BASF 2 Q2015 charts conference call for investors and analysts
15
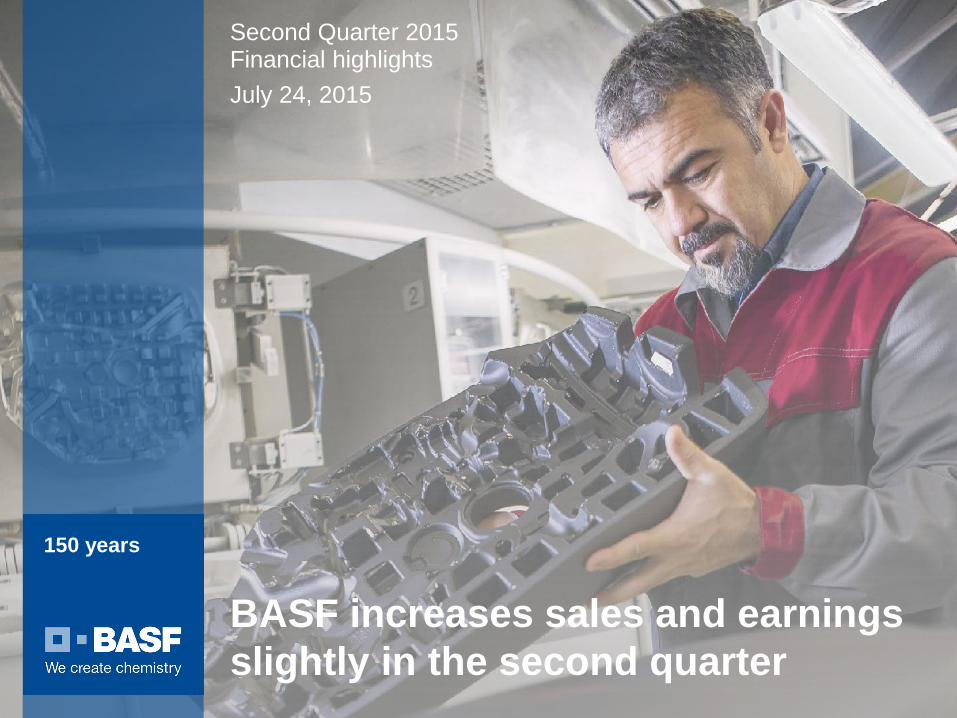
150 years BASF increases sales and earnings slightly in the second quarter Second Quarter 2015 Financial highlights July 24, 2015
-
Upload
basf -
Category
Investor Relations
-
view
695 -
download
0
Transcript of BASF 2 Q2015 charts conference call for investors and analysts
150 years150 years150 years
BASF increases sales and earnings slightly in the second quarter
Second Quarter 2015Financial highlightsJuly 24, 2015

150 years150 years
Cautionary note regarding forward-looking statements
2
This presentation may contain forward-looking statements that are subject to risks and uncertainties, including those pertaining to the anticipated benefits to be realized from the proposals described herein. Forward-looking statements may include, in particular, statements about future events, future financial performance, plans, strategies, expectations, prospects, competitive environment, regulation and supply and demand. BASF has based these forward-looking statements on its views and assumptions with respect to future events and financial performance. Actual financial performance could differ materially from that projected in the forward-looking statements due to the inherent uncertainty of estimates, forecasts and projections, and financial performance may be better or worse than anticipated. Given these uncertainties, readers should not put undue reliance on any forward-looking statements. The information contained in this presentation is subject to change without notice and BASF does not undertake any duty to update the forward-looking statements, and the estimates and assumptions associated with them, except to the extent required by applicable laws and regulations.
BASF Analyst Conference Call Q2 2015; July 24, 2015

150 years150 years
BASF increases sales and earnings slightly in the second quarter
Sales developmentPeriod Volumes Prices Portfolio Currencies
Q2´15 vs. Q2´14 2% (8%) 0% 9%
Business performance Q2’15 Q2’14* vs. Q2’14
Sales €19.1 billion €18.5 billion +3%
EBITDA €3.0 billion €2.7 billion +11%
EBIT before special items €2.0 billion €2.0 billion +2%
EBIT €2.0 billion €1.9 billion +5%
Net income €1.3 billion €1.3 billion 0%
Reported EPS €1.38 €1.37 +1%
Adjusted EPS €1.49 €1.53 (3%)
Operating cash flow €2.8 billion €1.0 billion +185%
BASF Analyst Conference Call Q2 2015; July 24, 2015 3* Previous year values restated due to dissolution of disposal group “Natural Gas Trading“

150 years150 years
Important milestones in Q2 2015
4BASF Analyst Conference Call Q2 2015; July 24, 2015
New chemical catalystplant in China
Inauguration of first world-scale acrylics complex in South America
Divestment of textile chemicalsNew agricultural research station in India

150 years150 years
5BASF Analyst Conference Call Q2 2015; July 24, 2015
Further divestments
Custom synthesis business (closing expected for Q4 2015) Parts of active pharmaceutical ingredients business
Paper hydrous kaolin (closing expected for Q3 2015)
Stake in SolVin joint venture (closed on July 1, 2015)
Selected assets on the Norwegian continental shelf (closing expected for Q4 2015)
Performance Products
Chemicals
Oil & Gas

150 years150 years
ChemicalsHigher fixed costs from start-ups impact earnings
Intermediates739+5%
Monomers1,5760%
Petrochemicals1,660(18%)
€3,975(8%)
Sales development Period Volumes Prices Portfolio Currencies
Q2’15 vs. Q2’14 0% (15%) (2%) 9%
Q2’15 segment sales (in million €) vs. Q2’14 EBIT before special items (in million €)
570 616 580
726
548
0
200
400
600
800
Q2 Q3 Q4 Q1 Q2
20152014
BASF Analyst Conference Call Q2 2015; July 24, 2015 6

150 years150 years
Performance Chemicals1,066+6%
Performance ProductsEarnings impacted by challenging markets
CareChemicals
1,215+1%
€4,084+4%
Nutrition& Health558+7%
Dispersions& Pigments
1,245+4%
Sales development Period Volumes Prices Portfolio Currencies
Q2’15 vs. Q2’14 (1%) (5%) 0% 10%
Q2’15 segment sales (in million €) vs. Q2’14 EBIT before special items (in million €)
435376
217
515
304
0
200
400
600
Q2 Q3 Q4 Q1 Q2
7BASF Analyst Conference Call Q2 2015; July 24, 2015
20152014

150 years150 years
Functional Materials & SolutionsStrong business with automotive and construction
Catalysts1,700+11%
ConstructionChemicals
625+16%
Coatings815+8%
€4,916+9%
Q2’15 segment sales (in million €) vs. Q2’14
Sales development Period Volumes Prices Portfolio Currencies
Q2’15 vs. Q2’14 0% (2%) 0% 11%
Performance Materials1,776+5%
EBIT before special items (in million €)
356310
220
431 458
0
200
400
600
Q2 Q3 Q4 Q1 Q2
8BASF Analyst Conference Call Q2 2015; July 24, 2015
20152014

150 years150 years
Agricultural SolutionsHalf-year results on prior year level
Sales developmentPeriod Volumes Prices Portfolio Currencies
Q2’15 vs. Q2’14 (8%) 3% 0% 6%
Segment sales (Q2’15 vs. Q2’14 / H1’15 vs. H1’14; million €)
EBIT before special items (Q2’15 vs. Q2’14 / H1’15 vs. H1’14; million €)
0
1,000
2,000
3,000
4,000
Q2 2014 Q2 2015 H1 2014 H1 2015
1,678
+1%
1,666
9
3,5763,319
0
200
400
600
800
1,000
Q2 2014 Q2 2015 H1 2014 H1 2015
365433
9390%
943
BASF Analyst Conference Call Q2 2015; July 24, 2015

150 years150 years
Oil & GasDecrease in earnings driven by lower prices
Exploration &Production
704(13%)
Natural GasTrading2,964+24%
€3,668+15%
Sales development Period Volumes Price/Currencies Portfolio
Q2’15 vs. Q2’14 21% (9%) 3%
* Previous year values restated due to dissolution of disposal group “Natural Gas Trading“
Q2’15 segment sales (in million €) vs. Q2’14
EBIT bSI*/Net income* (million €)
353250
0
200
400
600
800
Q2/2014 Net Income Q2/2015 Net Income
Natural Gas Trading
Exploration & Production
Net income
546
457
431
288
10BASF Analyst Conference Call Q2 2015; July 24, 2015
89 143

150 years150 years
Review of ’Other’
Million € Q2´15 Q2´14
Sales 757 855EBIT before special items (63) (328)Thereof corporate research costs
group corporate costscurrency results, hedges and other valuation effectsother businesses
(102)(64)151
30
(97)(57)
(117)
37
Special items (20) (12)
EBIT (83) (340)
11BASF Analyst Conference Call Q2 2015; July 24, 2015

150 years150 years
Million € H1’15 H1’14*Cash provided by operating activities 5,143 2,713Thereof changes in net working capital
miscellaneous items 877(32)
(1,251)(261)
Cash used in / provided by investing activities (3,331) (2,376)Thereof payments related to tangible / intangible assets (2,845) (2,201)
acquisitions / divestitures (15) 355Cash used in financing activities (1,033) 189Thereof changes in financial liabilities
dividends 1,723
(2,803)2,781
(2,592)
Strong operating cash flow in H1 2015
* Previous-year figures restated due to dissolution of disposal group “Natural Gas Trading“ 12BASF Analyst Conference Call Q2 2015; July 24, 2015
First half 2015 Cash flow from operating activities nearly doubled to €5.1 billion Cash inflow from changes in net working capital of €0.9 billion Free cash flow improved from €0.5 billion to €2.3 billion, exceeding free cash flow of FY
2014

150 years150 years
Balance sheet remains strongBalance sheet June 30, 2015 vs. December 31, 2014* (in billion €)
* Previous year values restated due to dissolution of disposal group “Natural Gas Trading“
Liquid funds
Accountsreceivable
Long-termassets
10.4
1.7
Otherliabilities
Financialdebt
Stockholders’equity
Dec 312014
June 302015
June 302015
Dec 312014
64.4
Inventories
Other assets
11.3
4.1
11.5
2.6
10.3
4.2
28.2
27.8
30.6
43.9
71.475.7
46.0
71.475.7
15.4
27.0
17.6
13
1.1 0.5 Disposal group
Disposalgroup
Total assets increased by €4.3 billion due to:- FX-related effects
- Investment projects
- Accounts receivables
- Liquid funds
Inventories down by ~€1.0 billion
Pension obligations down by €1.1 billion
Net debt increased by €1.4 billion to €15.1 billion
Equity ratio: 40.4%
Highlights June 30, 2015
BASF Analyst Conference Call Q2 2015; July 24, 2015
150 years150 years
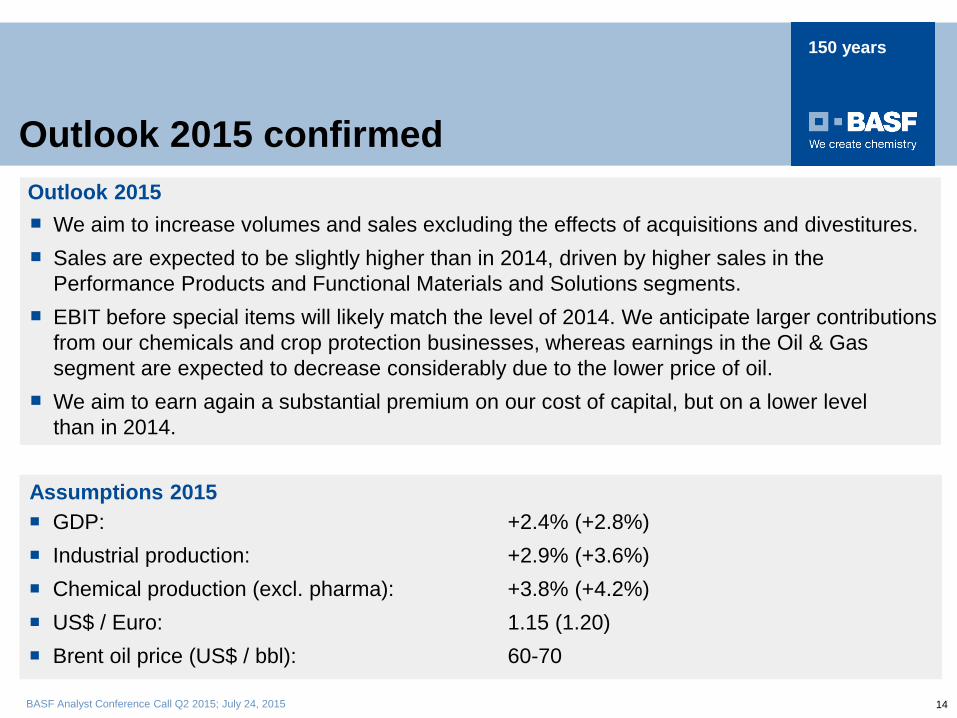
We aim to increase volumes and sales excluding the effects of acquisitions and divestitures. Sales are expected to be slightly higher than in 2014, driven by higher sales in the
Performance Products and Functional Materials and Solutions segments. EBIT before special items will likely match the level of 2014. We anticipate larger contributions
from our chemicals and crop protection businesses, whereas earnings in the Oil & Gas segment are expected to decrease considerably due to the lower price of oil.
We aim to earn again a substantial premium on our cost of capital, but on a lower levelthan in 2014.
Outlook 2015
GDP: +2.4% (+2.8%) Industrial production: +2.9% (+3.6%) Chemical production (excl. pharma): +3.8% (+4.2%) US$ / Euro: 1.15 (1.20) Brent oil price (US$ / bbl): 60-70
Assumptions 2015
Outlook 2015 confirmed
14BASF Analyst Conference Call Q2 2015; July 24, 2015

150 years150 years
150 years