Baseline Report on Maize Sub- Sector in Sumenep...Arisan Group-based rotating savings and lending...
43
Baseline Report on Maize Sub- Sector in Sumenep Longitudinal Livelihood Study (LLS) January 2016 PRISMA Author: Tatiana Maria Jaramillo Research Assistant: Adhi Maulana Akbar
Transcript of Baseline Report on Maize Sub- Sector in Sumenep...Arisan Group-based rotating savings and lending...

Baseline Report on Maize Sub-Sector in Sumenep
Longitudinal Livelihood Study (LLS)
January 2016
PRISMA
Author: Tatiana Maria Jaramillo
Research Assistant: Adhi Maulana Akbar

ii

iii
LONGITUDINALLIVELIHOODSTUDY
BaselineReportonMaizeSub-SectorinSumenep
PRISMA
Author:TatianaMariaJaramilloResearchAssistant:AdhiMaulanaAkbar
January2016
LLS|January2016
i
TableofContents
ListofAbbreviationandExpressions..................................................................................ii
ListofFigures.....................................................................................................................ii
ListofTables.....................................................................................................................iv
1 Introduction................................................................................................................1
2 ShortDescriptionIntervention.....................................................................................1
3 Sampling......................................................................................................................33.1 SamplingQuantitative......................................................................................................33.2 SamplingQualitative.........................................................................................................33.3 StatusofInterventionintheVillages.................................................................................43.4 PovertyRateofHouseholdsusingPPI...............................................................................4
4 FiveLivelihoodAssets..................................................................................................54.1 HumanAssets...................................................................................................................54.2 PhysicalAssets..................................................................................................................84.3 NaturalAssets.................................................................................................................164.4 SocialAssets...................................................................................................................174.5 FinancialAssets...............................................................................................................18
5 IncomeGeneration....................................................................................................195.1 AgriculturalActivitywithFocusonMaize........................................................................205.2 LivestockActivities..........................................................................................................23
6 ExpendituresandFinancialExpenditure....................................................................246.1 EducationExpenditure....................................................................................................256.2 SocialExpenditure..........................................................................................................266.3 LivestockExpenditure.....................................................................................................296.4 AgriculturalAssetsandInputs.........................................................................................296.5 RepayingDebt................................................................................................................306.6 FoodExpenditures..........................................................................................................30
7 IncomeUseofMaize.................................................................................................32
8 SeasonalityandVulnerability.....................................................................................34
9 ConclusionandRecommendationsforFutureWaves.................................................35
10 Appendix................................................................................................................36

LLS|January2016
ii
ListofAbbreviationandExpressions
Abbreviations
Obs Observation
SD SekolahDasar(PrimarySchool)
SMP SekolahMenengahPertama(JuniorHighSchool)
SMA SekolahMenengahAtas,(SeniorHighSchool),
SMK SekolahMenengahKejuruan(VocationalHighSchool)
UBSP UnitBersamaSimpanPinjam(SmallSavingsandBorrowingsGroup)
UPK UnitPengelolaKagiatan((Government)ActivityManagingUnits)
VCR VideocassetteRecorder
VCP VideocassettePlayer
VCD VideoCompactDisc
Expressions
Adat Localtraditions
Angkot Carforpublictransportation
Arisan Group-basedrotatingsavingsandlendingfund
Desa Village
Koperasi,Cooperative
Lebaran IslamiccelebrationinJuly2015
NaikHaji Hajjpilgrimage
Ojek Motorcycleforpublictransportation)
Pasar Localtraditionalmarket
Warung Localshop/restaurant
ListofFigures
Figure1:Schoolenrolmentforchildren7-18yearsoldbyquintiles.............................................................7
Figure2:HighestEducationofPersons25+years.........................................................................................8
Figure3:Assets-HouseandLand..................................................................................................................9
Figure4:Assets-Housing............................................................................................................................10
Figure5:Assets-Transport..........................................................................................................................10
Figure6:Assets-Communication................................................................................................................11
Figure7:Assets–KitchenandStorage........................................................................................................12

LLS|January2016
iii
Figure8:Assets–OtherHouseholdItems...................................................................................................12
Figure9:Assets-AgriculturalItems.............................................................................................................13
Figure10:LargeLivestockbyQuintile..........................................................................................................14
Figure11:OtherLivestockbyQuintile.........................................................................................................14
Figure12:AmountofLargeLivestockbyQuintile........................................................................................15
Figure13:AmountofOtherLivestockbyQuintile.......................................................................................16
Figure14:LandHoldingsbyQuintile............................................................................................................16
Figure15:OwnProductionandReceivedFood/TotalFoodConsumption.................................................17
Figure16:SavingandBorrowingbyQuintile...............................................................................................18
Figure17:SavingandBorrowingbyQuintile-totalamountinIDR.............................................................18
Figure18:AgricultureandLivestockIncomeGeneration............................................................................19
Figure19:FrequencyofCropsmentionedasoneofthethreemostimportant(exceptmaize)intermsofincome..................................................................................................................................................20
Figure20:CropsforSelf-consumption(reportednoselling).......................................................................21
Figure21:Cropswhicharemainlysold(reportedas50%+selling).............................................................21
Figure22:Maizesellingbycalendarmonth.................................................................................................22
Figure23:Othercrop(cropsotherthanmaize)salesbycalendarmonth...................................................22
Figure24:MonthwhenpeoplesellLivestock..............................................................................................24
Figure25:Significanthouseholdexpenditure..............................................................................................24
Figure26:ExpenditureonEducation(total)................................................................................................25
Figure27:Expenditureoneducationperchild............................................................................................25
Figure28:financingofEducation.................................................................................................................26
Figure29:Timingofsignificantexpenditure:Education..............................................................................26
Figure30:SocialExpenditure.......................................................................................................................27
Figure31:FinancingMarriage......................................................................................................................27
Figure32:Timingofsignificantexpenditure–Marriage.............................................................................28
Figure33:Timingofsignificantexpenditure(otherAdat/religious/villagecelebration)...........................29
Figure34:TimingofSignificantExpenditure-buyinganimalstock.............................................................29
Figure35:Timingofsignificantexpenditure-repayingdebt......................................................................30
Figure36:FoodExpenditurebyQuintile......................................................................................................31
Figure37:TotalFoodandnon-foodExpenditurebyQuintile......................................................................31
Figure38:TypeofFoodExpenditurebyQuintile(totalspend)...................................................................32
Figure39:ShareofExpenditureonRiceandOtherstaplesbyQuintile......................................................32
Figure40:Mostimportantuseofincomederivedfrommaize...................................................................33
Figure41:Secondmostimportantuseofincomederivedfrommaize.......................................................33

LLS|January2016
iv
ListofTables
Table1:SamplingofQuantitativeDataCollection........................................................................................3
Table2:SamplingofQuantitativeDataCollection........................................................................................3
Table3:CurrentStatusoftheInterventionperVillage.................................................................................4
Table4:PovertyRateofHouseholdsusingPPI..............................................................................................4
Table5:PerCapitaExpenditureperQuintileinRp.perMonth.....................................................................5
Table6:HouseholdCharacteristics................................................................................................................5
Table7:HouseholdMemberCharacteristics.................................................................................................6
Table8:EducationofPeople15YearsorOlder.............................................................................................6
Table9:Educationofchildren7-15years......................................................................................................6
Table10:SchoolEnrolmentbyAgeGroup.....................................................................................................7
Table11:IncomeEarnedwithMaize...........................................................................................................22
Table12:FemaleDecisionMakingPowerandEngagementinMaizeActivities.........................................23
Table13:ControlandDecisionPowerofEarningsfromMaize...................................................................34
Table14:FoodSecurity................................................................................................................................34

LLS|January2016
LivelihoodStudyBaselineReport 1MaizeSub-SectorinSumenepPRISMAJanuary2016
1 Introduction
This baseline report is part of a study, which aims to gain a deeper understanding on how targetedhouseholds use additional income generated through the PRISMA intervention. Sumenep is one ofmanydistricts in East Java that has been targeted by PRISMA and where the project tries to alleviate poverty.PRISMAsupportsmaize farmersbypromotinghybridseed fordry land farming.Thegoal is to increase theproductivity of maize and therefore increase the income of maize farmers. The goal of this longitudinallivelihoodstudy(LLS)istogainadeeperunderstandingonhowthemaizefarmersusetheiradditionalincomeanticipated to be generated through the intervention. This will run until the end of the program. Thehouseholdsinterviewedduringthisyearwillbetrackedduringthefollowingyearstoseehowtheirlivelihoodsituationhaschangedandhowthechangesrelatetotheintervention.SuchastudyisimportantforPRISMAbecauseithelpsassesswhethertargetsselectedforraisingruralincomearereasonableandhowitcanaffectrurallivelihoods.
The goal of this baseline report is to give an overview over the current livelihood situation to see in laterstageshowthissituationchanged.Thereportprovidesanoverviewwithspecialfocusonincomegenerationand use of income. The baseline study uses a mixed method approach including the collection of bothqualitative and quantitative data. 197 householdswere interviewed for quantitative data collectionwith aquestionnaireandninerespondentswereinterviewedforqualitativedatacollectionthroughsemi-structuredinterviews.Togetherthisdataprovidesapictureofthecurrentlivelihoodsituationofthefarmers.ThesamehouseholdswillbeinterviewedincomingyearsaspartofthenextwavesoftheLLS.
The baseline report initially provides a short overview over the intervention (Section 2); with the framesampling for the study discussed in Section 3; the five assets of the sustainable livelihood framework aredescribed inSection4;withadiscussionof incomegenerationdiscussed inSection5). Section6describesexpenditure;while Section7 focusesonuseof incomegeneratedby coconutearnings. Section8discussesseasonalityandvulnerabilityofthehouseholds,withconclusionsprovidedinSection9.
2 ShortDescriptionIntervention
2.1 Sumanep
SumenepisadistrictintheprovinceofEastJavaandliesontheislandMadura.Fortheyear2013thedistrictreported that 29.2%of thepeoplewerepoorwhich corresponds to 300,700poor people (StatisticAgencyCenter, 2014). Within East Java, Sumenep ranks 32 out of 39 districts with respect to the HumanDevelopment Index and has a score of 66.89 Statistic Center Agency (2016). Besides, life expectancy inSumenep is65.25yearsandaverageyearsofschooling is6.37years forboysand4.62years forgirls (2013data)(StatisticCenterAgency,2014;StatisticCenterAgency,2014).Literacyrateslieat85.07%forthe2012(Statistic Agency Center, 2015). According to the intervention plan (Internal PRISMA document, 2014),Sumenep has 179’945 farmerswith 29’656 farmers classified as poor farmers. Moreover, 19.1% of thoseunder-fiveyearsoldwerereportedundernourished(weightforage)and35.8%oftheunder-fiveyearswere

LLS|January2016
LivelihoodStudyBaselineReport 2MaizeSub-SectorinSumenepPRISMAJanuary2016
reported stunted (height for age) in East Java for the year 2013 (Statistics Centre Agency, health profile,2014).
2.2 InterventionSummary
Context
Globallymaize production is increasing and over 1 billion tons ofmaizewere produced in 2013. USA andChina are the dominating countries formaize production and together produce around half of the globalmaize supply. USA is known to be the largestmaize exporter followed by Brazil. Japan and the EuropeanUnion are large importers. (Food andAgriculturalOrganization, 2015). Indonesia is one of the ten largestmaize producers globally and around 18 million tons maize were produced in 2013 while ca. 3.8 millionhectareswereharvested(DataCenterandAgricultural informationSystem,2013) (internalPRISMAreport).Indonesiaexportsand importsmaizedependingonseasonalitybut isnet importer. IndiaandArgentinaareimportant partners for import while overall imports are highly volatile in amount. (Food and AgriculturalOrganization,2015).
Maize demand in Indonesia has been increasing rapidly due to the increasing demand for poultry (wheremaize is a key ingredient inpoultry feed).Household consumptionper capital is around1.18 kgmaizeperyear. Average productivity ofmaize production in Indonesia is 4.9 tons per hectare. (Sector Report) (DataCenter and Agricultural information System, 2013). The province with the largest maize production inIndonesia is East Java (Statistic Center Agency, 2014) .Within East Java, Sumenep district is an importantmaizeproducer–withsome359,000tonsofmaizeproduced in2013. However, theproductivityofmaizeproductioninSumenepisrelativelylow,at2.65tonsperhectarewhichisbelowtheaverageproductivityofEastJavaof4.80tonsperhectare.
There are several reasonswhy the productivity inMadura Island and especially in Sumenep is low. Firstly,low-yieldinglocalseedvarietiesareusedwhicharelessproductivethanhybridseed.Secondly,farmersoftenapplythefertilizer incorrectly.Thirdly,drysoilconditionsarenotmanagedproperlywithirrigationsystems,which is especially crucial for production in the dry season. A further problem is that poor post-harvestpracticesareappliedsothattheharvestedmaizegetscontaminatedwithforeignmaterialandoftencontainstoomuchmoisture,resultingindeteriorationinqualityandlowersellingprices.
Intervention
PRISMA’s intervention seeks to increase productivity amongst the small-holder farmers in Sumanep. Theintervention is implemented in three phases. Firstly, higher productivity is targeted with improved seeds;secondly,productivity is increased throughbetterpost-harvest technologiesand fertilizer;and, in the thirdphasetheintroductionofirrigationsystemsshallincreaseproductivity.
Inthecaseofpromotingtheuseofimproved/hybridseedPTAHSTIisthekeycommercialpartner.Whilethecompanysellsthetechnologiesthatcanimproveproductivity(hybridseeds),ithasnotbeenverysuccessfulinpromotingimprovedseedsinSumanepandotherareasofEastJava.Theinterventionseekstopromotetheseedsaswellasassociatedtrainingfordistributors.Inadditiontothis,PRISMAcollaborateswithPTAHSTItoprovide training and assistance for farmers during the transition phase between planting local seed andhybridseed.Theseedswillbepartlypaidbythefarmersdirectlyandpartlywillbepaidlater(formofcredit).

LLS|January2016
LivelihoodStudyBaselineReport 3MaizeSub-SectorinSumenepPRISMAJanuary2016
Moreover,PTAHSTIwill createnetworks forbuyers (e.g.Poultry farmers, feed-millers, traders) to facilitatethesellingoftheseeds.
The interventionseekstodistributehybridseedthroughfarmergroups.For thispurpose,PRISMAtogetherwithPTAHSTIapproachactivefarmergroups.Activefarmergroupsinthiscontextmeansthattheyareactiveintheirrepresentationofthefarmers.WhilePTAHSITsellshybridseedstothefarmergroups,theyselltheseedsontothefarmers.Thefarmergroupsthereforecanbeseenasintermediateactorinthesupplychainforimprovedinputs.
3 Sampling
3.1 SamplingQuantitative
Thestudyusedbothqualitativeandquantitativesamplinginordertoprovidethedataprovidedbelow.ThesampleframewasdrawnfrominternalPRISMAdocuments–withprojectionsonthepotentialtargetgroups.Thestudydrawsfrom197respondentsfromatargetof200–onlyx3respondentsweredroppedasthedatacollectedwasincomplete.Thehighestnumberofrespondentsfromasinglevillagewas34andlowest4,theaveragenumberofrespondentswas18.
Table1:SamplingofQuantitativeDataCollection
A10 No.Babbalan 20BatuDinding 25BilaporaTimur 20Kasengan 34KebundadapTimur 15Kopedi 20MandingTimur 19MoncekTengah 20Sarokah 4Totosan 20Total 197
3.2 SamplingQualitative
For the qualitative data collection, the same list of respondents was used as for the quantitative datacollection.Outofthevillagesavailableforquantitativedatacollectionfivevillageswerechosenforqualitativedata collection.One or two respondentswere chosen in the villageswhich yielded the sampling shown intable2.Thedatawascollectedfrom4to9November2015.
Table2:SamplingofQuantitativeDataCollection
NameofDesaNumberofrespondent
LLS|January2016
LivelihoodStudyBaselineReport 4MaizeSub-SectorinSumenepPRISMAJanuary2016
BilaporaTimur 1
Babbalan 2
MoncekTengah 2
Kopedi 2
KebondadapTimur 2
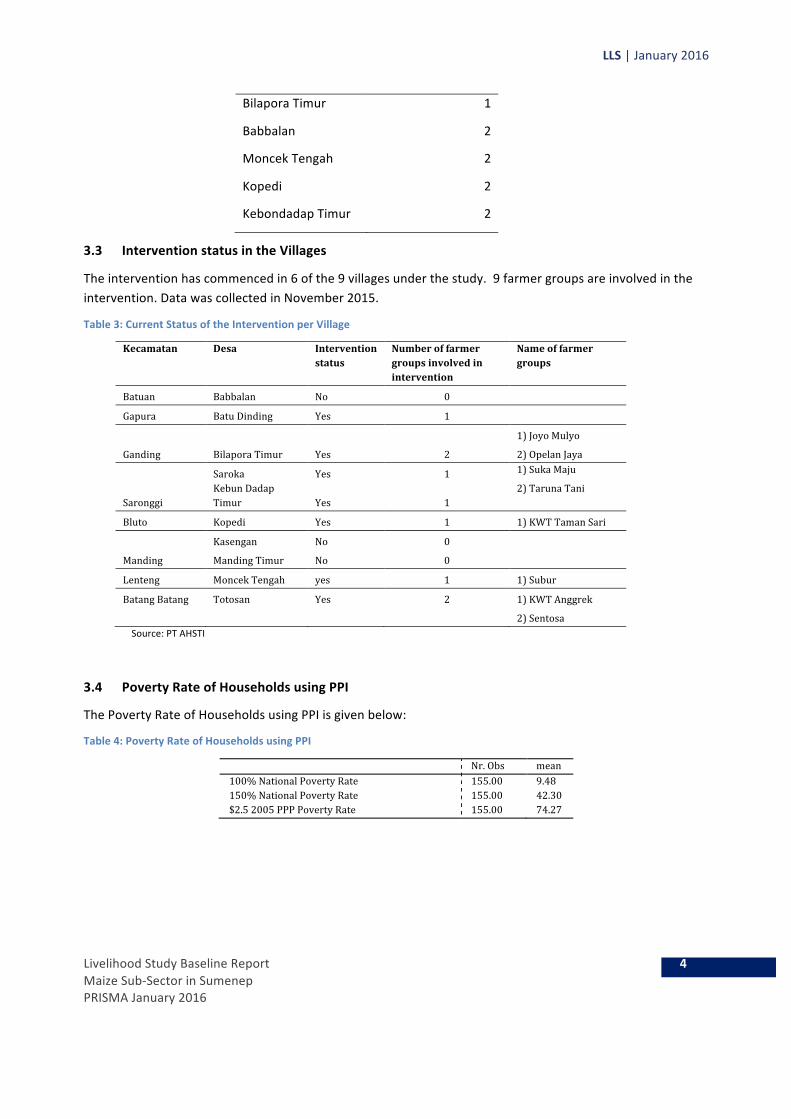
3.3 InterventionstatusintheVillages
Theinterventionhascommencedin6ofthe9villagesunderthestudy.9farmergroupsareinvolvedintheintervention.DatawascollectedinNovember2015.
Table3:CurrentStatusoftheInterventionperVillage
Kecamatan Desa Interventionstatus
Numberoffarmergroupsinvolvedinintervention
Nameoffarmergroups
Batuan Babbalan No 0
Gapura BatuDinding Yes 1
Ganding BilaporaTimur Yes 2
1)JoyoMulyo
2)OpelanJaya
Saronggi
Saroka Yes 11)SukaMaju
KebunDadap
Timur Yes 1
2)TarunaTani
Bluto Kopedi Yes 1 1)KWTTamanSari
Manding
Kasengan No 0
MandingTimur No 0
Lenteng MoncekTengah yes 1 1)Subur
BatangBatang Totosan Yes 2 1)KWTAnggrek
2)Sentosa
Source:PTAHSTI
3.4 PovertyRateofHouseholdsusingPPI
ThePovertyRateofHouseholdsusingPPIisgivenbelow:
Table4:PovertyRateofHouseholdsusingPPI
Nr.Obs mean
100%NationalPovertyRate 155.00 9.48
150%NationalPovertyRate 155.00 42.30
$2.52005PPPPovertyRate 155.00 74.27

LLS|January2016
LivelihoodStudyBaselineReport 5MaizeSub-SectorinSumenepPRISMAJanuary2016
4 FiveLivelihoodAssets
Thediscussionoffivelivelihoodassetsofthesustainablelivelihoodframeworkgivesagoodoverviewovertheresourcesthatareavailabletoahousehold(DFID,1999).Theassetsareclassifiedinfivecategorieswhicharehumanassets,physicalassets,naturalassets,socialassets,andfinancialassets.
Tounderstandhowthesevariousassetschangewithwealth level,awealthvariablewasconstructedbasedontotalexpenditurepercapita.Asthequestionnairecontainsscopefordetailedinformationonexpenditure,total expenditureper capitawere calculated. This total expenditureper capitaweredivided intoquintileswhich provides information on household expenditure per capita level. As will be discussed later, thesequintilesthenwereusedtosplitthesampleandunderstandinformationaboutdifferentquintilelevels.
Asseenintable5,thefirstquintilecontainshouseholdwhichspent193’222until396’533IDRpercapitaandper month with the mean of 328’912 IDR. The households in the highest expenditure quintile spent onaverage1’557’030IDR.
Table5:PerCapitaExpenditureperQuintileinRp.perMonth
Nr. Obs Mean Sd Min Max
Q1 37.00 328,011.74 49,446.83 193,222.22 396,533.31 Q2 36.00 464,549.17 37,792.70 400,305.53 537,916.63 Q3 37.00 634,447.01 54,087.71 548,416.63 706,966.63 Q4 36.00 789,443.31 52,424.34 711,805.56 913,750.00 Q5 36.00 1,557,029.56 740,344.44 930,955.56 4,432,291.50
4.1 HumanAssets
Humanassetsdescribeassetswhichliewiththepersonorhouseholditself.Thismightbehealth,educationorother household characteristics. This sub-section first focuses on household characteristics and then oneducation.
4.1.1 HouseholdCharacteristicsThenumberofhouseholdsisalsocategorisedashumanassetsbecauseitdeterminesthelabourforceinthehousehold. In the sample the average number of household members is 4.1 (see table 6). The smallesthouseholds report twohouseholdmembersand the largest reportsninehouseholdmembers.Theaveragenumber of children in this household is 1.0with some households that have no children at all and otherswhich have up to three children. The average number of elderly people is 0.4. The number of elderly andchildreninahouseholdindicatestheburdenonactivehouseholdmemberstosupporttheirhousehold.
Table6:HouseholdCharacteristics
Nr. Obs mean Sd Min Max
Hh size 197.00 4.06 1.40 2.00 9.00 Nr children 197.00 1.02 0.88 0.00 3.00 Nr elderly 197.00 0.38 0.69 0.00 3.00

LLS|January2016
LivelihoodStudyBaselineReport 6MaizeSub-SectorinSumenepPRISMAJanuary2016
Accordingtotable7, theaveragenumberof femaleandmalehouseholdmember inthehousehold isevenand theaverageagehouseholdmemberhas34.7 years.Householdsareoverwhelminglymale-headed. Ascanbeseenintable8,only1.1%ofthehouseholdsarereportedasfemale-headed.
Table7:HouseholdMemberCharacteristics
Nr. Obs Mean
Female 788.00 0.50 Age 796.00 34.73
Table8:Female-headedhouseholds
Nr. Obs Percent
female headed 186.00 1.08
4.1.2 EducationMost respondents during qualitative data collection reported that education is important for them. Theybelievethatthelifeoftheirchildrenmightbechangedforthebetterwitheducation.Onesaidthathewoulddoanythingtobeabletofinancehischild’seducation.Table9showstheeducationofpeoplewith15yearsandmore,here66.6%reportthattheycanreadandwritewhile65%reportthattheyeverwenttoschool.These levelsare lowcompared to thenational average. Thismightbedue to farmersbeing relatively lesseducatedthantheaveragepersoninSumenep.
Table9:EducationofPeople15YearsorOlder
Nr. Obs Mean
Can Read and Write 637.00 66.56
Ever Went to School 642.00 64.95
As seen in table10,mostbutnotall childrengo toschool.Some89.23ofboysbetweensevenand fifteenyearsreportthattheycanreadandwritewhilethispercentageis93.1%forgirls. Only3%oftheboysand3.4%ofthegirlsinthesameagegroupreportthattheyneverwenttoschool.
Table10:Educationofchildren7-15years
Nr. Obs Boys mean Boys Nr. Obs Girls mean Girls
Can Read and Write 65.00 89.23 58.00 93.10 Ever Went to School 66.00 96.97 59.00 96.61
Ascanbeseenintable11,schoolenrolmentfortheagegroup9-11yearsisthehighestandisreportedtobe100% for girls andboys. Younger children are less likely to be enrolled in school (72.7% for age group6-8years)andalsoolderchildrenarelesslikelytobeenrolledinschool.Apartfortheagegroup15-18years,girlsarelesslikelytogoschoolthanboys.82.4%boy’senrolmentand69%girl’senrolmentfortheagegroup6-8yearsarereported,andtheagegroup19-22reports68%enrolmentofboysand46.7%enrolmentofgirls.

LLS|January2016
LivelihoodStudyBaselineReport 7MaizeSub-SectorinSumenepPRISMAJanuary2016
Table11:SchoolEnrolmentbyAgeGroup
ALL Male Female
Mean Nr. Obs. Mean Nr. Obs. Mean Nr. Obs.
age 6-8 72.7 33.0 82.4 17.0 60.0 15.0
age 9-11 100.0 40.0 100.0 16.0 100.0 23.0
age 12-14 95.0 40.0 95.5 22.0 94.1 17.0
age 15-18 92.6 54.0 90.9 33.0 95.0 20.0
age 19-22 56.4 55.0 68.0 25.0 46.7 30.0
Figure1:Schoolenrolmentforchildren7-18yearsoldbyquintiles.
Asseeninfigure1schoolenrolmentofchildrenbetween7and18yearsisonaveragehigherthan85%forallquintiles. There is no clear trend visible across the quintiles. 42.6% of themen and 49.8% of the womeninterviewed in Sumenep report that their highest education is not finishing elementary school (No SD).Around28%ofmenandwomen report thatprimary school is their highest educationwhile around11.5%reportthatjuniorhighschool(SMP)istheirhighestdegree.While14.8%ofthemenreportthatseniorhighschoolistheirhighesteducationthispercentageislowerforwomen(9%).Highereducationwasachievedbylessthan4%bymenandwomen.Thepercentageofwomen,however,isslightlylowerwith2%.
91.995.2
91.3 88.9 90.5
0
20
40
60
80
100
Enro
lmen
t in
%
Q1 Q2 Q3 Q4 Q5
School Enrolment of Children 7-18 yearsby Quintile

LLS|January2016
LivelihoodStudyBaselineReport 8MaizeSub-SectorinSumenepPRISMAJanuary2016
Figure2:HighestEducationofPersons25+years
Terms:NoSD=notgoing/notfinishingelementaryschool;SD=Elementaryschool;SMP=Secondaryschool;SMA=SeniorHighschool;D1,D3,S1,S2,S3=HighereducationsuchasAcademy,University,andpost-graduate.
4.2 PhysicalAssets
Physicalassetscomprisethebasicinfrastructureandproducergoodsneededtosupporthouseholdmembersto pursue their livelihood strategies (see DFID, 1999). These can include: infrastructure, the physicalenvironmentthathelppeopletomeettheirbasicneedsandtobemoreproductive;andproducergoods,thetools and equipment that people use to function more productively. The following components ofinfrastructure are usually essential for sustainable livelihoods: affordable transport; secure shelter andbuildings; adequate water supply and sanitation; clean, affordable energy; and access to information(communications). This section will focus on housing, household, agricultural assets as well as livestockholdings.
4.2.1 Housing,WC,ElectricityandWaterAlmost100%oftherespondentshavetheirownhouse.Accordingtoqualitativedatacollected,thehouseisconsideredthemost importantasset for localhouseholds. Itwasreportedtobemore important than landand transportation assets. Respondents explained that housing gives them security and convenience andallows them to live andworkpeacefully. Theyalsoexplained that theyoften inherit thehouse from theirparentsorparents-in-law.Alsoagriculturallandisownedbyover90%inallquintileswhilethepercentageishigherforhouseholdsinthehighestexpenditurequintile(figure3).Otherhousesorbuildingsareownedbyaround50%to60%whilenotrendisdiscerniblebyquintile.
2.0
9.0
11.4
27.8
49.8
3.3
14.8
11.5
27.9
42.6
0 10 20 30 40 50percent
female
male
D1, D3, S1, S2,S3
SMA
SMP
SD
No SD
D1, D3, S1, S2,S3
SMA
SMP
SD
No SD
Highest Education of Person 25+ Years

LLS|January2016
LivelihoodStudyBaselineReport 9MaizeSub-SectorinSumenepPRISMAJanuary2016
Figure3:Assets-HouseandLand
Not all householdshaveelectricity.As canbe seen in figure4over80%of thehouseholdshaveelectricityacross all expenditure quintiles. Whether a household has electricitymay depend on location since somevillageshaveelectricityaccesstothenationalgrid(whichprovidesaccessforthehouseholds)whileforotherhouseholdsitismoredifficulttoaccesselectricity.Otherhouseholdsmightnotbeabletoaffordelectricity.
Better floor material (no bamboo or earth) is used more commonly in households in higher expenditurequintiles.43.2%reporthavingbetterfloormaterialinthelowestexpenditurequintilewhilethepercentageishigherforhigherexpenditurequintiles.Thehighestexpendituresquintilereports69.4%usingbetterhousingmaterial. Similarly, toilet facilitiesarepossessedmoreoftenbyhigherexpenditurequintiles. In the lowestquintileonly62.9%ofthehouseholdsreporthavingtoiletswhilethisrisesto90.9%ofthehighestquintile.
Wells and tubewells are not often possessed by local households. Only 16.7%of the lowest expenditurequintile reports having a well or tube well, while 52.8% in the highest expenditure quintile report havingthese.Theratherlowpercentagesofwelloratubewellownershipdoesnotnecessarilyequatetolowaccessto water. In some cases in Sumenep this may be explained as public water access is provided by thegovernmentonavillage level inagreementsbetween inhabitants. For somehouseholds,buildingawellortubewell in thehousehold isa secondaryneedbecause theyalreadyhaveaccess towatereven if it isnotprivate.
100.0
91.9
52.8
100.0
94.4
61.8
97.394.6
54.1
97.2100.0
55.6
97.2100.0
57.1
0
20
40
60
80
100
Perc
ent
Q1 Q2 Q3 Q4 Q5
Assets: House and Land
House Agricultural Land
Other House/Building

LLS|January2016
LivelihoodStudyBaselineReport 10MaizeSub-SectorinSumenepPRISMAJanuary2016
Figure4:Assets-Housing
4.2.2 TransportThemostcommonmeansoftransportationinSumenepisthemotorcycle.Morethan75%ofthehouseholdsin every quintile report having a motorcycle, with more households possessing motorcycles in higherexpenditure quintiles. During qualitative data collection it was reported that transportation assets areimportant as they enable the household members to be mobile. For households which do not havemotorcycles,householdmembersreportusingangkot(carforpublictransportation)andojek(motorcycleforpublic transportation) as alternativemeans of transportation. Therewere also respondents that explainedthattheygenerallywalktotheiragriculturallands.
Morethan60%ofrespondents ineveryquintileownbicycles.Bicyclesareusedgenerallyforshortdistancetransportation. Cars and trucks are a veryuncommonmeansof transportation in the sample.Householdsthatreportedhavingacaroratruckduringqualitativedatacollectionexplainedthattheyneedthoseassetsforlongdistancetransportationortoruntheirbusinesssuccessfully.
Figure5:Assets-Transport
86.5
43.2
62.9
16.7
86.1
57.1
68.6
17.6
89.2
54.3
88.9
8.1
94.4
77.8
88.9
41.7
82.9
69.4
90.9
52.8
0
20
40
60
80
100
Perc
ent
Q1 Q2 Q3 Q4 Q5
Assets: Housing
Electricity Floor not Eearth or Bamboo
WC Well/Tubewell
0.0
67.6
86.5
0.0
63.9
75.0
2.7
67.6
81.1
0.0
63.9
94.4
0.0
69.4
100.0
0
20
40
60
80
100
Perc
ent
Q1 Q2 Q3 Q4 Q5
Assets: Transport
Car/Truck Bicycle
Motorbike

LLS|January2016
LivelihoodStudyBaselineReport 11MaizeSub-SectorinSumenepPRISMAJanuary2016
4.2.3 CommunicationAssetsAsseenfigure6,televisionandmobilephonearecommoncommunicationassets.Morethanaround70%ofhouseholdshaveatelevisionandamobilephoneacrossallexpenditurequintiles.Bothassetsarepossessedmoreoftenbyhouseholdsinthehighestexpenditurequintile.Themobilephoneisusedforcommunicatingwith friends and family as well as for business issues. Television is used for both entertainment andinformation.
Havingaradio,computeroralandlineislesscommon.8.3%ofhouseholdsreporthavingaradio,transistor,stereoorcassetteinthelowestexpenditurequintile.Thehigherexpenditurequintilesreporthighernumberswhile the highest expenditure quintile reports 41.7% possessing those items. Also computers are morecommon in higher expenditure quintiles and 20% report having a computer in the highest expenditurequintile.Landlinesarenotveryfrequentwithlessthan15%reporthavingalandlineacrossallexpenditurequintiles.
Figure6:Assets-Communication
4.2.4 StoringandKitchenAssetsMostofrespondentshavestovesacrossallexpenditurequintiles.Inadditiontocooking,thestoveisalsousedfor heatingmaizewhen they store it in the kitchen. Themaize is usually storedon topof the stove. Thistraditionaltechniqueisusedtoavoiddiseasewhilethemaizecanbestoredlongerlikethis.Accordingtodatafromqualitativeinterviewsthestoveisoftenheatedwithfirewoodwhichtheysourcefromlocalforests.
8.3
73.0
2.8
73.0
11.1
22.9
77.8
11.8
69.4
9.1
40.5
81.1
2.7
83.8
8.1
47.2
91.7
13.9
83.3
5.6
41.7
91.7
20.0
86.1
11.4
0
20
40
60
80
100
Perc
ent
Q1 Q2 Q3 Q4 Q5
Assets: Communication
Radio, Transitor, Stereo, Cassette TV
Computer Mobile Phone
Land-Line

LLS|January2016
LivelihoodStudyBaselineReport 12MaizeSub-SectorinSumenepPRISMAJanuary2016
Figure7:Assets–KitchenandStorage
Grain storage containers are reported tobeownedby 30.6%of thehouseholds in the lowest expenditurequintile, while this percentage rises for higher quintiles reaching some 77.8% for the highest expenditurequintile.This isasignificantdifference. Sincethe intervention isconcernedwithhigherproductivity (whichrelatestostoring)thismight indicatethathigherexpenditurequintiles investmore instoragefacilities. Just2.7%ofthehouseholdsinthelowestexpenditurequintilereporthavingafridge.Thispercentageissteadilyhigherforhigherexpenditurequintilesreaching19.4%inthehighestexpenditurequintile.
4.2.5 OtherHouseholdAssets
Washingandsewingmachinesarenotverycommonamongsthouseholds inthesample.Bothhoweveraremorepresentinhigherexpenditurequintiles.Mostrespondentshavejewelleryintheirhousehold.Accordingtoqualitative interviews,mostsee jewelleryasasavingor investment. Theysaid that jewellery (especiallygold)canbesoldeasilyiftheyneedmoney.Inadditiontothis,thevalueofjewelleryisreportedtoappreciateso it corresponds to the idea that it is a form of investment. Surprisingly households which are in higher
83.3
30.6
2.7
75.0
44.1
2.9
64.9
40.5
5.6
72.2
44.4
16.7
80.0 77.8
19.4
0
20
40
60
80
Perc
ent
Q1 Q2 Q3 Q4 Q5
Assets: Kitchen and Storing
Stove Grain Storage Container
Fridge/Freezer
Figure8:Assets–OtherHouseholdItems
2.80.0
73.0
13.5
2.9 2.9
63.9
20.0
2.70.0
56.855.6
11.1
2.8
66.763.9
14.3
2.9
50.0 50.0
0
20
40
60
80
Perc
ent
Q1 Q2 Q3 Q4 Q5
Assets: Other Household Items
Sewing Machine Washing Machine
Jewelry VCR/VCP/VCD/DVD

LLS|January2016
LivelihoodStudyBaselineReport 13MaizeSub-SectorinSumenepPRISMAJanuary2016
expenditurequintilesreportedhavinglessjewellery.VCR/CP/VCD/DVDisreportedtobeownedby12.5%ofthelowestexpenditurequintilewhilethepercentageishigherforhigherexpenditurequintiles.
4.2.6 AgriculturalAssetsVeryfewhouseholdsreportedowningtractorsorotherheavyfarmingequipment.Thismaybeduetoreports that somehouseholds canaccess tractors through their farmergroup (which receives tractorsfrom the government). However, therewere other households that reported during qualitative datacollectionthattheydonothaveaccesstotractorsandinsteadusecowsforfarmlabourpurposes.Iftheydonothavecows,theycanalsorentcowsfromwithinthevillage. Irrigationsystemsarenotcommonlocally. Notably, irrigation systems are more frequent in lower expenditure quintiles. Householdswithoutirrigationsystemsreportthattheyaredependentonraintowatertheircrops.Asseeninfigure9,smalltools(suchasaxes,hammers,hoes,etc.)arewidelyowedbythehouseholds.Thetrendtohavethoseitemsincreasesbyexpenditurequintile.Figure9:Assets-AgriculturalItems
4.2.7 LivestockCows are the most common type of livestock in Sumenep. Aside from land and gold, farmers generallyconsidercowsasaninvestmentandaformofsavings.ThisisalsoreflectedinthefactthatSumenephasthebiggestcowpopulationinEastJava(StatisticCentreAgency,2015).Accordingtoqualitativeresponses,cowsareusedforsellingbutalsoasfarmequipmenttolooseningthesoilusingtraditionaltillingpractices.
0.0
19.4
0.0
48.6
2.9
14.7
0.0
64.7
0.0
8.1
2.7
78.4
0.02.8 2.8
77.8
8.3
2.8 2.9
50.0
0
20
40
60
80
Perc
ent
Q1 Q2 Q3 Q4 Q5
Assets: Agricultural Items
Tractor Irrigation Equipment
Heavy Farming Equipment Small tools

LLS|January2016
LivelihoodStudyBaselineReport 14MaizeSub-SectorinSumenepPRISMAJanuary2016
Figure10:LargeLivestockbyQuintile
Aside from cows, chickens are a common livestock in Sumenep. The higher the expenditure quintile thehigher the probability that the household will have chickens. Chickens are generally used to sell or forconsumption by households. Chickens are usually slaughtered during special events including Islamiccelebrations (Eid-ul-Fitri and Eid-ul-Adha). Buffalos are not very common, and most buffalos are onlypossessedbyhouseholdsinthehighestexpenditurequintile.
Figure11:OtherLivestockbyQuintile
Goats are a common typeof livestock for the samplehouseholds in Sumenepas canbe seen in figure11.These are less frequently found than cows or chickens. Ducks and fish are only possessed by very fewhouseholds.
86.5
0.0 0.0 0.0
83.3
2.80.0 0.0
86.5
0.0 0.0 0.0
83.3
0.0 0.0 0.0
86.1
13.9
0.0 0.00
20
40
60
80
Perc
ent
Q1 Q2 Q3 Q4 Q5
Livestock 1
Cow Buffalo
Horse Pig
24.3
43.2
0.0 0.0
33.3
47.2
2.80.0
21.6
62.2
0.0 0.0
33.3
66.7
5.6
0.0
30.6
66.7
5.6 5.6
0
20
40
60
80
Perc
ent
Q1 Q2 Q3 Q4 Q5
Livestock 2
Goat and Sheeps Chicken
Duck Fish

LLS|January2016
LivelihoodStudyBaselineReport 15MaizeSub-SectorinSumenepPRISMAJanuary2016
Figure12:AmountofLargeLivestockbyQuintile
Asseeninfigures12and131,thenumberofcowsandchickensiscorrelatedagainsttheexpenditurequintile,withhigherexpenditurequintilesreportingmore livestock. People inthehighestexpenditurequintilehave2.3 cowsonaveragewhile this is1.8 for the lowestexpenditurequintile.Alsohigherexpenditurequintileshavemorethantwiceasmanychickensthanhouseholdsinthelowestexpenditurequintile.
1Twooutliersweretakenoutforthenumberofchickensandoneoutlierwastakenoutforthenumberofgoats.Fishwastakenoutbecausetheyareanotherdimensionofnumbersandareownedbyfewrespondents.
1.8
0.0 0.0 0.0
1.9
0.10.0 0.0
1.8
0.0 0.0 0.0
2.0
0.0 0.0 0.0
2.3
0.2
0.0 0.00
.5
1
1.5
2
2.5
Amou
nt in
Num
ber
Q1 Q2 Q3 Q4 Q5
Amount of Livestock 1
Cow Buffalo
Horse Pigs

LLS|January2016
LivelihoodStudyBaselineReport 16MaizeSub-SectorinSumenepPRISMAJanuary2016
Figure13:AmountofOtherLivestockbyQuintile
4.3 NaturalAssets
Naturalresourcestockisconsideredanaturalresourcefromwhichthehouseholdcangetresourceflowandservices (DFID, 1999). Land is typically classified as natural asset and agricultural land is very commonamongstlocalhouseholds.Theamountofhectaresownedbythosewhohaveagriculturallandcanbeseeninfigure 142. The number of hectares owned by the households lies within a small range for the quintilesreachingfrom0.6until0.9hectares,indicatingthatthereislittledifferencebetweenthequintilesinrelationto land ownership. As shown in figure 15, the lowest expenditure quintile generates the largest share ofconsumption by them or received food from other parties (16.5%). The highest expenditure quintilegeneratesorreceives13.9%oftheirfoodconsumption.Thetrendtobuyfoodthereforeappearstoincreasewithexpenditurequintile.
Figure14:LandHoldingsbyQuintile
2Twooutliersweretakenout
0.6
2.5
0.0
1.1
3.1
0.1
0.6
3.2
0.0
1.1
5.1
0.4
1.1
5.5
0.1
0
2
4
6
Amou
nt in
Num
ber
Q1 Q2 Q3 Q4 Q5
Amount of Livestock 2
Goat and Sheeps Chicken
Duck
0.7
0.9
0.60.7 0.6
0
.2
.4
.6
.8
hect
ares
Q1 Q2 Q3 Q4 Q5
Land Holdings

LLS|January2016
LivelihoodStudyBaselineReport 17MaizeSub-SectorinSumenepPRISMAJanuary2016
Figure15:OwnProductionandReceivedFood/TotalFoodConsumption
4.4 SocialAssets
Socialassetsaresocialresourcesuponwhichpeopledrawtopursuetheir livelihoodobjective(DFID,1999).Sumenephasdifferentaspectswhichmightbeconsideredassocialassets.Duringqualitativedatacollectionitwasfoundthatfamilyneighboursandfriendsplayanimportantroleinahousehold’slivelihoodsituation.In particular, households rely on their friends and neighbours in situation of stress and uncertainty.Qualitativedatacollection indicatesthat threehouseholdsexplainedthatwhentheyfaceda lackofmoneytheydonotreducetheirconsumption,rathertheyborrowedmoneyandfoodfromtheirneighbours,family,andfriends.
Many households report savings systemswithin the villages (e.g.arisan)which encourage farmers to saveeachweek.Theamountofmoneypaidbythehouseholdsvariesanddependsontheabilityofthefarmerstopay.Inthis,farmergroupsplayalsoanimportantroleforthelivelihoodsituationofthehouseholds.Farmersreceive free seeds if they are members of farmer groups, which are often indirectly obtained by thegovernment. In addition to this, farmers report also borrowing and saving money in farmer groups.Equipmentsuchastractorscanbeborrowedbymembersof farmergroups.Tractorsmightbegiventothefarmergroupsbythegovernmentoracquiredthroughjointsavingeffortsofthemembers.
Another formof social interdependence inSumeneparecelebrations. Asdiscussedduringqualitativedatacollectionlargeeventssuchasmarriageareseldomfinancedbythecelebratinghouseholdalone,butratherarecommonlyfinancedbythewholecommunity. Neighbours, friends,andfamilyoftenhelpfinancethoseeventsforinstancebyofferingrice.Theamountofwhatisofferedtothecelebratinghouseholddependsontheneighbours, friends,and families’ financial capabilityandhowclose relationshipsare to thehousehold.Theamountgiventothehouseholdmightevenbewrittendownandshallbereturnedoncethehouseholdhasacelebrationofitsown.
16.5
11.2
13.4
7.2
13.9
0
5
10
15
20
Food
Pro
duce
d or
Rec
eive
d by
the
HH
in %
Q1 Q2 Q3 Q4 Q5
Own Food Production and Received Food ofTotal Food Conusmption

LLS|January2016
LivelihoodStudyBaselineReport 18MaizeSub-SectorinSumenepPRISMAJanuary2016
4.5 FinancialAssets
Financial capital denotes the financial resource that people use to achieve their livelihoodobjective (DFID,1999).Thisincludessavingsandborrowingsbylocalhouseholds.Whileborrowingmaynotbeconsideredasafinancialassetitdoesindicatealevelofaccesstocreditwhichcanbeseenasavaluableasset.
Ascanbeseeninfigure163,savingsdecreaseasapercentagewithexpenditurequintile,whichissurprising.Borrowings instead are increasing with expenditure quintile. In absolute terms however (see figure 17),households inhigherexpenditurequintileshavegreatervalue savingsandborrowings (for thosewhohavesavingsorexpenditures).Theaveragehouseholdinthefirstexpenditurequintilehas1.5millionIDRsavingsand 0.6 million IDR borrowings. In the highest expenditure quintile savings are 2.8 million IDR whileborrowingsare2.6millionIDR.Duringqualitativedatacollectionhouseholdsreportedthatsomedonottakecreditbecausetheyareconcernedaboutrepayments(interestandthepaymentschedule).
Figure16:SavingandBorrowingbyQuintile
Figure17:SavingandBorrowingbyQuintile-totalamountinIDR
3Dataofsavingsandborrowingswasnotalwaysconclusivesinceitwascontradicting.Thereforeresultsshouldbeinterpretedwithcaution.
59.5
10.8
52.8
14.3
37.840.5 41.7
14.3
27.8
19.4
0
20
40
60
Perc
ent
Q1 Q2 Q3 Q4 Q5
Saving and Borrowing
Saving Borrowing
1.5
0.6
2.4
0.7
3.0
1.5
3.1
0.8
2.8
2.6
0
1
2
3
Amou
nt in
Mill
ion
Rp.
Q1 Q2 Q3 Q4 Q5
Saving and Borrowing
Saving Borrowing

LLS|January2016
LivelihoodStudyBaselineReport 19MaizeSub-SectorinSumenepPRISMAJanuary2016
Duringqualitativedatacollectionhouseholdsreportedvariouswaystosavemoney.Banks,koperasi,arisan,and farmer groups were mentioned as institutions through which to save money. Three respondents ofqualitative interviews said that banks and koperasi are the best place to savingmoney because they haveprofessional management and it also allows them to borrow money there. Also farmer groups werementionedasinstitutionsinwhichtosavemoney.
Besidesthoseformsofsavingalsojewellery(asgold),arisanandlivestock(especiallycows)areseenasaformofsaving.Jewelleryandlivestockcanbesoldveryquicklywhentheyhavesuddenneedsandurgentlyneedmoney.Somehouseholdsrespondedthattheyconsidermaizestocktobesavings(qualitativedata).Aswillbediscussedlater,thismayberelatedtothewaysomehouseholdsdeterminethepointofsales.
Usuallyhouseholdsborrowmoneyfromtheirneighbours,family,andfriends.Accordingtointerviewsduringqualitative data collection, farmers can also borrow money from within farmer groups. However, farmergroupstendtolendmoneyinsmallvaluesonlyastheydonothavethescaleofresourcescomparedtobanksorkoperasi.
5 IncomeGeneration
Regarding the income generation strategies of the households, as can be seen in figure 18 51.5% ofhouseholdsreportthattheminorityoftheirincomeisgeneratedbyagriculturalandlivestockactivities.Some26.3%reportthataroundhalfoftheir incomecomesfromtheseactivities,while22.2%,or1 in5,reportedthat themajority of their income comes from agriculture or livestock activities. These findings correspondwithqualitativedataresponseswhichindicatedavarietyofincomesources.Householdsdonotonlydependon those agriculture or livestock activities, as different jobs including seed distributor, coconut distributor,governmental staff, chicken trader, egg producer, and casual labourer were mentioned. Labour-basedactivitiesmightalsodependonthevillage.InKopediforinstanceitiscommonthatmenworkasfishermanwhiletheyalsocultivatedifferentcrops.However,otherhouseholdsreportbeingmainlydependentontheiragriculturalandlivestockincome.
Figure18:AgricultureandLivestockIncomeGeneration
51.5
26.3
22.2
0
10
20
30
40
50
Perc
ent
minority
(<50
%)
half (
~50%)
majority
(>50
%)
Agricultural and Livestock Income Geneartion

LLS|January2016
LivelihoodStudyBaselineReport 20MaizeSub-SectorinSumenepPRISMAJanuary2016
5.1 AgriculturalActivitywithFocusonMaize
Whilemaize is important there are other crops that are also important for the households. Tobacco wasmentioned by most during qualitative data collection, and which is also attested in figure 19 where 118householdsreportthattobacco isoneofthethreemost important incomesources.Duringqualitativedatacollectionsomehouseholdsperceivedthatitistheirlargestincomesource.Alsorice(55households),mungbean(36households),peanuts(28households),soybeans(12households),andchilipepper(12households)werementionedtobeimportantforlocalhouseholds.
Figure19:FrequencyofCropsmentionedasoneofthethreemostimportant(exceptmaize)intermsofincome
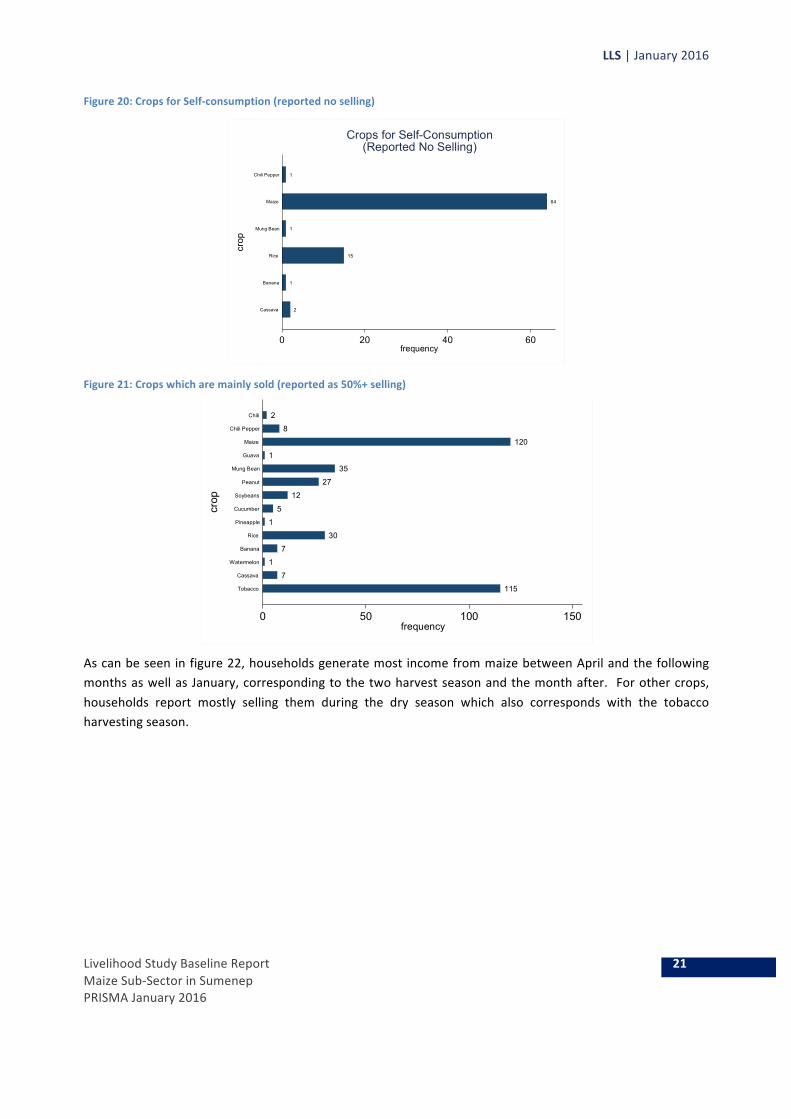
As can be seen in figures 20 and 21, income from crops are used for different purposes.While some aremainly used for household consumption, other crops are used primarily for sales. During qualitative datacollection all households reported that they use part of themaize they produce to supplement their ownhouseholdconsumption. Someevenreportednotsellingatallattimes,andusingallforownconsumptionwhich is also reflected in figure 20 – where 64 households report that they plant maize only for self-consumption and where no selling was reported. During qualitative data collection some householdsexplainedthat theyusemaizeasastaple food intheirhousehold.Thiswas firstpriority,wherethesecondpriorityistosellmaize.Incomparison,ricewasthesecondmostusedcropforself-consumptionreportedby15householdstobeonlyusedprimarilyforthispurpose.
Incontrasttothis,therearealsohouseholds(120)whichreportthattheysellmorethan50%oftheirmaize(seefigure21).Alsotobaccowasreportedtobemainlyusedforsalesby115households.Sincetherearenohouseholds reporting that theymainlyconsumetobacco, tobaccomightbeconsideredasacashcrop.Alsomungbean (35households),peanut (27households) and soybean (12households) aremainlyproduced tosell.Whilericeisoftenusedforself-consumptionasjustdiscussed,itisalsoreportedtobemainlysoldby30households.
118
9
1
8
55
1
5
12
28
36
1
12
2
0 50 100 150frequency
Tobacco
Cassava
Watermelon
Banana
Rice
Pineapple
Cucumber
Soybeans
Peanut
Mung Bean
Guava
Chili Pepper
Chili
crop
Frequency of Crops Mentionedas one of the Three Most Important Crops
Apart from Maizein Terms of Income
LLS|January2016
LivelihoodStudyBaselineReport 21MaizeSub-SectorinSumenepPRISMAJanuary2016
Figure20:CropsforSelf-consumption(reportednoselling)
Figure21:Cropswhicharemainlysold(reportedas50%+selling)
Ascanbeseeninfigure22,householdsgeneratemost incomefrommaizebetweenAprilandthefollowingmonthsaswellasJanuary,correspondingtothetwoharvestseasonandthemonthafter. Forothercrops,households report mostly selling them during the dry season which also corresponds with the tobaccoharvestingseason.
2
1
15
1
64
1
0 20 40 60frequency
Cassava
Banana
Rice
Mung Bean
Maize
Chili Pepper
crop
Crops for Self-Consumption(Reported No Selling)
115
7
1
7
30
1
5
12
27
35
1
120
8
2
0 50 100 150frequency
Tobacco
Cassava
Watermelon
Banana
Rice
Pineapple
Cucumber
Soybeans
Peanut
Mung Bean
Guava
Maize
Chili Pepper
Chili
crop
Crops which are Mainly Sold(Reporting 50%+ selling)

LLS|January2016
LivelihoodStudyBaselineReport 22MaizeSub-SectorinSumenepPRISMAJanuary2016
Figure22:Maizesellingbycalendarmonth
Figure23:Othercrop(cropsotherthanmaize)salesbycalendarmonth
Table 12 shows the percentage that maize contributes to the total income from households. Thesehouseholdsclaimthataroundathird(31%)oftheirincomecomesfrommaize.
Table12:IncomeEarnedwithMaize
Nr. Obs mean
Percent of Total HH Income Earned with Maize 193.00 30.83
Duringqualitativedatacollectiontwohouseholdsexplainedthattheywereplantinghybridseedsforthefirsttime because they got hybrid seeds from the government which was encouraging households to try thetechnology. They knew that hybrid seeds have better yields but considered them to be costly. Anotherhouseholdnotcultivatingusinghybridseedssaidthattheseedswereexpensiveandledtoproducethatwas‘notverydelicious’.Also,onehouseholdrespondedthathybridseedscannotbestoredverylong.Whilelocalseedscanbestoredup toayear,hybridseedscanonlybestored foramaximumofsixmonths.Since thefarmerclaimedheneededtoconsumethemaizeyearround,thehouseholdneedstoplanthybridseed.
To sell maize households report a range of behaviours. Four respondents explained that they usually sellmaize to a trader which comes to the village, making it easier for them as they do not have to travelanywhere. Selling inthewarungwasmentionedbytworespondents,whicharealsonearthehomesfromwhichtheywereselling.Tworespondentsexplainedthattheygotothelocalmarketsbecausethepricethere
5.4
9.2 10.0
16.9
12.3
15.5
28.5
18.5
24.6
17.7
10.011.5
0
10
20
30
Perc
enta
ge
Octobe
r
Novem
ber
Decem
ber
Janu
ary
Februa
ryMarc
hApri
lMay
June Ju
ly
Augus
t
Septem
ber
Month When People Sell Maize
10.9
7.1
9.8
11.7 12.0
8.3
10.5
14.3
24.1
13.2
16.215.0
0
5
10
15
20
25
Perc
enta
ge
Octobe
r
Novem
ber
Decem
ber
Janu
ary
Februa
ryMarc
hApri
lMay
June Ju
ly
Augus
t
Septem
ber
Month When People Sell Cropsother than Maize

LLS|January2016
LivelihoodStudyBaselineReport 23MaizeSub-SectorinSumenepPRISMAJanuary2016
is better than what the trader offer, and that in the markets they can get information about the pricesituation.
The price which households command is important for the maize farmers as it directly determines theirincome.Whilesomehouseholdssellingmaizeconsiderthepricesituationandwaitiftheyconsiderthepricenot tomeet theirexpectations,otherhouseholdsreport that theyarecompelledtoselleven if theprice islowbecausetheyneedthemoney.
The perception of a ‘high’ price however is not consistent across the households interviewed duringqualitativedatacollection.Onehouseholdexplainedthatthehighestpricetheycangetis3’200IDRperkg.The householdmember said that if the price is 3200 IDR per kg then the government importsmaize andthereforethepricecanneverbehigherthan3200IDRperkg.Otherhouseholdsconsider3000IDRperkgashighenoughtosellmaize.Anotherhouseholdstatedthatthebestwaytogetinformationaboutthepricesiswhengoingtothemarket.Sometimes2’800IDRperkgisalreadyagoodprice.
Sales practices also show somediversity. Somehouseholds report selling all themaize they have at oncewhiledominantly thehouseholdsclaimthat theysell theirmaizebyparts. Householdsexplainedthat theyonly sellmaizewhen they needmoney. Those that aremore price-sensitive, sell only parts because theyhopethatthepricemightbehigherinthefuture.Otherhouseholds,however,explainthattheywaituntiltheprice ishighestwithinayear. Iftheydonotexpect ittoriseanylongertheyselleverythingatonce.Otherhouseholdshoweverexplainedthattheyselleverythingrightaftertheharvestingseasonasthis isthetimewhenthehouseholdneedstorepaydebts,hassocialexpendituresandfinanceseducation.
Regardinggenderdivisionof labour, fourhouseholds reported that thehusbandandwifegenerate incomefromagricultureandmanagelivestocktogether.Otherhouseholdsexplainedthatthehusbandgeneratestheincomewhilethehousewifeismoreresponsibletomanageissueswithinthehouse.Ascanbeseenintable13alsothedecisionwhentosellmaizeismostlythepreserveofmalehouseholdmembers.Yetinaroundaquarter(27.1%)ofhouseholds,womenarereportedtobethemostimportantdecisionmaker.
Therewereotherhouseholdswhichreportedthattheydonotthemselvesmanagetheirlandbutthisisdoneby labouroutside theirhousehold. Manyhouseholdmembershaveotheractivities toearn incomeanddonothavetimetomanagethelandthemselves.Oncetheharvestseasoncomestheysharetheprofitswiththelabourers.Thesehouseholdsgenerallyreportedthatchildrenarenotinvolvedinfieldwork.However,whenneeded(suchasintheharvestingseason)orwhenthechildrenareavailable(suchasinholidayperiods)theydohelpinthefield.
Table13:FemaleDecisionMakingPowerandEngagementinMaizeActivities
Nr. Obs mean
Most important decision maker in HH is female: Selling Maize 129.00 27.13 Second important decision maker in HH is female: Selling Maize 128.00 75.78
5.2 LivestockActivities
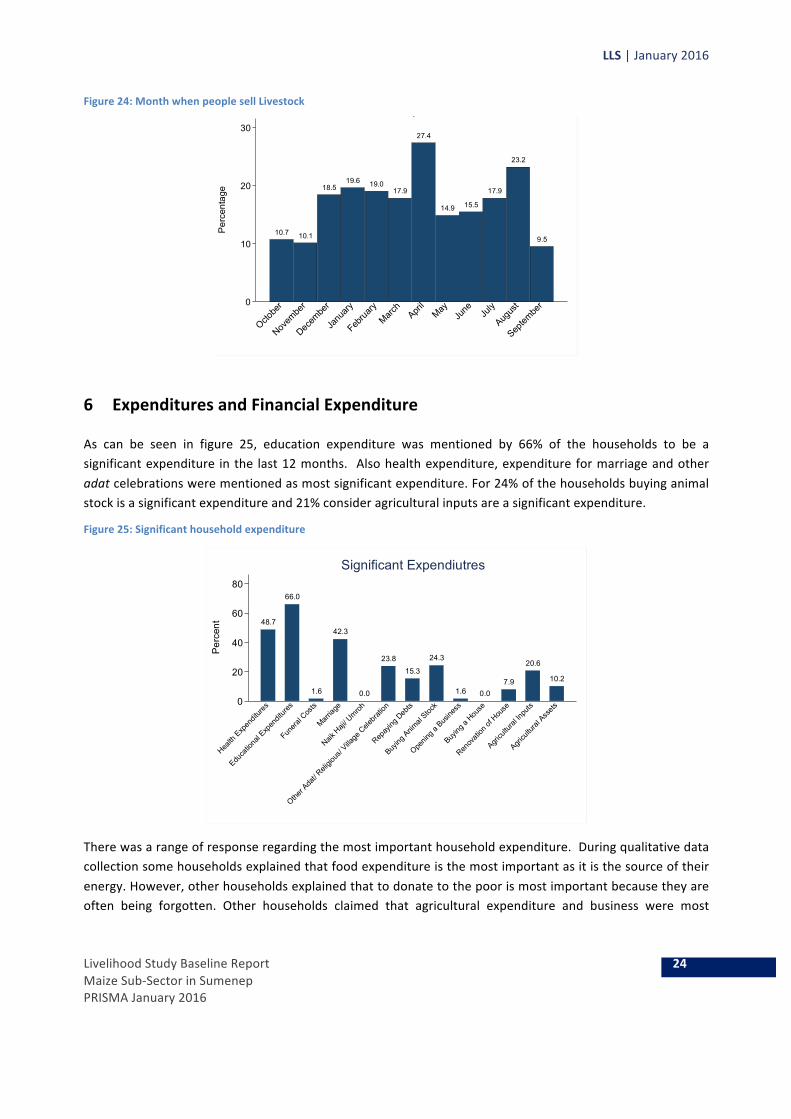
Livestock rearing is also part of household income. As discussed the livestock can be seen as a form ofinvestment. They are sold throughout the year as can be seen in figure 24. Livestock is sold regularlythroughouttheyearbutwithpeaksinAprilandAugust,whichmayberelatedtoreligiousceremoniessuchasEid-ul-Adha(August)
LLS|January2016
LivelihoodStudyBaselineReport 24MaizeSub-SectorinSumenepPRISMAJanuary2016
Figure24:MonthwhenpeoplesellLivestock
6 ExpendituresandFinancialExpenditure
As can be seen in figure 25, education expenditure was mentioned by 66% of the households to be asignificantexpenditure inthe last12months. Alsohealthexpenditure,expenditureformarriageandotheradatcelebrationswerementionedasmostsignificantexpenditure.For24%ofthehouseholdsbuyinganimalstockisasignificantexpenditureand21%consideragriculturalinputsareasignificantexpenditure.
Figure25:Significanthouseholdexpenditure
Therewasarangeofresponseregardingthemostimportanthouseholdexpenditure.Duringqualitativedatacollectionsomehouseholdsexplainedthatfoodexpenditureisthemostimportantasitisthesourceoftheirenergy.However,otherhouseholdsexplainedthattodonatetothepoorismostimportantbecausetheyareoften being forgotten. Other households claimed that agricultural expenditure and business were most
10.7 10.1
18.519.6 19.0
17.9
27.4
14.9 15.5
17.9
23.2
9.5
0
10
20
30
Perc
enta
ge
Octobe
r
Novem
ber
Decem
ber
Janu
ary
Februa
ryMarc
hApri
lMay
June Ju
ly
Augus
t
Septem
ber
Month When People Sell Livestock
48.7
66.0
1.6
42.3
0.0
23.8
15.3
24.3
1.6 0.07.9
20.6
10.2
0
20
40
60
80
Per
cent
Health
Exp
endit
ures
Educa
tiona
l Exp
endit
ures
Funera
l Cos
ts
Marria
ge
Naik H
aji/ U
mroh
Other A
dat/ R
eligio
us/ V
illage
Cele
brati
on
Repay
ing D
ebts
Buying
Anim
al Stoc
k
Openin
g a B
usine
ss
Buying
a Hou
se
Renov
ation
of H
ouse
Agricu
ltura
l Inpu
ts
Agricu
ltura
l Ass
ets
Significant Expendiutres

LLS|January2016
LivelihoodStudyBaselineReport 25MaizeSub-SectorinSumenepPRISMAJanuary2016
importantbecauseitenablestogeneratefurtherincome.Alsoeducationwasmentionedtobeimportantaswell.
6.1 EducationExpenditure
Ascanbeseen in figures26and27, theshareof totalexpenditureoneducationdecreasesbyexpenditurequintile. The total amountof IDRvalue spend for educationper childdoesnot seem tobemuchdifferentacrossthequintiles.
Figure26:ExpenditureonEducation(total)
Figure27:Expenditureoneducationperchild
All households interviewed during qualitative data collection explained that they consider education to beimportantbecause itopenstheirchildrennewpossibilitiesandcan leadtoabetter life inthefuture. Eventhough school is often free,manyhouseholds still consider education as a large expenditurebecause theyneedtopaytransportationcosts,books,uniforms,andprovidepocketmoney.Forotherhouseholdswherebooksanduniformsarecovered,theyclaimedtheystillneedtopayforpocketmoneyandtransportation.
Forhouseholdswithchildrenthatstudy inauniversity, thecostoftuitionandsometimesdormitoryfees isconsidered a large expenditure. Those households are convinced that education can help their childrenchangetheirlifeforthebetter.Twointerviewedhouseholdsreportedthatsincetheyhaveenoughmoneytofinance their children’suniversity theydonot feel that thoseexpendituresareaburden.Also,mostof thehouseholdsseemtobesatisfiedwiththecurrenteducationoftheirchildrenasfoundduringqualitativedatacollection.Onehousehold,however,explainedthat it isnotsatisfiedwithhisdaughter’seducationbecauseshewouldliketogotouniversitybutthehouseholdcannotaffordit.
10.710.3
7.0
4.8
3.3
0
2
4
6
8
10
Shar
e of
Tot
al E
xpen
ditu
rs in
%
Q1 Q2 Q3 Q4 Q5
Education Expenditure
0
50,000
100000
150000
200000
Tota
l Exp
endi
turs
in R
p
Q1 Q2 Q3 Q4 Q5
Education Expenditure per Child

LLS|January2016
LivelihoodStudyBaselineReport 26MaizeSub-SectorinSumenepPRISMAJanuary2016
Figure28:financingofEducation
Ascanbeseeninfigure29,mosthouseholdsfinanceeducationwhilesellingcropsandlivestockorbydrawingupontheirsavings.Educationalexpenditureistypicallyduearoundharvestseasonaswasseeninsection4.Thismightbethereasonwhytheeducationexpenditurearesometimesfinancedwithcropstocks.
Figure29:Timingofsignificantexpenditures:Education
6.2 SocialExpenditure
Socialexpendituremight includeceremonies,alcoholand tobacco, recreationandentertainment,and foodconsumedoutsidethehousehold.Theseexpendituresaretypicallymadewheninagroup.Expendituresfortobacco and alcohol are four all quintiles around 8-10% of total expenditures. Because Madura ispredominantly Muslim much of is likely to be tobacco consumption. No clear trend is visible across thequintiles. The expenditures for ceremonies are lower reaching around 1.2-2% depending on expenditurequintile. Also here no clear trend across quintiles can be reported. Expenditure for recreation and
33.1
0.8 0.8 0.8 0.8
40.3
19.4
4.0
0
10
20
30
40
Perc
ent
Saving
s
Help fro
m Rela
tives
/Friend
s
Help fro
m Gov
ernmen
t
Help fro
m NGO/R
eligio
us In
stitut
ion
Chang
e Eati
ng Patt
erns
Employe
d Hou
seho
ld Mem
bers
Inten
sified
Work
Adult H
ouse
hold
Membe
rs Star
ted to
Work
House
hold
Membe
rs Migr
ate
Reduc
e Exp
endit
ures o
n Hea
lth an
d/ or
Educa
tion
Credit
Sell Agri
cultu
ral Ass
ets
Sell D
urable
Assets
Sell La
nd/Buil
ding
Sell C
rop Stoc
k
Sell Li
vesto
ck
Inten
sify F
ishing
Send C
hildre
n to L
ive Else
where
Spiritu
al Effo
rts
Curren
t Inco
me
Did Not
Do Any
thing
Other
Financing Education
1.6 0.8
8.8
5.6
2.4
24.8
40.0
9.6
3.2 3.2
0
10
20
30
40
Perc
ent
Janu
ary
Februa
ryMarc
hApri
lMay
June Ju
ly
Augus
t
Septem
ber
Octobe
r
Novem
ber
Decem
ber
Timing of Significant Expenditures:Education

LLS|January2016
LivelihoodStudyBaselineReport 27MaizeSub-SectorinSumenepPRISMAJanuary2016
entertainmentaswellasforfoodconsumedoutsidethehouseareincreasingwithexpenditurequintile.Thisexpenditure,however,isalsorelativelylowforallquintiles.
Figure30:SocialExpenditure
Apartfromthisexpenditure,alsodonationsandgiftstootherhouseholdsareconsideredsocialexpenditure.Aswas already discussed before, helping neighbours, family, and friends finance celebration is part of thelocalcultureinSumenep,whileforinstanceforfuneralsandweddingsitisasocialobligationtoprovidericetothehouseholdholdingtheceremonies.Ascanbeseeninfigure31,andalsoattestedduringquantitativedata collection,many households reported that theymostly financewedding expenditureswith their cropstock.
Figure31:FinancingMarriage
Ascanbeseeninfigure32,otheradatexpenditures(generallyvillageorreligiouscelebrations)arefinancedwith savings, selling crops and livestock aswell. Even thoughonly a fewhouseholds report selling durable
8.7
1.6
0.0
0.6
8.3
1.2
0.0
0.9
10.0
1.3
0.0
0.7
9.3
2.0
0.2
2.1
8.2
1.5
0.5
1.3
0
2
4
6
8
10Sh
are
of E
xpen
ditu
res
from
Tot
al E
xpdn
ditu
res
in %
Q1 Q2 Q3 Q4 Q5
Social Expenditures
Alcohol & Tobacco Ceremonies
Recreation & Entertainment Food Consumed outside of the House
8.92.5 1.3 1.3 1.3
67.1
15.2
1.3 1.30
20
40
60
80
Perc
ent
Saving
s
Help fro
m Rela
tives
/Friend
s
Help fro
m Gov
ernmen
t
Help fro
m NGO/R
eligio
us In
stitut
ion
Chang
e Eati
ng Patt
erns
Employe
d Hou
seho
ld Mem
bers
Inten
sified
Work
Adult H
ouse
hold
Membe
rs Star
ted to
Work
House
hold
Membe
rs Migr
ate
Reduc
e Exp
endit
ures o
n Hea
lth an
d/ or
Educa
tion
Credit
Sell Agri
cultu
ral Ass
ets
Sell D
urable
Assets
Sell La
nd/Buil
ding
Sell C
rop Stoc
k
Sell Li
vesto
ck
Inten
sify F
ishing
Send C
hildre
n to L
ive Else
where
Spiritu
al Effo
rts
Curren
t Inco
me
Did Not
Do Any
thing
Other
Financing Marriage

LLS|January2016
LivelihoodStudyBaselineReport 28MaizeSub-SectorinSumenepPRISMAJanuary2016
goodsortakingcredit,itindicatestheimportanceofadatcelebrations.Somehouseholdsmentionedreducingexpendituresoneducationorhealthtobeingabletofinanceeducation. Thoseformsoffinancingmarriageandotheradatcelebrations,however,arerare.
Figure32:FinancingotherAdat
As can be seen in graphs 33 and 34, households hold most marriage and other adat, village or religiouscelebrationsaroundApriltoOctober.Thisisthedryerperiod,andhouseholdsgeneratemostincomearoundthosemonthsasreportedinqualitativedatacollection.
Figure33:Timingofsignificantexpenditure–Marriage
37.2
2.3 2.3
30.2
20.9
4.72.3
0
10
20
30
40Pe
rcen
t
Saving
s
Help fro
m Rela
tives
/Friend
s
Help fro
m Gov
ernmen
t
Help fro
m NGO/R
eligio
us In
stitut
ion
Chang
e Eati
ng Patt
erns
Employe
d Hou
seho
ld Mem
bers
Inten
sified
Work
Adult H
ouse
hold
Membe
rs Star
ted to
Work
House
hold
Membe
rs Migr
ate
Reduc
e Exp
endit
ures o
n Hea
lth an
d/ or
Educa
tion
Credit
Sell Agri
cultu
ral Ass
ets
Sell D
urable
Assets
Sell La
nd/Buil
ding
Sell C
rop Stoc
k
Sell Li
vesto
ck
Inten
sify F
ishing
Send C
hildre
n to L
ive Else
where
Spiritu
al Effo
rts
Curren
t Inco
me
Did Not
Do Any
thing
Other
Financing other Adat
2.5 2.53.8
2.5
15.0
20.0
7.5 7.5
15.0
23.8
0
5
10
15
20
25
Pe
rcen
t
Janu
ary
Febru
ary
Mar
chApr
ilM
ayJu
ne July
Augus
t
Septe
mbe
r
Octobe
r
Novem
ber
Decem
ber
Timing of Significant Expenditures:Marriage

LLS|January2016
LivelihoodStudyBaselineReport 29MaizeSub-SectorinSumenepPRISMAJanuary2016
Figure34:Timingofsignificantexpenditure(otherAdat/religious/villagecelebration)
6.3 LivestockExpenditure
As reportedby somehouseholdsduringqualitativedata collection, small livestock isoften financedby theearnings from selling grown livestock, business profits or by other forms of daily income. As discussedpreviously, livestock is also considered a form of investment and savings. Especially goats and cows arereported tobeingheld to finance largeexpenditures in the futurewhichmightbeoreducational,businessrelated(morelivestock),ortofinancehealthcare.
Expenditure toholdanimal stockare considered tobe small since they feed the livestockwithwaste fromtheircropsorbysearching food for the livestock in thenearby forest. Ascanbeseenthehouseholdsbuyanimal stock around the year. In August and September, they buymost animal stock. This is likely to becaused by the Eid-ul-Adha, an Islamic celebration where households slaughter livestock (and held inSeptemberin2015).
Figure35:TimingofSignificantExpenditure-buyinganimalstock
6.4 AgriculturalAssetsandInputs
Mostof thequalitativedata respondents (5of9)explained that theydonotconsidermaize inputs tobeasignificantexpenditureduringqualitativedatacollection,thisisalsoreflectedinfigure25.Theyaccessseeds
2.2 2.2
22.2
4.46.7 6.7
35.6
15.6
4.4
0
10
20
30
40
Perc
ent
Janu
ary
Februa
ryMarc
hApri
lMay
June Ju
ly
Augus
t
Septem
ber
Octobe
r
Novem
ber
Decem
ber
Timing of Significant Expenditures:Other Adat/Religious/Village Celebration
6.5 6.5
8.7
10.9
6.5
8.7
17.4 17.4
10.9
4.3
2.2
0
5
10
15
20
Pe
rcen
t
January
Febru
ary
Marc
h
April
May
June
July
August
Septe
mber
October
Nove
mber
Dece
mber
Timing of Significant Expenditures:
Buying Animal Stock

LLS|January2016
LivelihoodStudyBaselineReport 30MaizeSub-SectorinSumenepPRISMAJanuary2016
eitherfromthegovernmentorcultivatelocalseedsfromlastseasons’crops.Theyneedtopurchasefertiliser.Thisexpenditureis,however,notconsideredtobeverycostly.
Most of the households during qualitative data collection claimed that they finance inputs with dailyexpenditure,borrowingordrawingfromtheirprofits frombusinessoragriculture. Alsosmall toolsarenotconsidered tobea largeexpenditureandare financedwithdaily income.Aswasalreadydiscussedabove,tractorandotherlargeequipmentmightbeprovidedbythefarmergroupsorcowsareused.
6.5 RepayingDebt
Usuallyhouseholdsborrowmoneyfromtheirneighbours,family,andfriendsbuthavealsoaccesstoformalinstitutions as discussed previously. Borrowing is also an option when households have an importantexpenditure, but do not have enoughmoney to finance them. These households report to borrowmoneyduringplantingseason,schoolingperiods,andforbusinessexpenditure,andhealthexpenditureandfordailyexpenditure. Duringqualitativedata collection, 6 of 9 respondents explained that tobacco gives them themostincome.Theyexplainedthatwhentheyharvesttobaccotheyrepaytheirdebts,whichismainlyduringthemonthsSeptemberandOctober.
Figure36:Timingofsignificantexpenditure-repayingdebt
6.6 FoodExpenditures
As can be seen in figure 37, the share of food consumption is increasingwith expenditure quintile. This issurprising,sincewealthierhouseholdsusuallytendtohavelowersharesoffoodexpenditures.Ascanbeseentheshareliesbetween63%and75%.WhiletotalIDRvalueofnon-fooditemshasincreasedmoderatelyinthehigherexpenditurequintile,theincreaseinabsolutetermsforfoodexpenditureismorestriking.
7.1
3.6
10.7 10.7
3.6 3.6
17.9
21.4 21.4
0
5
10
15
20
Perc
ent
Janu
ary
Februa
ryMarc
hApri
lMay
June Ju
ly
Augus
t
Septem
ber
Octobe
r
Novem
ber
Decem
ber
Timing of Significant Expenditures:Repaying Debt

LLS|January2016
LivelihoodStudyBaselineReport 31MaizeSub-SectorinSumenepPRISMAJanuary2016
Figure37:FoodExpenditurebyQuintile
Figure38:TotalFoodandnon-foodExpenditurebyQuintile
Ascanbeseeninfigures39and40,higherexpenditureinfoodforhigherquintilesismainlydrivenbyhigherconsumptionofmeatandfish.AsIndonesiaingeneralreportsincreasingratesofanaemia(StatisticsCentreAgency, health profile, 2014),moremeat and fish consumption thereforemight indicate a preference formore diverse food consumption, richer in micronutrients, for higher expenditure quintiles. Also higherexpenditure isreported intheconsumptionofbeveragesandvegetables.Theshareofmoneyusedforriceandotherstaplefoodsisseentodecreasebyexpenditurequintile.
63.465.7
69.4 70.974.0
0
20
40
60
80
Shar
e of
Tot
al E
xpen
ditu
rs in
%
Q1 Q2 Q3 Q4 Q5
Food Expenditure
0
1.0e+06
2.0e+06
3.0e+06
4.0e+06
5.0e+06
Tota
l Exp
endi
turs
per
Mon
th in
Rp.
Q1 Q2 Q3 Q4 Q5
Total Food and Non-Food Expendiures by Quintile
Food Non-Food

LLS|January2016
LivelihoodStudyBaselineReport 32MaizeSub-SectorinSumenepPRISMAJanuary2016
Figure39:TypeofFoodExpenditurebyQuintile(totalspend)
Figure40:ShareofExpenditureonRiceandOtherstaplesbyQuintile
7 IncomeUseofMaize
Thewayincomeofmaizeisreportedtobeused.Ascanbeseeninfigure41,maizeearningsaremainlyusedtofinancedailyhouseholdneeds.Oncesuchbasicneedsaresatisfiedtheincomeismainlyusedforsavingsor education costs. However, most of the expenditure types in the figure were identified through the
0
200000
400000
600000
800000
Tota
l Exp
endi
ture
s pe
r Mon
th in
Rp.
Q1 Q2 Q3 Q4 Q5
Type of Food Expenditures
Rice Staple Food
Vegetables Dried Food
Meat Fish
Milk & Eggs Spices
Sugar Oil
Beverages Alcohol & Tobacco
Snaks Food Consumed Outside of the House
0
5
10
15
20
Shar
e of
Tot
al E
xpen
ditu
rs in
%
Q1 Q2 Q3 Q4 Q5
Type of Food Expenditures
Rice Staple Food
Vegetables Dried Food
Meat Fish
Milk & Eggs Spices
Sugar Oil
Beverages Alcohol & Tobacco
Snaks Food Consumed Outside of the House

LLS|January2016
LivelihoodStudyBaselineReport 33MaizeSub-SectorinSumenepPRISMAJanuary2016
quantitative data collection. Thismeans that after the household has satisfied daily household needs (forinstancefoodconsumption)theyusethemaizeincomeforarangeofexpenditurepriorities.
Incomefromtobacco(figure inappendix) isalsoconsideredtobean importantsourceof income ismainlyusedforeducationcosts.Therefore,incomefromcropsseemstobeusedforavarietyofpurposes
Figure41:Mostimportantuseofincomederivedfrommaize
Figure42:Secondmostimportantuseofincomederivedfrommaize
During qualitative data collection most households reported that the household head decides what theincomefrommaize isuseforastheheadof thehousehold is responsible. Usually theheaddiscusseswiththeirpartner. Since thehouseholdhead ismostly reported tobemale,womenaregenerallynot themostimportantdecisionmakerswithinahousehold.Asshownintable14,23%ofthehouseholdsreportthemostimportantdecisionmakerwithrespecttowhattheincomefrommaizeisusedforisreportedtobefemale.The second most important decision maker is female for 77% of households. Qualitative data collectionrevealed that often thewife takes decisionswhen she is responsible tomanage financial aspects and thehusbandtruststhewifetotakereasonabledecisions.
10.214.1
46.1
10.2
0.8 1.6
9.4
3.9 3.9
0
10
20
30
40
50P
erce
nt
0
Health
Exp
endit
ures
Educa
tiona
l Exp
endit
ures
Daily H
ouse
hold
Needs
Agricu
ltura
l Inpu
ts
Agricu
ltrual
Assets
House
reno
vatio
n/buy
ing
Debt R
epay
ment
Cash S
aving
s
Lives
tock
Other D
urable
Goo
dsOthe
r
Most Important Income Use of Maize
11.6
19.8
7.05.8
2.3
5.8
25.6
5.8
14.0
2.3
0
5
10
15
20
25
Perc
ent
0
Health
Expen
diture
s
Educa
tiona
l Exp
endit
ures
Daily H
ouse
hold
Needs
Agricu
ltural
Inpu
ts
Agricu
ltrual
Assets
House
reno
vatio
n/buy
ing
Debt R
epay
ment
Cash S
aving
s
Lives
tock
Other D
urable
Goo
dsOthe
r
Sectond Most Important Income Use of Maize

LLS|January2016
LivelihoodStudyBaselineReport 34MaizeSub-SectorinSumenepPRISMAJanuary2016
Table14:ControlandDecisionPowerofEarningsfromMaize
Nr. Obs mean
Most important decision maker in HH is female 129.00 23.26 Second important decision maker in HH is female 128.00 76.56
8 SeasonalityandVulnerability
During qualitative interviews households identified when they have most income during a year. August,SeptemberandOctoberwereexplainedasatimeofgenerating income,asthis istheharvestingseasonfortobacco.Mosthouseholdsalsoplanttobaccowhichtheyusetosell.Otherhouseholdshoweverreportedthatthey have most income when their business is especially lucrative which was Lebaran for one household(IslamiccelebrationinJulyfortheyear2015)orduringplantingseasonwhichisgenerallyDecembertoApril(dependingonthecrop).
Mosthouseholds,however, report that theyareshortofmoneyduring theplantingseason.Thosemonthsareespeciallydifficultformanyhouseholdsastheyhavetopayforagriculturalinputsandalsotorentcows.Thisdoesnotseemtoaffectfoodsecurity. Ascanbeseenintable15,only2%ofhouseholdsworriedthattheydidnothaveenough food toeat in the last sevendays and0.5%of thehouseholds faceda situationwithinthelast12monthsweretheydidnothaveenoughfoodintheirhousehold.Thesenumbersmightbelow,becauseallthehouseholdsproducemaizewhichatleastoffersthemenoughstaplefoodfortheirfoodconsumption.
Table15:FoodSecurity
Nr. Obs mean
Worried 193.00 2.07 Did not Have Enough Food 192.00 0.52
Aquestionaskedduringqualitativedatacollectionwaswhatthehouseholdswouldstopbuying if theyhadlessmoney. Some respondents explained that theywould not knowwhat to stop buying because all theexpendituresareimportant.Otherhouseholdsreportedthattheywouldbuycheaperfoodbecausethisistheonlythingthattheystillcanreduce.Anotherhouseholdreportedthatitwouldstopsavingforthechildren’seducationwhileothertwohouseholdexplainedthatthiswasimportantandtheywouldrelyontheirsavings.
Mosthouseholdsalsoclaimedthattheydonothaveunnecessaryexpenditure.Onehouseholdadmittedthatthey could reduce the cost of smokingwhile also clothes expenditure aswell as those for their children’seveningactivitieswerementioned.Duringqualitativedatacollectionitwasalsoidentifiedthatthelongdryseason(whichisbeinglongerthanusualbecauseitistheyearofElNiño),isaffectingthehouseholdsastheycannotstarttoplantandcropsarelessproductivethanusual.

LLS|January2016
LivelihoodStudyBaselineReport 35MaizeSub-SectorinSumenepPRISMAJanuary2016
9 ConclusionandRecommendationsforFutureWaves
This baseline study has seen that households have very different sources of income. Around 30% of theincome is reported tobegained throughmaize.Anotherkeycrop that is relevant for incomegeneration istobacco,whichisakeycashcrop.Maizerather isusedforamixofconsumptionandsales. Itprovidesthehouseholdswithstaplefoodandincreasestheirfoodsecurity.Theincomefrommaizeismainlyreportedtobeusedfordailyexpenditurewithhouseholdssellingmoremaizewhentheyhaveneeds.
Regardinghouseholdpurchasingpreferences if theyhadmoremoneytherewasarangeof responses.Twohouseholdsexplainedthattheywouldliketoopenanewbusiness–thattheyhaveideasbutneedmoneytoput these into action. Other households explained that theywould buy livestock because they anticipategood returns from the cows in the future. Another household said that itwould like to invest in existingbusiness(alargerpenfortheircattleascurrentlyitistoosmall).Buyinggoldorlandwasmentionedoftenastheseareassetsareunderstoodtoappreciateinvalue.
Two respondents claimed that the money should be saved as you cannot to anticipate unexpectedexpendituresinthefuture.Whilehouseholdshaveverydifferentideaswhattheywoulddoiftheyhadmoremoney,theyarenotconsideredessentialforsubsistenceandmostarerelatedtoanticipatedfuturereturns.In relation to large expenditures, here households answered that theywould like to renovate their homeyard,openabusiness,naikhajiandbuyahousewhilesomeotherexplainedthattheydidnothaveanylargeexpenditures planned. Other consumption preferences were more modest, one household claimed theywouldliketobuytheirgrandsonatoy.Savingswerealsomentioned.
Anotherindicationonwhatadditionalincomeisusedformightbegivenbycomparingthelivelihoodsituationacrossdifferentexpenditurequintiles.Households inhigherexpenditurequintiles tend tohavemore toiletfacilities,betterfloormaterial,moreTVs,mobilephones,motorcyclesandlivestock.Theyalsotendtohavemore grain storage containers which might allow better storage of maize. As was discussed earlier,householdsinhigherexpenditurequintilesconsumemoremeatandfishwhichindicateshighermicronutrientconsumption. Anotherarea is time. As the interventionwillchangethetypeofseedused, thismightalsochangetheamountoftimeneededforfieldpreparation,forinstancefertiliserneedtobeapplieddifferentlyandmorewaterresourcesareneeded.Understandingchangessuchasthesewillbeconsideredinthefollowupofthestudies.

LLS|January2016
LivelihoodStudyBaselineReport 36MaizeSub-SectorinSumenepPRISMAJanuary2016
10 Appendix
14.7
31.9
27.6
1.7 0.9
6.0
14.7
0.9 1.7
0
10
20
30Pe
rcen
t
0
Health
Expen
diture
s
Educa
tiona
l Exp
endit
ures
Daily H
ouse
hold
Needs
Agricu
ltural
Inpu
ts
Agricu
ltrual
Assets
House
reno
vatio
n/buy
ing
Debt R
epay
ment
Cash S
aving
s
Lives
tock
Other D
urable
Goo
dsOthe
r
Most Important Income Use of Tobacco
7.610.5
47.6
1.9 1.94.8
15.2
4.8 5.7
0
10
20
30
40
50
Perc
ent
0
Health
Expen
diture
s
Educa
tiona
l Exp
endit
ures
Daily H
ouse
hold
Needs
Agricu
ltural
Inpu
ts
Agricu
ltrual
Assets
House
reno
vatio
n/buy
ing
Debt R
epay
ment
Cash S
aving
s
Lives
tock
Other D
urable
Goo
dsOthe
r
Sectond Most Important Income Use of Tobacco