Baseline by Treatment Interactions 1 Running head ...davidpm/ripl/atlas/btifull.pdf · Baseline by...
35
Baseline by Treatment Interactions 1 Running head: Baseline by Treatment Interactions in ATLAS Analysis of Baseline by Treatment Interactions in a Drug Prevention and Health Promotion Program for High School Male Athletes Matthew S. Fritz, B.S., David P. MacKinnon, Ph.D., and Jason Williams, M.A. Department of Psychology Arizona State University Tempe, AZ 85287-1104 Linn Goldberg, M.D., Esther L. Moe, Ph.D., M.P.H., and Diane L. Elliot, M.D. Oregon Health & Science University Portland, OR 97201-3098 Keywords: Drug Prevention, Steroids, Interactions Corresponding author: Matthew S. Fritz, B.S. Department of Psychology Arizona State University Box 871104 Tempe, AZ 85287-1104 Phone: (480) 965-0915 Fax: (480) 727-6176 [email protected] Acknowledgments This research was supported by grant DA-07356 from the National Institute on Drug Abuse.
-
Upload
nguyenhanh -
Category
Documents
-
view
216 -
download
0
Transcript of Baseline by Treatment Interactions 1 Running head ...davidpm/ripl/atlas/btifull.pdf · Baseline by...

Baseline by Treatment Interactions 1
Running head: Baseline by Treatment Interactions in ATLAS
Analysis of Baseline by Treatment Interactions in a Drug Prevention and Health Promotion
Program for High School Male Athletes
Matthew S. Fritz, B.S., David P. MacKinnon, Ph.D., and Jason Williams, M.A.
Department of Psychology Arizona State University Tempe, AZ 85287-1104
Linn Goldberg, M.D., Esther L. Moe, Ph.D., M.P.H., and Diane L. Elliot, M.D.
Oregon Health & Science University
Portland, OR 97201-3098
Keywords: Drug Prevention, Steroids, Interactions
Corresponding author: Matthew S. Fritz, B.S. Department of Psychology Arizona State University Box 871104 Tempe, AZ 85287-1104 Phone: (480) 965-0915 Fax: (480) 727-6176 [email protected]
Acknowledgments This research was supported by grant DA-07356 from the National Institute on Drug Abuse.

Baseline by Treatment Interactions 2
Abstract
This paper investigates baseline by treatment interactions of a randomized anabolic steroid
prevention program delivered to high school football players. Baseline by treatment interactions
occur when a participant’s score on an outcome variable is determined both by their pre-
treatment standing on the outcome variable and the treatment itself. The program was delivered
to 31 high school football teams (Control=16, Treatment=15) in Oregon and Washington over
the course of three years (Total N=3207). Regression and multilevel analyses showed consistent
baseline by treatment interactions for knowledge of the effects of steroid use and intentions to
use steroids. Both of these interactions were beneficial in that they increased the effectiveness of
the program for participants lower in knowledge and higher in intentions at baseline.

Baseline by Treatment Interactions 3
Analysis Baseline by Treatment Interactions in a Successful Drug Prevention and Health
Promotion Program for High School Male Athletes
Drug prevention programs have been shown to delay or reduce drug use for a number of
substances, including tobacco, alcohol, and marijuana (Lipsey & Wilson, 1993; Pentz et al.,
1989). Despite these positive findings, the question has been raised whether prevention
programs affect subgroups differently (Botvin, Malgady,Griffin, Scheier, & Epstein, 1998;
MacKinnon, Weber, & Pentz, 1988). The purpose of this study is to investigate interactions
between the intervention and an individual’s pre-intervention standing (knowledge, attitudes, and
intentions) in a large prevention program designed to reduce anabolic steroid use among
adolescent male athletes.
Baseline by treatment interactions (BTI) occur when the magnitude or direction of the
effect of a treatment upon an outcome variable depends on the individual’s baseline standing on
that variable. To use a prevention example, imagine a program designed to reduce smoking in
teenagers, where the outcome variable is number of cigarettes smoked per day. If the group that
received the intervention significantly reduced the number of cigarettes smoked compared to a
control group, there would be a significant main effect of the treatment. However, if upon closer
inspection of the treatment group it was found that heavier smokers reduced their smoking to a
greater degree than lighter smokers, a baseline by treatment interaction would be present. That is,
the effectiveness of the intervention on the number of cigarettes smoked would depend upon the
number of cigarettes the individual smoked before being given the intervention.
Baseline by treatment interactions are used to assess the potential differential effects of
an intervention, which can be beneficial or harmful in nature, or represent ceiling or floor effects

Baseline by Treatment Interactions 4
on outcomes. Using the smoking example, the greater reduction in smoking in the heavy
smoking group compared to the light smoking group is a beneficial interaction because while
both subgroups reduced their smoking, one group reduced it by a greater degree. In contrast, if
one of the subgroups had increased the number of cigarettes smoked from baseline to post-test, a
detrimental or iatrogenic interaction would be present. One possible reason why harmful
interactions could occur in prevention studies is when low risk individuals become resentful
about being made to participate in a prevention program or become labeled as atypical by peers
who were not subjected to the program. This could cause the undesired behavior to arise through
a self-fulfilling prophecy resulting in counter-productive program effects (Pillow, Sandler,
Braver, Wolchik, & Gersten, 1991). Another explanation for iatrogenic effects is that when only
high-risk individuals participate in an intervention program, deviant peer bonding can occur,
counteracting the effect of the intervention and increasing the undesired behavior, such as
smoking (Dishion & Andrews, 1995; Dishion, Andrews, & Crosby, 1995).
Baseline by treatment interactions have been found in a variety of prevention studies,
many of which have found differential program effects for low risk individuals as compared to
their high risk counterparts (Allen & Philliber, 2001; Flay et al., 1985; Holmbeck, 1997; Jensen
et al., 2001; Pacifici, Stoolmiller, & Nelson, 2001; Stoolmiller, Eddy, & Reid, 2000; Wilson,
Lipsey, & Derzon, 2003). Pacifici, Stoolmiller, and Nelson (2001) found that an intervention to
reduce sexual coercion among high school students was effective for individuals who scored at
or above the baseline mean for indicators of coercive attitudes. However, those scoring below
the baseline mean did not significantly benefit from the program. Similarly, Stoolmiller, Eddy,
and Reid (2000) found that the efficacy of a program designed to lower violent behavior in
elementary school children depended upon the child’s pre-intervention level of violent behavior.

Baseline by Treatment Interactions 5
In addition, Flay et al. (1985) found that a program to decrease smoking had a greater impact
with individuals who already smoked or were exposed to smoking in the home, compared to
those who where not analogously exposed.
Baseline by treatment interactions have also been reported in treatment research. Jensen
et al. (2001) found that children with ADHD or ADHD comorbid with a conduct disorder
performed better with medication therapy and worse with behavioral therapy, while children
with ADHD comorbid with an anxiety disorder benefited equally well with either form of
therapy. Children with ADHD, comorbid with both an anxiety disorder and a conduct disorder,
were best served by a treatment regiment that combined medication and behavioral therapy.
Numerous authors have discussed iatrogenic effects and the need for the investigation of
the presence of these effects in prevention programs (e.g., Dishion, McCord, & Poulin, 1999;
Goodstadt, 1980; Lorion, 1983, 1987; Pillow et al., 1991; Werch & Owen, 2002). Besides
identifying any iatrogenic effects, another reason to investigate baseline by treatment interactions
in prevention programs is to discover how specific subgroups are affected by the program. With
this knowledge, changes to the content or implementation of the intervention can be made to
increase the efficacy of the program by tailoring the treatment to a particular subgroup’s specific
needs. Tailoring allows implementers to reduce time and costs by offering targeted interventions
to groups that do not need the full version or even by identifying individuals who do not require
the program at all, although selection of these individuals may create other problems (see Pillow
et al., 1991 for a description of problems related to selection).
Despite the likelihood that interventions are affecting individuals differently, an
alternative explanation for the presence of beneficial and adverse BTI effects is sampling
variability. Given that most researchers fix their alpha error to 0.05 for all statistical tests,

Baseline by Treatment Interactions 6
chance alone would dictate that a prevention program containing twenty variables, for example,
would likely have at least one statistically significant baseline by treatment interaction, even if
the program had the same effect on all participants. A spurious interaction may be reported
when in fact, no interaction existed. This underscores the need to replicate findings to determine
the true nature of these interactions.
The purpose of this paper is to investigate the ATLAS (Adolescents Training and
Learning to Avoid Steroids) prevention program for the presence of baseline by treatment
interactions in the twelve potential program mediators identified by MacKinnon et al. (2001) and
the three program outcome variables: intention to use steroids, nutrition behaviors, and strength
training self-efficacy.
The ATLAS Program
ATLAS is a prevention program aimed at limiting alcohol and select substance use
(‘athletic enhancing’ supplements and anabolic androgenic steroids (AAS)) among high school
football players (Goldberg et al., 1996; Goldberg et al., 2000). ATLAS focused on reducing
anabolic steroid use by targeting intentions to use AAS, as previous studies have shown that
intentions are strong predictors of future behaviors (Fishbein & Ajzen, 1975; Kim & Hunter,
1993). Intentions to use AAS were decreased by presenting state-of-the-art nutrition and
strength training programs as alternatives to AAS use. ATLAS is unlike other drug prevention
programs in that by promoting nutrition and strength training, ATLAS was able to offer direct
alternatives to AAS use and other athletic enhancing substances (For a more information on the
ATLAS program see Goldberg et al., 1996).
The effects of the intervention on intentions to use anabolic steroids, nutrition behaviors,
and strength training self-efficacy were reported in an earlier study (Goldberg et al., 2000).

Baseline by Treatment Interactions 7
Students in the treatment group reported an increased knowledge of the effects of AAS,
increased perceptions that their peers and teammates were a reliable source of information, more
confidence in their ability to resist offers of steroids, an increase in negative attitudes toward
AAS users, and an increase in the perceived severity of AAS effects and susceptibility to those
effects. Program participants identified more reasons for using AAS, as well as reasons against
using AAS. They also had greater perceived athletic competence, and self-esteem, while
becoming less likely to believe that their coaches were tolerant of AAS use or to believe in
media advertisements.
Although an investigation of the mediating mechanisms in ATLAS found that not all of
the twelve hypothesized mediating mechanisms were significant (MacKinnon et al., 2001),
Goldberg et al. (2000) found that all of the potential mediators did increase or decrease in the
desired direction as hypothesized by the investigators at the post-test, except for reasons for
using AAS, which was found to increase following exposure to the intervention. As a result, all
students who received the intervention might be expected to improve on all the mediators except
reasons for AAS use, regardless of their baseline measurement or any demographic variables.
Similarly, any significant interactions between program participation and baseline measurement
should enhance the positive effects of the intervention, rather than decrease it or cause negative
effects.
Overall, the target variables fall into five categories: outcomes, belief mediators,
knowledge mediators, social norm mediators, and resistance mediators. Significant baseline by
treatment interactions are expected for the belief mediators because the program is meant to
weaken positive beliefs about steroid use while reinforcing negative beliefs. Therefore,
individuals with strong a priori positive beliefs and weak negative beliefs should be affected

Baseline by Treatment Interactions 8
differently than those with already weak positive beliefs and strong negative beliefs. Knowledge
of the effects of AAS should also have a significant interaction, with players who know less
about steroids learning much more than players who already know a great deal about steroids.
The significant interactions should remain constant across measurements time (i.e. significant at
both post-test and one-year follow-up) and replicate across cohorts.
In contrast, the target variables that focus on social norms should not have significant
interactions, since any change in norms will affect everyone to the same degree, which should
also hold true for ability to resist drugs. Significant baseline by treatment interactions are not
expected for the three outcome variables either, because the outcome variables are expected to be
mediated by all of the variables and not just those with significant interactions.
Methods
Participants
The participants in this study were male high school football players from Oregon and
Washington. The mean age of the participants was 15.43 years of age, with 73.3% of the fathers
and 67.9% of the mothers having had at least some college education, and the parental divorce
rate was 33.54%. A majority of the sample was White, 77.9%, with the rest of the sample being
composed of 5.8% African-Americans, 3.6% Hispanics, 3.5% Asians, 0.9% Native Americans,
and 8.3% had a mixed ethnic background.
The sample was composed of three cohorts consisting of 3207 students, one new cohort
per year, with the first cohort starting in 1994. None of the demographic variables varied
significantly across cohorts (all p-values >0.05) except for age, which decreased from the Cohort
1 to the later cohorts by several months. The difference in age was expected, however, because
players in later cohorts were new to the team and mostly freshmen and sophomores.
Baseline by Treatment Interactions 9
Design
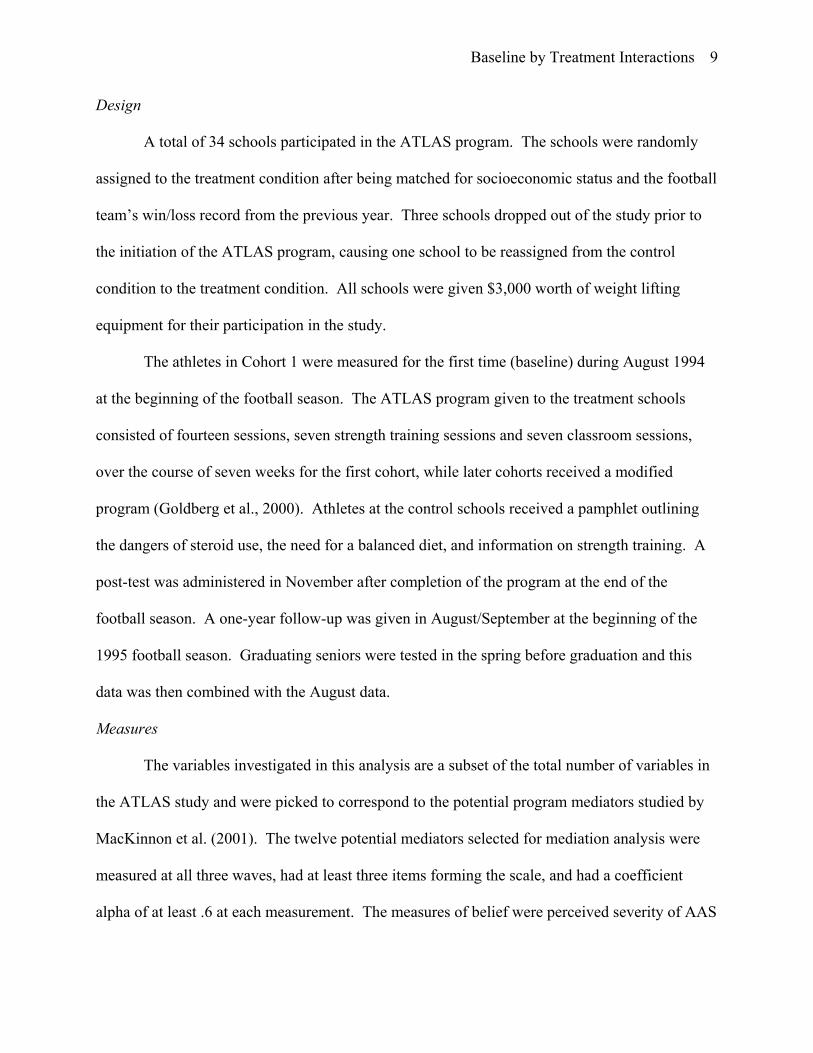
A total of 34 schools participated in the ATLAS program. The schools were randomly
assigned to the treatment condition after being matched for socioeconomic status and the football
team’s win/loss record from the previous year. Three schools dropped out of the study prior to
the initiation of the ATLAS program, causing one school to be reassigned from the control
condition to the treatment condition. All schools were given $3,000 worth of weight lifting
equipment for their participation in the study.
The athletes in Cohort 1 were measured for the first time (baseline) during August 1994
at the beginning of the football season. The ATLAS program given to the treatment schools
consisted of fourteen sessions, seven strength training sessions and seven classroom sessions,
over the course of seven weeks for the first cohort, while later cohorts received a modified
program (Goldberg et al., 2000). Athletes at the control schools received a pamphlet outlining
the dangers of steroid use, the need for a balanced diet, and information on strength training. A
post-test was administered in November after completion of the program at the end of the
football season. A one-year follow-up was given in August/September at the beginning of the
1995 football season. Graduating seniors were tested in the spring before graduation and this
data was then combined with the August data.
Measures
The variables investigated in this analysis are a subset of the total number of variables in
the ATLAS study and were picked to correspond to the potential program mediators studied by
MacKinnon et al. (2001). The twelve potential mediators selected for mediation analysis were
measured at all three waves, had at least three items forming the scale, and had a coefficient
alpha of at least .6 at each measurement. The measures of belief were perceived severity of AAS
Baseline by Treatment Interactions 10
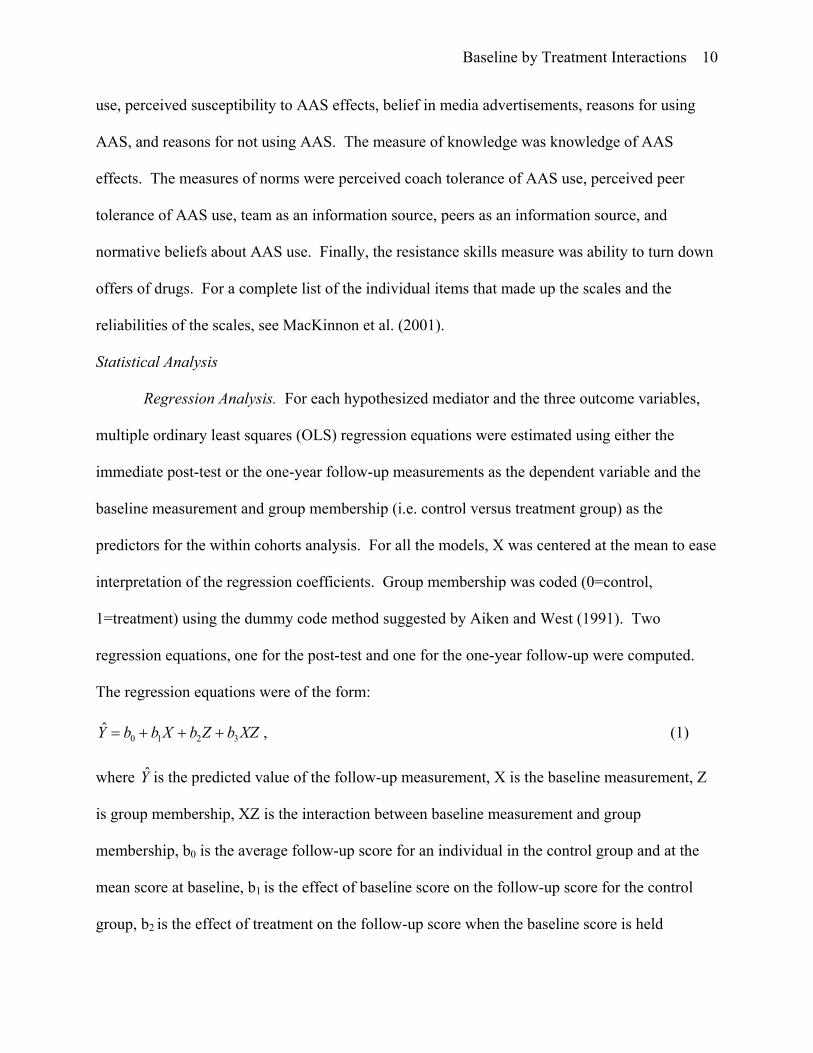
use, perceived susceptibility to AAS effects, belief in media advertisements, reasons for using
AAS, and reasons for not using AAS. The measure of knowledge was knowledge of AAS
effects. The measures of norms were perceived coach tolerance of AAS use, perceived peer
tolerance of AAS use, team as an information source, peers as an information source, and
normative beliefs about AAS use. Finally, the resistance skills measure was ability to turn down
offers of drugs. For a complete list of the individual items that made up the scales and the
reliabilities of the scales, see MacKinnon et al. (2001).
Statistical Analysis
Regression Analysis. For each hypothesized mediator and the three outcome variables,
multiple ordinary least squares (OLS) regression equations were estimated using either the
immediate post-test or the one-year follow-up measurements as the dependent variable and the
baseline measurement and group membership (i.e. control versus treatment group) as the
predictors for the within cohorts analysis. For all the models, X was centered at the mean to ease
interpretation of the regression coefficients. Group membership was coded (0=control,
1=treatment) using the dummy code method suggested by Aiken and West (1991). Two
regression equations, one for the post-test and one for the one-year follow-up were computed.
The regression equations were of the form:
XZbZbXbbY 3210ˆ +++= , (1)
where Y is the predicted value of the follow-up measurement, X is the baseline measurement, Z
is group membership, XZ is the interaction between baseline measurement and group
membership, b0 is the average follow-up score for an individual in the control group and at the
mean score at baseline, b1 is the effect of baseline score on the follow-up score for the control
group, b2 is the effect of treatment on the follow-up score when the baseline score is held

Baseline by Treatment Interactions 11
constant, and b3 is the effect of the interaction on the follow-up score. All parameters and
standard errors were estimated using SAS v.8.02 (SAS Institute, 2003).
A second across cohorts OLS regression analysis investigated whether the interaction
between baseline standing and group varied across cohort by probing the cohort by baseline by
group three-way interaction, using the model:
XZCbZCbXCbXZbCbZbXbbY 76543210ˆ +++++++= , (2)
where Y is the predicted value of the follow-up measurement, X is the baseline measurement, Z
is group membership, C is the cohort membership, XZ, XC, ZC, and XZC are the interactions
between baseline measurement, group membership, and cohort membership, b0 is the average
follow-up score for an individual in the control group, Cohort 1, and at the mean score at
baseline, b1 is the effect of baseline score on the follow-up score for an individual in the control
group and Cohort 1, b2 is the effect of treatment on the follow-up score for an individual in the
control group and Cohort 1, b3 is the effect of cohort on the follow-up score for an individual in
the control group and at the mean baseline score, b4 is the effect of the interaction between
baseline score and treatment group, b5 is the effect of the interaction between baseline score and
cohort, b6 is the effect of the interaction between treatment group and cohort, and b7 is the effect
of the interaction between baseline score, treatment group, and cohort. Cohort membership was
dichotomized into two groups, Cohort 1 and then a second group made up of Cohorts 2 and 3
combined. This dichotomization was done both to ease interpretation of the results and because
Cohorts 2 and 3 were fundamentally different than Cohort 1 in that they only included players
new to the team, whereas Cohort 1 included all players on the team.
Multilevel Modeling. Due to the dependence that exists among students at the same
school, it is important to model variation that is accounted for by the clustering within the

Baseline by Treatment Interactions 12
schools. To accomplish this, SAS PROC MIXED (SAS Institute, 2003) was used as described
by Singer (1998). The model was:
Level 1: ijijjjij eXY ++= 10 ββ
Level 2: jjj UZ 001000 ++= γγβ
jjj UZ 111101 ++= γγβ ,
where Y is the value of the follow-up measurement for the iijth student at the jth school, Xij is the
baseline measurement for the ith student at the jth school, Zj is group membership for the jth
school, β0j, and β1j are the level 1 regression coefficients for the jth school, γ00, γ01, γ10 and γ11 are
the level 2 regression coefficients, eij is the level 1 residual for the ith student at the jth school, and
U0j, and U1j are the level 2 residuals for the jth school.
Substituting the equations from level 2 into the equation in level 1 results in the mixed
model:
ijijjjjijjijij eXUUZXZXY ++++++= 1011011000 γγγγ , (3)
where γ00 is the average follow-up score for an individual in the control group and at the mean
baseline score, γ10 is the effect of baseline score for the control group, γ01 is the effect of
treatment for individuals at the mean baseline score, and γ11 is the effect of the interaction
between baseline score and group membership. U0j and U1j represent the random effects for the
jth school.
The three-way interaction between baseline, group, and cohort was also tested using
multilevel modeling. The model for the three-way interaction was:
Level 1: ijijijjijjijjjij eCXCXY ++++= 3210 ββββ
Level 2: jjj UZ 001000 ++= γγβ

Baseline by Treatment Interactions 13
jjj UZ 111101 ++= γγβ
jj Z21202 γγβ +=
jijj UZ 331303 ++= γγβ
where Y is the value of the follow-up measurement for the iijth student at the jth school, Xij is the
baseline measurement for the ith student at the jth school, Cij is cohort membership for the ith
student at the jth school, XijCij is the interaction between baseline measurement and cohort
membership for the ith student at the jth school, Zj is group membership at the jth school, β0j, β1j,
β2j, and β3j are the level 1 regression coefficients for the jth school, γ00, γ10, γ20, and γ30 are the
level 2 regression coefficients, γ01, γ11, γ21, and γ31 represent the effect of group membership, eij
is the level 1 residual for the ith student at the jth school, and U0j, U1j, and U3j are the level 2
residuals for the jth school. U2j was not included in the model because the cohorts were not
directly nested within the schools so significant variation of the effect of cohort β2j is not
expected.
Substituting the equations from level 2 into the equation in level 1 results in the mixed
model:
ijijijjijjj
jijijjijjijjijijijijij
eCXUXUU
ZCXZCZXZCXCXY
++++
+++++++=
310
3121110130201000 γγγγγγγγ (4)
where γ00 is the average follow-up score for individuals at the mean baseline score in the control
group in Cohort 1, γ10 is the effect of baseline score for individuals in the control group in Cohort
1, γ20 is the effect on cohort for individuals at the mean baseline score in the control group, γ30 is
the effect of the interaction between baseline score and cohort, γ01 is the effect of treatment group
for individuals at the mean baseline score in Cohort 1, γ11 is the effect of the interaction between
baseline score and treatment group, γ21 is the effect of the interaction between cohort and

Baseline by Treatment Interactions 14
treatment group, and γ31 is the effect of the interaction between baseline score, cohort, and
treatment group. U0j, U1j, and U3j represent the random effects for the jth school.
Results
Demographics
Table 1 shows the individual demographic variables for the treatment and control groups
for each of the three cohorts. The control and treatment groups are very similar for all of the
cohorts, the only consistent difference being father’s education level, which was higher in the
control group for all three cohorts.
__________________________________
Insert Table 1 About Here
__________________________________
Regression Analysis
Within Cohort. There were several significant interactions between baseline status and
group membership in each cohort, as shown in Table 2. Significant interactions were found for
Cohort 1 at the post-test for seven of the potential mediating variables: knowledge of the results
of AAS use, ability to turn down drugs, reasons to use AAS, team as an information source,
peers as an information source, belief in media advertisements, and perceived severity of AAS
use. A significant interaction was also found for one of the outcome variables for Cohort 1 at the
post-test, strength training self-efficacy. Of these eight interactions, only knowledge of AAS use
had a significant interaction at the one-year follow-up.
In Cohort 2, no outcome variables had significant interactions at the post-test, but intent
to use AAS was significant at the one-year follow-up. Four mediators were found to have

Baseline by Treatment Interactions 15
significant interactions terms at the post-test, with only reasons to use steroids having a
significant interaction at the one-year follow-up. Cohort 3 had three significant mediator
variable interaction terms at the post-test, but none were significant at the one-year follow-up.
There were no significant interactions for the outcome variables in Cohort 3 at the post-test, but
intent to use AAS was significant at the one-year follow-up.
Partial correlations were computed for the interaction terms to estimate the effects sizes
for the interactions. The largest partial correlation was for knowledge of the effects of AAS use
at the post-test in Cohort 3, where rpart= 0.159. Using 0.14 as a standard for small effect sizes
(Cohen, 1988), all of the effect sizes for the interactions are considered small.
__________________________________
Insert Table 2 About Here
__________________________________
Across Cohort. The results of the within cohort analysis suggest that the BTI effect may
differ across cohorts. A formal test of whether the interactions differ across cohorts was
accomplished by testing the baseline by treatment by cohort three-way interaction term. The
three-way interaction analyses show that the baseline by treatment interactions differed across
cohorts for three of the twelve potential mediators and one of the outcome variables at the post-
test, while one mediator, team as an information source, and one outcome variable, intent to use
AAS, were significant only at the one-year follow-up (Table 3). Only one of the interactions
was significant at both the post-test and the one-year follow-up, ability to turn down drugs.
Partial correlations were again computed for the interaction terms to estimate the effects
sizes for the interactions. The largest partial correlation occurred for team as an information

Baseline by Treatment Interactions 16
source at the one-year follow-up where rpart= 0.100, indicating that all of the effect sizes for the
interactions were small.
__________________________________
Insert Table 3 About Here
__________________________________
Multilevel Analyses
The following analyses are replications of the single level regression analyses described
earlier, but differ in that clustering within schools was included in the analysis. For the most part,
the multilevel analyses were very similar to the single level models. A measure of the
dependency of observations within schools is the intraclass correlation. The intraclass
correlation provides a gauge of whether multilevel modeling is necessary. Values of the ICC
were very small to small (e.g., 0.003 to 0.035).
Within Cohort. The within cohorts analysis looked at whether the BTI’s differed across
different follow-up measures when school membership was used as a clustering variable. In the
multilevel analysis of the Cohort 1 data there were seven significant baseline by treatment
interactions at the post-test (Table 4), six potential mediators and one outcome variable, all of
which had been significant in the single level analysis. As in the single level analysis, only
knowledge of the effects of AAS use was significant at the one-year follow-up.
For Cohort 2, three significant mediator interactions were found at the post-test but no
outcome interactions, with reasons to use AAS replicated at the one-year follow-up. However,
both nutrition behaviors and intent to use AAS were significant at the one-year follow-up.
Cohort 3 had two significant mediator interactions at the post-test, neither of which were

Baseline by Treatment Interactions 17
significant at the one-year follow-up, and two significant interactions at the one-year follow-up
that were not significant at the post-test.
__________________________________
Insert Table 4 About Here
__________________________________
Across Cohort. The across cohort analysis investigated difference in BTI’s across
cohorts when school membership was used as a clustering variable. The across cohort analysis
found significant interactions for three of the variables at the post-test, ability to turn down drugs,
team as an information source, and peers as an information source, and one of the outcome
variables, strength training self efficacy. Only team as an information source and intent to use
AAS were significant at the one-year follow-up (Table 5).
__________________________________
Insert Table 5 About Here
__________________________________
Discussion
The purpose of the ATLAS program was in part to reduce the amount of anabolic steroid
use among high school football players by reducing one outcome variable, intent to use AAS,
and increasing two other outcome variables, nutrition behavior and strength training self-efficacy.
This analysis examines the data from the ATLAS program for the presence of baseline by
treatment interactions in the twelve potential mediating variables and in the three outcome
variables. Only one of these outcome variables had a significant baseline by treatment
interaction in the first cohort at the post-test, strength training self-efficacy, which was not

Baseline by Treatment Interactions 18
significant at the one-year follow-up and was not replicated in either of the other two cohorts.
However, intent to use AAS had significant interactions at the one-year follow-up for both of the
later cohorts. The multilevel analysis, which included the subject’s school membership as a
clustering variable, found very similar results even after the error terms were adjusted for
clustering within school. Although the interaction for intent to use AAS was not significant for
the post-test for Cohort 2 and 3, closer inspection shows that the estimates are in the same
direction. The negative value of the interaction term means that at the post-test and one-year
follow-up individuals in the treatment group with higher levels of baseline intent had decreased
their intentions more than individuals with lower intent to use AAS. Also, the three-way
interaction between intention, group, and cohort was significant, indicating that the interaction
was not constant for the different cohorts. This would strengthen the assumption that an
interaction is present.
Although several interactions were detected for the twelve mediating variables, knowledge
of the effects of AAS use was the only variable that had a significant interaction at both the post-
test and the one-year follow-up, and consistently replicated in later cohorts. Even though the
interaction was not significant at the one-year follow-up for Cohorts 2 and 3, the estimates are in
the same direction as the post-test estimate. The negative value of the interaction term means
that as a student’s baseline knowledge increases, if they are in the treatment group, their
knowledge increases less than someone with lower baseline knowledge. A baseline by treatment
interaction was expected for knowledge of the effects of AAS, since players who already knew a
great deal about steroids were less likely to learn anything new from the program than players
who were unfamiliar with steroids. The lack of interactions in the belief mediators was
unexpected, however, especially for reasons to use AAS and reasons not to use AAS, as they

Baseline by Treatment Interactions 19
appear to be related to knowledge of steroids. It is important to consider, however, that the
measures are beliefs about the pros and cons of steroid use, not necessarily the actual facts about
steroid use.
The lack of baseline by treatment interactions for the normative mediators was expected.
When norms are changed for a social group, in this case the football team, the change should
affect everyone in that social group equally, regardless of their pre-treatment status. The
absence of interactions in the normative mediators supports the argument that the ATLAS
program is changing team norms. No interaction for ability to resist drug offers was expected
either, since ATLAS focuses mainly on increasing knowledge about AAS and describing
alternatives to AAS use.
Re-examining Table 2 shows that there were twenty significant two-way interactions out of
ninety possible interactions and Table 3 shows that there were five significant three-way
interaction out of thirty possible interactions. Except for knowledge of the effects of AAS use
and intent to use steroids, all other significant interactions were consistent with sampling
variability. The fact that the estimates for the interaction terms were not consistently positive or
negative supports this interpretation. However, the difficulty in detecting interactions in field
research should be mentioned. McClelland and Judd (1993) showed that nonoptimal
distributions of the variables led to a lower residual variance of the product of the variables and
reduced both the statistical power and the efficiency of the interaction parameter estimate in field
experiments compared to laboratory studies. Aiken and West (1991) likewise discuss the loss of
power when investigating interactions. One solution to decreased power is to increase the
number of observations, especially for interactions with small effect sizes (i.e., .14 or less), such
as the interactions in this paper. Another is to replicate the experiment. Because of this, the
Baseline by Treatment Interactions 20
replications in ATLAS made the determination of whether a significant interaction is spurious or
real more readily identifiable. However, the replications still did not make the presence or
absence of the interactions as clear as was planned.
The absence of harmful BTI effects is desirable for a program such as ATLAS because it
shows the program is having a beneficial effect on all subjects, which is appropriate as a
universal application for male athletes, irrespective of their baseline knowledge, beliefs, and
intentions. By not needing to give different players special versions of the program, it allows the
administrator of the program to reinforce the idea that the reduction of AAS use is a team goal,
rather than breaking the team into smaller units with differential risk. This is helpful since team
cohesion is a main ingredient of the ATLAS program.
Overall, it appears that ATLAS does have at least one baseline by treatment interaction,
knowledge of the effects of AAS use, and possibly a second BTI, intent to use AAS, based upon
a student’s pre-intervention level of risk. The baseline by treatment interaction analysis did not
discover any adverse, iatrogenic effects, however, as the direction of the interaction was
beneficial for both of the BTI’s. This study is then consistent with the idea that ATLAS,
designed to be delivered in a team atmosphere, can be safely applied, regardless of the student
athlete’s risk.

Baseline by Treatment Interactions 21
References
Aiken, L.S., & West, S.G. (1991). Multiple Regression: Testing and Interpreting Interactions.
Newbury Park, CA: Sage Publications.
Allen, J.P., & Philliber, S. (2001). Who benefits most from a broadly targeted prevention
program? Differential efficacy across populations in the teen outreach program. Journal of
Community Psychology, 29, 637-655.
Botvin, G.J., Maldagy, R.G., Griffin, K.W., Scheier, L.M., & Epstein, J.A. (1998). Alcohol and
marijuana use among rural youth: Interaction of social and interpersonal influences.
Addictive Behaviors, 23, 379-387.
Cohen, J. (1988). Statistical power analysis for the behavioral sciences, 2nd Ed. Hillsdale, NJ:
Erlbaum.
Dishion, T.J., & Andrews, D.W. (1995). Preventing escalation in problem behaviors with high-
risk young adolescents: Immediate and 1-year outcomes. Journal of Consulting and
Clinical Psychology, 63, 538-548.
Dishion, T.J., Andrews, D.W., & Crosby, L. (1995). Adolescent boys and their friends in early
adolescence: I. Relationship characteristics, quality, and interactional process. Child
Development, 66, 139-151.
Dishion, T.J., McCord, J., & Poulin, F. (1999). When interventions harm: Peer groups and
problem behavior. American Psychologist, 54, 755-764.
Fishbein, M., & Ajzen, J. (1975). Belief, attitude, intention, and behavior. Reading, MA:
Addison-Wesley.

Baseline by Treatment Interactions 22
Flay, B.R., Ryan, K.B., Best, J.A., Brown, K.S., Kersell, M.W., d’Avernas, J.R., & Zanna, M.P.
(1985). Are social-psychological smoking prevention programs effective? The Waterloo
study. Journal of Behavioral Medicine, 8, 37-59.
Goldberg, L., Elliot, D., Clarke, G. N., MacKinnon, D. P., Moe, E., Zoref, L., Green, C.,
Wolf, S. L., Greffrath, E., Miller, D. J., & Lapin, A. (1996). Effects of a multi-dimensional
anabolic steroid prevention intervention: The Adolescents Training and Learning to Avoid
Steroids (ATLAS) program. Journal of the American Medical Association, 276, 1555-1562.
Goldberg, L., MacKinnon, D.P., Elliot, D.L., Moe, E.L., Clarke, G., & Cheong, J.W. (2000).
The Adolescents Training and Learning to Avoid Steroids program: Preventing drug use
an promoting health behaviors. Archives of Pediatric and Adolescent Medicine, 154,
332-338.
Goodstadt, M.S. (1980). Drug education—A turn on or a turn off? Journal of Drug Education,
10, 89-99.
Holmbeck, G.N. (1997). Toward terminological, conceptual, and statistical clarity in the study
of mediators and moderators: Examples from the child-clinical and pediatric psychology
literatures. Journal of Consulting and Clinical Psychology, 65, 599-610.
Jensen, P.S., Hinshaw, S.P., Kraemer, H.C., Lenora, N., Newcorn, J.H., Abikoff, H.B., March,
J.S., Arnold, L.E., Cantwell, D.P., Conners, C.K., Elliott, G.R., Greenhill, L.L., Hechtman,
L., Hoza, B., Pelham, W.E., Severe, J.B., Swanson, J.M., Wells, K.C., Wigal, T., & Vitiello,
B. (2001). ADHD comorbidity findings from the MTA study: Comparing comorbid
subgroups. Journal of the American Academy of Child and Adolescent Psychiatry, 40, 147-
158.

Baseline by Treatment Interactions 23
Kim, M., & Hunter, J. E. (1993). Relationships among attitudes, behavioral intentions, and
behavior: A meta-analysis of past research, Part 2. Communication Research, 20, 331-364.
Lipsey, M.W., & Wilson, D.B. (1993). The efficacy of psychological, educational, and
behavioral treatments: Confirmation from meta-analysis. American Psychologist, 48,
1181-1209.
Lorion, R.P. (1983). Evaluating preventive interventions: Guidelines for the serious social
change agent. In R.D. Felner, L. Jason, J. Moritsugu, & S.S. Farber (Eds.), Preventive
Psychology: Theory, Research and Practice (pp. 243-250). New York: Pergamon Press.
Lorion, R.P. (1987). The other side of the coin: The potential for negative consequences of
preventive interventions. In J.A. Steinberg & M.M. Silverman (Eds.), Preventing Mental
Disorders: A research perspective (pp. 243-250). Rockville, MD: National Institute of
Mental Health.
MacKinnon, D.P., Goldberg, L., Clarke, G.N., Elliot, D.L., Cheong, J.W., Lapin, A., Moe, E.L.,
& Krull, J.L. (2001). Mediating mechanisms in a program to reduce intentions to use
anabolic steroids and improve exercise self-efficacy and dietary behavior. Prevention
Science, 2, 15-28.
MacKinnon, D.P., Weber, M.D., & Pentz, M.A. (1988). How do school-based drug prevention
programs work and for whom? Drugs and Society, 3, 125-143.
McClelland, G.H., & Judd, C.M. (1993). Statistical difficulties of detecting interactions and
moderator effects. Psychological Bulletin, 114, 376-390.
Pacifici, C., Stoolmiller, M., & Nelson, C. (2001). Evaluating a prevention program for
teenagers on sexual coercion: A differential effectiveness approach. Journal of
Consulting and Clinical Psychology, 69, 552-559.

Baseline by Treatment Interactions 24
Pentz, M.A., Dwyer, J., MacKinnon, D.P., Flay, B.R., Hansen, W.B., Wang, E., & Johnson, C.A.
(1989). A multi-community trial for primary prevention of adolescent drug abuse:
Effects of drug use prevalence. Journal of the American Medical Association, 261, 3259-
3266.
Pillow, D.R., Sandler, I.N., Braver, S.L., Wolchik, S.A., and Gersten, J.C. (1991). Theory-
based screening for prevention: Focusing on mediating processes in children of divorce.
American Journal of Community Psychology, 19, 809-836.
SAS Institute. (2003). Statistical analysis system. Available at http:/www.sas.com
Singer, J.D. (1998). Using SAS PROC MIXED to fit multilevel models, hierarchical models,
and individual growth models. Journal of Educational and Behavioral Statistics, 24,
323-355.
Stoolmiller, M., Eddy, J.M., & Reid, J.B. (2000). Detecting and describing preventive
intervention effects in a universal school-based randomized trial targeting delinquent and
violent behavior. Journal of Consulting and Clinical Psychology, 68, 296-306.
Werch, C.E., & Owen, D.M. (2002). Iatrogenic effects of alcohol and drug prevention
programs. Journal of Studies on Alcohol, 63, 581-590.
Wilson, S.J., Lipsey, M.W., & Derzon, J.H. (2003). The effects of school-based intervention
programs on aggressive behavior: A meta-analysis. Journal of Consulting and Clinical
Psychology, 71, 136-149.

Baseline by Treatment Interactions 25
Table 1. Demographic variables for treatment groups by cohort.
Demographics Cohort 1 Cohort 2 Cohort 3
Control Treatment Control Treatment Control Treatment
Sample Size 804 702 493 391 422 395
Age 15.79 15.89 15.20 15.11 14.93* 15.11
(St. Error) (1.16) (1.16) (1.15) (1.15) (1.12) (1.08)
GPA 3.07* 3.00 2.98 3.03 3.12 3.05
(St. Error) (0.64) (0.63) (0.62) (0.68) (0.64) (0.60)
Asian% 3.52 3.00 3.88 3.34 3.59 3.56
Native American% 0.38 1.29 1.63 0.77 0.96 0.51
Hispanic% 3.14 2.29 5.10 3.86 4.31 4.07
African American% 4.40 6.29 4.29 10.03 4.07 7.63
White% 79.40 76.97 80.00 75.32 76.79 77.61
Mixed Ethnicity% 9.17 10.16 5.10 6.68 10.29 6.62
Father some college% 77.60* 71.67 73.06* 64.87 77.38* 71.84
Mother some college% 70.75 67.77 67.01* 57.45 73.08 68.13
Parents divorced% 31.29 33.14 33.95 38.26 34.22 32.99
Note: All significance test are t-tests with 1 degree of freedom between the treatment and control
group within the same cohort.
* P<0.05

Baseline by Treatment Interactions 26
Table 2.
OLS regression coefficient estimates, standard errors, and partial correlations for the Baseline x
Group interaction term.
Cohort 1 Cohort 2 Cohort 3
Construct Year Year Year
Post-test Follow-up Post-test Follow-up Post-test Follow-up
Nutrition behaviors 0.018 0.010 -0.028 0.177 0.012 -0.101
(0.046) (0.060) (0.068) (0.092) (0.070) (0.093)
0.011 0.006 0.016 0.094 0.007 0.053
Intent to use AAS -0.008 0.032 -0.153 -0.309** -0.093 -0.328**
(0.046) (0.062) (0.081) (0.101) (0.091) (0.103)
0.005 0.018 0.074 0.149 0.041 0.156
Strength training efficacy -0.273** -0.077 0.032 0.032 -0.100 -0.009
(0.053) (0.065) (0.070) (0.094) (0.079) (0.091)
0.147 0.040 0.018 0.017 0.051 0.005
Knowledge of AAS use -0.223** -0.235** -0.223** -0.033 -0.339** -0.074
(0.053) (0.070) (0.078) (0.100) (0.084) (0.102)
0.109 0.113 0.111 0.016 0.159 0.036
Coach's tolerance of use -0.063 -0.088 -0.190* 0.133 0.089 -0.148
(0.059) (0.076) (0.083) (0.117) (0.088) (0.106)
0.003 0.039 0.090 0.006 0.041 0.069

Baseline by Treatment Interactions 27
Table 2. continued
Cohort 1 Cohort 2 Cohort 3
Construct Year Year Year
Post-test Follow-up Post-test Follow-up Post-test Follow-up
Ability to turn down drugs -0.123* 0.037 -0.028 -0.059 0.212* -0.092
(0.051) (0.064) (0.077) (0.105) (0.083) (0.108)
0.069 0.020 0.014 0.027 0.102 0.042
Peer tolerance of use -0.040 0.010 -0.159* -0.113 0.133 0.031
(0.055) (0.069) (0.075) (0.092) (0.074) (0.093)
0.022 0.005 0.085 0.061 0.072 0.017
Normative beliefs of AAS -0.086 0.009 -0.013 -0.166 0.177* -0.010
(0.053) (0.066) (0.075) (0.087) (0.083) (0.099)
0.047 0.005 0.008 0.094 0.086 0.005
Susceptibility to AAS -0.013 -0.001 0.096 0.015 -0.023 -0.094
(0.054) (0.064) (0.076) (0.095) (0.075) (0.099)
0.007 0.001 0.050 0.008 0.012 0.048
Reasons to use AAS 0.107* 0.105 -0.220** 0.309* 0.095 0.058
(0.047) (0.054) (0.068) (0.124) (0.070) (0.098)
0.065 0.066 0.127 0.121 0.054 0.029

Baseline by Treatment Interactions 28
Table 2. continued
Cohort 1 Cohort 2 Cohort 3
Construct Year Year Year
Post-test Follow-up Post-test Follow-up Post-test Follow-up
Reasons not to use AAS 0.003 0.034 0.088 -0.017 -0.053 -0.058
(0.061) (0.076) (0.082) (0.106) (0.089) (0.111)
0.001 0.015 0.042 0.008 0.024 0.026
Team as an info source -0.177** 0.008 -0.092 -0.174 0.101 -0.224*
(0.056) (0.068) (0.081) (0.108) (0.085) (0.099)
0.093 0.004 0.045 0.079 0.047 0.111
Peers as an info source -0.136* 0.003 0.084 -0.105 0.064 -0.040
(0.054) (0.068) (0.074) (0.096) (0.080) (0.100)
0.073 0.002 0.045 0.054 0.032 0.020
Belief in media -0.158** -0.030 -0.118 -0.066 0.098 0.159
(0.055) (0.068) (0.072) (0.092) (0.081) (0.095)
0.083 0.015 0.067 0.035 0.049 0.082
Perceived severity of AAS -0.150** -0.063 0.054 -0.138 -0.030 0.122
(0.053) (0.067) (0.078) (0.096) (0.079) (0.092)
0.082 0.032 0.027 0.070 0.015 0.065
Note: Standard errors are in parentheses. Partial correlations are in bold.
* P<0.05, ** P<0.01.

Baseline by Treatment Interactions 29
Table 3.
OLS regression coefficient estimates, standard errors, and partial correlations for the
Baseline x Group x Cohort interaction term.
Construct Year
Post-test Follow-up
Nutrition behaviors -0.006 -0.050
(0.032) (0.043)
0.004 0.028
Intent to use AAS -0.077 -0.187**
(0.041) (0.051)
0.038 0.089
Strength training efficacy 0.095** -0.008
(0.033) (0.039)
0.058 0.005
Knowledge of AAS use 0.017 0.022
(0.040) (0.051)
0.008 0.010
Coach's tolerance of use -0.023 -0.050
(0.044) (0.056)
0.010 0.022

Baseline by Treatment Interactions 30
Table 3. continued
Construct Year
Post-test Follow-up
Ability to turn down drugs 0.077* -0.103*
(0.035) (0.045)
0.044 0.055
Peer tolerance of use 0.016 -0.007
(0.041) (0.051)
0.008 0.003
Normative beliefs of AAS 0.077 -0.042
(0.043) (0.051)
0.036 0.020
Susceptibility to AAS -0.026 -0.076
(0.037) (0.046)
0.014 0.040
Reasons to use AAS -0.073* -0.026
(0.037) (0.052)
0.039 0.012

Baseline by Treatment Interactions 31
Table 3. continued
Construct Year
Post-test Follow-up
Reasons not to use AAS -0.090 -0.064
(0.046) (0.057)
0.040 0.027
Team as an info source 0.023 -0.184**
(0.037) (0.044)
0.013 0.102
Peers as an info source 0.076* -0.049
(0.038) (0.05)
0.040 0.024
Belief in media 0.066 0.022
(0.040) (0.049)
0.033 0.011
Perceived severity of AAS 0.013 0.052
(0.035) (0.044)
0.007 0.029
Note: Standard errors are in parentheses. Partial correlations are in bold.
* P<0.05, ** P<0.01.

Baseline by Treatment Interactions 32
Table 4.
Multilevel regression coefficient estimates and standard errors for the Baseline x Group
interaction term.
Cohort 1 Cohort 2 Cohort 3
Construct Year Year Year
Post-test Follow-up Post-test Follow-up Post-test Follow-up
Nutrition behaviors 0.021 0.004 -0.033 0.180* 0.005 -0.098
(0.050) (0.064) (0.073) (0.091) (0.070) (0.102)
Intent to use AAS 0.020 0.037 -0.164 -0.351* -0.078 -0.326**
(0.077) (0.081) (0.103) (0.15) (0.116) (0.110)
Strength training efficacy -0.258** -0.069 0.001 0.015 -0.082 0.002
(0.054) (0.066) (0.071) (0.094) (0.083) (0.092)
Knowledge of AAS use -0.224** -0.230** -0.224** -0.049 -0.340** -0.108
(0.054) (0.072) (0.080) (0.103) (0.091) (0.113)
Coach's tolerance of use -0.022 -0.060 -0.188* 0.126 0.076 -0.152
(0.067) (0.084) (0.091) (0.122) (0.100) (0.110)
Ability to turn down drugs -0.125* 0.038 -0.031 -0.055 0.213* -0.093
(0.052) (0.064) (0.077) (0.112) (0.083) (0.109)
Peer tolerance of use -0.038 0.010 -0.144 -0.103 0.124 0.038
(0.068) (0.069) (0.080) (0.101) (0.076) (0.095)
Normative beliefs of AAS -0.120 0.020 -0.021 . 0.172 -0.040
(0.078) (0.081) (0.092) (.) (0.102) (0.115)

Baseline by Treatment Interactions 33
Table 4. continued
Cohort 1 Cohort 2 Cohort 3
Construct Year Year Year
Post-test Follow-up Post-test Follow-up Post-test Follow-up
Susceptibility to AAS -0.010 0.005 0.080 0.005 -0.025 -0.094
(0.057) (0.066) (0.079) (0.096) (0.076) (0.097)
Reasons to use AAS 0.079 0.105 -0.290* 0.289* 0.074 0.051
(0.057) (0.070) (0.113) (0.14) (0.086) (0.107)
Reasons not to use AAS -0.004 0.045 . -0.016 -0.047 -0.061
(0.065) (0.083) (.) (0.108) (0.088) (0.130)
Team as an info source -0.157** 0.042 -0.086 -0.132 0.073 -0.213*
(0.058) (0.070) (0.083) (0.108) (0.089) (0.101)
Peers as an info source -0.121* 0.008 0.085 -0.106 0.059 -0.049
(0.056) (0.069) (0.075) (0.096) (0.083) (0.102)
Belief in media -0.151* -0.026 -0.132 -0.086 0.116 .
(0.061) (0.073) (0.075) (0.097) (0.091) (.)
Perceived severity of AAS -0.141** -0.057 0.013 -0.151 -0.043 0.121
(0.053) (0.068) (0.079) (0.097) (0.081) (0.092)
Note: Standard errors are in parentheses. A period indicates the model did not converge.
* P<0.05, ** P<0.01.

Baseline by Treatment Interactions 34
Table 5.
Multilevel regression coefficient estimates and standard errors for the Baseline x Group x Cohort
interaction term.
Construct Year
Post-test Follow-up
Nutrition behaviors -0.034 0.026
(0.069) (0.090)
Intent to use AAS -0.143 -0.343**
(0.091) (0.109)
Strength training efficacy 0.259** 0.096
(0.077) (0.093)
Knowledge of AAS use -0.055 0.176
(0.078) (0.101)
Coach's tolerance of use 0.007 0.076
(0.095) (0.115)
Ability to turn down drugs 0.223** -0.112
(0.078) (0.099)
Peer tolerance of use 0.026 -0.050
(0.083) (0.096)
Normative beliefs of AAS 0.164 -0.101
(0.090) (0.103)

Baseline by Treatment Interactions 35
Table 5. continued
Construct Year
Post-test Follow-up
Susceptibility to AAS 0.040 -0.045
(0.078) (0.096)
Reasons to use AAS -0.100 0.000
(0.079) (0.098)
Reasons not to use AAS 0.004 -0.084
(0.093) (0.112)
Team as an info source 0.187* -0.204*
(0.084) (0.102)
Peers as an info source 0.221** -0.075
(0.079) (0.098)
Belief in media 0.133 0.056
(0.079) (0.099)
Perceived severity of AAS 0.148 0.058
(0.078) (0.096)
Note: Standard errors are in parentheses. A period indicates the model did not converge.
* P<0.05, ** P<0.01.