Basel III Disclosure Basel III Disclosure Fiscal 2012 Board of Directors Holding company (Mitsubishi...
75
Basel III Data (Consolidated) Mitsubishi UFJ Financial Group, Inc. 29 Risk Management Overview 2 Credit Risk Management 6 Risk Management of Strategic Equity Portfolio 16 Market Risk Management 16 Liquidity Risk Management 23 Operational Risk Management 24 Basel III Disclosure Fiscal 2012 1
Transcript of Basel III Disclosure Basel III Disclosure Fiscal 2012 Board of Directors Holding company (Mitsubishi...
Basel III Data (Consolidated)
Mitsubishi UFJ Financial Group, Inc. 29
Risk Management
Overview 2
Credit Risk Management 6
Risk Management of Strategic Equity Portfolio 16
Market Risk Management 16
Liquidity Risk Management 23
Operational Risk Management 24
Basel III Disclosure Fiscal 2012
1

Type of Risk Definition
Credit Risk The risk of financial loss in credit assets (including off-balance sheet instruments) caused by deterioration in the credit conditions of counterparties. This category includes country risk.
Market Risk Market risk is the risk of financial loss where the value of our assets and liabilities could be adversely affected by changes in market variables such as interest rates, securities prices and foreign exchange rates. Market liquidity risk is the risk of financial loss caused by the inability to secure market transactions at the required volume or price levels as a result of market turbulence or lack of trading liquidity.
Liquidity Risk The risk of incurring loss if a poor financial position at a group company hampers the ability to meet funding requirements or necessitates fund procurement at interest rates markedly higher than normal.
Operational Risk The risk of loss resulting from inadequate or failed internal processes, people or systems, or from external events.
Operations Risk The risk of incurring loss that might be caused by negligence of correct operational processing, or by incidents or misconduct by either officers or staff, as well as other similar risks.
Information Asset Risk The risk of loss caused by loss, alteration, falsification or leakage of information, or by destruction, disruption, errors or misuse of information systems, as well as other similar risks.
Reputation Risk
The risk of loss due to deterioration in reputation as a consequence of the spread of rumors among customers or in the market, or as a consequence of inadequate response to a particular circumstance by MUFG, as well as other similar risks.
2
Basel III Disclosure Fiscal 2012
Numerous changes in our business environment have occurred as a result of globalization of the financial industry, the
advancement of information technology, and changes in economic conditions. We aim to be a global and compre-
hensive financial group encompassing leading commercial and trust banks, and securities firms. Risk management
plays an increasingly important role as the risks faced by financial groups such as us increase in scope and variety.
We identify various risks arising from businesses based on uniform criteria, and implement integrated risk manage-
ment to ensure a stronger financial condition and to maximize shareholder value. Based on this policy, we identify,
measure, control and monitor a wide variety of risks so as to achieve a stable balance between earnings and risks. We
undertake risk management to create an appropriate capital structure and to achieve optimal allocation of resources.
Risk Classification
At the holding company level, we broadly classify and define risk categories faced by the Group including those that are
summarized below. Group companies perform more detailed risk management based on their respective operations.
Risk Management
Overview
3
Basel III Disclosure Fiscal 2012
Board of Directors
Holding company (Mitsubishi UFJ Financial Group)
Corporate Risk Management Division
(Coordinates risk management)
Public Relations Division
Executive Committee
Market Risk, Liquidity Risk, Operational Risk, Operations Risk
Corporate Risk Management Division, Operations &
Systems Planning DivisionInformation Asset Risk
Corporate Risk Management Committee
(includes crisis management)
Management Planning Committee
(includes ALM)
Group Credit Management Committee
Risk Committee
Reputation Risk
Credit & Investment Management Division Credit Risk
Board of Directors
Corporate Risk Management Division
(Coordinates risk management)
Credit Policy & Planning Division
Operations Services Planning Division
Corporate Administration Division
Compliance & Legal Division
Public Relations Division
Compliance & Legal Division, Systems Division
Human Resources Division
Executive Committee ALM Committee
Market Risk, Liquidity Risk,
Operational Risk
Risk Management Committee
(includes crisis management)
Credit & Investment Management Committee
Credit Committee
Information Security Management Committee
Operations Risk
Transaction Services Division
Settlement Risk
Credit Risk
Tangible Asset Risk
Legal Risk
Reputation Risk
Information Asset Risk
Personnel Risk
Board of Directors
Executive Committee
Corporate Risk Management Division
(Coordinates risk management)
Credit Risk, Market Risk, Liquidity Risk,
Operational Risk, Information Asset Risk
Credit and Investment Council
ALM Council
Crisis Management Committee
Operational Risk Management Committee
Capital Management Committee
Operations Planning Division
Operations Risk
Corporate Administration Division
Tangible Asset Risk
Personnel Division Personnel Risk
Compliance & Legal Division Legal Risk
Corporate Planning Division Reputation Risk
Discuss and report
Discuss and report
Establish fundamental policy
Group Companies
Bank of Tokyo-Mitsubishi UFJ Mitsubishi UFJ Trust and Banking Mitsu
bish
i UFJ Secu
rities Ho
ldin
gs
Oth
er Sub
sidiaries
Guidance and advice
Risk Management System
Risk Management System
We have adopted an integrated risk management system to promote close cooperation among the holding company
and group companies. The holding company and the major subsidiaries (which include BTMU, MUTB and MUSHD)
each appoint a chief risk officer and establish an independent risk management division. The board of directors of the
holding company determines risk management policies for various type of risk based on the discussions at, and
reports and recommendations from, committees established specially for risk management purposes. The holding
company has established committees to assist management in managing risks relevant to the Group. For example, the
Corporate Risk Management Committee and the Group Credit Management Committee each deliberate important
issues regarding the risk management policy and framework for the Group and report to the Executive Committee. In
addition, the Risk Committee also deliberates important issues regarding the risk management policy and framework
for the Group and reports to the board of directors. Following the fundamental risk management policies determined
by the board of directors, each group company establishes its own systems and procedures for identifying, analyzing
and managing various types of risks from both quantitative and qualitative perspectives. The holding company seeks
to enhance group wide risk identification, to integrate and improve the Group’s risk management system and related
methods, to maintain asset quality, and to eliminate concentrations of specific risks.

4
Basel III Disclosure Fiscal 2012
Business Continuity Management
In order to have a clear critical response rationale and associated decision-making criteria, we have developed systems
designed to ensure that our operations are not interrupted or can be restored to normal quickly in the event of a nat-
ural disaster or system failure so as to minimize any disruption to customers and markets. A crisis management team
within the holding company is the central coordinating body in the event of any emergency. Based on information
collected from crisis management personnel at the major subsidiaries, this central body would assess the overall
impact of a crisis on the Group’s business and establish task forces that could implement all countermeasures to
restore full operations. We have business continuity plans to maintain continuous operational viability in the event of
natural disasters, system failures and other types of emergencies. Regular training drills are conducted to upgrade the
practical effectiveness of these systems.
The Great East Japan Earthquake created unprecedented and extreme circumstances, an electricity power supply
shortage and a need for all companies in Japan, including us, to reduce their electricity consumption. We are conduct-
ing a comprehensive review of our existing business continuity plan to more effectively respond to these circumstances
as well as further extreme scenarios, such as a sudden massive blackout in major metropolitan areas in Japan. In addi-
tion, recognizing that our operations particularly in Japan are subject to the risk of earthquakes and other natural
disasters as well as accidents resulting from such disasters, and that our contingency plans may not address all eventu-
alities that may occur in the event of a material disruption to our operations, we continue to contemplate and imple-
ment measures to augment our current business continuity management framework, including enhancing our off-site
back-up data storage and other information technology systems.
Implementation of Basel Standards
Basel II, as adopted by the FSA, has been applied to Japanese banks since March 31, 2007. Certain provisions of Basel
III were adopted by the FSA effective March 31, 2013 for Japanese banking institutions with international operations
conducted by their foreign offices. Basel III is based on Basel II’s comprehensive regulatory framework which is built on
“three pillars”: (1) minimum capital requirements, (2) the self-regulation of financial institutions based on supervisory
review process, and (3) market discipline through the disclosure of information. Based on the Basel principles, MUFG
has adopted the Advanced Internal Ratings-Based Approach to calculate its capital requirements for credit risk since
March 31, 2009. The Standardized Approach is used for some subsidiaries that are considered to be immaterial to our
overall capital requirements, and UNBC has adopted a phased rollout of the Internal Ratings-Based Approach. MUFG
has adopted the Advanced Measurement Approach since March 31, 2012 to calculate its capital requirements for
operational risk, except that we use the Basic Indicator Approach for entities that are deemed to be less important in
the calculation of the operational risk equivalent amount and for entities that are still preparing to implement the
Advanced Measurement Approach. As for market risk, MUFG has adopted the Internal Models Approach mainly to
calculate general market risk and adopted the Standardized Measurement Method to calculate specific risk.

5
Basel III Disclosure Fiscal 2012
In response to the recent financial crisis, the Group of Central Bank Governors and Heads of Supervision has made a
series of announcements regarding the new global regulatory framework, which has been referred to as “Basel III,” to
strengthen the regulation, supervision and risk management of the banking sector. Various Basel III measures are
being phased in from the calendar year 2013, including those designed to raise the level of minimum capital require-
ments and to establish an internationally harmonized leverage ratio and a global minimum liquidity standard. In addi-
tion, the Basel Committee on Banking Supervision has proposed additional loss absorbency requirements to
supplement the Common Equity Tier 1 capital requirement ranging from 1% to 3.5% for global systemically impor-
tant banks, or G-SIBs, depending on the bank’s systemic importance. The Financial Stability Board identified us as a
G-SIB in its most recent annual report published in November 2012, and indicated that, as a G-SIB, we would be
required to hold an additional 1.5% of Common Equity Tier 1. The group of banks identified as G-SIBs is expected to
be updated annually, and the first group of G-SIBs to which the stricter capital requirements will initially be applied is
expected to be identified in 2014. The stricter capital requirements are expected to be implemented in phases
between January 1, 2016 and December 31, 2018 and will become fully effective on January 1, 2019.
Based on the Basel III framework, the Japanese capital ratio framework has been revised to implement the more strin-
gent requirements, which are being implemented in phases beginning on March 31, 2013. Likewise, local banking
regulators outside of Japan, such as those in the United States, are expected to revise the capital and liquidity require-
ments imposed on our subsidiaries and operations in those countries to implement the more stringent requirements
of Basel III as adopted in those countries. We intend to carefully monitor further developments with an aim to
enhance our corporate value and maximize shareholder value by integrating the various strengths within the MUFG
Group.

6
Basel III Disclosure Fiscal 2012
Credit risk is the risk of losses due to deterioration in the financial condition of a borrower. We have established risk man-
agement systems to maintain asset quality, manage credit risk exposure and achieve earnings commensurate with risk.
Our major banking subsidiaries (which include BTMU and MUTB) apply a uniform credit rating system for asset evalua-
tion and assessment, loan pricing, and quantitative measurement of credit risk. This system also underpins the calcula-
tion of capital requirements and management of credit portfolios. We continually seek to upgrade credit portfolio
management, or CPM, expertise to achieve an improved risk-adjusted return based on the Group’s credit portfolio sta-
tus and flexible response capability to economic and other external changes.
Credit Risk Management System
The credit portfolios of our major banking subsidiaries are monitored and assessed on a regular basis by the holding
company to maintain and improve asset quality. A uniform credit rating and asset evaluation and assessment system is
used to ensure timely and proper evaluation of all credit risks.
Under our credit risk management system, each of our subsidiaries in the banking, securities, consumer finance, and
leasing businesses, manages its respective credit risk on a consolidated basis based on the attributes of the risk, while
the holding company oversees and manages credit risk on an overall group-wide basis. The holding company also
convenes regular committee meetings to monitor credit risk management at banking subsidiaries and to issue guid-
ance where necessary.
Each major banking subsidiary has in place a system of checks and balances in which a credit administration section
that is independent of the business promotion sections screens individual transactions and manages the extension of
credit. At the management level, regular meetings of the Credit & Investment Management Committee and related
deliberative bodies ensure full discussion of important matters related to credit risk management. Besides such checks
and balances and internal oversight systems, credit examination sections also undertake credit testing and evaluation
to ensure appropriate credit risk management.
Board of Directors/Executive Committee Credit & Investment Management Committee
/ related deliberative bodies
Credit examination sections
Credit risk management sections
Monitoring by MUFG Credit Management
Committee
Credit administration sections
Business promotion sections
Credit testing and evaluation
Quantitative risk monitoring
Credit screening and management
Regular report
Management System of the Major Subsidiaries
Decisions regarding important matters Delegation of authority
Discussion of important matters Transaction report
Credit Risk Management Framework of the Major Banking Subsidiaries
Credit Risk Management
Borrower Rating
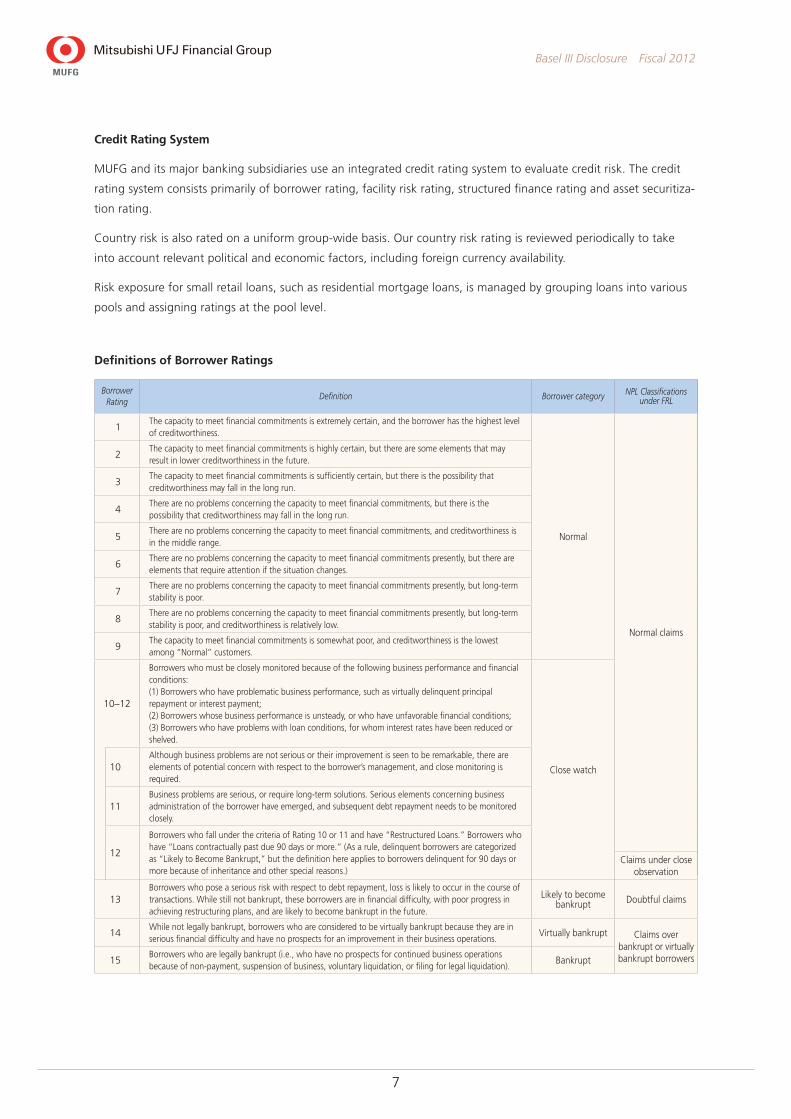
Definition Borrower category NPL Classifications under FRL
1The capacity to meet financial commitments is extremely certain, and the borrower has the highest level of creditworthiness.
Normal
Normal claims
2The capacity to meet financial commitments is highly certain, but there are some elements that may result in lower creditworthiness in the future.
3The capacity to meet financial commitments is sufficiently certain, but there is the possibility that creditworthiness may fall in the long run.
4There are no problems concerning the capacity to meet financial commitments, but there is the possibility that creditworthiness may fall in the long run.
5There are no problems concerning the capacity to meet financial commitments, and creditworthiness is in the middle range.
6There are no problems concerning the capacity to meet financial commitments presently, but there are elements that require attention if the situation changes.
7There are no problems concerning the capacity to meet financial commitments presently, but long-term stability is poor.
8There are no problems concerning the capacity to meet financial commitments presently, but long-term stability is poor, and creditworthiness is relatively low.
9The capacity to meet financial commitments is somewhat poor, and creditworthiness is the lowest among “Normal” customers.
10–12
Borrowers who must be closely monitored because of the following business performance and financial conditions:(1) Borrowers who have problematic business performance, such as virtually delinquent principal repayment or interest payment;(2) Borrowers whose business performance is unsteady, or who have unfavorable financial conditions;(3) Borrowers who have problems with loan conditions, for whom interest rates have been reduced or shelved.
Close watch 10Although business problems are not serious or their improvement is seen to be remarkable, there are elements of potential concern with respect to the borrower’s management, and close monitoring is required.
11Business problems are serious, or require long-term solutions. Serious elements concerning business administration of the borrower have emerged, and subsequent debt repayment needs to be monitored closely.
12
Borrowers who fall under the criteria of Rating 10 or 11 and have “Restructured Loans.” Borrowers who have “Loans contractually past due 90 days or more.” (As a rule, delinquent borrowers are categorized as “Likely to Become Bankrupt,” but the definition here applies to borrowers delinquent for 90 days or more because of inheritance and other special reasons.)
Claims under close observation
13Borrowers who pose a serious risk with respect to debt repayment, loss is likely to occur in the course of transactions. While still not bankrupt, these borrowers are in financial difficulty, with poor progress in achieving restructuring plans, and are likely to become bankrupt in the future.
Likely to become bankrupt Doubtful claims
14While not legally bankrupt, borrowers who are considered to be virtually bankrupt because they are in serious financial difficulty and have no prospects for an improvement in their business operations.
Virtually bankrupt Claims over bankrupt or virtually bankrupt borrowers15
Borrowers who are legally bankrupt (i.e., who have no prospects for continued business operations because of non-payment, suspension of business, voluntary liquidation, or filing for legal liquidation).
Bankrupt
7
Basel III Disclosure Fiscal 2012
Credit Rating System
MUFG and its major banking subsidiaries use an integrated credit rating system to evaluate credit risk. The credit
rating system consists primarily of borrower rating, facility risk rating, structured finance rating and asset securitiza-
tion rating.
Country risk is also rated on a uniform group-wide basis. Our country risk rating is reviewed periodically to take
into account relevant political and economic factors, including foreign currency availability.
Risk exposure for small retail loans, such as residential mortgage loans, is managed by grouping loans into various
pools and assigning ratings at the pool level.
Definitions of Borrower Ratings
8
Basel III Disclosure Fiscal 2012
• Borrower rating
Our borrower rating classifies borrowers into 15 grades based on evaluations of their expected debt-service capability
over the next three to five years.
• Facility risk rating
Facility risk rating is used to evaluate and classify the quality of individual credit facilities, including guarantees and collat-
eral. Ratings are assigned by quantitatively measuring the estimated loss rate of a facility in the event of a default.
• Structured finance rating and asset securitization rating
Structured finance rating and asset securitization rating are also used to evaluate and classify the quality of individual
credit facilities, including guarantees and collateral, and focus on the structure, including the applicable credit period,
of each credit facility. In evaluating the debt service potential of a credit facility, we scrutinize its underlying structure
to determine the likelihood of the planned future cash flows being achieved.
• Pool assignment
Each major banking subsidiary has its own system for pooling and rating small retail loans designed to reflect the risk
profile of its loan portfolios.
• Asset Evaluation and Assessment System
The asset evaluation and assessment system is used to classify assets held by us according to the probability of collec-
tion and the risk of any impairment in value based on borrower classifications consistent with the borrower ratings
and the status of collateral, guarantees, and other factors.
The system is used to conduct write-offs and allocate allowances against credit risk in a timely and adequate manner.
• Quantitative Analysis of Credit Risk
MUFG and its major banking subsidiaries manage credit risk by monitoring credit amount and expected losses, and
run simulations based on internal models to estimate the maximum amount of credit risk. These models are used for
internal management purposes, including loan pricing and measuring economic capital.
When quantifying credit risk amounts using the internal models, MUFG and its major banking subsidiaries consider
various parameters, including probability of default, or PD, loss given default, or LGD, and exposure at default, or
EAD, used in their borrower ratings, facility risk ratings and pool assignments as well as any credit concentration risk
in particular borrower groups or industry sectors. MUFG and its major banking subsidiaries also share credit portfolio
data in appropriate cases.
• PD (Probability of Default)
The estimated default rate or the probability that the borrower
will default. The definition of default is nonperformance in pay-
ments of interest or principal in the narrow sense; however, in
quantifying credit risk, a wider definition of default is used.
• LGD (Loss Given Default)
The percentage loss at time of default, or in other words, the
estimated percentage of loss on loan when a borrower
defaults due to bankruptcy or other reasons.
• EAD (Exposure at Default)
The amount expressed in relevant currency of exposure to loss
at time of default, or in other words, the estimated amount of
exposure to loss on loan when a borrower defaults due to
bankruptcy or other reasons.
Glossary of terms:
9
Basel III Disclosure Fiscal 2012
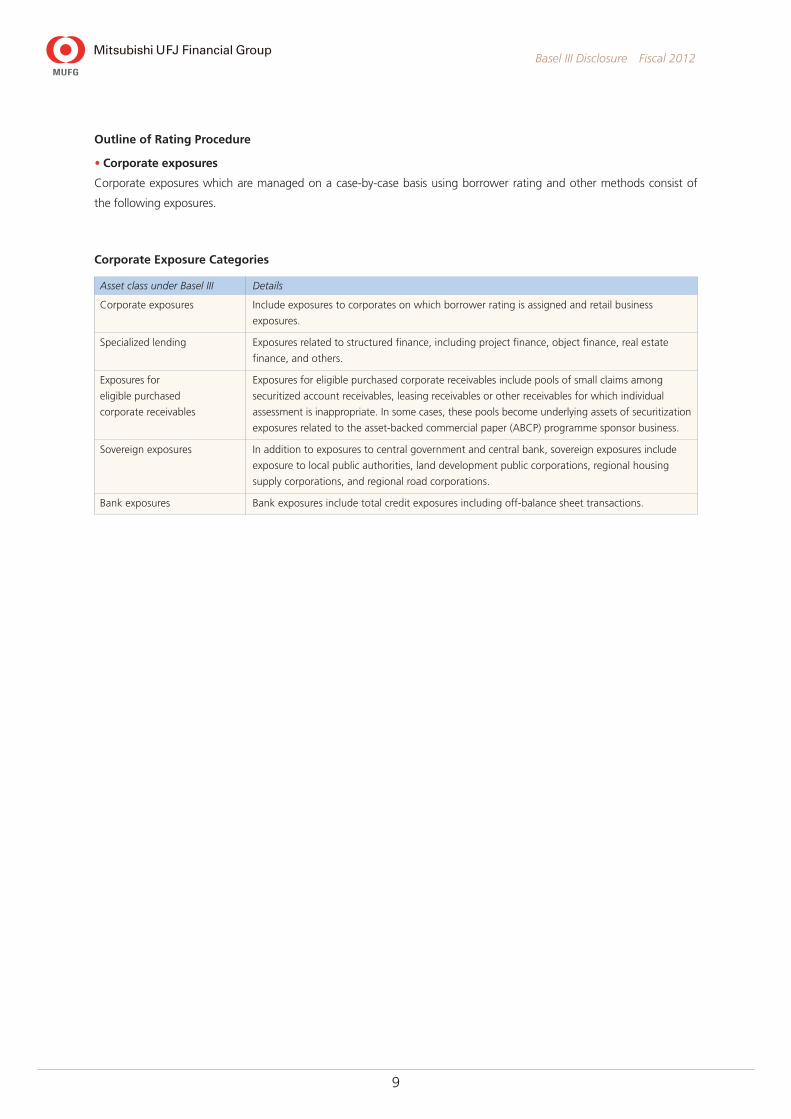
Outline of Rating Procedure
• Corporate exposures
Corporate exposures which are managed on a case-by-case basis using borrower rating and other methods consist of
the following exposures.
Corporate Exposure Categories
Asset class under Basel III Details
Corporate exposures Include exposures to corporates on which borrower rating is assigned and retail business
exposures.
Specialized lending Exposures related to structured finance, including project finance, object finance, real estate
finance, and others.
Exposures for Exposures for eligible purchased corporate receivables include pools of small claims among
eligible purchased securitized account receivables, leasing receivables or other receivables for which individual
corporate receivables assessment is inappropriate. In some cases, these pools become underlying assets of securitization
exposures related to the asset-backed commercial paper (ABCP) programme sponsor business.
Sovereign exposures In addition to exposures to central government and central bank, sovereign exposures include
exposure to local public authorities, land development public corporations, regional housing
supply corporations, and regional road corporations.
Bank exposures Bank exposures include total credit exposures including off-balance sheet transactions.

10
Basel III Disclosure Fiscal 2012
Equity exposures under Includes strategic equity investments. Such investments made before the end of September 2004
PD/LGD approach are excluded from this category because of the grandfathering provisions stipulated in the FSA
Notification on Basel III.
•PD/LGD approach
A method of calculating capital requirements from estimation
of both probability of default and loss given default. Other
methods used to calculate capital requirements include the
Market-Based Approach, which uses stock price volatility.
Glossary of terms:
Borrower rating is assigned to these exposures by taking into consideration quantitative financial analysis, various risk
adjustments, evaluation of business group, and external indexes and information.
In estimating an individual PD of each borrower rating, internal data regarding actual default records for each borrow-
er rating are used. For the purpose of calculating capital requirements, measuring economic capital and loan pricing,
PD is estimated with default defined as borrower rating 12 to 15 and any disposal that generates material economic
loss. For the purpose of other internal risk management, including conducting write-offs and allocating allowances
based on asset evaluation and assessments, PD is estimated with default defined as borrower rating 13 to 15.
When assigning a structured finance rating to specialized lending, similar procedures are followed in adjusting for vari-
ous risks after conducting quantitative financial analysis. In calculating capital requirements, ratings for certain real
estate finance and object finance are mapped to supervisory slotting criteria; PD estimation is not used.
For eligible purchased corporate receivables, PD is estimated using external information and other factors.
Evaluation of the external data with regard to explanation capability to default rates and other factors is conducted
to ensure conservativeness.
For corporate exposures under the PD/LGD approach, facility ratings are assigned based on loan recoverability, taking
into account factors specific to each loan (guarantees/collateral, etc.). LGD, which is estimated for each individual
facility rating, is determined based on internal data concerning the actual loss record of default exposures, taking into
account the recessionary period.
Furthermore, for undrawn commitments under off
balance sheet exposures, EAD is estimated based on
internal data regarding the amount drawn at the time
of default.
Example of Borrower Rating Assignment Process
Quantitative evaluation model for financial data (Primary evaluation)
Adjustment for various risk factors (including the evaluation based on financial substance)
Secondary evaluation
Group company analysis
Third evaluation
Verification by external ratings / information
Determination of borrower rating / borrower grade
Example of Borrower Rating Assignment Process
Equity Exposures under PD/LGD Approach

11
Basel III Disclosure Fiscal 2012
• Retail exposures
Retail exposures being managed based on pool are comprised of the exposures shown in the above table. In the pool
assignment system, the exposures are first divided into pools by product type and then the pools are partitioned after
analyzing delinquency status, transaction risk characteristics and borrower risk characteristics.
In estimating parameters such as PDs, internal data with regard to actual default result of each pool classification are
used (where default is defined as claims more than 3 months in arrears, the borrower category of close observation or
below, or repayment by subrogation).
Quantitative Analysis of Credit Risk
MUFG and its major banking subsidiaries manage credit risk by monitoring credit amount and expected losses, and
run simulations based on internal models to estimate the maximum amount of credit risk. These models are used for
internal management purposes, including loan pricing and measuring economic capital.
When quantifying credit risk amounts using the internal models, MUFG and its major banking subsidiaries consider
various parameters, including probability of default, or PD, loss given default, or LGD, and exposure at default, or
EAD, used in their borrower ratings, facility risk ratings and pool assignments as well as any credit concentration risk
in particular borrower groups or industry sectors. MUFG and its major banking subsidiaries also share credit portfolio
data in appropriate cases.
In calculating regulatory capital requirements under the Basel III framework, as with quantification of credit risk
amounts for internal risk management, MUFG and its major banking subsidiaries basically use PD, LGD and EAD appli-
cable to borrower rating, facility risk rating and pool assignment based on the AIRB Approach. (However, in calculat-
ing capital requirements based on the Standardized Approach as an exemption to the IRB Approach, a risk weight of
100% is used for corporate exposures continuously and uniformly while risk weights for bank and sovereign expo-
sures are determined using external ratings of the rating agency R&I for domestic exposures and those of S&P for
overseas exposures.)
Retail Exposure Categories Categories under Basel III Details
Residential mortgage Include retail housing loans to individuals living in residential real estate to purchase the real
exposures estate
Qualifying revolving Include individual card loans that fulfill certain requirements
retail exposures
Other retail exposures Include non-business related loans to individuals other than residential mortgage and qualifying
revolving retail exposures, and small business exposures being managed in pools instead of by
borrower rating
12
Basel III Disclosure Fiscal 2012
Implementation of Basel standards
Risk quantification
Quantitative monitoring of credit riskPortfolio risk concentration checks
Market-based advanced CPM
Risk-based earnings managementO
bjective credit rating system
Execute business strategies
Asset evaluation and assessment Appropriate write-offs and allowance
Risk-based pricing management
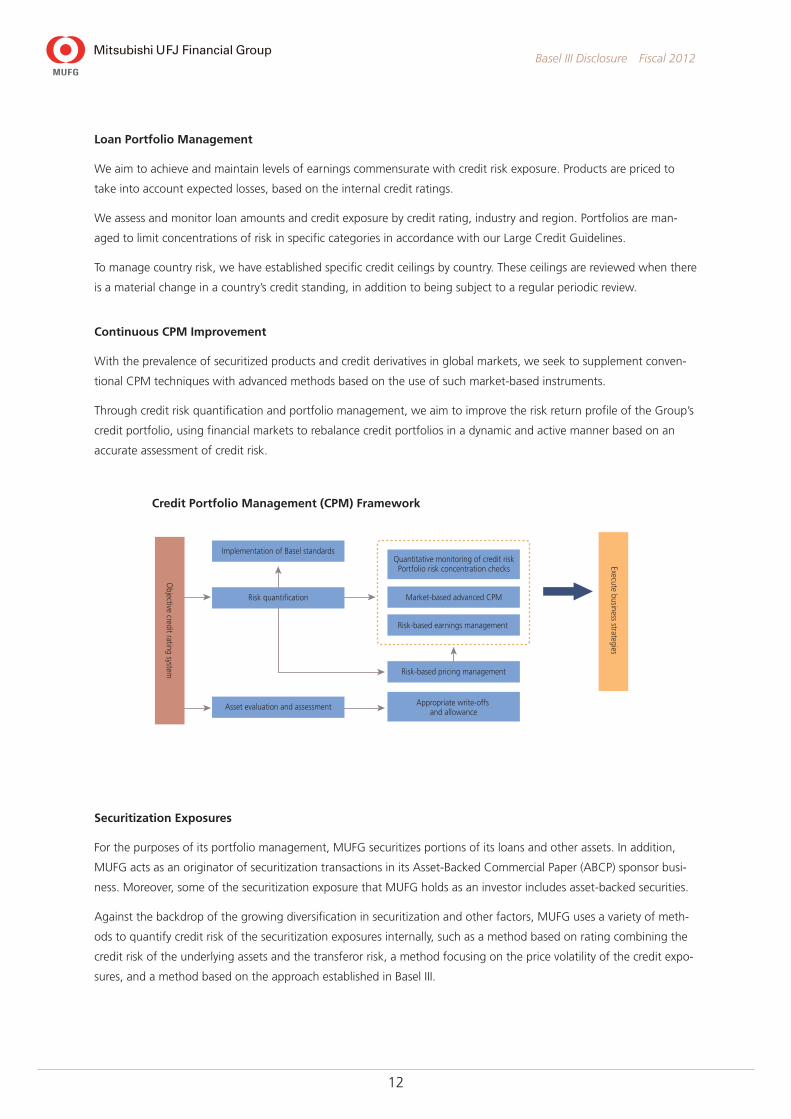
Credit Portfolio Management (CPM) FrameworkCredit Portfolio Management (CPM) Framework
Loan Portfolio Management
We aim to achieve and maintain levels of earnings commensurate with credit risk exposure. Products are priced to
take into account expected losses, based on the internal credit ratings.
We assess and monitor loan amounts and credit exposure by credit rating, industry and region. Portfolios are man-
aged to limit concentrations of risk in specific categories in accordance with our Large Credit Guidelines.
To manage country risk, we have established specific credit ceilings by country. These ceilings are reviewed when there
is a material change in a country’s credit standing, in addition to being subject to a regular periodic review.
Continuous CPM Improvement
With the prevalence of securitized products and credit derivatives in global markets, we seek to supplement conven-
tional CPM techniques with advanced methods based on the use of such market-based instruments.
Through credit risk quantification and portfolio management, we aim to improve the risk return profile of the Group’s
credit portfolio, using financial markets to rebalance credit portfolios in a dynamic and active manner based on an
accurate assessment of credit risk.
Securitization Exposures
For the purposes of its portfolio management, MUFG securitizes portions of its loans and other assets. In addition,
MUFG acts as an originator of securitization transactions in its Asset-Backed Commercial Paper (ABCP) sponsor busi-
ness. Moreover, some of the securitization exposure that MUFG holds as an investor includes asset-backed securities.
Against the backdrop of the growing diversification in securitization and other factors, MUFG uses a variety of meth-
ods to quantify credit risk of the securitization exposures internally, such as a method based on rating combining the
credit risk of the underlying assets and the transferor risk, a method focusing on the price volatility of the credit expo-
sures, and a method based on the approach established in Basel III.

13
Basel III Disclosure Fiscal 2012
In calculating regulatory capital requirements for credit risk, MUFG uses both “the Ratings-Based Approach (RBA)”
and “the Supervisory Formula (SF).” Where the securitization exposures are rated by qualified rating agency, MUFG
uses RBA. Where external ratings are not available, MUFG uses the SF stipulated in the FSA Notification. In calculating
capital requirements under the RBA, MUFG refers to the ratings of S&P, Moody’s, Fitch, R&I, and JCR.
In calculating regulatory capital requirements for market risk, MUFG uses both the “Internal Models Approach,”
where the MUFG Group’s market risk measurement model is adopted for calculations, and the “Standardized
Method,” where calculation methods stipulated in the FSA Notification are adopted.
The risk profiles of securitization exposures vary widely depending on involvement in schemes and the type and structure
of underlying assets. In addition, the risk profile is more complex for re-securitization exposures because the underlying
assets have a multi-level structure. In regard to the management of securitization exposures, MUFG strives for monitoring
of conditions through various methods, including establishing a monitoring system for such risk profiles and perfor-
mance based on management rules, etc., as well as regularly confirming information requiring monitoring.
MUFG holds securitized loans and other assets, as well as securitized products as a sponsor of ABCP programs, which
are acquired from external investors, in principle. Normally, MUFG Group companies do not acquire such products
directly from the originators.
•Securitization of loans and other assets held by MUFG
MUFG securitizes some of its loans and other assets to transfer long-term interest rate risk on residential mortgage
loans, and to transfer credit risk in its corporate loan portfolio.
Because the sections carrying out these types of transactions within MUFG are limited, the credit risk management
sections directly collaborate with these sections to calculate the capital requirements.
As a credit risk control technique, the importance of securitization is growing. However, at this time, credit derivatives
and guarantees account for a greater proportion of credit risk transfer transactions than securitization.
Portion of MUFG credit portfolio
Either the preferred or subordinated tranche sold; the other held
Example of Securitization of Loan Assets
Division into two portions based on certainty of redemption
Preferred tranche Subordinated tranche
Example of Securitization of Loan Assets
14
Basel III Disclosure Fiscal 2012
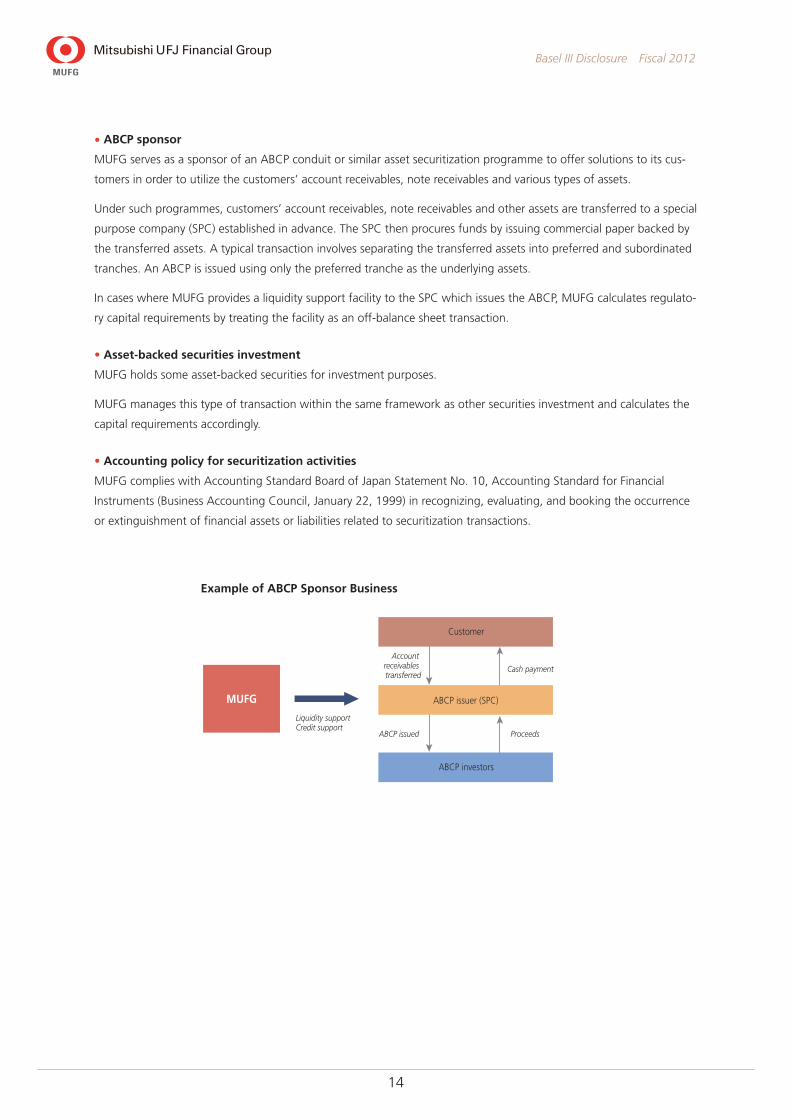
• ABCP sponsor
MUFG serves as a sponsor of an ABCP conduit or similar asset securitization programme to offer solutions to its cus-
tomers in order to utilize the customers’ account receivables, note receivables and various types of assets.
Under such programmes, customers’ account receivables, note receivables and other assets are transferred to a special
purpose company (SPC) established in advance. The SPC then procures funds by issuing commercial paper backed by
the transferred assets. A typical transaction involves separating the transferred assets into preferred and subordinated
tranches. An ABCP is issued using only the preferred tranche as the underlying assets.
In cases where MUFG provides a liquidity support facility to the SPC which issues the ABCP, MUFG calculates regulato-
ry capital requirements by treating the facility as an off-balance sheet transaction.
•Asset-backed securities investment
MUFG holds some asset-backed securities for investment purposes.
MUFG manages this type of transaction within the same framework as other securities investment and calculates the
capital requirements accordingly.
•Accounting policy for securitization activities
MUFG complies with Accounting Standard Board of Japan Statement No. 10, Accounting Standard for Financial
Instruments (Business Accounting Council, January 22, 1999) in recognizing, evaluating, and booking the occurrence
or extinguishment of financial assets or liabilities related to securitization transactions.
Customer
ABCP investors
Example of ABCP Sponsor Business
ABCP issuer (SPC) MUFG
Liquidity support Credit support
ABCP issued Proceeds
Cash payment
Account receivables transferred
Example of ABCP Sponsor Business
15
Basel III Disclosure Fiscal 2012
Derivatives and Long Settlement Transactions, and Credit Risk Mitigation Techniques (Collateral and guarantees)
While loan exposures are the main portion of the credit portfolio to be managed, a counterparty credit risk arising from
derivatives and long settlement transactions (hereafter “derivatives transactions”) is also included in the portfolio. In addition,
when quantifying credit risk internally, MUFG takes into consideration an effect of credit risk mitigation (CRM) provided by
collateral or guarantees.
1. Derivatives
Because counterparty credit risk of derivatives transactions generally can vary over time with the movement of underlying
market factors, MUFG calculates exposures to counterparty credit risk by adding increases in future potential exposure to
the balance of present exposure. Counterparty credit risk is not just recognized when calculating capital requirements, but
significant exposures to counterparty credit risk are also managed in the same manner as loan exposures through allocation
of capital for credit risk and setting limits for the purpose of internal risk management.
In addition, the establishment of collateral-based security and reserves for derivative transactions is, in principle, treated in
the same manner as for loans.
Among generally used derivatives contracts, there are some contracts that provide for the requirement of additional collater-
al in the event that the credit capabilities of MUFG should deteriorate, and therefore, are a potential source of increased
exposures.
2. Credit Risk Mitigation Techniques (Collateral, guarantees, and credit derivatives)
When quantifying credit risk and calculating capital requirements based on the AIRB Approach, MUFG basically takes into
account the CRM effects of collateral, guarantees and credit derivatives using a method based on the amounts recovered in
association with default exposures.
When using the Standardized Approach to calculate capital requirements, MUFG takes into consideration the effect of CRM
techniques. Among these techniques are eligible financial collateral as typified by deposit collateral in our banks, or guaran-
tees and credit derivatives.
The method for taking into account CRM effects based on the IRB Approach is tied to the internal risk management system.
For example, through assessing real estate value accurately, MUFG endeavors to increase the sophistication of its internal
risk management systems and use its advanced internal risk management systems in the calculation of capital requirements.
MUFG has a diversity of guarantors, such as local public authorities, credit guarantee corporations, financial institutions, and
corporates, but its counterparties in credit derivative transactions are primarily financial institutions. When calculating capital
requirements, guarantees and credit derivatives for which CRM effects are taken into account are limited to counterparties
to whom MUFG continuously assigns borrower ratings and monitors creditworthiness.
With loans, MUFG mainly uses guarantees by Credit Guarantee Corporations or real estate collateral as CRM techniques. At
this point of time, the use of CRM techniques has not led to excessive concentration of credit or market risk.
Other credit risk mitigation techniques
When calculating capital requirements for corporate exposures applicable to the AIRB Approach or exposures applicable to
the Standardized Approach, MUFG recognizes the effect of on-balance netting of loans and deposits. For exposures applica-
ble to the AIRB Approach, deposits eligible for the netting process are limited to call money.
For derivatives, such as interest rate swaps and currency options, and repo-style transactions with legally enforceable netting
agreements, the CRM effects are taken into account when calculating capital requirements.
In addition, for collateralized derivatives (transactions based on CSA agreements), the CRM effects are also taken into
account when calculating capital requirements.

16
Basel III Disclosure Fiscal 2012
Market risk is the risk that the value of our assets and liabilities could be adversely affected by changes in market vari-
ables such as interest rates, securities prices, or foreign exchange rates.
Management of market risk at MUFG aims to control related risk exposure across the Group while ensuring that earn-
ings are commensurate with levels of risk.
Market Risk Management System
We have adopted an integrated system to manage market risk from our trading and non-trading activities. The hold-
ing company monitors group-wide market risk, while each of the major subsidiaries manages its market risks on a
consolidated and global basis.
At each of the major subsidiaries, checks and balances are maintained through each system in which back and middle
offices operate independently from front offices. In addition, separate Asset-Liability Management, or ALM, Committee,
ALM Council and Risk Management Meetings are held at each of the major subsidiaries every month to deliberate
important matters related to market risk and control.
The holding company and the major subsidiaries allocate economic capital commensurate with levels of market risk
and determined within the scope of their capital bases. The major subsidiaries have established quantitative limits
relating to market risk based on their allocated economic capital. In addition, in order to keep losses within predeter-
mined limits, the major subsidiaries have also set limits for the maximum amount of losses arising from market activities.
Market Risk Management
Strategic equity investment risk is the risk of loss caused by a decline in the prices of our equity investments.
We hold shares of various corporate clients for strategic purposes, in particular to maintain long-term relationships
with these clients. These investments have the potential to increase business revenue and appreciate in value. At
the same time, we are exposed to the risk of price fluctuation in the Japanese stock market. For that reason, in
recent years, it has been a high priority for us to reduce our equity portfolio to limit the risks associated with hold-
ing a large equity portfolio, but also to respond to applicable regulatory requirements as well as increasing market
expectation and demands for us to reduce our equity portfolio. We are required to comply with a regulatory frame-
work that prohibits Japanese banks from holding an amount of shares in excess of their adjusted Tier 1 capital after
September 2006.
We use quantitative analysis to manage the risks associated with the portfolio of equities held for strategic purposes.
According to internal calculations, the market value of our strategically held (Tokyo Stock Exchange-listed) stocks
(excluding foreign stock exchange-listed stocks) as of March 31, 2013 was subject to a variation of approximately
¥3.77 billion when TOPIX index moves one point in either direction.
We seek to manage and reduce strategic equity portfolio risk based on such types of simulation. The aim is to keep
this risk at appropriate levels compared with Tier 1 capital while generating returns commensurate with the degree of
risk exposure.
Risk Management of Strategic Equity Portfolio
17
Basel III Disclosure Fiscal 2012
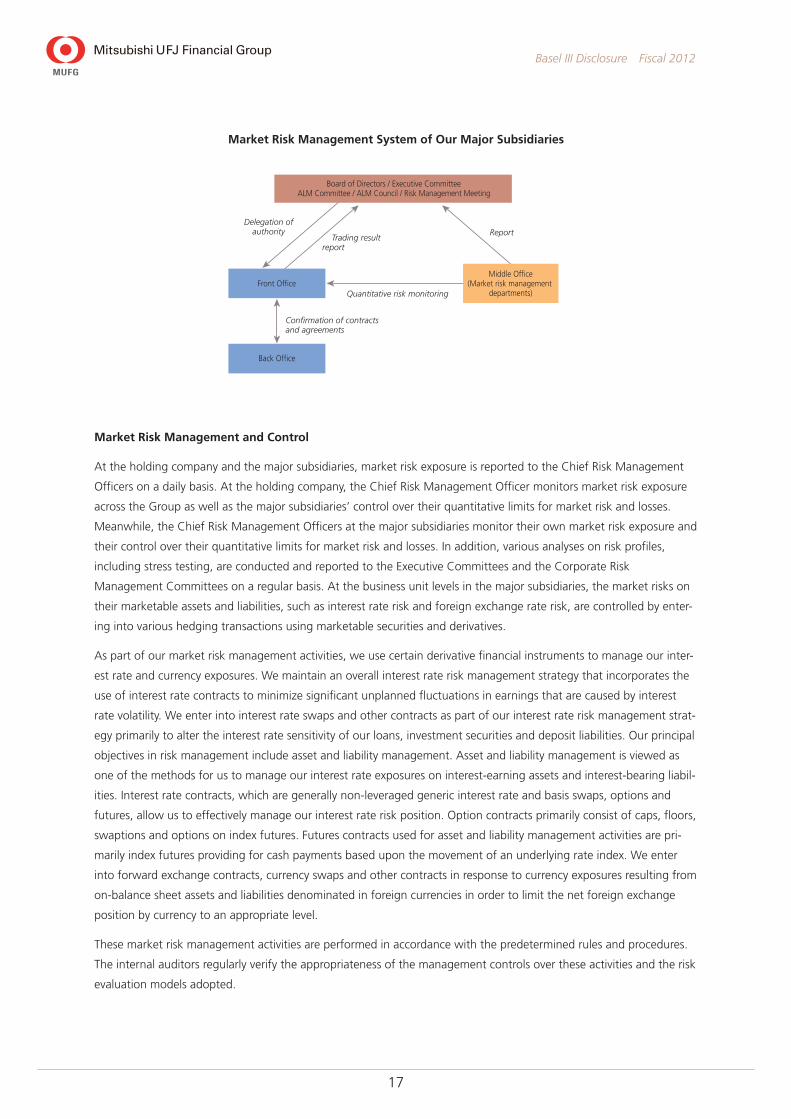
Market Risk Management and Control
At the holding company and the major subsidiaries, market risk exposure is reported to the Chief Risk Management
Officers on a daily basis. At the holding company, the Chief Risk Management Officer monitors market risk exposure
across the Group as well as the major subsidiaries’ control over their quantitative limits for market risk and losses.
Meanwhile, the Chief Risk Management Officers at the major subsidiaries monitor their own market risk exposure and
their control over their quantitative limits for market risk and losses. In addition, various analyses on risk profiles,
including stress testing, are conducted and reported to the Executive Committees and the Corporate Risk
Management Committees on a regular basis. At the business unit levels in the major subsidiaries, the market risks on
their marketable assets and liabilities, such as interest rate risk and foreign exchange rate risk, are controlled by enter-
ing into various hedging transactions using marketable securities and derivatives.
As part of our market risk management activities, we use certain derivative financial instruments to manage our inter-
est rate and currency exposures. We maintain an overall interest rate risk management strategy that incorporates the
use of interest rate contracts to minimize significant unplanned fluctuations in earnings that are caused by interest
rate volatility. We enter into interest rate swaps and other contracts as part of our interest rate risk management strat-
egy primarily to alter the interest rate sensitivity of our loans, investment securities and deposit liabilities. Our principal
objectives in risk management include asset and liability management. Asset and liability management is viewed as
one of the methods for us to manage our interest rate exposures on interest-earning assets and interest-bearing liabil-
ities. Interest rate contracts, which are generally non-leveraged generic interest rate and basis swaps, options and
futures, allow us to effectively manage our interest rate risk position. Option contracts primarily consist of caps, floors,
swaptions and options on index futures. Futures contracts used for asset and liability management activities are pri-
marily index futures providing for cash payments based upon the movement of an underlying rate index. We enter
into forward exchange contracts, currency swaps and other contracts in response to currency exposures resulting from
on-balance sheet assets and liabilities denominated in foreign currencies in order to limit the net foreign exchange
position by currency to an appropriate level.
These market risk management activities are performed in accordance with the predetermined rules and procedures.
The internal auditors regularly verify the appropriateness of the management controls over these activities and the risk
evaluation models adopted.
Board of Directors / Executive Committee ALM Committee / ALM Council / Risk Management Meeting
Middle Office (Market risk management
departments) Front Office
Back Office
Confirmation of contracts and agreements
Quantitative risk monitoring
Report Trading result report
Delegation of authority
Management System of Our Major SubsidiariesMarket Risk Management System of Our Major Subsidiaries
18
Basel III Disclosure Fiscal 2012
Market Risk Measurement Model
Market risks consist of general risks and specific risks. General market risks result from changes in entire markets,
while specific risks relate to changes in the prices of individual stocks and bonds which are independent of the overall
direction of the market.
To measure market risks, MUFG uses the VaR method which estimates changes in the market value of portfolios with-
in a certain period by statistically analyzing past market data. Since the daily variation in market risk is significantly
greater than that in other types of risk, MUFG measures and manages market risk using VaR on a daily basis.
Market risk for trading and non-trading activities is measured using a uniform market risk measurement model. The
principal model used for these activities is historical simulation, or HS, model (holding period, 10 business days; confi-
dence interval, 99%; and observation period, 701 business days). The HS model calculates VaR amounts by estimat-
ing the profit and loss on the current portfolio by applying actual fluctuations in market rates and prices over a fixed
period in the past. This method is designed to capture certain statistically infrequent movements, such as a fat tail,
and accounts for the characteristics of financial instruments with non-linear behavior. The holding company and
banking subsidiaries also use the HS model to calculate as part of the calculation of their Basel III regulatory capital
adequacy ratios.
In calculating VaR using the HS method, we have implemented an integrated market risk measurement system
throughout the Group. Our major subsidiaries calculate their VaR based on the risk and market data prepared by the
information systems of their front offices and other departments. The major subsidiaries provide this risk data to the
holding company, which calculates overall VaR, taking into account the diversification effect among all portfolios of
the major subsidiaries.
For the purpose of internally evaluating capital adequacy on an economic capital basis in terms of market risk, we use
this market risk measurement model to calculate risk amounts based on a holding period of one year and a confi-
dence interval of 99%.
Monitoring and managing our sensitivity to interest rate fluctuations is the key to managing market risk in MUFG’s
non-trading activities. The major banking subsidiaries take the following approach to measuring risks concerning core
deposits, loan prepayments and early deposit withdrawals.
To measure interest rate risk relating to deposits without contract-based fixed maturities, the amount of “core depos-
its” is calculated through a statistical analysis based on deposit balance trend data and the outlook for interest rates
on deposits, business decisions, and other factors. The amount of “core deposit” is categorized into various groups of
maturity terms of up to five years (2.5 years on average) to recognize interest rate risk. The calculation assumptions
and methods to determine the amount of core deposits and maturity term categorization are regularly reviewed.
Meanwhile, deposits and loans with contract-based maturities are sometimes cancelled or repaid before their maturity
dates. To measure interest rate risk for these deposits and loans, we reflect these early termination events mainly by
applying early termination rates calculated based on a statistical analysis of historical repayment and cancellation data
together with historical market interest rate data.
19
Basel III Disclosure Fiscal 2012
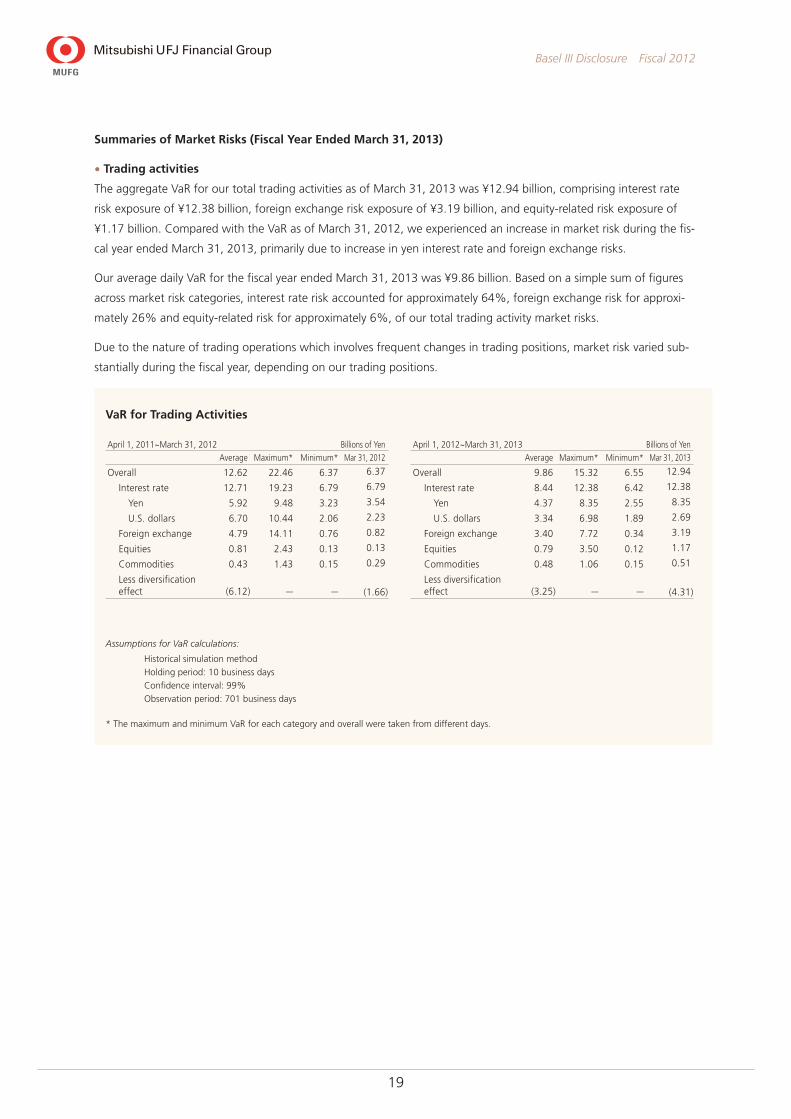
Summaries of Market Risks (Fiscal Year Ended March 31, 2013)
• Trading activities
The aggregate VaR for our total trading activities as of March 31, 2013 was ¥12.94 billion, comprising interest rate
risk exposure of ¥12.38 billion, foreign exchange risk exposure of ¥3.19 billion, and equity-related risk exposure of
¥1.17 billion. Compared with the VaR as of March 31, 2012, we experienced an increase in market risk during the fis-
cal year ended March 31, 2013, primarily due to increase in yen interest rate and foreign exchange risks.
Our average daily VaR for the fiscal year ended March 31, 2013 was ¥9.86 billion. Based on a simple sum of figures
across market risk categories, interest rate risk accounted for approximately 64%, foreign exchange risk for approxi-
mately 26% and equity-related risk for approximately 6%, of our total trading activity market risks.
Due to the nature of trading operations which involves frequent changes in trading positions, market risk varied sub-
stantially during the fiscal year, depending on our trading positions.
Assumptions for VaR calculations:
Historical simulation method
Holding period: 10 business days
Confidence interval: 99%
Observation period: 701 business days
* The maximum and minimum VaR for each category and overall were taken from different days.
VaR for Trading Activities
April 1, 2012~March 31, 2013 Billions of Yen Average Maximum* Minimum* Mar 31, 2013
Overall 9.86 15.32 6.55 12.94
Interest rate 8.44 12.38 6.42 12.38
Yen 4.37 8.35 2.55 8.35
U.S. dollars 3.34 6.98 1.89 2.69
Foreign exchange 3.40 7.72 0.34 3.19
Equities 0.79 3.50 0.12 1.17
Commodities 0.48 1.06 0.15 0.51
Less diversification effect (3.25) — — (4.31)
April 1, 2011~March 31, 2012 Billions of Yen Average Maximum* Minimum* Mar 31, 2012
Overall 12.62 22.46 6.37 6.37
Interest rate 12.71 19.23 6.79 6.79
Yen 5.92 9.48 3.23 3.54
U.S. dollars 6.70 10.44 2.06 2.23
Foreign exchange 4.79 14.11 0.76 0.82
Equities 0.81 2.43 0.13 0.13
Commodities 0.43 1.43 0.15 0.29
Less diversification effect (6.12) — — (1.66)

20
Basel III Disclosure Fiscal 2012
• Non-trading Activities
The aggregate VaR for our total non-trading activities as of March 31, 2013, excluding market risks related to our
strategic equity portfolio and measured using the same standards as trading activities, was ¥413.0 billion. Market risks
related to interest rates equaled ¥422.3 billion and equities-related risks equaled ¥108.5 billion. Compared with the
VaR for MUFG at March 31, 2012, the decrease in the overall market risk was ¥58.3 billion. Market risks related to
interest rates decreased ¥31.0 billion. Equity related risks increased ¥29.3 billion.
Based on a simple sum of figures across market risk categories, interest rate risks accounted for approximately 80% of
our total non-trading activity market risks. Looking at a breakdown of interest rate related risk by currency, at March
31, 2013, the yen accounted for approximately 44% while the U.S. dollar accounted for approximately 40%, and the
Euro approximately 16%.
The following tables set forth the VaR related to our non-trading activities by risk category for the periods indicated:
Assumptions for VaR calculations:
Historical simulation method
Holding period: 10 business days
Confidence interval: 99%
Observation period: 701 business days
* The maximum and minimum VaR for each category and in total were taken from different days.
The equities-related risk figures do not include market risk exposure from our strategic equity portfolio.
VaR for Non-trading Activities
April 1, 2011~March 31, 2012 Billions of Yen
Average Maximum* Minimum* Mar 31, 2012
Interest rate 472.5 546.3 386.3 453.3
Yen 209.2 262.4 159.4 191.2
U.S. dollars 323.4 376.3 268.0 311.5
Euro 42.3 61.6 25.2 54.5
Equities 126.7 177.5 78.8 79.2
Foreign exchange 0.2 1.3 0.0 0.1
Total 505.5 572.2 415.7 471.3
April 1, 2012~March 31, 2013 Billions of Yen
Average Maximum* Minimum* Mar 31, 2013
Interest rate 443.1 500.0 402.3 422.3
Yen 216.4 247.7 184.3 227.9
U.S. dollars 268.5 300.2 203.4 206.6
Euro 55.7 98.7 9.0 85.2
Equities 74.8 110.4 57.9 108.5
Foreign exchange 0.4 1.7 0.0 0.3
Total 446.3 499.8 413.0 413.0
21
Basel III Disclosure Fiscal 2012
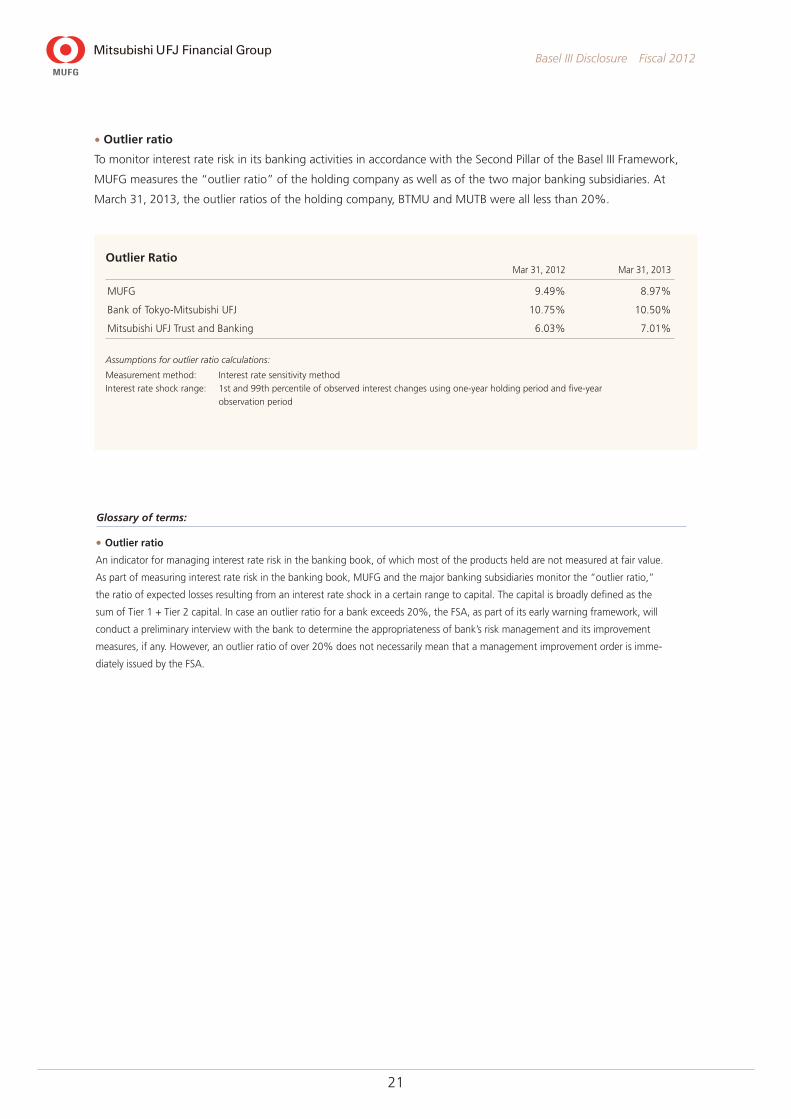
• Outlier ratio
To monitor interest rate risk in its banking activities in accordance with the Second Pillar of the Basel III Framework,
MUFG measures the “outlier ratio” of the holding company as well as of the two major banking subsidiaries. At
March 31, 2013, the outlier ratios of the holding company, BTMU and MUTB were all less than 20%.
• Outlier ratio
An indicator for managing interest rate risk in the banking book, of which most of the products held are not measured at fair value.
As part of measuring interest rate risk in the banking book, MUFG and the major banking subsidiaries monitor the “outlier ratio,”
the ratio of expected losses resulting from an interest rate shock in a certain range to capital. The capital is broadly defined as the
sum of Tier 1 + Tier 2 capital. In case an outlier ratio for a bank exceeds 20%, the FSA, as part of its early warning framework, will
conduct a preliminary interview with the bank to determine the appropriateness of bank’s risk management and its improvement
measures, if any. However, an outlier ratio of over 20% does not necessarily mean that a management improvement order is imme-
diately issued by the FSA.
Glossary of terms:
Assumptions for outlier ratio calculations:
Measurement method: Interest rate sensitivity method
Interest rate shock range: 1st and 99th percentile of observed interest changes using one-year holding period and five-year
observation period
Mar 31, 2012 Mar 31, 2013
MUFG 9.49% 8.97%
Bank of Tokyo-Mitsubishi UFJ 10.75% 10.50%
Mitsubishi UFJ Trust and Banking 6.03% 7.01%
Outlier Ratio

22
Basel III Disclosure Fiscal 2012
Backtesting
We conduct backtesting in which a VaR is compared with actual realized and unrealized losses on a daily basis to veri-
fy the accuracy of our VaR measurement model. We also conduct additional backtesting using other methods, includ-
ing testing VaR against hypothetical losses and testing VaR by various changing parameters such as confidence
intervals and observation periods used in the model.
Actual losses exceeded VaR one time in the fiscal year ended March 31, 2013 (one time in the fiscal year ended
March 31, 2012). This means that our VaR model provided reasonably accurate measurements of market risk during
the fiscal year.
0
–3
–6
–9
–12
6
3
12
9
Daily profit/loss
VaR shown on a negative scale
Mar. 2012Apr. 2011
VaR
Dai
ly p
rofit
/loss
0
–6
–1212106 842
0
6
–9
3
–3
12
9
Case of losses exceeding VaR: 1
Market Risk Backtesting(April 1, 2011–March 31, 2012)
VaR and Daily Profit/Loss for Trading Activities(April 1, 2011–March 31, 2012)
Billions of Yen
Billions of Yen
VaR
Dai
ly p
rofit
/loss
0
–6
–1212106 842
0
6
–9
3
–3
12
9
Case of losses exceeding VaR: 1
0
–3
–6
–9
–12
6
3
12
9
Daily profit/loss
VaR shown on a negative scale
Mar. 2013Apr. 2012
Market Risk Backtesting(April 1, 2012–March 31, 2013)
VaR and Daily Profit/Loss for Trading Activities(April 1, 2012–March 31, 2013)
Billions of Yen
Billions of Yen

23
Basel III Disclosure Fiscal 2012
Liquidity risk is the risk of incurring losses if a poor financial position hampers the ability to meet funding requirements,
or necessitates fund procurement at interest rates markedly higher than normal.
Our major subsidiaries maintain appropriate liquidity in both Japanese yen and foreign currencies by managing their
funding sources and mechanism, such as liquidity gap, liquidity-supplying products such as commitment lines, and
buffer assets.
We have established a group-wide system for managing liquidity risk by categorizing the risk in the following three
stages: Normal, With-Concern, and Critical. The front offices and risk management offices of the major subsidiaries and
the holding company exchange information and data on liquidity risk even at the Normal stage. At higher alert stages,
we centralize information about liquidity risk and discuss issues relating to group-wide liquidity control actions among
group companies, if necessary. We have also established a system for liaison and consultation on funding in preparation
for contingency, such as natural disasters, wars and terrorist attacks. The holding company and the major subsidiaries
conduct group-wide contingency preparedness drills on a regular basis to ensure smooth implementation in the event
of an emergency.
Liquidity Risk Management
Stress Testing
We have adopted an HS-VaR model, which calculates a VaR as a statistically possible amount of losses in a fixed confi-
dence interval based on historical market volatility. However, the HS-VaR model is not designed to capture certain
abnormal market fluctuations. In order to complement this weakness of the model, MUFG conducts portfolio stress
testing to measure potential losses using a variety of scenarios.
The holding company and the major subsidiaries conduct stress testing on a daily, monthly and quarterly basis to
monitor their overall portfolio risk by applying various scenarios. For example, daily stress testing at the holding com-
pany estimates maximum potential losses in each market on the current trading portfolio based on the worst ten-day
historical volatility recorded during the VaR observation period of 701 days.
In light of increased market volatility since the second half of the calendar year 2007, we have implemented additional
tests under various stress scenarios to supplement VaR and are applying the test results to risk management.

Board of Directors / Executive Committee Committees regarding risk management
Division in charge of Operational Risk Management
Divisions in charge of Sub-category Risk Management
Head Office and
Branches Reporting
Instruction
Coordination
Instruction
Reporting on risk profile
Management System of Our Major Banking Subsidiaries
24
Basel III Disclosure Fiscal 2012
Operational risk refers to the risk of loss caused by either internal control issues, such as inadequate operational pro-
cesses or misconduct, system failures, or external factors such as serious political instability, major terrorist activity,
health epidemics and natural disasters. The term includes a broad range of risks that could lead to losses, including
operations risk, information asset risk, reputation risk, legal risk, and tangible asset risk. These risks that comprise
operational risk are referred to as sub-category risks.
MUFG’s board of directors has approved the MUFG Operational Risk Management Policy as a group-wide policy for
managing operational risk. This policy sets forth the core principles regarding operational risk management, including
the definition of operational risk, and the risk management system and processes. The policy also requires the board
of directors and the Executive Committee to formulate fundamental principles of operational risk management and
establish and maintain an appropriate risk management system. The Chief Risk Management Officer is responsible for
recognizing, evaluating, and appropriately managing operational risk in accordance with the fundamental principles
formulated by the board of directors and the Executive Committee. A division in charge of operational risk manage-
ment must be established that is independent of business promotion sections to manage overall operational risk in a
comprehensive manner. These fundamental principles have also been approved by the boards of directors of the
major subsidiaries, providing a consistent framework for operational risk management of the Group.
Operational Risk Management
Operational Risk Management System of Our Major Banking Subsidiaries
25
Basel III Disclosure Fiscal 2012
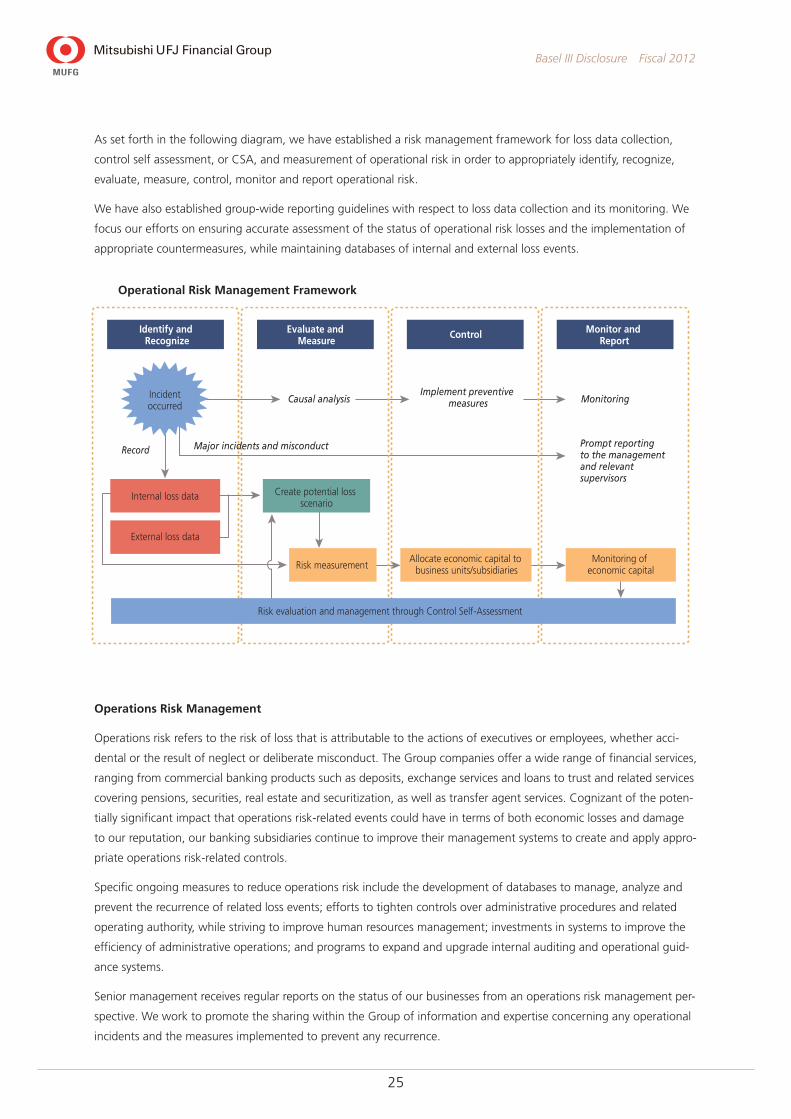
As set forth in the following diagram, we have established a risk management framework for loss data collection,
control self assessment, or CSA, and measurement of operational risk in order to appropriately identify, recognize,
evaluate, measure, control, monitor and report operational risk.
We have also established group-wide reporting guidelines with respect to loss data collection and its monitoring. We
focus our efforts on ensuring accurate assessment of the status of operational risk losses and the implementation of
appropriate countermeasures, while maintaining databases of internal and external loss events.
Operations Risk Management
Operations risk refers to the risk of loss that is attributable to the actions of executives or employees, whether acci-
dental or the result of neglect or deliberate misconduct. The Group companies offer a wide range of financial services,
ranging from commercial banking products such as deposits, exchange services and loans to trust and related services
covering pensions, securities, real estate and securitization, as well as transfer agent services. Cognizant of the poten-
tially significant impact that operations risk-related events could have in terms of both economic losses and damage
to our reputation, our banking subsidiaries continue to improve their management systems to create and apply appro-
priate operations risk-related controls.
Specific ongoing measures to reduce operations risk include the development of databases to manage, analyze and
prevent the recurrence of related loss events; efforts to tighten controls over administrative procedures and related
operating authority, while striving to improve human resources management; investments in systems to improve the
efficiency of administrative operations; and programs to expand and upgrade internal auditing and operational guid-
ance systems.
Senior management receives regular reports on the status of our businesses from an operations risk management per-
spective. We work to promote the sharing within the Group of information and expertise concerning any operational
incidents and the measures implemented to prevent any recurrence.
Incidentoccurred
Risk evaluation and management through Control Self-Assessment
Causal analysis
Major incidents and misconduct
Implement preventive measures Monitoring
Record Prompt reporting to the management and relevant supervisors
Identify and Recognize
Evaluate and Measure
Control Monitor and Report
Internal loss data
External loss data
Create potential loss scenario
Risk measurementMonitoring of
economic capitalAllocate economic capital to
business units/subsidiaries
Risk Management Framework
Incidentoccurred
Risk evaluation and management through control self-assessment
Causal analysis
Major incidents and misconduct
Implement preventive measures Monitoring
Record Prompt reporting to the management and relevant supervisors
Identify and Recognize
Evaluate and Measure
Control Monitor and Report
Internal loss data
External loss data
Create potential loss scenario
Risk measurementMonitoring of
economic capitalAllocate economic capital to
business units/subsidiaries
Risk Management FrameworkOperational Risk Management Framework
26
Basel III Disclosure Fiscal 2012
Efforts to upgrade the management of operations risk continue with the aim of providing our customers with a vari-
ety of high-quality services.
Information Asset Risk Management
Information asset risk refers to the risk of loss caused by loss, alteration, falsification or leakage of information, or by
destruction, disruption, errors or misuse of information systems, as well as risks similar to this risk. In order to ensure
proper handling of information and prevent loss or leakage of information, our major banking subsidiaries strive to
better manage and reduce such risks through the appointment of managers with specific responsibilities for informa-
tion security issues, the establishment of internal procedures, training courses designed for all staff, and the imple-
mentation of measures to ensure stable IT systems control. We have also formulated the Personal Information
Protection Policy as the basis for ongoing programs to protect the confidentiality of personal information.
Systems planning, development and operations include appropriate design and extensive testing phases to ensure
that systems are designed to help prevent failures while providing sufficient safeguards for the security of personal
information. The status of the development of any mission-critical IT systems is reported regularly to senior manage-
ment. We have developed disaster countermeasures systems and have also been investing in duplication of the
Group’s IT infrastructure to minimize damage in the event of any system failure. Emergency drills are conducted to
help increase staff preparedness.
With the aim of preventing any recurrence, we also work to promote sharing of information within the Group related
to the causes of any loss or leakage of information, or system failure.
Reputation Risk Management
Reputation risk refers to the risk of loss due to deterioration in reputation as a consequence of the spread of rumors
among customers or in the market, or as a consequence of our inadequate response to particular situations, as well as
risks similar to this risk.
We recognize the potentially significant impact reputation risk-related events can have on the management and execu-
tion of the Group’s businesses, which in turn can result in economic losses to, or diminished market confidence in, the
Group. Accordingly, we continue to improve our risk control framework designed to appropriately manage such risk.
Specifically, in order to manage our reputation risk effectively on a group-wide basis, we have established a risk man-
agement system designed to ensure mutual consultation and reporting if a reputation risk-related event occurs or is
anticipated and, through this system, share relevant information within the Group.
Through the risk control framework and risk management system, we seek to minimize damage to the reputation and
credibility of, and the market confidence in, the Group by promptly obtaining an accurate understanding of relevant
facts relating to reputation risk-related events and disclosing information concerning the events and the measures we
take in response to such events in an appropriate and timely manner.
Risk Management for Other Risks
In addition to the risks discussed above, the MUFG Group companies define and manage sub-category risks as appro-
priate, including tangible asset risk, personnel risk and legal risk as set forth in the “Operational Risk Management
System of Our Major Banking Subsidiaries” diagram on P24.

27
Basel III Disclosure Fiscal 2012
Regulatory Capital Requirements for Operational Risk
(1) Adoption of the Advanced Measurement Approach (AMA)
We have employed the AMA since March 31, 2012, in place of the Standardized Approach that we had been using previ-
ously, for calculation of the operational risk equivalent amount in connection with measuring capital adequacy ratios
based on the Basel Standards. On the other hand, we use the Basic Indicator Approach, or BIA, for entities that are
deemed to be less important in the calculation of the operational risk equivalent amount and for entities that are still pre-
paring to implement the AMA.
(2) Outline of AMA
We have established a measurement model designed to account for four data elements—internal loss data, external loss
data, scenario analysis, and business environment and internal control factors, or BEICFs—and calculate the operational
risk equivalent amount by estimating the maximum loss using a 99.9th percentile one-tailed confidence interval and a
one-year holding period.
In calculating the operational risk equivalent amount, we exclude expected losses relating to the amount of allowance for
repayment of excess interest associated with the consumer finance business of a subsidiary. We do not exclude any other
expected losses and do not reflect the risk mitigating impact of insurance. In addition, we take into account credit risk-
related events that are not reflected in the measurement of the credit risk equivalent amount.
(3) Outline of Measurement Model
Our operational risk equivalent amount measured under the AMA is a simple sum of the amounts calculated separately
for BTMU on a consolidated basis, MUTB on a consolidated basis, and the total amount for other Group companies
(including the holding company, MUSHD and Mitsubishi UFJ NICOS). For each of BTMU and MUTB on consolidated basis,
the operational risk equivalent amount is a simple sum of the amounts calculated based on the seven loss event types
defined by the Basel Standards. For other Group companies, the operational risk equivalent amount is a simple sum of the
amounts calculated based on eight loss event types consisting of the seven loss event types defined by the Basel
Standards and an additional loss event type representing losses relating to repayment of excess interest associated with
the consumer finance business of a subsidiary. We do not reflect the correlation effects among the loss event types in the
calculation of our operational risk equivalent amount.
Outline of Measurement Model
External Loss DataBusiness Environment
andInternal Control Factors
Monte C
arlo Simulation
Litigation DataInternal Loss Data
Internal Loss Data
Basel Loss Event Types
Internal FraudRisk Equivalent Amount
OccurrenceFrequency
Loss Amount
Scenario DataFrequency
Distribution
LossDistribution
Risk EquivalentAmount
Loss SeverityDistribution
OccurrenceFrequency
Loss Amount
Scenario Analysis
External FraudRisk Equivalent Amount
Employment Practicesand Workplace SafetyRisk Equivalent Amount
Clients, Products,and Business PracticesRisk Equivalent Amount
Damage to Physical AssetsRisk Equivalent Amount
Business Disruptionand System FailuresRisk Equivalent Amount
Execution, Delivery, andProcess ManagementRisk Equivalent Amount
Repayment of Excess InterestRisk Equivalent Amount
28
Basel III Disclosure Fiscal 2012
The risk equivalent amount for each loss event type represents the amount of maximum loss estimated with a 99.9th per-
centile one-tailed confidence interval and a one-year holding period based on the distribution of losses arising from all rel-
evant risk events for a one-year period (Loss Distribution). A Loss Distribution combines a Frequency Distribution (through
which the frequency of occurrence of risk events is expressed) and a Loss Severity Distribution (through which the
amounts of losses resulting from risk events are expressed) through Monte Carlo simulations. The data used for this pur-
pose include internal loss data and scenario data. Scenario data are generated through a scenario analysis. External data
and BEICFs are taken into account in the scenario analysis and reflected in scenario data. The Frequency Distribution is
derived from the occurrence frequency information in internal loss data and scenario data expressed through a Poisson
Distribution. The Loss Severity Distribution is derived from the amount information in internal loss data and scenario data
expressed in a non-parametric manner (where no underlying distribution is assumed).
With respect to the risk of losses relating to repayment of excess interest associated with the consumer finance business
of a subsidiary, the risk equivalent amount represents the amount of maximum loss estimated with a 99.9th percentile
one-tailed confidence interval and a one-year holding period based on a normal distribution assumed by applying data on
losses that arose in a given period, excluding any related expected losses.
We confirm the appropriateness of the measurement models by periodic verification and back testing.
(4) Outline of Scenario Analysis
As an initial step of our scenario analysis, we identify potential severe loss events that we have not experienced but may
potentially experience in the future. In this identification process, we seek to ensure exhaustive coverage of potential
severe loss events by comprehensively examining our experience relating to loss events and legal proceedings, external
loss data, the control self-assessment results and other relevant information.
In the next step, we prepare scenario data for each identified severe loss event by quantifying the values depending on its
occurrence frequency and loss severity, taking into account relevant transaction amounts and restructuring costs as well as
BEICFs. In preparing scenario data, we apply an analysis method we deem appropriate for the type and nature of the
operational risk involved.
In order to obtain an operational risk equivalent amount that is commensurate with, and appropriate for, our risk profile,
we assess the need for an additional scenario or modification to our existing scenarios semi-annually. We then reflect, as
necessary, new risks arising as a result of changes in the business environment and the results of the implementation of
measures to enhance our internal controls in response to newly identified risks in our scenario data.
29
Contents
Scope of Consolidation 30
Composition of Equity Capital 32
Capital Adequacy 43
Credit Risk 45
Credit Risk Mitigation 58
Derivative Transactions and Long Settlement Transactions 59
Securitization Exposures
(Subject to calculation of credit risk assets) 60
Securitization Exposures
(Subject to calculation of market risk equivalent amount) 69
Market Risk 71
Equity Exposures in Banking Book 73
Exposures Relating to Funds 74
Interest Rate Risk in the Banking Book (IRRBB) 75
Basel III Data (Consolidated) Fiscal 2012

30
Basel III Disclosure Fiscal 2012
In accordance with the provisions of Article 52-25 of the Banking Law of Japan, Mitsubishi UFJ Financial Group (MUFG) adopts the
“International regulatory framework” to calculate its capital adequacy ratio based on formulas contained in the standards for the
consolidated capital adequacy ratio of bank holding companies (Notification of the Financial Services Agency No. 20, 2006; referred
to hereinafter as the “FSA Holding Company Capital Adequacy Notification”) to assess capital adequacy in light of the assets we
own on a consolidated basis.
With regard to the calculation of the consolidated capital adequacy ratio, MUFG received an independent audit by Deloitte Touche
Tohmatsu (DTT) LLC in accordance with “Treatment of Inspection of the Capital Ratio Calculation Framework Based on Agreed-
Upon Procedures” (JICPA Industry Committee Report No. 30). With regard to part of the internal controls structure governing calcu-
lation of the consolidated capital adequacy ratio, MUFG received a report from DTT LLC, which conducted certain procedures as
deemed necessary by MUFG. The procedures conducted by the independent auditor were not part of an accounting audit of the
consolidated financial statements, and we did not receive any audit opinion with regard to our internal controls structure governing
the calculation of the consolidated capital adequacy ratio or the related consolidated capital adequacy ratio.
Scope of Consolidation
Notes on the scope of consolidation
Differences between those companies
belonging to the corporate group (here-
inafter, the “holding company group”) to
which the calculation of consolidated
capital adequacy ratio as stipulated in
Articles 3 or 15 of the FSA Holding
Company Capital Adequacy Notification
is applicable and those companies that
are included in the scope of consolidation
for accounting purposes
Paragraph 1 of Article 3 of the FSA Holding Company Capital Adequacy Notification
states that “the provisions of Paragraph 2 of Article 5 of the Japanese regulations
pertaining to consolidated financial statements shall not apply” to “financial subsid-
iaries” of a bank holding company. Moreover, Paragraph 2 of the said Article 3 states
that “insurance-related subsidiaries” of a bank holding company “shall not be includ-
ed in the scope of consolidation.”
In addition, with regard to affiliated companies engaged in financial operations, the
FSA Consolidated Capital Adequacy Notification states that, provided certain condi-
tions are met, such companies “can be included in the scope of consolidation and in
the calculation of the consolidated capital adequacy ratio using pro rata consolida-
tion” (under which only those portions of the affiliated company’s assets, liabilities,
income and expenditures that are attributable to the bank holding company or any
consolidated subsidiaries with investments in the said affiliated company are included
in the scope of consolidation).
MUFG Group had no companies to which the above exception applied as of March
31, 2012, or March 31, 2013, and there were no differences between those compa-
nies belonging to the “holding company group” and those companies that are
included in the “scope of consolidation for accounting purposes.”
Number of consolidated subsidiaries, and
names and principal businesses of major
consolidated subsidiaries of the holding
company group
224 companies as of March 31, 2012; 220 companies as of March 31, 2013
The Bank of Tokyo-Mitsubishi UFJ, Ltd. (banking business), Mitsubishi UFJ Trust and
Banking Corporation (trust/banking business), Mitsubishi UFJ Securities Holdings Co.,
Ltd. (securities business), etc.
Number of affiliated companies engaged
in financial operations which are subject to
Articles 9 or 21 of the FSA Holding
Company Capital Adequacy Notification,
and names, amounts of total assets and
net assets shown on the balance sheet and
principal businesses of affiliated companies
engaged in these financial operations
Not applicable as of March 31, 2012 and 2013
Names, amounts of total assets and net
assets shown on the balance sheet, and
principal businesses of companies belong-
ing to the holding company group that
are not included in the scope of consolida-
tion for accounting purposes, and of com-
panies not belonging to the holding
company group but included in the scope
of consolidation for accounting purposes
Not applicable as of March 31, 2012 and 2013

31
Basel III Disclosure Fiscal 2012
Outline of restrictions on transfer of
funds or equity capital within the holding
company group
As of March 31, 2012 and 2013, transfer of funds or capital within the MUFG Group
is conducted with all due consideration given to the appropriateness of each action.
We give priority in ensuring that each group company maintains sufficient capital
level for legal and regulatory compliance purposes. Care is also taken to ensure that
actions do not compromise sound and proper operations, while eliminating negative
effects on payment capacity, liquidity or profitability.
Companies that are deficient in regulatory capital and total regulatory capital deficiencies
Names of any other financial institutions,
etc., classified as subsidiaries or other
members of the bank holding company
that are deficient in regulatory capital,
and corresponding total regulatory capi-
tal deficiencies
Not applicable as of March 31, 2012 and 2013
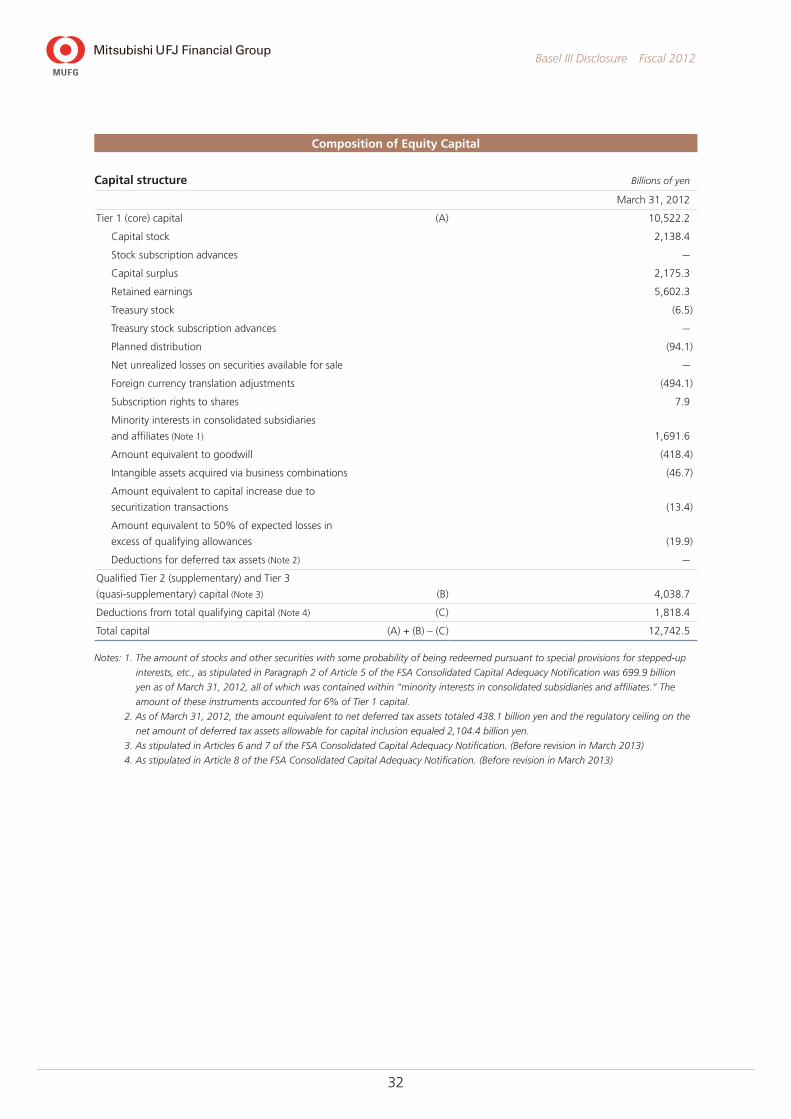
32
Basel III Disclosure Fiscal 2012
Composition of Equity Capital
Capital structure Billions of yen
March 31, 2012
Tier 1 (core) capital (A) 10,522.2
Capital stock 2,138.4
Stock subscription advances —
Capital surplus 2,175.3
Retained earnings 5,602.3
Treasury stock (6.5)
Treasury stock subscription advances —
Planned distribution (94.1)
Net unrealized losses on securities available for sale —
Foreign currency translation adjustments (494.1)
Subscription rights to shares 7.9
Minority interests in consolidated subsidiaries
and affiliates (Note 1) 1,691.6
Amount equivalent to goodwill (418.4)
Intangible assets acquired via business combinations (46.7)
Amount equivalent to capital increase due to
securitization transactions (13.4)
Amount equivalent to 50% of expected losses in
excess of qualifying allowances (19.9)
Deductions for deferred tax assets (Note 2) —
Qualified Tier 2 (supplementary) and Tier 3
(quasi-supplementary) capital (Note 3) (B) 4,038.7
Deductions from total qualifying capital (Note 4) (C) 1,818.4
Total capital (A) + (B) – (C) 12,742.5
Notes: 1. The amount of stocks and other securities with some probability of being redeemed pursuant to special provisions for stepped-up
interests, etc., as stipulated in Paragraph 2 of Article 5 of the FSA Consolidated Capital Adequacy Notification was 699.9 billion
yen as of March 31, 2012, all of which was contained within “minority interests in consolidated subsidiaries and affiliates.” The
amount of these instruments accounted for 6% of Tier 1 capital.
2. As of March 31, 2012, the amount equivalent to net deferred tax assets totaled 438.1 billion yen and the regulatory ceiling on the
net amount of deferred tax assets allowable for capital inclusion equaled 2,104.4 billion yen.
3. As stipulated in Articles 6 and 7 of the FSA Consolidated Capital Adequacy Notification. (Before revision in March 2013)
4. As stipulated in Article 8 of the FSA Consolidated Capital Adequacy Notification. (Before revision in March 2013)
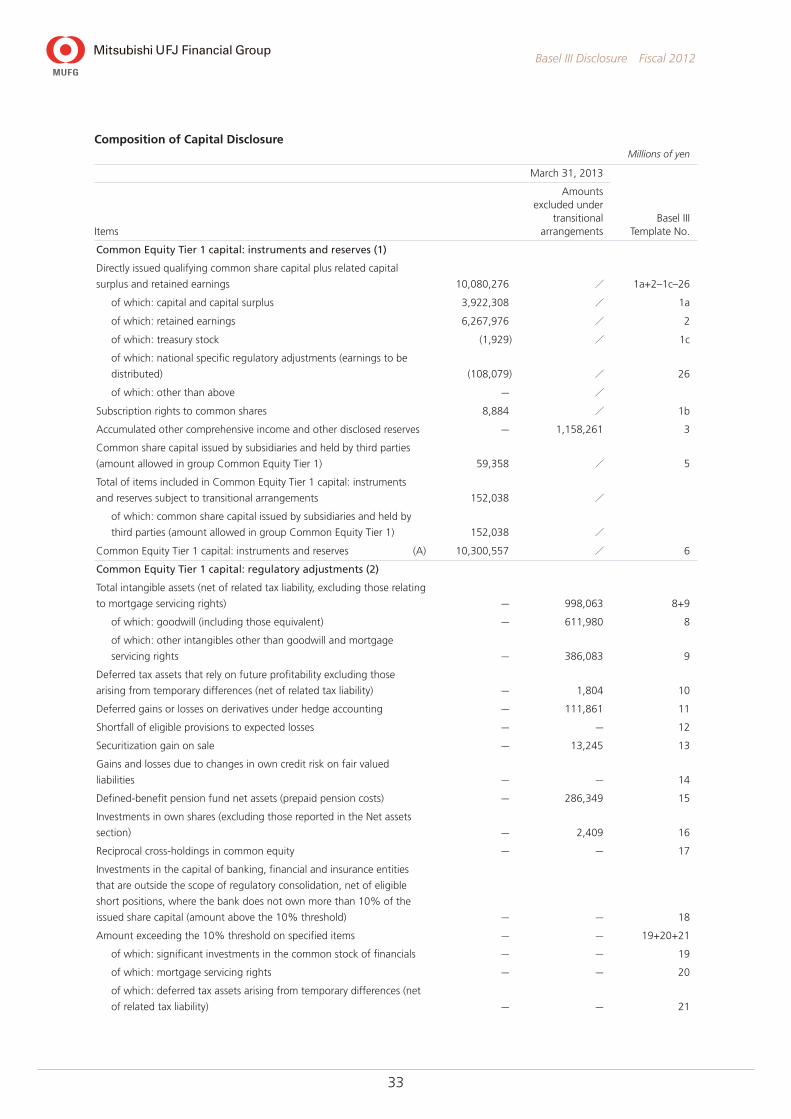
33
Basel III Disclosure Fiscal 2012
Composition of Capital DisclosureMillions of yen
March 31, 2013
Basel III Template No.Items
Amounts excluded under
transitional arrangements
Common Equity Tier 1 capital: instruments and reserves (1)
Directly issued qualifying common share capital plus related capital
surplus and retained earnings 10,080,276 / 1a+2–1c–26
of which: capital and capital surplus 3,922,308 / 1a
of which: retained earnings 6,267,976 / 2
of which: treasury stock (1,929) / 1c
of which: national specific regulatory adjustments (earnings to be
distributed) (108,079) / 26
of which: other than above — /
Subscription rights to common shares 8,884 / 1b
Accumulated other comprehensive income and other disclosed reserves — 1,158,261 3
Common share capital issued by subsidiaries and held by third parties
(amount allowed in group Common Equity Tier 1) 59,358 / 5
Total of items included in Common Equity Tier 1 capital: instruments
and reserves subject to transitional arrangements 152,038 /
of which: common share capital issued by subsidiaries and held by
third parties (amount allowed in group Common Equity Tier 1) 152,038 /
Common Equity Tier 1 capital: instruments and reserves (A) 10,300,557 / 6
Common Equity Tier 1 capital: regulatory adjustments (2)
Total intangible assets (net of related tax liability, excluding those relating
to mortgage servicing rights) — 998,063 8+9
of which: goodwill (including those equivalent) — 611,980 8
of which: other intangibles other than goodwill and mortgage
servicing rights — 386,083 9
Deferred tax assets that rely on future profitability excluding those
arising from temporary differences (net of related tax liability) — 1,804 10
Deferred gains or losses on derivatives under hedge accounting — 111,861 11
Shortfall of eligible provisions to expected losses — — 12
Securitization gain on sale — 13,245 13
Gains and losses due to changes in own credit risk on fair valued
liabilities — — 14
Defined-benefit pension fund net assets (prepaid pension costs) — 286,349 15
Investments in own shares (excluding those reported in the Net assets
section) — 2,409 16
Reciprocal cross-holdings in common equity — — 17
Investments in the capital of banking, financial and insurance entities
that are outside the scope of regulatory consolidation, net of eligible
short positions, where the bank does not own more than 10% of the
issued share capital (amount above the 10% threshold) — — 18
Amount exceeding the 10% threshold on specified items — — 19+20+21
of which: significant investments in the common stock of financials — — 19
of which: mortgage servicing rights — — 20
of which: deferred tax assets arising from temporary differences (net
of related tax liability) — — 21

34
Basel III Disclosure Fiscal 2012
Composition of Capital Disclosure (continued) Millions of yen
March 31, 2013
Basel III Template No.Items
Amounts excluded under
transitional arrangements
Amount exceeding the 15% threshold on specified items — — 22
of which: significant investments in the common stock of financials — — 23
of which: mortgage servicing rights — — 24
of which: deferred tax assets arising from temporary differences (net
of related tax liability) — — 25
Regulatory adjustments applied to Common Equity Tier 1 due to
insufficient Additional Tier 1 and Tier 2 to cover deductions — / 27
Common Equity Tier 1 capital: regulatory adjustments (B) — / 28
Common Equity Tier 1 capital (CET1)
Common Equity Tier 1 capital (CET1) ((A) – (B)) (C) 10,300,557 / 29
Additional Tier 1 capital: instruments (3)
Directly issued qualifying Additional Tier 1 instruments plus related
capital surplus of which: classified as equity under applicable accounting
standards — / 31a 30
Subscription rights to Additional Tier 1 instruments — / 31b 30
Directly issued qualifying Additional Tier 1 instruments plus related
capital surplus of which: classified as liabilities under applicable
accounting standards — / 32 30
Qualifying Additional Tier 1 instruments plus related capital surplus
issued by special purpose vehicles and other equivalent entities — / 30
Additional Tier 1 instruments issued by subsidiaries and held by third
parties (amount allowed in group Additional Tier 1) 130,488 / 34–35
Eligible Tier 1 capital instruments subject to transitional arrangements
included in Additional Tier 1 capital: instruments 1,491,777 / 33+35
of which: instruments issued by bank holding companies and their
special purpose vehicles 1,491,777 / 33
of which: instruments issued by subsidiaries — / 35
Total of items included in Additional Tier 1 capital: instruments subject
to transitional arrangements (195,421) /
of which: foreign currency translation adjustments (195,421) /
Additional Tier 1 capital: instruments (D) 1,426,844 / 36
Additional Tier 1 capital: regulatory adjustments
Investments in own Additional Tier 1 instruments — 1,169 37
Reciprocal cross-holdings in Additional Tier 1 instruments — — 38
Investments in the capital of banking, financial and insurance entities
that are outside the scope of regulatory consolidation, net of eligible
short positions, where the bank does not own more than 10% of the
issued common share capital of the entity (amount above the 10%
threshold) — — 39
Significant investments in the capital of banking, financial and insurance
entities that are outside the scope of regulatory consolidation (net of
eligible short positions) — 10,240 40
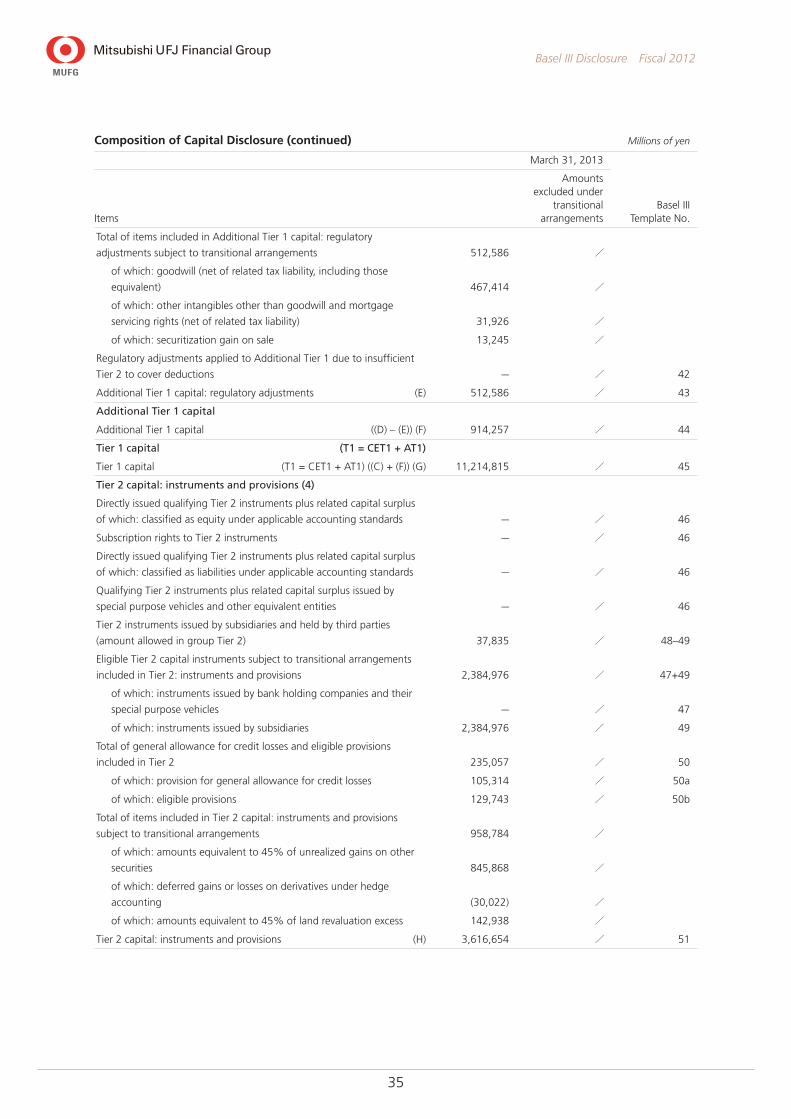
35
Basel III Disclosure Fiscal 2012
Composition of Capital Disclosure (continued) Millions of yen
March 31, 2013
Basel III Template No.Items
Amounts excluded under
transitional arrangements
Total of items included in Additional Tier 1 capital: regulatory
adjustments subject to transitional arrangements 512,586 /
of which: goodwill (net of related tax liability, including those
equivalent) 467,414 /
of which: other intangibles other than goodwill and mortgage
servicing rights (net of related tax liability) 31,926 /
of which: securitization gain on sale 13,245 /
Regulatory adjustments applied to Additional Tier 1 due to insufficient
Tier 2 to cover deductions — / 42
Additional Tier 1 capital: regulatory adjustments (E) 512,586 / 43
Additional Tier 1 capital
Additional Tier 1 capital ((D) – (E)) (F) 914,257 / 44
Tier 1 capital (T1 = CET1 + AT1)
Tier 1 capital (T1 = CET1 + AT1) ((C) + (F)) (G) 11,214,815 / 45
Tier 2 capital: instruments and provisions (4)
Directly issued qualifying Tier 2 instruments plus related capital surplus
of which: classified as equity under applicable accounting standards — / 46
Subscription rights to Tier 2 instruments — / 46
Directly issued qualifying Tier 2 instruments plus related capital surplus
of which: classified as liabilities under applicable accounting standards — / 46
Qualifying Tier 2 instruments plus related capital surplus issued by
special purpose vehicles and other equivalent entities — / 46
Tier 2 instruments issued by subsidiaries and held by third parties
(amount allowed in group Tier 2) 37,835 / 48–49
Eligible Tier 2 capital instruments subject to transitional arrangements
included in Tier 2: instruments and provisions 2,384,976 / 47+49
of which: instruments issued by bank holding companies and their
special purpose vehicles — / 47
of which: instruments issued by subsidiaries 2,384,976 / 49
Total of general allowance for credit losses and eligible provisions
included in Tier 2 235,057 / 50
of which: provision for general allowance for credit losses 105,314 / 50a
of which: eligible provisions 129,743 / 50b
Total of items included in Tier 2 capital: instruments and provisions
subject to transitional arrangements 958,784 /
of which: amounts equivalent to 45% of unrealized gains on other
securities 845,868 /
of which: deferred gains or losses on derivatives under hedge
accounting (30,022) /
of which: amounts equivalent to 45% of land revaluation excess 142,938 /
Tier 2 capital: instruments and provisions (H) 3,616,654 / 51

36
Basel III Disclosure Fiscal 2012
Composition of Capital Disclosure (continued) Millions of yen
March 31, 2013
Basel III Template No.Items
Amounts excluded under
transitional arrangements
Tier 2 capital: regulatory adjustments
Investments in own Tier 2 instruments — 18,870 52
Reciprocal cross-holdings in Tier 2 instruments — — 53
Investments in the capital of banking, financial and insurance entities
that are outside the scope of regulatory consolidation, net of eligible
short positions, where the bank does not own more than 10% of the
issued common share capital of the entity (amount above the 10%
threshold) — — 54
Significant investments in the capital banking, financial and insurance
entities that are outside the scope of regulatory consolidation (net of
eligible short positions) — 4,922 55
Total of items included in Tier 2 capital: regulatory adjustments subject
to transitional arrangements 157,518 /
of which: goodwill (net of related tax liability, including those
equivalent) 144,565 /
of which: significant investments in the capital banking, financial
and insurance entities that are outside the scope of regulatory
consolidation (net of eligible short positions) 12,952 /
Tier 2 capital: regulatory adjustments (I) 157,518 / 57
Tier 2 capital (T2)
Tier 2 capital (T2) ((H) – (I)) (J) 3,459,135 / 58
Total capital (TC = T1 + T2)
Total capital (TC = T1 + T2) ((G) + (J)) (K) 14,673,951 / 59
Risk weighted assets (5)
Total of items included in risk weighted assets subject to transitional
arrangements 669,851 /
of which: other intangibles other than goodwill and mortgage
servicing rights (net of related tax liability) 354,156 /
of which: deferred tax assets that rely on future profitability
excluding those arising from temporary differences (net of related tax
liability) 1,804 /
of which: defined-benefit pension fund net assets (prepaid pension
costs) 286,349 /
of which: investments in own shares (excluding those reported in the
Net assets section) 4,963 /
of which: significant investments in the capital banking, financial
and insurance entities that are outside the scope of regulatory
consolidation (net of eligible short positions) 22,577 /
Risk weighted assets (L) 87,968,639 / 60
Capital ratio (consolidated)
Common Equity Tier 1 capital ratio (consolidated) ((C) / (L)) 11.70% / 61
Tier 1 capital ratio (consolidated) ((G) / (L)) 12.74% / 62
Total capital ratio (consolidated) ((K) / (L)) 16.68% / 63
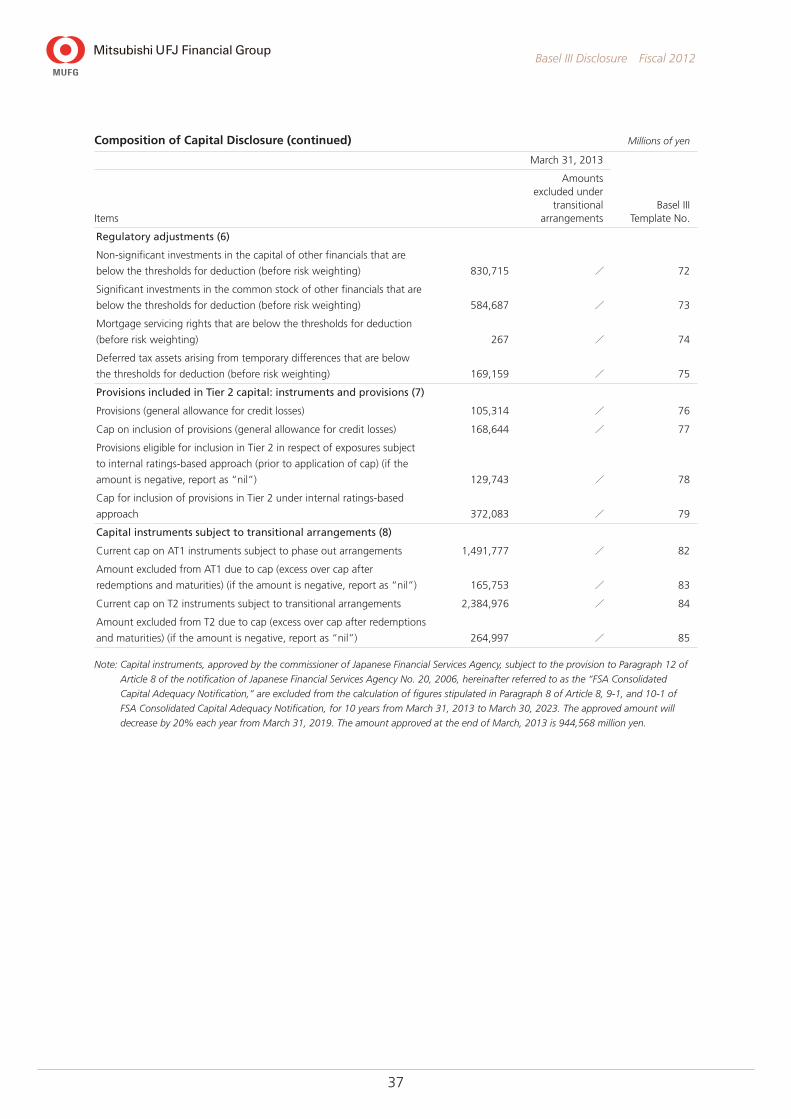
37
Basel III Disclosure Fiscal 2012
Composition of Capital Disclosure (continued) Millions of yen
March 31, 2013
Basel III Template No.Items
Amounts excluded under
transitional arrangements
Regulatory adjustments (6)
Non-significant investments in the capital of other financials that are
below the thresholds for deduction (before risk weighting) 830,715 / 72
Significant investments in the common stock of other financials that are
below the thresholds for deduction (before risk weighting) 584,687 / 73
Mortgage servicing rights that are below the thresholds for deduction
(before risk weighting) 267 / 74
Deferred tax assets arising from temporary differences that are below
the thresholds for deduction (before risk weighting) 169,159 / 75
Provisions included in Tier 2 capital: instruments and provisions (7)
Provisions (general allowance for credit losses) 105,314 / 76
Cap on inclusion of provisions (general allowance for credit losses) 168,644 / 77
Provisions eligible for inclusion in Tier 2 in respect of exposures subject
to internal ratings-based approach (prior to application of cap) (if the
amount is negative, report as “nil”) 129,743 / 78
Cap for inclusion of provisions in Tier 2 under internal ratings-based
approach 372,083 / 79
Capital instruments subject to transitional arrangements (8)
Current cap on AT1 instruments subject to phase out arrangements 1,491,777 / 82
Amount excluded from AT1 due to cap (excess over cap after
redemptions and maturities) (if the amount is negative, report as “nil”) 165,753 / 83
Current cap on T2 instruments subject to transitional arrangements 2,384,976 / 84
Amount excluded from T2 due to cap (excess over cap after redemptions
and maturities) (if the amount is negative, report as “nil”) 264,997 / 85
Note: Capital instruments, approved by the commissioner of Japanese Financial Services Agency, subject to the provision to Paragraph 12 of
Article 8 of the notification of Japanese Financial Services Agency No. 20, 2006, hereinafter referred to as the “FSA Consolidated
Capital Adequacy Notification,” are excluded from the calculation of figures stipulated in Paragraph 8 of Article 8, 9-1, and 10-1 of
FSA Consolidated Capital Adequacy Notification, for 10 years from March 31, 2013 to March 30, 2023. The approved amount will
decrease by 20% each year from March 31, 2019. The amount approved at the end of March, 2013 is 944,568 million yen.

38
Basel III Disclosure Fiscal 2012
Explanation on reconciliation between balance sheet items and regulatory capital elements defined in the previous paragraph (March 31, 2013)
Note: 1. The amounts in the “Composition of capital disclosure” are based on those before considering transitional arrangements and
includes “Amounts excluded under transitional arrangements” disclosed in “Composition of Capital Disclosure” as wells as the
amounts included in regulatory capital. In addition, items included in regulatory capital under transitional arrangements are excluded
from this table.
2. As of March 31, 2013, the regulatory scope of consolidation was the same as the accounting scope of consolidation.
1. Shareholders’ equity
(1) Consolidated balance sheetMillions of yen
Consolidated balance sheet items Amount Remarks
Capital stock 2,139,378
Stock surplus 2,172,930
Retained earnings 6,267,976
Treasury stock (1,929)
Total shareholders’ equity 10,578,356
(2) Composition of capitalMillions of yen
Composition of capital disclosure Amount RemarksBasel III
Template No.
Directly issued qualifying common share capital
plus related stock surplus and retained earnings 10,188,355
Shareholders’ equity attributable to
common shares (before adjusting national
specific regulatory adjustments (earnings
to be distributed))
of which: capital and stock surplus 3,922,308 1a
of which: retained earnings 6,267,976 2
of which: treasury stock (1,929) 1c
of which: other than above —
Directly issued qualifying Additional Tier 1
instruments plus related stock surplus of which:
classified as equity under applicable accounting
standards and the breakdown —
Shareholders’ equity attributable to
preferred shares with a loss absorbency
clause upon entering into effective
bankruptcy 31a
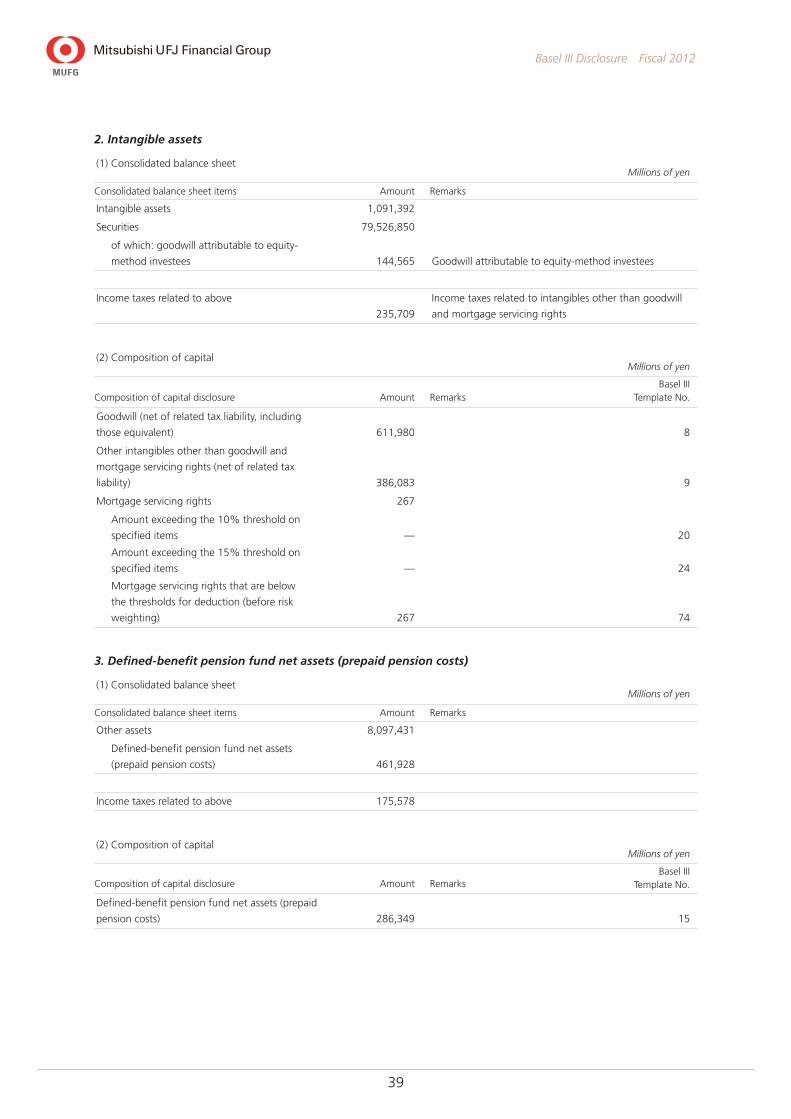
39
Basel III Disclosure Fiscal 2012
2. Intangible assets
(1) Consolidated balance sheetMillions of yen
Consolidated balance sheet items Amount Remarks
Intangible assets 1,091,392
Securities 79,526,850
of which: goodwill attributable to equity-
method investees 144,565 Goodwill attributable to equity-method investees
Income taxes related to above
235,709
Income taxes related to intangibles other than goodwill
and mortgage servicing rights
(2) Composition of capitalMillions of yen
Composition of capital disclosure Amount RemarksBasel III
Template No.
Goodwill (net of related tax liability, including
those equivalent) 611,980 8
Other intangibles other than goodwill and
mortgage servicing rights (net of related tax
liability) 386,083 9
Mortgage servicing rights 267
Amount exceeding the 10% threshold on
specified items — 20
Amount exceeding the 15% threshold on
specified items — 24
Mortgage servicing rights that are below
the thresholds for deduction (before risk
weighting) 267 74
3. Defined-benefit pension fund net assets (prepaid pension costs)
(1) Consolidated balance sheetMillions of yen
Consolidated balance sheet items Amount Remarks
Other assets 8,097,431
Defined-benefit pension fund net assets
(prepaid pension costs) 461,928
Income taxes related to above 175,578
(2) Composition of capitalMillions of yen
Composition of capital disclosure Amount RemarksBasel III
Template No.
Defined-benefit pension fund net assets (prepaid
pension costs) 286,349 15
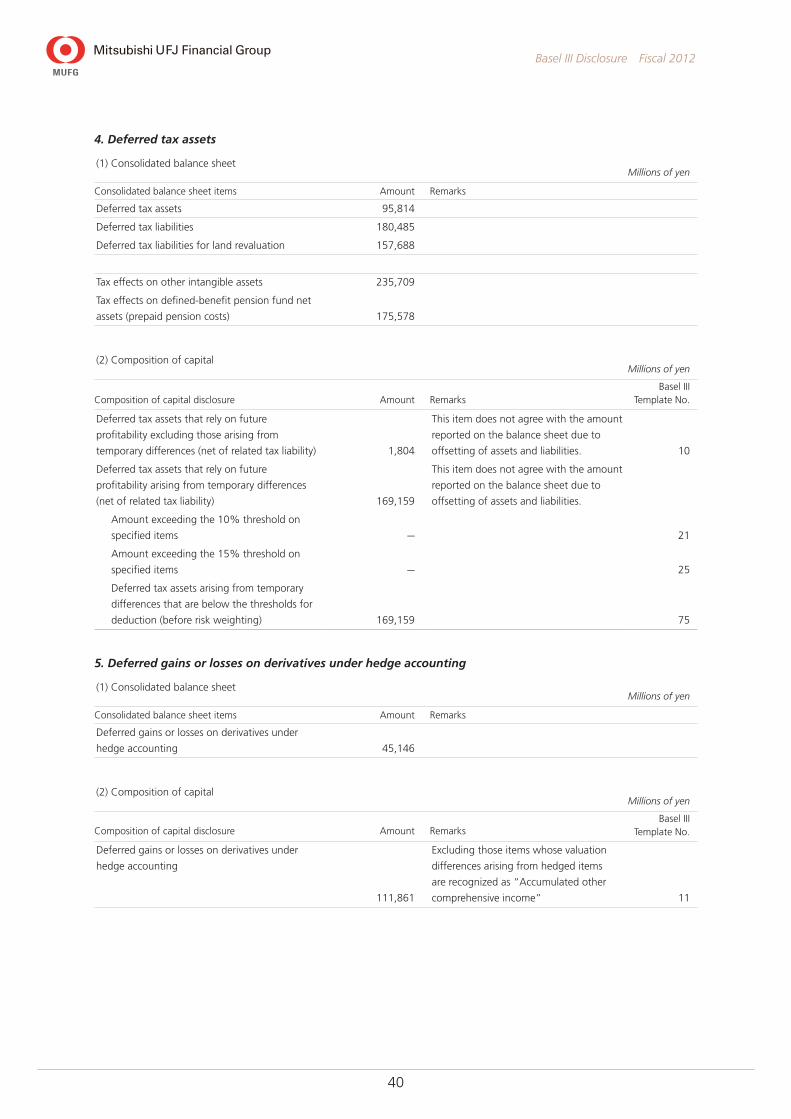
40
Basel III Disclosure Fiscal 2012
4. Deferred tax assets
(1) Consolidated balance sheetMillions of yen
Consolidated balance sheet items Amount Remarks
Deferred tax assets 95,814
Deferred tax liabilities 180,485
Deferred tax liabilities for land revaluation 157,688
Tax effects on other intangible assets 235,709
Tax effects on defined-benefit pension fund net
assets (prepaid pension costs) 175,578
(2) Composition of capitalMillions of yen
Composition of capital disclosure Amount RemarksBasel III
Template No.
Deferred tax assets that rely on future
profitability excluding those arising from
temporary differences (net of related tax liability) 1,804
This item does not agree with the amount
reported on the balance sheet due to
offsetting of assets and liabilities. 10
Deferred tax assets that rely on future
profitability arising from temporary differences
(net of related tax liability) 169,159
This item does not agree with the amount
reported on the balance sheet due to
offsetting of assets and liabilities.
Amount exceeding the 10% threshold on
specified items — 21
Amount exceeding the 15% threshold on
specified items — 25
Deferred tax assets arising from temporary
differences that are below the thresholds for
deduction (before risk weighting) 169,159 75
5. Deferred gains or losses on derivatives under hedge accounting
(1) Consolidated balance sheetMillions of yen
Consolidated balance sheet items Amount Remarks
Deferred gains or losses on derivatives under
hedge accounting 45,146
(2) Composition of capitalMillions of yen
Composition of capital disclosure Amount RemarksBasel III
Template No.
Deferred gains or losses on derivatives under
hedge accounting
111,861
Excluding those items whose valuation
differences arising from hedged items
are recognized as “Accumulated other
comprehensive income” 11
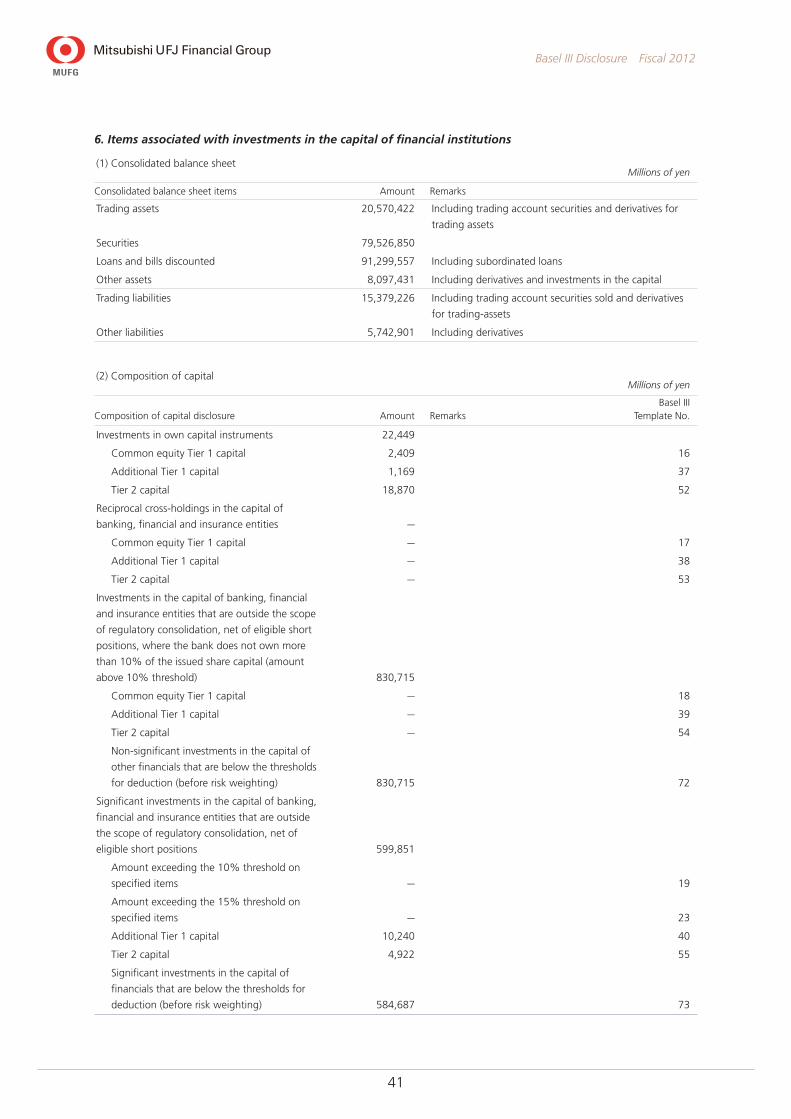
41
Basel III Disclosure Fiscal 2012
6. Items associated with investments in the capital of financial institutions
(1) Consolidated balance sheetMillions of yen
Consolidated balance sheet items Amount Remarks
Trading assets 20,570,422 Including trading account securities and derivatives for
trading assets
Securities 79,526,850
Loans and bills discounted 91,299,557 Including subordinated loans
Other assets 8,097,431 Including derivatives and investments in the capital
Trading liabilities 15,379,226 Including trading account securities sold and derivatives
for trading-assets
Other liabilities 5,742,901 Including derivatives
(2) Composition of capitalMillions of yen
Composition of capital disclosure Amount RemarksBasel III
Template No.
Investments in own capital instruments 22,449
Common equity Tier 1 capital 2,409 16
Additional Tier 1 capital 1,169 37
Tier 2 capital 18,870 52
Reciprocal cross-holdings in the capital of
banking, financial and insurance entities —
Common equity Tier 1 capital — 17
Additional Tier 1 capital — 38
Tier 2 capital — 53
Investments in the capital of banking, financial
and insurance entities that are outside the scope
of regulatory consolidation, net of eligible short
positions, where the bank does not own more
than 10% of the issued share capital (amount
above 10% threshold) 830,715
Common equity Tier 1 capital — 18
Additional Tier 1 capital — 39
Tier 2 capital — 54
Non-significant investments in the capital of
other financials that are below the thresholds
for deduction (before risk weighting) 830,715 72
Significant investments in the capital of banking,
financial and insurance entities that are outside
the scope of regulatory consolidation, net of
eligible short positions 599,851
Amount exceeding the 10% threshold on
specified items — 19
Amount exceeding the 15% threshold on
specified items — 23
Additional Tier 1 capital 10,240 40
Tier 2 capital 4,922 55
Significant investments in the capital of
financials that are below the thresholds for
deduction (before risk weighting) 584,687 73

42
Basel III Disclosure Fiscal 2012
7. Minority interests
(1) Consolidated balance sheetMillions of yen
Consolidated balance sheet items Amount Remarks
Minority interests 1,774,153
(2) Composition of capitalMillions of yen
Composition of capital disclosure Amount RemarksBasel III
Template No.
Common share capital issued by subsidiaries and
held by third parties (amount allowed in group
CET1) 59,358
After reflecting amounts eligible
for inclusion (after minority interest
adjustments) 5
Directly issued qualifying Additional Tier 1
instruments plus related stock surplus of which:
classified as equity under applicable accounting
standards, or of which: classified as liabilities under
applicable accounting standards Subscription rights
to Additional Tier 1 instruments —
After reflecting amounts eligible
for inclusion (after minority interest
adjustments) 30–31ab–32
Additional Tier 1 instruments issued by
subsidiaries and held by third parties (amount
allowed in group AT1) 130,488
After reflecting amounts eligible
for inclusion (after minority interest
adjustments) 34–35
Directly issued qualifying Tier 2 instruments plus
related stock surplus —
After reflecting amounts eligible
for inclusion (after minority interest
adjustments) 46
Tier 2 instruments issued by subsidiaries and held
by third parties (amount allowed in group Tier 2) 37,835
After reflecting amounts eligible
for inclusion (after minority interest
adjustments) 48–49
8. Other capital instruments
(1) Consolidated balance sheetMillions of yen
Consolidated balance sheet items Amount Remarks
Borrowed money 10,758,136
Bonds payable 6,114,578
Total 16,872,714
(2) Composition of capitalMillions of yen
Composition of capital disclosure Amount RemarksBasel III
Template No.
Directly issued qualifying Additional Tier 1
instruments plus related stock surplus of
which: classified as liabilities under applicable
accounting standards — 32
Directly issued qualifying Tier 2 instruments
plus related stock surplus of which: classified as
liabilities under applicable accounting standards
and its breakdown — 46
Description of agreements concerning methods of procuring capital
Details are shown on the MUFG website (Please see http://www.mufg.jp/english/ir/basel3/)

43
Basel III Disclosure Fiscal 2012
Capital Adequacy
Capital requirements for credit risk Billions of yen
March 31, 2012 March 31, 2013
Capital requirements for credit risk (excluding equity exposures under the IRB
Approach and exposures relating to funds (Note 3)) 6,793.2 6,517.0
IRB Approach (excluding securitization exposures) 5,645.7 5,228.6
Corporate exposures (excluding specialized lending exposures subject to
supervisory slotting criteria) 3,880.3 3,727.9
Corporate exposures (specialized lending exposures subject to
supervisory slotting criteria) 32.5 33.1
Sovereign exposures 86.9 71.6
Bank exposures 186.8 211.4
Residential mortgage exposures 618.7 517.7
Qualifying revolving retail exposures 226.7 200.0
Other retail exposures 313.5 266.3
Exposures related to unsettled transactions 0.0 0.1
Exposures for other assets 300.0 200.3
Standardized Approach (excluding securitization exposures) 904.3 1,079.3
Securitization exposures (Note 4) 243.2 209.0
Portfolios under the IRB Approach 216.3 183.2
Portfolios under the Standardized Approach 26.8 25.7
Capital requirements for credit risk of equity exposures under the IRB Approach 459.0 774.9
Exposures subject to transitional arrangements (grandfathering provisions) (Note 5) 286.8 329.4
Market-Based Approach (Simple Risk Weight Method) (Note 6) 68.4 76.2
Market-Based Approach (Internal Models Method) (Note 6) — —‐
PD/LGD Approach (Note 6) 103.7 245.1
Exposures related to specific items related to components not included in
survey items / 124.0
Capital requirements for exposures relating to funds 202.2 199.7
Required capital for CVA risk / 266.8
Required capital for credit risk associated with exposures relating to central clearing
houses / 22.6
Total 7,454.6 7,781.1
Notes: 1. Credit risk-weighted assets were calculated using the AIRB approach. However, as an exemption to this approach, the
Standardized Approach is used for calculations with credit risk-weighted assets at some subsidiaries in cases where the figures for
such subsidiaries are expected to be minor compared with the total. In addition, the adoption of the IRB approach is due to be
phased in from the end of March 2018 at UnionBanCal Corporation
2. Capital requirement for portfolios under the IRB Approach is calculated as “credit risk-weighted asset amount x 8% + expected
losses.” In this calculation, the amount of capital requirement is including any exposures qualifying as capital deduction, and the
credit risk-weighted asset amount is multiplied by the scaling factor of 1.06. Capital requirements for portfolios under the
Standardized Approach are calculated as “credit risk-weighted asset amount x 8%.”
3. Exposures to calculate the amount of credit risk-weighted assets as stipulated in Article 145 of the FSA Holding Company Capital
Adequacy Notification.
4. Including amounts equivalent to increase in equity capital resulting from a securitization exposure, as a deduction from Tier 1
capital elements.
5. Exposures to calculate the amount of credit risk-weighted assets as stipulated in Article 13 of the Supplementary Provisions to the
FSA Holding Company Capital Adequacy Notification.
6. Exposures to calculate the amount of credit risk-weighted assets as stipulated in Article 144 of the FSA Holding Company Capital
Adequacy Notification.
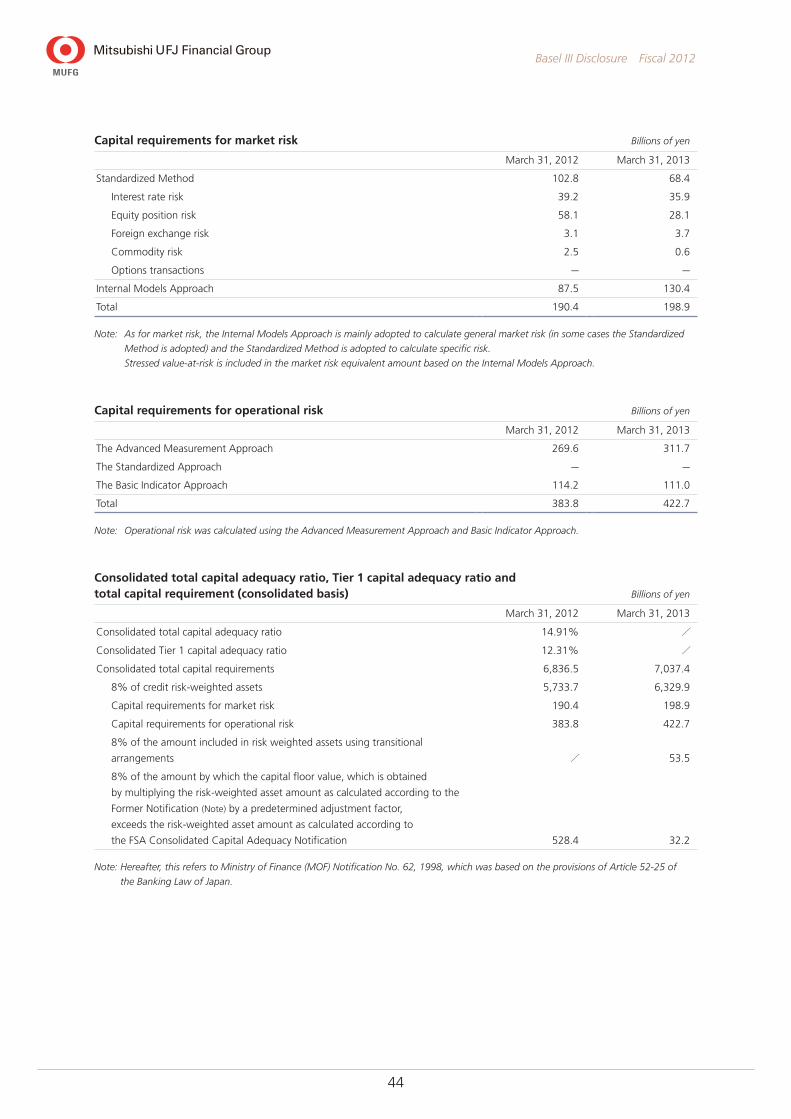
44
Basel III Disclosure Fiscal 2012
Capital requirements for market risk Billions of yen
March 31, 2012 March 31, 2013
Standardized Method 102.8 68.4
Interest rate risk 39.2 35.9
Equity position risk 58.1 28.1
Foreign exchange risk 3.1 3.7
Commodity risk 2.5 0.6
Options transactions — —
Internal Models Approach 87.5 130.4
Total 190.4 198.9
Note: As for market risk, the Internal Models Approach is mainly adopted to calculate general market risk (in some cases the Standardized
Method is adopted) and the Standardized Method is adopted to calculate specific risk.
Stressed value-at-risk is included in the market risk equivalent amount based on the Internal Models Approach.
Capital requirements for operational risk Billions of yen
March 31, 2012 March 31, 2013
The Advanced Measurement Approach 269.6 311.7
The Standardized Approach — —
The Basic Indicator Approach 114.2 111.0
Total 383.8 422.7
Note: Operational risk was calculated using the Advanced Measurement Approach and Basic Indicator Approach.
Consolidated total capital adequacy ratio, Tier 1 capital adequacy ratio and total capital requirement (consolidated basis) Billions of yen
March 31, 2012 March 31, 2013
Consolidated total capital adequacy ratio 14.91% /
Consolidated Tier 1 capital adequacy ratio 12.31% /
Consolidated total capital requirements 6,836.5 7,037.4
8% of credit risk-weighted assets 5,733.7 6,329.9
Capital requirements for market risk 190.4 198.9
Capital requirements for operational risk 383.8 422.7
8% of the amount included in risk weighted assets using transitional
arrangements / 53.5
8% of the amount by which the capital floor value, which is obtained
by multiplying the risk-weighted asset amount as calculated according to the
Former Notification (Note) by a predetermined adjustment factor,
exceeds the risk-weighted asset amount as calculated according to
the FSA Consolidated Capital Adequacy Notification 528.4 32.2
Note: Hereafter, this refers to Ministry of Finance (MOF) Notification No. 62, 1998, which was based on the provisions of Article 52-25 of
the Banking Law of Japan.

45
Basel III Disclosure Fiscal 2012
Credit Risk
Credit risk exposures and default exposures (By approach) Billions of yen
March 31, 2012
Credit risk exposures (Note 1)
Loans, etc. (Note 2) Debt securities OTC derivatives Total
The IRB Approach 121,696.8 67,441.1 3,931.3 212,177.4
The Standardized Approach 14,371.9 2,468.7 2,424.7 23,949.8
Total 136,068.8 69,909.9 6,356.0 236,127.2
Billions of yen
March 31, 2013
Credit risk exposures (Note 1)
Loans, etc. (Note 2) Debt securities OTC derivatives Total
The IRB Approach 125,187.9 66,892.2 4,320.6 217,888.2
The Standardized Approach 19,458.2 2,384.6 2,539.5 30,156.2
Total 144,646.2 69,276.9 6,860.2 248,044.5
Notes: 1. Figures are without taking into account the effects of credit risk mitigation techniques. Furthermore, figures do not include any
securitization exposures or exposures relating to central clearing houses.
2. Loans, etc., include loans, commitments and other non-derivative off balance sheet exposures.
3. Regarding on balance sheet exposures to loans and debt securities, etc., and off balance sheet exposures to commitments, etc.,
no significant disparity was observed between the interim term-end position and the average risk positions during this period.
(By geographic area) Billions of yen
March 31, 2012
Credit risk exposures (Note 1) Default exposures (Note 3)Loans, etc. (Note 2) Debt securities OTC derivatives Total
Domestic 103,570.1 63,859.1 5,690.4 191,021.4 2,502.6
Foreign 32,498.6 6,050.8 665.6 45,105.8 173.3
Total 136,068.8 69,909.9 6,356.0 236,127.2 2,676.0
Billions of yen
March 31, 2013
Credit risk exposures (Note 1) Default exposures (Note 3)Loans, etc. (Note 2) Debt securities OTC derivatives Total
Domestic 105,062.9 62,173.4 5,966.5 193,431.8 2,465.9
Foreign 39,583.3 7,103.5 893.6 54,612.6 190.4
Total 144,646.2 69,276.9 6,860.2 248,044.5 2,656.4
Notes: 1. Figures are without taking into account the effects of credit risk mitigation techniques. Furthermore, figures do not include any
securitization exposures or exposures relating to central clearing houses.
2. Loans, etc., include loans, commitments and other non-derivative off balance sheet exposures.
3. Figures for exposures past due three months or more or default exposures correspond to exposures as of the period-end where
the amount of the credit risk-weighted asset is computed assuming default in cases subject to the IRB Approach, and exposures
where the amount of the credit risk-weighted asset is computed assuming past-due loan exposure in cases subject to the
Standardized Approach. Figures do not include any securitization exposures or exposures relating to funds.
4. Geographic area refers to the locations of MUFG or our subsidiaries or the head and branch offices of our subsidiaries.

46
Basel III Disclosure Fiscal 2012
(By type of industry) Billions of yen
March 31, 2012
Credit risk exposures (Note 1) Default exposures (Note 3)Loans, etc. (Note 2) Debt securities OTC derivatives Total
Manufacturing 17,066.6 1,451.2 622.7 21,838.2 392.1
Wholesale and retail 10,443.2 556.6 550.0 12,662.1 431.4
Construction 1,533.2 124.6 21.2 1,784.6 77.1
Finance and insurance 26,297.1 1,534.1 3,801.1 35,333.8 56.4
Real estate 10,758.8 315.7 84.0 11,254.7 252.1
Services 6,461.1 325.8 230.8 7,107.1 241.6
Transport 4,470.0 224.2 242.0 5,265.6 67.0
Individuals 22,316.6 — 0.0 23,096.6 824.8
Governments and local authorities 19,399.9 63,177.2 53.8 85,560.8 0.0
Others 17,321.8 2,200.0 749.8 32,223.1 333.1
Total 136,068.8 69,909.9 6,356.0 236,127.2 2,676.0
Billions of yen
March 31, 2013
Credit risk exposures (Note 1) Default exposures (Note 3)Loans, etc. (Note 2) Debt securities OTC derivatives Total
Manufacturing 19,036.0 1,260.9 696.2 23,897.1 418.1
Wholesale and retail 11,277.8 421.4 442.7 13,314.0 437.7
Construction 1,605.6 77.6 23.2 1,831.6 69.5
Finance and insurance 26,095.9 1,572.4 4,000.0 35,863.1 38.8
Real estate 11,019.0 256.5 106.3 11,522.3 253.1
Services 6,684.5 254.4 209.8 7,257.3 227.2
Transport 4,707.8 198.5 200.9 5,569.2 72.3
Individuals 21,866.4 — 0.0 22,665.9 798.6
Governments and local authorities 21,511.0 62,972.9 62.2 89,895.4 0.0
Others 20,841.8 2,262.0 1,118.4 36,228.1 340.7
Total 144,646.2 69,276.9 6,860.2 248,044.5 2,656.4
Notes: 1. Figures are without taking into account the effects of credit risk mitigation techniques. Furthermore, figures do not include any
securitization exposures or exposures relating to central clearing houses.
2. Loans, etc., include loans, commitments and other non-derivative off balance sheet exposures.
3. Figures for exposures past due three months or more or default exposures correspond to exposures as of the period-end where
the amount of the credit risk-weighted asset is computed assuming default in cases subject to the IRB Approach, and exposures
where the amount of the credit risk-weighted asset is computed assuming past-due loan exposure in cases subject to the
Standardized Approach. Figures do not include any securitization exposures or exposures relating to central clearing houses.
4. Exposures held by certain subsidiaries whose credit risk weighted assets are considered minor relative to the overall total are
included in the “Others” category.
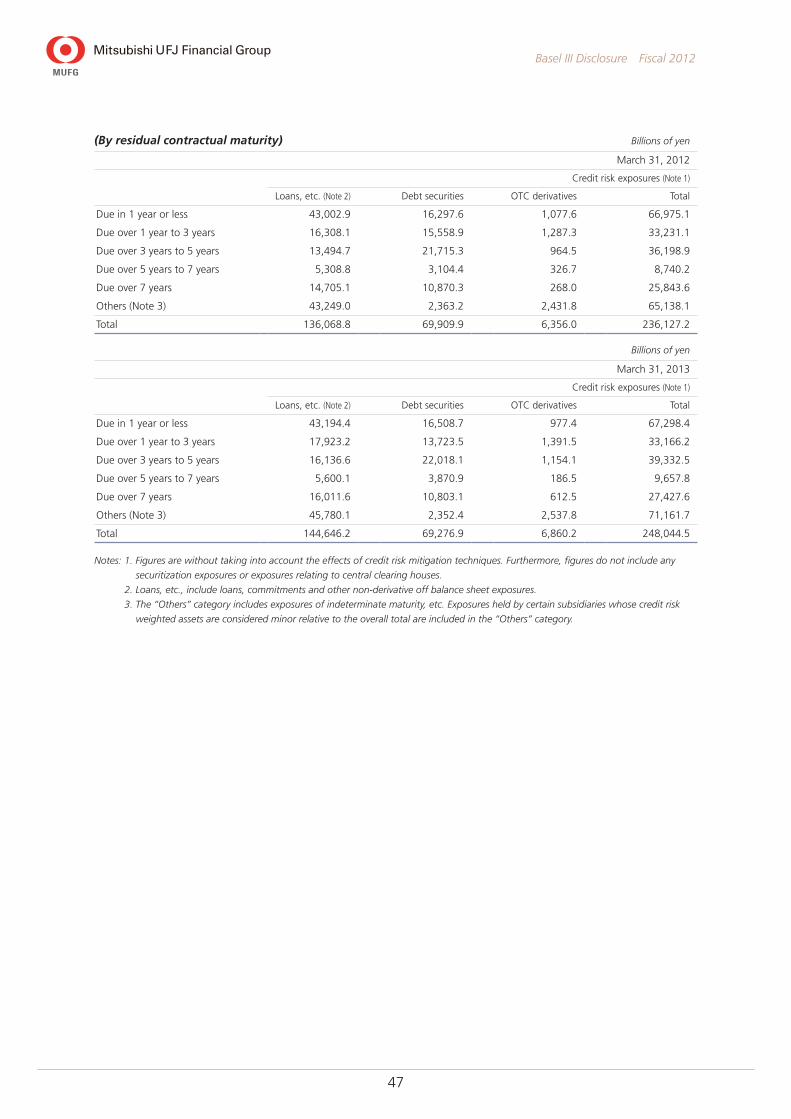
47
Basel III Disclosure Fiscal 2012
(By residual contractual maturity) Billions of yen
March 31, 2012
Credit risk exposures (Note 1)
Loans, etc. (Note 2) Debt securities OTC derivatives Total
Due in 1 year or less 43,002.9 16,297.6 1,077.6 66,975.1
Due over 1 year to 3 years 16,308.1 15,558.9 1,287.3 33,231.1
Due over 3 years to 5 years 13,494.7 21,715.3 964.5 36,198.9
Due over 5 years to 7 years 5,308.8 3,104.4 326.7 8,740.2
Due over 7 years 14,705.1 10,870.3 268.0 25,843.6
Others (Note 3) 43,249.0 2,363.2 2,431.8 65,138.1
Total 136,068.8 69,909.9 6,356.0 236,127.2
Billions of yen
March 31, 2013
Credit risk exposures (Note 1)
Loans, etc. (Note 2) Debt securities OTC derivatives Total
Due in 1 year or less 43,194.4 16,508.7 977.4 67,298.4
Due over 1 year to 3 years 17,923.2 13,723.5 1,391.5 33,166.2
Due over 3 years to 5 years 16,136.6 22,018.1 1,154.1 39,332.5
Due over 5 years to 7 years 5,600.1 3,870.9 186.5 9,657.8
Due over 7 years 16,011.6 10,803.1 612.5 27,427.6
Others (Note 3) 45,780.1 2,352.4 2,537.8 71,161.7
Total 144,646.2 69,276.9 6,860.2 248,044.5
Notes: 1. Figures are without taking into account the effects of credit risk mitigation techniques. Furthermore, figures do not include any
securitization exposures or exposures relating to central clearing houses.
2. Loans, etc., include loans, commitments and other non-derivative off balance sheet exposures.
3. The “Others” category includes exposures of indeterminate maturity, etc. Exposures held by certain subsidiaries whose credit risk
weighted assets are considered minor relative to the overall total are included in the “Others” category.

48
Basel III Disclosure Fiscal 2012
General allowance for credit losses, specific allowance for credit losses and allowance for loans to specific foreign borrowers
(Balances by geographic area) Millions of yen
March 31, 2012 Against March 31, 2011 March 31, 2013 Against March 31, 2012
General allowance for
credit losses 748,128 (57,114) 729,080 (19,047)
Specific allowance for
credit losses 375,017 36,988 357,625 (17,391)
Domestic 334,362 24,944 314,554 (19,808)
Foreign 40,655 12,044 43,071 2,416
Allowance for loans to specific
foreign borrowers 626 (98) 751 124
Total 1,123,773 (20,224) 1,087,457 (36,315)
(Balances by type of industry) Millions of yen
March 31, 2012 Against March 31, 2011 March 31, 2013 Against March 31, 2012
General allowance for
credit losses 748,128 (57,114) 729,080 (19,047)
Specific allowance for
credit losses 375,017 36,988 357,625 (17,391)
Manufacturing 78,346 29,629 89,623 11,277
Wholesale and retail 75,622 17,512 83,474 7,852
Construction 8,617 (3,027) 8,756 139
Finance and insurance 16,390 2,112 18,038 1,647
Real estate 19,964 (5,705) 20,852 887
Services 24,842 1,538 23,646 (1,196)
Transport 14,469 9,872 16,215 1,745
Individuals 37,213 (11,356) 27,895 (9,317)
Governments and
local authorities 5 (0) 4 (0)
Others 99,545 (3,586) 69,117 (30,428)
Allowance for loans to
specific foreign borrowers 626 (98) 751 124
Total 1,123,773 (20,224) 1,087,457 (36,315)
Notes: 1. Although the specific allowance for credit losses does not include the allowance relating to any securitization exposures and
exposures relating to funds, the allowance relating to these exposures is not excluded from both the general allowance for credit
losses and the allowance for loans to specific foreign borrowers, owing to the fact that MUFG does not manage provisioning with
respect to each asset class based on Basel III.
2. Industry classifications apply primarily to allowances related to exposures held by the Bank of Tokyo-Mitsubishi UFJ and Mitsubishi
UFJ Trust and Banking (both on a non-consolidated basis). The bulk of provisions relating to exposures held by other subsidiaries
are included in the “Others” category.
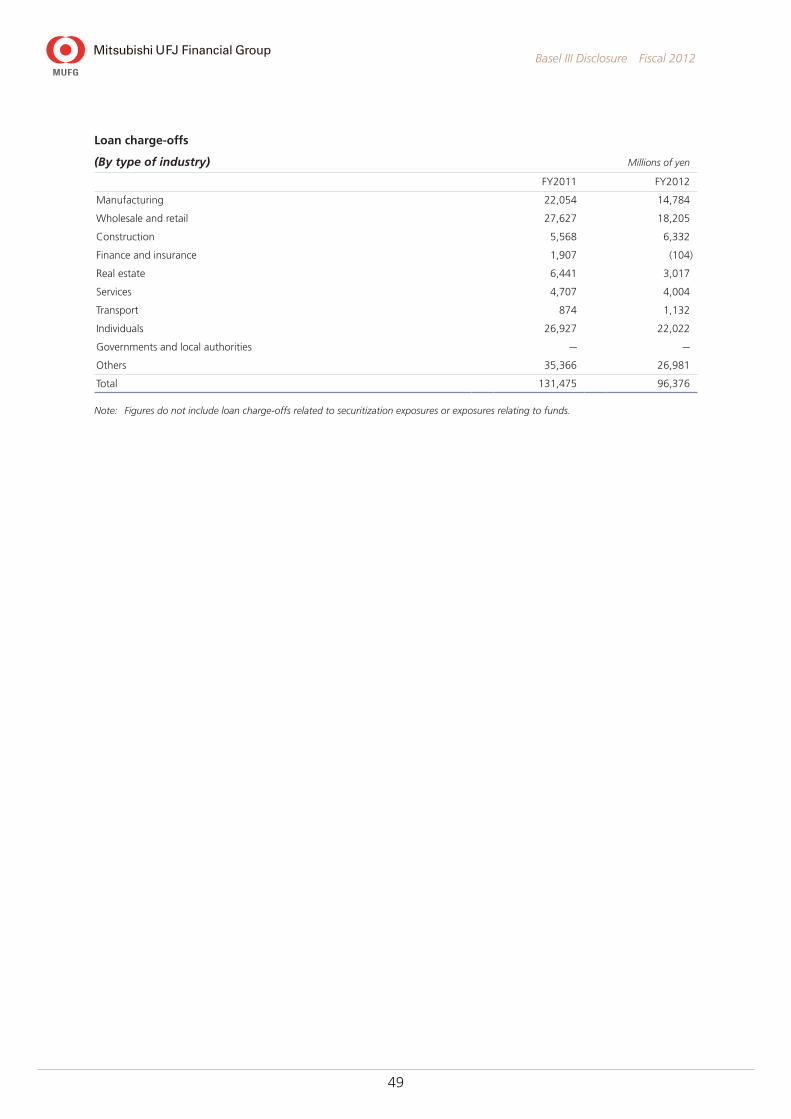
49
Basel III Disclosure Fiscal 2012
Loan charge-offs
(By type of industry) Millions of yen
FY2011 FY2012
Manufacturing 22,054 14,784
Wholesale and retail 27,627 18,205
Construction 5,568 6,332
Finance and insurance 1,907 (104)
Real estate 6,441 3,017
Services 4,707 4,004
Transport 874 1,132
Individuals 26,927 22,022
Governments and local authorities — —
Others 35,366 26,981
Total 131,475 96,376
Note: Figures do not include loan charge-offs related to securitization exposures or exposures relating to funds.

50
Basel III Disclosure Fiscal 2012
Balances by risk weight category of exposures under the Standardized Approach Billions of yen
March 31, 2012 March 31, 2013
Balances
Of which: balances for which risk weights
are determined by external rating Balances
Of which: balances for which risk weights
are determined by external rating
Risk weight: 0% 2,241.3 902.7 2,874.1 1,147.4
Risk weight: 10% 200.5 — 234.0 —
Risk weight: 20% 4,862.5 4,641.2 4,641.2 4,382.8
Risk weight: 35% 1,506.3 — 1,872.2 —
Risk weight: 50% 159.1 158.9 326.5 326.3
Risk weight: 75% 1,087.8 — 1,250.8 —
Risk weight: 100% 8,645.7 115.9 10,608.7 122.7
Risk weight: 150% 61.3 0.3 52.1 0.0
Risk weight: 625% — — 0.0 —
Risk weight: 937.5% 0.0 — — —
Risk weight: 1,250% — — 6.8 —
Capital deductions 11.1 — — —
Others (Note 3) 5.3 — 4.3 —
Total 18,781.4 5,819.3 21,871.1 5,979.3
Notes: 1. Figures are taking into account the effects of credit risk mitigation techniques.
2. Figures do not contain any securitization exposures.
3. “Others” includes investment funds leveraged by debt loans, etc., for which the weighted average risk weight was 220% as of
March 31, 2012 and 224% as of March 31, 2013.
Exposures subject to the IRB Approach: specialized lending exposures subject to supervisory slotting criteria and equity exposures subject to the Market-Based Approach (simple risk weight method) Billions of yen
March 31, 2012 March 31, 2013
Specialized lending exposures subject to
supervisory slotting criteria 272.2 320.7
Risk weight: 50% 27.0 10.0
Risk weight: 70% 82.4 106.4
Risk weight: 90% 13.0 86.3
Risk weight: 95% 49.3 28.7
Risk weight: 115% 45.0 24.5
Risk weight: 120% 3.8 1.0
Risk weight: 140% 1.1 37.4
Risk weight: 250% 50.1 26.0
Risk weight: 0% 0.0 —
Equity exposures subject to the Market-Based Approach
(simple risk weight method) 212.9 241.0
Risk weight: 300% 44.0 64.5
Risk weight: 400% 168.8 176.4

51
Basel III Disclosure Fiscal 2012
Exposures subject to the IRB Approach: corporate exposures Billions of yen
March 31, 2012
EAD
On balance sheet EAD
Off balance sheet EAD
Credit rating
Amount of undrawn
commitments
Weighted average factor
on undrawn commitments
Other off balance
sheet EAD
Borrower ratings 1~3 25,691.4 17,070.8 8,620.6 10,594.7 56.92% 2,589.5
Borrower ratings 4~9 38,756.3 33,242.5 5,513.7 5,570.7 57.12% 2,331.8
Borrower ratings 10~11 4,899.9 4,230.9 669.0 313.8 57.47% 488.6
Borrower ratings 12~15 1,787.3 1,694.6 92.7 10.3 56.67% 86.8
March 31, 2012
Credit rating
Weighted average
PD
Weighted average
LGD
Weighted average
EL default
Weighted average
RW
Borrower ratings 1~3 0.15% 36.63% — 26.51%
Borrower ratings 4~9 0.85% 32.66% — 53.16%
Borrower ratings 10~11 13.03% 28.36% — 132.90%
Borrower ratings 12~15 100.00% 47.10% 44.13% 41.29%
Billions of yen
March 31, 2013
EAD
On balance sheet EAD
Off balance sheet EAD
Credit rating
Amount of undrawn
commitments
Weighted average factor
on undrawn commitments
Other off balance
sheet EAD
Borrower ratings 1~3 28,656.7 18,538.6 10,118.0 12,628.3 56.57% 2,974.0
Borrower ratings 4~9 40,412.4 34,254.6 6,157.7 6,679.4 56.75% 2,367.3
Borrower ratings 10~11 5,455.4 4,863.0 592.3 348.0 56.87% 394.4
Borrower ratings 12~15 1,857.7 1,800.7 57.0 11.3 56.51% 50.6
March 31, 2013
Credit rating
Weighted average
PD
Weighted average
LGD
Weighted average
EL default
Weighted average
RW
Borrower ratings 1~3 0.11% 35.10% — 24.62%
Borrower ratings 4~9 0.85% 29.95% — 49.56%
Borrower ratings 10~11 11.54% 25.82% — 117.20%
Borrower ratings 12~15 100.00% 41.24% 38.07% 47.43%
Notes: 1. Figures exclude specialized lending exposures subject to supervisory slotting criteria and any exposures relating to funds.
2. Weighted average PD and weighted average LGD represent weighted average figures based on EAD.
3. RW stands for risk weight. Risk weight is calculated by dividing the amount of credit risk-weighted assets by EAD, and does not
include any expected losses. Note that credit risk-weighted asset amounts are multiplied by 1.06.

52
Basel III Disclosure Fiscal 2012
Exposures subject to the IRB Approach: sovereign exposures Billions of yen
March 31, 2012
EAD
On balance sheet EAD
Off balance sheet EAD
Credit rating
Amount of undrawn
commitments
Weighted average factor
on undrawn commitments
Other off balance
sheet EAD
Borrower ratings 1~3 88,387.1 74,573.6 13,813.4 994.9 56.67% 13,249.6
Borrower ratings 4~9 370.0 339.6 30.3 25.1 56.67% 16.1
Borrower ratings 10~11 208.4 203.6 4.8 3.8 56.67% 2.6
Borrower ratings 12~15 23.7 22.7 0.9 — — 0.9
March 31, 2012
Credit rating
Weighted average
PD
Weighted average
LGD
Weighted average
EL default
Weighted average
RW
Borrower ratings 1~3 0.00% 38.03% — 0.71%
Borrower ratings 4~9 0.71% 32.24% — 43.18%
Borrower ratings 10~11 17.73% 8.38% — 46.23%
Borrower ratings 12~15 100.00% 46.48% 44.20% 31.45%
Billions of yen
March 31, 2013
EAD
On balance sheet EAD
Off balance sheet EAD
Credit rating
Amount of undrawn
commitments
Weighted average factor
on undrawn commitments
Other off balance
sheet EAD
Borrower ratings 1~3 91,383.5 78,185.9 13,197.5 1,188.7 56.30% 12,528.2
Borrower ratings 4~9 418.2 366.7 51.4 63.9 56.30% 15.4
Borrower ratings 10~11 140.7 139.0 1.7 0.5 56.30% 1.4
Borrower ratings 12~15 54.7 53.8 0.8 — — 0.8
March 31, 2013
Credit rating
Weighted average
PD
Weighted average
LGD
Weighted average
EL default
Weighted average
RW
Borrower ratings 1~3 0.00% 35.91% — 0.57%
Borrower ratings 4~9 0.82% 30.33% — 47.03%
Borrower ratings 10~11 15.77% 5.39% — 30.25%
Borrower ratings 12~15 100.00% 14.62% 8.11% 22.19%

53
Basel III Disclosure Fiscal 2012
Exposures subject to the IRB Approach: bank exposures Billions of yen
March 31, 2012
EAD
On balance sheet EAD
Off balance sheet EAD
Credit rating
Amount of undrawn
commitments
Weighted average factor
on undrawn commitments
Other off balance
sheet EAD
Borrower ratings 1~3 5,753.4 3,012.7 2,740.6 175.0 56.67% 2,641.4
Borrower ratings 4~9 2,104.4 1,417.8 686.5 78.7 56.99% 641.6
Borrower ratings 10~11 266.7 131.9 134.7 0.5 60.85% 134.4
Borrower ratings 12~15 1.9 1.9 — — — —
March 31, 2012
Credit rating
Weighted average
PD
Weighted average
LGD
Weighted average
EL default
Weighted average
RW
Borrower ratings 1~3 0.12% 32.32% — 20.62%
Borrower ratings 4~9 0.40% 33.94% — 34.19%
Borrower ratings 10~11 13.03% 33.54% — 94.20%
Borrower ratings 12~15 100.00% 79.91% 78.77% 15.09%
Billions of yen
March 31, 2013
EAD
On balance sheet EAD
Off balance sheet EAD
Credit rating
Amount of undrawn
commitments
Weighted average factor
on undrawn commitments
Other off balance
sheet EAD
Borrower ratings 1~3 4,804.7 2,535.1 2,269.5 287.5 56.30% 2,107.6
Borrower ratings 4~9 2,974.9 1,545.0 1,429.8 134.3 55.80% 1,354.9
Borrower ratings 10~11 149.5 30.5 118.9 — — 118.9
Borrower ratings 12~15 1.5 1.5 — — — —
March 31, 2013
Credit rating
Weighted average
PD
Weighted average
LGD
Weighted average
EL default
Weighted average
RW
Borrower ratings 1~3 0.10% 31.72% — 24.75%
Borrower ratings 4~9 0.36% 29.50% — 38.82%
Borrower ratings 10~11 13.31% 30.56% — 158.82%
Borrower ratings 12~15 100.00% 79.08% 80.57% 22.52%

54
Basel III Disclosure Fiscal 2012
Exposures subject to the IRB Approach: equity exposures under PD/LGD Approach Billions of yen
March 31, 2012
Credit ratingAmount
of exposuresWeighted average
PDWeighted average
RW
Borrower ratings 1~3 460.2 0.12% 145.55%
Borrower ratings 4~9 206.8 1.83% 262.68%
Borrower ratings 10~11 4.0 9.66% 460.00%
Borrower ratings 12~15 1.0 100.00% /
Billions of yen
March 31, 2013
Credit ratingAmount
of exposuresWeighted average
PDWeighted average
RW
Borrower ratings 1~3 522.7 0.10% 152.20%
Borrower ratings 4~9 1,179.6 0.49% 188.01%
Borrower ratings 10~11 6.4 8.97% 557.52%
Borrower ratings 12~15 1.2 100.00% 1,192.50%
Note: Figures exclude any equity exposures based on calculations where credit risk asset values are assessed using the Market-Based
Approach as well as any equity exposures where a 100% risk weight is applied based on the transitional arrangements stipulated in
Article 13 of the Supplementary Provisions to the FSA Consolidated Capital Adequacy Notification.

55
Basel III Disclosure Fiscal 2012
Exposures subject to the IRB Approach: retail exposures Billions of yen
March 31, 2012
EAD
On balance sheet EAD
Off balance sheet EAD
Amount of undrawn
commitments
Weighted average factor
on undrawn commitments
Other off balance
sheet EAD
Residential mortgage 14,064.0 13,708.7 355.3 — — 355.3
Non-defaulted 13,698.3 13,347.6 350.6 — — 350.6
Defaulted 365.7 361.1 4.6 — — 4.6
Qualifying revolving retail 4,788.1 1,404.3 3,383.7 17,634.2 18.90% 51.4
Non-defaulted 4,641.1 1,257.7 3,383.4 17,630.2 18.90% 51.1
Defaulted 146.9 146.6 0.3 3.9 0.00% 0.3
Other retail (non-business) 2,215.3 928.9 1,286.4 4,377.3 14.44% 654.4
Non-defaulted 1,979.7 702.3 1,277.4 4,371.6 14.46% 645.3
Defaulted 235.6 226.6 9.0 5.7 0.05% 9.0
Other retail (business-related) 1,816.5 1,746.7 69.7 127.0 25.87% 36.8
Non-defaulted 1,805.1 1,735.8 69.2 127.0 25.87% 36.3
Defaulted 11.4 10.9 0.4 — — 0.4
March 31, 2012
Number of pools
Weighted average PD
Weighted average LGD
Weighted average EL default
Weighted average RW
Residential mortgage 91 3.52% 41.90% — 38.02%
Non-defaulted 65 0.96% 41.95% — 38.15%
Defaulted 26 99.43% 40.11% 37.45% 33.44%
Qualifying revolving retail 72 3.97% 74.91% — 20.67%
Non-defaulted 55 0.93% 75.05% — 21.16%
Defaulted 17 100.00% 70.54% 78.72% 5.05%
Other retail (non-business) 176 12.57% 40.74% — 51.10%
Non-defaulted 107 2.17% 39.72% — 55.30%
Defaulted 69 99.99% 49.26% 48.85% 15.76%
Other retail (business-related) 45 5.93% 28.50% — 39.68%
Non-defaulted 29 5.33% 28.27% — 39.63%
Defaulted 16 100.00% 65.02% 64.89% 47.95%
Note: In cases where purchased receivables are included, the weighted average PD reflects not only the PD but also a figure for which the
annual expected loss corresponding to the dilution risk is prorated.
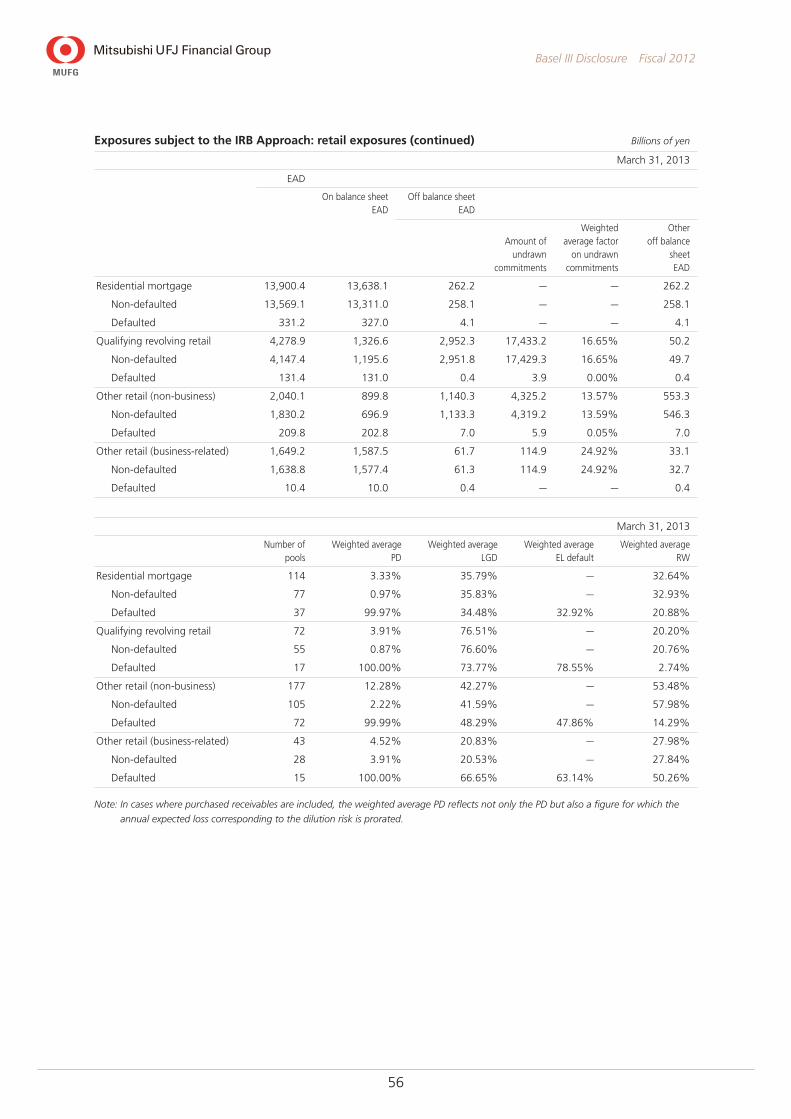
56
Basel III Disclosure Fiscal 2012
Exposures subject to the IRB Approach: retail exposures (continued) Billions of yen
March 31, 2013
EAD
On balance sheet EAD
Off balance sheet EAD
Amount of undrawn
commitments
Weighted average factor
on undrawn commitments
Other off balance
sheet EAD
Residential mortgage 13,900.4 13,638.1 262.2 — — 262.2
Non-defaulted 13,569.1 13,311.0 258.1 — — 258.1
Defaulted 331.2 327.0 4.1 — — 4.1
Qualifying revolving retail 4,278.9 1,326.6 2,952.3 17,433.2 16.65% 50.2
Non-defaulted 4,147.4 1,195.6 2,951.8 17,429.3 16.65% 49.7
Defaulted 131.4 131.0 0.4 3.9 0.00% 0.4
Other retail (non-business) 2,040.1 899.8 1,140.3 4,325.2 13.57% 553.3
Non-defaulted 1,830.2 696.9 1,133.3 4,319.2 13.59% 546.3
Defaulted 209.8 202.8 7.0 5.9 0.05% 7.0
Other retail (business-related) 1,649.2 1,587.5 61.7 114.9 24.92% 33.1
Non-defaulted 1,638.8 1,577.4 61.3 114.9 24.92% 32.7
Defaulted 10.4 10.0 0.4 — — 0.4
March 31, 2013
Number of pools
Weighted average PD
Weighted average LGD
Weighted average EL default
Weighted average RW
Residential mortgage 114 3.33% 35.79% — 32.64%
Non-defaulted 77 0.97% 35.83% — 32.93%
Defaulted 37 99.97% 34.48% 32.92% 20.88%
Qualifying revolving retail 72 3.91% 76.51% — 20.20%
Non-defaulted 55 0.87% 76.60% — 20.76%
Defaulted 17 100.00% 73.77% 78.55% 2.74%
Other retail (non-business) 177 12.28% 42.27% — 53.48%
Non-defaulted 105 2.22% 41.59% — 57.98%
Defaulted 72 99.99% 48.29% 47.86% 14.29%
Other retail (business-related) 43 4.52% 20.83% — 27.98%
Non-defaulted 28 3.91% 20.53% — 27.84%
Defaulted 15 100.00% 66.65% 63.14% 50.26%
Note: In cases where purchased receivables are included, the weighted average PD reflects not only the PD but also a figure for which the
annual expected loss corresponding to the dilution risk is prorated.

57
Basel III Disclosure Fiscal 2012
Comparison of estimated and actual losses for exposures subject to the IRB Approach Millions of yen
Corporate exposures
Sovereign exposures
Bank exposures
Equity exposures
under PD/LGD Approach
Residential mortgage exposures
Qualifying revolving
retail exposures
Other retail exposures
FY2006 actual losses 23,025 (1,571) (6,941) 84 26,725 — 5,940FY2006 estimated losses 1,235,407 18,106 14,417 173,180 62,968 — 108,173
Initial EAD 72,143,293 43,809,530 16,865,540 375,755 14,985,264 — 5,648,325Estimated weighted average PD 3.91% 0.09% 0.19% 51.21% 1.17% — 5.21%Estimated weighted average LGD 43.74% 44.79% 45.16% 90.00% 36.05% — 36.78%
FY2007 actual losses 70,776 (499) (52) 2,063 12,645 — 6,058 FY2007 estimated losses 1,200,881 13,051 15,572 96,176 76,518 — 121,380
Initial EAD 66,584,415 39,998,750 19,100,674 520,689 13,705,023 — 5,469,071Estimated weighted average PD 4.12% 0.07% 0.17% 20.52% 1.50% — 5.60%Estimated weighted average LGD 43.75% 44.96% 45.28% 90.00% 37.78% — 39.56%
FY2008 actual losses 367,111 (353) 24,309 66,906 26,218 — 52,879FY2008 estimated losses 993,791 18,389 24,850 94,474 89,938 — 112,090
Initial EAD 70,710,242 37,890,290 19,877,135 632,858 14,243,086 — 5,099,330Estimated weighted average PD 3.19% 0.10% 0.25% 16.58% 1.44% — 5.27%Estimated weighted average LGD 43.75% 44.96% 41.89% 90.00% 44.05% — 41.63%
FY2009 actual losses 374,658 (118) 23,631 2,162 28,922 2,817 20,190 FY2009 estimated losses 1,040,595 47,332 39,863 27,827 101,070 11,784 86,698
Initial EAD 74,113,431 55,115,408 12,125,418 1,382,457 14,240,099 741,843 3,877,135 Estimated weighted average PD 3.78% 0.23% 0.88% 2.24% 1.66% 2.20% 5.98%Estimated weighted average LGD 36.98% 38.47% 37.47% 90.00% 43.02% 72.32% 37.34%
FY2010 actual losses 161,997 (298) (6,725) 238 27,687 62,514 23,460FY2010 estimated losses 1,202,669 31,084 38,243 7,631 143,096 210,666 171,435
Initial EAD 70,981,831 65,386,649 11,189,296 1,531,399 14,527,802 5,354,803 4,809,516 Estimated weighted average PD 4.42% 0.12% 0.84% 0.55% 2.29% 4.74% 6.87%Estimated weighted average LGD 38.14% 40.86% 40.48% 90.00% 43.13% 82.68% 44.89%
FY2011 actual losses 144,305 (214) (4) 93 29,023 18,693 23,826FY2011 estimated losses 1,125,141 29,294 29,545 7,597 216,949 164,990 182,613
Initial EAD 66,989,253 88,407,803 12,816,541 1,500,479 14,368,724 4,706,299 4,739,835Estimated weighted average PD 4.39% 0.08% 0.58% 0.56% 3.27% 4.62% 7.89%Estimated weighted average LGD 37.97% 41.17% 39.48% 90.00% 46.17% 75.77% 42.54%
Interim FY2012 actual losses 62,993 (201) 0 8,516 13,340 6,795 1,465Interim FY2012 estimated losses (Note 4) 951,689 25,146 20,163 5,194 206,700 142,764 157,993
Initial EAD 71,463,314 88,940,300 10,391,449 672,201 14,064,062 4,788,117 4,022,364Estimated weighted average PD 3.91% 0.08% 0.58% 0.86% 3.52% 3.97% 9.37%Estimated weighted average LGD 34.13% 37.94% 33.47% 90.00% 41.83% 75.17% 35.19%
Interim FY2012: Discussion of the factors
Actual losses on exposures were lower than initial estimated losses, reflecting repayments on defaulted exposures and other factors such as loan normalization.
Notes: 1. Actual losses include the following amounts related to defaulted exposures: write-offs against allowances, losses on the disposal
of claims, debt forgiveness or loan waivers, and impairment losses on securities. Actual losses incurred by Mitsubishi UFJ Trust and
Banking Corporation equal the aggregate figures for the banking account and for trust accounts for which repayment of the
principal to the customers is guaranteed.
2. The initial EAD under FY2006 estimated losses was used for a preliminary calculation under the FIRB Approach at the end of
March 2006, and was not used to calculate an official figure of capital adequacy ratio.
3. Estimates for PD and LGD under FY2006 estimated losses were used for preliminary calculations under the FIRB Approach at the
end of September 2006, and were not used to calculate official figures of capital adequacy ratio. Estimates for PD and LGD that
were used for preliminary calculations under the FIRB Approach at the end of March 2006 were not used, because such estimates
included temporary factors due to the merger of Mitsubishi Tokyo Financial Group, Inc. with UFJ Holdings, Inc.
4. Estimated losses for Interim FY2012 represent the anticipated losses for the full year estimated at the beginning of the fiscal year.

58
Basel III Disclosure Fiscal 2012
Credit Risk Mitigation
Exposures subject to application of credit risk mitigation techniques Billions of yen
March 31, 2012
Eligible financial collateral Guarantees
Credit derivatives
Portfolios under the AIRB Approach / 5,277.0 237.5
Corporate exposures / 3,501.5 230.1
Sovereign exposures / 553.3 4.9
Bank exposures / 664.6 2.3
Residential mortgage exposures / — —
Qualifying revolving retail exposures / — —
Other retail exposures / 557.4 —
Portfolios under the Standardized Approach 4,625.3 256.2 —
Billions of yen
March 31, 2013
Eligible financial collateral Guarantees
Credit derivatives
Portfolios under the AIRB Approach / 5,415.5 168.3
Corporate exposures / 3,753.4 158.4
Sovereign exposures / 510.0 7.1
Bank exposures / 669.5 2.7
Residential mortgage exposures / — —
Qualifying revolving retail exposures / — —
Other retail exposures / 482.5 —
Portfolios under the Standardized Approach 7,628.9 181.2 —
Note: Eligible financial collateral includes collateral for repo transactions but does not include deposits in our banks subject to on balance
sheet netting.
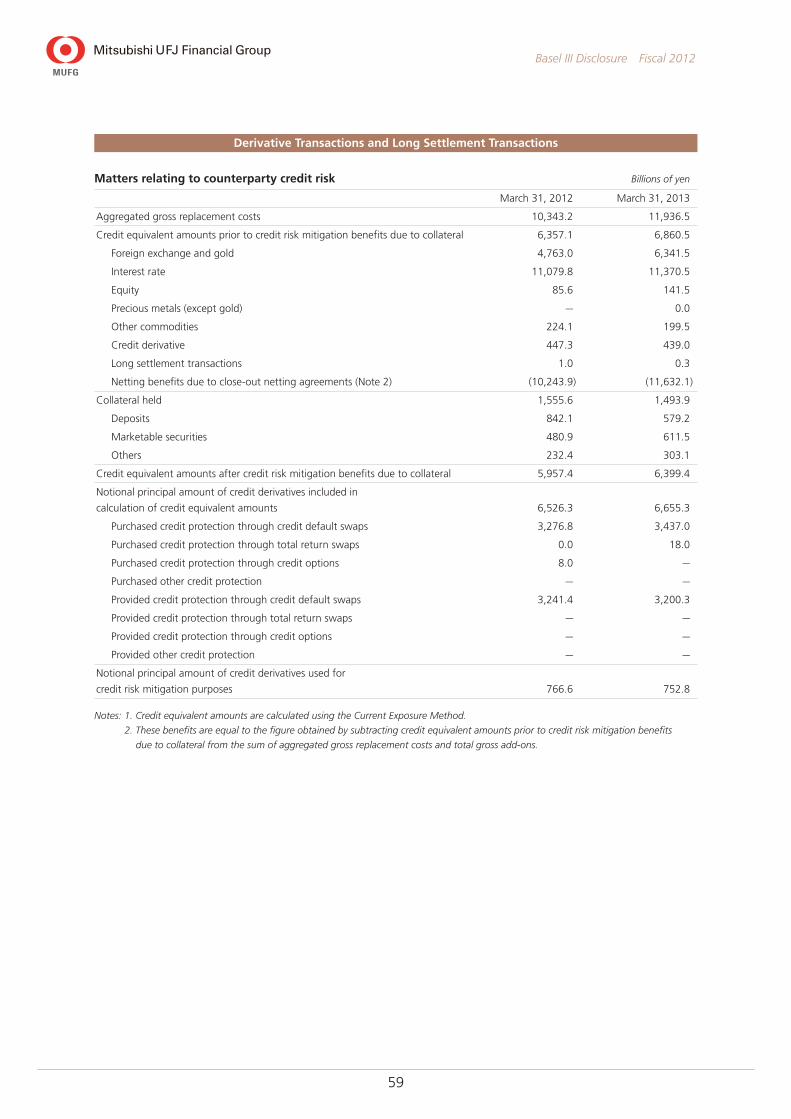
59
Basel III Disclosure Fiscal 2012
Derivative Transactions and Long Settlement Transactions
Matters relating to counterparty credit risk Billions of yen
March 31, 2012 March 31, 2013
Aggregated gross replacement costs 10,343.2 11,936.5
Credit equivalent amounts prior to credit risk mitigation benefits due to collateral 6,357.1 6,860.5
Foreign exchange and gold 4,763.0 6,341.5
Interest rate 11,079.8 11,370.5
Equity 85.6 141.5
Precious metals (except gold) — 0.0
Other commodities 224.1 199.5
Credit derivative 447.3 439.0
Long settlement transactions 1.0 0.3
Netting benefits due to close-out netting agreements (Note 2) (10,243.9) (11,632.1)
Collateral held 1,555.6 1,493.9
Deposits 842.1 579.2
Marketable securities 480.9 611.5
Others 232.4 303.1
Credit equivalent amounts after credit risk mitigation benefits due to collateral 5,957.4 6,399.4
Notional principal amount of credit derivatives included in
calculation of credit equivalent amounts 6,526.3 6,655.3
Purchased credit protection through credit default swaps 3,276.8 3,437.0
Purchased credit protection through total return swaps 0.0 18.0
Purchased credit protection through credit options 8.0 —
Purchased other credit protection — —
Provided credit protection through credit default swaps 3,241.4 3,200.3
Provided credit protection through total return swaps — —
Provided credit protection through credit options — —
Provided other credit protection — —
Notional principal amount of credit derivatives used for
credit risk mitigation purposes 766.6 752.8
Notes: 1. Credit equivalent amounts are calculated using the Current Exposure Method.
2. These benefits are equal to the figure obtained by subtracting credit equivalent amounts prior to credit risk mitigation benefits
due to collateral from the sum of aggregated gross replacement costs and total gross add-ons.

60
Basel III Disclosure Fiscal 2012
Securitization Exposures (Subject to calculation of credit risk assets)
Information on underlying assets Billions of yen
March 31, 2012 FY2011
Amount of underlying assets at period-end (Note 1)
Cumulative amount of underlying assets in default or contractually
past due 3 months or more
Underlying assets relating to
retained securitization
exposures
Underlying assets relating to
securitization transactions
during this period with no retained
securitization exposures (Note 2)
Underlying assets relating to
retained securitization
exposures
Underlying assets relating to
securitization transactions
during this period with no retained
securitization exposures (Note 3)
Losses on underlying assets
incurred during this period (Note 4)
Traditional securitizations
(asset transfer type) 1,918.7 — 19.1 — 7.9
Residential mortgage 1,742.4 — 19.1 — 7.8
Apartment loan 118.5 — — — 0.0
Credit card receivables — — — — —
Other assets 57.8 — 0.0 — —
Synthetic securitizations — — — — —
Residential mortgage — — — — —
Apartment loan — — — — —
Credit card receivables — — — — —
Other assets — — — — —
Sponsor of asset-backed
commercial paper (ABCP) program 23,049.8 — 396.8 688.7 716.9
Residential mortgage — — — — —
Apartment loan — — — — —
Credit card receivables 13,624.5 — 221.3 306.5 582.5
Account receivables 6,357.8 — 166.5 365.9 124.9
Leasing receivables 772.3 — 0.0 0.0 4.6
Other assets 2,295.0 — 8.9 16.1 4.7
Total as an originator 24,968.5 — 416.0 688.7 724.8
Notes: 1. The amount of underlying assets relating to sponsor of ABCP programs includes underlying assets related to ABCP programs
sponsored by multiple financial institutions, including certain consolidated subsidiaries of MUFG.
2. The amount of underlying assets refers only to those cases in which the securitization exposures associated with a securitization
conducted during this period were wholly transferred to third parties.
3. Figures show cumulative totals for this period of underlying assets either in default or contractually past due 3 months or more
arising from securitization transactions in cases where the securitization exposures associated with a transaction conducted
during this period was wholly transferred to third parties, or where no exposure was retained at the end of this period from a
securitization conducted during this period due to related maturity.
4. Losses with traditional or synthetic securitizations are based on the projected accounting losses for holding the underlying assets
without conducting the relevant securitization. With sponsor of ABCP programs, since it is extremely rare for such schemes to
result in losses on any retained securitization exposure, it is difficult to obtain generally relevant information relating to losses as
based on certain definitions. These figures therefore aggregate cases where actual economic losses have been recognized with
cases where the loss has been valued on the same basis as the underlying defaulted assets. Losses on underlying assets relating to
sponsor of ABCP programs differ from losses incurred by MUFG.
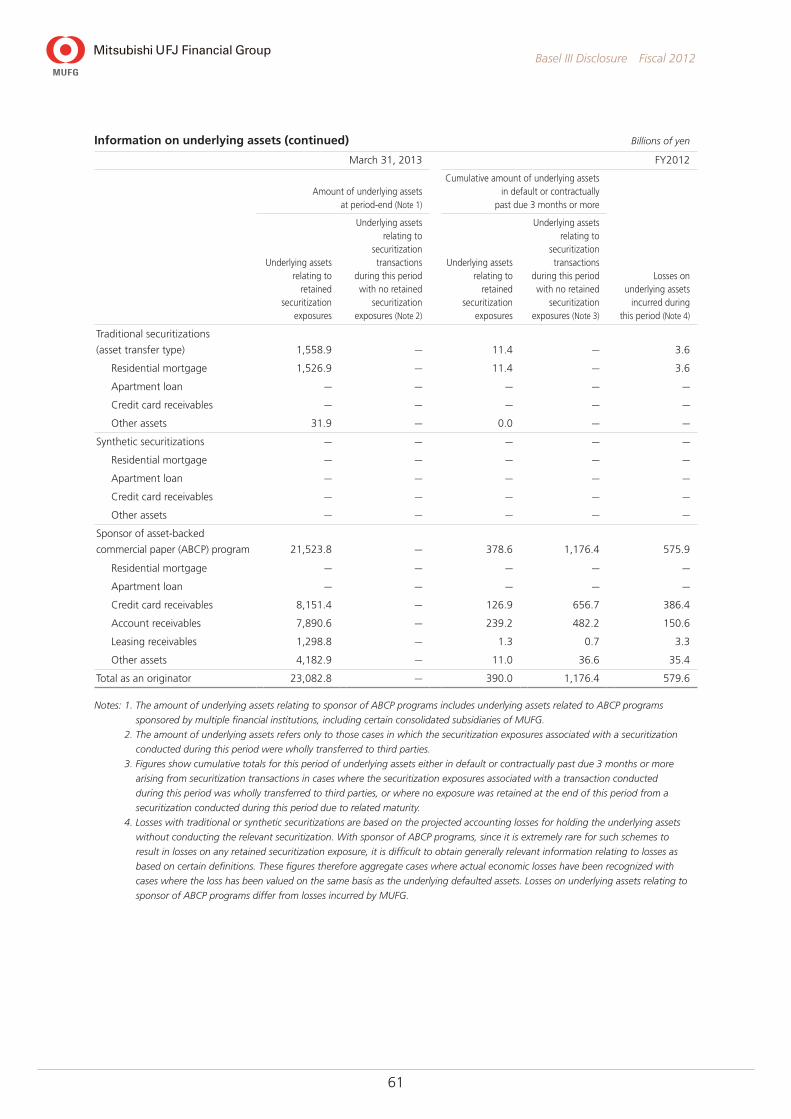
61
Basel III Disclosure Fiscal 2012
Information on underlying assets (continued) Billions of yen
March 31, 2013 FY2012
Amount of underlying assets at period-end (Note 1)
Cumulative amount of underlying assets in default or contractually
past due 3 months or more
Underlying assets relating to
retained securitization
exposures
Underlying assets relating to
securitization transactions
during this period with no retained
securitization exposures (Note 2)
Underlying assets relating to
retained securitization
exposures
Underlying assets relating to
securitization transactions
during this period with no retained
securitization exposures (Note 3)
Losses on underlying assets
incurred during this period (Note 4)
Traditional securitizations
(asset transfer type) 1,558.9 — 11.4 — 3.6
Residential mortgage 1,526.9 — 11.4 — 3.6
Apartment loan — — — — —
Credit card receivables — — — — —
Other assets 31.9 — 0.0 — —
Synthetic securitizations — — — — —
Residential mortgage — — — — —
Apartment loan — — — — —
Credit card receivables — — — — —
Other assets — — — — —
Sponsor of asset-backed
commercial paper (ABCP) program 21,523.8 — 378.6 1,176.4 575.9
Residential mortgage — — — — —
Apartment loan — — — — —
Credit card receivables 8,151.4 — 126.9 656.7 386.4
Account receivables 7,890.6 — 239.2 482.2 150.6
Leasing receivables 1,298.8 — 1.3 0.7 3.3
Other assets 4,182.9 — 11.0 36.6 35.4
Total as an originator 23,082.8 — 390.0 1,176.4 579.6
Notes: 1. The amount of underlying assets relating to sponsor of ABCP programs includes underlying assets related to ABCP programs
sponsored by multiple financial institutions, including certain consolidated subsidiaries of MUFG.
2. The amount of underlying assets refers only to those cases in which the securitization exposures associated with a securitization
conducted during this period were wholly transferred to third parties.
3. Figures show cumulative totals for this period of underlying assets either in default or contractually past due 3 months or more
arising from securitization transactions in cases where the securitization exposures associated with a transaction conducted
during this period was wholly transferred to third parties, or where no exposure was retained at the end of this period from a
securitization conducted during this period due to related maturity.
4. Losses with traditional or synthetic securitizations are based on the projected accounting losses for holding the underlying assets
without conducting the relevant securitization. With sponsor of ABCP programs, since it is extremely rare for such schemes to
result in losses on any retained securitization exposure, it is difficult to obtain generally relevant information relating to losses as
based on certain definitions. These figures therefore aggregate cases where actual economic losses have been recognized with
cases where the loss has been valued on the same basis as the underlying defaulted assets. Losses on underlying assets relating to
sponsor of ABCP programs differ from losses incurred by MUFG.
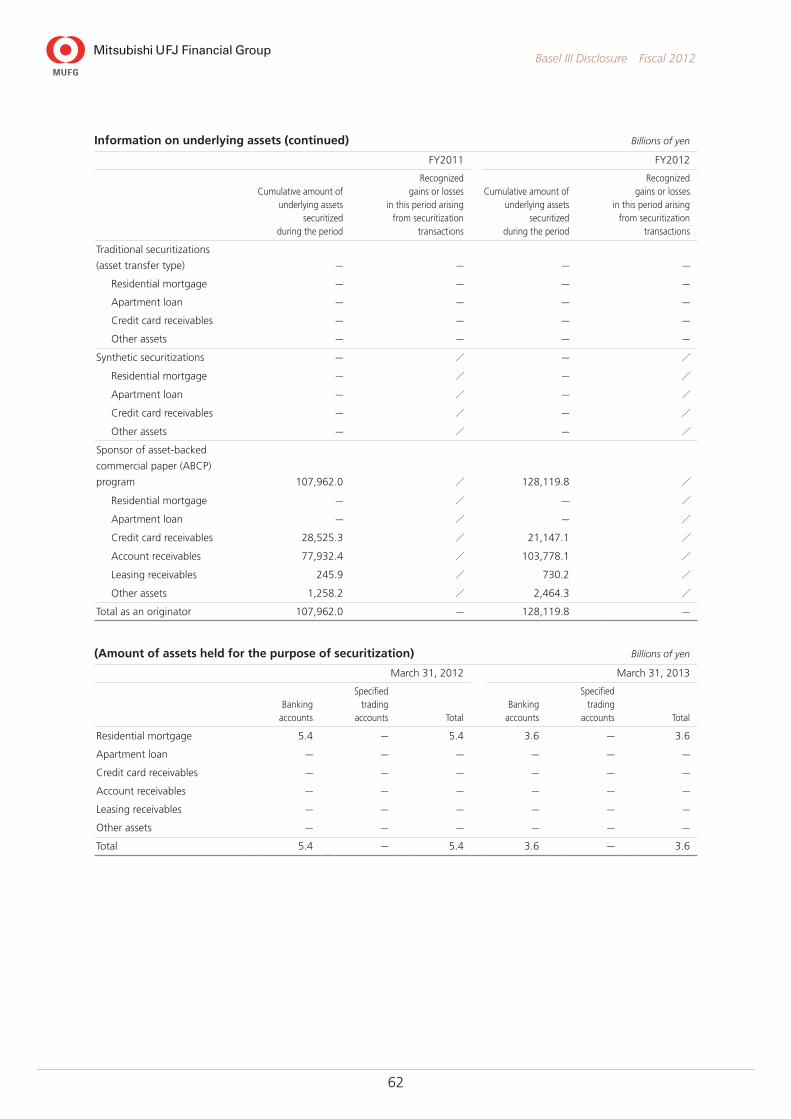
62
Basel III Disclosure Fiscal 2012
Information on underlying assets (continued) Billions of yen
FY2011 FY2012
Cumulative amount of underlying assets
securitized during the period
Recognized gains or losses
in this period arising from securitization
transactions
Cumulative amount of underlying assets
securitized during the period
Recognized gains or losses
in this period arising from securitization
transactions
Traditional securitizations
(asset transfer type) — — — —
Residential mortgage — — — —
Apartment loan — — — —
Credit card receivables — — — —
Other assets — — — —
Synthetic securitizations — / — /
Residential mortgage — / — /
Apartment loan — / — /
Credit card receivables — / — /
Other assets — / — /
Sponsor of asset-backed
commercial paper (ABCP)
program 107,962.0 / 128,119.8 /
Residential mortgage — / — /
Apartment loan — / — /
Credit card receivables 28,525.3 / 21,147.1 /
Account receivables 77,932.4 / 103,778.1 /
Leasing receivables 245.9 / 730.2 /
Other assets 1,258.2 / 2,464.3 /
Total as an originator 107,962.0 — 128,119.8 —
(Amount of assets held for the purpose of securitization) Billions of yen
March 31, 2012 March 31, 2013
Banking accounts
Specified trading
accounts TotalBanking
accounts
Specified trading
accounts Total
Residential mortgage 5.4 — 5.4 3.6 — 3.6
Apartment loan — — — — — —
Credit card receivables — — — — — —
Account receivables — — — — — —
Leasing receivables — — — — — —
Other assets — — — — — —
Total 5.4 — 5.4 3.6 — 3.6

63
Basel III Disclosure Fiscal 2012
Information on securitization exposures retained (By type of underlying asset) Billions of yen
March 31, 2012
Amount of securitization exposures
Amount of securi-tization exposures
that have been deducted from
Tier 1 capital (Amount equiva-
lent to increase in capital) (Note 1)
Capital deduc-tions related to
securitization exposures
(Note 2)
Other than re-securitization exposure Re-securitization exposure
On balance sheet
Off balance sheet
On balance sheet
Off balance sheet
Total as an originator 3,841.4 472.6 — — 13.4 7.0
Traditional securitizations
(asset transfer type) 639.3 — — — 13.4 7.0
Residential mortgage 495.2 — — — 13.4 1.1
Apartment loan 123.1 — — — — —
Credit card receivables — — — — — —
Other assets 20.9 — — — — 5.8
Synthetic securitizations — — — — — —
Residential mortgage — — — — — —
Apartment loan — — — — — —
Credit card receivables — — — — — —
Other assets — — — — — —
Sponsor of asset-backed
commercial paper (ABCP)
program 3,202.0 472.6 — — — —
Residential mortgage — — — — — —
Apartment loan — — — — — —
Credit card receivables 561.0 173.9 — — — —
Account receivables 1,190.6 247.6 — — — —
Leasing receivables 347.8 8.1 — — — —
Other assets 1,102.5 42.9 — — — —
As an investor 2,201.1 1.3 495.9 — / 18.4
Residential mortgage 778.3 — 5.5 — / 0.4
Apartment loan 53.7 — 5.1 — / —
Credit card receivables 34.2 — — — / —
Corporate loans 943.6 1.3 478.8 — / 3.1
Other assets 391.0 — 6.3 — / 14.9
Notes: 1. The amount of securitization exposures that have been deducted from Tier 1 capital counts as deductions from Tier 1 capital, such
as capital stock, as stipulated by Article 5 of the FSA Holding Company Capital Adequacy Notification, and includes any gains on
disposal of the underlying assets relating to the securitization.
2. Figures listed refer to deductions as stipulated by Basel II. Securitization exposures qualifying as capital deductions include cases
where the credit risk-weighted assets computed using the Supervisory Formula exceed 1,250% or where a rating is lower than a
certain threshold when calculating credit risk-weighted assets under the Ratings-Based Approach.

64
Basel III Disclosure Fiscal 2012
Information on securitization exposures retained (By type of underlying asset) (continued) Billions of yen
March 31, 2013
Amount of securitization exposuresAmount of securi-tization exposures
subject to a risk weight of 1,250%
(Note 1)
Capital deduc-tions related to
securitization exposures
(Note 2)
Other than re-securitization exposure Re-securitization exposure
On balance sheet
Off balance sheet
On balance sheet
Off balance sheet
Total as an originator 4,145.0 539.9 — — 3.2 13.2
Traditional securitizations
(asset transfer type) 507.0 — — — 3.2 13.2
Residential mortgage 490.5 — — — 0.0 13.2
Apartment loan — — — — — —
Credit card receivables — — — — — —
Other assets 16.5 — — — 3.1 —
Synthetic securitizations — — — — — —
Residential mortgage — — — — — —
Apartment loan — — — — — —
Credit card receivables — — — — — —
Other assets — — — — — —
Sponsor of asset-backed
commercial paper (ABCP)
program 3,638.0 539.9 — — — —
Residential mortgage — — — — — —
Apartment loan — — — — — —
Credit card receivables 635.9 85.5 — — — —
Account receivables 1,402.9 306.3 — — — —
Leasing receivables 315.5 51.8 — — — —
Other assets 1,283.6 96.2 — — — —
As an investor 2,966.3 — 560.0 — 12.9 /
Residential mortgage 831.9 — 5.2 — 0.3 /
Apartment loan 37.8 — 1.7 — 1.4 /
Credit card receivables 5.6 — — — — /
Corporate loans 1,447.4 — 547.3 — — /
Other assets 643.3 — 5.7 — 11.0 /
Notes: 1. Figures listed refer to the amounts of exposures subject to a 1,250% risk weight as stipulated in Article 225 of the FSA Holding
Company Capital Adequacy Notification. Securitization exposures subject to a 1,250% risk weight include cases where the credit
risk-weighted assets computed using the Supervisory Formula exceed 1,250% or where a rating is lower than a certain threshold
when calculating credit risk-weighted assets under the Ratings-Based Approach.
2. Figures listed refer to deductions as stipulated by Basel II. Securitization exposures qualifying as capital deductions include cases
where the credit risk-weighted assets computed using the Supervisory Formula exceed 1,250% or where a rating is lower than a
certain threshold when calculating credit risk-weighted assets under the Ratings-Based Approach.
(Securitization exposures subject to early amortization provisions retained)
In line with the provisions of Articles 230 & 248 of the FSA Holding Company Capital Adequacy Notification, as of March 31, 2012
and 2013, there were no securitization exposures subject to early amortization treatment that are retained by external investors and
are used to calculate credit risk-weighted assets.

65
Basel III Disclosure Fiscal 2012
(Amount of securitization exposures retained and the associated capital requirement for these exposures broken down into a number of risk weight bands) Billions of yen
March 31, 2012
Other than re-securitization exposure
Amount of securitization exposures
Capital requirement
On balance sheet
Off balance sheet
On balance sheet
Off balance sheet
Total as an originator 3,841.4 472.6 160.2 6.8
Traditional securitizations (asset transfer type) 639.3 — 89.6 —
Risk weight: to 20% — — — —
Risk weight: over 20% to 50% 10.4 — 0.2 —
Risk weight: over 50% to 100% 149.6 — 11.1 —
Risk weight: over 100% to 250% 428.4 — 52.1 —
Risk weight: over 250% under 1,250% 43.7 — 19.0 —
Risk weight: 1,250% 7.0 — 7.0 —
Synthetic securitizations — — — —
Risk weight: to 20% — — — —
Risk weight: over 20% to 50% — — — —
Risk weight: over 50% to 100% — — — —
Risk weight: over 100% to 250% — — — —
Risk weight: over 250% under 1,250% — — — —
Risk weight: 1,250% — — — —
Sponsor of asset-backed
commercial paper (ABCP) program 3,202.0 472.6 70.6 6.8
Risk weight: to 20% 2,418.8 407.5 17.6 3.4
Risk weight: over 20% to 50% 415.7 49.0 14.6 1.4
Risk weight: over 50% to 100% 204.5 9.5 11.5 0.7
Risk weight: over 100% to 250% 135.0 6.4 17.9 1.2
Risk weight: over 250% under 1,250% 27.8 0.0 8.7 0.0
Risk weight: 1,250% — — — —
As an investor 2,203.9 1.3 46.8 0.0
Risk weight: to 20% 1,918.7 1.3 13.9 0.0
Risk weight: over 20% to 50% 197.8 0.0 5.8 0.0
Risk weight: over 50% to 100% 43.9 — 3.2 —
Risk weight: over 100% to 250% 12.4 — 1.5 —
Risk weight: over 250% under 1,250% 12.4 — 3.7 —
Risk weight: 1,250% 18.4 — 18.4 —
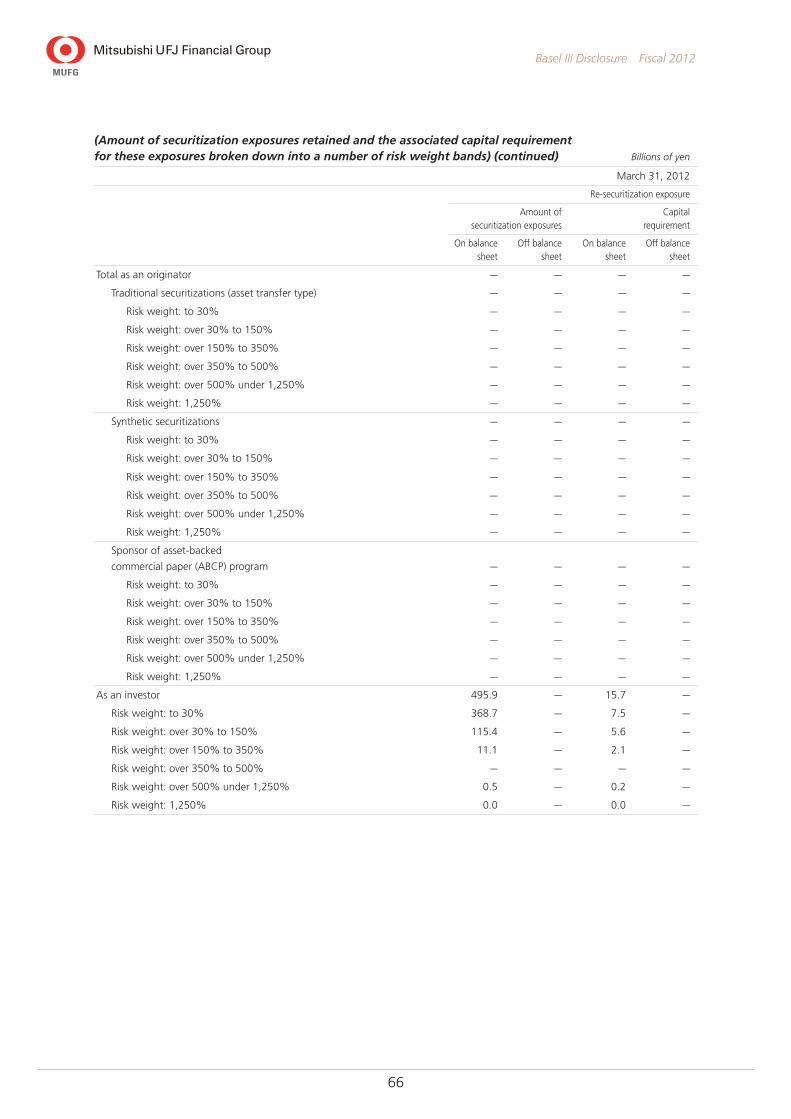
66
Basel III Disclosure Fiscal 2012
(Amount of securitization exposures retained and the associated capital requirement for these exposures broken down into a number of risk weight bands) (continued) Billions of yen
March 31, 2012
Re-securitization exposure
Amount of securitization exposures
Capital requirement
On balance sheet
Off balance sheet
On balance sheet
Off balance sheet
Total as an originator — — — —
Traditional securitizations (asset transfer type) — — — —
Risk weight: to 30% — — — —
Risk weight: over 30% to 150% — — — —
Risk weight: over 150% to 350% — — — —
Risk weight: over 350% to 500% — — — —
Risk weight: over 500% under 1,250% — — — —
Risk weight: 1,250% — — — —
Synthetic securitizations — — — —
Risk weight: to 30% — — — —
Risk weight: over 30% to 150% — — — —
Risk weight: over 150% to 350% — — — —
Risk weight: over 350% to 500% — — — —
Risk weight: over 500% under 1,250% — — — —
Risk weight: 1,250% — — — —
Sponsor of asset-backed
commercial paper (ABCP) program — — — —
Risk weight: to 30% — — — —
Risk weight: over 30% to 150% — — — —
Risk weight: over 150% to 350% — — — —
Risk weight: over 350% to 500% — — — —
Risk weight: over 500% under 1,250% — — — —
Risk weight: 1,250% — — — —
As an investor 495.9 — 15.7 —
Risk weight: to 30% 368.7 — 7.5 —
Risk weight: over 30% to 150% 115.4 — 5.6 —
Risk weight: over 150% to 350% 11.1 — 2.1 —
Risk weight: over 350% to 500% — — — —
Risk weight: over 500% under 1,250% 0.5 — 0.2 —
Risk weight: 1,250% 0.0 — 0.0 —
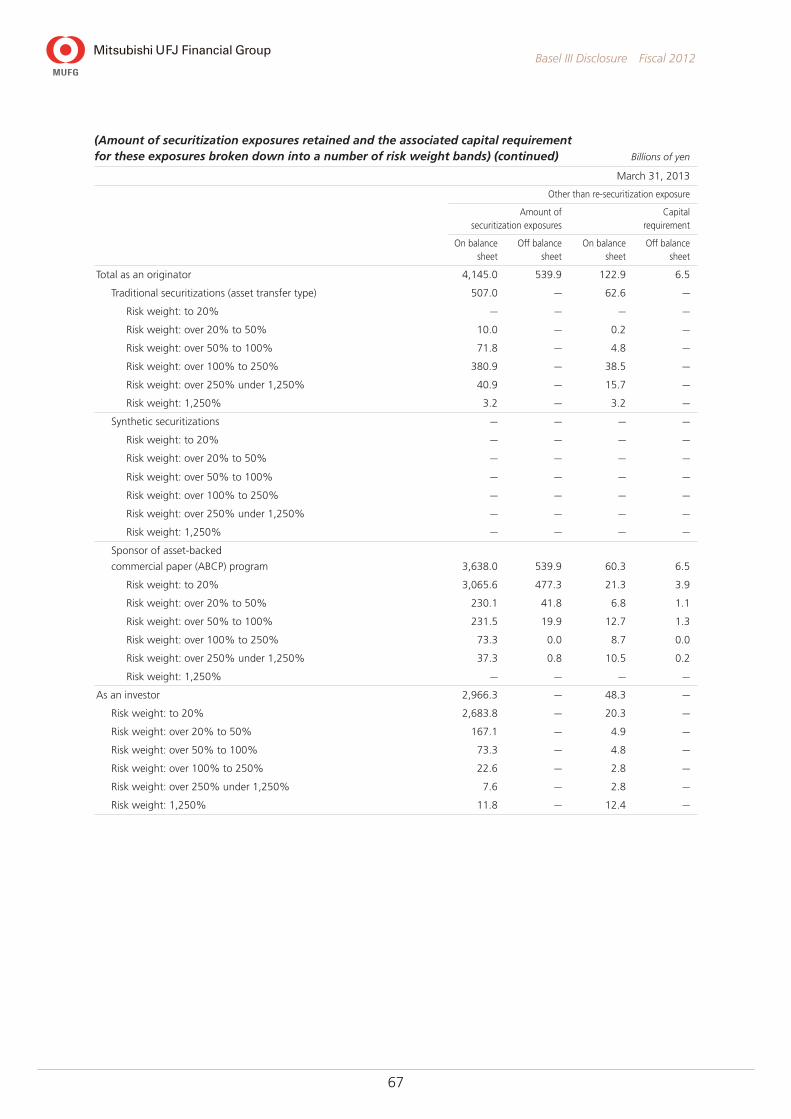
67
Basel III Disclosure Fiscal 2012
(Amount of securitization exposures retained and the associated capital requirement for these exposures broken down into a number of risk weight bands) (continued) Billions of yen
March 31, 2013
Other than re-securitization exposure
Amount of securitization exposures
Capital requirement
On balance sheet
Off balance sheet
On balance sheet
Off balance sheet
Total as an originator 4,145.0 539.9 122.9 6.5
Traditional securitizations (asset transfer type) 507.0 — 62.6 —
Risk weight: to 20% — — — —
Risk weight: over 20% to 50% 10.0 — 0.2 —
Risk weight: over 50% to 100% 71.8 — 4.8 —
Risk weight: over 100% to 250% 380.9 — 38.5 —
Risk weight: over 250% under 1,250% 40.9 — 15.7 —
Risk weight: 1,250% 3.2 — 3.2 —
Synthetic securitizations — — — —
Risk weight: to 20% — — — —
Risk weight: over 20% to 50% — — — —
Risk weight: over 50% to 100% — — — —
Risk weight: over 100% to 250% — — — —
Risk weight: over 250% under 1,250% — — — —
Risk weight: 1,250% — — — —
Sponsor of asset-backed
commercial paper (ABCP) program 3,638.0 539.9 60.3 6.5
Risk weight: to 20% 3,065.6 477.3 21.3 3.9
Risk weight: over 20% to 50% 230.1 41.8 6.8 1.1
Risk weight: over 50% to 100% 231.5 19.9 12.7 1.3
Risk weight: over 100% to 250% 73.3 0.0 8.7 0.0
Risk weight: over 250% under 1,250% 37.3 0.8 10.5 0.2
Risk weight: 1,250% — — — —
As an investor 2,966.3 — 48.3 —
Risk weight: to 20% 2,683.8 — 20.3 —
Risk weight: over 20% to 50% 167.1 — 4.9 —
Risk weight: over 50% to 100% 73.3 — 4.8 —
Risk weight: over 100% to 250% 22.6 — 2.8 —
Risk weight: over 250% under 1,250% 7.6 — 2.8 —
Risk weight: 1,250% 11.8 — 12.4 —
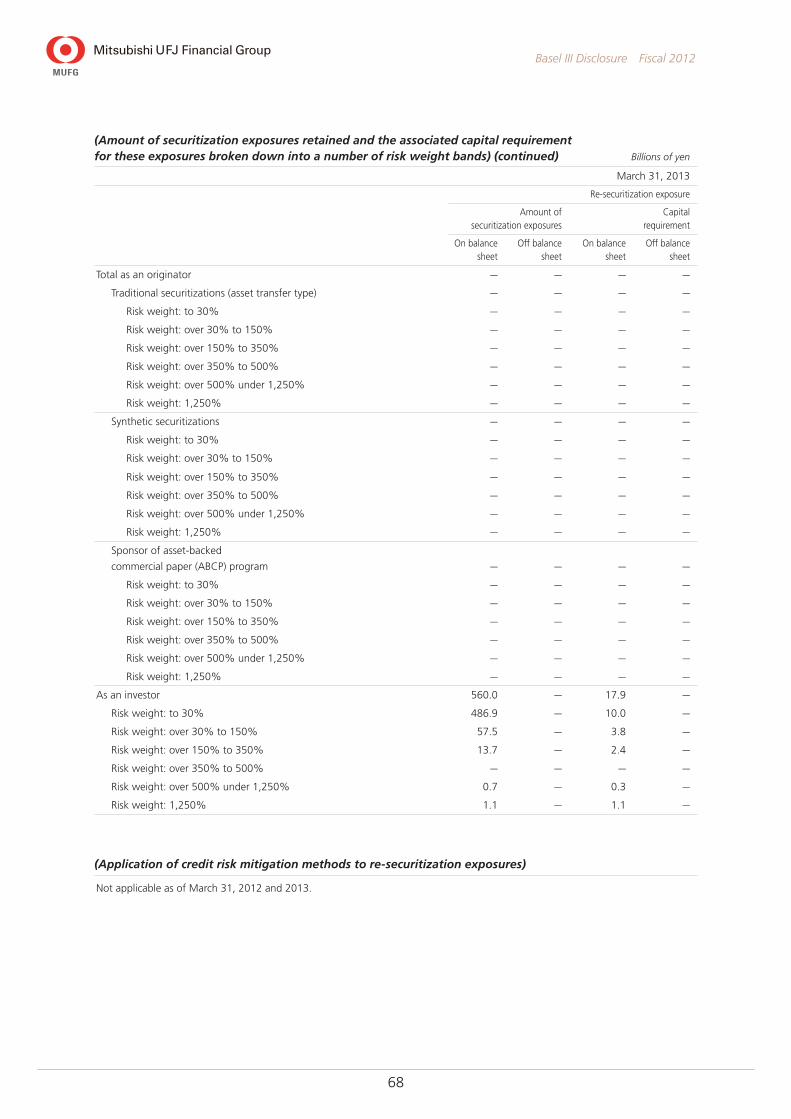
68
Basel III Disclosure Fiscal 2012
(Amount of securitization exposures retained and the associated capital requirement for these exposures broken down into a number of risk weight bands) (continued) Billions of yen
March 31, 2013
Re-securitization exposure
Amount of securitization exposures
Capital requirement
On balance sheet
Off balance sheet
On balance sheet
Off balance sheet
Total as an originator — — — —
Traditional securitizations (asset transfer type) — — — —
Risk weight: to 30% — — — —
Risk weight: over 30% to 150% — — — —
Risk weight: over 150% to 350% — — — —
Risk weight: over 350% to 500% — — — —
Risk weight: over 500% under 1,250% — — — —
Risk weight: 1,250% — — — —
Synthetic securitizations — — — —
Risk weight: to 30% — — — —
Risk weight: over 30% to 150% — — — —
Risk weight: over 150% to 350% — — — —
Risk weight: over 350% to 500% — — — —
Risk weight: over 500% under 1,250% — — — —
Risk weight: 1,250% — — — —
Sponsor of asset-backed
commercial paper (ABCP) program — — — —
Risk weight: to 30% — — — —
Risk weight: over 30% to 150% — — — —
Risk weight: over 150% to 350% — — — —
Risk weight: over 350% to 500% — — — —
Risk weight: over 500% under 1,250% — — — —
Risk weight: 1,250% — — — —
As an investor 560.0 — 17.9 —
Risk weight: to 30% 486.9 — 10.0 —
Risk weight: over 30% to 150% 57.5 — 3.8 —
Risk weight: over 150% to 350% 13.7 — 2.4 —
Risk weight: over 350% to 500% — — — —
Risk weight: over 500% under 1,250% 0.7 — 0.3 —
Risk weight: 1,250% 1.1 — 1.1 —
(Application of credit risk mitigation methods to re-securitization exposures)
Not applicable as of March 31, 2012 and 2013.
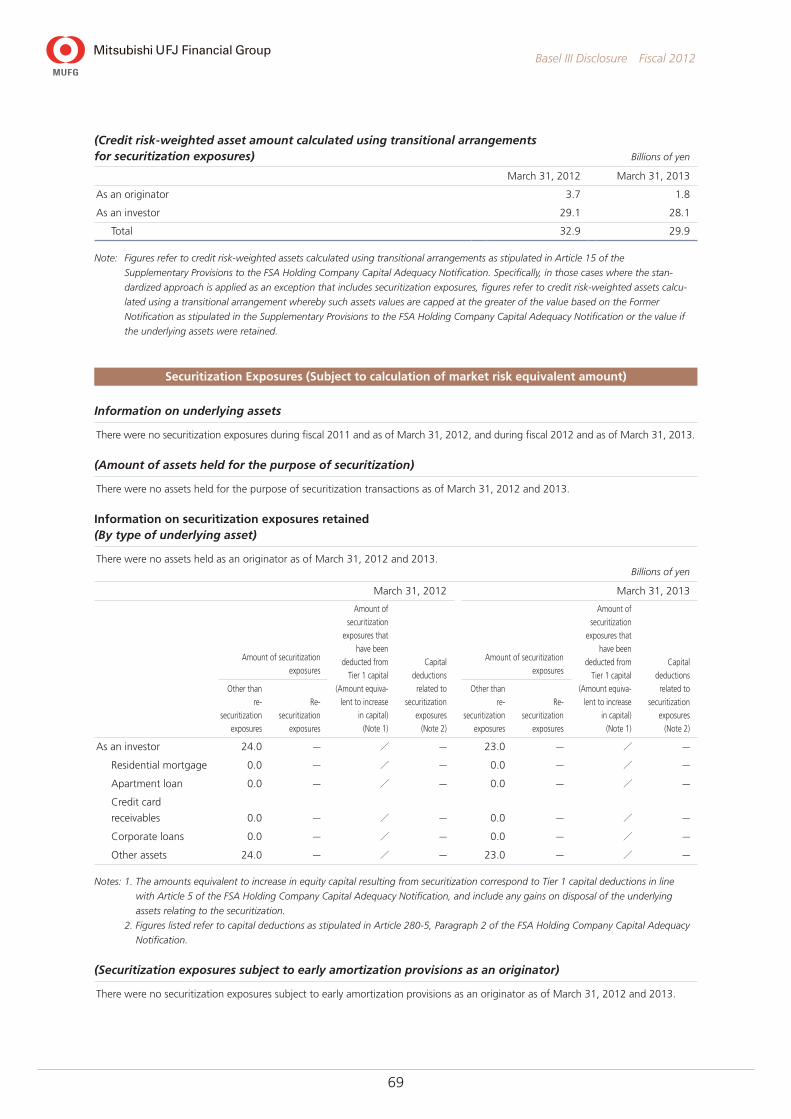
69
Basel III Disclosure Fiscal 2012
(Credit risk-weighted asset amount calculated using transitional arrangements for securitization exposures) Billions of yen
March 31, 2012 March 31, 2013
As an originator 3.7 1.8
As an investor 29.1 28.1
Total 32.9 29.9
Note: Figures refer to credit risk-weighted assets calculated using transitional arrangements as stipulated in Article 15 of the
Supplementary Provisions to the FSA Holding Company Capital Adequacy Notification. Specifically, in those cases where the stan-
dardized approach is applied as an exception that includes securitization exposures, figures refer to credit risk-weighted assets calcu-
lated using a transitional arrangement whereby such assets values are capped at the greater of the value based on the Former
Notification as stipulated in the Supplementary Provisions to the FSA Holding Company Capital Adequacy Notification or the value if
the underlying assets were retained.
Securitization Exposures (Subject to calculation of market risk equivalent amount)
Information on underlying assets
There were no securitization exposures during fiscal 2011 and as of March 31, 2012, and during fiscal 2012 and as of March 31, 2013.
(Amount of assets held for the purpose of securitization)
There were no assets held for the purpose of securitization transactions as of March 31, 2012 and 2013.
Information on securitization exposures retained(By type of underlying asset)
There were no assets held as an originator as of March 31, 2012 and 2013.Billions of yen
March 31, 2012 March 31, 2013
Amount of securitization
exposures
Amount of
securitization
exposures that
have been
deducted from
Tier 1 capital
(Amount equiva-
lent to increase
in capital)
(Note 1)
Capital
deductions
related to
securitization
exposures
(Note 2)
Amount of securitization
exposures
Amount of
securitization
exposures that
have been
deducted from
Tier 1 capital
(Amount equiva-
lent to increase
in capital)
(Note 1)
Capital
deductions
related to
securitization
exposures
(Note 2)
Other than
re-
securitization
exposures
Re-
securitization
exposures
Other than
re-
securitization
exposures
Re-
securitization
exposures
As an investor 24.0 — / — 23.0 — / —
Residential mortgage 0.0 — / — 0.0 — / —
Apartment loan 0.0 — / — 0.0 — / —
Credit card
receivables 0.0 — / — 0.0 — / —
Corporate loans 0.0 — / — 0.0 — / —
Other assets 24.0 — / — 23.0 — / —
Notes: 1. The amounts equivalent to increase in equity capital resulting from securitization correspond to Tier 1 capital deductions in line
with Article 5 of the FSA Holding Company Capital Adequacy Notification, and include any gains on disposal of the underlying
assets relating to the securitization.
2. Figures listed refer to capital deductions as stipulated in Article 280-5, Paragraph 2 of the FSA Holding Company Capital Adequacy
Notification.
(Securitization exposures subject to early amortization provisions as an originator)
There were no securitization exposures subject to early amortization provisions as an originator as of March 31, 2012 and 2013.

70
Basel III Disclosure Fiscal 2012
(Amount of securitization exposures retained and the associated capital requirement for these exposures broken down into a number of risk weight bands)
There was no securitization exposure as an originator as of March 31, 2012 and 2013.Billions of yen
March 31, 2012
Other than re-securitization exposures Re-securitization exposures
Amount of securiti-zation exposures Capital requirement
Amount of securiti-zation exposures Capital requirement
As an investor 24.0 1.0 — —
Risk weight: to 1.6% 0.0 0.0 — —
Risk weight: over 1.6% to 4% 11.0 0.3 — —
Risk weight: over 4% to 8% 11.0 0.5 — —
Risk weight: over 8% to 20% 2.0 0.2 — —
Risk weight: over 20% under 100% 0.0 0.0 — —
Risk weight: 100% 0.0 0.0 — —
Billions of yen
March 31, 2013
Other than re-securitization exposures Re-securitization exposures
Amount of securiti-zation exposures Capital requirement
Amount of securiti-zation exposures Capital requirement
As an investor 23.0 0.2 — —
Risk weight: to 1.6% 21.0 0.1 — —
Risk weight: over 1.6% to 4% 2.0 0.0 — —
Risk weight: over 4% to 8% 0.0 0.0 — —
Risk weight: over 8% to 20% 0.0 0.0 — —
Risk weight: over 20% under 100% 0.0 0.0 — —
Risk weight: 100% 0.0 0.0 — —
(Securitization exposures subject to measurement of comprehensive risk)
There were no securitization exposures subject to measurement of comprehensive risk as of March 31, 2012 and 2013.

71
Basel III Disclosure Fiscal 2012
Market Risk
Value-at-risk (VaR): maximum, minimum and average values by disclosure period and period-end
• VaR for trading activities Billions of yen
FY2011 FY2012
Average Maximum Minimum Mar 31, 2012 Average Maximum Minimum Mar 31, 2013
Overall 12.62 22.46 6.37 6.37 9.86 15.32 6.55 12.94
Interest rate 12.71 19.23 6.79 6.79 8.44 12.38 6.42 12.38
Yen 5.92 9.48 3.23 3.54 4.37 8.35 2.55 8.35
U.S. dollar 6.70 10.44 2.06 2.23 3.34 6.98 1.89 2.69
Foreign exchange 4.79 14.11 0.76 0.82 3.40 7.72 0.34 3.19
Equities 0.81 2.43 0.13 0.13 0.79 3.50 0.12 1.17
Commodities 0.43 1.43 0.15 0.29 0.48 1.06 0.15 0.51
Less diversification effect (6.12) — — (1.66) (3.25) — — (4.31)
Assumptions for VaR calculations:
Historical simulation method
Holding period: 10 business days
Confidence interval: 99%
Observation period: 701 business days
• The maximum and minimum VaR overall and for various risk categories were taken from different days.
• Figures for stressed value-at-risk (VaR) are not included.
Stressed value-at-risk (VaR): maximum, minimum and average values by disclosure period and period-end
Billions of yen
FY2011 FY2012
Average Maximum Minimum Mar 31, 2012 Average Maximum Minimum Mar 31, 2013
Stressed VaR 21.71 31.73 13.58 26.27 21.49 32.77 12.98 28.20
Assumptions for VaR calculations:
Historical simulation method
Holding period: 10 business days
Confidence interval: 99%
The amount of required capital related to additional risk and comprehensive risk as of the period-end, as well as the maximum, minimum and average values for the amount of required capital for additional risk and comprehensive risk during the disclosure period
Not applicable in fiscal 2011 and 2012.

72
Basel III Disclosure Fiscal 2012
Results of market risk backtesting and explanations of any actual trading losses significantly in excess of VaR
Note: Actual trading losses never significantly exceeded VaR
throughout the period studied.
Note: Actual trading losses never significantly exceeded VaR
throughout the period studied.
VaR
Dai
ly p
rofit
/loss
0
–6
–1212106 842
0
6
–9
3
–3
12
9
Case of losses exceeding VaR: 1
Market Risk Backtesting(April 1, 2011–March 31, 2012)
Billions of Yen
0
–3
–6
–9
–12
6
3
12
9
Daily profit/loss
VaR shown on a negative scale
Mar. 2012Apr. 2011
VaR and Daily Profit/Loss for Trading Activities(April 1, 2011–March 31, 2012)
Billions of Yen
Note: Actual trading losses never significantly exceeded VaR
throughout the period studied.
Note: Actual trading losses never significantly exceeded VaR
throughout the period studied.
VaRD
aily
pro
fit/lo
ss
0
–6
–1212106 842
0
6
–9
3
–3
12
9
Case of losses exceeding VaR: 1
Market Risk Backtesting(April 1, 2012–March 31, 2013)
Billions of Yen
0
–3
–6
–9
–12
6
3
12
9
Daily profit/loss
VaR shown on a negative scale
Mar. 2013Apr. 2012
VaR and Daily Profit/Loss for Trading Activities(April 1, 2012–March 31, 2013)
Billions of Yen

73
Basel III Disclosure Fiscal 2012
Equity Exposures in Banking Book
Amount on consolidated balance sheet and market values
• Exposures to publicly traded equities Billions of yen
March 31, 2012 March 31, 2013
Amount on consolidated
balance sheetMarket
value
Amount on consolidated
balance sheetMarket
value
Exposures to publicly traded equities 3,504.2 3,504.2 4,105.7 4,105.7
Notes: 1. Figures only count Japanese and foreign equities held within securities available for sale with quoted market value.
2. There is no significant disparity between the share prices of publicly quoted share values and fair value.
• Equity exposures other than above Billions of yen
March 31, 2012 March 31, 2013
Amount on consolidated
balance sheet
Amount on consolidated
balance sheet
Equity exposures other than above 411.0 363.3
Note: Figures only count Japanese and foreign equities held within securities available for sale whose market values are not readily determinable.
Cumulative gains or losses arising from sales or write-offs of exposures to equities Millions of yen
FY2011 FY2012
Gains on sales Losses on sales Write-offs Gains on sales Losses on sales Write-offs
Exposures to equities 56,410 (65,844) (79,251) 53,169 (19,471) (87,357)
Note: Figures refer to net gains or losses on equity securities within net non-recurring gains or losses.
Unrealized gains or losses recognized on consolidated balance sheet but not on consolidated statement of income Billions of yen
March 31, 2012 March 31, 2013
Acquisition cost
Amount on consolidated
balance sheetUnrealized
gains or lossesAcquisition
cost
Amount on consolidated
balance sheetUnrealized
gains or losses
Exposures to equities 3,132.2 3,504.2 371.9 2,965.0 4,105.7 1,140.6
Note: Figures only count Japanese and foreign equities held within securities available for sale with quoted market value.
Unrealized gains or losses not recognized either on consolidated balance sheet or on consolidated statement of income
Not applicable as of March 31, 2012 and 2013.
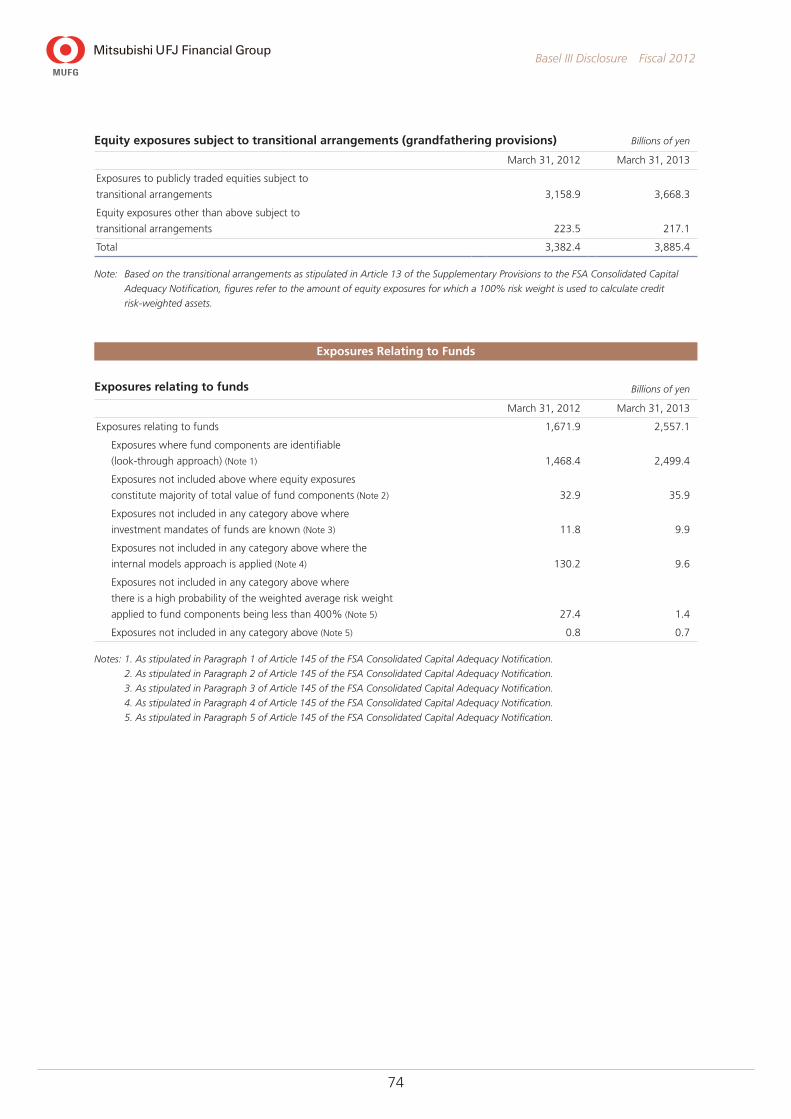
74
Basel III Disclosure Fiscal 2012
Equity exposures subject to transitional arrangements (grandfathering provisions) Billions of yen
March 31, 2012 March 31, 2013
Exposures to publicly traded equities subject to
transitional arrangements 3,158.9 3,668.3
Equity exposures other than above subject to
transitional arrangements 223.5 217.1
Total 3,382.4 3,885.4
Note: Based on the transitional arrangements as stipulated in Article 13 of the Supplementary Provisions to the FSA Consolidated Capital
Adequacy Notification, figures refer to the amount of equity exposures for which a 100% risk weight is used to calculate credit
risk-weighted assets.
Exposures Relating to Funds
Exposures relating to funds Billions of yen
March 31, 2012 March 31, 2013
Exposures relating to funds 1,671.9 2,557.1
Exposures where fund components are identifiable
(look-through approach) (Note 1) 1,468.4 2,499.4
Exposures not included above where equity exposures
constitute majority of total value of fund components (Note 2) 32.9 35.9
Exposures not included in any category above where
investment mandates of funds are known (Note 3) 11.8 9.9
Exposures not included in any category above where the
internal models approach is applied (Note 4) 130.2 9.6
Exposures not included in any category above where
there is a high probability of the weighted average risk weight
applied to fund components being less than 400% (Note 5) 27.4 1.4
Exposures not included in any category above (Note 5) 0.8 0.7
Notes: 1. As stipulated in Paragraph 1 of Article 145 of the FSA Consolidated Capital Adequacy Notification.
2. As stipulated in Paragraph 2 of Article 145 of the FSA Consolidated Capital Adequacy Notification.
3. As stipulated in Paragraph 3 of Article 145 of the FSA Consolidated Capital Adequacy Notification.
4. As stipulated in Paragraph 4 of Article 145 of the FSA Consolidated Capital Adequacy Notification.
5. As stipulated in Paragraph 5 of Article 145 of the FSA Consolidated Capital Adequacy Notification.
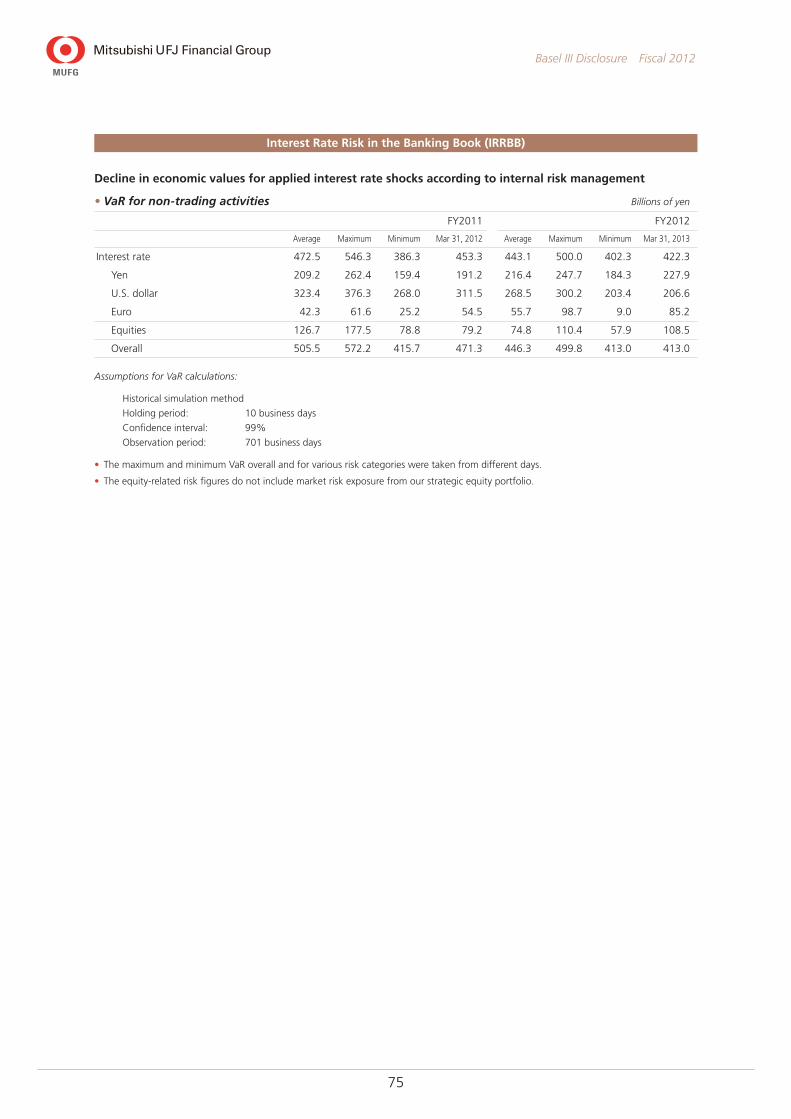
75
Basel III Disclosure Fiscal 2012
Interest Rate Risk in the Banking Book (IRRBB)
Decline in economic values for applied interest rate shocks according to internal risk management
• VaR for non-trading activities Billions of yen
FY2011 FY2012
Average Maximum Minimum Mar 31, 2012 Average Maximum Minimum Mar 31, 2013
Interest rate 472.5 546.3 386.3 453.3 443.1 500.0 402.3 422.3
Yen 209.2 262.4 159.4 191.2 216.4 247.7 184.3 227.9
U.S. dollar 323.4 376.3 268.0 311.5 268.5 300.2 203.4 206.6
Euro 42.3 61.6 25.2 54.5 55.7 98.7 9.0 85.2
Equities 126.7 177.5 78.8 79.2 74.8 110.4 57.9 108.5
Overall 505.5 572.2 415.7 471.3 446.3 499.8 413.0 413.0
Assumptions for VaR calculations:
Historical simulation method
Holding period: 10 business days
Confidence interval: 99%
Observation period: 701 business days
• The maximum and minimum VaR overall and for various risk categories were taken from different days.
• The equity-related risk figures do not include market risk exposure from our strategic equity portfolio.