Basel II, Sovereign Ratings and Transfer Risk
27
1 Basel II, Sovereign Ratings and Transfer Risk External versus Internal Ratings by Stijn Claessens and Geert Embrechts* 07 May 2002 Abstract Basel II puts great emphasis on external ratings, including f rom rating agencies, to quantify credit risks, but it also allows financial institutions to use their internal risk ratings. This is also the case for international lending, but f ollowing recent emerging markets’ crises, t he quality of sovereign ratings has received much criticism. At the same time, little is known about the quality of int ernal ratings of country risk. Using data from a major international bank, we assess the relative performance of internal and external country ratings. We find that internal and external ratings are driven by similar factors and both underestimate “event risks”, but that ex ternal ratings are somewhat slower in adjusting to a financial crisis. ------------------------------------------------------------------------------------------------------------ University of Amsterdam and Rabobank International, the Netherlands respectivel y. For presentation at the conference Basel II: An Economic Assessment, Bank for International Settlements, Basel, 17-18 May 2002, organized by the Centre for Economic Policy Research, Journal of Financial Intermediation, and the Basel Committee on Banking Supervision. The opinions do not necessarily express those of the Rabobank. The authors would like to thank Peter Boswijk and Martijn Krijger for help with the statistical analysis and Michiel van Voorst, Leendert Colijn, Adriaan Kukl er, Frank Ligtenberg and Leonhardt van Efferink for comments on an earlier version.
Transcript of Basel II, Sovereign Ratings and Transfer Risk
8/6/2019 Basel II, Sovereign Ratings and Transfer Risk
http://slidepdf.com/reader/full/basel-ii-sovereign-ratings-and-transfer-risk 1/27
1
Basel II, Sovereign Ratings and Transfer Risk
External versus Internal Ratings
by
Stijn Claessens and Geert Embrechts*
07 May 2002
Abstract
Basel II puts great emphasis on external ratings, including from rating agencies, to
quantify credit risks, but it also allows financial institutions to use their internal risk ratings. This is also the case for international lending, but following recent emerging
markets’ crises, the quality of sovereign ratings has received much criticism. At the same
time, little is known about the quality of internal ratings of country risk. Using data froma major international bank, we assess the relative performance of internal and external
country ratings. We find that internal and external ratings are driven by similar factors
and both underestimate “event risks”, but that external ratings are somewhat slower in
adjusting to a financial crisis.
------------------------------------------------------------------------------------------------------------
University of Amsterdam and Rabobank International, the Netherlands respectively. For
presentation at the conference Basel II: An Economic Assessment, Bank for International Settlements, Basel, 17-18 May 2002, organized by the Centre for Economic Policy
Research, Journal of Financial Intermediation, and the Basel Committee on BankingSupervision. The opinions do not necessarily express those of the Rabobank. The authors
would like to thank Peter Boswijk and Martijn Krijger for help with the statistical
analysis and Michiel van Voorst, Leendert Colijn, Adriaan Kukler, Frank Ligtenberg andLeonhardt van Efferink for comments on an earlier version.
8/6/2019 Basel II, Sovereign Ratings and Transfer Risk
http://slidepdf.com/reader/full/basel-ii-sovereign-ratings-and-transfer-risk 2/27
2
Introduction
In January 2001 the Basel Committee on Banking Supervision issued aconsultative document on a new Basel Capital Accord (the ‘Basel II’ proposal). Under
the standardized approach, Basel II puts greater emphasis on the role of external ratings,
including from rating agencies, to assess credit risks. At the same time, Basel II alsoincreases the scope for financial institutions to use their internal risk ratings under the
more advanced approach, provided a number of criteria are being met by the particular
financial institution.
Regulatory authorities are expected to request banks to apply the new risk
management concepts not only to domestic lending but also to international lending in
the next few years. Although not (yet) in particular extensively dealt with in the Basel II proposal, country and transfer risk are major sources of credit risk for international
lending. For the standardized Basel II approach, sovereign ratings by rating agencies are
expected to play an important role in the measurement of credit risk. The quality of
sovereign ratings has received much criticism, however, particularly for emergingmarkets and following the East Asian financial crises. This may make internal ratings
more attractive.
Little is known, however, on how internal ratings perform in assessing country
risk and how they compare to external ratings. Are internal ratings driven by similar or
different considerations of country risk? Do internal ratings perform a better job in predicting rating changes than external ratings do? Which set of ratings performs best in
assessing expected default frequencies? Are internal ratings more or less volatile than
external ratings? The purpose of this paper is to examine how country risk ratings (andtransfer risk in particular) may fit into the Basel II proposals and Economic Capital
models, how external and commercial banks’ internal rating behavior can be explained,
and how external ratings compare to internal ratings.
To do so, we first review the notion of country risks. We argue that, in the current
environment, sovereign risk is but one component of country risk that can lead to credit
risks. Transfer risk is all the more important, also as under Basel II it is the onlyidentified category of country risk. We next review the literature on sovereign ratings to
identify the factors driving country risk. We also review the criticism of sovereign ratings
following the East Asian financial crisis. We then assess the (relative) performance of internal and external ratings using a long series from a major bank active in international
lending. We find that internal transfer and external sovereign credit ratings are driven by
similar factors, but with different weighting. We also find that external ratings are worsein adjusting to crises. The findings suggest that internal ratings can be as good or even
better a tool to assess country risk as external sovereign ratings are.
The outline of the paper is as follows. In the first section, the concepts of countryrisk, transfer risk and sovereign risk are defined. In the second section, the Basel II
proposals regarding sovereign ratings and transfer risk, and new risk management
techniques, such as the Economic Capital approach, are briefly discussed. The third
8/6/2019 Basel II, Sovereign Ratings and Transfer Risk
http://slidepdf.com/reader/full/basel-ii-sovereign-ratings-and-transfer-risk 3/27
3
section examines the rating methodologies used for sovereign and transfer risks. Since
Basel II and Economic Capital models leave ample room for a statistical approach to risk,
the explanatory powers of sovereign and transfer rating models are checked. Also, thetransfer rating migration over time are examined and compared to sovereign rating
behavior. The last section concludes.
1. The concepts of country and transfer risks
We start with a commonly used definition of country risk, as provided for example
by Nagy (1984): ‘Country risk is the exposure to a loss in cross-border lending, caused by
events in a particular country which are at least to some extent under the control of the government but definitely not under the control of a private enterprise or individual.’It is important to realize that in this definition all forms of cross-border lending in a
country whether to the government, a bank, a private enterprise or an individual are
included. Country risk is therefore a broader concept than sovereign risk is, which is
restricted to the risk of lending to the government of a sovereign nation. An assessment of the willingness to pay, for example, is one of the distinguishing features of sovereign
credit analysis compared to corporate credit analysis. Country risk assessment does not
only involve an assessment of willingness of the state to fulfil its obligations, as other factors can also cause losses. In practice, sovereign risk and country risk are highly
correlated, however, as the government is the major actor in sovereign and country risk
affairs.
Nagy sees transfer risk, defined as the inability of private agents to fulfil their
obligations due to government actions, as one of the most important drivers of countryrisk. One example of transfer risk is when the government has imposed prohibitive
exchange restrictions, which may make it impossible for private agents to transfer payments. This type of country risk only applies to private borrowers. If instead the
government cannot service its own debt because it does not have the required amount of foreign exchange or is unwilling to service its debts, then these events would be classified
as sovereign default, renegotiation, rescheduling or a form of technical default. For the
purpose of this paper, we will not take into account of industrial countries where transfer risk can be assumed to be non-existent.
Of course, credit risk involves other forms of country risk as well. Since the EastAsian financial crisis, it has become clear that country risk can occur in forms other than
transfer risk or sovereign risk. In particular, an overall deterioration of credit risk in the
country can lead to many private contracts not being observed, although the governmentdoes not impose any specific balance-of-payments restrictions. This credit concentrationrisk has been called collective debtor risk (or domestic economic risk) and relates to the
likelihood that countrywide (political, economical) events occur which negatively
influence the quality of a bank’s overall portfolio in a country. We do not consider thisrisk part of transfer risk.
8/6/2019 Basel II, Sovereign Ratings and Transfer Risk
http://slidepdf.com/reader/full/basel-ii-sovereign-ratings-and-transfer-risk 4/27
8/6/2019 Basel II, Sovereign Ratings and Transfer Risk
http://slidepdf.com/reader/full/basel-ii-sovereign-ratings-and-transfer-risk 5/27
5
obligations. In practice, sovereign risk may be highly correlated with country risk, but is
still conceptual a different form of risk.
A transfer risk event involves thus an action by the government to impose
restrictions to the transfer of funds from the debtors in the country to foreign creditors.
Note that apart from a transfer risk event, there are numerous other crises, which can belabeled country risk (e.g., a currency crisis or large scale-banking crisis). These events
will most often lead to losses stemming from we call collective debtor risk, but these
events do not necessarily lead to a transfer risk event. The Basel II proposals primarily
address credit risk, with collective debtor risk assumed to be an integral part of credit risk (and in the correlation of defaults). In all explicit references, country risk in Basel II is
restricted to transfer risk.1 We therefore restrict our discussion and analysis as well to
transfer risk only.
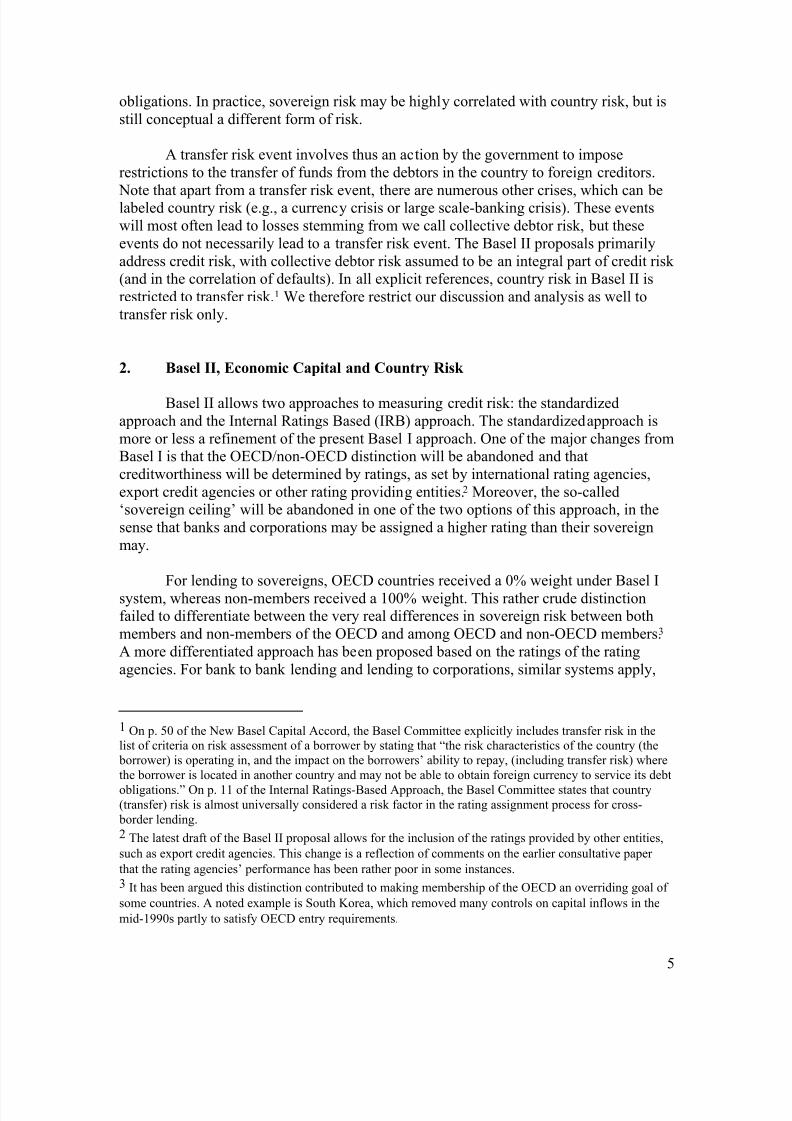
2. Basel II, Economic Capital and Country Risk
Basel II allows two approaches to measuring credit risk: the standardized
approach and the Internal Ratings Based (IRB) approach. The standardized approach is
more or less a refinement of the present Basel I approach. One of the major changes fromBasel I is that the OECD/non-OECD distinction will be abandoned and that
creditworthiness will be determined by ratings, as set by international rating agencies,
export credit agencies or other rating providing entities.2 Moreover, the so-called‘sovereign ceiling’ will be abandoned in one of the two options of this approach, in the
sense that banks and corporations may be assigned a higher rating than their sovereign
may.
For lending to sovereigns, OECD countries received a 0% weight under Basel I
system, whereas non-members received a 100% weight. This rather crude distinctionfailed to differentiate between the very real differences in sovereign risk between both
members and non-members of the OECD and among OECD and non-OECD members.3
A more differentiated approach has been proposed based on the ratings of the rating
agencies. For bank to bank lending and lending to corporations, similar systems apply,
1 On p. 50 of the New Basel Capital Accord, the Basel Committee explicitly includes transfer risk in the
list of criteria on risk assessment of a borrower by stating that “the risk characteristics of the country (the
borrower) is operating in, and the impact on the borrowers’ ability to repay, (including transfer risk) where
the borrower is located in another country and may not be able to obtain foreign currency to service its debt
obligations.” On p. 11 of the Internal Ratings-Based Approach, the Basel Committee states that country(transfer) risk is almost universally considered a risk factor in the rating assignment process for cross-
border lending.
2 The latest draft of the Basel II proposal allows for the inclusion of the ratings provided by other entities,
such as export credit agencies. This change is a reflection of comments on the earlier consultative paper
that the rating agencies’ performance has been rather poor in some instances.
3 It has been argued this distinction contributed to making membership of the OECD an overriding goal of
some countries. A noted example is South Korea, which removed many controls on capital inflows in the
mid-1990s partly to satisfy OECD entry requirements.
8/6/2019 Basel II, Sovereign Ratings and Transfer Risk
http://slidepdf.com/reader/full/basel-ii-sovereign-ratings-and-transfer-risk 6/27
8/6/2019 Basel II, Sovereign Ratings and Transfer Risk
http://slidepdf.com/reader/full/basel-ii-sovereign-ratings-and-transfer-risk 7/27
7
For sovereign ratings, the results are more mixed. Cantor and Packer (1995, 1996)
studied the effects of rating announcements by S&P and Moody’s on ‘relative spreads,’i.e., the differential between yields on sovereign dollar-denominated eurobonds and on
comparable U.S. treasury, using data from 1987 until 1994. The conclusions of this event
study were as follows. Announcements of a change in sovereign risk assessment appear to be preceded by a similar change in the markets’ assessment. In the 29 days preceding
negative respectively positive announcements, relative spreads rose cumulative 3.3
respectively declined 2.0 percentage points. This trend disappears shortly before the
announcements. After the announcement, statistically significant bond yield movementsin the expected direction followed positive announcements in the agencies’ ratings, but
negative changes did not produce significant effects. Rating announcements also have a
highly significant impact on spreads of speculative grade sovereign bonds but not for investment-grade sovereign bonds, with an announcement by Moody’s having a higher
impact than announcements by S&P.
Larrain, Reisen and von Maltzan (1997) and Reisen and von Maltzan (1999)replicated the method of Cantor and Packer closely to study the impact of rating
announcements by Moody’s, S&P and Fitch IBCA.5 They also employed a larger (and
more recent) sample period, from 1989 to 1997. Reisen and von Maltzan question theresults by Cantor and Packer. They find that the impact of one rating announcement is not
significant for all countries in the sample period. A significant change in the yield spread
in the expected direction occurred during the announcement period only when adowngrade was implemented. These results contrast those of Cantor and Packer, who
found significant effects only for positive announcements. One similarity between the
two studies is that Reisen and von Maltzan find that the largest announcement effects arefor emerging market sovereign spreads. As noted above, Cantor and Packer found the
largest effects for speculative grade bonds, which more or less correspond to those issued
by emerging market sovereigns. Moreover, Reisen and von Maltzan also find that a risein yield precedes a downgrade. Apart from a replication of the Cantor and Packer test,
Reisen and von Maltzan also do a Granger causality test to examine the interaction
between spreads on sovereign bonds and credit ratings, after allowing for the influence of
macroeconomic country risk determinants. The authors conclude that the three leadingcredit ratings agencies do not independently lead the market and that there is a two-way
causality between ratings and spreads.
In general, this research suggests that the rating agencies do not so much lead but
lag the market and the rating agencies are overall slow to adjust their ratings. Moreover,
the findings of Cantor and Packer and Reisen and von Maltzan suggest that the criticismon the rating agencies in the wake of the Mexican and the Asian crisis may also apply to
a longer period as well. These findings are confirmed by recent work by Kaminsky and
Schmukler (2002) who conclude not only that rating agencies contribute to financial
instability and cross-country contagion, but also confirm that rating agencies act pro-cyclical.
5 For a more recent study of announcements effects, see Kaminsky and Schmukler, 2002.
8/6/2019 Basel II, Sovereign Ratings and Transfer Risk
http://slidepdf.com/reader/full/basel-ii-sovereign-ratings-and-transfer-risk 8/27
8
Rating stability and actual defaults
Corporate ratings are fairly stable, also over the business cycle, and provide a
reasonable measure of the relative chances of a corporation’s default (Altman andSaunders, 1998). On the basis of an overview of sovereign ratings in the twentieth
century, the IMF (1999) concludes that sovereign ratings have a more ‘checkered’ history
than corporate ratings. Most sovereign ratings were lowered during the 1930s Great
Depression, with 21 out of 58 nations defaulting on their international bonds between1930 and 1935. On a volume basis, roughly 70% of all sovereign debt (excluding
Canadian debt) issued in the US between 1926 and 1929 defaulted before the end of
1937, compared to a US corporate bond default figure of 30%.
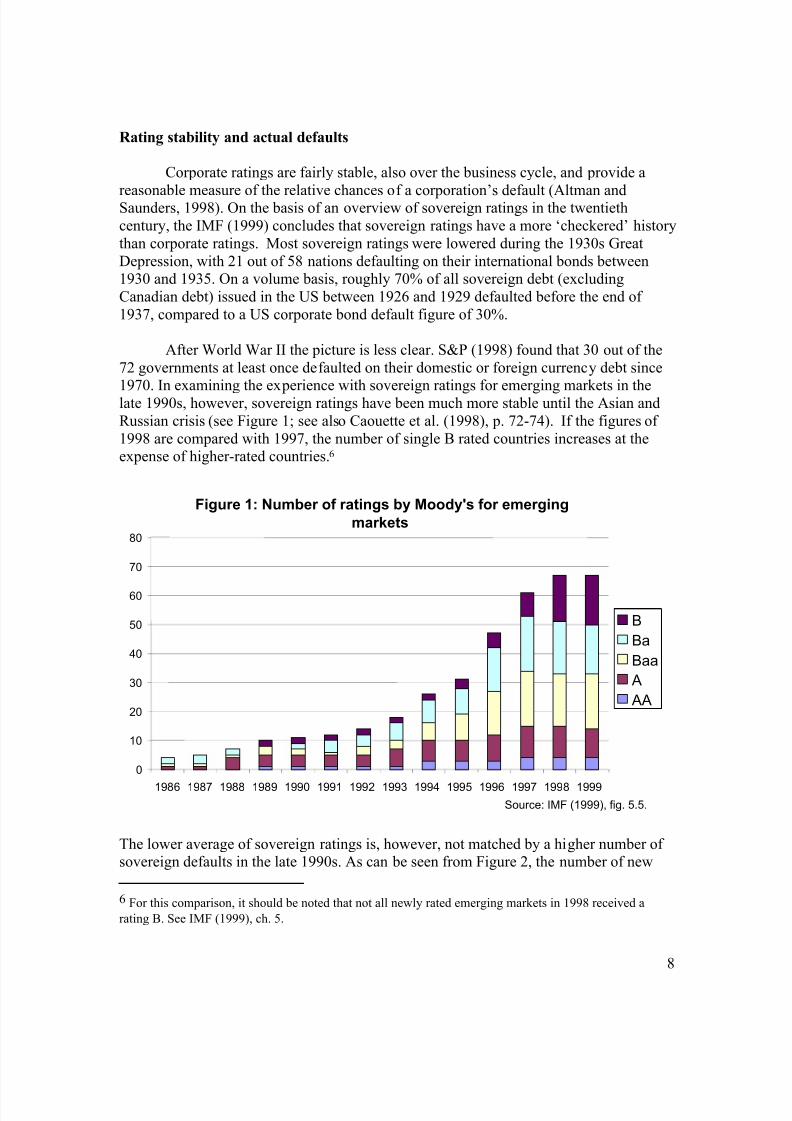
After World War II the picture is less clear. S&P (1998) found that 30 out of the
72 governments at least once defaulted on their domestic or foreign currency debt since
1970. In examining the experience with sovereign ratings for emerging markets in thelate 1990s, however, sovereign ratings have been much more stable until the Asian and
Russian crisis (see Figure 1; see also Caouette et al. (1998), p. 72-74). If the figures of
1998 are compared with 1997, the number of single B rated countries increases at theexpense of higher-rated countries.6
Figure 1: Number of ratings by Moody's for emerging
markets
0
10
20
30
40
50
60
70
80
1986 1987 1988 1989 1990 1991 1992 1993 1994 1995 1996 1997 1998 1999
B
Ba
Baa
A
AA
Source: IMF (1999), fig. 5.5.
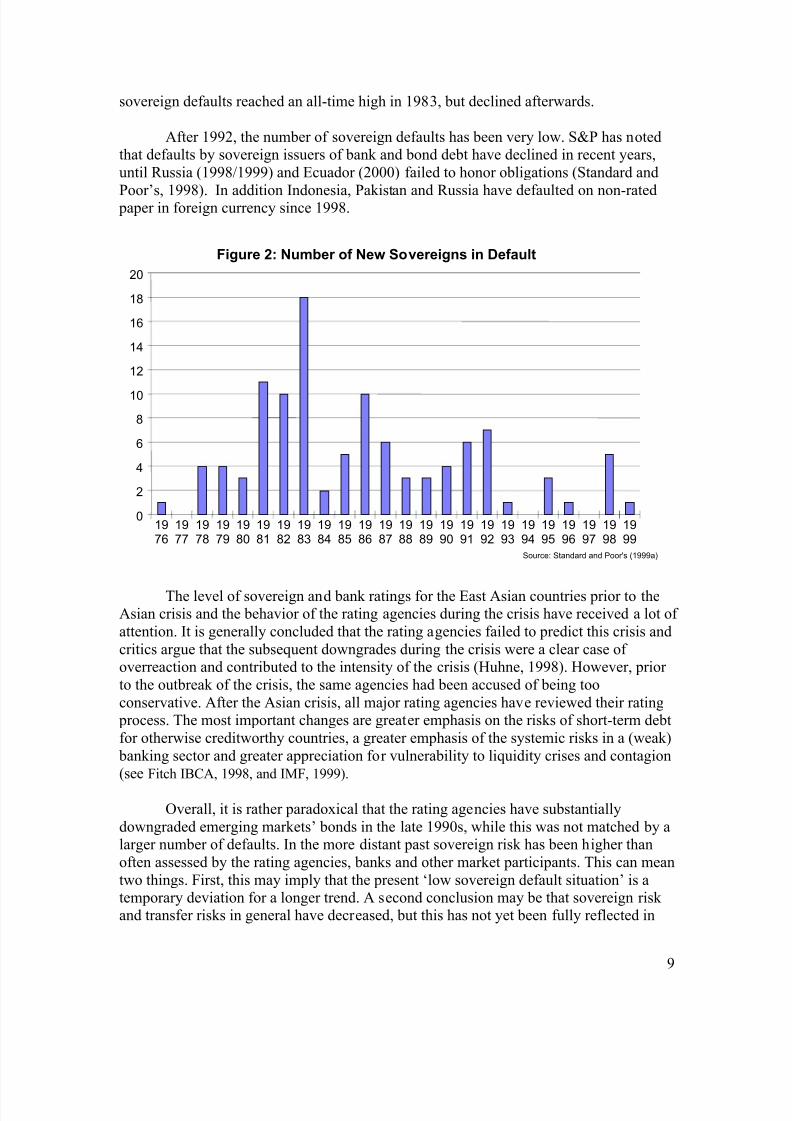
The lower average of sovereign ratings is, however, not matched by a higher number of sovereign defaults in the late 1990s. As can be seen from Figure 2, the number of new
6 For this comparison, it should be noted that not all newly rated emerging markets in 1998 received a
rating B. See IMF (1999), ch. 5.
8/6/2019 Basel II, Sovereign Ratings and Transfer Risk
http://slidepdf.com/reader/full/basel-ii-sovereign-ratings-and-transfer-risk 9/27
9
sovereign defaults reached an all-time high in 1983, but declined afterwards.
After 1992, the number of sovereign defaults has been very low. S&P has notedthat defaults by sovereign issuers of bank and bond debt have declined in recent years,
until Russia (1998/1999) and Ecuador (2000) failed to honor obligations (Standard and
Poor’s, 1998). In addition Indonesia, Pakistan and Russia have defaulted on non-rated paper in foreign currency since 1998.
0
2
4
6
8
10
12
14
16
18
20
1976
1977
1978
1979
1980
1981
1982
1983
1984
1985
1986
1987
1988
1989
1990
1991
1992
1993
1994
1995
1996
1997
1998
1999
Figure 2: Number of New Sovereigns in Default
Source: Standard and Poor's (1999a)
The level of sovereign and bank ratings for the East Asian countries prior to theAsian crisis and the behavior of the rating agencies during the crisis have received a lot of
attention. It is generally concluded that the rating agencies failed to predict this crisis and
critics argue that the subsequent downgrades during the crisis were a clear case of overreaction and contributed to the intensity of the crisis (Huhne, 1998). However, prior
to the outbreak of the crisis, the same agencies had been accused of being too
conservative. After the Asian crisis, all major rating agencies have reviewed their rating process. The most important changes are greater emphasis on the risks of short-term debt
for otherwise creditworthy countries, a greater emphasis of the systemic risks in a (weak)
banking sector and greater appreciation for vulnerability to liquidity crises and contagion(see Fitch IBCA, 1998, and IMF, 1999).
Overall, it is rather paradoxical that the rating agencies have substantially
downgraded emerging markets’ bonds in the late 1990s, while this was not matched by alarger number of defaults. In the more distant past sovereign risk has been higher than
often assessed by the rating agencies, banks and other market participants. This can mean
two things. First, this may imply that the present ‘low sovereign default situation’ is atemporary deviation for a longer trend. A second conclusion may be that sovereign risk and transfer risks in general have decreased, but this has not yet been fully reflected in
8/6/2019 Basel II, Sovereign Ratings and Transfer Risk
http://slidepdf.com/reader/full/basel-ii-sovereign-ratings-and-transfer-risk 10/27
10
the ratings. Instead, the rating agencies may have overreacted in the wake of the Asian
‘ratings crisis’.
4. Rating determinants
In this section, we review the empirical literature on the determinants of sovereign
ratings and provide the regression results of the most commonly used model. We also
analyze the ratings of transfer risk for a major international bank, and compare thesedeterminants to those of sovereign ratings.
4.1. Sovereign ratings
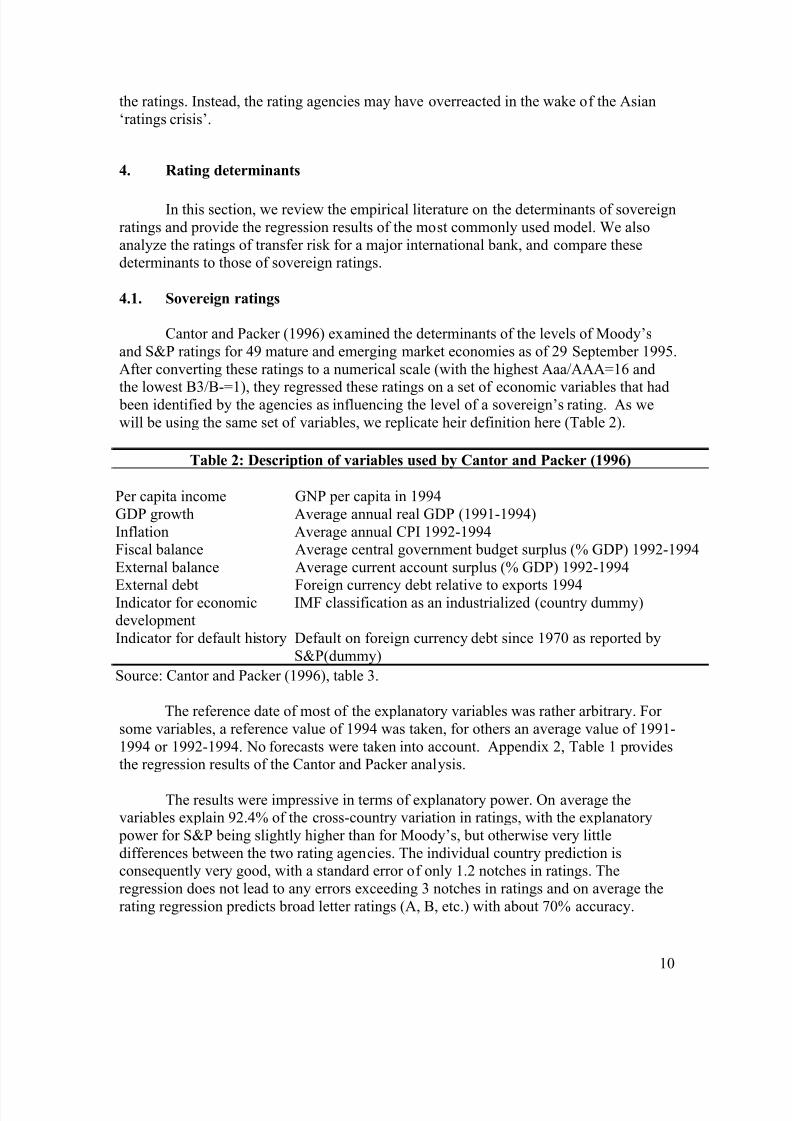
Cantor and Packer (1996) examined the determinants of the levels of Moody’s
and S&P ratings for 49 mature and emerging market economies as of 29 September 1995.
After converting these ratings to a numerical scale (with the highest Aaa/AAA=16 and
the lowest B3/B-=1), they regressed these ratings on a set of economic variables that had been identified by the agencies as influencing the level of a sovereign’s rating. As we
will be using the same set of variables, we replicate heir definition here (Table 2).
Table 2: Description of variables used by Cantor and Packer (1996)
Per capita income GNP per capita in 1994
GDP growth Average annual real GDP (1991-1994)
Inflation Average annual CPI 1992-1994Fiscal balance Average central government budget surplus (% GDP) 1992-1994
External balance Average current account surplus (% GDP) 1992-1994
External debt Foreign currency debt relative to exports 1994Indicator for economicdevelopment
IMF classification as an industrialized (country dummy)
Indicator for default history Default on foreign currency debt since 1970 as reported by
S&P(dummy)
Source: Cantor and Packer (1996), table 3.
The reference date of most of the explanatory variables was rather arbitrary. For
some variables, a reference value of 1994 was taken, for others an average value of 1991-
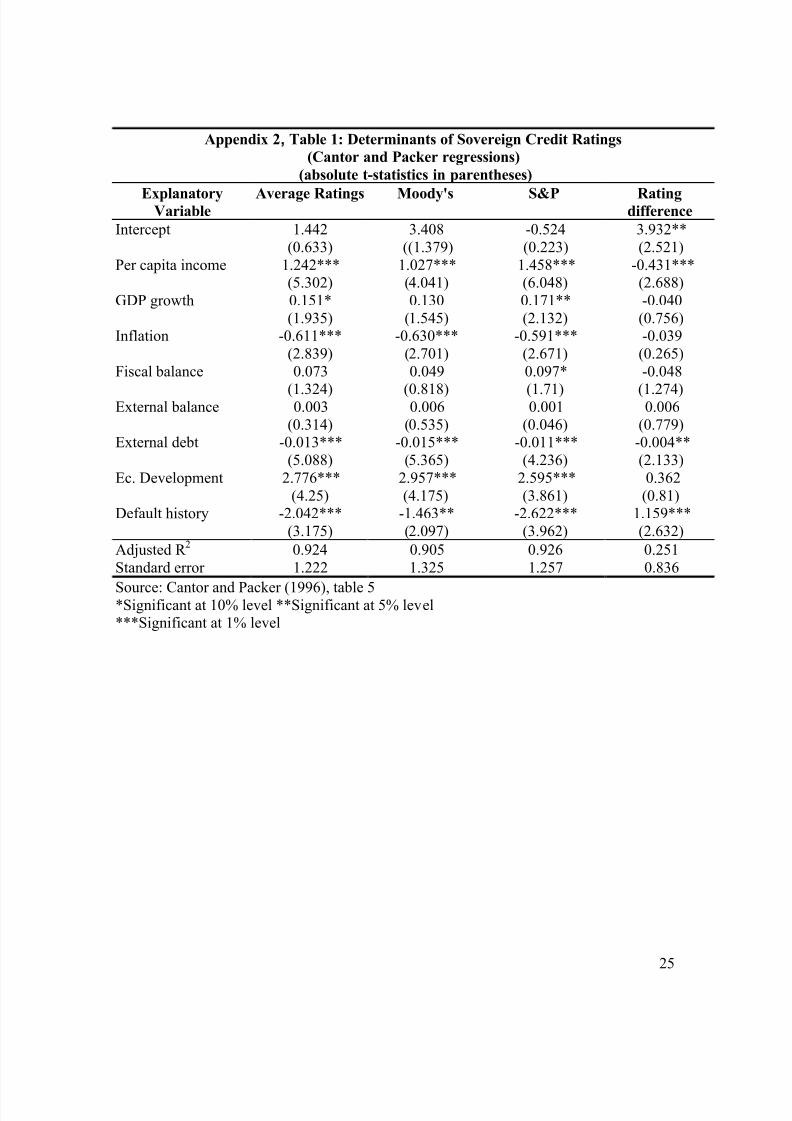
1994 or 1992-1994. No forecasts were taken into account. Appendix 2, Table 1 providesthe regression results of the Cantor and Packer analysis.
The results were impressive in terms of explanatory power. On average thevariables explain 92.4% of the cross-country variation in ratings, with the explanatory
power for S&P being slightly higher than for Moody’s, but otherwise very little
differences between the two rating agencies. The individual country prediction isconsequently very good, with a standard error of only 1.2 notches in ratings. The
regression does not lead to any errors exceeding 3 notches in ratings and on average the
rating regression predicts broad letter ratings (A, B, etc.) with about 70% accuracy.

8/6/2019 Basel II, Sovereign Ratings and Transfer Risk
http://slidepdf.com/reader/full/basel-ii-sovereign-ratings-and-transfer-risk 11/27
11
Cantor and Packer add, however, that the regression achieves its high R 2
through its
ability to explain large differences in rating. The model has little to say about small
differences in ratings.
Looking at the separate explanatory variables, the Cantor and Packer results
indicate that higher ratings were associated with high per capita income, high GDP-growth, low inflation, a low ratio of foreign currency external debt to exports, the
absence of a history of defaults on foreign currency debt since 1970, and a high level of
economic development (as measured by the IMF classification as an industrial country).
The coefficients on the fiscal position and the external balance were not statisticallysignificant.7
Jüttner and McCarthy (1998) looked into whether the Cantor and Packer resultsalso held for the turbulent period of the Asian ‘rating crisis.’8 First, they re-estimated the
regression for 29 September 1995, end-1996, end-1997 and end-1998, with slightly
different explanatory variables.9 As expected the results were more or less comparable
for 1995, 1996 and 1997 but the relationship broke down in 1998 in the wake of theAsian crisis. Jüttner and McCarthy also constructed a new model, with ‘old’ (in the 1998
regression) significant variables and new variables for the interest rate differential,
financial sector problems and the real exchange rate. All variables except economicdevelopment and real exchange rate then became significant at 1%-level. Although the
findings of Jüttner and McCarthy were very relevant for the period of the Asian crisis, it
should be noted that their analysis tried to find ex post explanations for the ratings behavior in one particular ‘crisis’ year and as such can amount to data-snooping.
4.2. Determinants of transfer risk ratings
To conduct a formal comparison between the determinants of sovereign ratings by
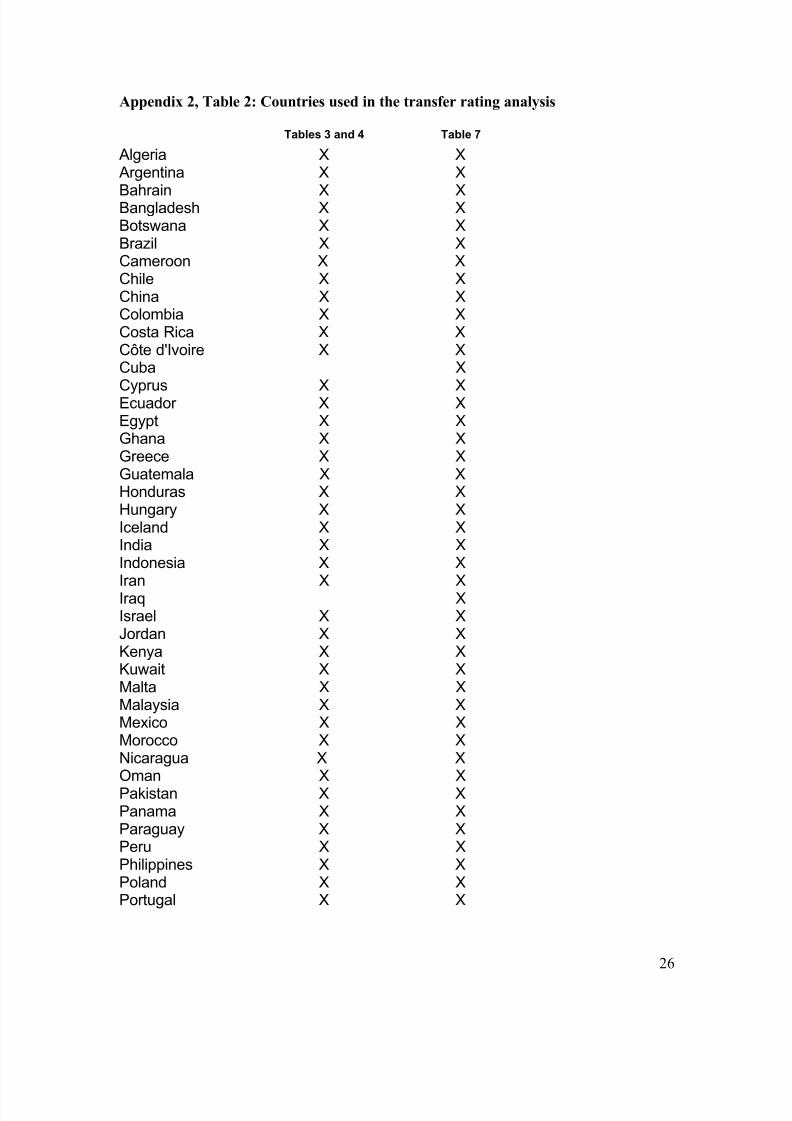
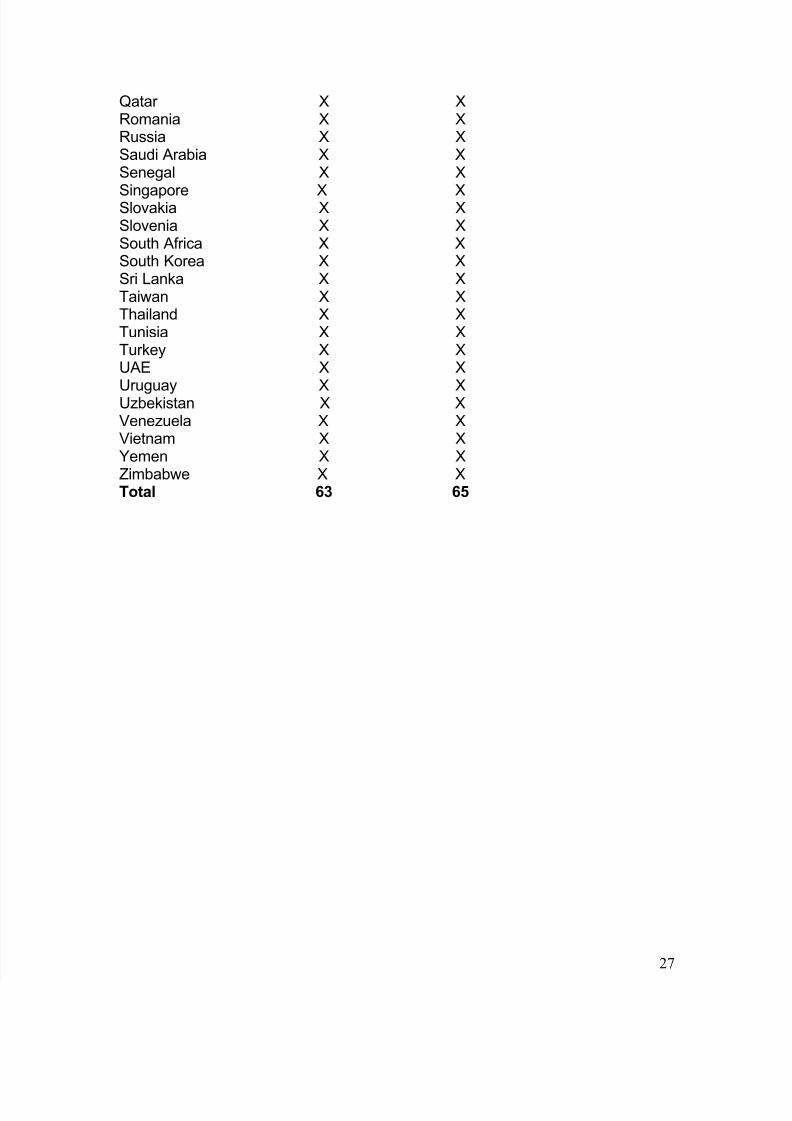
external rating agencies and internal transfer ratings by financial institutions, transfer risk ratings used at an international bank were used. Ratings as of April 2000 are taken for 63
developing countries and emerging markets.10 It is important to note that this sample does
not include many industrial countries.
For transfer ratings, a scale of 1 to7 was used, with 1 indicating the highest risk. All
data for the explanatory variables come from the EIU (EIU Country Data April 2001),
7 The authors explain the lack of clear correlation between ratings and fiscal and external balances by the
endogeneity in both fiscal policy and international capital flows: a country that tries to enhance its credit
rating, will opt for a more conservative fiscal policy. In addition, the indicators for budget deficit andcurrent account deficit may not reveal the most relevant information on the sustainability of external or
fiscal situation. A deteriorating trend may in that respect be more relevant. Moreover, as supply of capital
to low rated countries will be limited, the build up of foreign debt will be less.
8 A ratings crisis is defined by the authors as a three-notch sovereign credit rating downgrade on long-term
foreign currency debt over any six-month period.
9 Among other differences, they used three-year averages instead of two-year averages for some variables.
10 See Appendix 2 for the countries included in the sample. As we focus on transfer risk, G-10 countries,
other countries of the European Economic Association, Australia and New Zealand are excluded.
8/6/2019 Basel II, Sovereign Ratings and Transfer Risk
http://slidepdf.com/reader/full/basel-ii-sovereign-ratings-and-transfer-risk 12/27
12
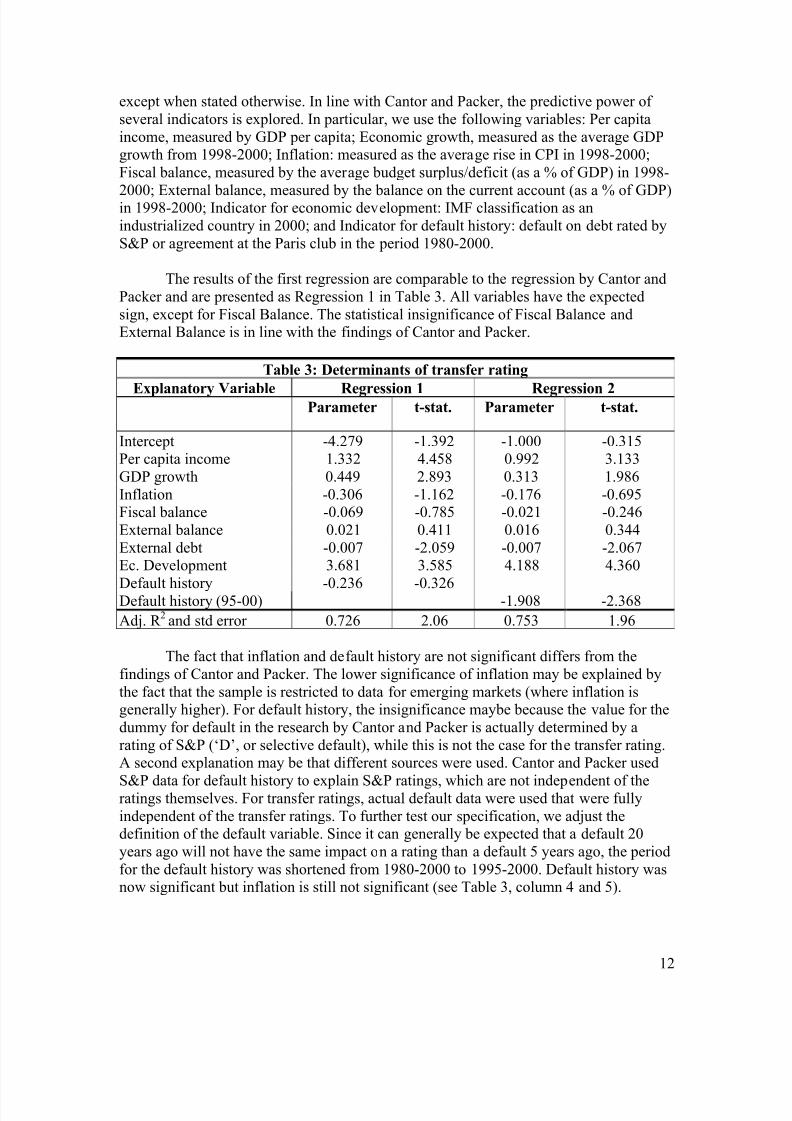
except when stated otherwise. In line with Cantor and Packer, the predictive power of
several indicators is explored. In particular, we use the following variables: Per capita
income, measured by GDP per capita; Economic growth, measured as the average GDPgrowth from 1998-2000; Inflation: measured as the average rise in CPI in 1998-2000;
Fiscal balance, measured by the average budget surplus/deficit (as a % of GDP) in 1998-
2000; External balance, measured by the balance on the current account (as a % of GDP)in 1998-2000; Indicator for economic development: IMF classification as an
industrialized country in 2000; and Indicator for default history: default on debt rated by
S&P or agreement at the Paris club in the period 1980-2000.
The results of the first regression are comparable to the regression by Cantor and
Packer and are presented as Regression 1 in Table 3. All variables have the expected
sign, except for Fiscal Balance. The statistical insignificance of Fiscal Balance andExternal Balance is in line with the findings of Cantor and Packer.
Table 3: Determinants of transfer rating
Explanatory Variable Regression 1 Regression 2Parameter t-stat. Parameter t-stat.
Intercept -4.279 -1.392 -1.000 -0.315Per capita income 1.332 4.458 0.992 3.133
GDP growth 0.449 2.893 0.313 1.986
Inflation -0.306 -1.162 -0.176 -0.695Fiscal balance -0.069 -0.785 -0.021 -0.246
External balance 0.021 0.411 0.016 0.344
External debt -0.007 -2.059 -0.007 -2.067Ec. Development 3.681 3.585 4.188 4.360
Default history -0.236 -0.326Default history (95-00) -1.908 -2.368
Adj. R 2
and std error 0.726 2.06 0.753 1.96
The fact that inflation and default history are not significant differs from the
findings of Cantor and Packer. The lower significance of inflation may be explained by
the fact that the sample is restricted to data for emerging markets (where inflation isgenerally higher). For default history, the insignificance maybe because the value for the
dummy for default in the research by Cantor and Packer is actually determined by a
rating of S&P (‘D’, or selective default), while this is not the case for the transfer rating.A second explanation may be that different sources were used. Cantor and Packer used
S&P data for default history to explain S&P ratings, which are not independent of theratings themselves. For transfer ratings, actual default data were used that were fully
independent of the transfer ratings. To further test our specification, we adjust thedefinition of the default variable. Since it can generally be expected that a default 20
years ago will not have the same impact on a rating than a default 5 years ago, the period
for the default history was shortened from 1980-2000 to 1995-2000. Default history wasnow significant but inflation is still not significant (see Table 3, column 4 and 5).
8/6/2019 Basel II, Sovereign Ratings and Transfer Risk
http://slidepdf.com/reader/full/basel-ii-sovereign-ratings-and-transfer-risk 13/27
13
The predictive power of the model (R 2=72.6%) is much lower than that of Cantor
and Packer (R 2=92.4%), but this can be explained by the fact that the transfer rating
sample is restricted to emerging markets. The explanatory power of GDP per capita andthe dummy for industrial country can thus be expected to be lower. It also reflects that
this specification is not subject to the critique of data-snooping since we use their
specification directly, rather than trying to find a set of explanatory variables with thehighest predictive power.
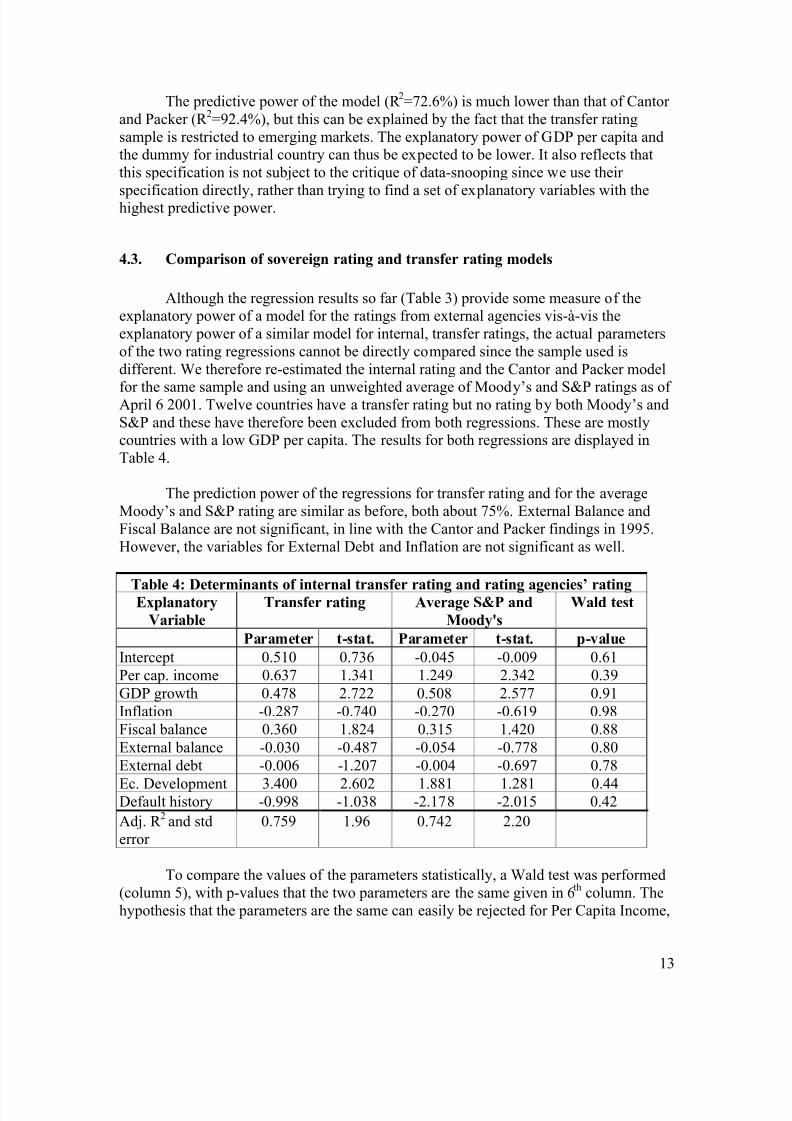
4.3. Comparison of sovereign rating and transfer rating models
Although the regression results so far (Table 3) provide some measure of theexplanatory power of a model for the ratings from external agencies vis-à-vis the
explanatory power of a similar model for internal, transfer ratings, the actual parameters
of the two rating regressions cannot be directly compared since the sample used is
different. We therefore re-estimated the internal rating and the Cantor and Packer model
for the same sample and using an unweighted average of Moody’s and S&P ratings as of April 6 2001. Twelve countries have a transfer rating but no rating by both Moody’s and
S&P and these have therefore been excluded from both regressions. These are mostlycountries with a low GDP per capita. The results for both regressions are displayed in
Table 4.
The prediction power of the regressions for transfer rating and for the average
Moody’s and S&P rating are similar as before, both about 75%. External Balance and
Fiscal Balance are not significant, in line with the Cantor and Packer findings in 1995.
However, the variables for External Debt and Inflation are not significant as well.
Table 4: Determinants of internal transfer rating and rating agencies’ rating Explanatory
Variable
Transfer rating Average S&P and
Moody's
Wald test
Parameter t-stat. Parameter t-stat. p-value
Intercept 0.510 0.736 -0.045 -0.009 0.61
Per cap. income 0.637 1.341 1.249 2.342 0.39
GDP growth 0.478 2.722 0.508 2.577 0.91
Inflation -0.287 -0.740 -0.270 -0.619 0.98
Fiscal balance 0.360 1.824 0.315 1.420 0.88
External balance -0.030 -0.487 -0.054 -0.778 0.80
External debt -0.006 -1.207 -0.004 -0.697 0.78
Ec. Development 3.400 2.602 1.881 1.281 0.44Default history -0.998 -1.038 -2.178 -2.015 0.42
Adj. R 2
and std
error
0.759 1.96 0.742 2.20
To compare the values of the parameters statistically, a Wald test was performed
(column 5), with p-values that the two parameters are the same given in 6th
column. The
hypothesis that the parameters are the same can easily be rejected for Per Capita Income,
8/6/2019 Basel II, Sovereign Ratings and Transfer Risk
http://slidepdf.com/reader/full/basel-ii-sovereign-ratings-and-transfer-risk 14/27
14
Economic Development, Default History and the intercept. The impact of Per Capita
Income is larger at the rating agencies, while the parameter for Economic Development is
higher for transfer ratings. As these two variables have a positive correlation, the effect of lower weighting for the Economic Development dummy in the rating agencies regression
may be compensated by the effect of higher weighting for Per Capita Income in the same
regression and vice versa. Transfer rating analysts, however, do regard Default History to be less important than analysts at the rating agencies seem to do. But otherwise, external
rating agencies seems to use (implicitly or explicitly) a similar model as the internal
ratings imply.
5. Rating migration behavior
While it is important to investigate the determinants of the rating levels, tocalculate expected default frequencies (EDFs) for Economic Capital or regulatory capital
purposes rating migration is at least as important. As a first step, the conclusions of the
rating agencies on their research of rating migration will be discussed. Secondly, rating
migration matrices for the transfer ratings will be calibrated.
5.1. Rating migration and default at the rating agencies
Empirical analyses by the rating agencies can be expected to correlate credit
quality and default rates. It is difficult, however, to come up with the default probabilitiesfor sovereign ratings for two reasons. First, there has only been a limited experience with
sovereign ratings, both in terms of the length of time since the ratings began (for most
emerging market countries only the early 1990s or later) and the number of countries that
has been rated. Second, under the definitions of default employed by the agencies, therewere only four defaults on foreign-currency-denominated debt rated by rating agencies.11
Therefore, the relationship between ratings and default probabilities and the relatedmigration of ratings to lower, default categories may be tenuous for sovereign ratings.More relevant may be the findings of the corporate credit rating migration, which will
therefore be discussed first. Since S&P has in spite of the above-mentioned
caveats calibrated a sovereign rating migration index, their findings will be discussed as
well.
Corporate credit rating migration by Moody’s
Most attention has been paid to calculate corporate credit rating migration. These
studies generally confirm that the default probability of an AAA-rated entity is lower
than an AA-rated entity, which is in turn lower than for an A-rated company etc. Therating agencies argue that ratings reflect relative default probabilities and see the absolutelevel of the default risk as being influenced by the state of the business and credit cycles.
The default probabilities are therefore period dependent (with higher concentration of
defaults in periods of economic depression). Absolute default probabilities may,however, not be inferred from the credit rating categories as default. For a good
11 Indonesia (twice), Pakistan and Russia.
8/6/2019 Basel II, Sovereign Ratings and Transfer Risk
http://slidepdf.com/reader/full/basel-ii-sovereign-ratings-and-transfer-risk 15/27
15
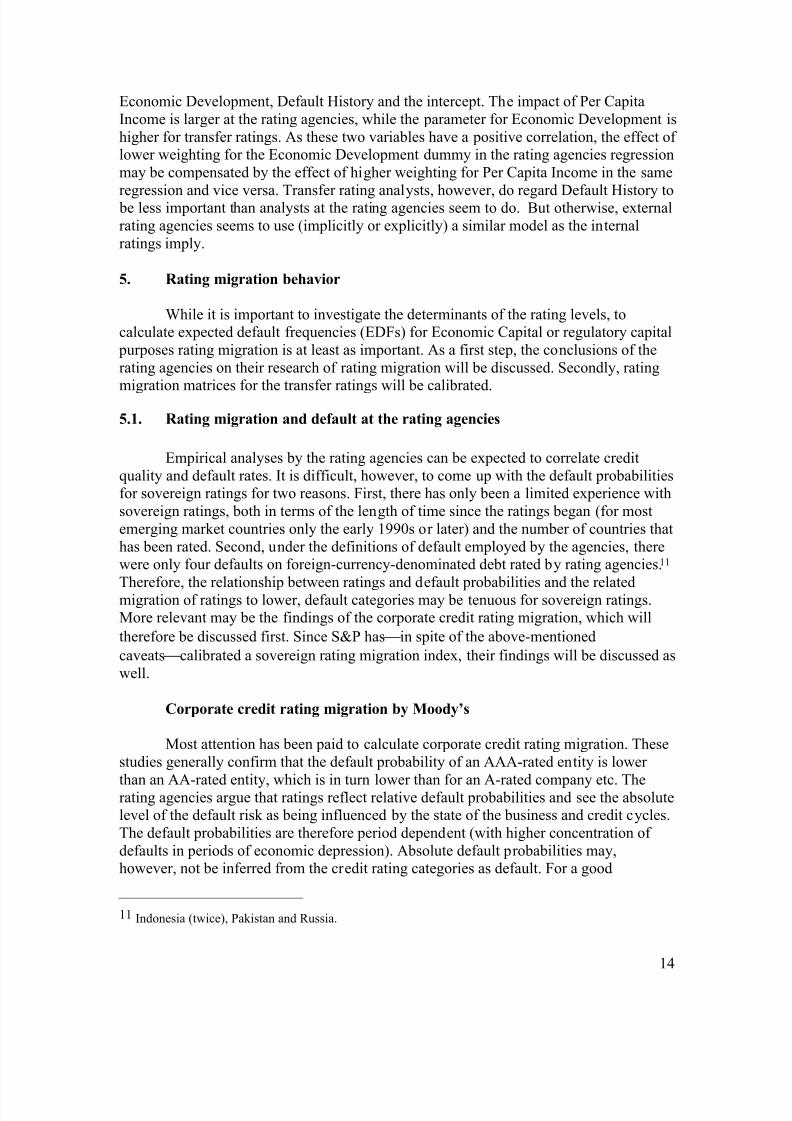
understanding of the migration matrices of the rating agencies, it is also important to note
that rating migration at the rating agencies is calculated by comparing the ratings at the
beginning of the year with the ratings at the end of the year.
A study by Moody’s (2001) showed the to be expected inverse relationship
between default rates and rating categories, with a clear pattern of higher risk of defaultfor the speculative grade rating categories (Table 5). The only exception is the default
probability of AA-rated corporations of 0.03%, which can be compared to a 0.01%
probability for A-rates corporations. Moody’s notes that this relatively high risk and
exception to the monotonic increase in default risk as ratings decline may fall under theumbrella of ‘event risk’. Moreover, there is different rating behavior regarding Caa-C
rated companies. The study also showed that the volatility of default rates increases with
lower credit rating. The lower predictability of default rates may explain the significantlyhigher risk premia required by investors in lower-rated issues.
Table 5: One year migration matrix of Moody's corporate ratings
(1980-2000, percent)Rating to: Aaa Aa A Baa Ba B Caa-C Default WR*
Aaa 86.17 9.45 1.02 0.00 0.03 0.00 0.00 0.00 3.33
Aa 1.10 86.05 8.93 0.31 0.11 0.01 0.00 0.03 3.46
A 0.06 2.85 86.75 5.58 0.66 0.17 0.01 0.01 3.91
Baa 0.06 0.34 6.64 81.00 5.52 0.97 0.08 0.16 5.23
Ba 0.03 0.06 0.54 5.46 75.50 8.18 0.53 1.32 8.38
B 0.01 0.04 0.20 0.56 5.92 75.94 3.03 6.41 7.90
Caa-C 0.00 0.00 0.00 0.87 2.61 5.62 57.02 25.31 8.58
Source: Moody's (2001), exhibit. 36, p. 44. *WR = withdrawn rating
A valid question remains whether corporate credit rating migration can becompared with sovereign rating migration. Moody’s has stated that on the basis of rating
behavior over time, default rates for sovereign issuers should broadly parallel the
corporate default rates. Standard & Poor's expects sovereign rating stability and default probability to converge over time with the behavior for corporate ratings as the number of
sovereign rating observations increases (Standard and Poor’s, 2000). There are, however,
some indications, that this presumption by the rating agencies may not hold. Cantor andPacker find that sovereign bonds rated below A tend to be associated with higher spreads
than comparably rated US corporate securities. They interpret this finding as more
pessimism by markets on sovereign credit risks than the ratings analysis of S&P andMoody’s implied. This could point in the direction that markets do not support a one to
one calibration of corporate credit ratings into sovereign ratings.
Sovereign rating migration by S&P ratings
On the basis of a rather small sample of sovereign ratings (due to a lack of ratings
for emerging markets in the 1980s), S&P (2000) has calculated a sovereign ratingmigration matrix (Table 6). S&P notes that comparisons between sovereign and corporate
default rates are skewed by the small sample size of sovereign defaults.
8/6/2019 Basel II, Sovereign Ratings and Transfer Risk
http://slidepdf.com/reader/full/basel-ii-sovereign-ratings-and-transfer-risk 16/27
16
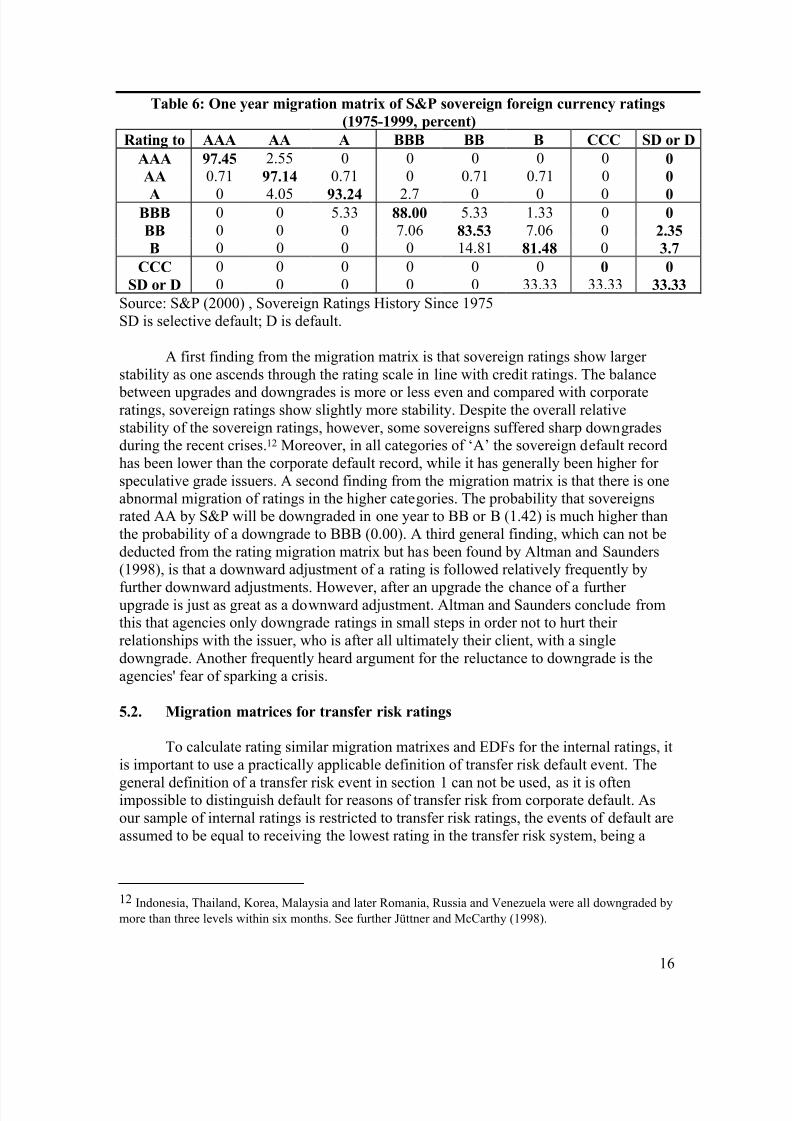
Table 6: One year migration matrix of S&P sovereign foreign currency ratings
(1975-1999, percent)
Rating to AAA AA A BBB BB B CCC SD or D
AAA 97.45 2.55 0 0 0 0 0 0
AA 0.71 97.14 0.71 0 0.71 0.71 0 0
A 0 4.05 93.24 2.7 0 0 0 0BBB 0 0 5.33 88.00 5.33 1.33 0 0
BB 0 0 0 7.06 83.53 7.06 0 2.35
B 0 0 0 0 14.81 81.48 0 3.7
CCC 0 0 0 0 0 0 0 0
SD or D 0 0 0 0 0 33.33 33.33 33.33
Source: S&P (2000) , Sovereign Ratings History Since 1975
SD is selective default; D is default.
A first finding from the migration matrix is that sovereign ratings show larger
stability as one ascends through the rating scale in line with credit ratings. The balance
between upgrades and downgrades is more or less even and compared with corporateratings, sovereign ratings show slightly more stability. Despite the overall relative
stability of the sovereign ratings, however, some sovereigns suffered sharp downgradesduring the recent crises.12 Moreover, in all categories of ‘A’ the sovereign default record
has been lower than the corporate default record, while it has generally been higher for
speculative grade issuers. A second finding from the migration matrix is that there is oneabnormal migration of ratings in the higher categories. The probability that sovereignsrated AA by S&P will be downgraded in one year to BB or B (1.42) is much higher than
the probability of a downgrade to BBB (0.00). A third general finding, which can not be
deducted from the rating migration matrix but has been found by Altman and Saunders(1998), is that a downward adjustment of a rating is followed relatively frequently by
further downward adjustments. However, after an upgrade the chance of a further upgrade is just as great as a downward adjustment. Altman and Saunders conclude fromthis that agencies only downgrade ratings in small steps in order not to hurt their
relationships with the issuer, who is after all ultimately their client, with a single
downgrade. Another frequently heard argument for the reluctance to downgrade is the
agencies' fear of sparking a crisis.
5.2. Migration matrices for transfer risk ratings
To calculate rating similar migration matrixes and EDFs for the internal ratings, it
is important to use a practically applicable definition of transfer risk default event. The
general definition of a transfer risk event in section 1 can not be used, as it is oftenimpossible to distinguish default for reasons of transfer risk from corporate default. As
our sample of internal ratings is restricted to transfer risk ratings, the events of default are
assumed to be equal to receiving the lowest rating in the transfer risk system, being a
12 Indonesia, Thailand, Korea, Malaysia and later Romania, Russia and Venezuela were all downgraded by
more than three levels within six months. See further Jüttner and McCarthy (1998).
8/6/2019 Basel II, Sovereign Ratings and Transfer Risk
http://slidepdf.com/reader/full/basel-ii-sovereign-ratings-and-transfer-risk 17/27
17
rating of 1. This is consistent with practices in the past since in case of a sovereign
default or a transfer risk event, the internal rating was downgraded to 1.
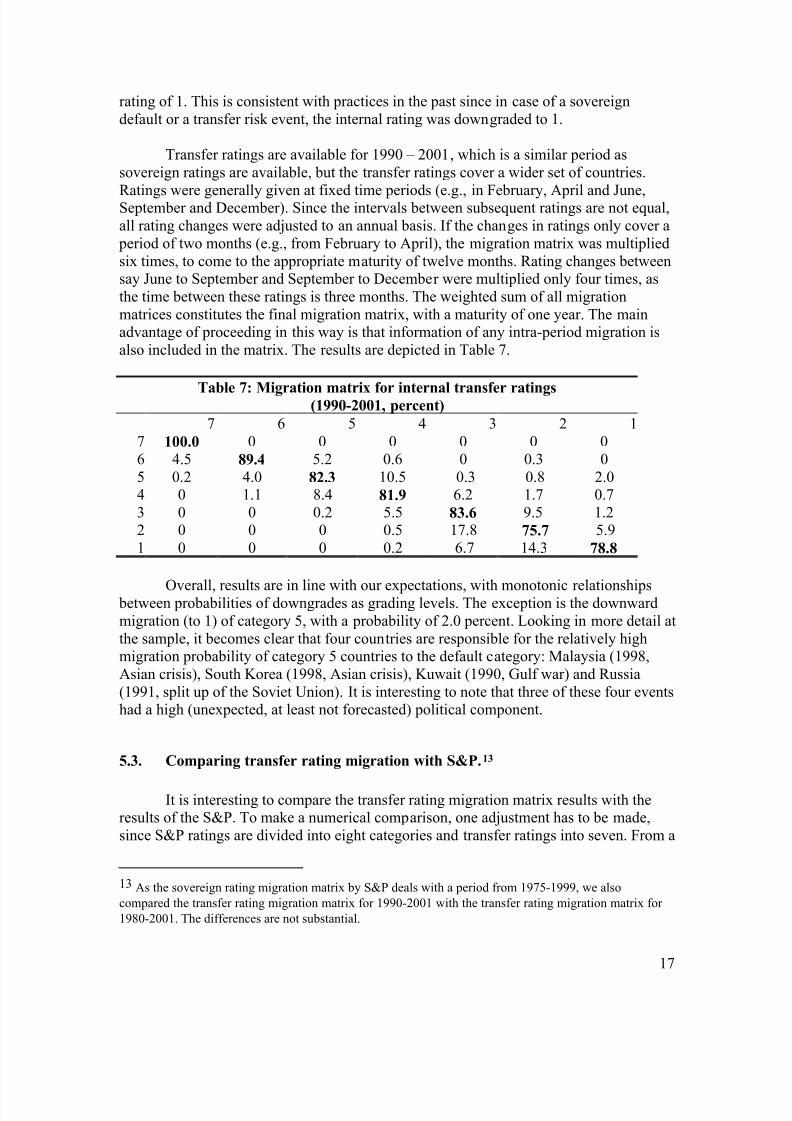
Transfer ratings are available for 1990 – 2001, which is a similar period as
sovereign ratings are available, but the transfer ratings cover a wider set of countries.
Ratings were generally given at fixed time periods (e.g., in February, April and June,September and December). Since the intervals between subsequent ratings are not equal,
all rating changes were adjusted to an annual basis. If the changes in ratings only cover a
period of two months (e.g., from February to April), the migration matrix was multiplied
six times, to come to the appropriate maturity of twelve months. Rating changes betweensay June to September and September to December were multiplied only four times, as
the time between these ratings is three months. The weighted sum of all migration
matrices constitutes the final migration matrix, with a maturity of one year. The mainadvantage of proceeding in this way is that information of any intra-period migration is
also included in the matrix. The results are depicted in Table 7.
Table 7: Migration matrix for internal transfer ratings(1990-2001, percent)
7 6 5 4 3 2 1
7 100.0 0 0 0 0 0 0
6 4.5 89.4 5.2 0.6 0 0.3 0
5 0.2 4.0 82.3 10.5 0.3 0.8 2.04 0 1.1 8.4 81.9 6.2 1.7 0.7
3 0 0 0.2 5.5 83.6 9.5 1.22 0 0 0 0.5 17.8 75.7 5.9
1 0 0 0 0.2 6.7 14.3 78.8
Overall, results are in line with our expectations, with monotonic relationships between probabilities of downgrades as grading levels. The exception is the downward
migration (to 1) of category 5, with a probability of 2.0 percent. Looking in more detail at
the sample, it becomes clear that four countries are responsible for the relatively highmigration probability of category 5 countries to the default category: Malaysia (1998,
Asian crisis), South Korea (1998, Asian crisis), Kuwait (1990, Gulf war) and Russia
(1991, split up of the Soviet Union). It is interesting to note that three of these four eventshad a high (unexpected, at least not forecasted) political component.
5.3. Comparing transfer rating migration with S&P.13
It is interesting to compare the transfer rating migration matrix results with theresults of the S&P. To make a numerical comparison, one adjustment has to be made,
since S&P ratings are divided into eight categories and transfer ratings into seven. From a
13 As the sovereign rating migration matrix by S&P deals with a period from 1975-1999, we also
compared the transfer rating migration matrix for 1990-2001 with the transfer rating migration matrix for
1980-2001. The differences are not substantial.
8/6/2019 Basel II, Sovereign Ratings and Transfer Risk
http://slidepdf.com/reader/full/basel-ii-sovereign-ratings-and-transfer-risk 18/27
18
comparison between transfer rating and S&P rating definitions, it appears that a transfer
rating of 1 can be compared to a rating CCC or lower. Therefore, the S&P rating
categories CCC and SD or D are cumulated. As the sample of countries initially ratedCCC by S&P is very small and no country has had a rating CCC in the period 1975-1999
at the beginning of the year, the loss of information of reducing the S&P categories from
eight to seven is very small.
The comparison shows that rating stability is slightly higher for the S&P
sovereign ratings than for the transfer ratings in the higher categories. Two explanations
come to mind. First, the S&P migration index includes both industrialized and non-industrialized countries, whereas the internal transfer rating sample includes only non-
industrialized countries. As explained in section 4.1, rating migration of lower rated
entities is higher than for higher rated entities. A second explanation may be the differentway of calculating the migration matrix. Implied default probabilities for the lower
categories are higher when using the transfer risk ratings than using the S&P ratings. This
may be explained by the broader definition of default (rating 1) by the international bank
than by S&P. On average, only about 20% of the international bank ‘transfer events’ arealso sovereign defaults registered by S&P.
The most important finding, however, is that the S&P sovereign rating migrationmatrix, the international bank transfer rating migration matrix and to a lesser extent the
Moody’s corporate rating migration matrix, all have one abnormal migration of ratings in
the higher categories. The probability that sovereigns rated AA by S&P will bedowngraded in one year to BB or B is higher than the probability of a downgrade from
AA to BBB. For the international bank transfer ratings, this is the case for rating category
5. Sharp downgrades after unexpected events (often related to ‘unwillingness to pay’ bythe government) appear to explain this abnormal migration behavior.
If the pattern of these sharp downgrades is examined in more detail, S&P andMoody’s do not downgrade countries immediately, but preferred instead a step by step
approach.14 This fits the conclusions of Altman and Saunders (1998) whom concluded
that a downward adjustment of the credit rating is followed relatively frequently by
further downward adjustments, but after an upgrade the chance of a further upgrade is just as great as a downward adjustment. By contrast, the downgrades in transfer ratings
were much larger and had a one off character. This suggests that internal ratings do not
suffer from the same biases as rating agencies do, i.e., they do not cushion the impact byadjusting rates slowly.
14 Venezuela from AA to A- on February 11, 1983 and to BB on March 28, 1983. Moreover, South Korea
was downgraded from AA- to A+ on October 24, 1997, from A+ to A- on November 25, 1997, from A- to
BBB- on December 11, 1997 and from BBB- to B+ on December 22, 1997.
8/6/2019 Basel II, Sovereign Ratings and Transfer Risk
http://slidepdf.com/reader/full/basel-ii-sovereign-ratings-and-transfer-risk 19/27
19
6. Conclusion
A first conclusion of our analysis is that the concept of country risk has changedin the 1990s. While transfer risk was the major source of country risk in the 1980s, the
growing openness of emerging and the growing interdependence of emerging markets
have changed the concept of country risk for banks in two ways. First, the probability of atransfer event happening has become lower, due to higher costs of a transfer event in the
form of exclusion of foreign borrowing, losses from FDI and trade flows. Second, even
without a transfer event happening, losses stemming from country risk for banks may be
high. Collective debtor risk and contagion may lead to substantial losses on the credit portfolio in the event of a large country risk (or regional) crisis. A higher correlation
between changes in asset values may imply higher Economic Capital and regulatory
capital. This conclusion is very relevant for the new Basel II proposals. Since in the BaselII proposals only transfer risk is explicitly mentioned, it remains an open question how
and where the growing importance of collective debtor risk should be dealt with.
A second conclusion is that although country risk analysts and analysts at therating agencies do not have specific models to assign transfer and sovereign ratings,
models can explain rating levels quite well. As the Basel Committee requires these
models to have statistical power and to be consistent, it seems that this condition is met.This links in to the question whether the ways in which sovereign risk and transfer risk
are rated can be compared. On the basis of the information that both the rating agencies
and the international bank provide, one would be tempted to conclude that differences inrating methodology are minor. Both types of risk seem to have the same determinants.
However, there are also important differences between the way sovereign risk and
transfer risk are rated. Transfer rating changes in cases of adverse developments are largeand changes have a one off character. This contrasts with the step-by-step approach by
the rating agencies: downward adjustments are relatively often followed by further
downward adjustments. Moreover, the rating agencies lag the market. It has beenconcluded that these small downgrades take place in order not to damage the issuer with
a single blow. For Economic Capital calculation purposes, a ‘one off’ downgrade is
preferable to the approach by the rating agencies. The step by step approach by the rating
agencies is particularly relevant for the evaluation of the use of the standardized approachof the Basel II proposals.
Regarding rating migration, it is striking to see that credit, sovereign and transfer ratings both have abnormal migration in one of the higher rating categories. This
exception is the more interesting as most of the cases behind the abnormal migration of
sovereign ratings and transfer risk ratings are cases of ‘unwillingness to pay’. In theliterature it has been concluded that the ‘unwillingness to pay’ is the more challenging
and the most difficult ingredient of country and sovereign risk assessment, both for the
rating agencies and the country risk analysts. One could argue, in line with the label
‘event risk’ as provided by Moody’s, that the exposure to this risk should be tested in aseparate way.

8/6/2019 Basel II, Sovereign Ratings and Transfer Risk
http://slidepdf.com/reader/full/basel-ii-sovereign-ratings-and-transfer-risk 20/27
20
The analysis also points towards suggestions for further research. First, the data
used here would allow one to explore the possible procyclical behavior of internal models
in the context of country ratings. As mentioned, recent papers have argued that ratingagencies may contribute to the instability of emerging financial markets, both directly by
affecting stock and bond market returns of the countries being rated and indirectly
through cross-country contagion. The analysis here has highlighted that there may bedifferences between rating agencies and international banks in their adjustments of
country risk assessment following the onset of a financial crisis. This raises the question
whether international banks may also act differently from general international financial
markets towards emerging markets in crises and other emerging markets, therebycontribute differently to financial instability and possible contagion. The data available
here would allow this question to be explored.
Second, the data allows one to test theories regarding the relationship between
ratings and pricing of sovereign claims. One of the assumption underlying Basel II is that
the internal and external ratings bear a relationship to credit risk which in turn is reflected
in spreads demanded. Although, as noted, there is a relationship between changes inratings and spreads, the extent to which external ratings help explain the level of spreads
is being debated. The internal ratings data would allow for a comparison on how an
international bank’s risk assessment relates to spreads and whether this relationshipdiffers systematically from that of external ratings. Furthermore, the times series on
internal ratings can help clarify the relationships between risk assessments and actual
defaults. In case of pricing country risks, models often use the assumption that defaultleads to a full loss. In practice, default is not a full loss, but rather a shift tot he left in the
distribution of recoverable amounts and often an increase in uncertainty. The low
frequency of defaults makes normally for difficult modeling, but using the long timeseries available for internal ratings can perhaps help in exploring the relationship between
spreads, ratings and actual default experiences.

8/6/2019 Basel II, Sovereign Ratings and Transfer Risk
http://slidepdf.com/reader/full/basel-ii-sovereign-ratings-and-transfer-risk 21/27
21
References
Altman E.I., and A. Saunders (1998), Credit Risk Measurement: Developments over thelast 20 years, Journal of Banking and Finance.
Basel Committee on Banking Supervision (2001), The New Basel Capital Accord,Consultative Document , January 2001, BIS, www.bis.org.
Cantor, R., and F. Packer (1994), The Credit Rating Industry, Quarterly Review, Federal
Reserve Bank of New York, Vol. 19 (Summer-Fall), pp. 1–26.
Cantor R., and F. Packer (1995), Sovereign Credit Ratings, Current Issues in Economicsand Finance, Federal Reserve Bank of New York, June 1995.
Cantor, R., and F. Packer (1996), Determinants and Impacts of Sovereign Credit Ratings, Economic Policy Review, Federal Reserve Bank of New York, Vol. 2
(October), pp. 37–53.
Caouette, J.B., E. I. Altman, and P. Narayanan (1998), Managing Credit Risk: The Next
Great Financial Challenge.
Fitch IBCA (1998), Asia: Agencies’ Harsh Lessons in a Crisis, press release, 13 January
1998, www.bradynet.com/e312.html
Huhne, C. (1998), How the Rating Agencies Blew It on Korea, International Economy,
Vol. 12 (May/June), pp. 46–63.
IMF (1999), International Capital Markets: Developments, Prospects, and Key Policy
Issues, World Economic and Financial Surveys (Washington), Chapter 5, Annex 5 and 6,www.imf.org/external/pubs/ft/icm/1999/index.htm.
Jüttner, J. D., and J. McCarthy (1998), Modeling a Ratings Crisis (unpublished, Sydney,
Australia: Macquarie University), www.econ.mq.edu.au/courses/econ360/Soveig1.pdf
Kaminsky, Graciela and Sergio Schmukler, 2002, Emerging Markets Instability: Do
Sovereign Ratings Affect Country Risks and Stock Returns? Forthcoming, World Bank
Economic Review
Larrain G., H. Reisen, J. von Maltzan (1997), Emerging market risk and sovereign creditratings, OECD Technical Papers no. 124,
www.oecd.org/pdf/M00006000/M00006202.pdf
Moody’s Investor Service (2001), Default and Recovery Rates of Corporate Bond
Issuers: 2000, Special Comment (February).

8/6/2019 Basel II, Sovereign Ratings and Transfer Risk
http://slidepdf.com/reader/full/basel-ii-sovereign-ratings-and-transfer-risk 22/27
22
Nagy, P.J. (1984), Country Risk: How to Assess, Quantify, and Monitor it, Euromoney
publications, London.
Reisen H., and J. von Maltzan (1999), Boom and Bust in sovereign ratings, OECD
Technical Papers no. 148, www.oecd.org/pdf/M00006000/M00006204.pdf
Standard & Poor’s (1998), Sovereign Credit Ratings: A Primer (December).
Standard & Poor’s (2000), Sovereign 1999 Recap: The Ups, the Downs, and the moral of
it all (January).
8/6/2019 Basel II, Sovereign Ratings and Transfer Risk
http://slidepdf.com/reader/full/basel-ii-sovereign-ratings-and-transfer-risk 23/27
23
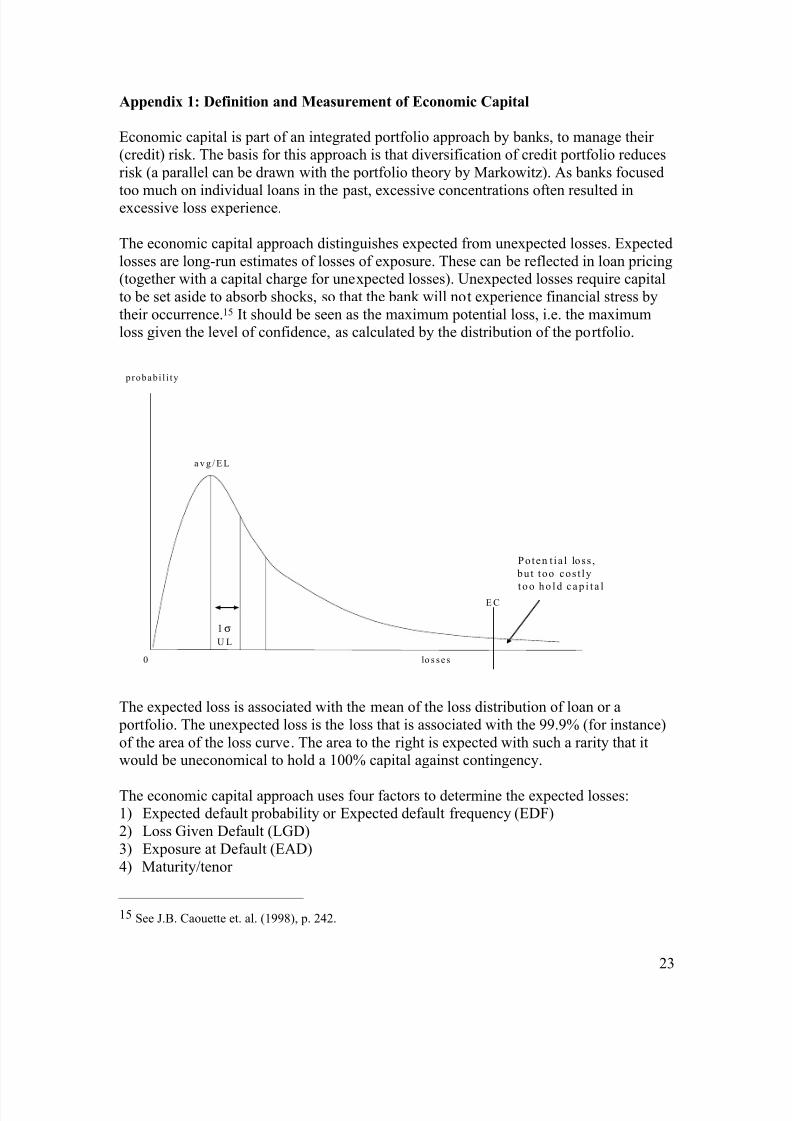
Appendix 1: Definition and Measurement of Economic Capital
Economic capital is part of an integrated portfolio approach by banks, to manage their (credit) risk. The basis for this approach is that diversification of credit portfolio reduces
risk (a parallel can be drawn with the portfolio theory by Markowitz). As banks focused
too much on individual loans in the past, excessive concentrations often resulted inexcessive loss experience.
The economic capital approach distinguishes expected from unexpected losses. Expected
losses are long-run estimates of losses of exposure. These can be reflected in loan pricing(together with a capital charge for unexpected losses). Unexpected losses require capital
to be set aside to absorb shocks, so that the bank will not experience financial stress by
their occurrence.15 It should be seen as the maximum potential loss, i.e. the maximumloss given the level of confidence, as calculated by the distribution of the portfolio.
0 lo s ses
probabi l i ty
a v g / E L
E C
1σ
U L
Poten t ia l lo ss ,
bu t too cos t ly
t o o h o l d c a p i t a l
The expected loss is associated with the mean of the loss distribution of loan or a
portfolio. The unexpected loss is the loss that is associated with the 99.9% (for instance)
of the area of the loss curve. The area to the right is expected with such a rarity that itwould be uneconomical to hold a 100% capital against contingency.
The economic capital approach uses four factors to determine the expected losses:1) Expected default probability or Expected default frequency (EDF)
2) Loss Given Default (LGD)
3) Exposure at Default (EAD)
4) Maturity/tenor
15 See J.B. Caouette et. al. (1998), p. 242.

8/6/2019 Basel II, Sovereign Ratings and Transfer Risk
http://slidepdf.com/reader/full/basel-ii-sovereign-ratings-and-transfer-risk 24/27
24
The Expected Loss (EL) is defined as:
EL = EDFtenor * EAD * LGD
with Default Probability (DP) linked to ratings and Loss Given Default (LGD) based onthe type of transaction/product and collateral. There are several ways to calculate default
probabilities, e.g. constructing rating migration matrices on the basis of rating behavior in
the past, using bond spreads etc. mapping ratings from the rating agencies.
The EL applied to transfer risk can be calculated as:
EL Transfer risk = Transfer Event Probabilitytenor * Transfer Risk Exposure at Default * LossGiven Transfer Event
Assets are divided into subclasses of varying risk and the LGTE can be estimated partly
by country risk rating category (a high income or low income country) and partly on a basis of past experience in (sovereign) workouts. Factors that contribute to lower risk
should be short tenor, export financing, co-financing with multilateral agencies, and local
currency denomination.
The calculation of the unexpected loss is driven by the volatility of the expected loss.
Apart from the described components (EDF, LGD, EAD) an additional correlation factor
is added. A commonly used measure for volatility is 2 EDF EDF − . Using this measure,
the Unexpected Loss can be calculated as follows:
bank i LGD EAD EDF EDF UL ρ ρ /* * *2−=
whereEAD = Exposure At Default
i ρ = Default Correlation of Country i to the total bank portfolio
bank ρ = The average Transfer Default Correlation of the total bank portfolio
A capital multiplier will then multiply this unexpected loss. This multiplier depends on
the rating of the bank and the credit portfolio of the bank. In the case of transfer risk,correlation between transfer ratings (this is in effect ‘country correlation’) has to be taken
into account.
8/6/2019 Basel II, Sovereign Ratings and Transfer Risk
http://slidepdf.com/reader/full/basel-ii-sovereign-ratings-and-transfer-risk 25/27
25
Appendix 2, Table 1: Determinants of Sovereign Credit Ratings (Cantor and Packer regressions)
(absolute t-statistics in parentheses)
ExplanatoryVariable
Average Ratings Moody's S&P Ratingdifference
Intercept 1.442 3.408 -0.524 3.932**
(0.633) ((1.379) (0.223) (2.521)
Per capita income 1.242*** 1.027*** 1.458*** -0.431***(5.302) (4.041) (6.048) (2.688)
GDP growth 0.151* 0.130 0.171** -0.040
(1.935) (1.545) (2.132) (0.756)Inflation -0.611*** -0.630*** -0.591*** -0.039
(2.839) (2.701) (2.671) (0.265)
Fiscal balance 0.073 0.049 0.097* -0.048
(1.324) (0.818) (1.71) (1.274)External balance 0.003 0.006 0.001 0.006
(0.314) (0.535) (0.046) (0.779)External debt -0.013*** -0.015*** -0.011*** -0.004**
(5.088) (5.365) (4.236) (2.133)
Ec. Development 2.776*** 2.957*** 2.595*** 0.362
(4.25) (4.175) (3.861) (0.81)Default history -2.042*** -1.463** -2.622*** 1.159***
(3.175) (2.097) (3.962) (2.632)
Adjusted R 2
0.924 0.905 0.926 0.251
Standard error 1.222 1.325 1.257 0.836
Source: Cantor and Packer (1996), table 5*Significant at 10% level **Significant at 5% level***Significant at 1% level
8/6/2019 Basel II, Sovereign Ratings and Transfer Risk
http://slidepdf.com/reader/full/basel-ii-sovereign-ratings-and-transfer-risk 26/27
26
Appendix 2, Table 2: Countries used in the transfer rating analysis
Tables 3 and 4 Table 7
Algeria X XArgentina X X
Bahrain X XBangladesh X XBotswana X XBrazil X XCameroon X XChile X XChina X XColombia X XCosta Rica X XCôte d'Ivoire X XCuba X
Cyprus X XEcuador X XEgypt X XGhana X XGreece X XGuatemala X XHonduras X XHungary X XIceland X XIndia X XIndonesia X XIran X XIraq XIsrael X XJordan X XKenya X XKuwait X XMalta X XMalaysia X XMexico X XMorocco X XNicaragua X XOman X XPakistan X XPanama X XParaguay X XPeru X XPhilippines X XPoland X XPortugal X X
8/6/2019 Basel II, Sovereign Ratings and Transfer Risk
http://slidepdf.com/reader/full/basel-ii-sovereign-ratings-and-transfer-risk 27/27
Qatar X XRomania X XRussia X XSaudi Arabia X XSenegal X X
Singapore X XSlovakia X XSlovenia X XSouth Africa X XSouth Korea X XSri Lanka X XTaiwan X XThailand X XTunisia X XTurkey X XUAE X X
Uruguay X XUzbekistan X XVenezuela X XVietnam X XYemen X XZimbabwe X XTotal 63 65