Basel II Pillar III Disclosures - Dubai Islamic Bank · DUBAI ISLAMIC BANK P.J.S.C. BASEL II –...
30
1 Basel II – Pillar III Disclosures (For the year ended 31 December 2016)
Transcript of Basel II Pillar III Disclosures - Dubai Islamic Bank · DUBAI ISLAMIC BANK P.J.S.C. BASEL II –...
1
Basel II – Pillar III Disclosures
(For the year ended 31 December 2016)

DUBAI ISLAMIC BANK P.J.S.C.
BASEL II – PILLAR III DISCLOSURES 31 DECEMBER 2016
2
1. Overview and introduction
The Central Bank of the United Arab Emirates (“CBUAE”) issued guidelines for implementation of Basel II Capital Accord
for the banks in UAE in November 2009. The CBUAE Basel II framework clearly addresses the importance of developing and
using better risk management techniques in monitoring and managing banks’ risks.
The Basel II Accord is based on the following three pillars:
Pillar I - defines the regulatory minimum capital requirements by providing rules and regulations for measurement of
credit risk, market risk and operational risk. The requirement of capital has to be covered by the banks’ own regulatory
funds;
Pillar II - addresses a bank’s Internal Capital Adequacy Assessment Program (“ICAAP”) for assessing overall capital
adequacy in relation to risks. Pillar II also introduces the Supervisory Review and Evaluation Process (“SREP”), which is
used as a tool to assess the internal capital adequacy of any bank; and
Pillar III - complements the other two pillars and focuses on enhanced transparency in information disclosure, covering
risk and capital management, including capital adequacy. The aim of these disclosures is to encourage market discipline
by developing a set of disclosure requirements which allow market participants to assess specific information in the scope
of application of Basel II, capital, particular risk exposures and risk assessment processes, and the capital adequacy of the
bank.
In compliance with the above mentioned CBUAE guidelines and Basel II Accord; these disclosures are prepared and include
information about Dubai Islamic Bank PJSC and its subsidiaries (collectively referred to as the “Group”) relating to the
financial group’s structure, capital structure, capital adequacy requirements, risk management objectives and policies, and
various supporting quantitative and qualitative disclosures.
Most of the Pillar III requirements have already been disclosed in the audited consolidated financial statements for the year
ended 31 December 2016, which covers in detail the risk and capital management processes of the Bank and its compliance
with the Basel II Accord. The following Pillar III disclosures provide qualitative and quantitative information in addition to the
consolidated financial statements for the year ended 31 December 2016 inorder to meet the disclosure requirements of Pillar
III.
Future developments
The regulation and supervision of financial institutions has undergone a significant shift since the global financial crisis. As
per Basel III standards and CBUAE guidelines, the regulatory focus on Liquidity Risk has been increased. Implementation of
revised guidelines on capital standards such as Leverage Ratio, Common Equity Tier 1 (CET1), Additional Tier 1 (AT1) and
Capital Buffers such as Capital Conservation Buffer (CCB), Countercyclical Buffer (CCyB) and Domestic Systemically
Important Banks Buffer (DSIBB) in line with the CBUAE revised guidelines is ongoing. Implementation of IFRS 9 forward
looking provisioning is currently under progress. There is close coordination between UAE banks and CBUAE for the smooth
implementation of the revised capital standards as per Basel III and any new guidelines or disclosure requirements that may
arise in future.
Implementation of Basel II/III guidelines
The Bank has been in compliance with Basel II Pillar I since December 2007, as per allowed by CBUAE guidelines1 circular
for Standardized Approach for Credit, Market and Operational Risk.
1 Further as per Basel Pillar II framework, the Bank assigns capital on risks other than Pillar I risk categories. Details on Pillar II methodologies are
contained in section No. 3.1 “Capital management policies” of this report.

DUBAI ISLAMIC BANK P.J.S.C.
BASEL II – PILLAR III DISCLOSURES 31 DECEMBER 2016
3
2. Group structure
The Bank consists of Dubai Islamic Bank P.J.S.C. and its subsidiaries. As of 31 December 2016, the Group’s interest held
directly or indirectly in its subsidiaries is as follows:
Name of subsidiary
Principal activity
Place of
incorporation and
operation
Ownership interest and
voting power
2016 2015
1. DIB Capital Limited (under liquidation) Investments and financial
services
DIFC, U.A.E.
-
95.5%
2. Dubai Islamic Bank Pakistan Ltd. Banking Pakistan 100.0% 100.0%
3. Tamweel P.S.C Financing U.A.E 92.0% 91.9%
4. DIB Bank Kenya Banking Kenya 100.0% -
5. Dubai Islamic Financial Services L.L.C. Brokerage services U.A.E 95.5% 95.5%
6. Deyaar Development P.J.S.C.
Real estate development U.A.E. 44.9% 44.9%
7. Dar al Shariah Financial & Legal
Consultancy L.L.C.
Financial and legal advisory U.A.E. 60.0% 60.0%
8. Al Tanmyah Services L.L.C. Labour services Egypt 99.5% 99.5%
9. Al Tatweer Al Hadith Real Estate Real estate development Egypt 100.0% 100.0%
10. Al Tameer Modern Real Estate
Investment
Real estate development Egypt 100.0% 100.0%
11. Al Tanmia Modern Real Estate
Investment
Real estate development U.A.E. 100.0% 100.0%
12. Naseej Fabric Manufacturing L.L.C. Textile Manufacturing U.A.E. 99.0% 99.0%
13. DIB Printing Press L.L.C. Printing U.A.E. 99.5% 99.5%
14. Al Islami Real Estate Investments Ltd. Investments U.A.E. 100.0% 100.0%
15. Emirates Automotive Leasing
Company
Trading in motor vehicles U.A.E. 100.0%
100.0%
In addition to the above subsidiaries, the following Special Purpose Vehicles (“SPV”) were formed by the Group to manage
specific transactions, including funds, and are expected to be closed upon completion of transactions:
Name of SPV
Principal activity
Place of
incorporation and
operation
Ownership interest and
voting power
2016 2015
16. HoldInvest Real Estate Sarl Investments Luxembourg 100.0% 100.0%
17. France Invest Real Estate SAS Investments France 100.0% 100.0%
18. SARL Barbanniers Investments France 100.0% 100.0%
19. SCI le Sevine Investments France 100.0% 100.0%
20. Findi Real Estate SAS Investments France 100.0% 100.0%
21. PASR Einudzwanzigste
Beteiligunsverwaltung GMBH
Investments
Austria
100.0%
100.0%
22. Al Islami German Holding Co. GMBH Investments Germany 100.0% 100.0%
23. Rhein Logistics GMBH Investments Germany 100.0% 100.0%
24. Jef Holdings BV Investments Netherlands 100.0% 100.0%
25. Al Islami Trade Finance FZ L.L.C. Investments U.A.E. 100.0% 100.0%
26. Gulf Atlantic FZ L.L.C. Investments U.A.E. 100.0% 100.0%
27. Al Islami Oceanic Shipping Co FZ L.L.C. Investments U.A.E. 100.0% 100.0%
28. MESC Investment Company Investments Jordan 40.0% 40.0%
29. Levant One Investment Limited Investments U.A.E. 100.0% 100.0%
30. Petra Limited Investments Cayman Islands 100.0% 100.0%
31. Sequia Investments L.L.C. Investments U.A.E. 99.0% 99.0%
32. Blue Nile Investments L.L.C. Investments U.A.E. 99.0% 99.0%
In addition to the registered ownership described above, the remaining equity in the entities 31 and 32 are also beneficially held
by the Group through nominee arrangements.

DUBAI ISLAMIC BANK P.J.S.C.
BASEL II – PILLAR III DISCLOSURES 31 DECEMBER 2016
4
3. Capital management and policies
The Group’s regulatory capital is into two tiers and calculated as per the guidelines issued by CBUAE and is composed of:
Tier 1 Capital - includes share capital, Tier 1 sukuks, statutory reserves, general reserve, additional paid in capital, treasury
shares, retained earnings, exchange translation reserve and non-controlling interests, and other regulatory adjustments relating to
items that are included in equity but are treated differently for capital adequacy calculation purposes.
Tier 2 Capital – includes qualifying subordinated liabilities (i.e. Medium term wakala deposit), collective impairment allowance
and investment fair value reserve relating to unrealized gain/loss on equity instruments, measured as fair value through other
comprehensive income (“FVTOCI”).
Deductions from Tier 1 and Tier 2 - significant minority investments in banking, securities and other financial entities, where
control does not exist, are excluded from the capital.
3.1 Capital management objective
The Group objectives in managing capital are:
To comply with the capital requirements set by the Central Bank of U.A.E.;
To safeguard the Group ability to continue as a going concern and increase the returns for the shareholders; and
To maintain a strong capital base to support the development of its business.
The Bank is governed by the Central Bank of UAE guidelines on regulatory capital requirements for the group and the overseas
branches and subsidiaries of the bank are directly supervised by their local regulators.
The main objective of the bank’s capital management policies is to ensure that it has sufficient capital to cover the risks associated
with its activities. The assessment of the various risks across the bank and their likely impact is carried out annually in conjunction
with ICAAP. As part of ICAAP process, risk management division identifies various risks the bank is exposed to as part of its
day-to-day operations. The Bank establishes policies and procedures, frameworks and methodologies, contingency plans and
other processes to measure, manage and mitigate the impact of such risks. Based on this the bank determines the risks which
should be covered by capital.
The key objectives of the bank’s capital management process are:
Maintain sufficient capital to meet minimum capital requirement set by the Central Bank of UAE;
To ensure smooth transition to Basel III compliance in terms of capital and liquidity ratios;
Maintain sufficient capital to support bank’s risk appetite in line with the strategic objectives as per the medium term
strategic plan;
Maintain adequate capital to withstand stress scenarios including increased capital requirements determined through
ICAAP; and
To support the Bank’s credit rating.
The capital management process of the bank is aligned with the overall business strategy to ensure that capital is adequate for the
level of inherent risk in the business. The bank conducts capital planning in conjunction with the strategic business and financial
planning exercise. The Bank develops medium-term strategic plan on a rolling basis which is updated annually. Detailed business
plan and budget for the year is prepared based on the medium-term plan. The overall strategic plan and budget are approved by the
Board of Directors of the bank. The business plan and budget for the year are cascaded down to the individual businesses. The
detailed business plan and budget provides the foundation for financial risk management and planning exercise.
3.2 Regulatory capital
The Bank’s lead regulator the Central Bank of U.A.E. sets and monitors capital requirements for the Group as a whole. The
Group and individual banking operations within the Bank are directly supervised by their respective local regulators.
Various limits are applied to elements of the capital base as per Basel II guidelines:
Tier 2 capital cannot exceed 67% of tier 1 capital;
Tier 1 capital must be a minimum of 8% of risk weighted assets; and
Qualifying subordinated liabilities capital cannot exceed 50% of tier 1 capital.
DUBAI ISLAMIC BANK P.J.S.C.
BASEL II – PILLAR III DISCLOSURES 31 DECEMBER 2016
5
3. Capital management and policies (continued)
3.2 Regulatory capital (continued)
Capital adequacy and the use of regulatory capital are monitored on a regular basis by the Bank's management, employing
techniques based on the guidelines developed by the Basel Committee and the Central Bank of United Arab Emirates. The
required information is filed with the regulators on a monthly or/and quarterly basis.
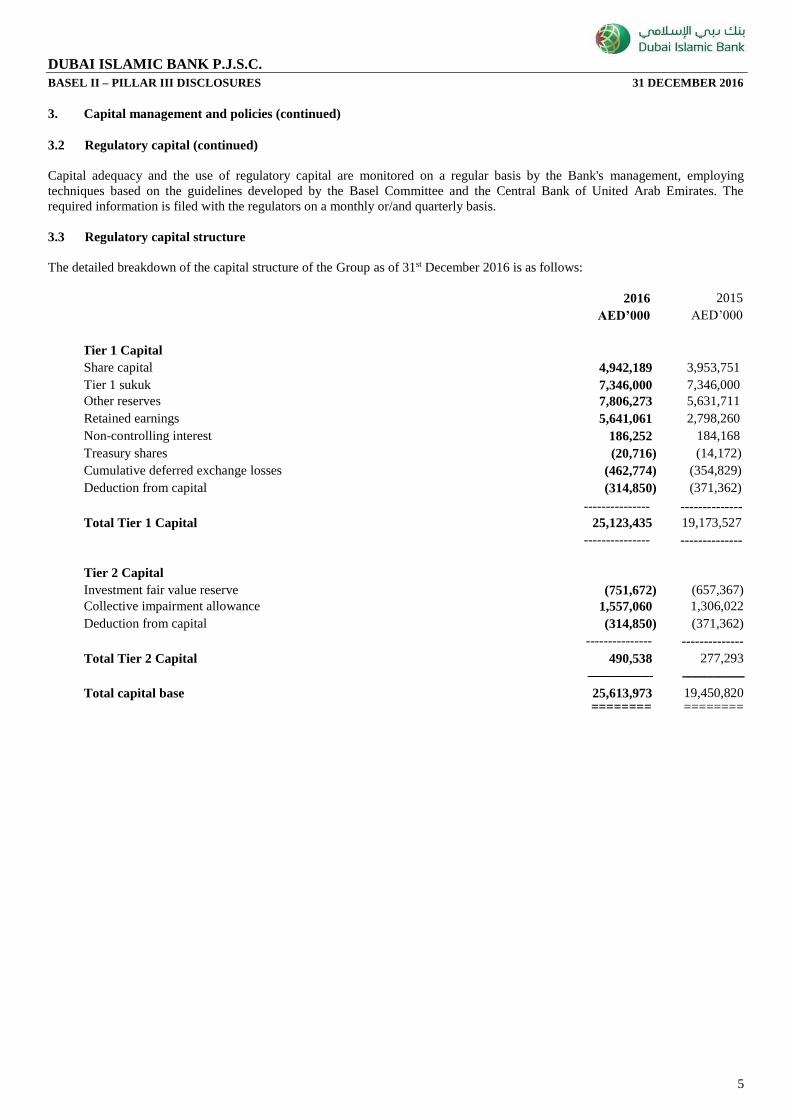
3.3 Regulatory capital structure
The detailed breakdown of the capital structure of the Group as of 31st December 2016 is as follows:
2016 2015
AED’000 AED’000
Tier 1 Capital
Share capital 4,942,189 3,953,751
Tier 1 sukuk 7,346,000 7,346,000
Other reserves 7,806,273 5,631,711
Retained earnings 5,641,061 2,798,260
Non-controlling interest 186,252 184,168
Treasury shares (20,716) (14,172)
Cumulative deferred exchange losses (462,774) (354,829)
Deduction from capital (314,850) (371,362)
--------------- --------------
Total Tier 1 Capital 25,123,435 19,173,527 --------------- --------------
Tier 2 Capital
Investment fair value reserve (751,672) (657,367)
Collective impairment allowance 1,557,060 1,306,022
Deduction from capital (314,850) (371,362)
--------------- --------------
Total Tier 2 Capital 490,538 277,293
--------------------- --------------------
Total capital base 25,613,973 19,450,820
======== ========

DUBAI ISLAMIC BANK P.J.S.C.
BASEL II – PILLAR III DISCLOSURES 31 DECEMBER 2016
6
3. Capital management and policies (continued)
3.4 Capital Adequacy
The Group assets are risk weighted as to their relative credit, market, and operational risk. Credit risk includes both on and off-
balance sheet risks. Market risk is defined as the risk of losses in on and off-balance sheet positions arising from movements in
market prices and includes profit rate risk, foreign exchange risk, equity exposure risk, and commodity risk. Operational risk is
defined as the risk of loss resulting from inadequate or failed internal processes, people or systems, or from external events.
The Group is following the standardized approach for credit, market and operational risk, as permitted by the U.A.E. Central Bank
and as per Pillar 1 of Basel 2.
The Group’s capital adequacy ratios as of 31 December 2016 were calculated by using the standardized approach as follows:
Risk weighted assets 2016
AED’000
2015
AED’000
Credit Risk
129,748,218
112,931,155
Market Risk 1,056,258 1,655,917
Operational Risk 10,590,092 8,975,375
----------------- ----------------
Total risk weighted assets 141,394,568 123,562,447
========== =========
Capital adequacy ratios:
Capital adequacy ratio
18.1%
15.7%
Tier 1 capital adequacy ratio
17.8%
15.5%
The Group’s Capital Adequacy ratio as at 31 December 2016 is 18.1% and Tier 1 capital adequacy ratio is 17.8% against the
regulatory requirement of minimum of 12% and 8%, respectively. The Group ensures adherence to CBUAE requirements by
implementing high internal limits.
The banking subsidiaries of the Group are regulated by their local banking supervisors who set and monitor their capital adequacy
requirements. CBUAE monitors the capital adequacy requirements of the Bank at a financial group level.
During the years ended 31 December 2016 and 2015, the Bank complied in full with all its externally imposed regulatory capital
requirements.

DUBAI ISLAMIC BANK P.J.S.C.
BASEL II – PILLAR III DISCLOSURES 31 DECEMBER 2016
7
3. Capital management and policies (continued)
3.4. Capital adequacy (continued)
3.4.1 Credit risk weighted assets
The details of Credit Risk Weighted Assets as of 31 December 2016 are as follows:
Gross
Exposure
AED’000
Risk Weighted
Assets
AED’000
Claims on sovereigns 27,819,820 3,997,222
Claims on non-commercial public sector enterprises (PSEs) 2,733,328 132,533
Claims on multilateral development banks 92,391 -
Claims on banks 28,548,307 3,361,330
Claims on corporate and government related entities (GRE) 120,218,331 77,139,946
Claims included in the regulatory retail portfolio 23,630,291 17,767,829
Claims secured by residential property 12,230,924 6,714,615
Claims secured by commercial real estate 9,445,492 9,168,094
Past due financing assets 7,421,487 2,768,656
Higher-risk categories 889,854 894,403
Other assets 9,849,264 7,803,590
----------------- -----------------
Total 242,879,488 129,748,218
========== ==========
The details of Credit Risk Weighted Assets as of 31 December 2015 are as follows:
Gross
Exposure
AED’000
Risk Weighted
Assets
AED’000
Claims on sovereigns 21,438,529 3,216,771
Claims on non-commercial public sector enterprises (PSEs) 2,163,443 62,314
Claims on multilateral development banks 59,765 -
Claims on banks 25,135,191 2,423,084
Claims on corporate and government related entities (GRE) 103,687,720 64,675,226
Claims included in the regulatory retail portfolio 22,332,700 16,919,297
Claims secured by residential property 12,121,062 6,720,209
Claims secured by commercial real estate 8,156,033 7,709,120
Past due financing assets 7,226,452 2,808,466
Higher-risk categories 964,936 1,007,026
Other assets 9,817,797 7,389,644
----------------- ----------------
Total 213,103,630 112,931,156
========== ==========

DUBAI ISLAMIC BANK P.J.S.C.
BASEL II – PILLAR III DISCLOSURES 31 DECEMBER 2016
8
3. Capital management and policies (continued)
3.4. Capital adequacy (continued)
3.4.2 Market risk weighted assets
Market risk weighted assets subject to capital charge are based on the following risks:
Profit rate risk;
Foreign exchange risk; and
Equity risk.
The scope of capital charges on market risk weighted assets is restricted to ‘trading book’ only for the profit rate risk and
equity positions. Foreign exchange risk is applicable to the Bank’s overall positions.
As of 31st December 2016, the capital requirement for Market2 Risk as per standardized approach was as follows:
2016
AED’000
2015
AED’000
Profit rate risk 5,429 14,244
Foreign exchange risk 120,635 184,466
Equity 686 -
-------------- --------------
Total capital requirement for market risk 126,751 198,710
======== ========
3.4.3 Operational risk weighted assets
In accordance with Basel II guidelines operational risk charge is computed by multiplying the beta factors of respective
banking business activities, subject to and as required by the Standardised Approach. The total capital requirement for
Operational3 Risk as at 31st December 2016 is AED 1,271 million.
No changes have been made to the capital management objectives, policies and processes from the previous year. However,
they are under constant review by the management.
2 Market Risk is reported as per Basel II guidelines Standardised Approach only for Foreign exchange risk compared to overall including profit rate
risk and equity positions reported prior to third quarter of 2014.
3 Operational Risk is currently reported as per Basel II guidelines Standardised Approach compared to Basic Indicator Approach used prior to 2014.

DUBAI ISLAMIC BANK P.J.S.C.
BASEL II – PILLAR III DISCLOSURES 31 DECEMBER 2016
9
4. Risk management objectives and policies
4.1 Introduction
Risk is inherent in the Group’s activities but it is managed through a process of ongoing identification, measurement and
monitoring, subject to risk limits and other controls. This process of risk management is critical to the Group’s continuing
profitability and each individual within the Group is accountable for the risk exposures relating to his responsibilities.
The Group is exposed to various risks including:
Credit risk;
Liquidity risk;
Market risk; and
Operational risk.
The independent risk control process does not include business risks such as changes in the environment, technology and
industry. They are monitored through the Group’s strategic planning process.
4.1.1 Risk management structure
The Board of Directors, supported by the Risk Management Committee (Board and Management) and Risk Management
Department, is ultimately responsible for identifying and controlling risks; however, there are separate independent bodies
responsible for managing and monitoring risks.
Board of Directors
The Board of Directors is responsible for the overall risk management approach and for approving the risk strategies and
policies.
Board Risk Management Committees
The Board Risk Management Committee has the overall responsibility for the development of the risk strategies, frameworks,
policies and limits, and for recommending these strategies and policies to the Board of Directors. It is responsible for the
fundamental risk issues, and manages and monitors relevant risk decisions.
Risk Management Committee
The day-to-day management of risk has been delegated to Risk Management Committee.
The Risk Management Committee has the overall responsibility to support the Board Risk Management Committee for the
development and formulation of the risk strategy, frameworks, policies and limits. It is responsible for ensuring the
compliance with all risk limits, monitoring risk exposures and implementing the regulatory guidelines issued by the
regulatory bodies (e.g. The Central Bank of the U.A.E.).
Risk Management Department
The Risk Management is responsible for implementing and maintaining risk related procedures to ensure risk remains within
the acceptable range as approved by the Board Risk Management Committee and the Board of Directors. The department is
responsible for credit administration, portfolio management, credit risk, market risk, operational risk and overall risk control.
Asset and Liability Management Committee
Asset and Liability Management Committee (“ALCO”) is responsible for managing the Group’s assets and liabilities and the
overall financial structure. It is also primarily responsible for the funding and liquidity risks of the Group.

DUBAI ISLAMIC BANK P.J.S.C.
BASEL II – PILLAR III DISCLOSURES 31 DECEMBER 2016
10
4. Risk management objectives and policies (continued)
4.1 Introduction (continued)
4.1.1 Risk management structure (continued)
Internal Audit Department
Risk management processes throughout the Group are audited periodically by the Internal Audit Department which examines
both the adequacy of the procedures and the Group compliance with the procedures. Internal Audit Department comments on
the results of their assessments with management, and reports its findings and recommendations to the Board Audit
Committee.
4.1.2 Risk measurement and reporting systems
The Group measures risks using conventional qualitative methods for credit, market, liquidity and operational risks. Further,
the Group also uses quantitative analysis and methods to support revisions in business and risk strategies as and when
required. These analysis and methods reflect both the expected loss likely to arise in normal course of business or unexpected
losses in an unforeseen event based on simple statistical techniques and probabilities derived from historical experience. The
Group also runs stress scenarios that would arise in the event that extreme events which are unlikely to occur do, in fact,
occur.
Monitoring and controlling risks is primarily performed based on limits established by the Board of Directors and
management. These limits reflect the business strategy and market environment of the Group as well as the level of risk that
the Group is willing to accept, with additional emphasis on selected industries.
Information compiled from all the businesses is examined and processed in order to analyse the risk profile and identify early
risks. This information is presented and explained to the management, management committees, the Risk Management
Committee of the management, and Board Risk Management Committee. Specialized reports are presented to the pertinent
heads of business and are delivered with a frequency suited to the volatility of the risk. The report includes aggregate credit
exposure, limit exceptions, liquidity, operational loss incidents and other risk profile changes. On a monthly basis, detailed
reporting of industry, customer and geographic risks takes place. Senior management assesses the appropriateness of the
provision for impairment losses on a quarterly basis.
4.1.3 Risk mitigation
As part of its overall risk management, the Group uses various methods to manage exposures resulting from changes in credit
risks, liquidity risks, market risks (including profit rate risk, foreign exchange risk, and equity price risk), and operational
risks.
The Group seeks to manage its credit risk exposures through diversification of financing and investing activities to avoid
undue concentration of risk with individuals and groups of customers in specific locations or businesses. The Group actively
uses collateral to reduce its credit risks.
In order to guard against liquidity risk, management has diversified funding sources and assets are managed with overall
Group liquidity in consideration maintaining a healthy balance of liquid assets (i.e. cash and cash equivalents).
The market risks are managed on the basis of predetermined asset allocation across various asset categories and continuous
appraisal of market conditions for movement and expectation of foreign currencies rate, bench mark profit rates and equity
houses.
To manage all other risks, the Group has developed a detailed risk management framework to identify and apply resources to
mitigate the risks.
4.1.4 Risk concentration
Concentrations arise when a number of counterparties are engaged in similar business activities, or activities in the same
geographic region, or have similar economic features that would cause their ability to meet contractual obligations to be
similarly affected by changes in economic, political or other conditions. Concentrations indicate the relative sensitivity of the
Group performance to developments affecting a particular industry or geographical location.

DUBAI ISLAMIC BANK P.J.S.C.
BASEL II – PILLAR III DISCLOSURES 31 DECEMBER 2016
11
4. Risk management objectives and policies (continued)
4.2 Credit risk
In order to avoid excessive concentrations of risk, the Group’s policies and procedures include specific guidelines to focus on
maintaining a diversified portfolio. Identified concentrations of credit risks are controlled and managed accordingly.
Credit risk measurement
The Group assesses the probability of default of individual counterparties using internal rating tools tailored to the various
categories of counterparties. Whilst some of the models for assessment of Real Estate projects are internally developed,
others for the Corporate, Contracting and SME businesses have been acquired from Moody’s and subsequently optimized
and calibrated to the Group’s internal rating scale. The models are housed with the Moody’s Risk Analyst rating tool.
The rating tools are kept under review and upgraded as necessary. The Group regularly validates the performance of the
rating and their predictive power with regard to default events.
Collateral
The Group employs a range of policies and practices to mitigate credit risk. The most traditional of these is the taking of
securities for facilities provided, which is a common practice. The Group implements guidelines on the acceptability of
specific classes of collateral or credit risk mitigation. The principal collateral types for Islamic financing and investing assets
are:
Mortgages over residential and commercial properties;
Corporate guarantees;
Charges over business assets such as premises, machinery, vehicles and inventory; and
Charges over financial instruments such as deposits and equity investments.
Islamic derivative financial instruments
Credit risk arising from Islamic derivative financial instruments is, at any time, limited to those with positive fair values, as
recorded in the consolidated financial position.
Credit-related commitments risks
The Bank makes available to its customers guarantees and letters of credit which require that the Bank makes payments in the
event that the customer fails to fulfil certain obligations to other parties. This exposes the Group to a similar risk to Islamic
financing and investing assets and these are mitigated by the same control processes and policies.

DUBAI ISLAMIC BANK P.J.S.C.
BASEL II – PILLAR III DISCLOSURES 31 DECEMBER 2016
12
4. Risk management objectives and policies (continued)
4.2 Credit risk (continued)
4.2.1 Maximum exposure to credit risk without taking account of any collateral and other credit enhancements
The table below shows the maximum exposure to credit risk by class of financial asset, including Islamic derivatives. The
maximum exposure is shown gross, before the effect of mitigation through the use of collateral agreements.
Gross
maximum
exposure
2016
AED’000
Gross
maximum
exposure
2015
AED’000
Balances with central banks 14,767,767 11,228,210
Due from banks and financial institutions 4,546,197 5,084,740
Islamic financing and investing assets 120,526,273 102,267,696
Investment in Islamic sukuk measured at amortised cost 23,408,660 20,065,651
Other investments measured at fair value 1,717,311 1,830,986
Receivables and other assets 6,910,186 4,944,863 ---------------- ---------------- 171,876,394 145,422,146 Contingent liabilities 14,357,080 11,963,397
Commitments 19,872,165 25,234,339 ------------------ ----------------------- Total 206,105,639 182,619,882
======== ========
4.2.2 Risk concentrations of the maximum exposure to credit risk
Concentration of risk is managed by client/counterparty, by geographical region and by industry sector. The Group’s
financial assets, before taking into account any collateral held or other credit enhancements can be analysed by the following
geographical regions:
2016
AED’000
2015
AED’000
The U.A.E. 185,194,982 161,875,432
Other Gulf Cooperation Council (GCC) countries 4,742,931 4,550,718
South Asia 11,177,436 10,384,575
Europe 4,023,938 1,907,463
Africa 272,349 219,238
Other 694,003 3,682,456
---------------- ----------------
Total 206,105,639 182,619,882
======== ========
DUBAI ISLAMIC BANK P.J.S.C.
BASEL II – PILLAR III DISCLOSURES 31 DECEMBER 2016
13
4. Risk management objectives and policies (continued)
4.2 Credit risk (continued)
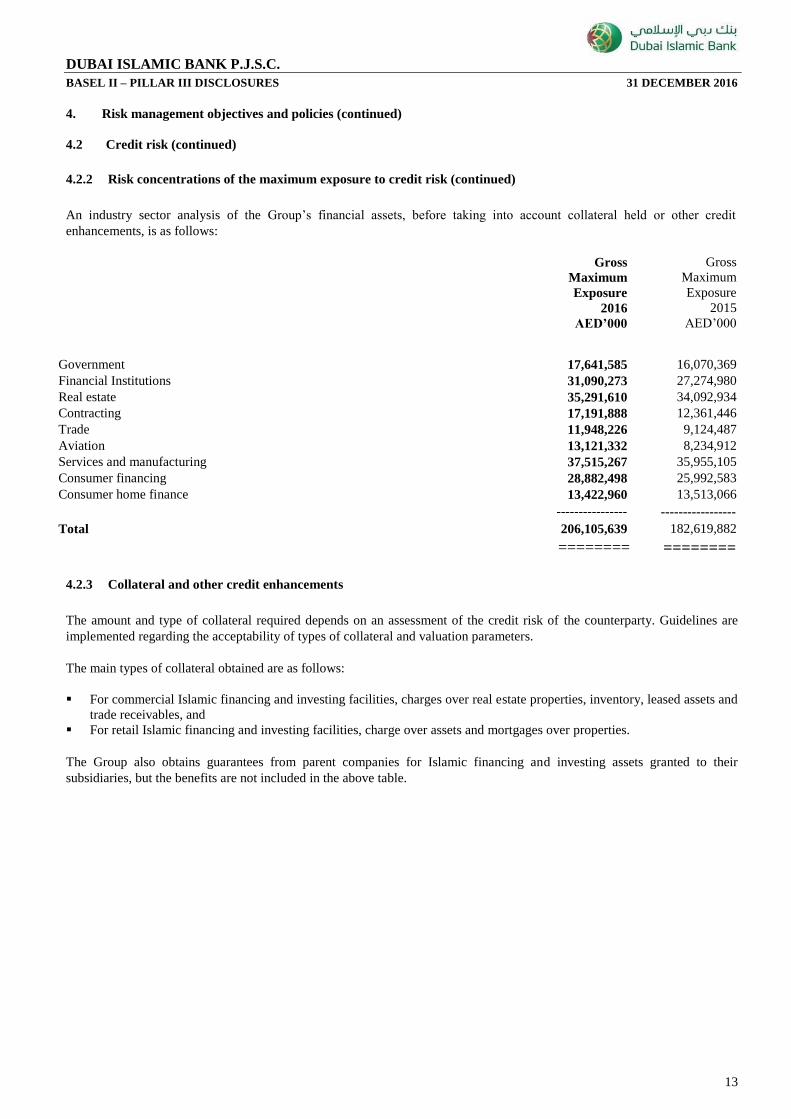
4.2.2 Risk concentrations of the maximum exposure to credit risk (continued)
An industry sector analysis of the Group’s financial assets, before taking into account collateral held or other credit
enhancements, is as follows:
Gross
Maximum
Exposure
2016
AED’000
Gross
Maximum
Exposure
2015
AED’000
Government 17,641,585 16,070,369
Financial Institutions 31,090,273 27,274,980
Real estate 35,291,610 34,092,934
Contracting 17,191,888 12,361,446
Trade 11,948,226 9,124,487
Aviation 13,121,332 8,234,912
Services and manufacturing 37,515,267 35,955,105
Consumer financing 28,882,498 25,992,583
Consumer home finance 13,422,960 13,513,066
---------------- -----------------
Total 206,105,639 182,619,882
======== ========
4.2.3 Collateral and other credit enhancements
The amount and type of collateral required depends on an assessment of the credit risk of the counterparty. Guidelines are
implemented regarding the acceptability of types of collateral and valuation parameters.
The main types of collateral obtained are as follows:
For commercial Islamic financing and investing facilities, charges over real estate properties, inventory, leased assets and
trade receivables, and
For retail Islamic financing and investing facilities, charge over assets and mortgages over properties.
The Group also obtains guarantees from parent companies for Islamic financing and investing assets granted to their
subsidiaries, but the benefits are not included in the above table.

DUBAI ISLAMIC BANK P.J.S.C.
BASEL II – PILLAR III DISCLOSURES 31 DECEMBER 2016
14
4. Risk management objectives and policies (continued)
4.2 Credit risk (continued)
4.2.4 Gross credit risk exposures as per standardized approach
The gross credit exposure as per standardized approach with the effect of CRM as of 31 December 2016 is detailed below:
December 2016
AED’000
On & Off Balance
Sheet Gross4
Outstanding
Credit Risk Mitigation (CRM)
Net exposure after
CCF
Exposure Before
Credit Risk
Mitigation (CRM) After CRM
Risk Weighted
Assets
Claims on sovereigns 27,819,820 27,819,820
_ 27,764,801 3,997,222
Claims on non-commercial public sector enterprises (PSEs) 2,733,328 2,733,328
_
2,733,328 132,533
Claims On Multi-Lateral Development Banks 92,391 92,391
_ 92,391
_
Claims on banks 28,548,307 28,548,307
_ 8,510,381
3,361,330
Claims on corporates and government related enterprises 120,218,331 120,077,357
7,479,213 78,773,565 77,139,946
Claims included in the regulatory retail portfolio 23,630,291 23,627,886
347,524 23,272,198 17,767,829
Claims secured by residential property 12,230,924 12,063,997
_ 12,063,997 6,714,615
Claims secured by commercial real estate 9,445,492 9,283,561
142,938 9,196,103 9,168,094
Past due financing assets 7,421,487 3,271,441
591,142 2,677,555 2,768,656
Higher-risk categories 889,854 889,854
293,585 596,268 894,403
Other assets 9,849,264 9,849,264
248,441 9,600,822 7,803,590
------------------ ------------------ ------------------ ------------------ -----------------
Total 242,879,488 238,257,205 9,102,843 175,281,410 129,748,218
=========== =========== =========== =========== ==========
4 As per CBUAE instructions and the revised CAR Returns template issued early first quarter of 2014 the On and Off Balance Sheet Gross Exposure is being reported as compared to the Credit Converted Equivalent
Exposure reported prior to 2014.
DUBAI ISLAMIC BANK P.J.S.C.
BASEL II – PILLAR III DISCLOSURES 31 DECEMBER 2016
15
4. Risk management objectives and policies (continued)
4.2 Credit risk (continued)
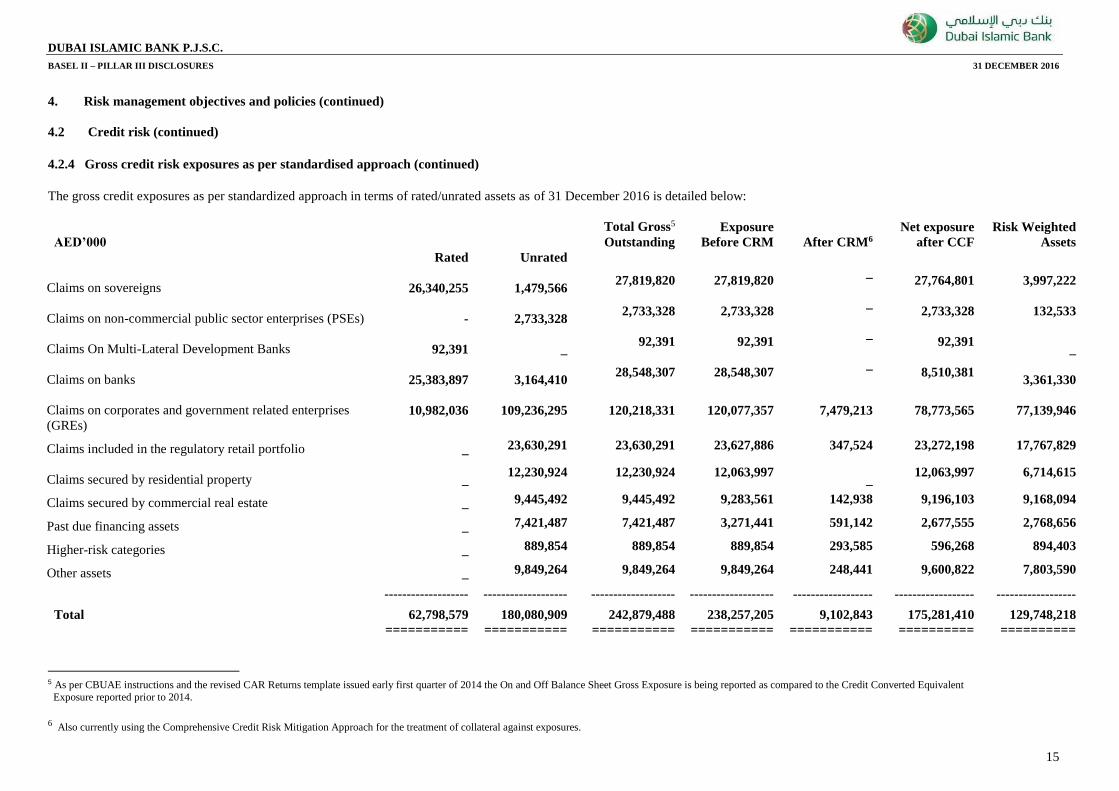
4.2.4 Gross credit risk exposures as per standardised approach (continued)
The gross credit exposures as per standardized approach in terms of rated/unrated assets as of 31 December 2016 is detailed below:
AED’000
Rated
Unrated
Total Gross5
Outstanding
Exposure
Before CRM
After CRM6
Net exposure
after CCF
Risk Weighted
Assets
Claims on sovereigns
26,340,255
1,479,566 27,819,820 27,819,820
_ 27,764,801 3,997,222
Claims on non-commercial public sector enterprises (PSEs)
-
2,733,328 2,733,328 2,733,328
_
2,733,328 132,533
Claims On Multi-Lateral Development Banks
92,391
_ 92,391 92,391
_ 92,391
_
Claims on banks
25,383,897
3,164,410 28,548,307 28,548,307
_ 8,510,381
3,361,330
Claims on corporates and government related enterprises
(GREs)
10,982,036
109,236,295 120,218,331 120,077,357 7,479,213 78,773,565 77,139,946
Claims included in the regulatory retail portfolio _ 23,630,291 23,630,291 23,627,886 347,524 23,272,198 17,767,829
Claims secured by residential property _ 12,230,924 12,230,924 12,063,997
_ 12,063,997 6,714,615
Claims secured by commercial real estate _ 9,445,492 9,445,492 9,283,561 142,938 9,196,103 9,168,094
Past due financing assets _ 7,421,487 7,421,487 3,271,441 591,142 2,677,555 2,768,656
Higher-risk categories _ 889,854 889,854 889,854 293,585 596,268 894,403
Other assets _ 9,849,264 9,849,264 9,849,264 248,441 9,600,822 7,803,590
------------------- ------------------- ------------------- ------------------- ------------------ ------------------ ------------------
Total 62,798,579 180,080,909 242,879,488 238,257,205 9,102,843 175,281,410 129,748,218
=========== =========== =========== =========== =========== ========== ==========
5 As per CBUAE instructions and the revised CAR Returns template issued early first quarter of 2014 the On and Off Balance Sheet Gross Exposure is being reported as compared to the Credit Converted Equivalent
Exposure reported prior to 2014.
6 Also currently using the Comprehensive Credit Risk Mitigation Approach for the treatment of collateral against exposures.
DUBAI ISLAMIC BANK P.J.S.C.
BASEL II – PILLAR III DISCLOSURES 31 DECEMBER 2016
16
4. Risk management objectives and policies (continued)
4.2 Credit risk (continued)
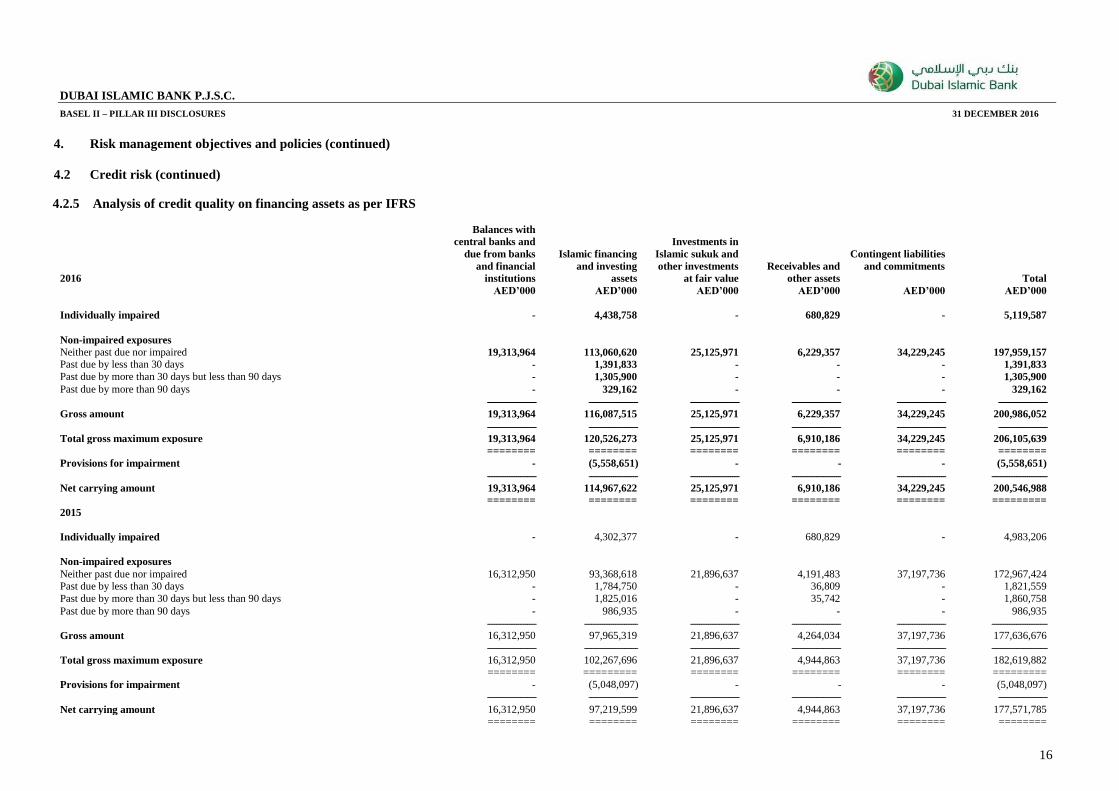
4.2.5 Analysis of credit quality on financing assets as per IFRS
2016
Balances with
central banks and
due from banks
and financial
institutions
Islamic financing
and investing
assets
Investments in
Islamic sukuk and
other investments
at fair value
Receivables and
other assets
Contingent liabilities
and commitments
Total
AED’000 AED’000 AED’000 AED’000 AED’000 AED’000
Individually impaired - 4,438,758 - 680,829 - 5,119,587
Non-impaired exposures
Neither past due nor impaired 19,313,964 113,060,620 25,125,971 6,229,357 34,229,245 197,959,157
Past due by less than 30 days - 1,391,833 - - - 1,391,833
Past due by more than 30 days but less than 90 days - 1,305,900 - - - 1,305,900
Past due by more than 90 days - 329,162 - - - 329,162
---------------------- ---------------------- ---------------------- ---------------------- ---------------------- ----------------------
Gross amount 19,313,964 116,087,515 25,125,971 6,229,357 34,229,245 200,986,052
---------------------- ---------------------- ---------------------- ---------------------- ---------------------- ----------------------
Total gross maximum exposure 19,313,964 120,526,273 25,125,971 6,910,186 34,229,245 206,105,639
======== ======== ======== ======== ======== ======== Provisions for impairment - (5,558,651) - - - (5,558,651)
---------------------- ---------------------- ---------------------- ---------------------- ---------------------- -------------------------
Net carrying amount 19,313,964 114,967,622 25,125,971 6,910,186 34,229,245 200,546,988
======== ======== ======== ======== ======== ========= 2015
Individually impaired - 4,302,377 - 680,829 - 4,983,206
Non-impaired exposures
Neither past due nor impaired 16,312,950 93,368,618 21,896,637 4,191,483 37,197,736 172,967,424 Past due by less than 30 days - 1,784,750 - 36,809 - 1,821,559
Past due by more than 30 days but less than 90 days - 1,825,016 - 35,742 - 1,860,758
Past due by more than 90 days - 986,935 - - - 986,935
---------------------- ------------------------ ---------------------- ---------------------- ---------------------- -------------------------
Gross amount 16,312,950 97,965,319 21,896,637 4,264,034 37,197,736 177,636,676
---------------------- ------------------------ ---------------------- ---------------------- ---------------------- -------------------------
Total gross maximum exposure 16,312,950 102,267,696 21,896,637 4,944,863 37,197,736 182,619,882 ======== ========= ======== ======== ======== ========= Provisions for impairment - (5,048,097) - - - (5,048,097)
---------------------- ---------------------- ---------------------- ---------------------- ---------------------- ----------------------
Net carrying amount 16,312,950 97,219,599 21,896,637 4,944,863 37,197,736 177,571,785
======== ======== ======== ======== ======== ========

DUBAI ISLAMIC BANK P.J.S.C.
BASEL II – PILLAR III DISCLOSURES 31 DECEMBER 2016
17
4. Risk management objectives and policies (continued)
4.2 Credit risk (continued)
4.2.6 Analysis of credit quality (continued)
Credit risk exposure of the Group’s financial assets as per IFRS for each internal risk rating
Moody’s
equivalent
grades
Total
2016
AED’000
Total
2015
AED’000
Low risk
Risk rating class 1 to 4 Aaa –Baa3 141,546,786 124,976,125 Fair risk
Risk rating classes 5 to 7 Ba1-Caa3 59,432,093 52,461,404 High risk
Risk rating classes 8 to11 5,126,760 5,182,353
----------------- -----------------
206,105,639 182,619,882
======== ========
It is the Group policy to maintain accurate and consistent risk ratings across the credit portfolio. This facilitates focused
management of the applicable risks and the comparison of financing exposures across all lines of business, geographic regions
and products. All internal risk ratings are tailored to the various categories and are derived in accordance with the Group rating
policy. The attributable risk ratings are assessed and updated regularly.
4.2.7 Analysis by economic sector and geography
The details of financing and investing assets by economic activity and geography are as below:
Within the U.A.E. Outside the U.A.E. Total
AED’000 AED’000 AED’000
2016
Government 3,923,465 1,219,871 5,143,336
Financial institutions 4,801,953 783,641 5,585,594
Real estate 19,595,437 - 19,595,437
Contracting 5,631,742 1,448,322 7,080,064
Trade 6,312,615 1,080,156 7,392,771
Aviation 10,672,641 171,184 10,843,825
Services and manufacturing 24,311,130 1,900,249 26,211,379
Consumer home finance 12,858,808 279,377 13,138,185
Consumer financing 25,038,758 496,924 25,535,682 ----------------- ----------------- -----------------
113,146,549 7,379,724 120,526,273
----------------- -----------------
Less: provision for impairment (5,558,651) --------------------- Total 114,967,622
=========

DUBAI ISLAMIC BANK P.J.S.C.
BASEL II – PILLAR III DISCLOSURES 31 DECEMBER 2016
18
4 Risk management objectives and policies (continued)
4.2 Credit risk (continued)
4.2.7 Analysis by economic sector and geography (continued)
Within the U.A.E. Outside the U.A.E. Total
AED’000 AED’000 AED’000
2015
Government 3,937,171 848,366 4,785,537
Financial institutions 4,612,109 571,750 5,183,859
Real estate 18,989,897 - 18,989,897
Contracting 2,732,658 1,451,502 4,184,160
Trade 4,295,572 1,252,453 5,548,025
Aviation 6,358,391 - 6,358,391
Services and manufacturing 18,101,307 2,551,510 20,652,817
Consumer home finance 12,957,394 244,755 13,202,149
Consumer financing 22,980,340 382,521 23,362,861 --------------- --------------- -----------------
94,964,839 7,302,857 102,267,696
--------------- ---------------
Less: provision for impairment (5,048,097) ------------------- Total 97,219,599
===========
4.2.8 Movements in the provision for impairment during the years ended 31 December 2016 and 2015
2016 2015
AED’000 AED’000
Balance at 1 January 5,048,097 5,147,044
Charge for the year
Specific 1,861,022 1,304,625
Collective 251,038 215,863
Release to consolidated statement of profit or loss (1,149,491) (1,036,421)
Write off (411,138) (380,283)
Others (40,877) (202,731)
--------------- ----------------- Balance at 31 December 5,558,651 5,048,097
----------------- ------------------ Gross amount of Islamic financing and investing assets,
determined to be impaired
4,438,758
4,302,377
======== ========
4.2.9 Impairment assessment
The main considerations for the impairment assessment include whether any payments of principal or profit are overdue by
more than 90 days (in line with the U.A.E. Central Bank guidelines) or there are any known difficulties in the cash flows of
counterparties, credit rating downgrades, or infringement of the original terms of the contract. The Group addresses impairment
assessment in two areas: individually assessed allowances and collectively assessed allowances.
Individually assessed allowances
The Group determines the allowances appropriate for each individually significant Islamic financing or investing asset on an
individual basis. Items considered when determining allowance amounts include the sustainability of the counterparty’s
business plan, its ability to improve performance once a financial difficulty has arisen, projected receipts and the expected
dividend payout should bankruptcy ensue, the availability of other financial support and the realisable value of collateral, and
the timing of the expected cash flows. The impairment losses are evaluated at each reporting date, unless unforeseen
circumstances require more careful attention.

DUBAI ISLAMIC BANK P.J.S.C.
BASEL II – PILLAR III DISCLOSURES 31 DECEMBER 2016
19
4 Risk management objectives and policies (continued)
4.2 Credit risk (continued)
4.2.10 Impairment assessment (continued)
Collectively assessed allowances
Allowances are assessed collectively for losses on Islamic financing and investing assets where there is not yet objective
evidence of individual impairment. Allowances are evaluated on each reporting date with each portfolio receiving a separate
review.
The collective assessment takes account of impairment that is likely to be present in the portfolio even though there is not yet
objective evidence of the impairment in an individual assessment. Impairment losses are estimated by taking into consideration
the following information: historical losses on the portfolio, current economic conditions, the approximate delay between the
time a loss is likely to have been incurred and the time it will be identified as requiring an individually assessed impairment
allowance, and expected receipts and recoveries once impaired. The impairment allowance is reviewed by credit risk
management to ensure alignment with the Group overall policy.
Acceptances and contingent liabilities are assessed and provisions made in a similar manner as for Islamic financing and
investing assets.

DUBAI ISLAMIC BANK P.J.S.C.
BASEL II – PILLAR III DISCLOSURES 31 DECEMBER 2016
20
4 Risk management objectives and policies (continued)
4.3 Liquidity risk and funding management
Liquidity risk is the risk that the Group will be unable to meet its payment obligations when they fall due under normal and
stress circumstances. To limit this risk, management has arranged diversified funding sources in addition to its core deposit
base, manages assets with liquidity in mind, and monitors future cash flows and liquidity on a daily basis. This incorporates an
assessment of expected cash flows and the availability of high grade collateral which could be used to secure additional
funding if required.
The Group maintains a portfolio of highly marketable and diverse assets that can be easily liquidated in the event of an
unforeseen interruption of cash flow. The Group also has committed lines of credit that it can access to meet liquidity needs. In
addition, the Group maintains statutory deposits with the central banks. The liquidity position is assessed and managed under a
variety of scenarios, giving due consideration to stress factors relating to both the market in general and specifically to the
Group.
The high quality of the asset portfolio ensures its liquidity and coupled with the Group’s own funds and “evergreen” customer
deposits help form a stable funding source. Even under adverse conditions, the Group has access to the funds necessary to
cover customer needs and meet its funding requirements.
The primary tool for monitoring liquidity is the maturity mismatch analysis, which is monitored over successive time bands
and across functional currencies. Guidelines are established for the cumulative negative cash flow over successive time bands.
4.3.1 Liquidity risk management process
The Group liquidity risk management process, as carried out within the Group and monitored by a separate team in Group
Treasury department, includes:
Day-to-day funding, managed by monitoring future cash flows to ensure that requirements can be met. This includes
replenishment of funds as they mature or are financed by customers;
Maintaining a portfolio of highly marketable assets that can easily be liquidated as protection against any unforeseen
interruption to cash flow;
Monitoring financial position liquidity ratios against internal and regulatory requirements; and
Managing the concentration and profile of Islamic financing and investing exposures maturities.
Based on the internal guidelines, the liquidity ratio (Stressed Liquid Assets/Total Assets (%)) at the end of each quarter during
the year were as follows:
March June September December
2016 15% 14% 10% 7%
======= ======= ======= =======
2015 16% 20% 16% 11%
======= ======= ======= =======
4.3.2 Funding approach
Sources of liquidity are regularly reviewed by management to maintain a wide diversification by currency, geography,
provider, product and term. During the year ended 31 December 2013 and 31 December 2015, the Bank issued Tier 1 sukuk of
AED 3,673 million (USD 1,000 million) each to diversify sources of funding to support business growth going forward.
The Group also uses senior Sukuks to manage its medium to long term liquidity position. As at 31 Dec 2016, an amount of
AED 7,695 million (31 Dec 2015: AED 5,602 million) was outstanding on account of Sukuk’s financing instruments.
4.3.3 Non-derivative cash flows
The table below summarises the maturity profile of the gross cash flows of the Group financial assets and liabilities as at 31
December 2016 and 2015. The amounts disclosed in the table are the contractual gross cash flows, whereas the Group manages
the inherent liquidity risk based on expected gross cash flows.
Repayments which are subject to notice are treated as if notice were to be given immediately. However, the management
expects that many customers will not request repayment on the earliest date the Group could be required to pay and the table
does not reflect the expected cash flows indicated by the Group’s deposit retention history.

DUBAI ISLAMIC BANK P.J.S.C.
BASEL II – PILLAR III DISCLOSURES 31 DECEMBER 2016
21
4. Risk management objectives and policies (continued)
4.3 Liquidity risk and funding management (continued)
4.3.3 Non-derivative cash flows
On demand
Less than
3 months
3 months to 1
year
1 to 5
years
Over 5
years
Total
AED’000 AED’000 AED’000 AED’000 AED’000 AED’000
2016
Balances with central banks 2,613,921 11,883,869 364,062 - - 14,861,852
Due from banks and financial
institutions
3,952,362
399,762
-
231,645
4,583,769
Islamic financing and investing
assets, net
4,775,561
11,347,874
18,558,897
59,074,743
27,608,424
121,365,499
Investment in Islamic sukuk
measured at amortised cost
11,897
573,709
903,763
12,034,465
15,381,734
28,905,568
Other investments measured at fair
value
586
-
819,198
897,527
-
1,717,311
Receivables and other assets 47,347 4,618,567 731,815 506,155 - 5,903,884
--------------------- --------------------- --------------------- ---------------------- -------------------- -----------------------
Total assets 11,401,674 28,823,781 21,377,735 72,744,535 42,990,158 177,337,883
======== ======== ======== ======== ======== =========
Customers’ deposits 10,009,015 21,821,682 58,208,995 35,480,444 35,880 125,556,016
Due to banks and other financial
institutions
5,070,475
520,919
2,317,334
2,887,215
-
10,795,943
Sukuk issued - 1,102,500 1,836,500 4,756,155 - 7,695,155
Payables and other liabilities 121,409 4,293,331 1,421,353 2,326,148 - 8,162,241
Zakat payable - - 242,289 - - 242,289
--------------------- --------------------- --------------------- ---------------------- ------------------- ------------------------
Total liabilities 15,200,899 27,738,432 64,026,471 45,449,962 35,880 152,451,644
========= ========= ========= ========= ======= ==========

DUBAI ISLAMIC BANK P.J.S.C.
BASEL II – PILLAR III DISCLOSURES 31 DECEMBER 2016
22
4. Risk management objectives and policies (continued)
4.3 Liquidity risk and funding management (continued)
4.3.3 Non-derivative cash flows (continued)
On demand
Less than
3 months
3 months to 1
year
1 to 5
years
Over 5
years
Total
AED’000 AED’000 AED’000 AED’000 AED’000 AED’000
2015
Balances with central banks 1,789,570 9,069,676 114,001 255,679 - 11,228,926
Due from banks and financial
institutions
5,608,046
561,973
186,309
264,738
-
6,621,066
Islamic financing and investing
assets, net
3,861,383
10,469,777
19,500,423
53,745,720
32,248,517
119,825,820
Investment in Islamic sukuk
measured at amortised cost
1,503
2,161,499
2,617,584
11,284,141
7,849,974
23,914,701
Other investments measured at fair
value
-
-
867,512
963,474
-
1,830,986
Receivables and other assets 48,262 135,502 2,121,380 2,710,137 - 5,015,281
--------------------- --------------------- --------------------- ---------------------- ---------------------- -------------------------
Total assets 11,308,764 22,398,427 25,407,209 69,223,889 40,098,491 168,436,780
======== ======== ======== ======== ======== ==========
Customers’ deposits 13,607,636 25,083,691 46,695,181 26,739,448 121,997 112,247,953
Due to banks and other financial
institutions
1,780,966
508,845
1,994,886
477,184
-
4,761,881
Sukuk issued - - - 6,520,175 - 6,520,175
Payables and other liabilities 92,887 3,970,273 1,470,091 1,056,397 - 6,589,648
Zakat payable - - 218,343 - - 218,343
--------------------- --------------------- --------------------- ---------------------- ------------------- ------------------------
Total liabilities 15,481,489 29,562,809 50,378,501 34,793,204 121,997 130,338,000
======== ======== ======== ======== ======= =========
Assets available to meet all of the liabilities and to cover outstanding commitments include cash and balances with central banks,
Islamic financing and investing assets, other investments at fair value and items in the course of collection.
DUBAI ISLAMIC BANK P.J.S.C.
BASEL II – PILLAR III DISCLOSURES 31 DECEMBER 2016
23
4. Risk management objectives and policies (continued)
4.3 Liquidity risk and funding management (continued)
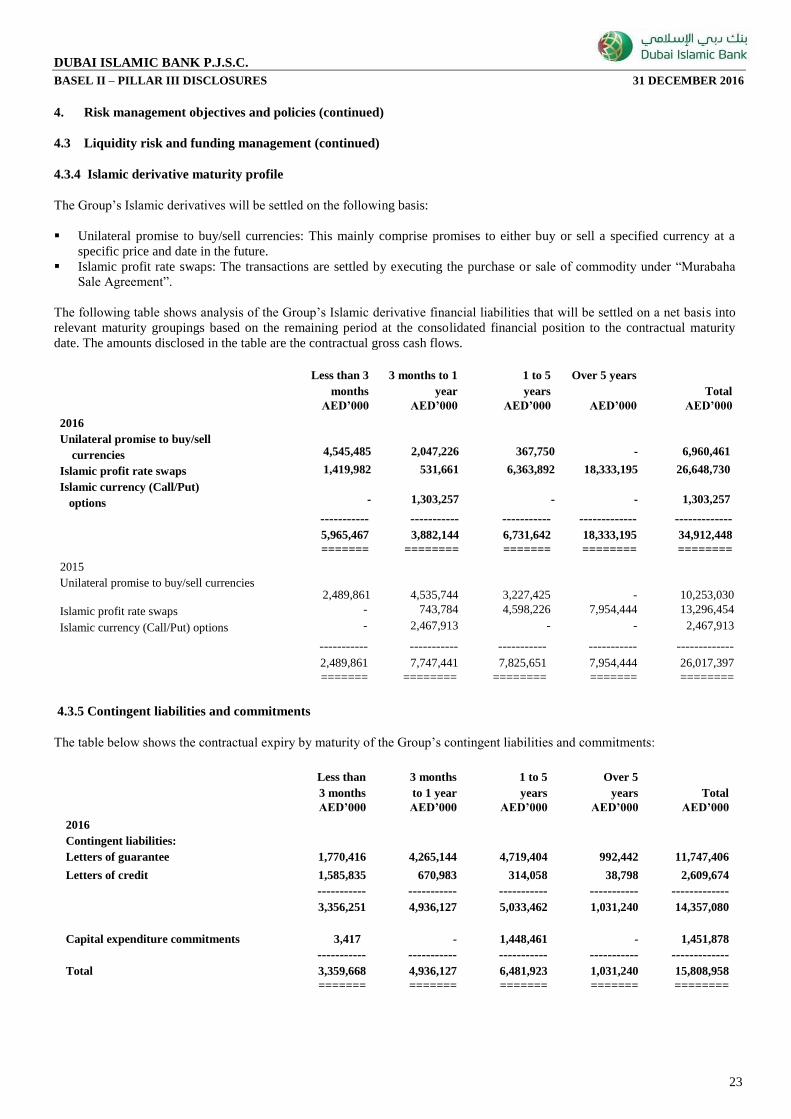
4.3.4 Islamic derivative maturity profile
The Group’s Islamic derivatives will be settled on the following basis:
Unilateral promise to buy/sell currencies: This mainly comprise promises to either buy or sell a specified currency at a
specific price and date in the future.
Islamic profit rate swaps: The transactions are settled by executing the purchase or sale of commodity under “Murabaha
Sale Agreement”.
The following table shows analysis of the Group’s Islamic derivative financial liabilities that will be settled on a net basis into
relevant maturity groupings based on the remaining period at the consolidated financial position to the contractual maturity
date. The amounts disclosed in the table are the contractual gross cash flows.
Less than 3
months
3 months to 1
year
1 to 5
years
Over 5 years
Total
AED’000 AED’000 AED’000 AED’000 AED’000
2016
Unilateral promise to buy/sell
currencies
4,545,485
2,047,226
367,750
-
6,960,461
Islamic profit rate swaps 1,419,982 531,661 6,363,892 18,333,195 26,648,730
Islamic currency (Call/Put)
options
-
1,303,257
-
-
1,303,257
----------- ----------- ----------- ------------- -------------
5,965,467 3,882,144 6,731,642 18,333,195 34,912,448
======= ======== ======= ======== ========
2015
Unilateral promise to buy/sell currencies
2,489,861
4,535,744
3,227,425
-
10,253,030
Islamic profit rate swaps - 743,784 4,598,226 7,954,444 13,296,454
Islamic currency (Call/Put) options - 2,467,913 - - 2,467,913
----------- ----------- ----------- ----------- -------------
2,489,861 7,747,441 7,825,651 7,954,444 26,017,397
======= ======== ======== ======= ========
4.3.5 Contingent liabilities and commitments
The table below shows the contractual expiry by maturity of the Group’s contingent liabilities and commitments:
Less than
3 months
3 months
to 1 year
1 to 5
years
Over 5
years
Total
AED’000 AED’000 AED’000 AED’000 AED’000
2016
Contingent liabilities:
Letters of guarantee 1,770,416 4,265,144 4,719,404 992,442 11,747,406
Letters of credit 1,585,835 670,983 314,058 38,798 2,609,674
----------- ----------- ----------- ----------- -------------
3,356,251 4,936,127 5,033,462 1,031,240 14,357,080
Capital expenditure commitments
3,417
-
1,448,461
-
1,451,878
----------- ----------- ----------- ----------- -------------
Total 3,359,668 4,936,127 6,481,923 1,031,240 15,808,958
======= ======= ======= ======= ========

DUBAI ISLAMIC BANK P.J.S.C.
BASEL II – PILLAR III DISCLOSURES 31 DECEMBER 2016
24
4. Risk management objectives and policies (continued)
4.3 Liquidity risk and funding management (continued)
4.3.5 Contingent liabilities and commitments (continued)
2015 Less than
3 months
3 months
to 1 year
1 to 5
years
Over 5
years
Total
AED’000 AED’000 AED’000 AED’000 AED’000
Contingent liabilities:
Letters of guarantee 6,556,133 2,052,534 175,416 312,401 9,096,484
Letters of credit 1,736,910 1,096,837 33,166 - 2,866,913
------------- ------------- ------------- ------------- -------------
8,293,043 3,149,371 208,582 312,401 11,963,397
Capital expenditure commitments
-
92,664
1,040,848
-
1,133,512
------------- ------------- ------------- -------------- --------------
Total 8,293,043 3,242,035 1,249,430 312,401 13,096,909
====== ======= ======= ======= =======
DUBAI ISLAMIC BANK P.J.S.C.
BASEL II – PILLAR III DISCLOSURES 31 DECEMBER 2016
25
4. Risk management objectives and policies (continued)
4.4 Market risk
Market risk arises from changes in market rates such as profit rates, foreign exchange rates and equity prices, as well as in their
correlation and implied volatilities. Market risk management is designed to limit the amount of potential losses on open
positions which may arise due to unforeseen changes in profit rates, foreign exchange rates or equity prices. The Group is
exposed to diverse financial instruments including securities, foreign currencies, equities and commodities.
The Group pays considerable attention to market risk. The Group uses appropriate models, as per standard market practice, for
the valuation of its positions and receives regular market information in order to regulate market risk.
The trading market risk framework comprises the following elements:
Limits to ensure that risk-takers do not exceed aggregate risk and concentration parameters set by senior management;
and
Independent mark-to-market valuation, reconciliation of positions and tracking of stop-losses for trading positions on a
timely basis.
The policies and procedures and the trading limits are set to ensure the implementation of the Group’s market risk policy in
day-to-day operations. These are reviewed periodically to ensure they remain in line with the Group’s general market risk
policy. The Chief Risk Officer of the Group ensures that the market risk management process is always adequately and
appropriately staffed. In addition to its internal procedures and systems, the Group is required to comply with the guidelines
and regulations of the Central Bank of the U.A.E.
4.4.1 Profit margin risk
The Group is not significantly exposed to risk in terms of repricing of its customer deposits since, in accordance with Islamic
Sharia’a, the Group does not provide contractual rates of return to its depositors or investment account holders. The return
payable to depositors and investment account holders is based on the principle of the Mudaraba by which the depositors and
investment account holders agree to share the profit or loss made by the Group’s Mudaraba asset pool over a given period.
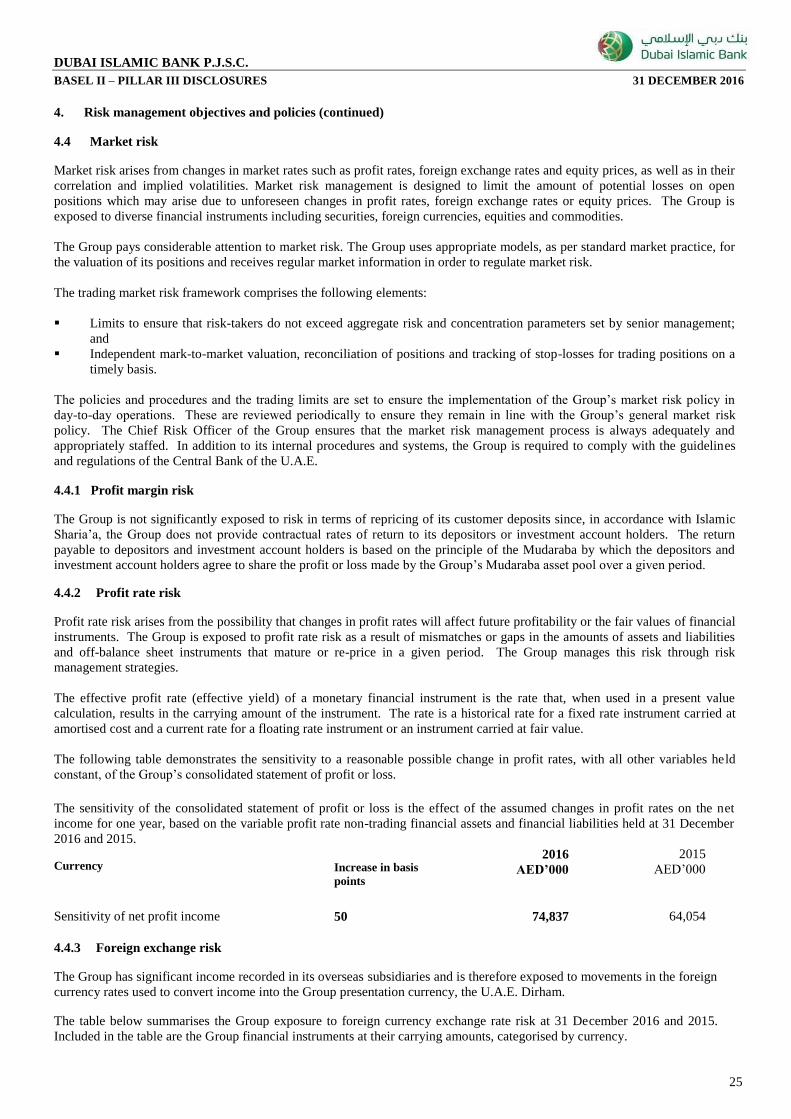
4.4.2 Profit rate risk
Profit rate risk arises from the possibility that changes in profit rates will affect future profitability or the fair values of financial
instruments. The Group is exposed to profit rate risk as a result of mismatches or gaps in the amounts of assets and liabilities
and off-balance sheet instruments that mature or re-price in a given period. The Group manages this risk through risk
management strategies.
The effective profit rate (effective yield) of a monetary financial instrument is the rate that, when used in a present value
calculation, results in the carrying amount of the instrument. The rate is a historical rate for a fixed rate instrument carried at
amortised cost and a current rate for a floating rate instrument or an instrument carried at fair value.
The following table demonstrates the sensitivity to a reasonable possible change in profit rates, with all other variables held
constant, of the Group’s consolidated statement of profit or loss.
The sensitivity of the consolidated statement of profit or loss is the effect of the assumed changes in profit rates on the net
income for one year, based on the variable profit rate non-trading financial assets and financial liabilities held at 31 December
2016 and 2015.
Currency
Increase in basis
points
2016
AED’000
2015
AED’000
Sensitivity of net profit income 50 74,837 64,054
4.4.3 Foreign exchange risk
The Group has significant income recorded in its overseas subsidiaries and is therefore exposed to movements in the foreign
currency rates used to convert income into the Group presentation currency, the U.A.E. Dirham.
The table below summarises the Group exposure to foreign currency exchange rate risk at 31 December 2016 and 2015.
Included in the table are the Group financial instruments at their carrying amounts, categorised by currency.

DUBAI ISLAMIC BANK P.J.S.C.
BASEL II – PILLAR III DISCLOSURES 31 DECEMBER 2016
26
4. Risk management objectives and policies (continued)
4.4 Market risk (continued)
4.4.3 Foreign exchange risk (continued)
2016
AED
USD
Other
G.C.C.
GBP
Euro
Other
Total
AED’000 AED’000 AED’000 AED’000 AED’000 AED’000 AED’000
Financial Assets:
Cash and balances with the central banks 15,601,268 601,442 - - - 451,971 16,654,681
Due from banks and financial institutions 1,277,791 2,134,965 190,547 24,064 362,528 556,302 4,546,197
Islamic financing and investing assets, net 82,084,793 27,977,529 1,610,918 - - 3,294,382 114,967,622
Investment in Islamic sukuk measured at amortised cost - 22,447,573 - - - 961,087 23,408,660
Other investments at fair value 641,464 908,545 147,832 - - 19,470 1,717,311
Receivables and other assets 5,784,413 283,634 9,838 - 10,102 94,557 6,182,544 --------------- ------------- ------------ ------------ ------------ ------------ -------------- Total 105,389,729 54,353,688 1,959,135 24,064 372,630 5,377,769 167,477,015
========== ======== ======== ======== ======== ======== =========
Financial Liabilities:
Customers’ deposits 100,148,008 17,362,925 41,864 37,872 200,090 4,586,191 122,376,950
Due to banks and other financial institutions 2,036,407 7,427,743 442,979 23 309,116 201,650 10,417,918
Sukuk issued - 7,695,155 - - - - 7,695,155
Payables and other liabilities 5,454,578 999,439 91,890 551 6,094 152,710 6,705,262 --------------- --------------- --------------- --------------- --------------- -------------- --------------- Total 107,638,993 33,485,262 576,733 38,446 515,300 4,940,551 147,195,285
========= ======== ======== ======== ======== ======== ========= Net on balance sheet (2,249,264) 20,868,426 1,382,402 (14,382) (142,670) 437,218 20,281,730
Unilateral promise to buy/sell currencies 2,607,220 (1,445,736) (1,282,119) 21,998 98,462 (1,806) (1,981) --------------- --------------- --------------- --------------- --------------- -------------- --------------- Currency position - long/(short) 357,956 19,422,690 100,283 7,616 (44,208) 435,412 20,279,749
========== ========== ========= ======== ======== ========= =========

DUBAI ISLAMIC BANK P.J.S.C.
BASEL II – PILLAR III DISCLOSURES 31 DECEMBER 2016
27
4. Risk management objectives and policies (continued)
4.4 Market risk (continued)
4.4.3 Foreign exchange risk (continued)
2015
AED
USD
Other
G.C.C.
GBP
Euro
Other
Total
AED’000 AED’000 AED’000 AED’000 AED’000 AED’000 AED’000
Financial Assets:
Cash and balances with central banks 12,151,249 826,734 - - - 436,891 13,414,874
Due from banks and financial institutions 653,103 3,549,488 109,674 6,376 48,451 717,648 5,084,740
Islamic financing and investing assets, net 71,163,919 21,078,437 1,425,134 - - 3,552,109 97,219,599
Investment in Islamic sukuk measured at amortised cost 422,900 18,990,383 - - - 652,368 20,065,651
Other investments at fair value 648,994 1,019,202 138,201 - - 24,589 1,830,986
Receivables and other assets 4,972,800 47,232 10,267 - 10,507 223,121 5,263,927 ------------- ------------- ------------- ------------- ------------- ------------- --------------- Total 90,012,965 45,511,476 1,683,276 6,376 58,958 5,606,726 142,879,777
======== ======== ======== ======== ======== ======== =========
Financial Liabilities:
Customers’ deposits 89,248,319 15,552,299 106,448 36,662 202,987 4,834,717 109,981,432
Due to banks and other financial institutions 1,364,230 2,985,266 - 37 200,702 162,393 4,712,628
Sukuk issued 1,010,675 4,591,250 - - - - 5,601,925
Payables and other liabilities 5,978,056 535,629 128,592 546 23,858 141,310 6,807,991 ------------- ------------- ------------- ------------- ------------- ------------- --------------- Total 97,601,280 23,664,444 235,040 37,245 427,547 5,138,420 127,103,976
======== ======== ======== ======== ======== ======== ========= Net on balance sheet (7,588,315) 21,847,032 1,448,236 (30,869) (368,589) 468,306 15,775,801
Unilateral promise to buy/sell currencies 1,061,107 49,483 (1,580,048) 78,039 341,077 47,572 (2,770) --------------- --------------- --------------- --------------- --------------- --------------- --------------- Currency position - long/(short) (6,527,208) 21,896,515 (131,812) 47,170 (27,512) 515,878 15,773,031
========== ========= ========= ========= ========= ========= =========

DUBAI ISLAMIC BANK P.J.S.C.
BASEL II – PILLAR III DISCLOSURES 31 DECEMBER 2016
28
4. Risk management objectives and policies (continued)
4.4 Market risk (continued)
4.4.3 Foreign exchange risk (continued)
Sensitivity analysis - impact of fluctuation of various currencies on net income and equity
The tables below indicate the extent to which the Group was exposed to currency risk at 31 December 2016 and 2015 on its non-
trading monetary assets and liabilities, and forecast cash flows. The analysis is performed for a reasonable possible movement of
the currency rate against the AED with all other variables held constant on the consolidated statement of profit or loss (due to the
changes in the fair values of currency sensitive non-trading monetary assets and liabilities) and equity (due to the change in fair
value of foreign currency denominated available-for-sale equity instruments). A negative amount in the table reflects a potential
net reduction in consolidated statement of profit or loss and equity, while a positive amount reflects a net potential increase. The
sensitivity analysis does not take account of actions by the Group that might be taken to mitigate the effect of such changes.
Currency
Increase in
currency
rate in %
Effect on
profit or loss
2016
Effect on
profit or loss
2015
AED’000 AED’000
US Dollar +2 388,454 437,930
GBP +2 152 943
EURO +2 (884) (550)
Currency
Decrease in
currency
rate in %
Effect on
profit or loss
2016
Effect on
profit or loss
2015
AED’000 AED ’000
US Dollar -2 (388,454) (437,930)
GBP -2 (152) (943)
EURO -2 884 550
4.4.4 Foreign investment
The Group has significant income recorded in its overseas subsidiaries and is therefore exposed to movements in the foreign
currency rates used to convert income into the Group presentation currency, the U.A.E. Dirham.
The table below indicates the change in recorded profit before tax and equity had the result for the year ended
31 December 2016 and 2015 been translated at exchange rates against the AED adjusted, with all other variables held constant,
by the assumed changes below. The sensitivity analyses do not take account of actions by the Group that might be taken to
mitigate the effect of such changes.
Currency
Increase in
currency
rate in %
Effect on
profit or loss
2016
Effect on other
comprehensive
income
2016
Effect on
profit or loss
2015
Effect on other
comprehensive
income
2015
AED’000 AED’000 AED’000 AED’000
Pak Rupees +5 1,626 22,534 834 20,816
Egypt Sterling +5 554 3,534 703 7,851

DUBAI ISLAMIC BANK P.J.S.C.
BASEL II – PILLAR III DISCLOSURES 31 DECEMBER 2016
29
4. Risk management objectives and policies (continued)
4.4 Market risk (continued)
4.4.4 Foreign investment (continued)
Currency
Increase in
currency
rate in %
Effect on
profit or loss
2016
Effect on other
comprehensive
income
2016
Effect on
profit or loss
2015
Effect on other
comprehensive
income
2015
AED’000 AED’000 AED’000 AED’000
Pak Rupees -5 (1,471) (20,388) (755) (18,834)
Egypt Sterling -5 (501) (3,197) (636) (7,098)
4.4.5 Equity price risk
Equity price risk is the risk that the fair values of equities decrease as the result of changes in the levels of equity indices and the
value of individual stocks. The non-trading equity price risk exposure arises from the Group’s investment portfolio.
The effect on equity (as a result of a change in the fair value of equity instruments held as fair value through other comprehensive
income (FVTOCI) at 31 December 2016 and 2015) due to a reasonably possible change in equity indices, with all other variables
held constant, is as follows:
Market indices
Change in
market Indices
Effect on other
comprehensive income
Effect on other
comprehensive income
2016 2015
% AED’000 AED’000
Dubai Financial Market + 5% 17,577 12,140
Abu Dhabi Exchange + 5% 1,729 2,370
Bahrain Stock Exchange + 5% 2,272 2,444
Other + 5% 5,201 4,847
4.5 Operational risk
Operational risk is the potential exposure to financial or other damage arising from inadequate or failed internal processes, people
or systems.
The Group has developed a detailed operational risk framework. The framework clearly defines roles and responsibilities of
individuals/units across different functions of the Group that are involved in performing various operational risk management
tasks. Operational Risk Management Framework will ensure that operational risks within the Group are properly identified,
monitored, managed and reported. Key elements of the framework include process mapping, setting up loss data base, setting up
of KRIs, risk analysis and risk management reporting.
The Group is currently using operational risk tracking system, i.e. ORMIS to track operational risk events across the Group. The
system houses three years of operational loss data. The subject system is currently enhanced to automate KRI, RCSA and scenario
based fraud risk self-assessment modules.
Each new product introduced is subject to a risk review and signoff process where all relevant risks are identified and assessed by
departments independent of the risk-taking unit proposing the product. Variations of existing products are also subject to a similar
process. Business and support units are responsible for managing operations risk in their respective functional areas. They operate
within the Group’s operational risk management framework and ensure that risk is being managed within their respective business
units. The day-to-day management of operations risk is through the maintenance of a comprehensive system of internal controls,
supported by robust systems and procedure to monitor transaction positions and documentation, as well as maintenance of key
backup procedures and business contingency planning.

DUBAI ISLAMIC BANK P.J.S.C.
BASEL II – PILLAR III DISCLOSURES 31 DECEMBER 2016
30
4. Risk management objectives and policies (Continued)
4.6 Stress Testing
The bank conducts stress test exercise over three year horizon by considering risk factors based on macroeconomic variables at
various levels of stress scenarios to determine its impact on the level of capital adequacy of the bank. The tests are considered as an
important tool for internal capital planning.
4.7 Regulatory/Compliance Risk
Regulatory risk is defined as the risk of regulatory sanctions, material financial or reputational loss, as a result of failure to comply
with laws, regulations, supervisory or industry codes requirements etc.
The Bank has mainly two major operational centers - UAE and Pakistan. The Group is entering into new jurisdictions i.e.
Indonesia and Kenya, also with minority interest in Jordan, Sudan, and Bosnia. The Bank’s primary regulators in these
jurisdictions are:
UAE Central Bank;
Securities & Commodities Authority;
Dubai Financial Services Authority;
State Bank of Pakistan; and
Other Regulators pertinent to their respective jurisdiction.
Given the dimensions of Group’s business and its operations, the regulatory requirements are significant. Any failure in policy,
internal control systems and processes may result in non-compliance with regulatory requirements which may impact the bank
adversely. The bank has develop a detail monitoring process to ensure compliance of regulatory requirements, internal policies and
procedures with a dedicated team responsible for monitoring.
4.8 Reputational Risk
Reputational risk is defined as a damage or loss to the Group’s reputation due to one or more events such as negative publicity on
bank’s practices, conduct and financial conditions. The Group has clearly identified the areas as sources of reputational events,
such as:
Compliance with legal and regulatory obligations;
Business practices followed;
Standard of products and service quality;
Information technology security and data integrity;
Association with customers, suppliers and partners;
Crises management;
External communication;
Achievements of financial targets.
The Group actively manages the identified business risks that may lead to reputational events.
During the period of severe adverse changes in the economic environment, the bank has consistently been able to maintain brand
image with considerable success. The risk assessment therefore, can be considered as modest.