Basel II & Credit Risk Management: Risk Data and Modeling ...Cudahy_Kim_Delotitte... · Copyright...
40
Copyright © 2011, SAS Institute Inc. All rights reserved. #analytics2011 Basel II & Credit Risk Management: Risk Data and Modeling Considerations Deloitte & Touche LLP
Transcript of Basel II & Credit Risk Management: Risk Data and Modeling ...Cudahy_Kim_Delotitte... · Copyright...

Copyright © 2011, SAS Institute Inc. All rights reserved. #analytics2011
Basel II & Credit Risk Management: Risk Data and Modeling ConsiderationsDeloitte & Touche LLP

Copyright © 2011, SAS Institute Inc. All rights reserved. #analytics2011Content Copyright © 2011 Deloitte Development LLC. All rights reserved.
Bank capital declined to < 20%
FRB initiated “go slow” policy with respect to expansion
proposals
Ratio of total capital to total assets for insured banks = 6%; ratio for largest banks = 4.5 %
Basel Accord led to adoption of risk-weighted framework for assessing
capital adequacy of 8 percent
19821870 - 1910 1970 19881915 - 1930
Averaged at 13% before Great Depression
History of Banking Capital and Basel
The Basel Accord was initially drafted in 1988 to improve the safety and soundness of the global banking system by enhancing the risk measurement and capital adequacy within Banks Aimed at placing internationally active banks on comparable footing
with respect to capital requirements
Progression of capital level policies prior to the Basel Accord

Copyright © 2011, SAS Institute Inc. All rights reserved. #analytics2011Content Copyright © 2011 Deloitte Development LLC. All rights reserved.
Basel I - History and Overview
The Basel Committee on Banking Supervision (BCBS) issued the first Basel Accord in 1988, and a market risk amendment in 1996
Overview Created a basic, global risk management framework for market and
credit risk (did not account for diversification or operational risk) Established standard supervisory and disclosure requirements Created a top down Risk Weight based approach for credit risk Assigned an 8% capital charge to Risk Weighted Assets

Copyright © 2011, SAS Institute Inc. All rights reserved. #analytics2011Content Copyright © 2011 Deloitte Development LLC. All rights reserved.
Basel II - History and Overview
Basel II refers to a comprehensive revision to the Basel I standards issued by the BCBS in 2004, and finalized in 2006
Overview Provides more flexibility in calculating minimum regulatory capital Improves risk sensitivity of regulatory capital framework, while
maintaining current capital levels in the system Broadly aligns regulatory capital rules to economic capital used in
large banks Incentivizes risk management and risk mitigation processes and
practices

Copyright © 2011, SAS Institute Inc. All rights reserved. #analytics2011Content Copyright © 2011 Deloitte Development LLC. All rights reserved.
US Basel II Final Rules – Overview
U.S. Basel II Final Rules were published in 2007 Delayed due to Legislative and regulatory concerns Retention of Leverage Capital ratio in the U.S. limits risk sensitivity of
the U.S. Final Rule, but was a non-negotiable item with some legislators and regulators Scope of applicability in the U.S. is limited to mandatory core banks
and opt-in banks Core Banks: Bank Holding Companies (BHCs) and/or Depository
Institutions (DI) with » Total Assets > $250 B, or» Foreign Exposure > $10 B

Copyright © 2011, SAS Institute Inc. All rights reserved. #analytics2011Content Copyright © 2011 Deloitte Development LLC. All rights reserved.
US Banks adopt Basel I
1988 1996 2008 2009
Effective date for US Basel II
Final Rules
18 month Transition Period
Financial Institutions classified as CORE Banks enter transition
period
Q1 Q2 Q3 Q4
Four Quarters of Internal Parallel Run
Basel II Timelines in the US
A parallel run—calculating both Basel I and Basel II capital—of at least four consecutive quarters must be completed as part of U.S. Basel II implementation
Copyright © 2011, SAS Institute Inc. All rights reserved. #analytics2011Content Copyright © 2011 Deloitte Development LLC. All rights reserved.
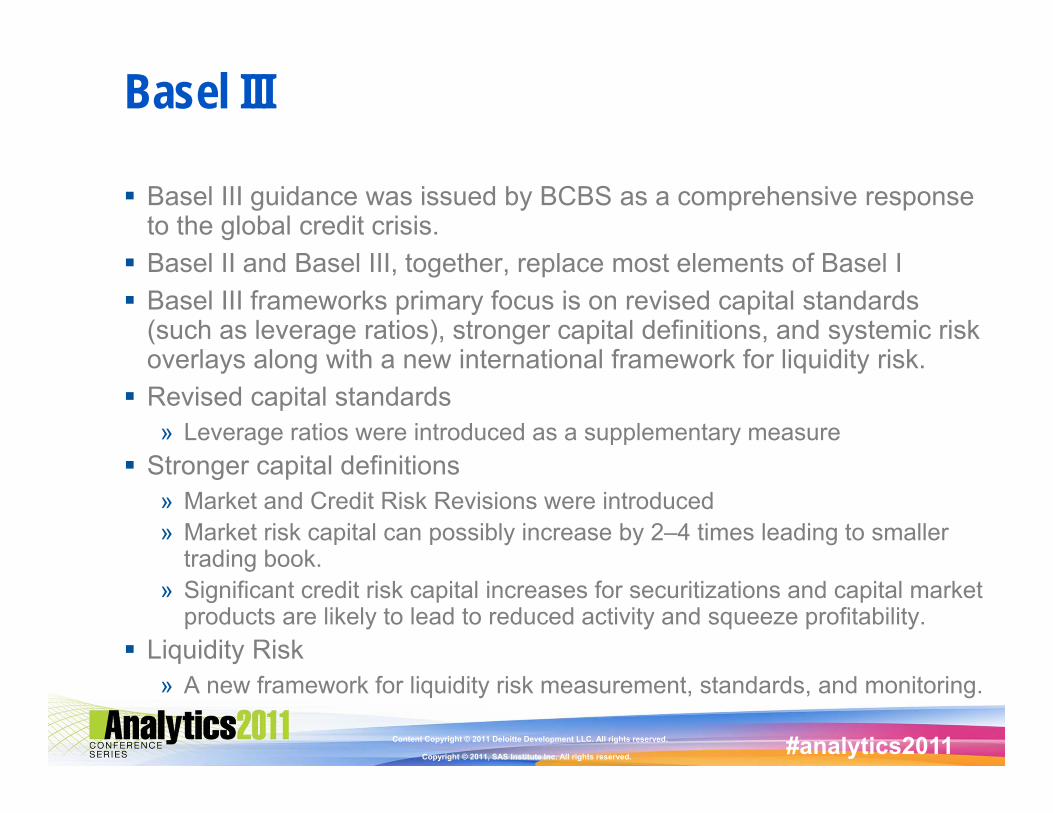
Basel III
Basel III guidance was issued by BCBS as a comprehensive response to the global credit crisis. Basel II and Basel III, together, replace most elements of Basel I Basel III frameworks primary focus is on revised capital standards
(such as leverage ratios), stronger capital definitions, and systemic risk overlays along with a new international framework for liquidity risk. Revised capital standards
» Leverage ratios were introduced as a supplementary measure Stronger capital definitions
» Market and Credit Risk Revisions were introduced » Market risk capital can possibly increase by 2–4 times leading to smaller
trading book.» Significant credit risk capital increases for securitizations and capital market
products are likely to lead to reduced activity and squeeze profitability. Liquidity Risk
» A new framework for liquidity risk measurement, standards, and monitoring.

Copyright © 2011, SAS Institute Inc. All rights reserved. #analytics2011Content Copyright © 2011 Deloitte Development LLC. All rights reserved.
* Source: FFIEC http://www.ffiec.gov/nicpubweb/nicweb/top50form.aspx
Core Banks Implementing Basel II*

Copyright © 2011, SAS Institute Inc. All rights reserved. #analytics2011
Key Data Considerations for Risk programs

Copyright © 2011, SAS Institute Inc. All rights reserved. #analytics2011Content Copyright © 2011 Deloitte Development LLC. All rights reserved.
Key Data Considerations for Risk programs
Risk Data Considerations
Data Standardization
Reference Data
Unification
Data Hierarchy
Single Customer
View
Metadata and Data
Governance
Loss Event Data
Data Lineage
Historical Data

Copyright © 2011, SAS Institute Inc. All rights reserved. #analytics2011Content Copyright © 2011 Deloitte Development LLC. All rights reserved.
Data standardization refers to building a common language for sharing of key business information across organization and users (i.e. a single version of truth). The key components of data standards are:
Data standardization issues are common in large Bank Holding Companies and Financial Institutions. These issues can result in the need to create additional transformation modules, translation efforts and exhaustive data validation. Such issues delay the process of system integration.
Usability
MeasurabilityTransferability
Standardize the quality of information
Enable an organization wide perspective
Provide baseline metric to capture viability of data
Data Standardization
Key Industry Observation Acquisition of systems and use of
multiple vendor product within a bank had resulted in a lack of uniformity of similar data. For example: the legal entity was referred to by different identifiers & values across the firm.
M&A and consolidation at major banks over the last decade has resulted in numerous disconnected systems with duplicated data sets.
Solutions from the Industry Efforts have been undertaken to
standardize information right at the source/ point of sale. Some firms have left the original systems as is and instead have created central translation systems to aid with the standardization of data values.
Most of the banks have created central data warehouses and reporting data marts to bring the data from various Business Units together and allow for centralized data management.

Copyright © 2011, SAS Institute Inc. All rights reserved. #analytics2011Content Copyright © 2011 Deloitte Development LLC. All rights reserved.
Reference Data Unification Reference data typically refers to static or slowly changing dimensional data that is used
across systems, such as customer and legal entity identifiers, FX rates, external ratings, contract id etc.
Basel calculations, credit risk reports, loss-event monitoring and other risk and finance programs require clean and reliable reference data.
Most Financial Services firms face issues affecting availability, accessibility, accuracy and unification of key reference data.
Key Industry Observation Most large Financial Services
Organizations and banks have issues in uniquely identifying customers across legal entities/jurisdictions
Most of the Bulge bracket banks in US found it difficult to assess the credit risk in their loan portfolio due to the inconsistent view (because of inconsistent capture of risk type data like counterparty info etc.) of reference data across the source systems within the firm.
Solutions from the Industry Some firms have instituted new programs
to collate customer information, within reason, to create a single customer view across the firm.
The dispersed reference data within the firm (like counterparty info) are mapped to the standardized data located in centralized data-mart.

Copyright © 2011, SAS Institute Inc. All rights reserved. #analytics2011Content Copyright © 2011 Deloitte Development LLC. All rights reserved.
Data Hierarchy Today’s organizations have complex business structures
with hundreds of subsidiaries, affiliate sub-affiliate relationships, business units. The sum of these relationships can be defined as an organizational hierarchy.
Most financial organizations find it challenging to create a counterparty hierarchy – understand the , organizational hierarchy of their customers based on legal entities
Organizational data hierarchy (entities, business units etc.) and product data hierarchy are especially useful when it comes to the consistent usage of data for risk, marketing, fraud and operations across products, countries and region.
Key Industry Observation Many major banks have issues with
identifying true concentration risk with a clear understanding of the true counterparty to their trades.
Solutions from the Industry Financial institutions have instituted
programs to capture full legal entity structures of their counterparties (ultimate parent and all its subs) in an effort to understand the real exposure to a counterparty. They have additionally extended their risk monitoring and trade approval process to leverage this singular view of risk (enabled by an accurate entity hierarchy).
Copyright © 2011, SAS Institute Inc. All rights reserved. #analytics2011Content Copyright © 2011 Deloitte Development LLC. All rights reserved.
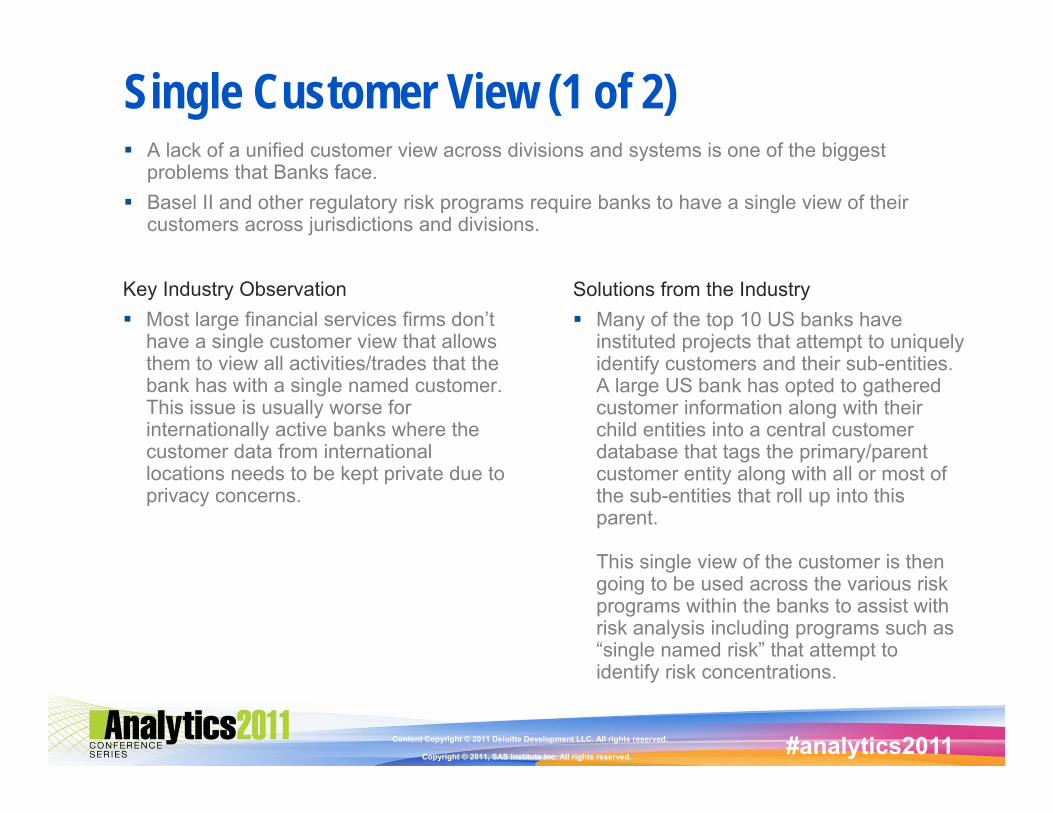
Single Customer View (1 of 2) A lack of a unified customer view across divisions and systems is one of the biggest
problems that Banks face. Basel II and other regulatory risk programs require banks to have a single view of their
customers across jurisdictions and divisions.
Key Industry Observation Most large financial services firms don’t
have a single customer view that allows them to view all activities/trades that the bank has with a single named customer. This issue is usually worse for internationally active banks where the customer data from international locations needs to be kept private due to privacy concerns.
Solutions from the Industry Many of the top 10 US banks have
instituted projects that attempt to uniquely identify customers and their sub-entities. A large US bank has opted to gathered customer information along with their child entities into a central customer database that tags the primary/parent customer entity along with all or most of the sub-entities that roll up into this parent.
This single view of the customer is then going to be used across the various risk programs within the banks to assist with risk analysis including programs such as “single named risk” that attempt to identify risk concentrations.

Copyright © 2011, SAS Institute Inc. All rights reserved. #analytics2011Content Copyright © 2011 Deloitte Development LLC. All rights reserved.
Single Customer View (2 of 2)
Key Industry Observation The Recent crisis has prompted all the
Core Banks in the US to revisit their approach to maintaining customer data. This has resulted in big efforts to build centralized client repositories and integration of current client datasets.
Solutions from the Industry A few banks have invested heavily in
managing their data by incorporating unique identifiers in their CRM and introduce common definitions for data used to run the bank and move it forward.

Copyright © 2011, SAS Institute Inc. All rights reserved. #analytics2011Content Copyright © 2011 Deloitte Development LLC. All rights reserved.
Metadata and Data Governance Metadata is the information about the data in the different systems, and data governance is
the end to end management of such data. Most of the Banks currently have weak policies around metadata management; making data
translation and transfer across systems a costly exercise. A lack of metadata typically results in poor data standards over time, and suspect data quality in downstream systems.
Key Industry Observation A major bank holding company did not
have the data dictionaries of its key risk modeling system updated, which delayed model development process
A major bank implementing Basel II faced problems in integrating potential Basel II data sources into a common Operational Data Store due to inconsistent metadata
Solutions from the Industry Most large financial services firms are
introducing metadata documentation standards during the Systems Development Life Cycle
Major Banks implementing Basel II are resorting to sound data oversight policies and metadata driven projects. Central metadata repositories are being created with metadata collection points being deployed into new systems.
Copyright © 2011, SAS Institute Inc. All rights reserved. #analytics2011Content Copyright © 2011 Deloitte Development LLC. All rights reserved.
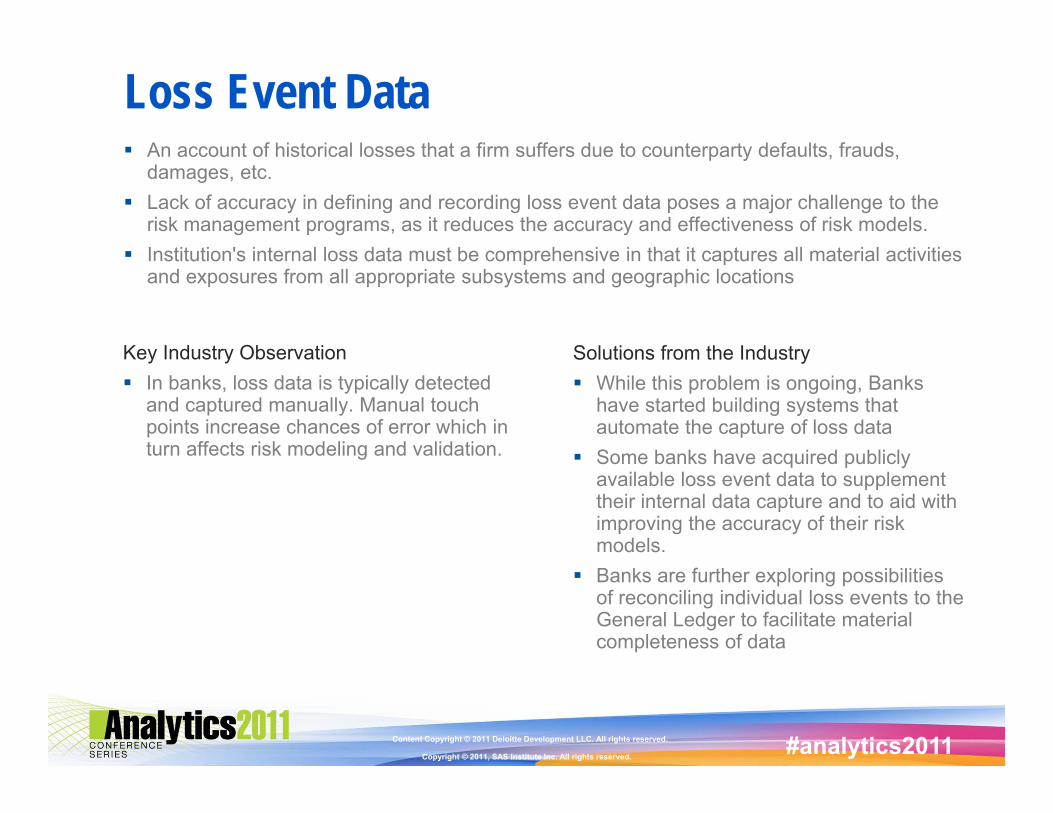
Loss Event Data An account of historical losses that a firm suffers due to counterparty defaults, frauds,
damages, etc. Lack of accuracy in defining and recording loss event data poses a major challenge to the
risk management programs, as it reduces the accuracy and effectiveness of risk models. Institution's internal loss data must be comprehensive in that it captures all material activities
and exposures from all appropriate subsystems and geographic locations
Key Industry Observation In banks, loss data is typically detected
and captured manually. Manual touch points increase chances of error which in turn affects risk modeling and validation.
Solutions from the Industry While this problem is ongoing, Banks
have started building systems that automate the capture of loss data
Some banks have acquired publicly available loss event data to supplement their internal data capture and to aid with improving the accuracy of their risk models.
Banks are further exploring possibilities of reconciling individual loss events to the General Ledger to facilitate material completeness of data

Copyright © 2011, SAS Institute Inc. All rights reserved. #analytics2011Content Copyright © 2011 Deloitte Development LLC. All rights reserved.
Data Lineage Data lineage is the process of tracing a data path from reports back to the origination source
systems Critical for firms striving to get an accurate assessment of the risk on their books and to ease
investigations and audits, as well as mandated by many regulators for large bank holding companies and banks.
Effective data lineage helps in identifying key data dependencies and helps in transparency
Key Industry Observation Source data undergoes various
transformations during its lifecycle from trade capture, sales confirmations to settlement and post trade activities. The regulators are often dissatisfied with poor audit trail for data used in risk systems, which affects investigations and audits
Solutions from the Industry This is an ongoing problem in banks, but
recently they have started focusing on having a homogenous ETL environment and strong audit trails to deal with data lineage issues.

Copyright © 2011, SAS Institute Inc. All rights reserved. #analytics2011Content Copyright © 2011 Deloitte Development LLC. All rights reserved.
Historical Data (1 of 2) Basel II advanced approaches require maintaining sufficient history of appropriate Basel II
related data for risk parameter estimation (typically ranging from 5 to 7 years of history) Historical data should be captured at varying levels of granularity (transactional data such as
balances, principal amounts etc.; reference data such as rates, ratings etc.; and other customer/counterparty data)
Banks need to ensure that Historical data is of high quality for comprehensive and accurate assessment of risk
Most risk models are calibrated using history data, and poor quality or availability of history data impacts the effectiveness of these risk models
Key Industry Observation Most of the banks don’t have concrete
historical data primarily because of legacy systems on-boarded as part of past acquisitions or due to acquisitions of smaller firms with poor data management capabilities.
Solutions from the Industry A major Institution recently implemented
strong data retention policies to ensure that data does not become redundant once the current system is transitioned to a new one.
Copyright © 2011, SAS Institute Inc. All rights reserved. #analytics2011Content Copyright © 2011 Deloitte Development LLC. All rights reserved.
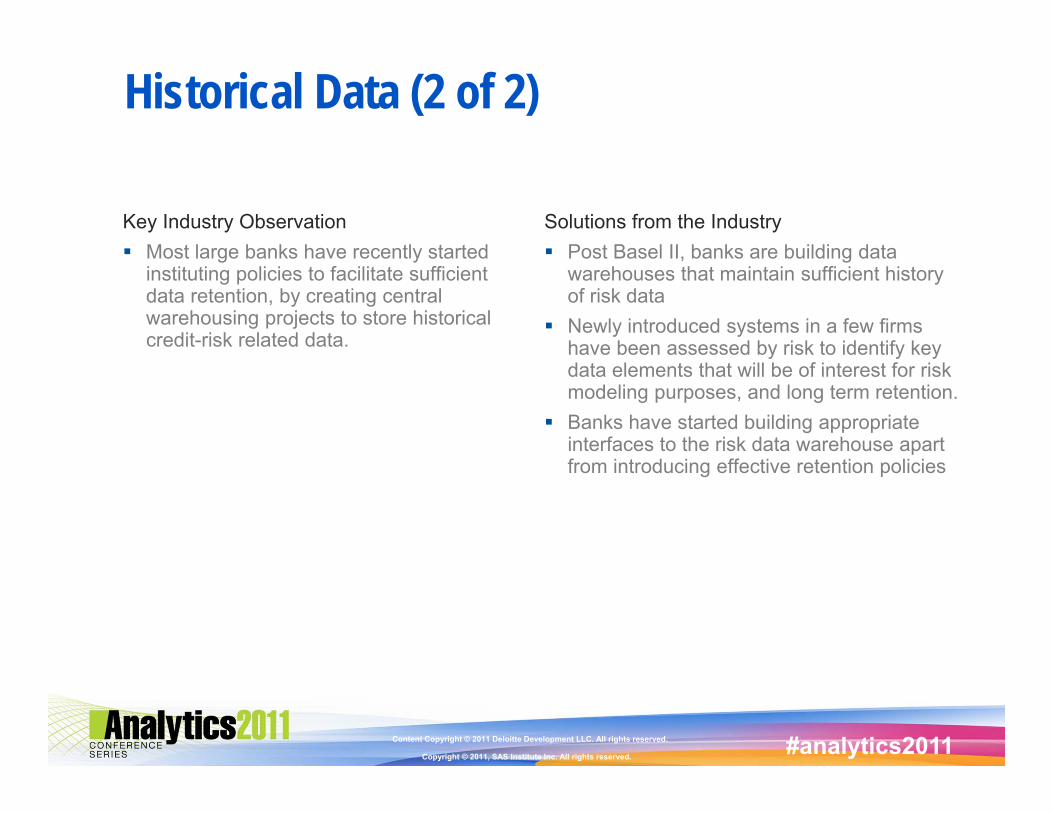
Historical Data (2 of 2)
Key Industry Observation Most large banks have recently started
instituting policies to facilitate sufficient data retention, by creating central warehousing projects to store historical credit-risk related data.
Solutions from the Industry Post Basel II, banks are building data
warehouses that maintain sufficient history of risk data
Newly introduced systems in a few firms have been assessed by risk to identify key data elements that will be of interest for risk modeling purposes, and long term retention.
Banks have started building appropriate interfaces to the risk data warehouse apart from introducing effective retention policies

Copyright © 2011, SAS Institute Inc. All rights reserved. #analytics2011
Key Considerations For Credit Risk Modeling

Copyright © 2011, SAS Institute Inc. All rights reserved. #analytics2011Content Copyright © 2011 Deloitte Development LLC. All rights reserved.
Basel II Credit Risk Modeling: Some Key Considerations
Use Test Considerations
Common PD/LGD/EAD Modeling Practices
Modeling Downturn LGD
Segmentation Approaches for Retail
Exposures
Basel II Credit Risk Modeling Considerations
Parameter Stressing in the Context of Pillar I
Estimation of Discount Rates
Copyright © 2011, SAS Institute Inc. All rights reserved. #analytics2011Content Copyright © 2011 Deloitte Development LLC. All rights reserved.
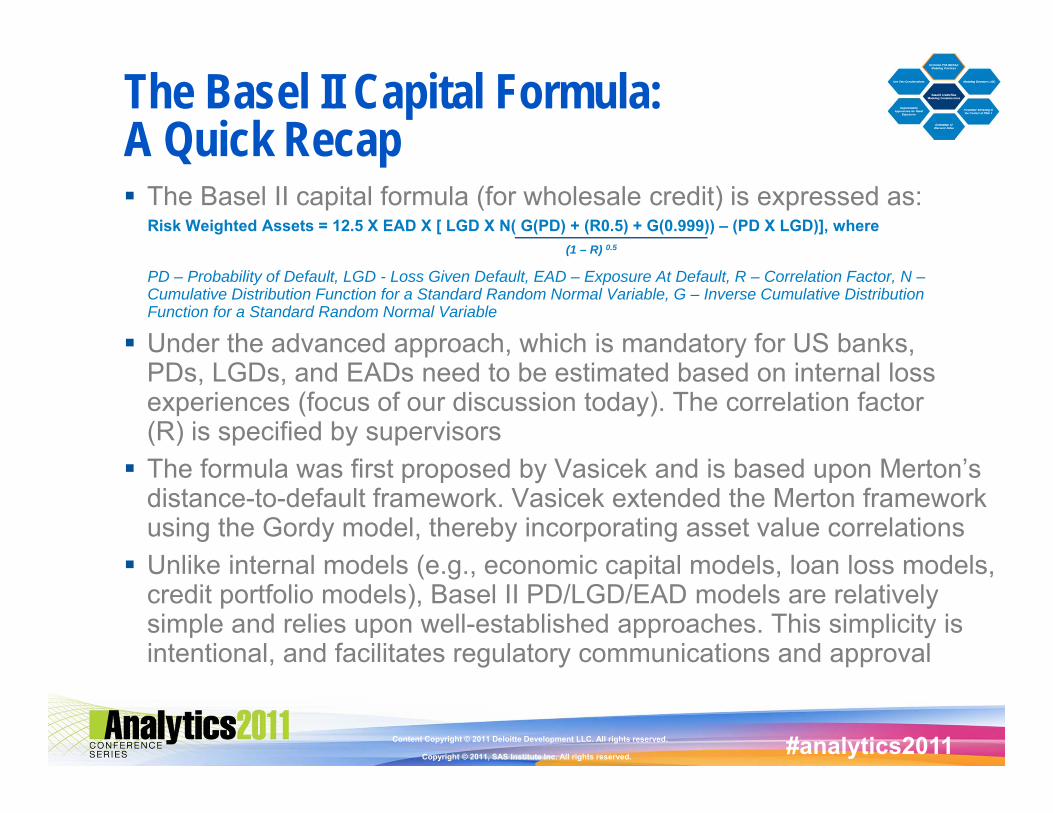
The Basel II Capital Formula: A Quick Recap The Basel II capital formula (for wholesale credit) is expressed as:
Risk Weighted Assets = 12.5 X EAD X [ LGD X N( G(PD) + (R0.5) + G(0.999)) – (PD X LGD)], where
PD – Probability of Default, LGD - Loss Given Default, EAD – Exposure At Default, R – Correlation Factor, N –Cumulative Distribution Function for a Standard Random Normal Variable, G – Inverse Cumulative Distribution Function for a Standard Random Normal Variable
Under the advanced approach, which is mandatory for US banks, PDs, LGDs, and EADs need to be estimated based on internal loss experiences (focus of our discussion today). The correlation factor (R) is specified by supervisors The formula was first proposed by Vasicek and is based upon Merton’s
distance-to-default framework. Vasicek extended the Merton framework using the Gordy model, thereby incorporating asset value correlations Unlike internal models (e.g., economic capital models, loan loss models,
credit portfolio models), Basel II PD/LGD/EAD models are relatively simple and relies upon well-established approaches. This simplicity is intentional, and facilitates regulatory communications and approval
(1 – R) 0.5

Copyright © 2011, SAS Institute Inc. All rights reserved. #analytics2011Content Copyright © 2011 Deloitte Development LLC. All rights reserved.
Basel II PD Models: Common Industry Practices Retail Credit: Logistic regression is the de-facto industry standard for
modeling PD for retail exposures. In fact, in some banks, modeling policies prohibit using any other modeling approach Wholesale Credit: Historically, qualitative scorecards have been used
to assign ratings to wholesale obligors» Scorecards typically combine various firm, industry and macroeconomic
variables to derive a rating – the rating is subsequently mapped to a master scale to derive PDs
» In some firms, scorecard outputs are combined with outputs from a logistic regression using various weighting algorithms
Apart from logistic regressions, probit is the other common approach for modeling PD. However, unlike logistic regressions, probits make assumptions regarding the underlying distribution (i.e., normal) and hence are less flexible
Copyright © 2011, SAS Institute Inc. All rights reserved. #analytics2011Content Copyright © 2011 Deloitte Development LLC. All rights reserved.
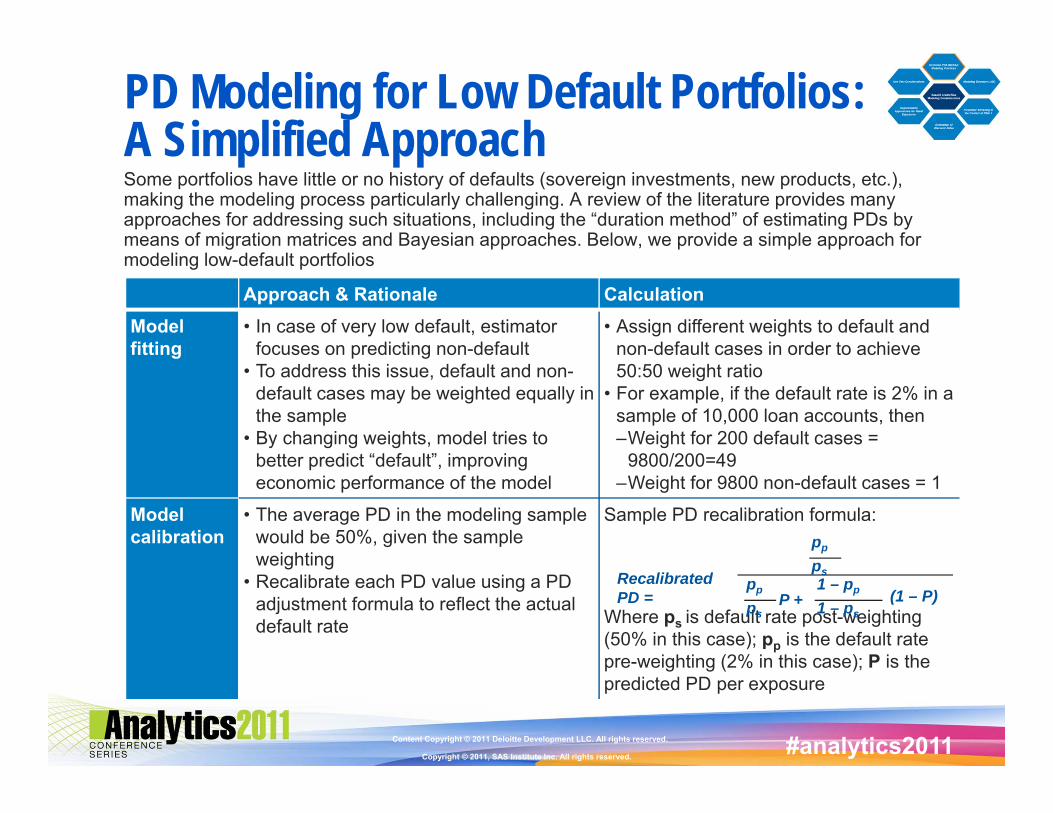
PD Modeling for Low Default Portfolios: A Simplified Approach Some portfolios have little or no history of defaults (sovereign investments, new products, etc.), making the modeling process particularly challenging. A review of the literature provides many approaches for addressing such situations, including the “duration method” of estimating PDs by means of migration matrices and Bayesian approaches. Below, we provide a simple approach for modeling low-default portfolios
Approach & Rationale CalculationModel fitting
• In case of very low default, estimator focuses on predicting non-default
• To address this issue, default and non-default cases may be weighted equally in the sample
• By changing weights, model tries to better predict “default”, improving economic performance of the model
• Assign different weights to default and non-default cases in order to achieve 50:50 weight ratio
• For example, if the default rate is 2% in a sample of 10,000 loan accounts, then–Weight for 200 default cases =
9800/200=49–Weight for 9800 non-default cases = 1
Model calibration
• The average PD in the modeling sample would be 50%, given the sample weighting
• Recalibrate each PD value using a PD adjustment formula to reflect the actual default rate
Sample PD recalibration formula:
Where ps is default rate post-weighting (50% in this case); pp is the default rate pre-weighting (2% in this case); P is the predicted PD per exposure
Recalibrated PD =
pp
pspp
ps
1 – pp
1 – ps(1 – P)P +
Copyright © 2011, SAS Institute Inc. All rights reserved. #analytics2011Content Copyright © 2011 Deloitte Development LLC. All rights reserved.
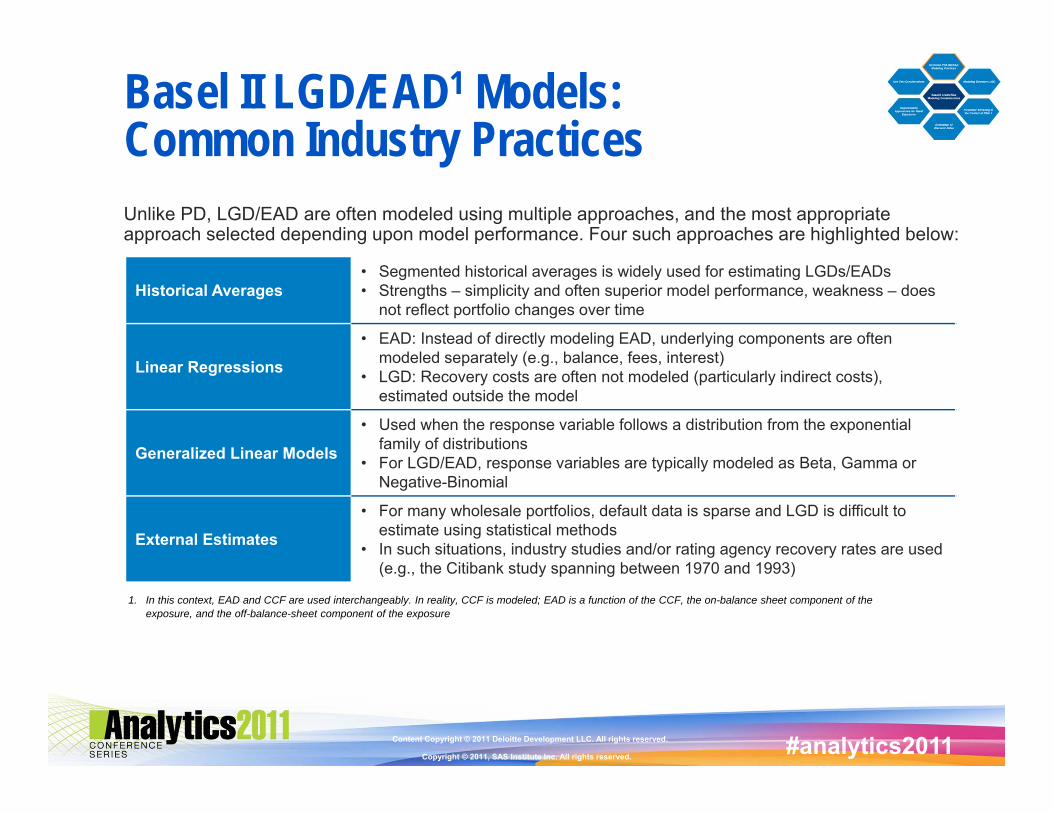
Basel II LGD/EAD1 Models: Common Industry PracticesUnlike PD, LGD/EAD are often modeled using multiple approaches, and the most appropriate approach selected depending upon model performance. Four such approaches are highlighted below:
1. In this context, EAD and CCF are used interchangeably. In reality, CCF is modeled; EAD is a function of the CCF, the on-balance sheet component of the exposure, and the off-balance-sheet component of the exposure
Historical Averages• Segmented historical averages is widely used for estimating LGDs/EADs• Strengths – simplicity and often superior model performance, weakness – does
not reflect portfolio changes over time
Linear Regressions
• EAD: Instead of directly modeling EAD, underlying components are often modeled separately (e.g., balance, fees, interest)
• LGD: Recovery costs are often not modeled (particularly indirect costs), estimated outside the model
Generalized Linear Models
• Used when the response variable follows a distribution from the exponential family of distributions
• For LGD/EAD, response variables are typically modeled as Beta, Gamma or Negative-Binomial
External Estimates
• For many wholesale portfolios, default data is sparse and LGD is difficult to estimate using statistical methods
• In such situations, industry studies and/or rating agency recovery rates are used (e.g., the Citibank study spanning between 1970 and 1993)

Copyright © 2011, SAS Institute Inc. All rights reserved. #analytics2011Content Copyright © 2011 Deloitte Development LLC. All rights reserved.
Modeling Downturn LGD: Introduction
Motivation & Objective
• The unexpected loss (UL) which is directly related to capital requirements is given by:
UL = (PDconditional - PDunconditional) * LGD * EADwhere PD = Probability of Default; LGD = Loss Given Default; EAD = Exposure at Default
• Evidence shows that LGD rises during economic downturns. The above formula does not take this correlation between PD and LGD into account, thereby underestimating capital requirements
• The goal of downturn modeling is to incorporate the effects of downturn scenarios on LGD and ensure that banks are sufficiently capitalized to withstand such scenarios
Basel Requirements • From the US Final Rule : Default, loss severity, and exposure data must include periods of economic downturn conditions, or the [bank] must adjust its estimates of risk parameters to compensate for the lack of data from periods of economic downturn conditions.
• Basel provides a principle-based approach where banks need to identify appropriate downturn conditions and the adverse dependencies between default rates and LGD. There is a lack of consensus amongst industry participants on exact modeling approaches

Copyright © 2011, SAS Institute Inc. All rights reserved. #analytics2011Content Copyright © 2011 Deloitte Development LLC. All rights reserved.
Modeling Downturn LGD: Common ApproachesThe Basel guidelines for downturn LGD modeling are flexible enough to allow for a range of practices. Some of the more common approaches are listed below:
Qualitative add-ons • Many banks use qualitative add-ons to incorporate downturn risk, particularly for their first-generation models
• Typical add-ons range between 2.5% to 5%
LGD at stressed points
• Identify stress points based on historical default rates and/or macroeconomic indicators
• Compute weighted average LGD across these stress points and compare them with average LGD over the cycle. Use the higher of the two for capital calculation purposes
Stressed LGD model • Identify stress points based on historical default rates and/or macroeconomic indicators, estimate default rates during these stressed conditions
• Plug these default rates into a stressed LGD model• Compare stressed LGD with their long run averages and derive a
scaling factor to reflect downturn risk
For firms that do not have sufficient data to estimate downturn LGD, a supervisory mapping function can be used: LGD = 0.08 + 0.92 * Expected LGD

Copyright © 2011, SAS Institute Inc. All rights reserved. #analytics2011Content Copyright © 2011 Deloitte Development LLC. All rights reserved.
Parameter Stressing & Pillar I Capital
Under Pillar 1, Basel II does mention of stress testing; however, the mechanics of incorporating stress tests within RWA calculations is not very prescriptive. According to the US Final Rule:The [bank] must periodically stress test its advanced systems. The stress testing must include a consideration of how economic cycles, especially downturns, affect risk-based capital requirements (including migration across rating grades and segments and the credit risk mitigation benefits of double default treatment)
Stressing risk parameters (PD/LGD/EAD) and using stressed parameters for capital calculation may be an effective way of incorporating conservatism into Pillar I capital estimates
» Using a range of outputs, as opposed to a point estimate, can provide a more meaningful expression of uncertainty
» Banks may use stressed parameters that correspond to different downturn conditions (e.g., mild recession, severe recession, etc.) and compare the capital requirements against their current capital level
» PDs may be the most likely candidate for stressing (The IRB formula already incorporates stressed LGDs, EADs are less susceptible to cyclical factors)
To reduce cyclicality, regulators are already exploring the use of downturn PDs for Pillar I capital calculation purposes. For example, the UK Financial Services Authority (FSA) has proposed an approach to scale long run average PDs to better reflect tail risks1
1. Source: Basel III: A global regulatory framework for more resilient banks and banking systems, December 2010, Paragraph 22

Copyright © 2011, SAS Institute Inc. All rights reserved. #analytics2011Content Copyright © 2011 Deloitte Development LLC. All rights reserved.
Parameter Stressing: Potential ApproachesThe following two approaches are commonly used in the industry for estimating stressed parameters:
Adding conservative “add-ons” to unconditional parameters
• Flat increase of PD, say by x bps. The increase is typically calibrated by industries, countries, regions, etc.
• Add-on usually based on either: a) expert judgment, or b) distribution of the parameter (e.g., add 1 standard deviation to the PD)
Explicitly modeling stressed parameters
• Usually done by modeling risk parameters as a function of stressed macroeconomic variables (e.g., GDP, unemployment rate, etc.), sometimes industry/firm specific factors are also used
• Approaches can range from simple to relatively complex. Two examples are provided in the next page
Copyright © 2011, SAS Institute Inc. All rights reserved. #analytics2011Content Copyright © 2011 Deloitte Development LLC. All rights reserved.
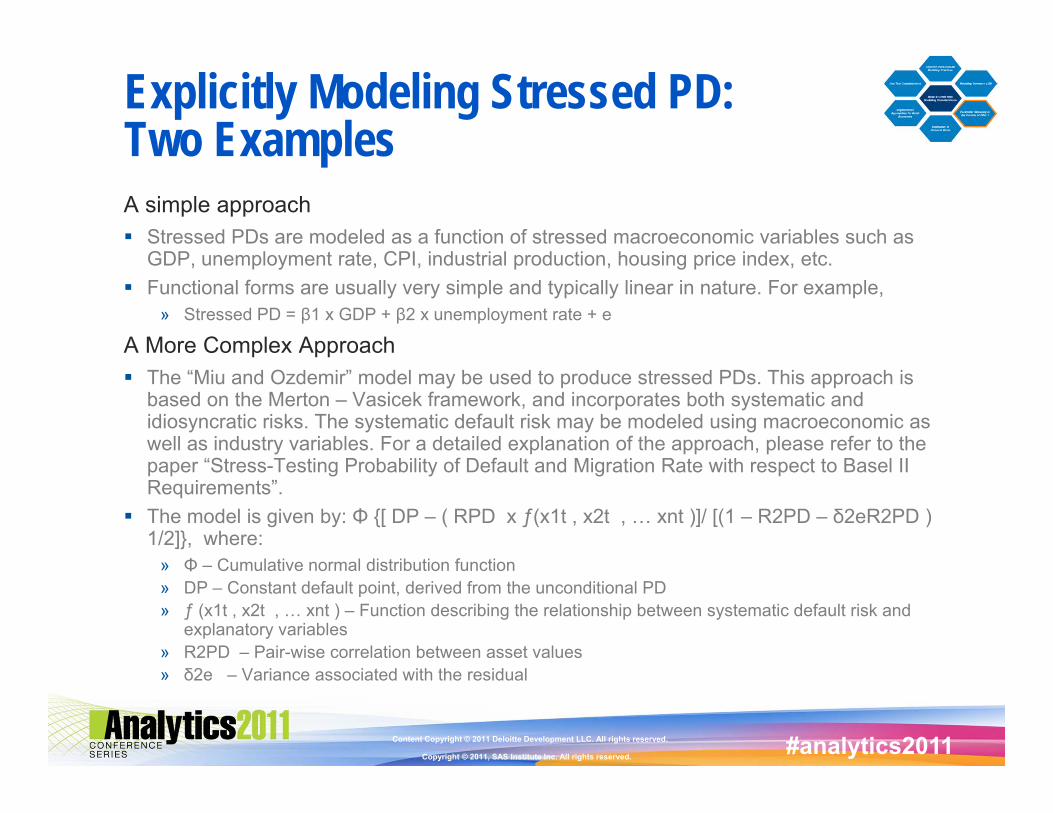
Explicitly Modeling Stressed PD: Two ExamplesA simple approach Stressed PDs are modeled as a function of stressed macroeconomic variables such as
GDP, unemployment rate, CPI, industrial production, housing price index, etc. Functional forms are usually very simple and typically linear in nature. For example,
» Stressed PD = β1 x GDP + β2 x unemployment rate + e
A More Complex Approach The “Miu and Ozdemir” model may be used to produce stressed PDs. This approach is
based on the Merton – Vasicek framework, and incorporates both systematic and idiosyncratic risks. The systematic default risk may be modeled using macroeconomic as well as industry variables. For a detailed explanation of the approach, please refer to the paper “Stress-Testing Probability of Default and Migration Rate with respect to Basel II Requirements”.
The model is given by: Φ {[ DP – ( RPD x ƒ(x1t , x2t , … xnt )]/ [(1 – R2PD – δ2eR2PD ) 1/2]}, where:
» Φ – Cumulative normal distribution function» DP – Constant default point, derived from the unconditional PD» ƒ (x1t , x2t , … xnt ) – Function describing the relationship between systematic default risk and
explanatory variables» R2PD – Pair-wise correlation between asset values» δ2e – Variance associated with the residual

Copyright © 2011, SAS Institute Inc. All rights reserved. #analytics2011Content Copyright © 2011 Deloitte Development LLC. All rights reserved.
Discount Rate in LGD Modeling
Discount Rate in the Context of LGD Modeling
• Discount Rate is a key input in Loss Given Default (LGD) calculations• The discount rate is used to calculate the present value (PV) of cash flows
associated with defaulted exposures• The Discount rate used in the estimation of LGD should reflect the costs of
holding the defaulted asset over the period, including an appropriate risk premium required by the asset holders.
Approaches for Discount Rate Determination
• Banks typically use the following approaches for estimating discount rates. These approaches are explained in greater detail in the next page
– Weighted average cost of capital– Opportunity cost of funds/
Investment hurdle rate
– Market Implied Discount Rate– Yield on other High Risk Assets
LGD =Economic Loss
Exposure at Default
Exposure at Default – PV*(Recoveries) + PV*(Costs)
Exposure at Default
* where PV is a function of Discount Rate
=

Copyright © 2011, SAS Institute Inc. All rights reserved. #analytics2011Content Copyright © 2011 Deloitte Development LLC. All rights reserved.
Commonly Used Discount Rate MethodologiesOpportunity Cost of Funds/Investment Hurdle Rate
Description:• Reflects the required internal rate of return on equity invested to undertake new projectsHighlights:• Captures the “opportunity cost” of allocating funds to other investments within the company• Is not directly driven by market data and hence is less volatile
Market Implied Discount Rate (sale of defaulted assets)
Description:• Implied discount rate on recovery cash flows computed by comparing the market price of defaulted
loans/bonds sold 30 days after default to their eventual recovery value and making assumptions on recovery timing
Highlights:• Rate reflects investors’ view on expected recovery and volatility of defaulted assets• Based on corporate debt instruments, might be less relevant to specific FIs depending on their
exposures
Yield on other High Risk Assets (non-defaulted)
Description:• Defaulted assets may be considered high risk and hence the appropriate discount rate could be
estimated using returns on other high risk assetsHighlights:• Rate reflects investors’ view on expected recovery and volatility of defaulted assets• Based on corporate debt instruments, might be less relevant to specific FIs depending on their
exposures
Weighted Average Cost of Capital
Description:• WACC is the overall cost of funding based on the capital structure of the firm and considers the cost
and weight of both equity and debt financingHighlights:• Varies over time with the bank’s leverage, risk premium, and credit condition, as well as market
conditions• Reflects the composite cost of funding rather than volatility of recovery rates

Copyright © 2011, SAS Institute Inc. All rights reserved. #analytics2011Content Copyright © 2011 Deloitte Development LLC. All rights reserved.
Example – Estimating WACC (Weighted Average Cost of Capital)The Formula for WACC The weighted average cost of capital, WACC, is the minimum rate of return allowable
and still meet financing obligations.WACC = Wd(Kd)(1-t) + Wpfd(Kpfd) + (We)(Ke)
Where Wd = The proportion of the financing provided by debtWpfd = The proportion of the financing provided by preferred stockWe = The proportion of the financing provided by equityKd = The cost of debtt = Corporate tax rateKpfd = dividend/ share priceThe Ke = Risk free rate (rf)+ Beta (β) * Market risk premium (rm – rf)
An ExampleLiability/Equity ($) Proportion (W) Inputs for Cost of
CapitalEffective Cost of
Capital WACC
Debt $250,000 Wd = 0.25 Kd = 8%, t = 30% Kd(1-t) = 5.6% WdKd(1-t) = 1.4%
Preferred Equity $250,000 Wpfd = 0.25 Kpfd = 6% Kpfd = 6.0% Wpfd(Kpfd) = 1.5%
Common Equity $500,000 We = 0.50 rf = 4.4%, β = 0.85rm – rf = 6.6%
Ke = Rf + β (rm – rf) = 10.01% WeKe = 5.0%
$1,000,000 1.00 7.9%

Copyright © 2011, SAS Institute Inc. All rights reserved. #analytics2011Content Copyright © 2011 Deloitte Development LLC. All rights reserved.
Segmentation Based On Modeled Attributes (PD/LGD/EAD)
Segmentation Based On Raw Attributes (e.g., LTV)
Develop exposure –level models
Score exposures (Assign PD/LGD/EAD)
Create segments; based on PD/LGD/EAD, assign exposures to segments
Generate segment-level parameters
Assign segment parameters to all
exposures in a segment
Develop segment–level models
Based on exposure attributes, assign
exposures to segments
Generate segment-level parameters
Assign segment parameters to all
exposures in a segment
Establish a segmentation framework
Segmentation Systems: An IntroductionFor retail exposures, Basel II requires Banks to assign risk parameters (for the purposes of risk-weighted asset calculation) at the segment level. Banks typically choose from one of the two approaches listed below to develop retail segments

Copyright © 2011, SAS Institute Inc. All rights reserved. #analytics2011Content Copyright © 2011 Deloitte Development LLC. All rights reserved.
Segmentation Systems: Key Considerations
This approach accounts for changes in the composition of the segment in assigning risk parameters
This approach is operationally and computationally more complex because it requires each exposure to be scored independently
Does not account for changes in segment composition, has been traditionally used for risk management of retail exposures
This approach is operationally and computationally simpler as it requires fewer scoring routines (equal to the number of segments)
Segmentation Based On Modeled Attributes (PD/LGD/EAD)
Segmentation Based On Raw Attributes (e.g., LTV)

Copyright © 2011, SAS Institute Inc. All rights reserved. #analytics2011Content Copyright © 2011 Deloitte Development LLC. All rights reserved.
Use Test: Definition & Interpretation
Regulatory Definition of Use Test Within the U.S. Basel II Final Rule, Banks are required to satisfy the “Use Test”
requirement The requirement essentially mandates that Bank’s Basel II models, risk rating systems,
segmentation systems, and data governance and management processes are consistent with existing risk management systems and processes
Interpretation of Use Test The U.S. regulatory guidance has provided Bank’s with considerable room for
interpretation on the “Use Test”» During a 2006 speech, Federal Reserve Chairman, Ben Bernanke said, “Under the use test,
the systems and processes that a bank uses for regulatory capital purposes must be consistent with those used internally. Note that I use the word ‘consistent,’ not ‘identical.’”
» While this feedback did emphasize the fact that the “Use Test” did not require Bank’s to have identical regulatory and internal risk management systems, it did not provide prescriptive guidance regarding the approaches or methods which would satisfy the “Use Test”
» Banks have established their own approaches to satisfying the “Use Test” and establish a de-facto industry standard in the process

Copyright © 2011, SAS Institute Inc. All rights reserved. #analytics2011Content Copyright © 2011 Deloitte Development LLC. All rights reserved.
Use Test Dimensions
Credit monitoring and approval processes should be aligned with the Basel II credit systems
Example – Bank’s should use the same risk ratings across loan approval and monitoring, and Basel II capital calculations
Historical/Current period data used for model development/ scoring should be consistent across BII and other risk processes
Example – FICO scores used for Basel II models and other internal processes should be consistent
While EC/ALLL and Basel II credit models may have some differences in underlying modeling approaches, key risk factors and segmentation frameworks should be aligned (differences should be well understood, documented, and explained)
For example, the Bank should use similar modeling granularity (e.g., account level) and risk drivers (e.g., account age) for parameters across the various estimation frameworks
Dimensions for Substantiating “Use Test”

Copyright © 2011, SAS Institute Inc. All rights reserved. #analytics2011Content Copyright © 2011 Deloitte Development LLC. All rights reserved.
Disclaimer
This publication contains general information only and Deloitte is not, by means of this publication, rendering accounting, business, financial, investment, legal, tax, or other professional advice or services. This publication is not a substitute for such professional advice or services, nor should it be used as a basis for any decision or action that may affect your business. Before making any decision or taking any action that may affect your business, you should consult a qualified professional advisor.
Deloitte shall not be responsible for any loss sustained by any person who relies on this publication.
Copyright © 2011 Deloitte Development LLC. All rights reserved.

Copyright © 2011, SAS Institute Inc. All rights reserved. #analytics2011