(Based on NTC, UTL and Mero Mobile)
81
1 MARKET RESEARCH OF TELECOMMUNICATION IN NEPAL (Based on NTC, UTL and Mero Mobile) By SHOMBHU THAKULLA Shanker Dev Campus Campus Roll No. : 290/062 T.U. Regd. No.: 7-1-282-368-99 A Thesis Submitted to: Office of the Dean Faculty of Management Tribhuvan University In partial fulfillment of the requirement for the degree of Master of Business Studies (MBS) Kathmandu, Nepal July 2010
Transcript of (Based on NTC, UTL and Mero Mobile)

1
MARKET RESEARCH OF TELECOMMUNICATIONIN NEPAL
(Based on NTC, UTL and Mero Mobile)
BySHOMBHU THAKULLA
Shanker Dev CampusCampus Roll No. : 290/062
T.U. Regd. No.: 7-1-282-368-99
A Thesis Submitted to:Office of the Dean
Faculty of ManagementTribhuvan University
In partial fulfillment of the requirement for the degree ofMaster of Business Studies (MBS)
Kathmandu, NepalJuly 2010

2
RECOMMENDATION
This is to certify that the thesis
Submitted by:
SHOMBHU THAKULLA
Entitled:
MARKET RESEARCH OF TELECOMMUNICATION IN NEPAL(Based on NTC, UTL and Mero Mobile)
has been prepared as approved by this Department in the prescribed format of
the Faculty of Management. This thesis is forwarded for examination.
…………………..………….. ........…………..….….….……… ……………..………………….
Kailash P. Amatya Prof. Bishweshor Man Shrestha Prof. Dr. Kamal Deep Dhakal
(Thesis Supervisor) (Head, Research Department) (Campus Chief)

3
VIVA-VOCE SHEET
We have conducted the viva –voce of the thesis presented
By
SHOMBHU THAKULLA
Entitled:
MARKET RESEARCH OF TELECOMMUNICATION IN NEPAL(Based on NTC, UTL and Mero Mobile)
And found the thesis to be the original work of the student and writtenaccording to the prescribed format. We recommend the thesis to
be accepted as partial fulfillment of the requirement for the degree of
Master of Business Studies (MBS)
Viva-Voce Committee
Head, Research Department …………………….………
Member (Thesis Supervisor) …..………………………..
Member (External Expert) …..………………………..…

4
DECLARATION
I hereby declare that the work reported in this thesis entitled “Market
Research of Telecommunication in Nepal (Based on NTC, UTL and Mero
Mobile)” submitted to Office of the Dean, Faculty of Management, Tribhuvan
University, is my original work done in the form of partial fulfillment of the
requirement for the degree of Master of Business Studies (MBS) under the
supervision of Kailash P. Amatya of Shanker Dev Campus, T.U.
..…………………………
Shombhu Thakulla
T.U. Regd. No.: 7-1-282-368-99
Campus Roll No. : 290/062

5
ACKNOWLEDGEMENT
I would like to express my gratitude and appreciation to all those who provided
me the genuine support to complete the thesis. I am greatly be debited with all
personalities for their respective helps and suggestions.
I take this opportunity to acknowledge my deep sense of Gratitude to my
supervisor Kailash P. Amatya of Shanker Dev Campus, Tribhuvan University,
for his generous encouragement and undertakings of the supervision of my
entire research work. This form of the report is the outcome of his continuous
encouragement, helpful suggestions and comments. I wish to extend thanks to
Prof. Dr. Kamal Deep Dhakal, Campus Chief of Shanker Dev Campus and my
all respected teachers for providing me the invaluable information, suggestions
and comments.
I would like to express heartily thanks to the staff of Library Shanker Dev
Campus, staff of Central Library of T.U, and staff of Nepal Telecom for the
kind cooperation during my visit of study. My special thanks go to Mr.
Rajendra Kumar Dahal, officers of Nepal Telecom for providing their valuable
data, suggestions generously for the completion of this thesis. Also I am very
much thankful to my friends Mr. Santa Kumar Maharjan of United Telecom for
his help in completion of my research work. And I would also like to say
thanks to my colleagues who provided their help directly or indirectly in my
study.
Last but not least, I would to express my deep gratefulness to my friend Mr.
Harischandra Bhandari, Mr. Santosh K.C, Mr. Santosh Gurung, Mr. Arjun
Paudel, Mr. Jaganath Dahal, Mr. Prem Prasad Nepal, Mr. Madan Thapa and
Mr. Hem Karna Rai. My special thanks to Miss Sita Thapa for the
encouragement and moral support from inception to completion of this thesis
research work.

6
ABBREVIATIONS
& : And
3G : Third Generation
A.D : Anno Domini
ARUP : Average Revenue per User
B.S : Bikram Sambat
CDMA : Code Division Multiple Access
DSAT : District Satelite
EDR : Eastern Development Region
F.Y : Fiscal Year
GSM : Global System for Mobile Communication
ICT : International Communicational Technology
ITU : International Telecommunication Union
LTD. : Limited
MMS : Multimedia Messaging Services
MTNL : Mahanagar Telephone Nigam Limited
NTA : Nepal Telecommunication Authority
NTC : Nepal Telecom
PCC : Profit Planning and Control
PCO : Public Communication Office
PVT. : Private
RSAT : Regenerative Satellite Access Terminals
S.N : Serial Number
SMS : Short Message Service
TCIL : Telecommunications Consultants India
Limited
UTL : United Telecom Limited
VSNL : Videsh Sanchar Nigam Limited
WCDMA : Wideband Code Division Multiple Access
WLL : Wireless Local Loop

7
TABLE OF CONTENTSRecommendation
Viva Voce Sheet
Declaration
Acknowledgement
Table of Contents
List of Figures
Abbreviations
Page No.
CHAPTER – I INTRODUCTION
1.1 General Background of Telecommunication Services 1
1.1.1 Establishment of Nepal Telecommunications Authority 1
1.1.2 Telecom Policy, 2004 2
1.2 Brief Overview of Telecommunications of Nepal 2
1.2.1 Brief History of Nepal Telecom 2
1.2.2 Brief History of Mero Mobile 6
1.2.3 Brief History of UTL Mobile 8
1.3 Strategy of Telecommunication Service 9
1.4 Statement of the Problems 10
1.5 Scope of the Study 11
1.6 Focus of the Study 12
1.7 Objectives of the Study 12
1.8 Significance of the Study 13
1.9 Limitations of the Study 13
1.10 Organization of the Study 14
CHAPTER-II REVIEW OF LITERATURE
2.1 Review of Conceptual Framework 15

8
2.1.1 Market 15
2.1.2 Market Segmentation 17
2.1.2.1 Need for Market Segmentation 18
2.1.2.2 Bases for Segmentation in Consumer Market 18
2.1.2.3 Bases for segmentation in Industrial Markets 18
2.1.3 Market Analysis 19
2.1.3.1 Market Size 19
2.1.3.2 Market Growth Rate 20
2.1.3.3 Market Profitability 20
2.1.3.4 Market Trends 20
2.1.3.5 Key Success Factors 21
2.2 Review of Previous Related Studies 21
2.2.3 International Telecommunication Union (ITU) 23
2.2.4 Telecom Network of the Country 24
2.3 Research Gap 24
CHAPTER – III RESERCH METHODOLOGY
3.1 Research Design 26
3.2 Nature and Sources of Data 26
3.3 Population and Sample 26
3.4 Data Collection Procedure 30
3.5 Technique of Data Analysis 31
CHAPTER – IV PRESENTATION AND ANALYSIS OF DATA
4.1 Status of Landline and Mobile Users 33
4.1.1 Distribution of Landline and Mobile Users According to
Development Region 33
4.1.2 Distribution of Landline and Mobile Users by Demographic and
Socioeconomic Status in Survey Areas 35
4.1.3 Table of Cellular Mobile Phone and Fixed Telephone Service 37

9
4.2 Distribution of GSM Prepaid and Postpaid and CDMA Users 38
4.3 Distribution of Brand of Mobile Users of NTC, Mero Mobile
and UTL (Users Only) 39
4.4 Reasons for Using Mobiles 42
4.5 Distribution of Monthly Expenditure on Mobiles 44
4.5.1 *Average Revenue per User (ARUP) 45
4.5.2 Satisfaction Level of Network Coverage 46
4.5.3 Satisfaction Level of Customer Service 48
4.5.4 Satisfaction Level of Call Rate of Mobile Service 51
4.5.5 Satisfaction Level of Value added Service of
Different Mobile Service 53
4.6 Future Expectation about New Mobile Service or Improvement in
Existing Mobile Service 55
4.7 Services to be Included in New Mobile Service 57
4.8 Services to be included in New Mobile Service (Contd.) 58
4.9 Major Findings 60
CHAPTER – V SUMMARY, CONCLUSION AND
RECOMMENDATION
5.1 Summary 61
5.2 Conclusion 65
5.3 Recommendations 66
Bibliography

10
LIST OF TABLES
Table No. Title Page
No.
1.1 Network Coverage of Ncell According to Development
Region, Zone and District 7
3.1 Total Population of Nepal According to Development Regions 27
3.2 Sample Market with Development Regions 28
4.1 Distribution of Landline and Mobile Users According to
Development Region 33
4.2 Distribution of Landline and Mobile Users by
Demographic and Socioeconomic Status in Survey Areas 35
4.3 Cellular Mobile Phone and Fixed Telephone Service 37
4.4 Distribution of GSM Prepaid and Postpaid and CDMA Users 38
4.5 Distribution of Brand of Mobile Users of NTC, Mero Mobile
and UTL (Users Only) 39
4.6 Subscribers of Cellular Services 41
4.7 Reasons for Using Mobiles 42
4.8 Distribution of Monthly Expenditure on Mobiles 44
4.9 Average Revenue per User (ARUP) 45
4.10 Satisfaction Level of Network Coverage 46
4.11 Satisfaction Level of Customer Service 48
4.12 Satisfaction Level of Call Rate of Mobile Service 51
4.13 Satisfaction Level of Value Added Service of
Different Mobile Service 53
4.14 Future Expectation about New Mobile Service or Improvement in
Existing Mobile Service 55
4.15 Services to be Included in New Mobile Service 57
4.16 Services to be included in New Mobile Service (Contd.) 58

11
LIST OF FIGURES
Figure No. Title Page
No.
1.1 Board of Directors 4
2.1 Total Population 16
3.1 Population Distributed By Development Region 28
3.2 Sample Population According to Development Region 30
4.1 Population Distribution By Development Regions 33
4.2 Raphical Representation of Cellular Services of NDCL and SPNL 41
4.3 Reasons for Using Mobile Phone 43
4.4 Graphical Representation 45
4.5 Satisfaction Level of Network Coverage 47
4.6 Satisfaction Level of Customer Service 49
4.7 Satisfaction Level of Call Rate of Mobile Service 52
4.8 Satisfaction Level of Value Added Service of
Different Mobile Services 54
4.9 Services to be Included in New Mobile Service 59

12
CHAPTER - I
INTRODUCTION
1.2 General Background of Telecommunication Services
With the unprecedented innovations in the field of telecommunication services
and rapid telecommunications development in the world, it has become
necessary to bring with the same pace development and expansion in this sector
in Nepal also. Keeping in harmony with the currently evolving new
technological developments, the emerging craze for globalization and
liberalization of market economy concept, it is felt that the resources and
efforts of Nepal government alone cannot fulfill the steadily increasing demand
of the telecommunication services in a competitive environment. Even though
the private sector entrepreneurs are interested in investing in the novel sectors,
flow of private sector capital in productive areas could not be made effective
due to unfavorable environment and lack of opportunities. Taking this scenario
into account, the National Communication Policy 1992 envisaged the concept
of encouraging the private sector participation for providing telecommunication
services to the public and to assist to the extent possible as is deemed necessary
in an easily available, simple and well planned manner for the development,
expansion and operation of this sector inside the kingdom of Nepal as well as
abroad.
1.1.1 Establishment of Nepal Telecommunications Authority
With this concept, using liberalization policy and involving the private sector in
a competitive environment for the development and expansion of
telecommunication sector in Nepal, His Majesty's Government of Nepal's
(cabinet’s) decision dated December 25, 1995 has initiated the involvement of
the private sector in the development of the telecommunication services. Nepal
Telecommunications Authority as an autonomous regulatory body has been

13
established on March 4, 1998 as stipulated within the framework of the
Telecommunication Act 1997 and Telecommunication Regulation 1998 to
make this work more systematic and regular
1.1.2 Telecom Policy, 2004
In the context of the difficult geographical terrain of Nepal,
telecommunications infrastructure is seen as more important than others. New
opportunities are being seen in the telecom sector due to the rapid development
of technology and continuous changes in the infrastructures. Nepali citizens
can also benefit from the worldwide trend in the reduction of tariff in the
telecommunications sector. In this context, by utilizing the achievements
gained in the telecom sector for maximum benefits and also to use the
possibilities and opportunities that might come in future for the greater benefit
of the Nepali people, the necessity of an appropriate and up to date policy has
been felt. Hence, His Majesty's Government of Nepal has passed the Telecom
Policy, 2004 replacing the older Telecom Policy, 1999 by the decision of the
cabinet on March 8, 2004.
The monopoly of limited telecom industries, curious and capacity of Nepalese
people towards telecom services and a new innovative topic in the field of
marketing build keen interest upon the topic. The frequent discussion, team of
research project co ordinate bring closer for the development of interest. The
development of IT world and curious world make closer with this topic
1.2 Brief Overview of Telecommunications of Nepal
1.2.1 Brief History of Nepal Telecom
In Nepal, operating any form of telecommunication service dates back to 94
years in B.S. 1970. But formally telecom service was provided mainly after the
establishment of MOHAN AKASHWANI in B.S. 2005.Later as per the plan
formulated in First National Five year plan (2012-2017); Telecommunication

14
Department was established in B.S.2016. To modernize the
telecommunications services and to expand the services, during third five-year
plan (2023-2028), Telecommunication Department was converted into
Telecommunications Development Board in B.S.2026. After the enactment of
Communications Corporation Act 2028, it was formally established as fully
owned Government Corporation called Nepal Telecommunications
Corporation in B.S. 2032 for the purpose of providing telecommunications
services to Nepalese People. After serving the nation for 29 years with great
pride and a sense of accomplishment, Nepal Telecommunication Corporation
was transformed into Nepal Doorsanchar Company Limited from Baisakh 1,
2061. Nepal Doorsa nchar Company Limited is a company registered under the
companies Act 2053. However the company is known to the general public by
the brand name Nepal Telecom as registered trademark.
Today NTC has services like NTC Landline; GSM prepaid (Namaste Mobile)
and post paid, postpaid 3G in Katmandu Valley, CDMA etc. Total subscribers
of NTC services, except landline are 3 million.
Board of Directors
NT has managing Directors under the supervision and Control of Board of
Directors. There are 6 Members in Board of Directors with 4 years working
period and meeting of Board of Director will be held minimum 6 times in a
year. The board of Directors chaired by secretary of Ministry of information
and communication with 4 members from government, 1 from the Citizen
Investment Trust and 2 members From the Telecom to run the affairs of the
Organization. The Composition of board of Directors is as Follows:
Figure 1.1

15
Board of Directors
NT in the Tenth Five Year Plan
The tenth five years Plan is a highly ambitious and challenging Project
targeting to provide telephone connection on demand throughout the country.
This project aims to cover 100% of VDCs (excluding the remaining VDCs in
Eastern Development Region) and raise substantially telephone penetration to
5.7%. For achieving the targeted penetration throughout the country. Nepal
Telecom aims to provide telecom Services also through CDMA system.
A telecom superhighway along the East-west Highway has been established
with Grant assistance from Government of India. An alternative satellite
network connecting major destinations in the country will also be established
ChairmanMr. Sushil Ghimire
SecretaryMinistry of Information &
Communications
MemberMr. Amarnath SinghManaging Director
Nepal Telecom
MemberMr. Bimal Prasad Wagle
Joint SecretaryMinistry of Finance
MemberMr. Narayan Prasad Regmi
Joint SecretaryMinistry of Information &
Communication
SecretaryMr. Buddhi Prasad Acharya
Company SecretaryNepal Telecom
MemberMr. Raju Man Singh Malla
Joint SecretaryMinistry of Law, Justice &
Constituent AssemblyAffairs
Source: www.ntc.net.np
16
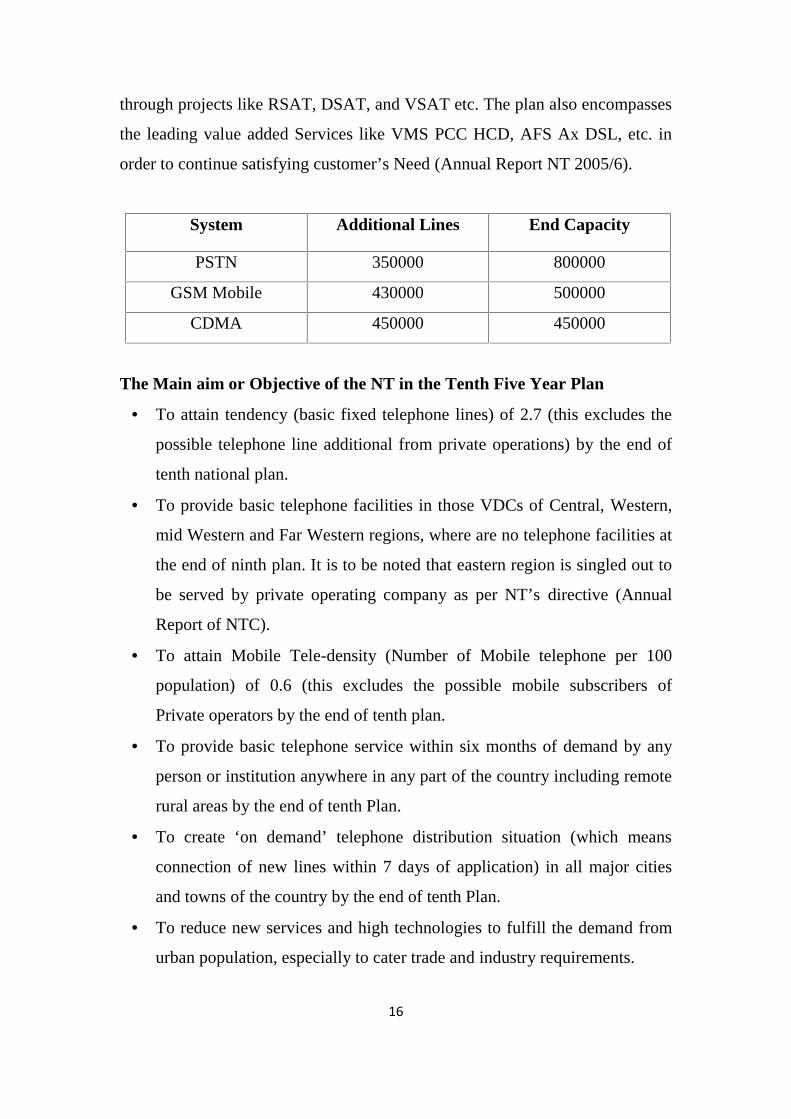
through projects like RSAT, DSAT, and VSAT etc. The plan also encompasses
the leading value added Services like VMS PCC HCD, AFS Ax DSL, etc. in
order to continue satisfying customer’s Need (Annual Report NT 2005/6).
System Additional Lines End Capacity
PSTN 350000 800000
GSM Mobile 430000 500000
CDMA 450000 450000
The Main aim or Objective of the NT in the Tenth Five Year Plan
To attain tendency (basic fixed telephone lines) of 2.7 (this excludes the
possible telephone line additional from private operations) by the end of
tenth national plan.
To provide basic telephone facilities in those VDCs of Central, Western,
mid Western and Far Western regions, where are no telephone facilities at
the end of ninth plan. It is to be noted that eastern region is singled out to
be served by private operating company as per NT’s directive (Annual
Report of NTC).
To attain Mobile Tele-density (Number of Mobile telephone per 100
population) of 0.6 (this excludes the possible mobile subscribers of
Private operators by the end of tenth plan.
To provide basic telephone service within six months of demand by any
person or institution anywhere in any part of the country including remote
rural areas by the end of tenth Plan.
To create ‘on demand’ telephone distribution situation (which means
connection of new lines within 7 days of application) in all major cities
and towns of the country by the end of tenth Plan.
To reduce new services and high technologies to fulfill the demand from
urban population, especially to cater trade and industry requirements.

17
To give impetus to IT developments in the country by expanding internet
network throughout the country.
To establish brand board backbone links interlinking major cities and
towns this will help the country to move towards “ information society”
1.2.2 Brief History of Mero Mobile
Spice Nepal Private Ltd., popularly known under its brand name "Ncell", is the
first private GSM mobile operator in Nepal. Company was established in 2004
and commercially launched on 17th September 2005.
It is a youth focused brand and the most innovative operator. Its customer base,
however, largely remains among those with less spending capacity (Example:
students), probably also because of its aggressive customer pull campaigns and
easy availability. It has GSM Pre-paid and Post-paid services and operates in
35 districts (out if total 75), covering all the 14 zones of Nepal with almost 2.26
millio subscribers.
Mero Mobile GSM is constantly expanding its coverage, adding new cities and
regions to its country-wide network. Powered by our commitment to setting
new service standards the GSM network coverage will extend throughout the
country gradually. Mero Mobile is providing different kinds of Services to the
public like Voice messages, Text messages, Call Forwarding, Call Waiting,
Fax Call Conference etc.
Currently, Spice Nepal officially rebranded its brand from Mero Mobile to
Ncell from March 12, 2010. Their aim is to promote Ncell in Nepal with top
quality to customers with cheap and best technology to compete with other
telecommunications of Nepal. Company is eager to make more investment in
Nepalese market to expand its network. We should consider it positive
symptoms for the development of nation and generation of employment in

18
competitive market. This compels other competitors to enhance their quality in
services.
Though Mero mobile has been converted to Ncell but because of its brand
name and its popularity in public tongue. I have also used Ncell as a Mero
Mobile or Spice Nepal. Here, its name has only changed and its whole data are
based on the statistical of Mero Mobile collected 6 months before.
Table 1.1
Network Coverage of Mero Mobile According to Development
Region, Zone and District
Development Regions Zone Districts
Eastern DevelopmentRegion
Mechi,Koshi&Sagarmatha
Illam, Jhapa, Morang Sunsari, Saptari,Siraha & solukhumbu
Central DevelopmentRegion
Janakpur, Narayani& Bagmati
Dhanusha, Mohatttari, Dolakha,Sarlahi, Bara, Chitwan, Makwanpurparsa, Rautahaut, Bhaktapurkavrepalanchowk kathmandu, lalitpur& sindhupalchowk
Western DevelopmentRegion
Gandaki & Lumbini Gorkha, kaski , tanahau kapilvastu,Nawalparashi,&Rupendhei
Mid WesternDevelopment Region
Rapti ,Bheri, Karnali& Dhaulagiri
Dang, Deukheri, banke Surkhet,Baglung &Jumla
Far WesternDevelopment Region
Seti & Mahakali Kailali &Kanchanpur
1.2.3 Brief History of UTL Mobile
United Telecom Ltd, a joint venture between Videsh Sanchar Nigam Ltd.
(VSNL), Mahanagar Telephone Nigam Ltd. (MTNL), and Telecommunications
Consultants India Ltd. (TCIL), and Nepal Ventures Private Ltd. (NVPL) plans
to offer telephony services in Nepal, based on the wireless local loop (WLL)
technology. After exhaustive deliberations & extensive scrutiny, UTL was
declared successful bidder by NTA in the bid for basic telephone service based
on WLL technology and letter of intent was awarded on 21st June 2001 &,

19
finally, the license was issued on 4th October 2002.UTL provides WLL
wireless phone services and is presently operating in the Central Development
Region. The present Network is in 7 zones i.e. 12 districts which includes 15
cities. And has a fair customer base of about 200,000 subscribers owing
mainly to its low tariff and easy availability.
Board of Directors of UTL
The Board of Directors of company consists of four members comprising of
one nominees each of MTNL, TCIL, Tata Communications Ltd. (formerly
VSNL)and NVPL. The following are the Directors of the company
Shri R.S.P Sinha
Chairman and Managing Director
Mahanagar Telephone Nigam Limited (MTNL)
Shri R.K. Upadhaya
Chairman and managing Director
Telecommunications and Consultants India Limited (TCIL)
Shri S.K Gupta
Advisor- Telecom Tata Group
Shri T.C Agrawal
Chairman and Marketing Director
Nepal Ventures Private Limited (NVPL)
Presently, Shri S.K. Gupta is the Chairman of Board of Director of United
Telecom Limited.
1.3 Strategy of Telecommunication Service

20
Universal Service Obligation
The telecommunication service providers shall be required to provide service to
any customer of the urban areas on demand.
Development of Corporate Service
In the urban areas, arrangement shall be made to provide the leased line, data
and other similar corporate services to the government entities and private
business enterprises through more than one service provider.
Liberalization of the Telecommunication Sector
The telecommunication sector has been fully opened for the service providers.
However, the number of the service providers may be limited due to the radio
spectrum. While providing directory service, the service provider shall be
required to provide such service incorporating all customers using the service.
Open Licensing Regime To Be Applied
The open licensing regime shall be applied for providing opportunity to all
service providers to enter into the telecommunication sector. Transparent
procedures shall be applied for granting such license. Moreover, an
environment for healthy competition shall be created.
Private Sector's Participation to Be Encouraged
The private sector's participation shall be encouraged for the
telecommunication sector. Foreign investment shall be attracted. Arrangement
shall be made to regularly inform the private sector about the particulars of
reform undertaken in the telecommunication sector and about the opportunity
available in this sector.
To Enter into Information Society

21
By arranging other necessary prerequisites such as extension of
telecommunication service and drafting of Cyber Law, Nepal shall be made to
enter into the Information Society in an effective manner.
Appropriate Information and Communication Technology for the
Users of the Rural Areas
Appropriate information and communication technology shall be made
available as per the capacity and need of the users of the rural areas. In this
connection, the information and communication technology that do not require
special training and literacy based on radio, television and telephone shall be
made available in collaboration with the private sector at all. The service of
information and communication technology shall be made available to the rural
users through the means of small service providers.
1.4 Statement of the Problems
In order to provide access of the telecommunication services to the general
public of rural and urban areas of the Kingdom, arrangement shall be made in a
manner that telecommunication services shall be made available within
shouting distance in the inhabited areas.
The telecommunication services shall be made available on demand in the
urban areas of the Kingdom. Corporate telecommunication service shall be
made available in the business areas.
Opportunity shall be provided to the customers of the urban areas to choose
services from different service providers. Arrangement of opportunity to
choose services accordingly shall be extended gradually to the rural areas also.
Arrangement shall be made for availing the use of appropriate information and
communication technology for poverty alleviation and development of the rural
areas.

22
Distribution of telecom services, user status, Factor of motivation, curiosity and
capability of Nepalese people, and satisfaction level of existing users has to be
find out. The probability of establishment of telecommunication industry in
Nepalese market has to be researched.
1.5 Scope of the Study
The Developing Countries like Nepal is far ahead in the infrastructure
development and technologies too. Among types of industries in Nepal the
telecommunication industries is also the one. The telecommunication industries
in Nepal are limited and have the monopoly market so the development of
Telecommunication industries in Nepal is far better appreciable. Mainly the
study is based on the customer opinion which has wide scope to the existing
telecommunication industries as well as the new mobile industries. The scopes
of mobile industries are listed below in points.
For the existing Mobile industries
1. To see the real picture for the growth of their industry in Nepalese Market
2. To analyze the weakness of existing mobile service providers towards
customers, and Nation.
3. To understand the strategy about the customers
4. To Find out the actual market for the development of telecommunications
For the New mobile industries
1. To Find out the strategies followed by the existing mobile industries
2. To Find out the possibility of new market
3. To motivate them to invest in new market than existing one.
1.6 Focus of the Study
The study is mainly based on the customer opinion of different areas, age
groups, caste, ethnicity, region, religion etc. The study is mainly based on the
opinion of customer who is the real user of Mobile services. The services

23
provided by the existing mobile industries and their tariff rates are the main
root of this study. Mainly the study includes the opinion of different people
about the services of existing mobile industries, their rates, their facilities and
the potentiality for the growth for the emerging telecommunications industries.
Some of the focusing points are listed below
1. Future Scope of emerging telecommunications in Nepal
2. Satisfaction Level of Customers on Network coverage, Services and
Tariffs
3. Services to be included in New Mobile Services
4. Drawbacks of existing telecommunications if any
1.7 Objectives of the Study
The primary objective of this study is to find out the potential market for the
emerging telecommunications in Nepal. Among Many objectives some of the
important objectives which the study tries to find out are listed in this manner.
To evaluate customers’ opinion and experiences on the prevailing services
of mobile service providers.
To derive estimation on potential user size/volume for new mobile service
provider.
To retrieve suggestions on anticipated new ideas of services by mobile
service provider.
To identify Satisfaction level of Customers Based on Network, Customer
Service, Call rates, Value Added Services
To Identify the Customer Future Expectation with New Mobile Services
or Improvement in existing Mobile Services.
1.8 Significance of the Study
The research work is mainly based on the interest and opinion of the customer
who is the real user of the product of Telecommunication industries. The study
is done to find out the customer opinion regarding pros and cons of telecom

24
industries. This study is also the primary survey for the potential market for the
new emerging telecommunication industries in the opinion of Customer. The
main aspect of this study is to promote the industries in the field of
telecommunications. The dissatisfaction regarding the network coverage,
services,. Facilities and rates of the customer should be decreased by
introducing innovative services in mobile. The monopoly of limited
telecommunications regarding rates, facilities, services should be removed. The
importance of this study is to introduce the real problems of customers.
1.9 Limitations of the Study
All the data presented here is the representation of the views of the sample
size of 1500.
All the figures are in percentage.
Demerits of this survey are that it doesn’t represent the total market as a
whole and only that of sample size selected.
The Data presented are Collected within the short period of Six Months
The Data are based on consumer opinion.
1.10 Organization of the Study
As specified format of the research study, this study also comprises of five
major chapters they are.
Chapter - I: Introduction
This chapter contains the brief introduction of the subject matter i.e. General
background of Telecommunication services, Brief overview of
telecommunications of Nepal, significance of the study, Statement of the
problem, Objectives of the study, Significance of the study, Limitations of the
study, Methodology of the Study, and Organizations of the study.

25
Chapter - II: Review of Literature
This Chapter Describes towards the review of literature of related studies. It
Contains conceptual review and Major studies Related with this research.
Chapter - III: Research Methodology
This chapter acknowledges the research methodology used in this study. It
includes Research Design, Nature and Source of Data, Period covered, Data
Processing Procedure and Tables and Diagrams used for the study.
Chapter - IV: Presentation and Analysis of Data
In This chapter various data (Primary and Secondary) data are gathered from
different sources and Presented as required by the research objective. In this
chapter data are analyzed and interpreted with the help of various tables and
diagrams.
Chapter - V: Summary, Conclusion and Recommendations
This Chapter states Summary, conclusion and recommendations of this study.
CHAPTER-II
REVIEW OF LITERATURE
Review of Literature means reviewing research studies or other relevant
propositions in the related area of the study so that all the past studies their
conclusions and deficiencies may be known and further research can be
concluded. It is an integral and mandatory process in research work (Joshi,

26
2003). It supports the researcher to explore the relevant and true facts for the
reporting purpose in the field of study. It also helps to find out his lacuna in the
earlier research work and to stop duplication of the previous work. It may be
various forms like book, booklet, thesis reports etc.
This chapter highlights the literature available related to the present Study. This
chapter has divided into two sections, Review of Conceptual Framework and
review of previous related Studies.
2.1 Review of Conceptual Framework
These are the general Concepts of Market Analysis Which are listed below:-
2.1.1 Market
In Marketing The term Market Refers to the group pf Consumers or
Organizations that is interested in product, has the resource to purchase the
product, and is permitted by law and other regulations to acquire the product.
Defining the Market is the first step in analyzing it. Since the market is likely to
be composed of consumers whose needs differ, Market Segmentation is useful
in Order to better understand those needs and to select the group within the
market that the firm will serve.
Market Definition
Figure 2.1
Total Population
Potential Market
Available Market
Qualified Available Market

27
Total Population
Conceptual Diagram
Beginning with total population, various terms are used to describe the market
based on the level of narrowing:
Total Population
Potential Market – those in the total population who have interest in
acquiring the product.
Available Market – those in the potential market who have enough money
to buy the product.
Qualified available Market- those in the available market who legally are
permitted to buy the product.
Target Market- the segment of the qualified available market that the firm
has decided to serve (the served Market).
Penetrated Market- those in the target market who have purchased the
product.
In above definitions product refers to both Physical products and services:
The size of the market is not necessarily fixed. For example the size of the
available market for a product can be increased by decreasing the product’s
price, and the size of the qualified available market can be increased through
changes in legislation that result in fewer restrictions on who can buy the
product.
Target Market
PenetratedMarket
28
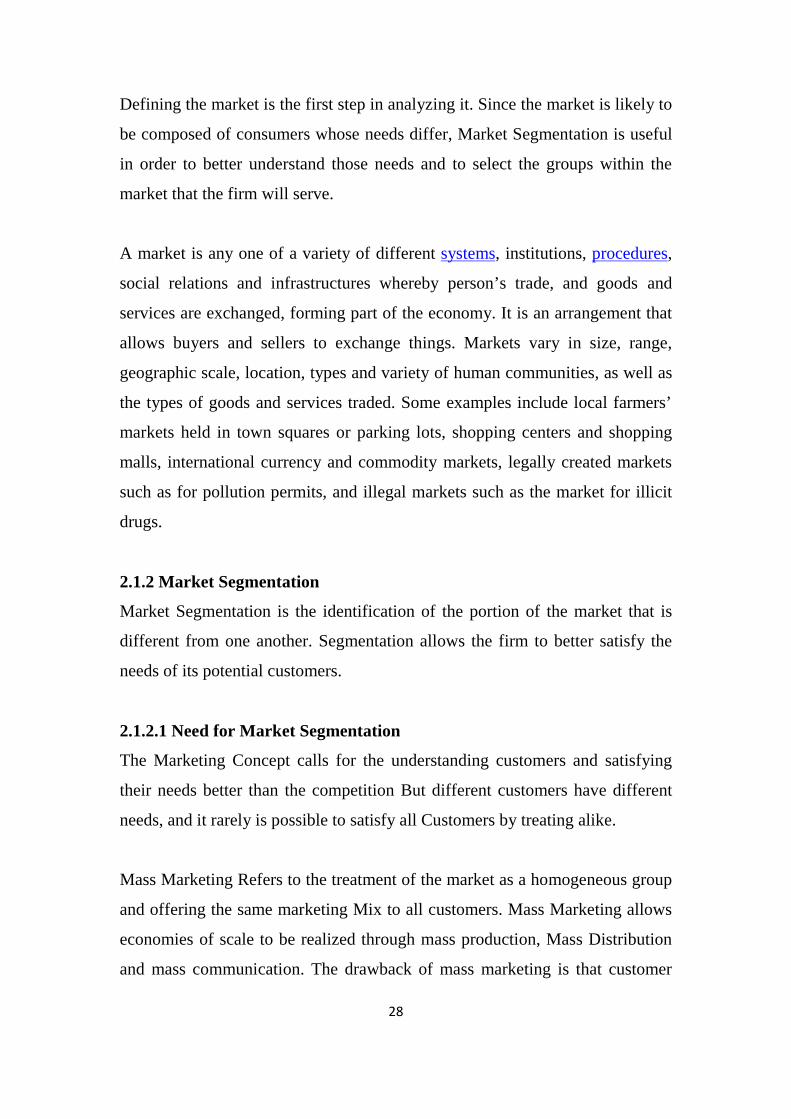
Defining the market is the first step in analyzing it. Since the market is likely to
be composed of consumers whose needs differ, Market Segmentation is useful
in order to better understand those needs and to select the groups within the
market that the firm will serve.
A market is any one of a variety of different systems, institutions, procedures,
social relations and infrastructures whereby person’s trade, and goods and
services are exchanged, forming part of the economy. It is an arrangement that
allows buyers and sellers to exchange things. Markets vary in size, range,
geographic scale, location, types and variety of human communities, as well as
the types of goods and services traded. Some examples include local farmers’
markets held in town squares or parking lots, shopping centers and shopping
malls, international currency and commodity markets, legally created markets
such as for pollution permits, and illegal markets such as the market for illicit
drugs.
2.1.2 Market Segmentation
Market Segmentation is the identification of the portion of the market that is
different from one another. Segmentation allows the firm to better satisfy the
needs of its potential customers.
2.1.2.1 Need for Market Segmentation
The Marketing Concept calls for the understanding customers and satisfying
their needs better than the competition But different customers have different
needs, and it rarely is possible to satisfy all Customers by treating alike.
Mass Marketing Refers to the treatment of the market as a homogeneous group
and offering the same marketing Mix to all customers. Mass Marketing allows
economies of scale to be realized through mass production, Mass Distribution
and mass communication. The drawback of mass marketing is that customer

29
needs and preference differs and the same offering is unlikely to be viewed as
optimal by all customers. If firms ignored the differing customer needs, another
firm likely would enter the market with a product that serves a specific group,
and the incumbent firms would lose those customers.
Target marketing on the other hand recognizers the diversity of customers and
does not try to please all of them with the same offering. The First step in target
marketing is to identify different market segments and their needs. Generally
Segmentation is done according to characteristics of Market.
2.1.2.2 Bases for Segmentation in Consumer Market
Consumer Market can be segmented on the following Customer characteristics
Geographic
Demographic
Psychographic
Behavioralistic
2.1.2.3 Bases for segmentation in Industrial Markets
In contrast to consumer Industrial Customers tend to be fewer in number and
purchase larger Quantities. They evaluate offerings in more detail, and the
decision process usually involves more than one person. These characteristics
apply to organizations such as manufacturers and service providers as well as
resellers, Governments and institutions.
Many of the consumer market segmentation variables can be applied to
industrial market. Industrial markets might be segmented on characteristics
such as
Location
Company Type
Behavioral Characteristics

30
2.1.3 Market Analysis
The Goal of Market analysis is to determine the attractiveness of a market and
to understand its evolving opportunities and Threats as they relate to the
strengths and weakness of the firm.
David A Aaker outlined the following Dimensions of a market Analysis:
Market Size
Market Growth Rate
Market Profitability
Market Trend
Key Success Factors
2.1.3.1 Market Size
The Size of the Market can be evaluated based on present sales and on potential
sales if the use of the product were expanded. The following are some
information sources for determining market size.
Government Data
Trade Associations
Customer Survey
2.1.3.2 Market Growth Rate
A Simple means of Forecasting the market growth rate is to extrapolate
historical data into the future. While this method may provide a first order
estimate, it does not predict important turning points. A better method is to
study growth drives such as Demographic Information and sales Growth in
complementary Products. Such drivers serve as leading indicators that are the
most accurate than simply extrapolating historical Data.
2.1.3.3 Market Profitability

31
While different firms in a market will have different levels of Profitability, the
average profit potential for a market can be used as a guideline for knowing
how difficult it is to make money in the market Michael porter devised a useful
framework for evaluating the attractiveness of an industry or market. This
framework known as porter’s five forces identifies five factors that influence
the market profitability.
Buyer Power
Supplier Power
Barriers to entry
Threat of Substitute Products
Rivalry among Firms in the industry
2.1.3.4 Market Trends
Changes in the market are important because they often are the source of new
opportunities and threats. The relevant trends are industry- dependent, but some
examples include changes in price sensivity demand for Variety, and level of
emphasis on service and support, regional trend also may be relevant.
2.1.3.5 Key Success Factors
The key success factors are those elements that are necessary in order for the
firm to achieve its marketing objectives. A few examples of such factor
include:
Access to unique resources
Ability to achieve economies of Scale
Access to distribution Channel
Technological Progress

32
It is important to consider that key success factors may change over time,
especially as the product progresses through its life cycle.
2.2 Review of Previous Related Studies
This part is a descriptive presentation of the literature work done by various
authors and previous researchers. The main objective of this part is to analyze
the previous research study. The purpose of literature review is thus, for find
out what research studies have been conducted in one’s chosen field of study.
And what remains to be done. It provides the foundation of developing a
comprehensive theoretical framework from which hypothesis can be developed
for testing. The literature survey also minimizes the risk of pursuing the dead
ends in research.
So far as known to the researcher, studies on Market analysis of
telecommunications in Nepal based on customer opinion are very few.
Numerous studies have been made in the area of effectiveness of sales planning
in Nepal Telecom, Human resource planning in Nepal based on Nepal telecom,
profit planning and control in public utilities sector based on Nepal Water
Supply Corporation and Nepal telecom but the detail study on market analysis
of telecommunications has not been conducted till this date. So, some of the
notable literatures relevant to the study are reviewed in this study to identify
the relevance of the present study. Some reviews are as follows:
Tripathi (2007) has conducted a research on the topic “Effectiveness of Sales
Planning in Nepal Telecom (With Special Reference to Nepal Telecom)” was
submitted to central department of Management T.U.
The Main Objective of this research works are as follows:
To analyze the existing sales planning system of Nepal telecom with
seasonal demand.
To study the relationship between sales plan with production Plan.

33
To analyze the relationship between sales and profit.
To analyze BEP of Nepal telecom
To provide suitable suggestion and recommendation on the basis of study
The major findings of Tripathi related with this Study are as follows:
The total actual sales units of NT are in increasing trend. It exceeds
budget In F.Y. 2060/061 and 2062/063. Actual sales revenue is always
higher than target except F.Y. 2061/062
The actual sales units of PSTN telephone service of NT is fluctuated every
Year.
There is high degree of Positive correlation of total sales units, but low
degree of Positive correlation of PSTN sales units.
The cost volume Profit analysis of NT Shows that BEP is Satisfactory.
Internal and external variables Providing opportunity, threats, strengths
and weakness are not identified clearly.
Adhikari (2009) has conducted a research on the topic “The effectiveness of
promotional Strategy of Mobile Services in Society with SP (With Special
Reference of Mero Mobile Services) was submitted to central department of
Management T.U.
The Main objectives of This Study are:
To identify response of Target Audience of Mero Mobile
To Identify the Brand awareness of Mero mobile
To identify the promotional tools adopted by Mero Mobile
The Major Findings of Mrs. Adhikari are stated in Brief:
Numbers of Respondent used Mero Mobile service it has least network
Problem, and it provides lots of Facility like free talk time. MMS ad
Ramaro Tariff. No body has enough time to involve in same problem for
long time. So, Hassle free is also most effective service of Mero Mobile.

34
The Sales Promotion and advertising is the most attractive strategy used
by Mero Mobile service while performing promotional strategy. One hr
talk time, Ramro Tariff is the most successful campaign.
The total no of subscribers which the mero Mobile has achieved till date
stands at 1710000. As per the Table 1575000 No of Subscribers are
achieved from the consumer Promotion and the rest are from other
activities.
2.2.3 International Telecommunication Union (ITU)
It has conducted a small tactical survey “Background Information on the ICT*
Static of Nepal: the state of ICT Collection and Disseminations “Which
conclude like this *NTA is collecting and Disseminating the
telecommunication Indicators those defined By *ITU which are comparable
across countries Although this is being done at a regular interval, difficulty in
obtaining data on time has been a major concern in our effort to make those
indicators available to the stake holders without delay. NTA reports the data
available from the operators but doesn’t validate the authenticity of such data.
However after several years’ effort NTA has been able to bring out the report
that solely reflects the ICT static, which carries much significance for the
development of ICT in the country. NTA also feels that there is a need for a
regular study/ Research on the impact of the ICT in socio economic as well as
overall national development of the Country. NTA Needs Technical Assistance
to Build this Capacity. It is Believed that Periodic Reporting of *ICT Related
Data is a Significance contribution for Bringing out a reliable Static for the
General Public (*Source International Telecommunication union
(Telecommunication Development Bureau, Document INF/010-E24 February
2009).
2.2.4 Telecom Network of the Country

35
According to quarterly performance of Nepal telecom conducted on April 2008
With the introduction of new Telecom Operators, the same tempo of growth
Continues with the number of distributed lines increasing from approximately
65,000 in 1992 to over 8, 05,061 (PSTN + WLL), Post-paid Mobile
Subscribers 1, 13,742 and Pre-paid Mobile Subscribers 28, 82,555 till 12April,
2008 (30 Chaitra, 2064). The fully digital network offers full national. Nepal
Doorsanchar Company Limited, the only wire line operator in Nepal has 233
Telephone exchanges in operation at 224 different locations in 72 districts of
Nepal. There are a total of 4575 International telephone circuits in operation
including Microwave circuits (Based on NDCL MIS).
2.3 Research Gap
I have found so many previous research reports on marketing field with related
subject Matter. But the choice of this subject is due to the fact, there is no
previous research found on Market Analysis of Telecommunications of Nepal
Based on customer survey. The study tried to find out the probability of market
for the emerging telecommunication industry in Nepalese Market by doing
Customer Survey. The study tries to find out the status of landline and mobile
users, habit of Monthly expenditure on mobile services, satisfaction level of
customers regarding network, tariffs, and services. By analyzing these elements
of existing telecommunications of Nepal the study tries to find out the potential
market for rising telecommunication. In This study the existing market trend,
Growing status, factors influencing customers for using telecommunication
services are studied and analyzed. Research has attempted to prepare and
present this report with full enthusiasm and all possible primary as well as
secondary data. Sources are collected analyzed and presented here in respective
Manner.

36

37
CHAPTER - III
RESERCH METHODOLOGY
The Main Objective of This chapter is to present the details of research design
followed during the case Study. The chapter mainly includes description of
research design, nature and source of Data, populations and Sample and
technique of Analysis Research Design.
3.1 Research Design
The main objective of this study is to analyze and evaluate the market of
telecommunications of Nepal. Especially the telecommunications included in
this study are Nepal Telecom; spice Nepal so called Mero Mobile and United
Telecom of Nepal. The primary objective of this study is to search for the
potential market for emerging telecommunication in Nepal. In order to meet the
primary as well as secondary objectives it adopts the descriptive case Study
research design.
3.2 Nature and Sources of Data
In this study, both primary and secondary data have been used. The primary
data have been collected through the customer survey. The identical locations
have been based on, primarily, intending to cover the 5 administrative regions
of the country.
Secondary data have been collected from annual report of Nepal telecom, spice
Nepal, and UTL, websites of concerned telecommunications, journals, News,
Bulletins, and Published articles and Books.
3.3 Population and Sample
Nepal’s population doubled in the last 30 years from around 12 million in 1971
to 23 million in 2001 The population grew at a rapid rate between 1971 and

38
1981 from 2.1 percent to 2.6 percent, but the population growth rate has slowed
since 1981 to just over 2 percent (Central Bureau of Statistics, 2003). The
population density has doubled over the three decades from 79 persons per
square kilometer in 1971 to 157 persons per square kilometer in 2001. Life
expectancy in Nepal is improving, increasing by about 20 years for males and
females between 1971 and 2001. Female life expectancy is slightly higher than
male life expectancy (60.7 years versus 60.1years). The Total * population of
Nepal according to Development regions is as follows
Table 3.1
Total Population of Nepal According to Development Regions
Area TotalHousehold
PopulationTotal Male Female
Nepal 4174374 22736934 11359378 11377556Eastern Development Region 1000358 5286890 2642320 2644570
Central Development Region 1465753 7988612 4088292 3900320
Western Development Region 863045 4571013 2198170 2372843
Mid Western Development Region 479817 2707244 1349073 1358171
Far Western Development Region 365401 2183175 1081523 1101652*The base of population is taken From CBS data 2003
Incremental Population is Not Considered in this Calculation

39
Figure 3.1
Population Distributed By Development Region
Among total Population the sample have been taken form different cities
covering 5 administrative regions of the country. For this study 44 identical
cities of 5 administrative regions have been selected which fulfills target
sample size of 2000 people. The selected Market for Sample is listed below.
Table 3.2Sample Market with Development Regions
S.N Sample Market Development Regions1 Birtamode
Eas
tern
Dev
elop
men
t Reg
ion2 Illam
3 Dharan4 Dhankuta5 Biratnagar6 Jhapa7 Rajbiraj8 Lahan9 Gaighat10 Malangwa11 Lalbandi12 Gaur13 Arghakhachhi
Wes
tern
Dev
elop
men
t Reg
ion
14 Gulmi15 Butwal16 Tansen
0
2000000
4000000
6000000
8000000
10000000
12000000
39
Figure 3.1
Population Distributed By Development Region
Among total Population the sample have been taken form different cities
covering 5 administrative regions of the country. For this study 44 identical
cities of 5 administrative regions have been selected which fulfills target
sample size of 2000 people. The selected Market for Sample is listed below.
Table 3.2Sample Market with Development Regions
S.N Sample Market Development Regions1 Birtamode
Eas
tern
Dev
elop
men
t Reg
ion2 Illam
3 Dharan4 Dhankuta5 Biratnagar6 Jhapa7 Rajbiraj8 Lahan9 Gaighat10 Malangwa11 Lalbandi12 Gaur13 Arghakhachhi
Wes
tern
Dev
elop
men
t Reg
ion
14 Gulmi15 Butwal16 Tansen
Male
Female

40
17 Pokhara18 Baglung19 Damauli20 Lamjung21 Gorusinga22 Kohalpur
Mid
Wes
tern
Dev
elop
men
t Reg
ion
23 Surkhet24 Ghorai25 Rolpa26 Salyan27 Pyuthan28 Gorusinga29 Doti
Far
wes
tern
Dev
elop
men
t Reg
ion
30 Dhangadi31 Mahendranagar32 Julma33 Kailali34 Kanchanpur35 Dadeldhura36 Kathmandu
Cen
tral
Dev
elop
men
t Reg
ion37 Lalitpur
38 Bhaktapur39 Banepa40 Charikot41 Janakpur42 Sindhuli43 Birgunj44 Hetauda45 Narayanghat46 Kawasoti
The Stratified random sampling technique has been adopted to collect
information. First of all the total population has been divided into 5
administrative regions and from 5 administrative regions the major densely
populated cities are selected for sample. 30% from Eastern, 22.5% from
western, 20% from far western and mid western and 27.5% from central
development region of the sample is taken for the study. For the study the
samples are further sub divided into Gender wise, age wise location wise, user
and Non user, since Kathmandu valley is the most densely populated cit the
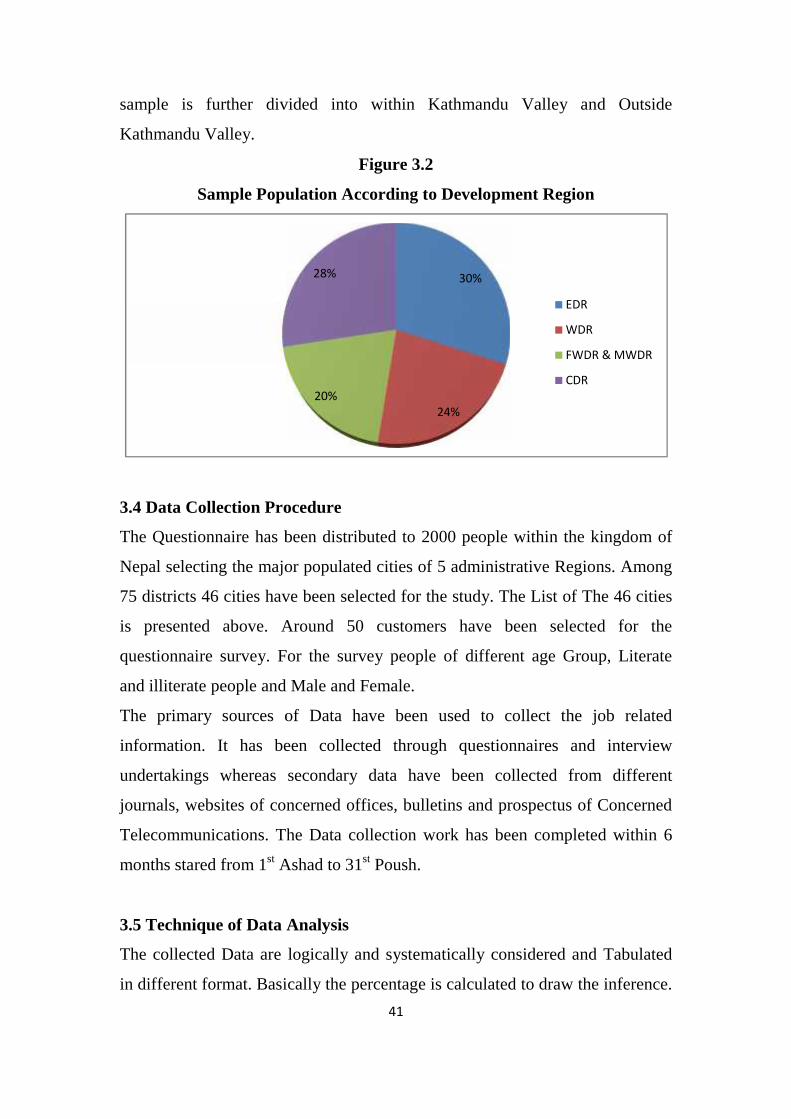
41
sample is further divided into within Kathmandu Valley and Outside
Kathmandu Valley.
Figure 3.2
Sample Population According to Development Region
3.4 Data Collection Procedure
The Questionnaire has been distributed to 2000 people within the kingdom of
Nepal selecting the major populated cities of 5 administrative Regions. Among
75 districts 46 cities have been selected for the study. The List of The 46 cities
is presented above. Around 50 customers have been selected for the
questionnaire survey. For the survey people of different age Group, Literate
and illiterate people and Male and Female.
The primary sources of Data have been used to collect the job related
information. It has been collected through questionnaires and interview
undertakings whereas secondary data have been collected from different
journals, websites of concerned offices, bulletins and prospectus of Concerned
Telecommunications. The Data collection work has been completed within 6
months stared from 1st Ashad to 31st Poush.
3.5 Technique of Data Analysis
The collected Data are logically and systematically considered and Tabulated
in different format. Basically the percentage is calculated to draw the inference.
30%
24%20%
28%
EDR
WDR
FWDR & MWDR
CDR
41
sample is further divided into within Kathmandu Valley and Outside
Kathmandu Valley.
Figure 3.2
Sample Population According to Development Region
3.4 Data Collection Procedure
The Questionnaire has been distributed to 2000 people within the kingdom of
Nepal selecting the major populated cities of 5 administrative Regions. Among
75 districts 46 cities have been selected for the study. The List of The 46 cities
is presented above. Around 50 customers have been selected for the
questionnaire survey. For the survey people of different age Group, Literate
and illiterate people and Male and Female.
The primary sources of Data have been used to collect the job related
information. It has been collected through questionnaires and interview
undertakings whereas secondary data have been collected from different
journals, websites of concerned offices, bulletins and prospectus of Concerned
Telecommunications. The Data collection work has been completed within 6
months stared from 1st Ashad to 31st Poush.
3.5 Technique of Data Analysis
The collected Data are logically and systematically considered and Tabulated
in different format. Basically the percentage is calculated to draw the inference.
EDR
WDR
FWDR & MWDR
CDR

42
The key information is received during the period of Working in An
advertising agency, Called ANS creation. The information are carefully
considered and analyzed during the interpretation of Facts and Figures

43
CHAPTER - IV
PRESENTATION AND ANALYSIS OF DATA
The chapter present and interprets the various data gathered from the
application of different methods and Presented and decorated as required by the
research objective. In this chapter, data are interpreted and analyzed with the
means of collected questionnaires and interviews.
In this chapter the collected data are tabulated and interpreted. In this Study the
findings of the customer survey is tabulated by using personally developed
Software Named SPSS. From this soft ware it is easy to tabulate and analyze
the Findings. First of all the Findings are Tabulated and Presented in Table and
Later on the findings is Shown on Graphical Representation, For The Market
Analysis, customer survey is performed preparing the Questionnaire . To meet
the primary objective of This Study the survey questionnaire tries to find out
the status of Landline and Mobile users, then its demographic and
Socioeconomic Status in Survey Areas. The study also tries to find out the user
of UTL, Postpaid and Prepaid of Mero mobile and NTC and its reason. People
expenditure habit on Mobile phones is also presented in this study. The
Satisfaction level and Dissatisfaction level of People on telecommunication
services are also presented in this study with the suggestions of services to be
included in Mobile Phones. The Detail of this study is Presented Below:
4.1 Status of Landline and Mobile users

44
4.1.1 Distribution of Landline and Mobile Users According to
Development Region
Table 4.1
Distribution of Landline and Mobile Users According to Development
Region
No ofHouseholds
No ofPopulations
% of Landline and Mobile Usersin Survey Areas
Landline (HH) Mobile (Pax)Overall 4174374 22736934 15.2 14.5Kathmandu Valley 345562 1645091 85.2 66.1OutsideKathmandu Valley
3828812 21091843 8.7 10.4
Development RegionsEastern 1000358 5286890 13.4 7.1
Central 1465753 7988612 25.7 21.2Western 863045 4571013 12.2 14.8Mid Western 479817 2707244 11.6 8.8Far Western 365401 2183175 8.6 7.3
Figure 4.1
Population Distribution By Development Regions
Up to last fiscal year (Ashadh 2065/66) the subscriber of NTC (except landline)
was around 3 million, Mero Mobile 2.26 million and UTL 0.4 million. NTSC’s
landline subscription was 0.63 million.
0
5
10
15
20
25
30
Eastern Central
44
4.1.1 Distribution of Landline and Mobile Users According to
Development Region
Table 4.1
Distribution of Landline and Mobile Users According to Development
Region
No ofHouseholds
No ofPopulations
% of Landline and Mobile Usersin Survey Areas
Landline (HH) Mobile (Pax)Overall 4174374 22736934 15.2 14.5Kathmandu Valley 345562 1645091 85.2 66.1OutsideKathmandu Valley
3828812 21091843 8.7 10.4
Development RegionsEastern 1000358 5286890 13.4 7.1
Central 1465753 7988612 25.7 21.2Western 863045 4571013 12.2 14.8Mid Western 479817 2707244 11.6 8.8Far Western 365401 2183175 8.6 7.3
Figure 4.1
Population Distribution By Development Regions
Up to last fiscal year (Ashadh 2065/66) the subscriber of NTC (except landline)
was around 3 million, Mero Mobile 2.26 million and UTL 0.4 million. NTSC’s
landline subscription was 0.63 million.
Central Western MidWestern
FarWestern
Landline (HH)
Mobile (Pax)
44
4.1.1 Distribution of Landline and Mobile Users According to
Development Region
Table 4.1
Distribution of Landline and Mobile Users According to Development
Region
No ofHouseholds
No ofPopulations
% of Landline and Mobile Usersin Survey Areas
Landline (HH) Mobile (Pax)Overall 4174374 22736934 15.2 14.5Kathmandu Valley 345562 1645091 85.2 66.1OutsideKathmandu Valley
3828812 21091843 8.7 10.4
Development RegionsEastern 1000358 5286890 13.4 7.1
Central 1465753 7988612 25.7 21.2Western 863045 4571013 12.2 14.8Mid Western 479817 2707244 11.6 8.8Far Western 365401 2183175 8.6 7.3
Figure 4.1
Population Distribution By Development Regions
Up to last fiscal year (Ashadh 2065/66) the subscriber of NTC (except landline)
was around 3 million, Mero Mobile 2.26 million and UTL 0.4 million. NTSC’s
landline subscription was 0.63 million.
Landline (HH)
Mobile (Pax)

45
Table 4.1 depicts that in Nepal overall there is only 14.5% subscription of
mobile phone services. Major gap area can be seen in the Far Western, Mid
Western and Eastern region with mobile service subscription of 7.3%, 8.8%
and 7.1% respectively. Present analysis shows that there is high potentiality of
new mobile phone services in these regions where the concentration of
population is higher (The Base of Population is taken from CBS data 2003,
Incremental Population is not considered in this calculation).
Figure 4.1 represented by the landline indicates that there is slow development
in PSTN service whereas mobile services have shown considerable
development in the small period of time. Reason behind this is the hassles and
investment during installation of PSTN landline service which is not there in
the case of mobile phone. In overall Nepal there is only 15.2% (household
base) subscription of landline service. Highest (85.2%) subscription of landline
is in Kathmandu Valley which is because there was no other substitute in the
initial stage which led to higher subscription. Apart from that corporate
customers and offices have multiple subscriptions.

46
4.1.2 Distribution of Landline and Mobile Users by Demographic and
Socioeconomic Status in Survey Areas
Table 4.2
Distribution of Landline and Mobile Users by Demographic and
Socioeconomic Status in Survey Areas
% of Landline and mobile users in survey areasLandline Mobile
GenderMale 45.9 78.0Female 33.1 64.0
Age Group
15-19 32.1 86.720-24 46.4 66.125-29 58.0 75.930-59 66.0 72.960+ 89.3 11.7
EducationalLevel
Illiterate 47.3 23.3Read/write 67.7 26.7Under SLC 82.8 36.411-12/Certificate 20.8 81.4Bachelor 74.9 76.2Masters and above 76.9 65.5
Occ
upat
ion
of R
espo
nden
t Agriculture 49.4 26.5Business 89.4 79.8Industry 69.0 52.0Government service 93.3 69.5Government teacher 94.1 28.5Private service 89.3 85.7Private teacher 68.9 73.0Housewife 80.3 36.0Student 58.0 77.4Others 79.5 72.8
Mon
thly
Inco
me
ofR
espo
nden
t less than 5000 20.8 62.75000-9999 78.6 80.110000-14999 66.5 92.115000-19999 98.2 96.620000 and above 96.6 94.3
Table 4.2 depicts the general usage pattern of landline and mobile phones. It
can be find out that in general male use more mobile phone than that of female.
Further in the age group, higher the age, higher the use of landline. Mix of both
can be seen in 25-29 and 30-59 years age which uses both landline and mobile.

47
This age group has more spending capacity. Age group of 15-19 uses mobile
phone to show off. Generally this age group use mobile for SMS and miss call.
Illiterate and people with ability of only reading and writing use more landline
than mobile. However, penetration of communication is less in this group.
Although under SLC use more landline, the trend of using mobile is increasing
in this education group. Maximum use of mobile is being done by 11/12 and
certificate level students. However, this group is not revenue generator. They
generally use mobile for SMS and miss call. Bachelor and Masters Level use
mix of both. Generally they are also earning group and have capacity to spend
in occupational group division, agriculturists use landline more than mobile
phones and in general, they are not using means of communication frequently.
Highest mix of both landline and mobile phones can be seen in business and
private sector. In the similar manner Government job holders and housewives
use landline more than mobile service. Higher the income, higher the use of
both Landline and Mobile. Highest of mix can be seen in the income group
15000 and above.

48
4.1.3 Table of Cellular Mobile Phone and Fixed Telephone Service
Table 4.3
Cellular Mobile Phone and Fixed Telephone Service
Cellular MobileService Providers
Fixed TelephoneService Providers
NDCL SPNL NDCL UTL
Number of Subscribers(Postpaid) 106546 7196 694260 110801Number of Subscribers(Prepaid)including CDMA and WCDMA Mobile
1645169 1237386
Services areas in terms of Districts (Noof Districts):
43 39 72 9
Average Revenue Per user in Rs 975 378.07 910 515.38*Source: Quarterly Performance Indicator of Telecom Service
According to quarterly performance indicator of Telecom services/ sector (15
January2008-12 April 2008) there coverage of NDCL is on 72 districts on
which Mobile service providers are on 43 districts and fixed line telephone
services is on 75 districts. Similarly the quarterly performance indicator has not
shown the no of Subscribers according to region, gender, and literacy rate etc,
but it indicates the population (Subscriber) according to Type that is Post paid
and Prepaid and it also indicate the subscriber according to Mobile Phone users
and Fixed Line users. The above table clearly indicates that the fixed line
service Provider industry is NDCL and UTL but the Cellular Mobile Service
Provider is NDCL and SPNL. The above Data Shows that the Subscribers have
used More Fixed line Services than Cellular Mobile Services. But the data also
that the user or subscriber of cellular phone is increasing day by day.

49
4.2 Distribution of GSM Prepaid and Postpaid and CDMA Users
Table 4.4Distribution of GSM Prepaid and Postpaid and CDMA Users
Prepaid Type Postpaid Type CDMA TypeNepal 64.1 4.2 4.3
Ktm
vs
othe
rs
Kathmandu valley 65.1 9.4 2.5Outside Kathmanduvalley 63.9 3.6 4.7
Dev
elop
men
tR
egio
n
Eastern 64.9 4.4 2.6Central 54.7 7.8 3.5Western 71.0 3.4 3.4Mid Western 61.8 3.3 5.9Far Western 72.3 2.9 6.9
Gen der Male 67.6 5.2 4.7
Female 56.3 1.8 3.4
Age
Gro
up
15-19 59.6 0.8 4.120-24 68.2 2.2 3.025-29 67.5 4.1 3.930-59 59.4 6.8 5.960+ 41.4 10.3 3.4
Edu
catio
nal
Lev
el
Illiterate 23.9 0.2 4.3Read/write 40.2 0.7 3.5Under SLC 59.4 1.8 4.611-12/Certificate 71.2 5.2 4.1Bachelor 78.0 6.6 4.7Masters and above 79.5 12.1 6.1
Occ
upat
ion
of R
espo
nden
t Agriculture 34.0 0.3 2.9Business 67.9 5.4 6.1Industry 43.3 6.2 3.1Gov-service 74.5 8.8 5.0Gov-teacher 78.8 7.7 5.8Private service 73.4 6.0 4.1Private teacher 63.5 1.6 4.8Housewife 49.0 1.7 3.4Student 68.0 2.3 3.2Others 69.1 1.2 2.5
Mon
thly
Inco
me
ofR
espo
nden
t less than 5000 54.4 0.7 4.35000-9999 71.3 3.2 4.610000-14999 80.4 10.3 6.615000-19999 76.7 14.2 5.820000 and above 65.0 17.9 4.1
Based on table 4.4, users of GSM prepaid mobile is significantly higher than
the GSM postpaid and CDMA. However, users of GSM postpaid mobile is

50
higher in Kathmandu valley than in other regions. Similarly, users of CDMA
phone are higher in Far Western region than the other regions.
4.3 Distribution of Brand of Mobile Users of NTC, Mero Mobile and UTL(Users Only)
Table 4.5Distribution of Brand of Mobile Users of NTC, Mero Mobile
and UTL (Users Only)NTC Mero Mobile UTL
Overall 52.0 46.5 1.5
Ktm vs. Others Kathmandu Valley 67.6 28.9 3.5Outside Kathmandu 51.5 48.3 0.2
Dev
elop
men
tR
egio
n
Eastern 59.9 40.1 0.0Central 69.1 28.4 2.5Western 47.8 52.2 0.0Mid Western 70.5 29.5 0.0Far Western 76.4 23.6 0.0
Gen der Male 74.2 25.1 0.7
Female 35.8 60.9 3.3
Age
Gro
up
15-19 45.8 52.6 1.620-24 65.2 32.2 2.625-29 67.5 31.8 0.730-59 71.4 27.7 0.960+ 85.7 11.9 2.4
Edu
cati
onal
Lev
el
Illiterate 20.7 55.4 23.9Read/write 28.9 53.4 17.7Under SLC 29.7 51.8 18.511-12/Certificate 43.3 49.8 6.9Bachelor 70.2 27.2 2.6Masters and above 85.9 13.1 1.0
Occ
upat
ion
of R
espo
nden
t Agriculture 35.7 36.5 27.8Business 60.5 27.8 11.7Industry 45.9 38.8 15.3Gov-service 78.4 21.4 0.2Gov-teacher 76.7 21.9 1.4Private service 86.6 13.4 0.0Private teacher 84.3 15.7 0.0Housewife 52.8 38.4 8.8Student 69.7 30.3 0.0Others 59.7 30.9 9.4
Mon
thly
Inco
me
ofR
espo
nden
t less than 5000 65.8 29.4 4.85000-9999 64.2 26.6 9.210000-14999 78.5 20.9 0.615000-19999 92.6 7.4 0.020000 and above 98.7 1.3 0.0
51
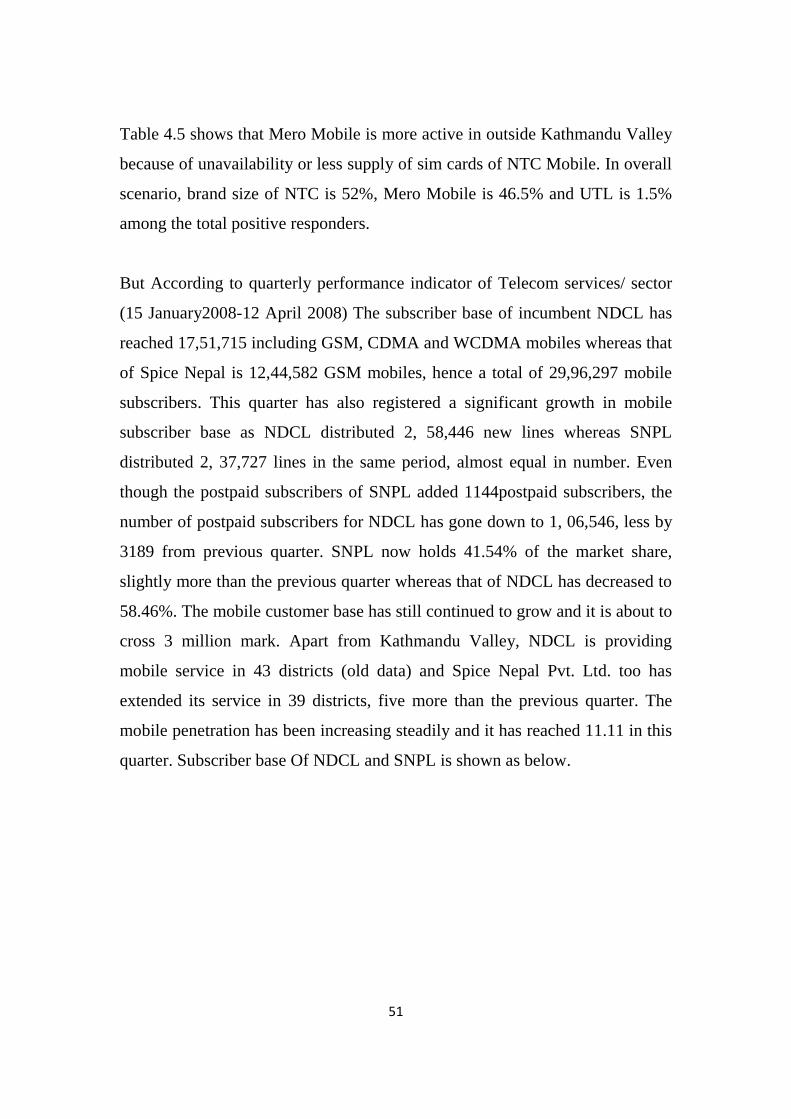
Table 4.5 shows that Mero Mobile is more active in outside Kathmandu Valley
because of unavailability or less supply of sim cards of NTC Mobile. In overall
scenario, brand size of NTC is 52%, Mero Mobile is 46.5% and UTL is 1.5%
among the total positive responders.
But According to quarterly performance indicator of Telecom services/ sector
(15 January2008-12 April 2008) The subscriber base of incumbent NDCL has
reached 17,51,715 including GSM, CDMA and WCDMA mobiles whereas that
of Spice Nepal is 12,44,582 GSM mobiles, hence a total of 29,96,297 mobile
subscribers. This quarter has also registered a significant growth in mobile
subscriber base as NDCL distributed 2, 58,446 new lines whereas SNPL
distributed 2, 37,727 lines in the same period, almost equal in number. Even
though the postpaid subscribers of SNPL added 1144postpaid subscribers, the
number of postpaid subscribers for NDCL has gone down to 1, 06,546, less by
3189 from previous quarter. SNPL now holds 41.54% of the market share,
slightly more than the previous quarter whereas that of NDCL has decreased to
58.46%. The mobile customer base has still continued to grow and it is about to
cross 3 million mark. Apart from Kathmandu Valley, NDCL is providing
mobile service in 43 districts (old data) and Spice Nepal Pvt. Ltd. too has
extended its service in 39 districts, five more than the previous quarter. The
mobile penetration has been increasing steadily and it has reached 11.11 in this
quarter. Subscriber base Of NDCL and SNPL is shown as below.

52
Table 4.6
Subscribers of Cellular Services
Figure 4.2
Raphical Representation of Cellular Services of NDCL and SPNL
4.4 Reasons for Using Mobiles
Table 4.7
0
200000
400000
600000
800000
1000000
1200000
1400000
1600000
1800000
NDCL
NDCL SPNL
Postpaid 106546 7196
Prepaid 1645169 1237386
52
Table 4.6
Subscribers of Cellular Services
Figure 4.2
Raphical Representation of Cellular Services of NDCL and SPNL
4.4 Reasons for Using Mobiles
Table 4.7
NDCL SPNL
NDCL SPNL
Postpaid 106546 7196
Prepaid 1645169 1237386
52
Table 4.6
Subscribers of Cellular Services
Figure 4.2
Raphical Representation of Cellular Services of NDCL and SPNL
4.4 Reasons for Using Mobiles
Table 4.7
Postpaid
Prepaid
NDCL SPNL
Postpaid 106546 7196
Prepaid 1645169 1237386

53
Reasons for Using Mobiles
Rec
omm
enda
tions
of r
elat
ives
and
Frie
nds
To
be in
touc
h w
ith
Fam
ily
Bus
ines
s Pu
rpos
e
Safe
ty P
urpo
se
To
avoi
d st
ress
and
lone
lines
s
Show
Off
Oth
ers
Overall 8.5 59 23.8 8.6 3.2 0.5 1.9
Kat
hman
du
vs o
ther
s
Kathmandu 2.7 62.9 29.5 5 0.5 0.5 1.1OutsideKathmandu 9.5 58.4 22.8 9.2 3.6 0.5 2
Dev
elop
men
tR
egio
n
Eastern 6 60.6 29.9 8.4 0.4 0 1Central 8.6 53.9 26.1 12 4.3 0.7 2.1Western 6.1 60.4 14.6 1.9 1.8 0.3 1.3Mid Western 7.3 64.2 24.3 7.7 7.1 0.2 2.9Far Western 14.3 60 24.5 11.3 2.2 1 2.2
GenderMale 9.6 60.1 30 9.9 3.7 0.7 2.4Female 6 56.5 9.7 5.6 2 0.1 0.8
Age
Gro
up
15-19 14.7 53.8 5.3 6.8 4.7 0.3 1.220-24 10.2 62.2 12.9 8.1 3.7 0.3 225-29 7.9 61.3 31.8 10.4 3.6 0.8 230-59 5.1 56.2 33.4 8.5 1.7 0.4 2.260+ 10.3 34.5 10.3 0 3.4 0 0
Edu
catio
nal L
evel Illiterate 2.2 28.3 10.9 8.7 1.1 1.1 1.1
Read/write 7.2 38.7 17.9 3.7 3 0 0.5Under SLC 10.1 53.5 22.5 7.3 3 0.1 1.9+2/Certificate 9.1 64.2 24.3 10.4 3.7 0.8 2.5Bachelor 8.6 73.2 26.6 10 3.1 0.5 2.3Masters and above 4.5 75.8 40.2 15.2 2.3 2.3 1.5
Occ
upat
ion
ofR
espo
nden
t
Agriculture 6.5 30.1 12.8 1.9 1.9 0.6 0.6Business 7.5 57.1 53.2 9.3 1.6 0.4 0.8Industry 3.1 35.1 36.1 5.2 1 0 1Gov- service 10 75.7 17.2 13.8 4.2 0.4 3.4Gov-teacher 9.6 67.3 30.8 11.5 3.8 3.8 1.9Private service 7.1 67 21.3 10.1 4.1 1.1 3.7Private teacher 4.8 58.7 7.9 6.3 3.2 0 4.8

54
Housewife 3.1 53.2 3.1 6 3.1 0.3 1.1Student 13.8 66.2 1.7 8.8 4.8 0.4 2.4Others 9.9 53.1 25.9 9.9 6.2 0 4.9
Mon
thly
Inco
me
ofR
espo
nden
t less than 5000 11.8 50.6 12.8 9.1 3.1 0.5 25000-9999 7.6 62.4 33.4 10.6 3 0.4 2.310000-14999 5.3 68.8 50.5 10 2.3 1.7 115000-19999 5.9 69.2 59.2 8.3 0.8 0 0.820000 and above 5.7 63.4 68.3 17.1 0.8 0.8 2.4
Figure 4.3Reasons for Using Mobile Phone
The data reveals that, among these different reasons for using mobile phone,
the most important reasons are - to be in contact with the family and for
business purpose. Except in few cases, more than 50% of the respondents in
different categories use mobile phones to be in direct contact with the family. It
is the primary reason for the use of mobile phones. The second important
reason is for business purpose.
4.5 Distribution of Monthly Expenditure on Mobiles
Table 4.8Distribution of Monthly Expenditure on Mobiles
Monthly Expenditure on Mobiles including all typesLess than 500 500-999 1000-1499 1500-1999 2000+
Overall 35.1 33.1 14.3 8.2 9.4Kathmanduvs others
Kathmandu Valley 8.1 23.1 24.2 22.2 22.4Outside Kathmandu 39.7 34.8 12.6 5.8 7.1
D e v e l o p m e n t R e g i o nEastern 33.5 47.9 10.1 6.3 2.2
010203040506070
54
Housewife 3.1 53.2 3.1 6 3.1 0.3 1.1Student 13.8 66.2 1.7 8.8 4.8 0.4 2.4Others 9.9 53.1 25.9 9.9 6.2 0 4.9
Mon
thly
Inco
me
ofR
espo
nden
t less than 5000 11.8 50.6 12.8 9.1 3.1 0.5 25000-9999 7.6 62.4 33.4 10.6 3 0.4 2.310000-14999 5.3 68.8 50.5 10 2.3 1.7 115000-19999 5.9 69.2 59.2 8.3 0.8 0 0.820000 and above 5.7 63.4 68.3 17.1 0.8 0.8 2.4
Figure 4.3Reasons for Using Mobile Phone
The data reveals that, among these different reasons for using mobile phone,
the most important reasons are - to be in contact with the family and for
business purpose. Except in few cases, more than 50% of the respondents in
different categories use mobile phones to be in direct contact with the family. It
is the primary reason for the use of mobile phones. The second important
reason is for business purpose.
4.5 Distribution of Monthly Expenditure on Mobiles
Table 4.8Distribution of Monthly Expenditure on Mobiles
Monthly Expenditure on Mobiles including all typesLess than 500 500-999 1000-1499 1500-1999 2000+
Overall 35.1 33.1 14.3 8.2 9.4Kathmanduvs others
Kathmandu Valley 8.1 23.1 24.2 22.2 22.4Outside Kathmandu 39.7 34.8 12.6 5.8 7.1
D e v e l o p m e n t R e g i o nEastern 33.5 47.9 10.1 6.3 2.254
Housewife 3.1 53.2 3.1 6 3.1 0.3 1.1Student 13.8 66.2 1.7 8.8 4.8 0.4 2.4Others 9.9 53.1 25.9 9.9 6.2 0 4.9
Mon
thly
Inco
me
ofR
espo
nden
t less than 5000 11.8 50.6 12.8 9.1 3.1 0.5 25000-9999 7.6 62.4 33.4 10.6 3 0.4 2.310000-14999 5.3 68.8 50.5 10 2.3 1.7 115000-19999 5.9 69.2 59.2 8.3 0.8 0 0.820000 and above 5.7 63.4 68.3 17.1 0.8 0.8 2.4
Figure 4.3Reasons for Using Mobile Phone
The data reveals that, among these different reasons for using mobile phone,
the most important reasons are - to be in contact with the family and for
business purpose. Except in few cases, more than 50% of the respondents in
different categories use mobile phones to be in direct contact with the family. It
is the primary reason for the use of mobile phones. The second important
reason is for business purpose.
4.5 Distribution of Monthly Expenditure on Mobiles
Table 4.8Distribution of Monthly Expenditure on Mobiles
Monthly Expenditure on Mobiles including all typesLess than 500 500-999 1000-1499 1500-1999 2000+
Overall 35.1 33.1 14.3 8.2 9.4Kathmanduvs others
Kathmandu Valley 8.1 23.1 24.2 22.2 22.4Outside Kathmandu 39.7 34.8 12.6 5.8 7.1
D e v e l o p m e n t R e g i o nEastern 33.5 47.9 10.1 6.3 2.2
Eastern
Central
Western
Mid Western
Far Western

55
Central 35.0 23.9 17.2 11.8 12.1Western 35.1 31.7 17.8 8.2 7.3Mid Western 28.8 36.8 15.1 8.2 11.1Far Western 41.4 31.8 9.4 4.8 12.5
Gen
der Male 32.5 33.7 14.8 9.1 9.9
Female 41.4 30.9 12.9 6.4 8.4
Age
Gro
up
15-19 54.6 26.2 8.8 4.0 6.420-24 41.0 33.7 12.1 5.8 7.425-29 31.4 36.4 14.6 9.8 7.730-59 25.8 32.3 17.4 10.4 14.060+ 31.0 17.2 31.0 10.3 10.3
Edu
catio
nal
Lev
el
Illiterate 65.5 16.7 8.3 6.0 3.6Read/write 52.4 26.2 12.6 4.5 4.3Under SLC 44.5 30.9 11.9 6.0 6.811-12/Certificate 30.4 39.0 14.7 7.2 8.7Bachelor 21.4 34.4 15.6 12.8 15.8Masters and above 6.8 30.8 27.8 18.0 16.5
Occ
upat
ion
of R
espo
nden
t Agriculture 68.0 21.8 6.8 1.4 2.0Business 22.3 33.2 19.4 10.5 14.6Industry 43.0 31.2 6.5 6.5 12.9Government service 24.5 42.8 17.0 7.4 8.3Government teacher 23.1 46.2 11.5 3.8 15.4Private service 28.2 36.3 13.7 13.7 8.0Private teacher 34.4 39.1 12.5 10.9 3.1Housewife 42.9 30.9 12.1 6.8 7.4Student 44.9 31.8 11.0 5.9 6.3Others 47.4 28.9 7.9 11.8 3.9
Mon
thly
Inco
me
ofR
espo
nden
t less than 5000 64.6 24.8 5.1 2.0 3.55000-9999 23.8 49.9 14.4 5.3 6.510000-14999 8.4 29.9 27.5 17.8 16.415000-19999 1.7 18.5 36.1 25.2 18.520000 and above 3.3 12.2 13.8 25.2 45.5
Figure 4.4
Graphical Representation

56
Table 4.8 depicts that respondents in Kathmandu valley the majority of
subscribers (24.2%) spends 1000-1499 per month and 22.4% spends about
more than 2000 per month. Outside Kathmandu valley, 39.7% of the
respondents show their monthly phone expenditure to be less than 500, 34.8%
between 500 to 999, 14.3% between 1000 to 1499, 5.8% between 1500 to 1999
and 7.1% in 2000 plus. In overall, around 33% of the subscribers are spending
500-999 per month.
4.5.1 *Average Revenue per User (ARUP)
Table 4.9
Average Revenue per User (ARUP)
Service ARPU/ Month(in Rs)Fixed Telephone (Wireline+ WLL+ Limited Mobility) 855.69Cellular Service ( Prepaid + Postpaid ) 374.12Internet 2136.12GMPCS 6344.62Rural Telecom Services 12oo.88 (STM Only Per PCO)
*Source Quarterly Performance Indicator of Telecom Services (August 2008)
Though the table 4.9 doesn’t clearly segment the total population into
development regions, Gender, Age Group, Education, Level, occupation of
Respondent, Monthly income of Respondent but it separates the Purchasing
0
5
10
15
20
25
30
35
40
45
50
Less than 500 500-999
56
Table 4.8 depicts that respondents in Kathmandu valley the majority of
subscribers (24.2%) spends 1000-1499 per month and 22.4% spends about
more than 2000 per month. Outside Kathmandu valley, 39.7% of the
respondents show their monthly phone expenditure to be less than 500, 34.8%
between 500 to 999, 14.3% between 1000 to 1499, 5.8% between 1500 to 1999
and 7.1% in 2000 plus. In overall, around 33% of the subscribers are spending
500-999 per month.
4.5.1 *Average Revenue per User (ARUP)
Table 4.9
Average Revenue per User (ARUP)
Service ARPU/ Month(in Rs)Fixed Telephone (Wireline+ WLL+ Limited Mobility) 855.69Cellular Service ( Prepaid + Postpaid ) 374.12Internet 2136.12GMPCS 6344.62Rural Telecom Services 12oo.88 (STM Only Per PCO)
*Source Quarterly Performance Indicator of Telecom Services (August 2008)
Though the table 4.9 doesn’t clearly segment the total population into
development regions, Gender, Age Group, Education, Level, occupation of
Respondent, Monthly income of Respondent but it separates the Purchasing
500-999 1000-1499 1500-1999 2000+
56
Table 4.8 depicts that respondents in Kathmandu valley the majority of
subscribers (24.2%) spends 1000-1499 per month and 22.4% spends about
more than 2000 per month. Outside Kathmandu valley, 39.7% of the
respondents show their monthly phone expenditure to be less than 500, 34.8%
between 500 to 999, 14.3% between 1000 to 1499, 5.8% between 1500 to 1999
and 7.1% in 2000 plus. In overall, around 33% of the subscribers are spending
500-999 per month.
4.5.1 *Average Revenue per User (ARUP)
Table 4.9
Average Revenue per User (ARUP)
Service ARPU/ Month(in Rs)Fixed Telephone (Wireline+ WLL+ Limited Mobility) 855.69Cellular Service ( Prepaid + Postpaid ) 374.12Internet 2136.12GMPCS 6344.62Rural Telecom Services 12oo.88 (STM Only Per PCO)
*Source Quarterly Performance Indicator of Telecom Services (August 2008)
Though the table 4.9 doesn’t clearly segment the total population into
development regions, Gender, Age Group, Education, Level, occupation of
Respondent, Monthly income of Respondent but it separates the Purchasing
Eastern
Central
Western
Mid Western
Far Western

57
Rate or Average Revenue per user of Subscribers. According to the table the
ARPU of Fixed Line is 855.69 and Cellular Service is 374.12 which are almost
equivalent to the average Spending of Subscribers of Consumers Survey which
is 500-999 per Month.
4.5.2 Satisfaction Level of Network Coverage
Table 4.10
Satisfaction Level of Network Coverage
NTC Mobile Mero Mobile UTL Phone NTC CDMA*** ** * *** ** * *** ** * *** ** *
Overall 8.5 36.4 55.1 36.3 44.1 19.7 76.9 23.1 0 32.5 44.4 23.1
Kat
hman
duvs
oth
ers Kathmandu
Valley 3 43.5 53.5 36.2 46.6 17.2 0 100 0 25 75 0Outside
Kathmandu 9.7 34.9 55.4 36.3 43.7 20 90.9 9.1 0 33 42.2 24.8
Dev
elop
men
tR
egio
n
Eastern 6.9 59.3 33.8 40.6 52.3 7 0 0 0 36.4 36.4 27.3Central 22.1 40.8 37.1 50.7 27.8 21.5 76.9 23.1 0 53.1 46.9 0
Western 4.9 43.2 51.9 29.4 50.3 20.2 0 0 0 30.8 69.2 0Mid Western 0.4 10.1 89.6 5.9 41.2 52.9 0 0 0 13.8 55.2 31Far Western 3.5 32.5 64 19.7 49.2 31.1 0 0 0 28.1 25 46.9
GenderMale 8.5 34 57.4 34.4 45.4 20.2 77.8 22.2 0 30.2 40.7 29.1
Female 8.2 43.8 47.9 41.1 41.1 17.8 75 25 0 42.9 50 7.1
Age
Gro
up
15-19 10.8 28.5 60.8 45.1 32.9 22 50 50 0 40 50 1020-24 8.8 39 52.3 33.5 42.7 23.9 75 25 0 33.3 47.6 1925-29 8.9 41 50.1 40.6 46.2 13.3 100 0 0 42.4 33.3 24.230-59 7.9 32.7 59.5 26.9 58.2 14.9 66.7 33.3 0 24.5 46.9 28.660+ 0 28.6 71.4 0 0 100 0 0 0 0 100 0
Edu
cati
onal
Lev
el Illiterate 11.1 27.8 61.1 50 25 25 0 0 0 66.7 33.3 0Read/write 8.3 42.9 48.9 36.7 42.9 20.4 100 0 0 40 60 0Under SLC 8.4 37.1 54.5 37.8 40.9 21.3 100 0 0 35.1 37.8 27
11-12/Certificate 10.7 37.8 51.5 39 40.5 20.5 71.4 28.6 0 24.2 57.6 18.2Bachelor 7.4 36.6 56 30.6 51.6 17.7 0 100 0 33.3 28.6 38.1
Masters andabove 3.7 19.4 76.9 25 75 0 0 0 0 25 37.5 37.5
Occ
upat
ion
ofR
espo
nden
t
Agriculture 3.1 50 46.9 35.7 42.9 21.4 0 0 0 37.5 50 12.5Business 7.7 34.4 57.8 38.6 47.9 13.6 77.8 22.2 0 42.6 29.8 27.7Industry 25.6 41 33.3 12.5 75 12.5 0 0 0 0 50 50
Gov-service 12.3 38.3 49.4 27.3 69.7 3 0 0 0 35.7 50 14.3Gov-teacher 16.2 10.8 73 33.3 50 16.7 0 0 0 50 50 0
Private service 2.3 33.1 64.6 38.5 43.6 17.9 0 0 0 0 70 30Private teacher 5.9 44.1 50 16.7 83.3 0 0 0 0 20 40 40

58
Housewife 4.5 48.5 47 37.2 34.9 27.9 100 0 0 22.2 55.6 22.2Student 9.3 35.6 55.1 38 38 24 66.7 33.3 0 33.3 50 16.7Others 22 41.5 36.6 7.7 38.5 53.8 0 0 0 0 100 0
Mon
thly
Inc
ome
ofR
espo
nden
t
less than 5000 10.5 38.3 51.2 42.7 41.4 15.9 100 0 0 51.5 30.3 18.2
5000-9999 12.9 34.6 52.5 37.5 49.3 13.2 75 25 0 28.1 50 21.9
10000-14999 5.1 41.4 53.5 24.4 64.4 11.1 0 0 0 17.6 52.9 29.4
15000-19999 5.1 35.7 59.2 25 50 25 0 0 0 22.2 44.4 33.320000 and
above 5.1 38.4 56.6 33.3 66.7 0 0 0 0 33.3 50 16.7Note: *** Satisfied **Average * Not Satisfied
Figure 4.5
Satisfaction Level of Network Coverage
Table 4.10 shows that inside Kathmandu valley, 53.5% of the respondents are
not satisfied, 43.5% feel average and only 3% are satisfied with the network
coverage of NTC. Similarly, 17.2% are not satisfied, 46.6% feel average and
36.2% are satisfied with the network coverage of Mero Mobile.
In eastern region, 59.3% of the respondents feel average and 33.8% are not
satisfied by the network coverage of NTC. Similarly, 7% are not happy, 40.6%
are satisfied and 52.3% feel average about the network coverage of Mero
0
20
40
60
80
100
Satis
fied
Aver
age
Not
Sat
isfie
d
NTC Mobie
58
Housewife 4.5 48.5 47 37.2 34.9 27.9 100 0 0 22.2 55.6 22.2Student 9.3 35.6 55.1 38 38 24 66.7 33.3 0 33.3 50 16.7Others 22 41.5 36.6 7.7 38.5 53.8 0 0 0 0 100 0
Mon
thly
Inc
ome
ofR
espo
nden
t
less than 5000 10.5 38.3 51.2 42.7 41.4 15.9 100 0 0 51.5 30.3 18.2
5000-9999 12.9 34.6 52.5 37.5 49.3 13.2 75 25 0 28.1 50 21.9
10000-14999 5.1 41.4 53.5 24.4 64.4 11.1 0 0 0 17.6 52.9 29.4
15000-19999 5.1 35.7 59.2 25 50 25 0 0 0 22.2 44.4 33.320000 and
above 5.1 38.4 56.6 33.3 66.7 0 0 0 0 33.3 50 16.7Note: *** Satisfied **Average * Not Satisfied
Figure 4.5
Satisfaction Level of Network Coverage
Table 4.10 shows that inside Kathmandu valley, 53.5% of the respondents are
not satisfied, 43.5% feel average and only 3% are satisfied with the network
coverage of NTC. Similarly, 17.2% are not satisfied, 46.6% feel average and
36.2% are satisfied with the network coverage of Mero Mobile.
In eastern region, 59.3% of the respondents feel average and 33.8% are not
satisfied by the network coverage of NTC. Similarly, 7% are not happy, 40.6%
are satisfied and 52.3% feel average about the network coverage of Mero
Satis
fied
Aver
age
Not
Sat
isfie
d
Satis
fied
Aver
age
Not
Sat
isfie
d
Satis
fied
Mero Mobile UTL Phone NTC CDMA
58
Housewife 4.5 48.5 47 37.2 34.9 27.9 100 0 0 22.2 55.6 22.2Student 9.3 35.6 55.1 38 38 24 66.7 33.3 0 33.3 50 16.7Others 22 41.5 36.6 7.7 38.5 53.8 0 0 0 0 100 0
Mon
thly
Inc
ome
ofR
espo
nden
t
less than 5000 10.5 38.3 51.2 42.7 41.4 15.9 100 0 0 51.5 30.3 18.2
5000-9999 12.9 34.6 52.5 37.5 49.3 13.2 75 25 0 28.1 50 21.9
10000-14999 5.1 41.4 53.5 24.4 64.4 11.1 0 0 0 17.6 52.9 29.4
15000-19999 5.1 35.7 59.2 25 50 25 0 0 0 22.2 44.4 33.320000 and
above 5.1 38.4 56.6 33.3 66.7 0 0 0 0 33.3 50 16.7Note: *** Satisfied **Average * Not Satisfied
Figure 4.5
Satisfaction Level of Network Coverage
Table 4.10 shows that inside Kathmandu valley, 53.5% of the respondents are
not satisfied, 43.5% feel average and only 3% are satisfied with the network
coverage of NTC. Similarly, 17.2% are not satisfied, 46.6% feel average and
36.2% are satisfied with the network coverage of Mero Mobile.
In eastern region, 59.3% of the respondents feel average and 33.8% are not
satisfied by the network coverage of NTC. Similarly, 7% are not happy, 40.6%
are satisfied and 52.3% feel average about the network coverage of Mero
Aver
age
Not
Sat
isfie
d
NTC CDMA
Eastern
Central
Western
Mid Western
Far Western

59
Mobile. In mid western and far western regions 89.6% and 64% of the
respondents are not satisfied with the network coverage of NTC.
4.5.3 Satisfaction Level of Customer Service
Table 4.11
Satisfaction Level of Customer Service
NTC Phone Mero Mobile UTL Phone NTC CDMA*** ** * *** ** * *** ** * *** ** *
Overall 8.2 50.1 41.7 29.7 55.0 15.3 15.4 61.5 23.1 26.4 45.3 28.3
Ktm
vs
othe
rs
Kathmandu 10.0 55.2 34.9 27.6 63.8 8.6 0.0 50.0 50.0 37.5 50.0 12.5OutsideKathmandu
7.8 48.9 43.3 30.0 53.8 16.3 18.2 63.6 18.2 25.5 44.9 29.6
Dev
elop
men
tR
egio
n
Eastern 16.3 40.1 43.5 25.8 64.5 9.7 0.0 0.0 0.0 10.0 30.0 60.0Central 9.7 64.0 26.3 41.7 51.4 6.9 15.4 61.5 23.1 28.1 40.6 31.3Western 5.6 52.9 41.5 23.6 52.9 23.6 0.0 0.0 0.0 15.4 76.9 7.7Mid Western 6.8 32.7 60.5 35.3 29.4 35.3 0.0 0.0 0.0 40.7 48.1 11.1Far Western 5.8 48.8 45.3 19.1 63.8 17.0 0.0 0.0 0.0 20.8 37.5 41.7
Gender Male 7.8 48.3 43.8 29.0 55.7 15.3 11.1 55.6 33.3 22.4 42.1 35.5Female 9.6 55.1 35.2 32.0 53.1 15.0 25.0 75.0 0.0 40.7 48.1 11.1
Age
Gro
up
15-19 4.5 52.3 43.2 42.1 39.5 18.4 0.0 50.0 50.0 62.5 25.0 12.520-24 8.2 53.4 38.5 23.5 61.7 14.8 0.0 75.0 25.0 36.8 36.8 26.325-29 10.0 52.5 37.5 32.2 54.2 13.6 33.3 33.3 33.3 22.6 41.9 35.530-59 7.9 45.7 46.3 30.8 55.4 13.8 33.3 66.7 0.0 15.9 56.8 27.360+ 0.0 23.1 76.9 0.0 0.0 100 0.0 0.0 0.0 0.0 0.0 100
Edu
cati
onal
Lev
el
Illiterate 12.5 37.5 50.0 0.0 75.0 25.0 0.0 0.0 0.0 0.0 100 0.0Read/write 6.5 58.5 35.0 33.3 58.3 8.3 0.0 100 0.0 40.0 26.7 33.3Under SLC 11.8 50.0 38.2 37.7 47.4 14.9 33.3 33.3 33.3 32.4 52.9 14.711-12/Certificate
7.5 49.9 42.6 26.5 54.7 18.8 14.3 71.4 14.3 30.0 40.0 30.0
Bachelor 5.9 51.5 42.6 28.4 58.7 12.8 0.0 0.0 100 10.5 42.1 47.4Masters andabove
9.7 36.9 53.4 12.5 75.0 12.5 0.0 0.0 0.0 0.0 66.7 33.3
Occ
upat
ion
of R
espo
nden
t Agriculture 10.3 55.2 34.5 35.7 64.3 0.0 0.0 0.0 0.0 50.0 37.5 12.5Business 8.3 46.7 45.0 30.6 55.4 14.0 11.1 77.8 11.1 23.3 44.2 32.6Industry 21.9 59.4 18.8 37.5 50.0 12.5 0.0 0.0 0.0 50.0 0.0 50.0Gov-service 11.1 53.5 35.4 37.5 59.4 3.1 0.0 0.0 0.0 7.1 57.1 35.7Gov- teacher 6.1 54.5 39.4 33.3 33.3 33.3 0.0 0.0 0.0 0.0 50.0 50.0Private service 7.2 47.4 45.4 40.5 51.4 8.1 0.0 0.0 0.0 0.0 62.5 37.5Private teacher 16.1 38.7 45.2 16.7 66.7 16.7 0.0 0.0 0.0 25.0 50.0 25.0Housewife 11.0 50.0 39.0 26.3 50.0 23.7 100.0 0.0 0.0 25.0 62.5 12.5Student 4.4 52.2 43.3 27.6 53.0 19.3 0.0 33.3 66.7 60.0 20.0 20.0Others 2.7 64.9 32.4 7.7 84.6 7.7 0.0 0.0 0.0 0.0 100 0.0
Mo
nthl y
Inco me
of Res
pon
dentless than 5000 7.5 49.1 43.3 35.6 55.5 8.9 0.0 100 0.0 48.3 24.1 27.6
5000-9999 10.3 53.1 36.6 30.5 60.2 9.3 12.5 75.0 12.5 10.7 60.7 28.6

60
10000-14999 8.9 52.6 38.4 18.4 65.8 15.8 0.0 0.0 0.0 6.3 43.8 50.015000-19999 9.6 50.0 40.4 27.3 54.5 18.2 0.0 0.0 0.0 11.1 66.7 22.220000 andabove
2.2 46.1 51.7 28.6 57.1 14.3 0.0 0.0 0.0 16.7 66.7 16.7
Note: *** Satisfied ** Average * Not Satisfied
Figure 4.6
Satisfaction Level of Customer Service
Table 4.11 shows that inside Kathmandu valley, 55.2% and 63.8% of the
respondent feel that customer services provided by NTC and Mero mobile
respectively is average. Similarly, in outside Kathmandu Valley area, 48.9%
and 53.8% of the respondents feel that customer services provided by NTC and
Mero mobile respectively is average.
In eastern region, 43.5% and in mid western region 60.5% of the respondents
are not satisfied by the customer service of NTC. Similarly, in central, western
and far western regions, 64%, 52.9% and 48.8% respectively feel that customer
service provided by NTC is average.
0
20
40
60
80
Satis
fied
Aver
age
Not
Sat
isfie
d
Satis
fied
NTC Phone Mero Mobile
60
10000-14999 8.9 52.6 38.4 18.4 65.8 15.8 0.0 0.0 0.0 6.3 43.8 50.015000-19999 9.6 50.0 40.4 27.3 54.5 18.2 0.0 0.0 0.0 11.1 66.7 22.220000 andabove
2.2 46.1 51.7 28.6 57.1 14.3 0.0 0.0 0.0 16.7 66.7 16.7
Note: *** Satisfied ** Average * Not Satisfied
Figure 4.6
Satisfaction Level of Customer Service
Table 4.11 shows that inside Kathmandu valley, 55.2% and 63.8% of the
respondent feel that customer services provided by NTC and Mero mobile
respectively is average. Similarly, in outside Kathmandu Valley area, 48.9%
and 53.8% of the respondents feel that customer services provided by NTC and
Mero mobile respectively is average.
In eastern region, 43.5% and in mid western region 60.5% of the respondents
are not satisfied by the customer service of NTC. Similarly, in central, western
and far western regions, 64%, 52.9% and 48.8% respectively feel that customer
service provided by NTC is average.
Satis
fied
Aver
age
Not
Sat
isfie
d
Satis
fied
Aver
age
Not
Sat
isfie
d
Satis
fied
Aver
age
Not
Sat
isfie
dMero Mobile UTL Phone NTC CDMA
60
10000-14999 8.9 52.6 38.4 18.4 65.8 15.8 0.0 0.0 0.0 6.3 43.8 50.015000-19999 9.6 50.0 40.4 27.3 54.5 18.2 0.0 0.0 0.0 11.1 66.7 22.220000 andabove
2.2 46.1 51.7 28.6 57.1 14.3 0.0 0.0 0.0 16.7 66.7 16.7
Note: *** Satisfied ** Average * Not Satisfied
Figure 4.6
Satisfaction Level of Customer Service
Table 4.11 shows that inside Kathmandu valley, 55.2% and 63.8% of the
respondent feel that customer services provided by NTC and Mero mobile
respectively is average. Similarly, in outside Kathmandu Valley area, 48.9%
and 53.8% of the respondents feel that customer services provided by NTC and
Mero mobile respectively is average.
In eastern region, 43.5% and in mid western region 60.5% of the respondents
are not satisfied by the customer service of NTC. Similarly, in central, western
and far western regions, 64%, 52.9% and 48.8% respectively feel that customer
service provided by NTC is average.
Eastern
Central
Western
Mid Western
Far Western
61
In overall scenario, 50.1% and 55% of the respondents feel that customer
service being provided by the NTC and Mero mobile respectively is average.

62
4.5.4 Satisfaction Level of Call Rate of Mobile Service
Table 4.12Satisfaction Level of Call Rate of Mobile Service
NTC Phone Mero Mobile UTL Phone NTC CDMA*** ** * *** ** * *** ** * *** ** *
Overall 11.7 40.0 48.3 8.4 31.4 60.2 46.2 46.2 7.7 25.9 46.4 27.7
Ktm
vs
othe
rs
Ktm Valley 5.0 32.2 62.8 1.7 8.6 89.7 50.0 0.0 50.0 0.0 62.5 37.5OutsideKtm 13.1 41.7 45.2 9.4 34.7 55.9 45.5 54.5 0.0 27.9 45.2 26.9
Dev
elop
men
tR
egio
n
Eastern 11.9 22.2 65.9 16.0 9.9 74.1 0.0 0.0 0.0 33.3 44.4 22.2Central 13.5 42.1 44.4 6.3 36.1 57.6 46.2 46.2 7.7 15.6 68.8 15.6Western 9.2 53.1 37.6 8.8 42.5 48.8 0.0 0.0 0.0 23.1 53.8 23.1Mid Western 20.1 44.0 35.8 0.0 11.8 88.2 0.0 0.0 0.0 41.4 48.3 10.3Far Western 5.3 29.9 64.8 5.0 25.0 70.0 0.0 0.0 0.0 20.7 17.2 62.1
Gen der Male 12.6 38.7 48.7 7.4 30.6 61.9 55.6 44.4 0.0 24.4 45.1 30.5
Female 8.9 44.2 46.9 10.1 33.8 56.1 25.0 50.0 25.0 33.3 44.4 22.2
Age
Gro
up
15-19 13.9 29.5 56.6 10.4 19.5 70.1 0.0 50.0 50.0 37.5 25.0 37.520-24 10.1 43.8 46.0 7.9 33.0 59.1 75.0 25.0 0.0 36.8 47.4 15.825-29 12.7 43.9 43.4 10.3 40.5 49.1 33.3 66.7 0.0 18.8 53.1 28.130-59 11.6 37.1 51.3 4.8 25.4 69.8 66.7 33.3 0.0 20.4 49.0 30.660+ 8.3 25.0 66.7 0.0 0.0 100.0 0.0 0.0 0.0 100.0 0.0 0.0
Edu
cati
onal
Lev
el Illiterate 11.1 22.2 66.7 0.0 75.0 25.0 0.0 0.0 0.0 0.0 33.3 66.7Read/write 12.9 53.2 33.9 8.3 47.9 43.8 100 0.0 0.0 33.3 60.0 6.7Under SLC 11.8 43.2 45.0 12.3 32.8 54.9 33.3 66.7 0.0 27.8 47.2 25.011-12/Certificate 13.1 37.6 49.2 7.8 31.9 60.2 28.6 57.1 14.3 38.7 38.7 22.6Bachelor 9.9 37.5 52.6 5.4 22.5 72.1 100 0.0 0.0 10.5 52.6 36.8Masters andabove 9.6 35.6 54.8 0.0 0.0 100.0 0.0 0.0 0.0 0.0 37.5 62.5
Occ
upat
ion
of R
espo
nden
t Agriculture 3.3 53.3 43.3 7.7 53.8 38.5 0.0 0.0 0.0 12.5 87.5 0.0Business 12.8 41.2 46.0 10.7 35.5 53.7 55.6 33.3 11.1 31.9 44.7 23.4Industry 16.7 47.2 36.1 12.5 37.5 50.0 0.0 0.0 0.0 50.0 0.0 50.0Gov-service 12.7 35.9 51.4 6.9 44.8 48.3 0.0 0.0 0.0 14.3 50.0 35.7Gov-teacher 19.4 38.9 41.7 20.0 20.0 60.0 0.0 0.0 0.0 0.0 100.0 0.0Private service 11.7 40.4 48.0 13.2 28.9 57.9 0.0 0.0 0.0 20.0 20.0 60.0Private teacher 11.8 32.4 55.9 16.7 16.7 66.7 0.0 0.0 0.0 20.0 40.0 40.0Housewife 7.3 42.7 50.0 7.9 26.3 65.8 0.0 100 0.0 12.5 62.5 25.0Student 11.5 34.4 54.1 6.5 26.3 67.2 33.3 66.7 0.0 42.9 35.7 21.4Others 2.7 56.8 40.5 0.0 40.0 60.0 0.0 0.0 0.0 0.0 0.0 100.0
Mon
thly
Inco
me
ofR
espo
nden
t less than 5000 8.5 42.8 48.7 9.2 40.8 50.0 100 0.0 0.0 37.5 37.5 25.05000-9999 17.8 38.8 43.4 14.0 35.1 50.9 50.0 37.5 12.5 25.0 40.6 34.410000-14999 12.1 42.4 45.5 2.8 36.1 61.1 0.0 0.0 0.0 11.8 64.7 23.515000-19999 10.0 44.4 45.6 8.3 16.7 75.0 0.0 0.0 0.0 25.0 50.0 25.020000 and above 5.2 34.0 60.8 0.0 0.0 100.0 0.0 0.0 0.0 16.7 50.0 33.3
Note: *** Satisfied ** Average * Not Satisfied
Figure 4.7
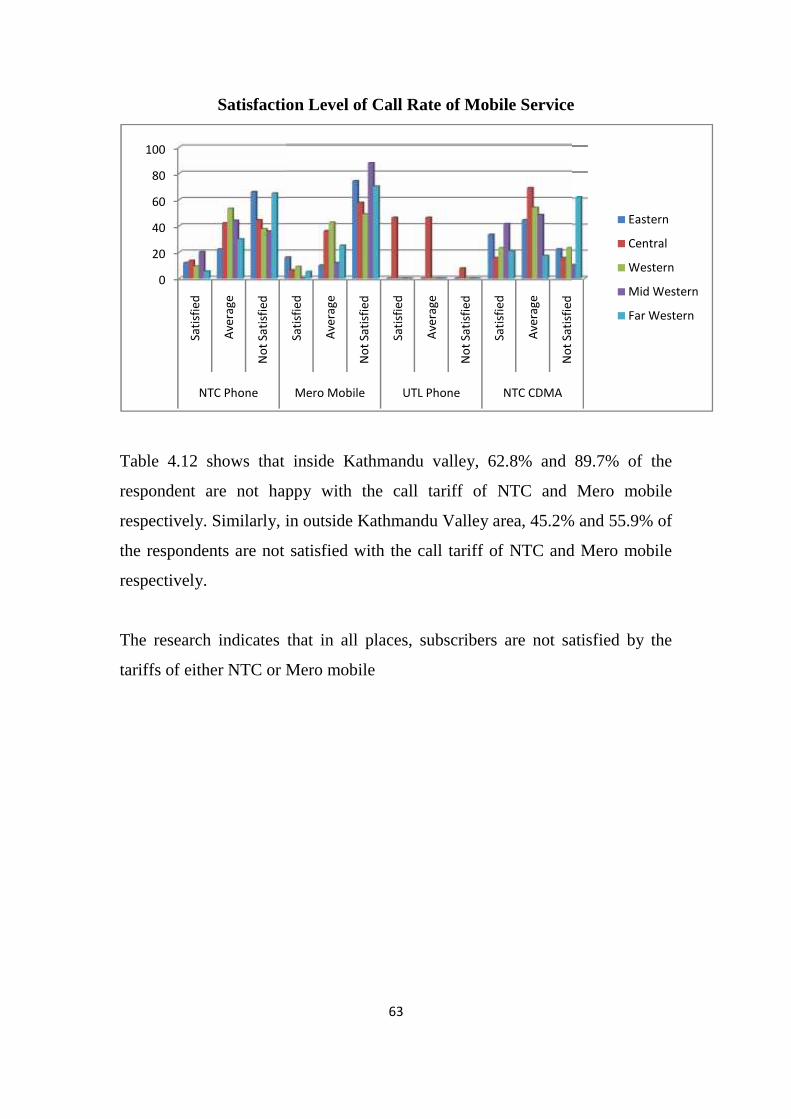
63
Satisfaction Level of Call Rate of Mobile Service
Table 4.12 shows that inside Kathmandu valley, 62.8% and 89.7% of the
respondent are not happy with the call tariff of NTC and Mero mobile
respectively. Similarly, in outside Kathmandu Valley area, 45.2% and 55.9% of
the respondents are not satisfied with the call tariff of NTC and Mero mobile
respectively.
The research indicates that in all places, subscribers are not satisfied by the
tariffs of either NTC or Mero mobile
0
20
40
60
80
100
Satis
fied
Aver
age
Not
Sat
isfie
d
NTC Phone
63
Satisfaction Level of Call Rate of Mobile Service
Table 4.12 shows that inside Kathmandu valley, 62.8% and 89.7% of the
respondent are not happy with the call tariff of NTC and Mero mobile
respectively. Similarly, in outside Kathmandu Valley area, 45.2% and 55.9% of
the respondents are not satisfied with the call tariff of NTC and Mero mobile
respectively.
The research indicates that in all places, subscribers are not satisfied by the
tariffs of either NTC or Mero mobile
Satis
fied
Aver
age
Not
Sat
isfie
d
Satis
fied
Aver
age
Not
Sat
isfie
d
Satis
fied
Aver
age
Not
Sat
isfie
d
Mero Mobile UTL Phone NTC CDMA
63
Satisfaction Level of Call Rate of Mobile Service
Table 4.12 shows that inside Kathmandu valley, 62.8% and 89.7% of the
respondent are not happy with the call tariff of NTC and Mero mobile
respectively. Similarly, in outside Kathmandu Valley area, 45.2% and 55.9% of
the respondents are not satisfied with the call tariff of NTC and Mero mobile
respectively.
The research indicates that in all places, subscribers are not satisfied by the
tariffs of either NTC or Mero mobile
Not
Sat
isfie
d
Eastern
Central
Western
Mid Western
Far Western

64
4.5.5 Satisfaction Level of Value added Service of Different Mobile Service
Table 4.13Satisfaction Level of Value Added Service of Different Mobile Service
NTC Phone Mero Mobile UTL Phone NTC CDMA*** ** * *** ** * *** ** * *** ** *
Overall 38.9 41.7 19.4 51.6 37.1 11.4 11.1 11.1 77.8 27.8 39.2 33.0
Ktm vs
othe
rs
Ktm Valley 23.9 66.5 9.6 24.6 66.7 8.8 0.0 0.0 100.0 0.0 33.3 66.7Outside Ktm 41.9 36.7 21.4 55.1 33.3 11.7 14.3 14.3 71.4 28.7 39.4 31.9
Dev
elop
men
tR
egio
n
Eastern 81.3 16.7 2.0 92.9 6.3 0.8 0.0 0.0 0.0 10.0 20.0 70.0Central 23.3 61.5 15.2 29.4 59.4 11.2 12.5 12.5 75.0 15.8 47.4 36.8Western 18.3 46.0 35.7 40.6 42.6 16.8 0.0 0.0 0.0 8.3 50.0 41.7Mid Western 49.2 38.6 12.1 70.6 17.6 11.8 0.0 0.0 0.0 48.3 44.8 6.9Far Western 41.7 32.8 25.6 41.0 39.3 19.7 0.0 0.0 0.0 29.6 29.6 40.7
Gender Male 39.4 40.3 20.3 50.1 36.4 13.5 16.7 0.0 83.3 31.1 35.1 33.8Female 35.8 47.1 17.2 54.1 38.9 7.0 0.0 33.3 66.7 20.0 55.0 25.0
Age
Gro
up
15-19 37.9 41.1 21.0 55.1 35.9 9.0 0.0 0.0 100 25.0 75.0 0.020-24 36.1 40.5 23.4 49.3 39.4 11.3 33.3 33.3 33.3 11.8 41.2 47.125-29 45.8 38.5 15.7 55.3 34.0 10.6 0.0 0.0 100.0 36.7 30.0 33.330-59 35.2 45.7 19.2 47.8 37.3 14.9 0.0 0.0 0.0 26.2 42.9 31.060+ 28.6 42.9 28.6 0.0 0.0 100.0 0.0 0.0 0.0 100.0 0.0 0.0
Edu
cati
onal
Lev
el
Illiterate 43.8 56.3 0.0 75.0 25.0 0.0 0.0 0.0 0.0 0.0 50.0 50.0Read/write 46.2 35.9 17.9 36.7 55.1 8.2 0.0 0.0 0.0 23.1 53.8 23.1Under SLC 34.5 42.0 23.4 49.2 40.3 10.5 33.3 0.0 66.7 25.9 48.1 25.9
11-12/Certificate
37.1 42.7 20.1 56.0 32.5 11.5 0.0 20.0 80 37.9 34.5 27.6
Bachelor 39.0 42.6 18.4 54.5 32.2 13.2 0.0 0.0 100 26.3 26.3 47.4Masters andabove
51.9 34.9 13.2 25.0 50.0 25.0 0.0 0.0 0.0 14.3 28.6 57.1
Occ
upat
ion
ofR
espo
nden
t Agriculture 31.0 48.3 20.7 42.9 50.0 7.1 0.0 0.0 0.0 37.5 25.0 37.5Business 41.8 36.8 21.5 44.2 39.9 15.9 20.0 0.0 80.0 28.9 39.5 31.6Industry 29.7 51.4 18.9 37.5 62.5 0.0 0.0 0.0 0.0 50.0 50.0 0.0Gvt. service 42.5 42.5 15.0 72.7 27.3 0.0 0.0 0.0 0.0 14.3 28.6 57.1Gvt. teacher 35.1 45.9 18.9 33.3 50.0 16.7 0.0 0.0 0.0 0.0 50.0 50.0Pvt. service 33.9 46.8 19.3 56.4 35.9 7.7 0.0 0.0 0.0 40.0 30.0 30.0Pvt. teacher 32.4 52.9 14.7 50.0 50.0 0.0 0.0 0.0 0.0 50.0 0.0 50.0Housewife 41.0 42.6 16.4 57.1 33.3 9.5 0.0 0.0 100 14.3 71.4 14.3Student 40.4 40.8 18.8 55.0 33.0 12.0 0.0 33.3 66.7 20.0 60.0 20.0Others 24.4 51.2 24.4 15.4 69.2 15.4 0.0 0.0 0.0 0.0 100.0 0.0
Mon
thly
Inco
me
ofR
espo
nden
t
less than 5000 39.7 40.6 19.7 53.3 40.1 6.6 0.0 0.0 100.0 32.1 35.7 32.15000-9999 39.9 41.4 18.7 58.2 32.8 9.0 25.0 0.0 75.0 32.1 39.3 28.610000-14999 38.0 40.8 21.1 47.7 40.9 11.4 0.0 0.0 0.0 28.6 28.6 42.915000-19999 40.2 41.3 18.5 16.7 41.7 41.7 0.0 0.0 0.0 0.0 44.4 55.6
20000 andabove
48.4 42.1 9.5 33.3 66.7 0.0 0.0 0.0 0.0 40.0 0.0 60.0
Note: *** Satisfied ** Average* Not Satisfied
Figure 4.8

65
Satisfaction Level of Value Added Service of Different Mobile Services
Table 4.13 shows that in overall, Mero mobile users are highly satisfied with
the Value added service with 51.6% users and 41.7% feel average about the
value added service of NTC. Similarly, in Kathmandu Valley, 66.5% and
66.7% feel average about the value added services provided by NTC and Mero
mobile respectively.
0102030405060708090
100
Satis
fied
Aver
age
Not
Sat
isfie
d
Satis
fied
NTC Phone Mero Mobile
65
Satisfaction Level of Value Added Service of Different Mobile Services
Table 4.13 shows that in overall, Mero mobile users are highly satisfied with
the Value added service with 51.6% users and 41.7% feel average about the
value added service of NTC. Similarly, in Kathmandu Valley, 66.5% and
66.7% feel average about the value added services provided by NTC and Mero
mobile respectively.
Satis
fied
Aver
age
Not
Sat
isfie
d
Satis
fied
Aver
age
Not
Sat
isfie
d
Satis
fied
Aver
age
Not
Sat
isfie
d
Mero Mobile UTL Phone NTC CDMA
65
Satisfaction Level of Value Added Service of Different Mobile Services
Table 4.13 shows that in overall, Mero mobile users are highly satisfied with
the Value added service with 51.6% users and 41.7% feel average about the
value added service of NTC. Similarly, in Kathmandu Valley, 66.5% and
66.7% feel average about the value added services provided by NTC and Mero
mobile respectively.
Eastern
Central
Western
Mid Western
Far Western

66
4.6 Future Expectation about New Mobile Service or Improvement inExisting Mobile Service
Table 4.14Future Expectation about New Mobile Service or Improvement in
Existing Mobile Service% of respondents who want new mobile serviceor improvement in existing mobile serviceNew Mobile
ServiceImprovement on existing mobile
serviceOverall 55.4 44.6
Ktm vs
othe
rs Kathmandu Valley 58.9 41.1
Outside Ktm 54.8 45.2
Dev
elop
men
tR
egio
n
Eastern 54.0 46.0Central 73.4 26.6Western 53.7 46.3Mid Western 34.3 65.7Far Western 47.7 52.3
Gen
de r
Male 55.7 44.3
Female 54.3 45.7
Age
Gro
up
15-19 63.3 36.720-24 58.9 41.125-29 55.0 45.030-59 49.7 50.360+ 44.8 55.2
Edu
catio
nal
Lev
el
Illiterate 50.0 50.0Read/write 51.5 48.5Under SLC 58.4 41.611-12/Certificate 54.9 45.1Bachelor 55.5 44.5Masters and above 60.0 40.0
Occ
upat
ion
of R
espo
nden
t Agriculture 59.4 40.6Business 53.0 47.0Industry 47.1 52.9Gvt. service 57.8 42.2Gvt. teacher 55.8 44.2Private service 53.4 46.6Private teacher 51.6 48.4Housewife 44.0 56.0Student 64.3 35.7Others 56.3 43.8
Mon
thl
yIn
com
eof
Res
pon
dent
less than 5000 55.2 44.85000-9999 55.0 45.010000-14999 53.2 46.8

67
15000-19999 54.6 45.420000 and above 56.6 43.4
Table 4.14 depicts that with only few exceptions, majority of respondents in all
categories prefer new mobile service over improvement on existing mobile
service. Inside Kathmandu valley, 58.9% of the respondents prefer new mobile
service as compared to 41.1% respondents preferring improvement on existing
mobile service. Outside Kathmandu valley, 54.8% of the respondents prefer
new mobile service as compared to 45.25% preferring improvement on existing
mobile service. Considering total respondents both inside and outside
Kathmandu valley, 55.4% respondents prefer new mobile service as compared
to 44.6% respondents expecting improvement in existing mobile service.

68
4.7 Services to be Included in New Mobile ServiceTable 4.15
Services to be Included in New Mobile ServiceTrafficupdate
Newsupdate
TelevisionViewing System Ticketing
Stock priceupdate
Overall 23.6 68.4 33.8 12.4 12.2Ktm vsothers
Ktm 30.8 74.0 35.7 7.4 14.7Outside Ktm 22.4 67.5 33.5 13.2 11.8
Development Region
Eastern 4.3 64.8 42.3 5.8 9.2Central 37.5 78.4 33.1 16.0 17.6Western 4.6 44.6 13.0 2.8 4.0
Mid Western 18.0 64.1 44.4 21.4 11.1Far Western 44.0 85.5 41.4 15.6 16.6
GenderMale 26.6 71.8 33.6 14.8 14.5
Female 17.4 60.5 33.8 7.0 7.1
AgeGroup
15-19 22.2 55.0 35.3 9.4 2.920-24 25.6 66.9 32.9 10.7 9.925-29 23.7 68.3 34.1 12.2 13.030-59 22.7 75.1 34.0 15.4 17.260+ 13.8 65.5 24.1 6.9 17.2
EducationalLevel
Illiterate 10.8 58.1 28.0 5.4 4.3Read/write 18.4 63.0 30.8 9.0 6.6Under SLC 23.3 71.0 36.5 13.3 9.2
11-12/Certificate 24.5 67.3 32.2 12.6 13.6Bachelor 26.7 71.5 34.6 12.6 15.7
Masters and above 32.6 71.2 39.1 21.1 30.1
Occupationof
Respondent
Agriculture 13.9 59.1 27.7 10.9 9.8Business 26.4 71.0 35.7 15.1 17.3Industry 22.8 68.3 39.2 12.7 17.6
Gov-service 26.2 79.4 29.0 14.7 18.1Gov-teacher 23.1 82.7 30.8 21.2 21.2
Private service 27.4 71.9 32.1 12.7 13.9Private teacher 26.6 71.9 40.6 14.1 14.1
Housewife 11.7 62.3 34.5 4.2 3.9Student 25.5 65.4 32.9 11.5 7.7Others 29.6 58.0 44.4 16.0 7.4
MonthlyIncome of
Respondent
Less than 5000 27.3 70.8 32.4 11.6 10.75000-9999 25.9 73.3 31.8 13.7 15.1
10000-14999 28.3 71.7 33.3 14.8 17.815000-19999 19.3 63.9 33.6 14.3 29.420000 and
above 26.0 82.0 38.2 22.8 24.44.8 Services to be included in New Mobile Service (Contd.)

69
Table 4.16
Services to be included in New Mobile Service (Contd.)
Horoscope
Ticketing
Bankingand
Finance
ExamResult
ViewingSystem
Votingand
SurveySystem
SportsSystem
Ktm vsothers
Kathmandu 17.2 7.4 26.4 21.9 9.3 23.0Outside Ktm 26.8 13.2 17.7 35.5 21.0 20.2
Total 25.4 12.4 19.0 33.5 19.3 20.6
DevelopmentRegion
Eastern 17.0 5.8 17.9 41.9 33.9 22.2Central 13.6 16.0 19.5 29.4 12.0 14.9Western 37.2 2.8 6.0 24.1 8.1 11.4
Mid Western 18.8 21.4 20.6 40.6 31.4 22.8Far Western 43.1 15.6 31.8 37.0 20.0 35.9
GenderMale 22.5 14.8 22.0 34.0 21.1 25.4
Female 31.9 7.0 11.4 32.0 15.4 9.7
AgeGroup
15-19 29.7 9.4 9.4 64.7 19.7 29.720-24 26.0 10.7 14.4 44.4 21.4 26.225-29 26.8 12.2 20.1 24.1 20.7 18.730-59 21.9 15.4 25.9 21.0 16.3 14.460+ 17.2 6.9 10.3 31.0 13.8 6.9
Educational Level
Illiterate 19.4 5.4 9.7 12.9 12.9 12.9Read/write 23.8 9.0 8.6 8.6 13.3 7.7Under SLC 28.8 13.3 14.1 32.4 18.5 17.2
11-12/Certificate 25.1 12.6 18.8 41.8 21.5 23.8Bachelor 25.4 12.6 27.7 42.9 22.0 28.5
Masters andabove 18.8 21.1 48.9 37.6 21.1 30.8
Occupation of
Respondent
Agriculture 23.8 10.9 9.1 13.9 18.2 10.9Business 23.6 15.1 26.7 22.2 18.0 17.2Industry 17.6 12.7 20.6 27.5 31.4 24.5
Gov-service 17.2 14.7 27.7 26.1 22.7 19.3Gov-teacher 19.2 21.2 23.1 48.1 21.2 15.4
Private service 22.1 12.7 23.6 22.2 16.5 23.7Private teacher 20.3 14.1 26.6 43.8 12.5 34.4
Housewife 38.4 4.2 7.0 20.1 13.6 5.0Student 27.6 11.5 13.2 65.7 23.0 33.7Others 28.8 16.0 11.1 23.5 18.5 16.0
MonthlyIncome ofResponden
t
less than 5000 28.3 11.6 13.1 29.1 17.1 20.65000-9999 18.9 13.7 20.3 26.1 19.5 17.6
10000-14999 27.6 14.8 31.9 28.9 21.1 22.715000-19999 32.8 14.3 42.9 25.2 17.6 24.4
20000 and above 22.8 22.8 44.7 26.8 17.9 23.6
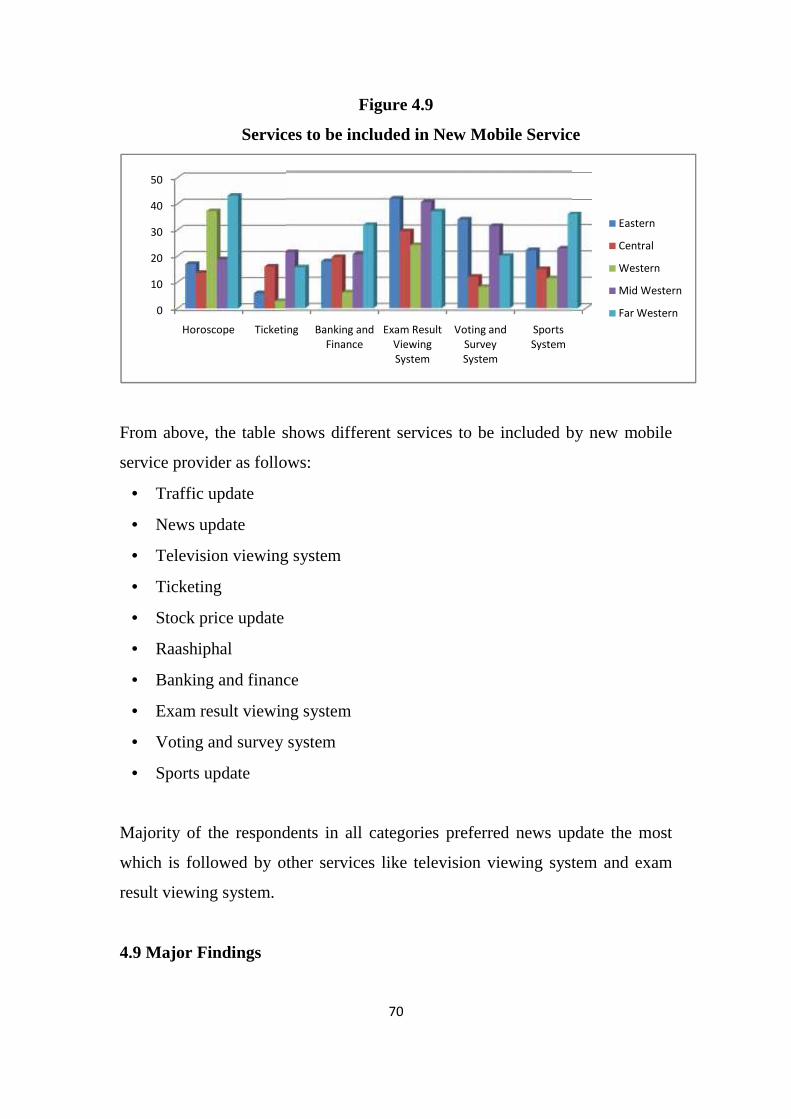
70
Figure 4.9
Services to be included in New Mobile Service
From above, the table shows different services to be included by new mobile
service provider as follows:
Traffic update
News update
Television viewing system
Ticketing
Stock price update
Raashiphal
Banking and finance
Exam result viewing system
Voting and survey system
Sports update
Majority of the respondents in all categories preferred news update the most
which is followed by other services like television viewing system and exam
result viewing system.
4.9 Major Findings
0
10
20
30
40
50
Horoscope Ticketing
70
Figure 4.9
Services to be included in New Mobile Service
From above, the table shows different services to be included by new mobile
service provider as follows:
Traffic update
News update
Television viewing system
Ticketing
Stock price update
Raashiphal
Banking and finance
Exam result viewing system
Voting and survey system
Sports update
Majority of the respondents in all categories preferred news update the most
which is followed by other services like television viewing system and exam
result viewing system.
4.9 Major Findings
Ticketing Banking andFinance
Exam ResultViewingSystem
Voting andSurveySystem
SportsSystem
70
Figure 4.9
Services to be included in New Mobile Service
From above, the table shows different services to be included by new mobile
service provider as follows:
Traffic update
News update
Television viewing system
Ticketing
Stock price update
Raashiphal
Banking and finance
Exam result viewing system
Voting and survey system
Sports update
Majority of the respondents in all categories preferred news update the most
which is followed by other services like television viewing system and exam
result viewing system.
4.9 Major Findings
SportsSystem
Eastern
Central
Western
Mid Western
Far Western

71
There is a wide area in Nepal especially outside the Valley which is yet to
experience the convenience of mobile phones and the people there have both
curiousness and capacity to use the mobile phones. Only 14.5 % of the
population of Nepal is using mobile phones.
Prepaid mobile phones are most preferred type of mobile service in Nepal,
especially in Kathmandu. 55.1% of the NTC mobile users and, 19.7% of the
Mero mobile as are not satisfied with the network coverage Satisfaction
regarding Network coverage of NTC and Mero Mobile is Very Low that is
only 8.5 and 36.3% only. Customers have lots of expectations from the value
added services in mobile phones. Mostly people are satisfied with Mero mobile
because most of the time the industries have added some value for its
customers.
This is also because majority of the population had been displaced from their
usual place of living. Most of the people have also left their family members
due to the nature of their jobs and mobile phones have been the convenient way
for them to be in touch with their loved ones.

72
CHAPTER - V
SUMMARY, CONCLUSION AND RECOMMENDATION
This chapter presents the state of the whole research process, its prospects as
consequence. The study is carried out to assess the potential market for
emerging telecommunication in Nepal. The whole research process is
concentrated on the services provided by top telecommunication industries of
Nepal (NTC, Mero Mobile, UTL) The study mainly focus on the opinion of
customer of different zones about the services and Facilities provided by the
current telecommunications of Nepal. These Chapters summarizes the study
and presents summary, conclusion and the main recommendation based on the
whole study process and analysis of the data
5.1 Summary
Nepal Telecom
Nepal Telecom is one of the most popular and pioneer company in
telecommunication industry in Nepal. In ancient time NTC has its Monopoly in
its services and its tariffs. Earlier people use to wait for the schedule of
distribution of the services and connection offered by NTC. Then the day, the
distribution was announced people had to wait in a long queue. But with the
entrance of Spice mobile (later got popular and accepted as Mero Mobile) and
the United Telecommunication Limited UTL, the market turned out a bit
competitive and sensitive for NTC. Responding to the scenario NTC made its
connections and services available at anytime.
At present it has also introduced a new scheme called Friend and family offer
where the customers talk to three numbers at 75% of the actual rate for per
minute. It has also introduced a value added service called Nepal Telecom
Notice Board Service targeting the School, Hospitals, Corporate Houses and
Financial Institutions by giving them important notices. Airlines by giving their
73
customers update regarding flight arrival/departure/delay flights. Media Houses
by broadcasting them the breaking news, Traffic Police by providing traffic
updates, Stock exchange by updating them with the market price of the shares.
Spice Nepal
Spice Nepal Private Ltd., popularly known under its brand name "Mero
Mobile", is the first private GSM mobile operator in Nepal at Present Mero
Mobile introduce many scheme plans which are as follows
No STD Charges: Mero mobile gives the call made by its mobile subscribe to
landlines and other networks across the city within Nepal at local call rates.
Therefore, there is no STD charge for any calls made to mobile or landline,
anywhere within Nepal. All outgoing call will be at local rates.
It has introduced from November 1st, 2008, MERO MOBILE new "Free Talk
Time" scheme that will be implemented for Access, Smart, Light tariff plans.
Free talk time will be provided to the subscriber in accordance to his/her
spending on any chargeable services such as outgoing calls, SMS, MMS,
GPRS or PRBT during one week.
Free Talk Time will be provided to subscriber according to the following
scheme: Subscriber will get 15 minutes free Mero to Mero time and 4 SMS
only in case he/she spends not less than NRs. 50 during the previous week.
Validity period of 15 minutes free talk time and 4 SMS is one week. 1 week is
a period from Sunday to Saturday. In total during one month period subscriber
can get 60 minutes free Mero to Mero talk time and 16 SMS.
Free USSD Service: Unstructured Supplementary Service Data (USSD) is a
GSM technology, used to send text between a mobile phone and an application
74
in the operator’s network. USSD provides session-based communication,
enabling a variety of applications.
Free Missed Call Notifications: Missed Call is the unique feature in mobile,
which enables you to know when and who called during your busy hours, out
of coverage or your mobile is switched off.
United Telecom of Nepal (UTL)
United Telecom Ltd, a joint venture between Videsh Sanchar Nigam Ltd.
(VSNL), Mahanagar Telephone Nigam Ltd. (MTNL), and Telecommunications
Consultants India Ltd. (TCIL), and Nepal Ventures Private Ltd. (NVPL) plans
to offer telephony services in Nepal, based on the wireless local loop (WLL)
technology. After exhaustive deliberations & extensive scrutiny, UTL was
declared successful bidder by NTA in the bid for basic telephone service based
on WLL technology and letter of intent was awarded on 21st June 2001 &,
finally, the license was issued on 4th October 2002.
Along with regular calling services, it also offers Voice mail, Call Forwarding,
Call Waiting, Conference Call and data transfer facilities. It is compatible for
Fax and Internet services as well. UTL provides WLL wireless phone services
and is presently operating in the Central Development Region and has a fair
customer base of about 200,000 subscribers owing mainly to its low tariff and
easy availability.
The main objective of this study is analyze the potential market for the
emerging telecom industries in Nepal through customer Survey based on
existing telecommunication of Nepal.
Analyzing the market is one of the most crucial parts before launching the
product and fixing the target group. The task on market analysis is
segmentation of customer based on age, gender, population, income, etc.

75
Beyond this feedback and response about the similar products should be
studied. And the limitations of the existing products should be made key factor
for the purchasing of new product to the target Group.
This is a consumer survey study based on this topic “Market Analysis Based on
existing Telecommunications of Nepal” where primary data are collected from
public through customer survey and secondary data are collected from concern
organizations.
In the First Chapter, Background of the study, Statement, Need, objectives and
limitations of the study is presented. Need of Market analysis for the growth of
organization is presented.
In the second chapter, the review of literature is made. This chapter briefly
deals with conceptual frameworks of the study and review of thesis.
In the third chapter, research design, data collection method, sources of data
populations and samples, data collection procedures, technique of data analysis
are presented.
The fourth chapter examines about the services rendered by existing
telecommunications to the target customers. Satisfaction level of people, tariff
rate, services to be included, motivation factors, reasons of using phones are
presented and analyzed.
Taking into account the top telecommunication industries of Nepal the services
provided by these companies are analyzed from the mouth of users. In this
study three telecom industries are taken into account they are mainly NT,
Spice, and UTL. This study mainly focus the opinion of customer about the
existing services and facilities provided by these industries, from their demand

76
and desire and from the secondary data the study tries to find out the market for
the new telecommunication industry. In this study people interest about new
telecommunication, existing services, tariff rates, services, satisfaction rate,
people spending habit, motivational factor etc are discussed and analyzed
5.2 Conclusion
Use of mobile phones (Handheld Devices) is showing the increasing trends
over the short period of time as compared with the PSTN Landline service.
There is a wide area in Nepal especially outside the Valley which is yet to
experience the convenience of mobile phones and the people there have both
curiousness and capacity to use the mobile phones.
Only 14.5 % of the population of Nepal is using mobile phones. Major gap area
can be seen in the Far Western, Mid Western and Eastern region with mobile
service subscription of 7.3%, 8.8% and 7.1% respectively.
Prepaid mobile phones are most preferred type of mobile service in Nepal,
especially in Kathmandu.
55.1% of the NTC mobile users and, 19.7% of the Mero mobile as are not
satisfied with the network coverage Satisfaction regarding Network coverage
of NTC and Mero Mobile is Very Low that is only 8.5 and 36.3% only.
41.7% of NTC mobile users and 15.3% of Mero mobile users are not satisfied
with the customer service of the respective companies.
48.3% of NTC mobile users and 60.2% of Mero mobile users are not happy
with the rates (tariffs) of the respective companies.

77
Customers have lots of expectations from the value added services in mobile
phones. Mostly people are satisfied with mero mobile because Most of the time
the industries have added some value for its customers.
People generally use mobile phones to be in touch with the family members.
This is also because majority of the population had been displaced from their
usual place of living. Most of the people have also left their family members
due to the nature of their jobs and mobile phones have been the convenient way
for them to be in touch with their loved ones.
5.3 Recommendations
The Main recommendations of this study are as follows:
There are almost twenty two development districts that can be an active
market for telecom product.
Major Markets are Kathmandu Lalitpur and Bhaktapur.
Dang district may be divided into two parts, Dang Valley and Deukhuri in
Terai.
NTC and Mero Mobile operating only in Banke, Bardiya, Surkhet, Dang
and Jumla hence an opportunity for emerging telecommunication is to
make the whole area as their property.
Another opportunity for growing telecom industry is that only 200
thousand people are carrying mobile in this area.
Thus among the five development regions the mid western region
provides more opportunity and favorable market due to low mobile
penetration yet growing economies. Besides Banke Bardiya, Surkhet, half
of Dang and Jumla we have almost Nine neglected regions in our court.
The data of reason of using Mobile phone reveals that, among these
different reasons for using mobile phone, the most common reasons are -
to be in contact with the family and for business purpose. Except in few
cases, more than 50% of the respondents in different categories use

78
mobile phones to be in direct contact with the family. Hence it can be
concluded that it is the primary and most common reason for the use of
mobile phones.
The second important reason is for business purpose.
Hence the communication should capitalize the primary and second
reason and build strategy focusing on the same. But it does not mean that
the other factors are neglected, at times it is also important to focus on
those minute factors too in fact, and in other words the basic focus which
would also work as a motivational factor is the first two important and
common factors.
Inside Kathmandu valley, 58.9% of the respondents prefer new mobile
service as compared to 41.1% respondents preferring improvement on
existing mobile service. So there is high priority of the new mobile
services. Similarly outside Kathmandu valley, 54.8% of the respondents
prefer new mobile service as compared to 45.25% preferring improvement
on existing mobile service.
Considering total respondents both inside and outside Kathmandu valley,
55.4% respondents prefer new mobile service as compared to 44.6%
respondents expecting improvement in existing mobile service.
Majority of the respondents in all categories preferred news update the
most which is followed by other services like television viewing system
and exam result viewing system. So Customer preference should be given
high priority for the new industry.
55% of the NTC mobile users are not satisfied with the network
coverage.41.7% of NTC mobile users and 15.3% of Mero mobile users
are not satisfied with the customer service of the respective
companies.48.3% of NTC mobile users and 60.2% of Mero mobile users
are not happy with the rates (tariffs) of the respective companies.
Customers have lots of expectations from the value added services in
mobile phones. Considering these data as a major source the emerging

79
telecommunication must try to satisfy customers in Network, tariffs, and
services.

80
BIBILOGRAPHY
Adhikari, M. (2009) The effectiveness of promotional Strategy of Mobile
Services in Society with SP (With Special Reference of Mero Mobile
Services). An Unpublished Master Degree Thesis submitted to Faculty of
Management, T.U.
Agrawal, G.R. (2002). Marketing Management in Nepal. Kathmandu: M.K.
Publishers and Distributors.
Agrawal, G.R. (2004). Fundamental of Marketing in Nepal. Kathmandu: M.K.
Publishers and Distributors.
Bhattrai, T.P. (2061). Human Resource Development in Nepal ,A Case Study of
Nepal Telecom. An Unpublished Master Degree Thesis submitted to
Faculty of Management, T.U.
Boyd, W. Harper, W., Westfall, R. & Stanley. F. (2004). Marketing Research.
(6th Edition). New Delhi: Prentice Hall.
Koirala, K.D. (1991). Marketing Decision. Kathmandu: M.K. Publishers and
Distributors.
Koirala, K.D. (1997). Fundamental of Marketing Decision. Kathmandu: M.K.
Publishers and Distributors
Kotler, P. & Armstrong, G. (2004). Principles of Marketing. New Delhi: Per
Arson.
Kotler, P. (1998). Marketing Management. New Delhi: Prentice Hall of India
Private Limited.
Kotler, P. (2003). Marketing Management. (11th Edition). N.J.: Prentice Hall of
India.
Nepal Doorsanchar Sansthan (1999). Nepal Doorshanchar Sasthan: Past and
Present. Kathmandu: Time Graphic Printers Pvt. Ltd.
Nepal Telecom (2001/02 to 2007/08). Annual Report. Kathmandu.
Nepal Telecom (2064/065) .MIS Report Ashad. Kathmandu.
NTA Quarterly Performance Indictor of Telecom (2008). Kathmandu.

81
Shrestha, S.K. (2008). International Marketing. Kathmandu: Dhaulagiri Books
and Stationary Publishers and Distributors.
Shrestha, S.K. (2008). Marketing Research. Kathmandu: Dhaulagiri Books and
Stationary Publishers and Distributors.
Sthapit, A. (2007). Marketing Research. Kathmandu, M.K. Publishers and
Distributors.
Tripathi, P. (2007). Effectiveness of Sales Planning in Nepal Telecom (With
Special Reference to Nepal Telecom). An Unpublished Master Degree
Thesis submitted to Faculty of Management, T.U.
Websites:
www.businessdirectory.com
www.economywatch.com
www.itu.itn
www.ncell.com
www.netmba.com
www.nta.gov.np
www.ntc.net.np
www.oppapers.com
www.spicenepal.com.np
www.utlnepal.com
www.wikepedia.com