Baseball Salaries and Income Taxes: The “Home Field Advantage ...
25
Tulane Economics Working Paper Series Baseball Salaries and Income Taxes: The “Home Field Advantage” of Income Taxes on Free Agent Salaries James Alm Department of Economics Tulane University New Orleans, LA [email protected] William H. Kaempfer Department of Economics University of Colorado at Boulder Boulder, Colorado [email protected] Edward Batte Sennoga Makerere University Kampala, Uganda Working Paper 1209 July 2012 Abstract In this paper we examine the impact on the salaries of free agents in Major League Baseball of differences in state and local individual income taxes between major league cities, in an attempt to see if income taxes affect player salaries. Our basic specification suggests that each percentage point of an income tax raises free agent salaries by $21 to $24 thousand; other estimates indicate even larger impacts. Our findings suggest that the existence of this additional salary demand means that low tax cities (e.g., Florida, Texas, and Washington) have a “home field advantage” in the baseball free agent market. Keywords: tax incidence, free agents, income tax, luxury tax JEL: H22, H24, H31, H73, L83
Transcript of Baseball Salaries and Income Taxes: The “Home Field Advantage ...
Tulane Economics Working Paper Series
Baseball Salaries and Income Taxes:The “Home Field Advantage” of Income Taxes on Free Agent Salaries
James AlmDepartment of Economics
Tulane UniversityNew Orleans, [email protected]
William H. KaempferDepartment of Economics
University of Colorado at BoulderBoulder, Colorado
Edward Batte SennogaMakerere UniversityKampala, Uganda
Working Paper 1209July 2012
Abstract
In this paper we examine the impact on the salaries of free agents in Major League Baseball of differencesin state and local individual income taxes between major league cities, in an attempt to see if incometaxes affect player salaries. Our basic specification suggests that each percentage point of an incometax raises free agent salaries by $21 to $24 thousand; other estimates indicate even larger impacts. Ourfindings suggest that the existence of this additional salary demand means that low tax cities (e.g.,Florida, Texas, and Washington) have a “home field advantage” in the baseball free agent market.
Keywords: tax incidence, free agents, income tax, luxury taxJEL: H22, H24, H31, H73, L83
Baseball Salaries and Income Taxes: The “Home Field Advantage” of Income
Taxes on Free Agent Salaries*
James Alm
Tulane University
William H. Kaempfer
University of Colorado at Boulder
Edward Batte Sennoga
Makerere University
Abstract
In this paper we examine the impact on the salaries of free agents in Major League Baseball of
differences in state and local individual income taxes between major league cities, in an attempt
to see if income taxes affect player salaries. Our basic specification suggests that each
percentage point of an income tax raises free agent salaries by $21 to $24 thousand; other
estimates indicate even larger impacts. Our findings suggest that the existence of this additional
salary demand means that low tax cities (e.g., Florida, Texas, and Washington) have a “home
field advantage” in the baseball free agent market.
Keywords: Tax incidence, free agents, income tax, luxury tax.
* Please address all correspondence to James Alm, Department of Economics, Tulane
University, 208 Tilton Hall, New Orleans, LA 70118 (phone +1 504 862 8344; fax +1 504 865
5869; email [email protected]). We are grateful for helpful comments and discussions to Scott
Carrell and William Hoyt.

1
“We have no state taxes, and it’s always 80 degrees.” Doc Rivers, then-coach of
Florida’s Orlando Magic, yelling from the sidelines to prospective free agents on
opposing teams.
Introduction
The theory of tax incidence suggests that taxes will fall on fixed factors of production,
while mobile factors will largely be able to avoid bearing the burden of a tax. It is hard to
imagine many factors of production more mobile than free agent professional athletes about to
sign a new contract. As such, an expectation about those contracts is that there will be a
divergence between the tax inclusive payment made by a team and the tax exclusive payment
received by the players. Assuming that free agents compare after-tax bids from prospective
teams, offers that seem nominally identical will differ in their face value by the degree to which
state (and local) taxes, especially state individual income taxes, differ in the playing sites.
The issue of taxation of professional athletes is particularly important in Major League
Baseball (MLB). For example, in 2001 the Seattle Mariners’ Aaron Sele and the Detroit Tigers’
Dean Palmer both had a contractual, pre-tax salary of $7,500,000. However, Palmer’s salary
was reduced by $315,000 from the State of Michigan’s income tax and by an additional $93,750
from the City of Detroit’s income tax, reducing his pre-tax salary by $408,750 (assuming
individual filing). In contrast, Sele was able to keep the entire $7.5 million since neither
Washington nor Seattle imposes income taxes. However, if Sele had been traded to the New
York Yankees (at the same salary), he would have owed even more than Palmer ($801,750) in
state and local taxes. As another especially telling example – and one based on actual events –
during the winter between the 2002 and 2003 seasons, a trade between Florida, Colorado, and
Atlanta involving several players and about $200 million in contracts almost fell through in its
2
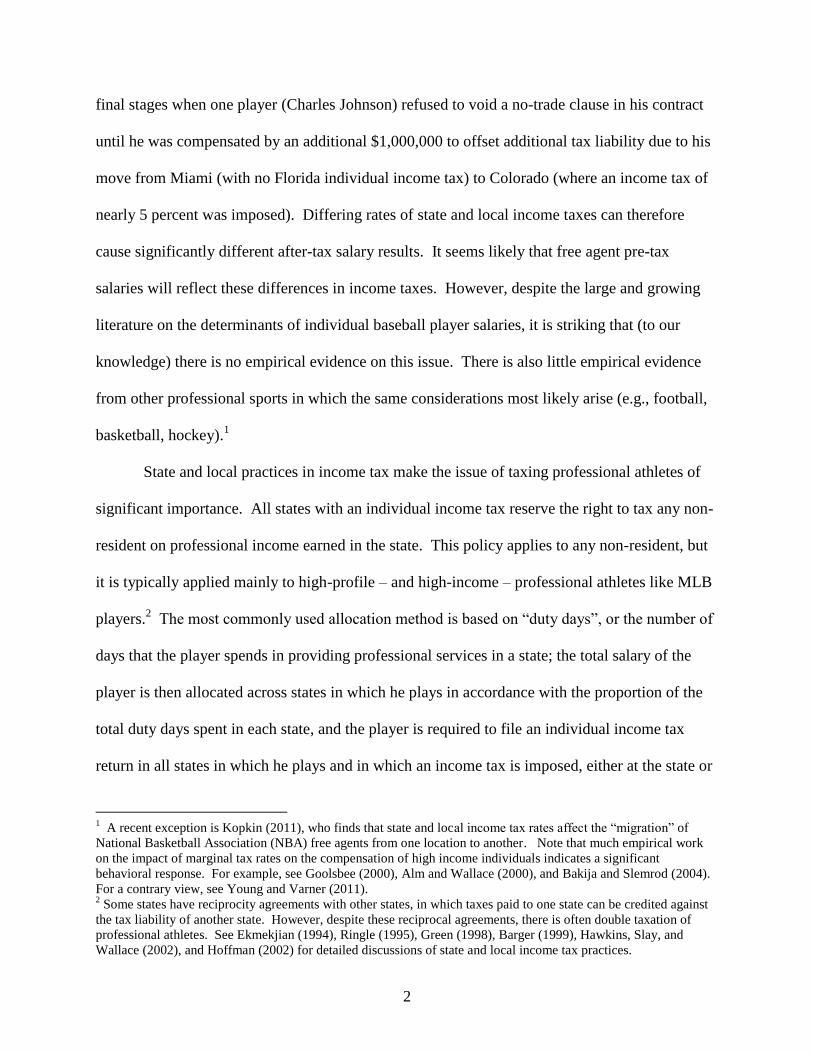
final stages when one player (Charles Johnson) refused to void a no-trade clause in his contract
until he was compensated by an additional $1,000,000 to offset additional tax liability due to his
move from Miami (with no Florida individual income tax) to Colorado (where an income tax of
nearly 5 percent was imposed). Differing rates of state and local income taxes can therefore
cause significantly different after-tax salary results. It seems likely that free agent pre-tax
salaries will reflect these differences in income taxes. However, despite the large and growing
literature on the determinants of individual baseball player salaries, it is striking that (to our
knowledge) there is no empirical evidence on this issue. There is also little empirical evidence
from other professional sports in which the same considerations most likely arise (e.g., football,
basketball, hockey).1
State and local practices in income tax make the issue of taxing professional athletes of
significant importance. All states with an individual income tax reserve the right to tax any non-
resident on professional income earned in the state. This policy applies to any non-resident, but
it is typically applied mainly to high-profile – and high-income – professional athletes like MLB
players.2 The most commonly used allocation method is based on “duty days”, or the number of
days that the player spends in providing professional services in a state; the total salary of the
player is then allocated across states in which he plays in accordance with the proportion of the
total duty days spent in each state, and the player is required to file an individual income tax
return in all states in which he plays and in which an income tax is imposed, either at the state or
1 A recent exception is Kopkin (2011), who finds that state and local income tax rates affect the “migration” of
National Basketball Association (NBA) free agents from one location to another. Note that much empirical work
on the impact of marginal tax rates on the compensation of high income individuals indicates a significant
behavioral response. For example, see Goolsbee (2000), Alm and Wallace (2000), and Bakija and Slemrod (2004).
For a contrary view, see Young and Varner (2011). 2 Some states have reciprocity agreements with other states, in which taxes paid to one state can be credited against
the tax liability of another state. However, despite these reciprocal agreements, there is often double taxation of
professional athletes. See Ekmekjian (1994), Ringle (1995), Green (1998), Barger (1999), Hawkins, Slay, and
Wallace (2002), and Hoffman (2002) for detailed discussions of state and local income tax practices.
3
the local level. A player who is signed by a state with no income tax (e.g., Florida, Texas,
Washington) will have most of his duty days untaxable, even though days in other states with an
income tax will be subject to the tax. MLB players can often be required to file tax returns in
upwards of a dozen or more states.
In this paper, we examine whether free agent baseball contracts reflect, or incorporate,
differences in state and local individual income taxes. We collect annual salary and performance
data on all 372 free agent players (171 pitchers and 201 position players) over the period 1995 to
2001, or the period after the cancellation of the 1994 season and through the expiration in 2001
of the Collective Bargaining Agreement between the major league baseball clubs and the players
association. We use these data to estimate a within-group panel model of individual baseball
free agent player salaries, estimated separately for pitchers and position players, as a function of
individual performance indicators and individual fixed and time effects. Importantly, we include
a variable that measures the marginal tax rate in state and local individual income taxes (where
relevant), in order to examine how income taxes affect player salaries. We find in our basic
specification that individuals choosing to play in cities with income taxes must be paid higher
pre-tax salaries, by an amount that ranges from $21 to $24 thousand for each percentage point of
a state and local income tax; other estimates suggest even larger impacts. We then point out the
implications for sports salary modeling, as well as the implications for major league baseball
from state and local tax differences, differences that are presumably unintended and certainly
outside the control of baseball. Our basic conclusion is that free agents are mobile factors of
production, and, as a result, they bear little of the burden of individual income taxes.
Modeling the Determinants of Baseball Player Salaries
4
Because so much information is available relating to player productivity in baseball, a
rich literature has developed investigating the relationship between the value of player
performance and team revenue generation (e.g., a player’s marginal revenue product, or MRP).
A major issue in this literature has been the degree to which MRP and salary tend to diverge as a
result of monopsony power on the part of teams. Prominent in this literature are contributions by
Scully (1974), Zimbalist (1992), and Fort (1992). More recently, Krautmann (1999) has
demonstrated that the existence of an open and competitive market for players eligible for free
agency allows salaries for free agents to be more directly tied to relevant productivity factors.
See also recent empirical studies by Bradbury (2007), Healy (2008), Brown and Jepsen (2009),
and Krautmann and Solow (2009).
At question for our work here is which of the many player productivity variables might
best predict salary. Everyday position players have both offensive and defensive characteristics,
with some degree of differentiation among various attributes. The important offensive
contributions of, say, a lead-off hitter, a number two hitter, or a clean-up hitter will vary, just as
the important defensive characteristics of catchers, infielders, and outfielders are not the same.
Nevertheless, most researchers have found that there exists a wide range of variables that are
correlated with salaries and, indeed, that simple models are often as effective as complicated
ones (Fort, 1992). On the other hand, empirical models for pitchers tend not to be as successful
in explaining pitcher salaries, given the apparent difficulties in aggregating over different types
of pitching measures (Krautmann, Gustafson, and Hadley, 2003; Bradbury, 2007)). Underlying
all of these models is the presumption that past performance predicts future salary. Since it is
future salary and not future performance that is being predicted, past performance seems a
reasonable indicator.
5
What role do state income taxes play in determining player salaries? The theory of tax
incidence suggests that taxes will be shifted from mobile factors to fixed factors (Fullerton and
Metcalf, 2002). Since free agent baseball players are quite mobile, certainly more mobile than
the baseball franchises for whom the players work, this theory implies that franchises will bear
the bulk of the burden of state income tax differences. However, to the extent that franchises are
themselves footloose, as in the case of new franchises or relocations of existing franchises, then
local governments compete extensively through tax breaks to win franchises (Noll and Zimbalist,
1997). In any event, free agents cannot be considered fixed factors, and so they should
effectively escape the incidence of state income taxes. Consequently, we argue that players will
compare after-tax salary offers, whereas reported salaries – and those salaries tested in all other
baseball salary models to date – are invariably pre-tax salaries.3 To the extent that these two
figures differ by any considerable amount, there is a clear misspecification of the salary models.
Do State and Local Taxes Differ Across Baseball Sites?
An important, prior empirical issue is whether state and local taxes differ to any
significant degree across team sites. The answer to this question is “Yes”. Five of the thirty
MLB teams are in sites with no state or local income tax: Miami, Tampa Bay, Houston, Texas,
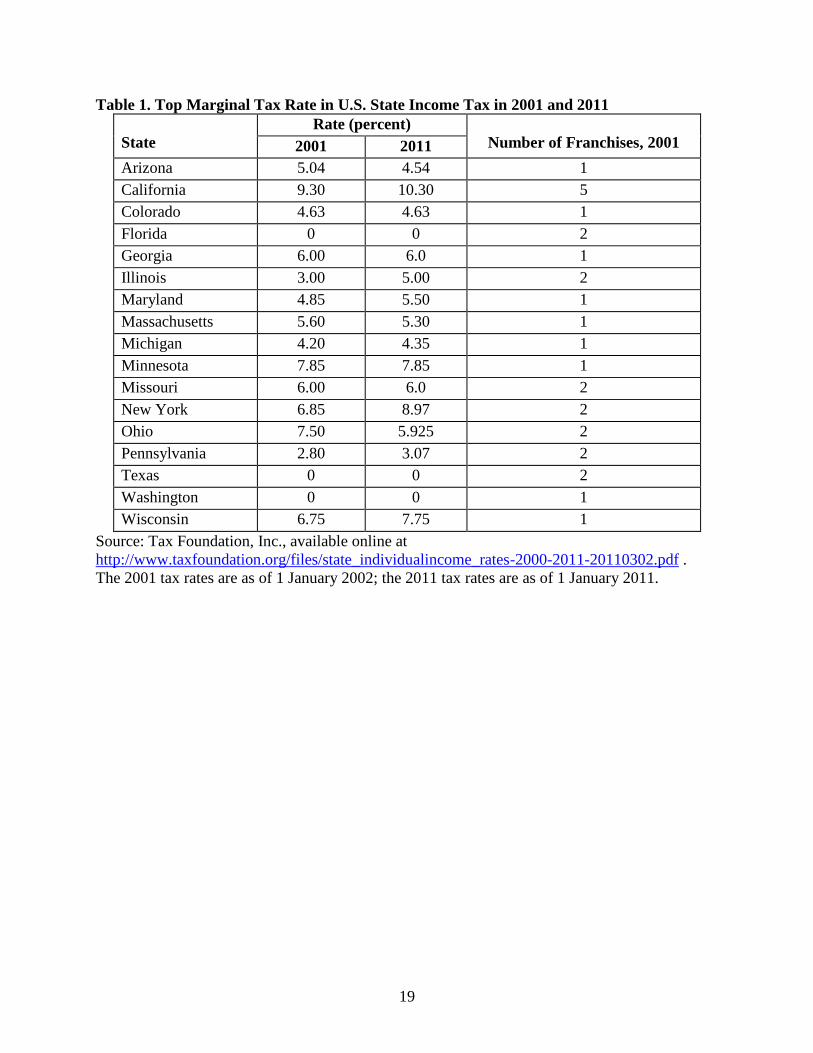
and Seattle. Table 1 lists the highest state income tax bracket by state with a baseball franchise,
in 2001 (or the last year of our sample); for purposes of comparison, Table 1 also presents
similar information as if 1 January 2011. In addition, local income taxes of up to 4 percent may
be applied in some cities, with Baltimore (3.05 percent), Cincinnati (2.10 percent), Cleveland
(2.0 percent), Detroit (1.25 percent), Kansas City (1.0 percent), New York City (3.84 percent),
Philadelphia (3.9642 percent), Pittsburgh (1.0 percent), San Francisco (1.5 percent), and St.
3 See Solow and Krautmann (2011) for a game theory model of free agent salary determination.

6
Louis (1.0 percent) all having local rates at or above 1 percent in 2001.4 This information
suggests a variability of up to about 10 percent in top marginal tax income tax rates in U.S cities
alone. When franchises in Canada are considered, the sum of the highest provincial and national
marginal rates in Canada in 2001 was 40.16 percent for Ontario and 53.5 percent for Quebec,
thereby creating an even greater variation in top marginal tax rates.5
Professional athletes, and multiple site performers of any kind, are responsible for paying
taxes to state and local authorities at every venue at which they play. Under current inter-league
playing schedules, a player on a major league roster for a full year may play in up to 18 or 19
different cities scattered over a dozen or more states. For instance, in 2001 a member of the
Colorado Rockies on the major league roster for a full year played in 18 cities over 14 states and
one province, and was responsible for paying the applicable state and local tax in each location
unless some sort of reciprocal agreement exists between the states. Playing half of one’s games
in a high relative to a low tax venue can make a considerable difference on a player’s after-tax
income. Recall the earlier example of Charles Johnson. Moving 81 home games from a city
with no state or local income taxes to one with a state tax rate of 4.63 percent prompted him to
demand an additional $1 million in compensation.6 It is this issue that we examine next.
Empirical Framework
4 These city tax rates are based on our search of individual city websites.
5 In the period that we examine, there was a MLB franchise in Montreal, Quebec, the Montreal Expos. This
franchise has since been relocated to Washington, D.C., and renamed the Washington Nationals. There remains one
MLB franchise in Canada, the Toronto Blue Jays. 6 Again, see Ekmekjian (1994), Ringle (1995), Green (1998), Barger (1999), Hawkins, Slay, and Wallace (2002),
and Hoffman (2002) for detailed discussions of state and local income tax practices.
7
Methods
We collect annual salary and performance data for all 372 baseball free agents (171
pitchers and 201 non-pitchers) for the period 1995 to 2001, which allows us to use variation
across free agent salaries to identify and to investigate how the presence and the magnitude of
state and local income taxes affects these salaries. We estimate a within-group model that
exploits the panel nature of our data and that controls for individual fixed and time effects.7
Aside from the marginal tax rate variable, we also include a full array of control variables,
including major league experience and other standard performance indicators for both pitchers
and non-pitchers. We choose this period because it covers the entire period after the cancellation
of the 1994 season and through the expiration in 2001 of the Collective Bargaining Agreement
between the major league baseball clubs and the players association.
Denote Sit as the pre-tax salary of free agent i in period t. We assume that the basic
relationship between the explanatory variables and the free agent salary is given by:
Sit = MTRit + Xit + i + t + it , (1)
(plus a constant term), where MTRit is a variable that measures the sum of state and local
marginal tax rates for free agent i in period t, Xit is a vector of performance indicators that
determine the salary of free agent i in period t, i and t are individual fixed and annual time
effects, (, ) are the relevant coefficients on the marginal tax rate and the performance
indicators, and it is a random error term. Note that free agents playing in a state for which there
is no state or local income tax have a value of MTRit equal to 0. We follow the previous
literature by including a very wide range of performance indicators in numerous specifications,
7 Individual fixed effects capture any permanent differences across free agents (e.g., innate abilities) not otherwise
captured by other explanatory variables. Similarly, the time effects capture any variation in free agent salaries over
time that affects the whole country (e.g., changes in MLB franchise laws, federal income taxes).
8
and we also explore alternative functional form specifications (e.g., quadratic, log-linear, log-
log), all in an attempt to demonstrate the robustness of our results.
The fixed-effects model seems appropriate for our analysis for two reasons. First, much
of the variation in free agent salaries is between individuals rather than within the same
individual over time. Although it would be difficult to specify all the characteristics that
determine the differences across individuals in free agent salaries, we can capture permanent
differences between free agents with individual fixed-effects. Similarly, there are many factors
that may affect free agent salaries over time, and we capture those differences with annual time
effects. Second, the fixed-effects model is a within-group estimator that uses a weighted average
of the within-individual and the across-individual variation to form the parameter estimates.
Therefore, our estimate of the effects of state and local income tax variations measures how free
agent salaries change within panels of free agents due to the presence or absence of a state and
local income tax. Nonetheless, we also estimate similar specifications with a random-effects
model, and our results are largely unaffected.8 Results from the Hausman (1978) specification
test indicate that the fixed effects model is a better fit. All standard errors are estimated using the
White (1980) procedure for robust standard errors.
Data
Our dependent variable is the annual pre-tax salary of baseball free agent i for time
period t, measured in thousands of dollars. We obtain information on free agent salaries and
other performance indicators for the years 1995 through 2001 from the MLB website, for all
MLB clubs. We include several explanatory variables to measure the effect of state income
taxes on salaries across free agents and over time. Our primary regressor is the top marginal tax
8 Hsiao (1986) presents a comprehensive discussion of panel data estimation procedures.

9
rate in the state and local income tax (where imposed); given that the top marginal tax rate
applies to incomes well below the salary of free agents, there is little concern with potential
endogeneity of the MTRit variable.9 Our expectation is that the estimated coefficient on MTRit
will be positive; that is, a player signing a contract in a city with a state and/or a local income tax
will require that the pre-tax salary of the free agent be higher in order to compensate for the
added income tax liability, in an amount the depends on the presence and on the magnitude of
the income tax in the city and the state. We estimate several variants on the basic specification
in equation (1), including those that are quadratic in MTRit, that are in log-linear form (e.g., Sit is
measured in natural log form), and that are in log-log form (e.g., both Sit and MTRit are in log
form).
To assess the impact of state income taxes on free agent salaries, it is necessary to control
for other factors that potentially affect these salaries. Following Krautmann, Gustafson, and
Hadley (2003), we include several factors that measure the performance (annual or career) of
hitters and pitchers. For position players (or non-pitchers), these performance and other
measures include: major league experience (Experience) and major league experience squared
(Experience Squared), on base percentage plus slugging percentage (OPS), and fielding
percentage (Fielding Percentage). Salary determinants for the pitchers include: major league
experience and major league experience squared, wins (Wins), the win/loss average (WinLoss
Average, computed as the ratio of wins to the sum of wins and losses), innings pitched (Innings
Pitched), earned run average (ERA), saves (Saves), and strike-out-to walk ratio (KBB Ratio). For
both non-pitchers and pitchers, we estimated different specifications with previous season and
with career averages of these performance indicators to appropriately capture their effect on free
agent salaries. Further, all specifications include year dummies to capture the trend of free agent
9 For example, in 2001 the average MLB salary was $2.2 million, and the minimum salary was $200,000.
10
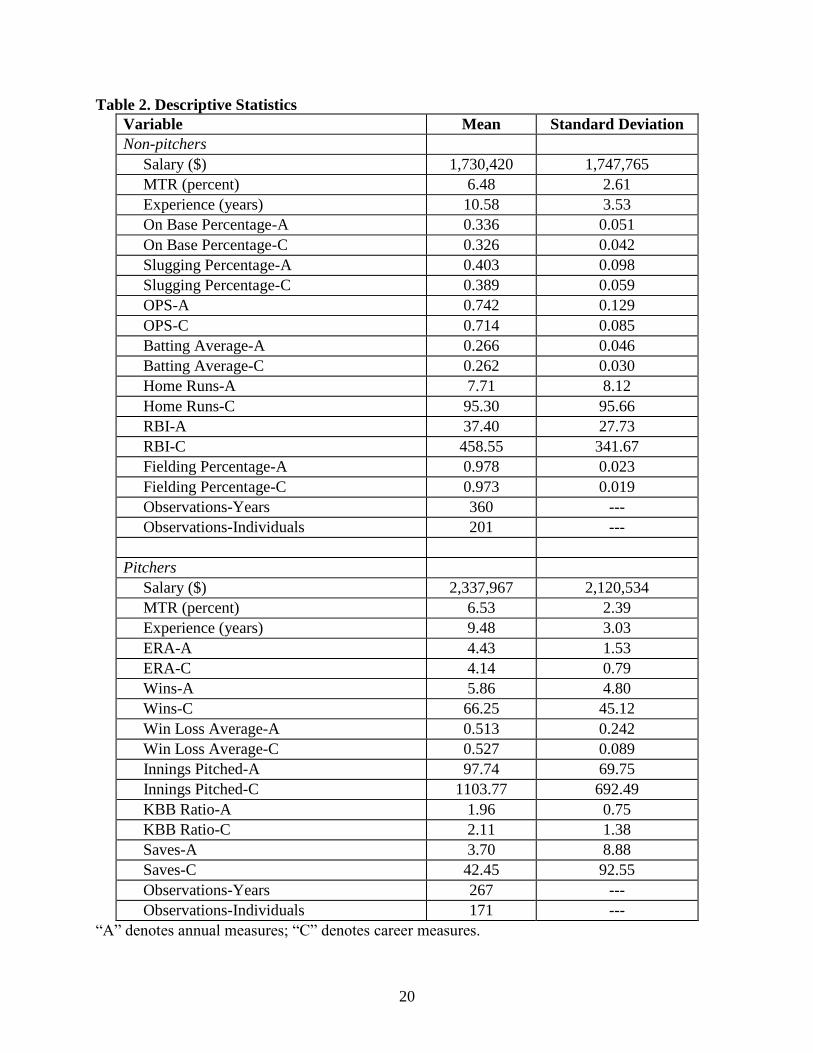
salaries during the period 1995-2001. Table 2 summarizes the descriptive statistics for our main
variables. Annual performance indicators in the most recent year before free agency have the
suffix A, while the career indicators are denoted by the suffix C.
It should be noted that we have estimated specifications with a wide range of alternative
performance indicators. For pitchers we have estimated variants with annual and career
indicators included and excluded, a dummy variable equal to 1 if the pitcher is left-handed and 0
otherwise, and so on. For non-pitchers, we have included annual and career batting average,
annual and career runs batted in (RBI), annual and career home runs, and the like. We have also
experimented with some of the more recently devised sabermetrics statistics for non-pitchers and
pitchers, such as “base runs” or “runs created”, “secondary average”, “true average”, “range
factor”, “weighted on-base average”, “equivalent average”, “peripheral earned run average”,
“defense-independent earned run average”, “walks plus hits per innings pitched”, “win shares”,
“total player rating”, and “value over replacement player”, to name several.10
These alternative
measures sometimes affect the magnitude of the tax impact on salaries but not its sign. We
report the results from the more commonly used performance statistics, but all results are
available upon request.
Estimation Results
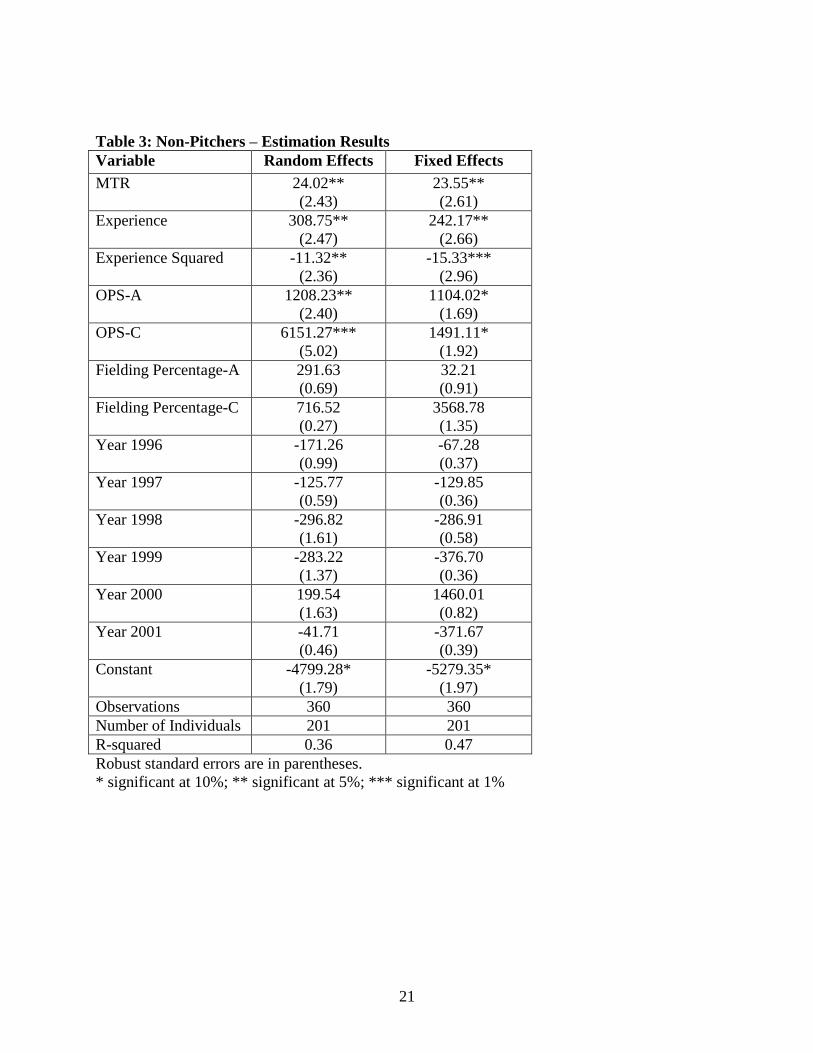
Table 3 contains the regression results of free agent salary estimation for non-pitchers for
the years 1995 through 2001. We report findings the random and fixed effects models for
10
See James (1989, 2001, 2011) and Thorn, Palmer, and Gershman (2004) for more detailed discussion of these
methods. For detailed discussions of the many statistics, see especially the website of the Society for American
Baseball Research (or “sabermetrics”) at http://www.sabr.org/), the Baseball Prospectus at
http://www.baseballprospectus.com/ , or The Hard Times at http://www.hardballtimes.com/ .
11
comparison. These results are largely the same, and our discussion is based mainly on results
from the fixed effects model.
For non-pitchers, the presence of a state and local individual income tax raises salaries by
about $24 thousand for each percentage point of the income tax. Also, most of our explanatory
variables used to measure the effect of free agents’ performance on salaries have the expected
signs. For instance, an additional year of MLB experience initially leads to an increase in a free
agents salary by $242 thousand while MLB experience beyond six years lowers free agent
salaries for non-pitchers by $15 thousand. Also, an increase in the previous season’s on-base
plus slugging percentage raises a free agent’s salary by approximately $1.1million, and an
increase in the lifetime on-base plus slugging percentage also has a comparably large and
statistically significant effect on free agent salaries for non-pitchers. In contrast, lifetime and
previous season fielding percentages do not have a statistically significant effect on free agent
salaries. The year dummies suggest that there was no statistically significant difference in free
agent salaries by year during the period 1995-2001.
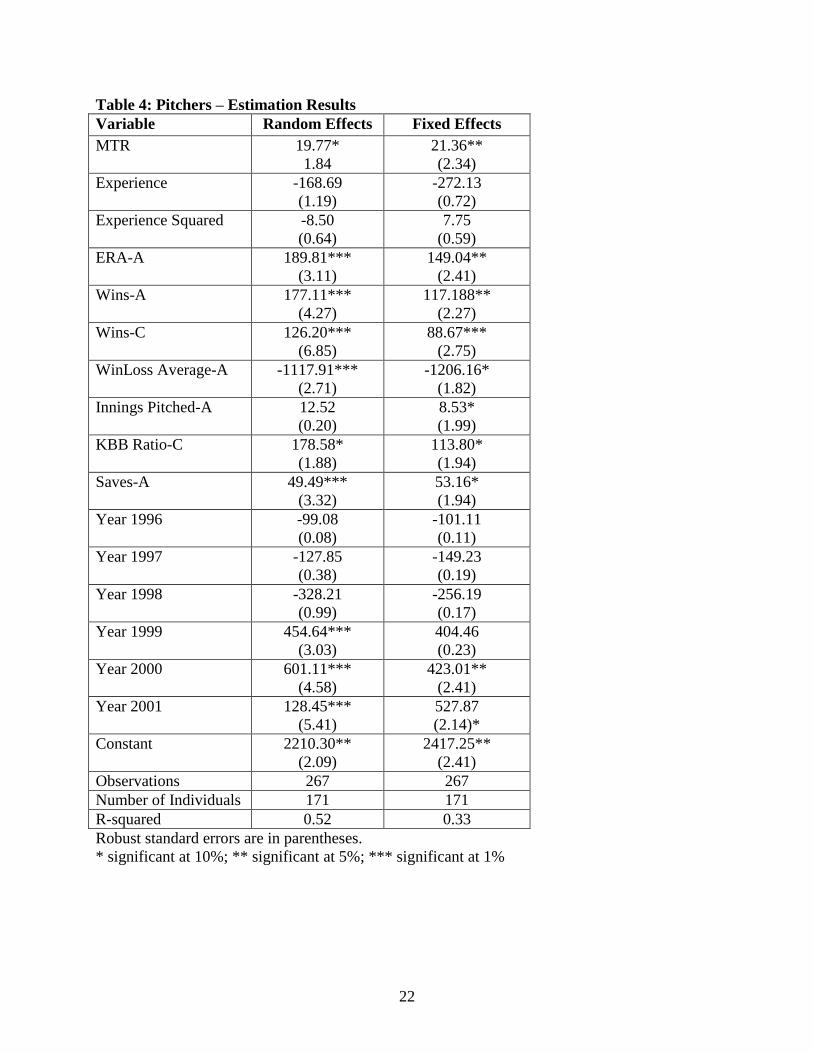
Table 4 shows the estimation results from the free agent pitcher salary equation. These
findings indicate that state and local income taxes again have a positive and statistically
significant effect on salaries for free agent pitchers, with a slightly smaller impact than for non-
pitchers. The presence of a state and local income tax now raises pitcher salaries by $21
thousand for each percentage point of the income tax; the random effects results gives a largely
similar impact. Unlike the results for non-pitchers, experience does not have a significant impact
on free agent pitcher salaries. As for performance measures, annual and lifetime wins both haves
a positive impact on salaries, as does previous season innings pitched, previous season win-loss
average, the career strikeout-walk ratio, and the previous season saves total. As in the non-
12
pitchers salary equation, the year dummies suggest that there is no statistically significant
difference in free agent salaries for pitchers by year over most of the period 1995-2001, with the
exception of the last two years.
To test further the robustness of these results, Table 5 presents fixed effects models for
both non-pitchers and pitchers that examine the impact of different ways of introducing MTRit.
Variant 1 repeats the fixed effects results for non-pitchers and pitchers as reported in Tables 3
and 4. Variant 2 introduces the marginal tax rate in a quadratic form (or MTR plus MTR
Squared). Variant 3 uses a simple log-linear specification where Sit is measured in its natural log
form, and Variant 4 estimates a standard log-log specification. Other variables are entered in the
same way as in the basic fixed effects specifications of Tables 3 and 4.
These results indicate somewhat variable quantitative impacts of the state and local
income tax on free agent salaries. Even so, all variants clearly indicate that a state and local
income tax has a positive and significant qualitative impact on free agent salaries. For example,
the quadratic specification suggests that the dollar impact on salaries of the income tax increases
(not decreases) with an increase in the marginal tax rate. Similarly, the log-linear variant
indicates that the percentage response of salaries to an increase in the marginal tax rate is about 2
to 3 percent. The log-log specification shows an elasticity of salaries with respect to the
marginal tax rate slightly in excess of 0.5. All variants point to the importance of state and local
income taxes in free agent salary determination.
Conclusions and Implications
There is a wide range of state and local income tax rates among cities with baseball
franchises. This range generates a marginal rate difference of up to 10 percentage points
13
between those cities in the U.S. with an income tax and the five no-tax cities. Our estimation
results indicate that these tax differences are largely reflected in pre-tax salary offers to free
agent MLB players: free agents are highly mobile, and they are able to ask for and receive pre-
tax salaries that largely compensate them for the state and local income taxes that they must pay
if playing in cities with an income tax.
To illustrate, the average salary of a MLB player in 2001 was $2.2 million. If the average
top marginal tax rate in state and local income taxes is approximated by 7 percent, as indicated in
the descriptive statistics of Table 2, then a player choosing the free agent offer of a city with an
income tax over a city without one would incur an additional statutory income tax liability of
roughly $150,000.11
Our estimation results vary somewhat in their precise implications, but even
so our basic specification suggests that each percentage point of a state and local income tax
raises free agent salaries by $21 to $24 thousand, a result that is broadly similar to the increased
statutory tax liability; other variants give largely similar estimates. In short, income taxes are
largely shifted away from mobile players to other factors, such as the franchise itself or immobile
factors in the city.
There are other implications of our results as well. The total 2001 payroll for all MLB
teams was in total $1.9 billion, of which $1.6 billion was incurred by franchises operating in
states with a state and local income tax. Again assuming that average top marginal tax rate is
roughly 7 percent, the franchises in states with an income tax paid an additional $20 million to
compensate players for the additional income taxes to which their players were subject.
11
Note also that in 2001 three-fourths of all states with an individual income tax imposed a top marginal tax rate of
between 5 and 9 percent; local income taxes impose additional burdens. See Table 1; for other years, see the Tax
Foundation information available at
http://www.taxfoundation.org/files/state_individualincome_rates-2000-2011-20110302.pdf .
14
An examination of individual players is also instructive. In 2001, there were 425 players
who were paid more than $1 million, and 22 players who were paid more than $10 million. The
five highest paid free agent players were Alex Rodriguez (Texas Rangers, $22,000,000), Kevin
Brown (Los Angeles Dodgers, $15,714,286), Mike Piazza (New York Mets, $13,571,429),
Randy Johnson (Arizona Diamondbacks, $13,350,000), and Mo Vaughn (Anaheim Angels,
$13,166,667).12
Of these five top earners, the salaries of all – notably except Rodriquez – were
subject to significant state and local income taxes that ranged from about 5 percent (for Johnson)
to roughly10 percent (for Brown, Piazza, and Vaughn). Our estimation results suggest that the
ownership of the teams in states with income taxes had to increase significantly the pre-tax
salaries of these players in order to sign them. In contrast, the Texas Rangers got a relative
bargain in Rodriguez given the absence of any state/local income tax in Texas. Similar
adjustments were necessary for other free agent players.
The basic implication of this tax difference is that there is a competitive edge – a “home
field advantage” – for teams in low-tax areas because they have lower team expenses in signing
free agents to contracts that pay the same after-tax wage to players. After correcting for multiple
tax venues, Florida, Tampa Bay, Texas, Houston, and Seattle may be able to sign free agents at a
salary savings of from 2 to 3 percent relative to other clubs.
This result leads to other implications as well. Because player contracts are assignable in
MLB, clubs in low-tax cities will find it easier to trade players to new teams because those
players will have relatively lower salaries. Trades in baseball are frequently motivated by a
desire to “dump salary”. When the salaries of those players being dumped are lower to begin
with, trades will be easier to negotiate and may bring better terms for low tax cities.
12
See http://sportsillustrated.cnn.com/baseball/mlb/news/2001/04/04/millionares_ap/ .
15
On the other hand, in order to counter an abrupt and undesired change of teams, players
commonly negotiate limited no-trade clauses in their contracts. Whereas these clauses are
commonly thought of as restricting player movement to other clubs that tend to be more
competitive or to clubs in areas with player-desired amenities, it is likely that an examination of
clubs to which players with trade restrictions would allow themselves to be traded would reveal a
disproportionate representation of low-tax cities.
Finally, the salary savings advantage for low-tax franchises will be magnified by the
present “luxury tax” system among teams. In order to maintain competitive balance and slow the
overall growth of salaries, MLB has instituted a system by which teams with the total annual
payrolls above a “threshold” must pay an additional “luxury tax” on all payroll above the limit,
with the tax payments then distributed to teams with the lowest payrolls. Since clubs in high tax
cities find they must pay more for the same players, the luxury tax distorts in favor of teams in
low tax cities. For example, in 2003 (the first year in which the luxury tax was imposed), the
New York Yankees had player salaries that were $67.5 million above the threshold of $117
million. With a luxury tax rate in 2003 of 17.5 percent, the Yankees paid total taxes of $11.2
million. Our estimation results suggest that as much as $7 million of the above-threshold salaries
was due to the existence of state and local income taxes, which implies that over $1 million of
the luxury tax was due to the income taxes. The likelihood that state and local income taxes
contributed to higher player salaries exacerbated the penalty imposed on the Yankees.
In short, free agent salaries are affected at least in part by the existence of individual
income taxes. Players choosing to play in high-tax cities demand – and receive – higher free
agent salaries as compensation. This phenomenon should be recognized in studies of the
16
determinants of player salaries, as well as in the analysis of other aspects of the market for
professional baseball players.13
References
Alm, James and Sally Wallace (2000). Are the rich different? In Does Atlas Shrug? The
Economic Consequences of Taxing the Rich, Joel Slemrod (ed.). New York, NY: Russell Sage
Foundation at Harvard University Press, 165-187.
Bakija, Jon and Joel Slemrod (2004). Do the rich flee from high tax states? Evidence from
federal estate tax returns. NBER Working Paper No. 10645. Cambridge, MA.
Barger, Paul (1999). State taxation of nonresident professional athletes: The need for
Congressional intervention. State Tax Notes, 17 (11) (September 13), 703-709.
Bradbury, John Charles (2007). Does the baseball labor market properly value pitchers?
Journal of Sports Economics, 8 (6), 616-632.
Brown, Kenneth H. and Lisa K. Jepsen (2009). The impact of team revenues on MLB salaries.
Journal of Sports Economics, 10 (2), 192-203.
Fort, Rodney (1992). Pay and performance: Is the field of dreams barren? In Diamonds Are
Forever: The Business of Baseball, Paul M. Sommers (ed.). Washington, D.C.: The Brookings
Institution, 134-160.
Ekmekjian, Elizabeth C. (1994). The jock tax: State and local income taxation of professional
athletes. Seton Hall Journal of Sport Law, 4 (2), 229-252.
Fort, Rodney (2009). Observation, replication, and measurement in sports economics. Journal
of Sports Economics, 11 (1), 3-16.
Fullerton, Don and Gilbert E. Metcalf (2002). Tax incidence. In Handbook of Public
Economics, Volume 4, Alan J. Auerbach and Martin Feldstein (eds.). Amsterdam, The
Netherlands: Elsevier Science B. V. – North Holland, 1787-1872.
Goolsbee, Austan (2000). What happens when you tax the rich? Evidence from executive
compensation. The Journal of Political Economy, 108 (2), 352-378.
Green, Richard E. (1998). The taxing profession of major league baseball: A comparative
analysis of nonresident taxation. Sports Lawyer Journal, 5 (1), 273-301.
Hausman, Jerry (1978). Specification tests in econometrics. Econometrica, 46 (6), 1251-1271.
13
See Fort (2009) for a recent discussion of some of the difficulties of empirical research in sports economics.
17
Hawkins, Richard, Terri Slay, and Sally Wallace. (2002). Play here, pay here: An analysis of state
income taxes on athletes. State Tax Notes, 26 (8) (November 25), 551-555.
Healy, Andrew (2008). Do firms have short memories? Evidence from major league baseball.
Journal of Sports Economics, 9 (4), 407-424.
Hoffman, David K. (2002). State income taxation of nonresident professional athletes. Tax
Notes, 26 (8) (November 25), 1083-1091.
Hsiao, Cheng (1986). Analysis of Panel Data. New York, NY: Cambridge University Press.
James, Bill (1989). This Time Let's Not Eat the Bones. New York, NY: Random House.
James, Bill (2001). The New Bill James Historical Abstract. New York, NY: Simon & Schuster.
James, Bill (2011). The Bill James Handbook. Chicago, IL: ACTA Publications.
Kopkin, Nolan (2011). Tax avoidance: How income tax rates affect labor migration decisions of
NBA free agents. Journal of Sports Economics, forthcoming.
Krautmann, Anthony C. (1999). What’s wrong with Scully’s estimates of a player’s marginal
revenue product? Economic Inquiry, 37 (1), 369-381.
Krautmann, Anthony C., Elizabeth Gustafson, and Lawrence Hadley (2003). A note on the
structural stability of salary equations: Major league pitchers. Journal of Sports Economics, 4
(1), 56-63.
Krautmann, Anthony C. and John L. Solow (2009). The dynamics of performance over the
duration of major league baseball long-term contracts. Journal of Sports Economics, 10 (6), 6-
22.
Noll, G. Roger and Andrew Zimbalist (eds.) (1997). Sports, Jobs and Taxes. Washington, D.C.:
The Brookings Institution Press.
Ringle, Leslie A. (1995). State and local taxation of professional athletes. Sports Lawyer
Journal, 2 (1), 169-181.
Scully, Gerald W. (1974). Pay and performance in Major League Baseball. The American
Economic Review, 64 (6), 915-930.
Solow, John L. and Anthony C. Krautmann (2011). A Nash bargaining model of the salaries of
elite free agents. Journal of Sports Economics, 12 (3), 309-316.
18
Thorn, John, Pete Palmer, and Michael Gershman (eds.) (2004). Total Baseball – The Official
Encyclopedia of Major League Baseball, Eighth Edition. Kingston, NY: Total Sports
Publishing.
White, Halbert (1980). A heteroskedasticity-consistent covariance matrix estimator and a direct
test for heteroskedasticity. Econometrica, 48 (4), 817-838.
Young, Cristobal and Charles Varner (2011). Millionaire migration and state taxation of top
incomes: Evidence from a natural experiment. National Tax Journal, 62 (2, Part 1), 255-284.
Zimbalist, Andrew (1992). Salaries and performance: Beyond the Scully model. In Diamonds
Are Forever: The Business of Baseball, Paul M. Sommers (ed.). Washington, D.C.: The
Brookings Institution, 109-133.
Author Biographies
James Alm is a professor and chair in the Department of Economics at Tulane University. He
has also taught at the Andrew Young School of Policy Studies at Georgia State University in
Atlanta, Georgia, where he served as chair of the department and dean of the school, and at the
University of Colorado at Boulder and at Syracuse University. Much of his research has
examined the responses of individuals and firms to taxation, in such areas as tax compliance, the
income tax treatment of the family, tax reform, social security, housing, and indexation. He has
also worked extensively on fiscal reform projects overseas.
William Kaempfer is a professor in the Department of Economics at the University of Colorado
at Boulder, where he has worked since 1980; he is currently Vice Provost and Associate Vice
Chancellor for Budget and Planning at the university. He specializes in the political economy of
international trade policy, as well as in the impacts of use of salary arbitration by major league
baseball and in other aspects of sports economics.
Edward Sennoga is a professor in the Department of Economics at Makerere University in
Kampala, Uganda; he has also taught at the University of North Texas and at Georgia State
University. He received his Ph.D. in economics from Georgia State University. His research
interests are in the fields of public finance, tax policy, economics of developing countries, and
applied econometrics. He has provided research and technical support to the business
community in Atlanta, Georgia, to Georgia’s Department of Labor, to the Georgia Legislature,
and to Uganda’s National Planning Authority, and has also participated in the African Economic
Research Consortium Collaborative Ph.D. Programme.
19
Table 1. Top Marginal Tax Rate in U.S. State Income Tax in 2001 and 2011
State
Rate (percent)
Number of Franchises, 2001 2001 2011
Arizona 5.04 4.54 1
California 9.30 10.30 5
Colorado 4.63 4.63 1
Florida 0 0 2
Georgia 6.00 6.0 1
Illinois 3.00 5.00 2
Maryland 4.85 5.50 1
Massachusetts 5.60 5.30 1
Michigan 4.20 4.35 1
Minnesota 7.85 7.85 1
Missouri 6.00 6.0 2
New York 6.85 8.97 2
Ohio 7.50 5.925 2
Pennsylvania 2.80 3.07 2
Texas 0 0 2
Washington 0 0 1
Wisconsin 6.75 7.75 1
Source: Tax Foundation, Inc., available online at
http://www.taxfoundation.org/files/state_individualincome_rates-2000-2011-20110302.pdf .
The 2001 tax rates are as of 1 January 2002; the 2011 tax rates are as of 1 January 2011.
20
Table 2. Descriptive Statistics
Variable Mean Standard Deviation
Non-pitchers
Salary ($) 1,730,420 1,747,765
MTR (percent) 6.48 2.61
Experience (years) 10.58 3.53
On Base Percentage-A 0.336 0.051
On Base Percentage-C 0.326 0.042
Slugging Percentage-A 0.403 0.098
Slugging Percentage-C 0.389 0.059
OPS-A 0.742 0.129
OPS-C 0.714 0.085
Batting Average-A 0.266 0.046
Batting Average-C 0.262 0.030
Home Runs-A 7.71 8.12
Home Runs-C 95.30 95.66
RBI-A 37.40 27.73
RBI-C 458.55 341.67
Fielding Percentage-A 0.978 0.023
Fielding Percentage-C 0.973 0.019
Observations-Years 360 ---
Observations-Individuals 201 ---
Pitchers
Salary ($) 2,337,967 2,120,534
MTR (percent) 6.53 2.39
Experience (years) 9.48 3.03
ERA-A 4.43 1.53
ERA-C 4.14 0.79
Wins-A 5.86 4.80
Wins-C 66.25 45.12
Win Loss Average-A 0.513 0.242
Win Loss Average-C 0.527 0.089
Innings Pitched-A 97.74 69.75
Innings Pitched-C 1103.77 692.49
KBB Ratio-A 1.96 0.75
KBB Ratio-C 2.11 1.38
Saves-A 3.70 8.88
Saves-C 42.45 92.55
Observations-Years 267 ---
Observations-Individuals 171 ---
“A” denotes annual measures; “C” denotes career measures.
21
Table 3: Non-Pitchers – Estimation Results
Variable Random Effects Fixed Effects
MTR 24.02**
(2.43)
23.55**
(2.61)
Experience 308.75**
(2.47)
242.17**
(2.66)
Experience Squared -11.32**
(2.36)
-15.33***
(2.96)
OPS-A 1208.23**
(2.40)
1104.02*
(1.69)
OPS-C 6151.27***
(5.02)
1491.11*
(1.92)
Fielding Percentage-A 291.63
(0.69)
32.21
(0.91)
Fielding Percentage-C 716.52
(0.27)
3568.78
(1.35)
Year 1996 -171.26
(0.99)
-67.28
(0.37)
Year 1997 -125.77
(0.59)
-129.85
(0.36)
Year 1998 -296.82
(1.61)
-286.91
(0.58)
Year 1999 -283.22
(1.37)
-376.70
(0.36)
Year 2000 199.54
(1.63)
1460.01
(0.82)
Year 2001 -41.71
(0.46)
-371.67
(0.39)
Constant -4799.28*
(1.79)
-5279.35*
(1.97)
Observations 360 360
Number of Individuals 201 201
R-squared 0.36 0.47
Robust standard errors are in parentheses.
* significant at 10%; ** significant at 5%; *** significant at 1%
22
Table 4: Pitchers – Estimation Results
Variable Random Effects Fixed Effects
MTR 19.77*
1.84
21.36**
(2.34)
Experience -168.69
(1.19)
-272.13
(0.72)
Experience Squared -8.50
(0.64)
7.75
(0.59)
ERA-A 189.81***
(3.11)
149.04**
(2.41)
Wins-A 177.11***
(4.27)
117.188**
(2.27)
Wins-C 126.20***
(6.85)
88.67***
(2.75)
WinLoss Average-A -1117.91***
(2.71)
-1206.16*
(1.82)
Innings Pitched-A 12.52
(0.20)
8.53*
(1.99)
KBB Ratio-C 178.58*
(1.88)
113.80*
(1.94)
Saves-A 49.49***
(3.32)
53.16*
(1.94)
Year 1996 -99.08
(0.08)
-101.11
(0.11)
Year 1997 -127.85
(0.38)
-149.23
(0.19)
Year 1998 -328.21
(0.99)
-256.19
(0.17)
Year 1999 454.64***
(3.03)
404.46
(0.23)
Year 2000 601.11***
(4.58)
423.01**
(2.41)
Year 2001 128.45***
(5.41)
527.87
(2.14)*
Constant 2210.30**
(2.09)
2417.25**
(2.41)
Observations 267 267
Number of Individuals 171 171
R-squared 0.52 0.33
Robust standard errors are in parentheses.
* significant at 10%; ** significant at 5%; *** significant at 1%

23
Table 5: Sensitivity Analysis
Variant Non-pitchers Pitchers
1. Linear Variant
MTR 23.55**
(2.61)
21.36**
(2.34)
2. Quadratic Variant
MTR 4.79**
(2.56)
3.94**
(2.77)
MTR Squared 11.43*
(1.88)
9.03**
(2.49)
3. Log-linear Variant
MTR 0.03*
(1.79)
0.02**
(2.46)
4. Log-log Variant
Ln MTR 0.66**
(2.93)
0.51**
(2.31)
Coefficient estimates from a fixed effects regression are reported with robust standard errors in
parentheses.
* significant at 10%; ** significant at 5%; *** significant at 1%