Barriers to growth report
17
01 Overcoming Barriers to Growth How the Nonprofit Sector Can Move From the Foothills to the Mountain Peaks
-
Upload
donorvoice -
Category
Government & Nonprofit
-
view
161 -
download
0
Transcript of Barriers to growth report

01
Overcoming Barriers to Growth
How the Nonprofit Sector Can Move From the Foothills to the Mountain Peaks
02
s
Overview The non-profit sector has grown rapidly if measured by the number of organizations. Alas, it is also shrinking by the more meaningful measure of private giving as a share of national income; on this score it is down 11%.
A smaller pie and more mouths to feed is a recipe for disaster and yet, status quo thinking and activity dominate within organizations. The growth curve can be bent but only with a willingness to do business much differently.
In the realms of computer science, operations research and management science lives the world of mathematical optimization, conceptually a very simple concept, with the purpose of finding the best approach from a set of available alternatives.
This definition could just as easily be applied to fundraising strategy, and even life. There is however one insidious concern with optimization; what if the set of alternatives we are optimizing or choosing amongst is not complete? What if we have unintentionally omitted the best alternative from consideration? Unknowingly the “optimum” isn’t optimum at all, merely the best of our not- so- best options.
Mathematicians call this “local optimization” versus “global optimization” with the former representing identification of a “winner” among a set of choices that does not include the overall (or global) best choice.
This global versus local phenomenon is very useful when conceptually considering the lack of growth in non-profit fundraising and how to fix it.
What growth problem you ask? Look no further than the DMA Nonprofit Federation’s decision to hold a “Summit” among nonprofit leaders entitled, “Overcoming Barriers to Growth”. As proof of the need for
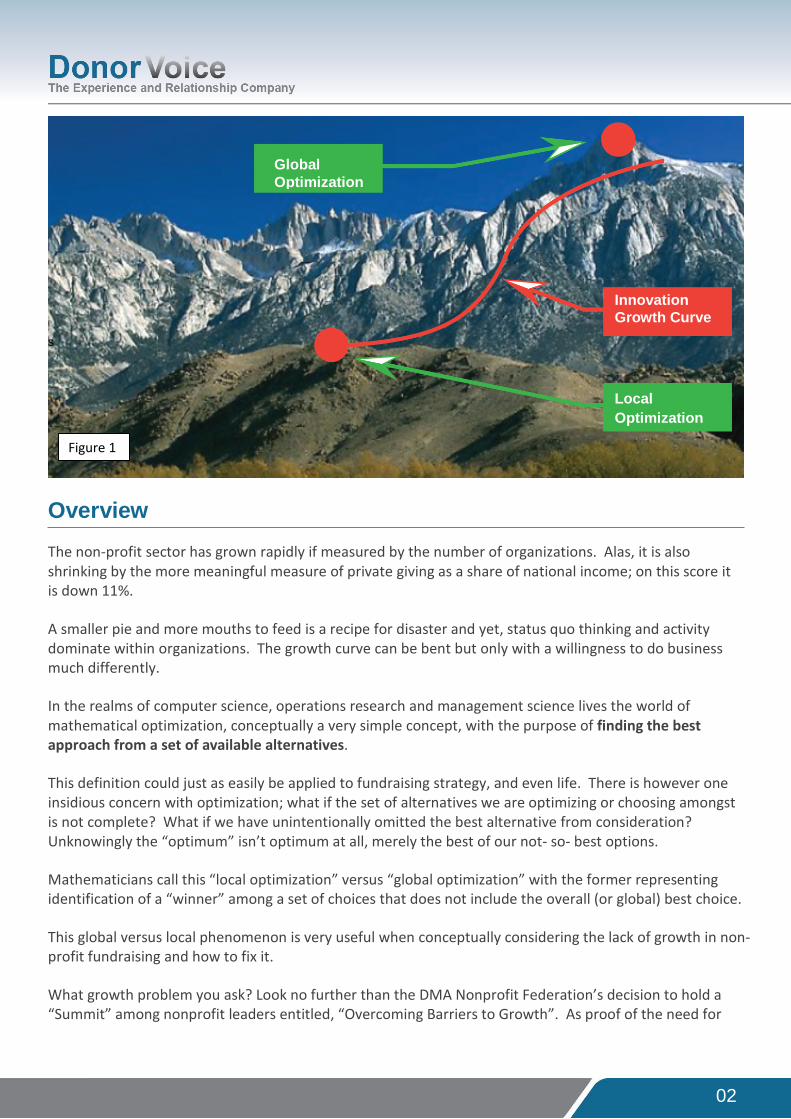
Global Optimization
Innovation Growth Curve
Local Optimization
Figure 1

03
such an event they cite well-established statistics pointing out the share of national income going to charities is down 11% while the number of charities chasing this smaller pie is up 47%.
A useful analogy for the growth conversation is that of comparing foothills and mountain peaks. The former representing local optimization and the latter, global. The only real growth comes from moving from a locally optimized way of doing business to a global one.
The purpose of this paper is to substantiate three main takeaways:
1) Nonprofits are, by and large, living in the foothills spending lots of time and effort trying to optimize with an approach to doing business that offers no sustained growth potential – i.e. there is a local optimization problem.
2) The only way to grow is with a very different approach to doing business – global optimization - and the upside is two to four times current income but only for first-movers.
3) There are three strategic alternatives (i.e. explicit choices) for every charity to consider – let’s label them “Head Down”, “Finger in the Air” or “Climb Mountain”. – and one of them is staying put in the foothills but doing it more efficiently.
It is worth noting as a final introductory comment that the growth curve when moving from local to global optimization is the exact same curve experienced by those bringing new innovations to the market -- the familiar, flattened “S” shape (figure 1) . The process unfolds as follows: slow growth to start as the changes in mindset, methods and metrics required for global optimization becomes more ingrained. This phase is followed by massive growth and then a natural flattening but only after reaching the summit.
As figure 2 suggests, only about 15% of the market – the Innovators and Early Adopters – will be first movers in this new way to do business, but their growth will be massive. The rest are followers to varying degrees. This reality means the majority of charities are best served selecting the “Head Down” strategy—staying put in the foothills never to reach the peak, but maintaining their lower position with greater efficiency.
Innovators 2.5%
Early Adopters
13.5%
Early Majority
34%
Late Majority
34%
Laggards Majority
16%
Figure 2

04
Living in the Foothills Non-profit strategic planning, fundraising and marketing tends to live in the foothills. For a lot, dare we say most, of the big charities, they are locally optimized.
Within the relative world of best practices, A/B testing of incremental changes, strategy by spreadsheet and internal white board sessions their world is as good as it will get. In fact, the way to stay at the top of this locally optimized place is to stop the incremental changes since they only cause the organization to slip (albeit a small amount) from the locally optimized perch at the top of the foothill when you factor in all the time and cost and the reality that for every “winning”, campaign level test there are far more losing ones. And every losing idea that wasn’t ‘breakthrough’ or innovative in the first place costs money; both hard cost and opportunity cost.
There are three organizational characteristic categories – mindset, methods, metrics – to describe a non-profit that is running its business in the foothills and similarly, to describe and distinguish those from the very few living (or at least climbing) on the mountain peaks.
Mindset
• No theory or point of view on how world works
• Territorial or zero-sum mentality among staff and partners
• Accepts status quo
• Thinks doing same thing in a new channel is innovation
• Senior leadership is not demanding change
• Is interested in new as long as it is proven
• Thinks can fill leaky bucket fast enough and invests little or nothing in retention
• Believes donors are born, not created

05
Methods • Treats channel as strategy
• A/B testing of incremental changes
• Only uses transactional data
• Focused on correlation, not causation
• Efficiency over effectiveness
• Strategy by spreadsheet
• Tomorrow’s plan looks like yesterday’s
• Organized by functional area
• Using same old team or replaces existing team with clone
• Internally generated ideas
Metrics • Campaign level
• Highest Previous Contribution, Most Recent Contribution
• Response rate viewed as highly important
• Average gift used as a basic measure of success
We need look no further than how strategy is typically thought of today as the (not so) shining example of local optimization and the need for change.
Strategy for the charity living in the foothills quickly devolves into a spreadsheet exercise. The larger the spreadsheets, the more confident the local optimization organization is in its process. All those numbers and data feel analytical, even scientific.
So why do managers and those on the front lines responsible for executing the “strategy” tend to dread the annual strategic planning ritual? Why does it consume so much time and have so little impact on organizational actions? The reason; those people responsible for delivering on the plan recognize the process as it exists today does not produce novel strategies.
Instead, it perpetuates the status quo.
But, if the alternative is ideation sessions and off-site retreats to come up with radical, big new ideas then these same managers and directors make the right choice in sticking with the process that at least produces some short term comfort versus the 1 day of talking with no action.

06
The short term comfort (along with a certain amount of resignation) lasts until the returns start coming in and we see – to nobody’s actual surprise - that revenue is not as predictable as Excel would lead us to believe – though the costs are dead on.
So what is the alternative? What does strategy look like if an organization is attempting to globally optimize its world? For starters,
• Strategy is about forcing a choice, stating what the organization is and is not doing.
• It is about making assumptions and explicit choices and outlining both – BRIEFLY – in 1 page, 2
maximum.
• If your strategy document is more than 2 pages then there is a 99.9% it isn’t a strategy at all. It is a
planning and forecasting and prognosticating exercise to deliver short term comfort. It is also
almost certainly a document that looks radically similar to last year.
• A strategy is clear, concise and focused. Just like good copy.
• Strategy is about making small bets with the explicit choices made and not made and the associated
assumptions spelled out.
• With a solid articulation of the 2 (or 3 max) choices available to solve a problem (e.g. falling
retention rates, lousy uptake with monthly giving offer) or achieve a goal and equally solid
articulation of the assumptions that must be true for either choice to work then we increase our
chance of success.
• Evaluate those assumptions and determine which set best fits with what you do well, is most likely
to be true and then make a choice. This will greatly increase chances of success.
• Increasing our chance of success is not the same as reducing risk
• It is about turning left or right and not believing we can do both at the same time.
• It is about monitoring performance of the small bet and modifying course or abandoning it all
together.
• Contrary to popular wisdom, strategy is not about first failing a whole lot. That is called failing.
• If there is no risk, there is no strategy. If you feel comfortable, there is no a strategy.
07
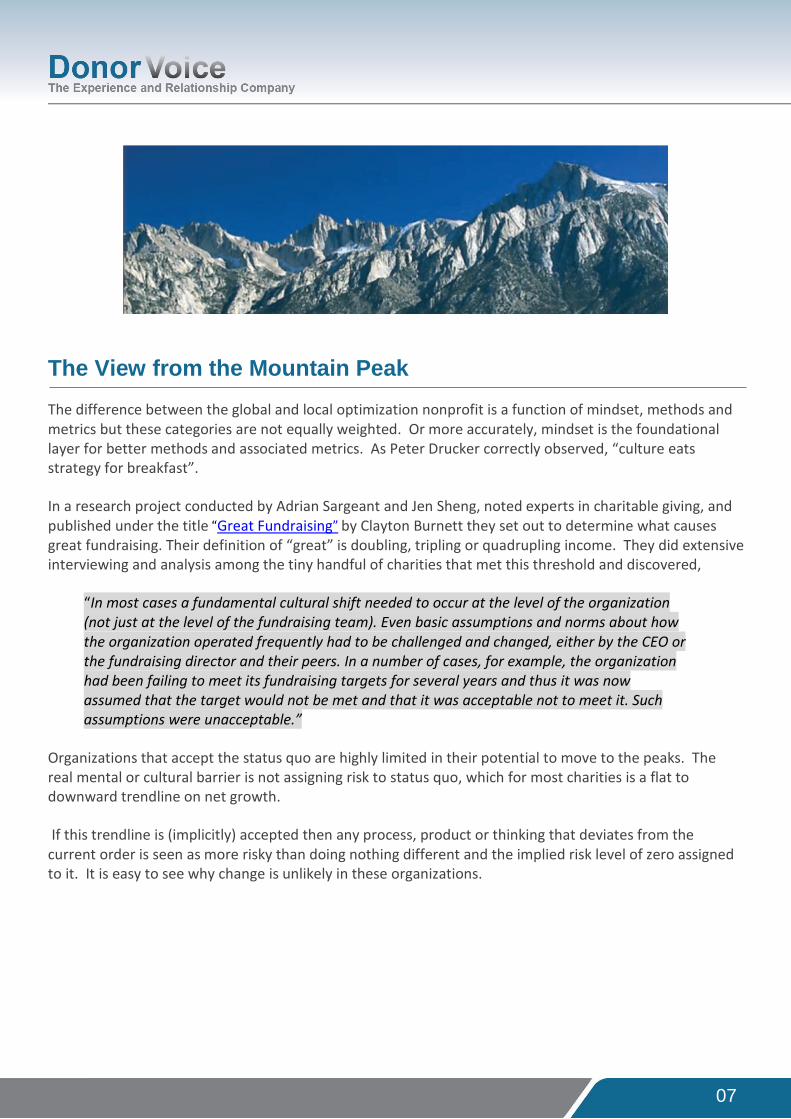
The View from the Mountain Peak The difference between the global and local optimization nonprofit is a function of mindset, methods and metrics but these categories are not equally weighted. Or more accurately, mindset is the foundational layer for better methods and associated metrics. As Peter Drucker correctly observed, “culture eats strategy for breakfast”.
In a research project conducted by Adrian Sargeant and Jen Sheng, noted experts in charitable giving, and published under the title “Great Fundraising” by Clayton Burnett they set out to determine what causes great fundraising. Their definition of “great” is doubling, tripling or quadrupling income. They did extensive interviewing and analysis among the tiny handful of charities that met this threshold and discovered,
“In most cases a fundamental cultural shift needed to occur at the level of the organization (not just at the level of the fundraising team). Even basic assumptions and norms about how the organization operated frequently had to be challenged and changed, either by the CEO or the fundraising director and their peers. In a number of cases, for example, the organization had been failing to meet its fundraising targets for several years and thus it was now assumed that the target would not be met and that it was acceptable not to meet it. Such assumptions were unacceptable.”
Organizations that accept the status quo are highly limited in their potential to move to the peaks. The real mental or cultural barrier is not assigning risk to status quo, which for most charities is a flat to downward trendline on net growth.
If this trendline is (implicitly) accepted then any process, product or thinking that deviates from the current order is seen as more risky than doing nothing different and the implied risk level of zero assigned to it. It is easy to see why change is unlikely in these organizations.

08
Mindset
• Realizes big change is only scary if it ignores risk of status quo
• Creating mindset that status quo is not ok
• Fears the organization is living in foothills
• Looks for subject matter experts, not “turn-key” generalists
• Is continually demanding better and better
• Knows strategy is about turning left OR right
Method • Lets donor needs dictate strategy
• Getting out of incremental testing business
• Developing hypotheses
• Links attitudinal data to transactional
• Separates “what we think” from “what we know”
• Builds teams who are not zero sum thinkers
• Realizes “big” change is only seen as ”big” from the foothills
• Moves quickly
• Collects and acts on donor feedback at key interaction points
Metrics • Steers by longer term metrics, understands the dangers and limitation campaign level focus
• Lives and acts by leading not lagging indicators

09
So what does it look like from the mountaintops? Here are two illustrations.
NSPCC Case Study (per the research project conducted by Adrian Sargeant and Jen Sheng, noted experts in charitable giving, and published under the title “Great Fundraising” by Clayton Burnett)
The National Society for the Prevention of Cruelty to Children (NSPCC) is a very large charity in the United Kingdom. At the turn of the millennium they launched a campaign (“Full Stop”) with the goal of raising £250 million pounds (roughly $419 million dollars). During the first phase they raised half the total, £125 million, more than twice the size of any comparable effort in the history of UK fundraising.
However, the revenue started to flatten and little more was raised for about 2 years between 2002 and 2003. This represented a significant barrier to growth. There were many observers – internally and externally – arguing the campaign had reached a “natural” saturation point. Surely this was sufficient, right? Enormous success by any historical measure and it running out of ‘energy’ was to be expected.
The local optimization organization would surely have let this campaign wither on the proverbial vine and likely resort to a myriad of incremental, package level changes that only serve to take up time, hard cost and opportunity cost and deliver no breakthrough results.
What was required was a change in mindset to lead to a new approach and a way to reinvigorate the internal team. The fundraising director sums up the new thinking that led to a new way to organize and ultimately, raise the second half – the other £125 million.
“And the thing that was fundamental was, people were saying, what did you do with the money? They wanted to know exactly how their money was being used. And for us - we’d previously been organizing ourselves by how you reach people – segments and so forth - and that obscured how the money was used. We’d missed something. And what we’d missed was that there was a better way of getting to people, designing the approach to talk to groups of people who were passionate about the same thing!” “I was at home considering this and I thought that’s profound. Rather than building teams around our sectors, corporate, regional, sport etc; could we build teams around our programmes.” “So we built a volunteer team raising money for our helpline, a volunteer team raising money for our treatment programmes, overall we built another group of (6 or 7) what we called project focused teams. And then we went back to the same principle we’d adopted previously: strategy then structure, form follows purpose. So we would aim to raise money for programmes, build our teams around the programmes, and have the volunteer and importantly the staff structure follow that strategy. We reorganised our staff teams in the same way to retain the staff/leadership mirror.”
The part of the answer that lies in employing donor input to provide the necessary new thinking it not coincidental. One of the significant markers of a global optimization organization is looking outward versus inward to develop new ideas and testable hypotheses.

010
As demonstrable proof of the need for constituent input versus exclusive reliance on transactional data (local optimization) or worse, internally derived and subjective input, consider the Norwegian Cancer Society and their “radical” (from the foothills vantage point) website redesign.
The following excerpts from the Agitator blog and its Editor, Roger Craver (you can find the full Agitator post, here) provide a good and entertaining summary.
Excerpts from the Agitator:
WAGER: I’m betting there’s no more than one out of every 10,000 nonprofits in the world with the guts or patience to follow the process I’m about to report. It’s donor-centric but also so very, very counter-intuitive to what most fundraisers would do if they were in charge of re-making a website. I’m pretty certain (sadly) my bet is a sure thing.
Please prove me wrong. Because, if you implement this process you’ll likely see:
• A 250% increase in revenue from your website;
• A 90% increase in monthly donors; and …
• A 150% + increase in folks willing to register or signup for more information and engagement.
The Norwegian Cancer Society and a user-consulting firm witness…convinced they weren’t realizing the potential of the web for fundraising and public education set out on the task to remake their website. They drew up a list of 70+ ‘tasks’ they thought the website performed. Then they asked actual website users to vote on what features were the most important to them. Here’s what they found in order of user priority: Top Tasks: 1. Treatment 2. Symptoms 3. Prevention 4. Research Tiny Tasks at the bottom of the priority list: 1. Donations 2. Gifts 3. Annual report 4. Press releases

011
That’s right. Out of 70+ tasks, users voted ‘donations’ as about the 66th most important priority.
So … fighting a tidal wave of denial, the group met again, discussed the finding and agreed (there was a lot of gnashing of teeth, lest I over-simplify this stage) they would remake the website to reflect the users’ priorities.
I reached Beate Sørum, head of Digital Fundraising for the Society, and we had a great chat.
Here’s how Beate summarized this marvelous and extraordinary adventure:
• In trying to get more donations, the traditional approach would be to devote much of the space on the homepage and other major pages to asking for donations.
• The logic goes that the less attention people are paying the harder we have to work to
attract it. And that is in fact how the old homepage for the Cancer Society looked. It had lots of banner ads asking for donations and support.
• The new approach is very different. It now focuses on helping people get the information
they need (treatment, symptoms, research) as quickly as possible. There are no banner ads for donations.
• This is true customer-centric design — putting the needs of the customer front and center. In appropriate places, such as on research pages, there are carefully phrased requests for donations. Why? Because if someone is reading about research, then it is appropriate to ask them in that context.
“So Beate”, your intrepid Agitator asked, “How has this worked out for you?”
• Year over year comparisons of giving on the old website versus the new find the new producing 200% and possibly more than the old. (The exact increase will be known when all year-end gifts are tallied.)
• An 88% increase in monthly (sustainer) contributions.
• Average gift is up and, even more significantly, the conversion rate (web browsers to web
donors) is up. Conversion rates from their Christmas appeal were 13% overall … 10% by mobile … 17% by tablet … 13% by desktop.
As Craver surmised, very few charities operating at the locally optimized foothills would undergo such seemingly radical change and yet, it is required for real growth of the 250% variety. The risk is only too high if a ‘do-no-harm’ mindset assumes status quo is not violating this precept already.
012
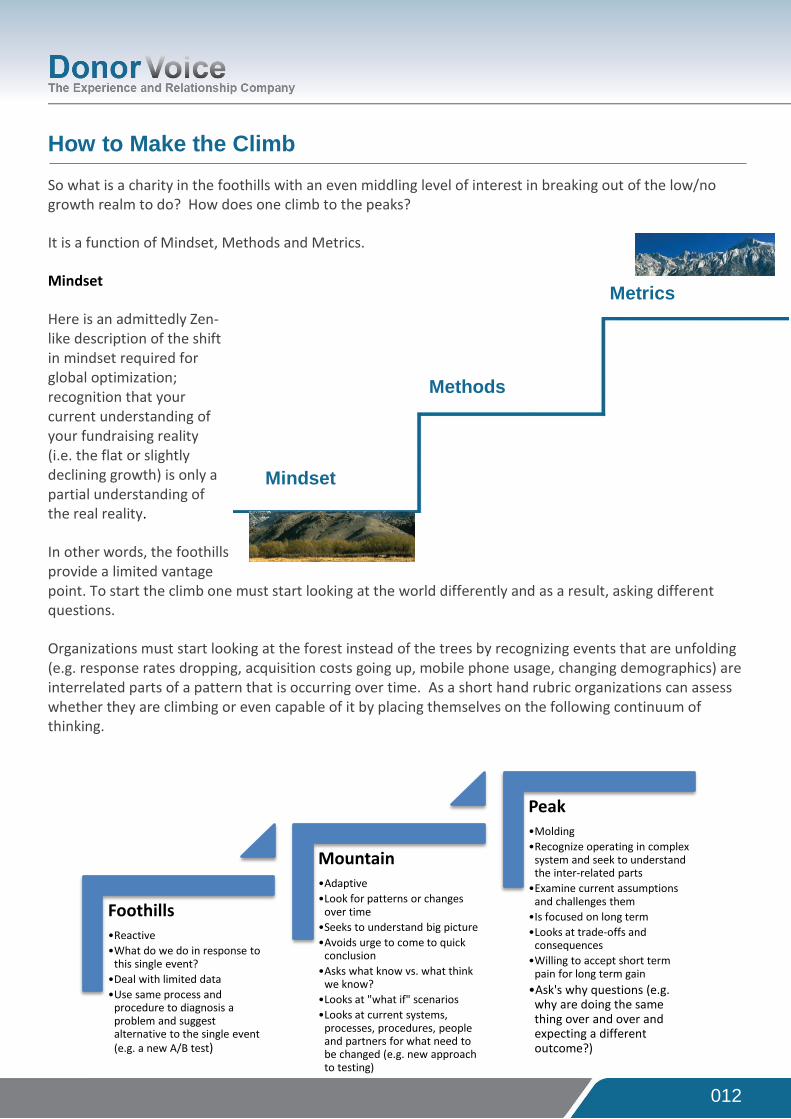
How to Make the Climb So what is a charity in the foothills with an even middling level of interest in breaking out of the low/no growth realm to do? How does one climb to the peaks?
It is a function of Mindset, Methods and Metrics.
Mindset
Here is an admittedly Zen-like description of the shift in mindset required for global optimization; recognition that your current understanding of your fundraising reality (i.e. the flat or slightly declining growth) is only a partial understanding of the real reality.
In other words, the foothills provide a limited vantage point. To start the climb one must start looking at the world differently and as a result, asking different questions.
Organizations must start looking at the forest instead of the trees by recognizing events that are unfolding (e.g. response rates dropping, acquisition costs going up, mobile phone usage, changing demographics) are interrelated parts of a pattern that is occurring over time. As a short hand rubric organizations can assess whether they are climbing or even capable of it by placing themselves on the following continuum of thinking.
Metrics
Methods
Mindset
Foothills •Reactive •What do we do in response to
this single event? •Deal with limited data •Use same process and
procedure to diagnosis a problem and suggest alternative to the single event (e.g. a new A/B test)
Mountain •Adaptive •Look for patterns or changes
over time •Seeks to understand big picture •Avoids urge to come to quick
conclusion •Asks what know vs. what think
we know? •Looks at "what if" scenarios •Looks at current systems,
processes, procedures, people and partners for what need to be changed (e.g. new approach to testing)
Peak •Molding •Recognize operating in complex
system and seek to understand the inter-related parts
•Examine current assumptions and challenges them
•Is focused on long term •Looks at trade-offs and
consequences •Willing to accept short term
pain for long term gain •Ask's why questions (e.g.
why are doing the same thing over and over and expecting a different outcome?)
013
Methods
This is a catch all for methodologies, processes and approaches to doing business. There are too many examples and too much detail for each to be overly expansive in this document. Therefore, what follows is a non-exhaustive, summary list of Methods for the global optimization organization.
• Collecting attitudinal data to answer questions of need, motive and preference. • Data linkage to connect attitudinal data to transactional for holistic models • Adding “voice of the customer” feedback loops to events/interactions and using that feedback to
dictate mitigation and upsell/cross-sell opportunities. • Hypothesis testing instead of random “mining” for correlations, which exist in abundance with most
being meaningless • Separating budget from strategy. • Having strategy that involves more risk as the two are inseparable if actually doing the former
(most organizations by extension are not doing strategy at all) • Reorganizing based on donor needs and real segments (versus internally derived ‘segments’ that
add no value to the donor or the organization) instead of functional area of expertise • Kill the annual budget process and replace it with rolling forecasts. The former takes far more time,
is too expensive and detailed, doesn’t contribute significantly to corporate strategy, stifles innovation, demotivates employees, and promotes unethical behavior by driving people “to meet the numbers at almost any cost.”
• Shifting to best in breed partnerships instead of “full-service” and “turn-key”
There is evidence in the academic literature that strong systems and processes can trump talent – to a point. Therefore, organizations only setup for local optimization today can start to adopt the methods of the global optimization organization and begin a slow but meaningful climb.
Metrics
This section is best summed up by pointing out that local optimization organizations focus almost exclusively on campaign metrics (i.e. response rate and average gift) and acquisition over retention. The campaign metric obsession is made worse in that it arguably drives most if not all of what passes as “strategy” for many local optimization organizations – namely internally generated, incremental change ideas that get A/B tested to try and improve a control that is the control by default (i.e. it is locally optimized too). It leads to no sustainable growth and as previously pointed out, actually creates net loss when factoring in the ratio of winners to losers and the time and effort to generate the former along with the opportunity cost.
In short, what gets measured gets managed.
Beyond pointing out that lifetime value, revenue growth at the individual donor level and retention rates are the metrics of choice for those living in the mountain peaks it is worth sharing one simple way to recast acquisition results in a way that may help change what (or how it) gets managed.
Instead of leaving acquisition reporting in a completely artificial silo why not tie it to the retention requirement to actually make money from the investment?

014
A simple illustration:
• 1,000 donors are acquired from a 100,000 piece mailing (a 1% response rate). • Drop 700 of them because history shows that’s how many won’t give in Year 2. • Next, take the total money spent on acquisition, say $75,000, and deduct the money raised, say
$20,000 with an average gift of $20. • Finally, divide the net loss ($55k in this example – 75k – 20k) by the number of donors who will
remain in Year 2 (300).
To break even on this acquisition mailing, the organization needs to raise $183.33 from each of the 300 donors you acquired. Some organizations do break-even analysis to come up with a number of months until the acquisition loss is recouped. Setting aside the errors often made in this calculation the dollar figure per donor approach may cause the organization to ask better and different questions such as:
• What fundraising plan for a single donor will raise $183 over the next two years? • What assumptions have to be correct for this plan to deliver? • Do those assumptions still hold? • How can the plan change to raise this money in 12 months? • What if it takes three years and not two (or 1)? What are the consequences? • Can the 1, 2 or 3 year plan be scaled at volume?
There are two cautionary tales in this pursuit of global optimization amounting to the modern day equivalent of sirens on the cliff tempting Odyessus in Homer’s The Odyssey. Odyessus, like the organization seeking global optimization, is intellectually curious. And the sirens of Greek mythology promised gifts of wisdom and knowledge much like the modern day equivalents claiming to be the answer to ascending the mountain. Two to be on the lookout for are,
• “Big data” and analytics. As we acquire more data, we have the ability to find many, many more statistically significant correlations. Most of these correlations are spurious and provide false understanding of a situation. This “falsity” grows exponentially the more data we collect. The haystack gets bigger, but the needle we are looking for is still buried deep inside.
If your organization is appending external data to the house file and slicing and dicing to find differences in historical responders and non-responders then rest easy; you will find those differences and plenty of them. Chasing this falsity or noise with test ideas is expensive, time consuming and a recipe for failure as you invariably slip and slide up and down the foothill guided by an endless set of meaningless differences emerging from all that big data. Without a theory and point of view to guide your “big data” efforts you should prepare to crash into the cliffs.
• Mistaking channel for strategy. The allure of “multi-channel” as the cure and path to the peaks is appealing. It is startlingly simple – start pushing stuff out in two or 3 (or 4) channels, get folks to respond in more than one and declare victory. After all, donors who donate in more than one channel are worth more. This is unfortunately all “effect” thinking, not “cause and effect” thinking and if it were this simple you’d be globally optimized already.
015
How to Make the Climb So where does this leave us? What are the strategies for thinking about local versus global optimization? Here are three alternatives. They are mutually exclusive and require the organization to climb fast, slow or not at all. The choices presented allow for only one choice to be made.
• Head Down o Reduce cost/headcount o Few tests/no tests o Raise price point marginally
This strategy is about being cost effective while deciding to stay locally optimized. Roughly half the market fits here. This is not an indictment or judgment, merely the recognition of the reality that Lake Wobegon does not exist in the nonprofit world.
• Finger in the Air o Lead with method o Let in-market change drive mindset change o Skunk-works projects with the likely small number of staff willing to press for something
meaningfully different.
Approximately one-third of the market will or should make this choice. It is a slower climb but a climb toward the peak nonetheless.
• Climb Mountain o Team is on board or prepared to change (quickly) o Raising expectations o Status quo is not acceptable o Have big goals o Right leadership team in place (likely a new team)
As a cautionary and pragmatic note we remind the reader of the innovation curve and the distribution of charities along it with roughly only 15% of the market being likely “Climb the Mountain” candidates.
And for those who think they might be in the 15% we end with a reminder of just how important the mindset piece really is by referring back to the Sargeant and Shang paper and a quote from the leader of the charity that made history with the successful campaign (yes, one campaign) to raise £250 million (approx. 420 million dollars).

016
All the leaders of the charities studied by Sargeant and Shang (“Great Fundraising”) acknowledged the culture of the organization when they started could never achieve the desired (and achieved) growth. In short, their thinking was tied up in local optimization based on the current ways they did business. It required a fundamental shift and beyond just the fundraising team. The expectations needed to be raised about what was possible, it required new talent with more original thinking, greater flexibility, a desire to move fast, take risks and foster a culture of shared learning that also encourages critical debate.
To quote directly from the report and one of the interviewees,
“… it is a culture of change, it’s about describing the existing culture and it’s building a narrative towards what it might look like. So, whether that’s a hill to climb an enemy to beat, you know, you’ve got to have a vision if you like, for how things can be different, so that people will come with you on that journey. You need to do that with the people below you, so that they feel enthusiastic and get behind you; but you also need to do that with the people in front of you and above you, in order to get their buy in, to give you the tools, the investment, and not to put barriers in the way that would prevent you from doing that.”
“We just started to change the culture into a culture that moved much quicker. I think people that are able to work in a setting that is quite fast paced, they’re comfortable with a fairly high degree of change. They enjoy being a part of it. It’s not just that they’re subject to it. They want a high degree of personal autonomy or want empowerment, will take some risks and are usually energetic, just personally energetic.”

017
DonorVoice The Experience and Relationship Company
Contact us: Kevin Schulman, Partner,
Josh Whichard, Partner [email protected]
Phone: 202-246-9649 www.thedonorvoice.com