Barrier Immune Radio Communications for Demand Response · Barrier Immune Radio Communications for...
52
LBNL-2294E Barrier Immune Radio Communications for Demand Response F. Rubinstein, G. Ghatikar, J. Granderson, D. Watson Lawrence Berkeley National Laboratory P. Haugen, C. Romero Lawrence Livermore National Laboratory February 2009
-
Upload
nguyenxuyen -
Category
Documents
-
view
218 -
download
2
Transcript of Barrier Immune Radio Communications for Demand Response · Barrier Immune Radio Communications for...

LBNL-2294E
Barrier Immune Radio Communications for Demand Response
F. Rubinstein, G. Ghatikar, J. Granderson, D. Watson
Lawrence Berkeley National Laboratory
P. Haugen, C. Romero
Lawrence Livermore National Laboratory
February 2009

DISCLAIMER
This document was prepared as an account of work sponsored by the United States Government. While this document is believed to contain correct information, neither the United States Government nor any agency thereof, nor The Regents of the University of California, nor any of their employees, makes any warranty, express or implied, or assumes any legal responsibility for the accuracy, completeness, or usefulness of any information, apparatus, product, or process disclosed, or represents that its use would not infringe privately owned rights. Reference herein to any specific commercial product, process, or service by its trade name, trademark, manufacturer, or otherwise, does not necessarily constitute or imply its endorsement, recommendation, or favoring by the United States Government or any agency thereof, or The Regents of the University of California. The views and opinions of authors expressed herein do not necessarily state or reflect those of the United States Government or any agency thereof or The Regents of the University of California.

i
Acknowledgements
The authors are grateful for the support of individuals who contributed to this project. Special thanks to the project manager, Gaymond Yee, and CEC consultant Ron Hofmann for their continued support of this project. The authors also thank Mary Ann Piette of Lawrence Berkeley National Laboratory’s (LBNL) Demand Response Research Center (DRRC) and Farid Dowla and Ken Masica of Lawrence Livermore National Laboratory (LLNL). The work described in this report was a collaboration of the LBNL and LLNL and funded by the California Institute of Energy and Environment’s (CIEE) Demand Response Emerging Technologies Development (DRETD) Program, under Work for Others, and by the U.S. Department of Energy under Contract DE-AC02-05CH11231. This project could not have been completed without the cooperation of the Molecular Foundry building’s Gilbert Torres and Rick Kelly.

ii

iii
Table of Contents
Abstract.................................................................................................................................................viiExecutive Summary............................................................................................................................11.0 Introduction................................................................................................................................5
1.1. Background and Overview.......................................................................................51.2. Project Objectives .......................................................................................................7
2.0 Methodology ..............................................................................................................................112.1. Technical approach....................................................................................................11
2.1.1. Remcom WirelessInsite™ Software.......................................................142.2. Test Site for RF Measurements.................................................................................142.3. Field Testing ...............................................................................................................17
2.3.1. First Field Test...........................................................................................182.3.2. Second Field Test......................................................................................19
2.4. Data Analysis..............................................................................................................213.0 Results .........................................................................................................................................23
3.1. Narrowband 900 MHz Results.................................................................................243.2. Narrowband 2.4 GHz Results ..................................................................................273.3. Comparison of 900 MHz and 2.4 GHz Performance ............................................293.4. RF Simulation Results ...............................................................................................313.5. Repeater Coverage Improvements..........................................................................32
3.5.1. Impact of Repeaters on 900 MHz Performance ...................................333.5.2. Impact of Repeaters on 2.4 GHz Performance .....................................34
3.6. Ultra-Wideband Results............................................................................................354.0 Discussion ...................................................................................................................................37
4.1. Ultra-Wideband .........................................................................................................374.2. Optimizing Coverage for DR Applications............................................................374.3. Extending Results to Other Sites .............................................................................37
5.0 Recommendations and Future Directions .............................................................................396.0 Conclusions ................................................................................................................................407.0 References ...................................................................................................................................42

iv
List of Tables
Table 1. Data communication and IEEE standards for major wireless technologies......................12
Table 2. 900 MHz wireless technology core specifications .................................................................13
Table 3. 2400 MHz Zigbee wireless technology core specifications ..................................................13
Table 4. UWB wireless technology core specifications........................................................................13
Table 5. Wireless technologies used in the study.................................................................................14
Table 6. Test site building characteristics ..............................................................................................15
v
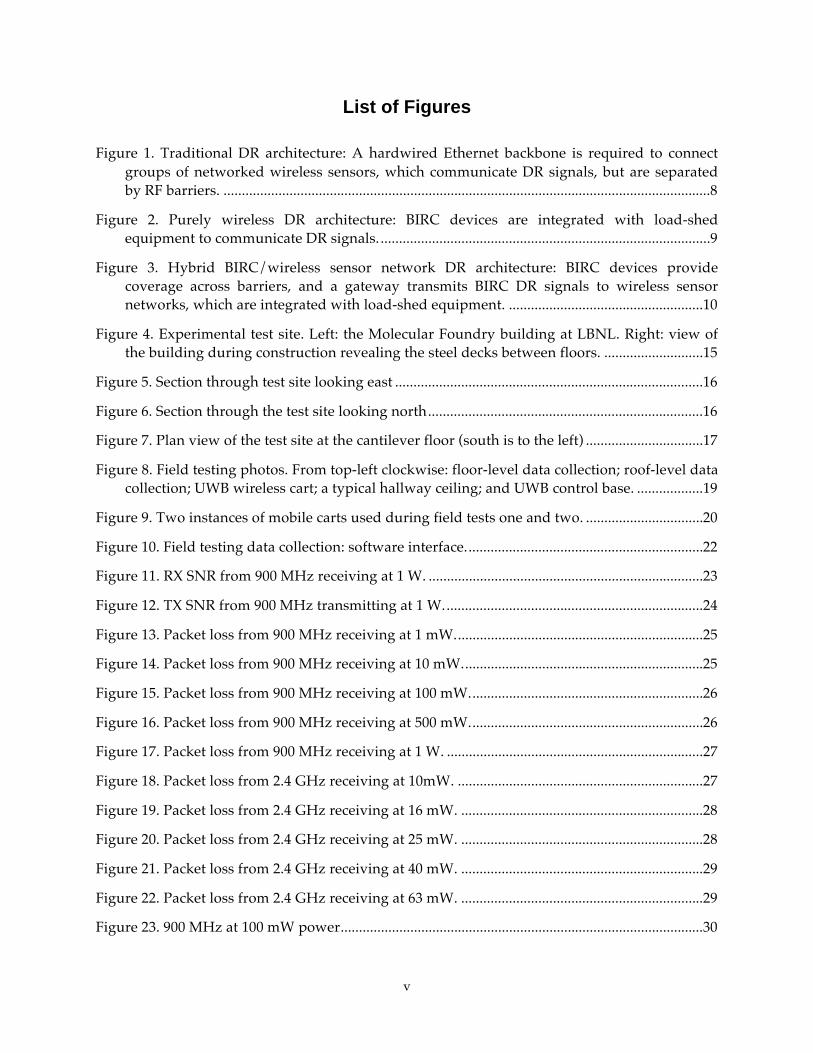
List of Figures
Figure 1. Traditional DR architecture: A hardwired Ethernet backbone is required to connect groups of networked wireless sensors, which communicate DR signals, but are separated by RF barriers. .....................................................................................................................................8
Figure 2. Purely wireless DR architecture: BIRC devices are integrated with load-shed equipment to communicate DR signals. ..........................................................................................9
Figure 3. Hybrid BIRC/wireless sensor network DR architecture: BIRC devices provide coverage across barriers, and a gateway transmits BIRC DR signals to wireless sensor networks, which are integrated with load-shed equipment. .....................................................10
Figure 4. Experimental test site. Left: the Molecular Foundry building at LBNL. Right: view of the building during construction revealing the steel decks between floors. ...........................15
Figure 5. Section through test site looking east ....................................................................................16
Figure 6. Section through the test site looking north...........................................................................16
Figure 7. Plan view of the test site at the cantilever floor (south is to the left) ................................17
Figure 8. Field testing photos. From top-left clockwise: floor-level data collection; roof-level data collection; UWB wireless cart; a typical hallway ceiling; and UWB control base. ..................19
Figure 9. Two instances of mobile carts used during field tests one and two. ................................20
Figure 10. Field testing data collection: software interface.................................................................22
Figure 11. RX SNR from 900 MHz receiving at 1 W. ...........................................................................23
Figure 12. TX SNR from 900 MHz transmitting at 1 W.......................................................................24
Figure 13. Packet loss from 900 MHz receiving at 1 mW....................................................................25
Figure 14. Packet loss from 900 MHz receiving at 10 mW..................................................................25
Figure 15. Packet loss from 900 MHz receiving at 100 mW................................................................26
Figure 16. Packet loss from 900 MHz receiving at 500 mW................................................................26
Figure 17. Packet loss from 900 MHz receiving at 1 W. ......................................................................27
Figure 18. Packet loss from 2.4 GHz receiving at 10mW. ...................................................................27
Figure 19. Packet loss from 2.4 GHz receiving at 16 mW. ..................................................................28
Figure 20. Packet loss from 2.4 GHz receiving at 25 mW. ..................................................................28
Figure 21. Packet loss from 2.4 GHz receiving at 40 mW. ..................................................................29
Figure 22. Packet loss from 2.4 GHz receiving at 63 mW. ..................................................................29
Figure 23. 900 MHz at 100 mW power...................................................................................................30

vi
Figure 24. 2.4 GHz at 63 mW power. .....................................................................................................30
Figure 25. First floor simulation of RF signals penetration. Above: 900 MHz. Below: 2.4 GHz. ..32
Figure 26. Packet loss from 900 MHz receiving at 100 mW, from the primary location. ...............33
Figure 27. Packet loss from 900 MHz receiving at 100mW, from the repeater location.................33
Figure 28. Packet-loss from 900 MHz receiving at 100 mW from the both the primary and repeater locations. .............................................................................................................................34
Figure 29. Packet loss from 2.4 GHz receiving at 63 mW from the primary location.....................34
Figure 30. Packet loss from 2.4 GHz receiving at 63 mW from the repeater location.....................35
Figure 31. Packet-loss from 2.4 GHz receiving at 63 mW from both the primary and repeater locations..............................................................................................................................................35
Figure 32. Transmitting link quality of UWB < 1mW..........................................................................36
Figure 33. Packet loss from UWB at 315mW.........................................................................................36

vii
Abstract
Various wireless technologies were field-tested in a six-story laboratory building to identify wireless technologies that can scale for future DR applications through very low node density power consumption, and unit cost. Data analysis included analysis of the signal-to-noise ratio (SNR), packet loss, and link quality at varying power levels and node densities. The narrowband technologies performed well, penetrating the floors of the building with little loss and exhibiting better range than the wideband technology. 900 MHz provided full coverage at 1 watt and substantially complete coverage at 500 mW at the test site. 900 MHz was able to provide full coverage at 100 mW with only one additional relay transmitter, and was the highest-performing technology in the study.2.4 GHz could not provide full coverage with only a single transmitter at the highest power level tested (63 mW). However, substantially complete coverage was provided at 2.4 GHz at 63 mW with the addition of one repeater node.

viii

1
Executive Summary
Introduction
This report, under collaborative effort by Lawrence Berkeley National Laboratory (LBNL) and Lawrence Livermore National Laboratory (LLNL), concerns research in innovative and adaptive wireless technologies that are immune to communication barriers and scalable for cost-effective implementation of Demand Response (DR). The Barrier Immune Radio Communications (BIRC) project identifies essential technical elements in 900 MHz and 2,400 MHz narrowband, and Ultra-Wideband (UWB) frequencies.
Methodology
The characterization of wireless technologies was conducted through a series of product assessments, simulations, and field-tested deployment in a six-story laboratory building. The communications data that was generated during field testing was analyzed to identify wireless technologies that can scale for future DR applications through very low node density power consumption, and unit cost. Data analysis included analysis of the signal-to-noise ratio (SNR), packet loss, and link quality at varying power levels and node densities. Further analyses to benchmark and understand SNR characteristics in response to barriers and existing interferences were carried out using the rich data-set collected during the field tests. At the conclusion of the study LBNL and LLNL developed a set of recommendations for wireless DR strategies, and presented the research findings.
Results
The use of BIRC technologies has enormous potential for automating and scaling Demand Response. Study results indicate that with significant improvement in cost and key performance parameter, RF technologies are feasible for wide-scale commercial and industrial buildings, with or without Energy Management Control Systems. Further, the IEEE standard underlying the technologies in the study is compatible with concurrent developments in load management, such as residential Programmable Communicating Thermostats (PCT) and Home Automation Networks (HAN), and the Automated Metering Infrastructure (AMI) and Automated DR (Auto-DR) initiatives by California Energy Commission (CEC), utilities, and Independent Systems Operators (ISOs).
Technologies in the 900 MHz, 2.4 GHz, and UWB frequency ranges each met or exceeded performance expectations. Field testing was conducted in a 6-floor building with significant challenges to radio communications. Signal propagation was measured at varying power densities, and measurements were duplicated to test data validity. Narrowband technologies showed 100% penetration; with a maximum of one repeater node.900 MHz technologies were able to provide coverage up to the fourth of sixth floors, at power levels as low as 100 mW.
In general, the 900 MHz technologies showed better coverage than the 2.4 GHz technologies, and both of the narrowband solutions outperformed the UWB. A particularly impressive finding was that the 2.4 GHz technology was able to penetrate several steel decks. UWB radios are constrained to far less power than the narrowband transmitters, likely limiting its performance. Nonetheless, the UWB hardware performed much as expected, and offers

2
potential advantages in environments where the signal suffers multiple reflections and fading losses, where existing wireless networks and interference are an issue for narrowband systems, or where standard wireless technologies are not permitted.
Few BIRC technologies can be used in existing as well as new buildings, and in buildings both with and without energy managements control systems (EMCS). The ideal DR technology can be used in any facility, independent of the specific building characteristics. Since existing buildings vary extensively in terms of EMCS and Ethernet infrastructures, construction features, and layout, promising BIRC technologies must be further developed to ensure that they are applicable to any building type.
The BIRC technologies that were identified show promise in meeting life-cycle cost requirements, encouraging higher participation in DR programs. BIRC reliability and scalability is unique compared to other wireless technologies in widespread use. For example, BIRC technologies are able to cover larger areas with fewer nodes than a barrier-prone wireless sensor network.
Barrier immunity need not be continuous. In this study packets were received or transmitted at a rate of 30 per second, with each packet consisting of 80 bits (or 10 bytes or characters) of data. Although this is not very fast for modern computer networks, it is more than sufficient for DR applications, which has a latency requirement on the order of minutes, rather than milliseconds. Furthermore, DR systems usually transmit small amounts of data, often just a few bytes. This suggests that for DR, a high degree of packet loss could be tolerated, provided that ultimately the message is received. Additional research could reveal whether coverage could be increased at lower power levels by leveraging this relaxed latency requirement. Alternately, multiple RF data bursts could be averaged in custom hardware to study the trade-offs between range of coverage and data rate.
Recommendations and Future Research
The promising technologies that were identified in this study merit further research into their applicability for DR. Specific recommended topics include:
Long-term monitoring and technology and building-type characterization for feasibility. Efforts will concentrate on long-term acquisition and study of data reliability, security, and improvement. Long-term monitoring is required to effectively capture deviations in the statistical profiles of SNR and packet-loss measures. Iteration over selected technologies within varied building types/zones will necessitate little or no additional hardware and software costs.
Pilot program to reduce end-use load(s) in building types with significant DR potential. Knowledge of the use of promising wireless technologies in small/medium commercial buildings types is essential to identifying key strengths and improvements. The focus will be transmission of wireless signals within the building’s local area network (LAN). The DR signaling communication infrastructure, using proven technologies such as DR Automation Server (DRAS) and controls integration, will be considered.
Examination of interference/collision with widely used wireless technologies. Although this study included data collection under different wireless protocols and frequencies in the

3
presence of a WLAN network, a comprehensive examination of competing signals and relative performance was beyond the scope of this project.
Identification of best-suited technologies using a combination of modes and frequencies. When considering application for varied building types, “hybrid” transformational emerging technologies may prove reliable and cost-effective for DR application, within existing or proposed standards. This includes direct application of a combination of technologies such as power line carrier or physical layer technologies such as UWB, to replace common architectures.
Use of BIRC technologies for DR and control over lighting end-uses. BIRC technology can be used to transmit control sensor data to a building EMS or lighting-control system, provided that the latency requirements are as relaxed as for DR. For example, control photo-sensor data for a daylight-harvesting control system could be transmitted wirelessly, since the latency requirements for daylight sensing are on the order of minutes.

4

5
1.0 Introduction
1.1. Background and Overview
Demand Response (DR) programs are emerging as a way to ensure reliability of the electric grid and promote significant energy savings by allowing electricity consumers to respond to supply-side fluctuations, such as price increases during times of peak use. DR systems installed within commercial buildings respond to events initiated by the utility company and reduce building energy use according to a predefined plan. As DR programs enter the mainstream, the vast majority of DR installations will be in existing facilities that vary extensively in terms of building type and construction, existing network infrastructures, and installed equipment. The technology used to implement a DR strategy should therefore minimize reliance on any particular facility characteristic in order to be feasible for widespread implementation throughout the commercial building sector. The ideal DR technology could be installed inexpensively in any facility, regardless of its individual characteristics, layout, or construction, offering the DR community a powerful solution for both retrofits and new construction.
Communications signals to initiate Demand Response events are often generated at a central location and then broadcast to hundreds or thousands of participating sites via pager, radio, or the Internet. An installed DR system is responsible for managing communications between the incoming DR signal and the targeted load-shed equipment (such as lighting panels or motor control centers). This equipment and the associated control devices (e.g. relays or thermostats) are often geographically distributed throughout a given facility, creating challenges for controlling whole-building energy use.
Thus far, available methods of building control and communications have not proven cost-effective for Demand Response applications. Traditional communications using cabling and wiring is very expensive, especially when it must be added to existing facilities. Similarly, the limited number of Energy Management and Control Systems (EMCS) installed in buildings prevents implementation of DR through commercial equipment/controller interfaces. While they serve 30% of commercial floor space, EMCS are found in only 7% of commercial buildings (John M. House 2003). Centralized, automated lighting control systems are even less prevalent. Adding building-wide network wiring solely dedicated to DR in new and existing facilities is complex, cost prohibitive, and not scalable, due to the unique network architecture needed for DR control. Additionally, using existing internal networks, wired or wireless, to carry DR information in buildings is typically not a viable option, due to network ownership and control issues.
Many vendors now offer off-the-shelf, networked wireless sensor platforms to address the need for low-cost, low-power communications for general-purpose controls and monitoring applications. However, as wireless building control technology typically relies on radio frequency (RF) communication, virtually all of the resulting systems use costly Ethernet wiring to connect sub-networks of wireless sensors that are separated by communication barriers such as building walls and flooring. The wired component of these “wireless” systems contributes to costs that prohibit widespread penetration throughout the HVAC market (Kintner-Meyer et al. 2002). While there has been a substantial effort by many groups to lower the cost of wireless devices, there has been little effort to lower the costs of installation.

6
The long-term goal of the Barrier Immune Radio Communications (BIRC) Program is to lower the installed cost of Demand Response networks by at least a factor of ten (10), while increasing system performance (i.e., speed, reliability etc.). A cost reduction of this magnitude would disrupt existing Demand Response paradigms, including economic models, constraints on monitoring and control data, and existing deployment methodologies. Meeting these long-term goals will require phased, multi-year research to permit the development of equipment that is low-cost, high-performance, and easy to install in new and existing buildings.
The focus of this study was to identify and test wireless technologies capable of alleviating the need for additional wiring, opening the entire existing commercial building stock to low-cost communications for Demand Response applications. Industry experts agree that in the future, the use of wireless technology for controls in commercial buildings will be inevitable (Ivanovich and Gustavson 1999). However, thus far, no purely wireless technology platforms have proven suitable for on-site building control and communications.
Demand Response applications require reliable communications in order to control electrical equipment during load-shed events. As noted earlier, these control points are often distributed over large areas of a facility and blocked from each other by barriers to RF signal propagation, posing problems for wireless building control. Common RF barriers include:
• Floors and walls of most commercial buildings
• Steel shelving, tinted window glass, and other building materials
• Walls of most industrial plants
• Brick or wire mesh stucco base walls of some residences
While a dense network of wireless sensors can be meshed in order to reliably transmit DR control data over greater distances, this is not a cost-effective solution because so many control nodes are required. Since typical DR applications have relatively few control points that must be addressed, a better strategy for implementing a wireless DR system would be individual high-power output transmitters that communicate to a small number of DR nodes using a star topology with minimal meshing.
Ultra-Wideband (UWB) radio communication is one technology that seems to offer great promise for DR applications, but its performance has not yet been thoroughly investigated. Unlike other forms of radio frequency communication, UWB does not rely upon an RF carrier. Instead, it uses modulated high-frequency, low-energy pulses of less than one nanosecond in duration (2005 Wikipedia). Among the unique characteristics commonly attributed to UWB communication are:
• High multi-path immunity to barriers (Fontana, R., 2002).
• Low cost, nearly “all-digital” architectures (Fontana, R., 2002).
• Capability to penetrate walls of commercial buildings (Win, M.Z., R.A. Scholtz, 1998).
• Capability to penetrate through steel ship walls (Gunderson, S.J., et al. 2002).
• Very low transmitting power makes UWB safe for use in buildings.
Although UWB has been researched since the 1960s, UWB has not been integrated into any commercial mass-market products to date. However, increased interest from the commercial

7
sector in recent years helped encourage the FCC to approve a spectral mask for operation of UWB devices in February 2002. Commercial applications that have been targeted for UWB technologies include penetrating radar, altimetry, collision avoidance, urban communications, intrusion detection and precision geographic location (Fontana, R., 2002). Several companies are currently developing UWB products for use in high bandwidth, short-range applications such as video broadcasting within residences.
1.2. Project Objectives
The purpose of the first phase of the BIRC research project was to identify and evaluate technologies that would enable Demand Response systems to be installed in new and existing facilities at a fraction of their current cost. Breakthroughs of this type could drastically increase the number of electric ratepayers who are able to respond to grid contingency alerts, dynamic pricing, and other program options that may become available in the future.
The specific objectives of Phase 1 were to:
1. Identify a communications infrastructure that more effectively overcomes the traditional radio frequency (RF) barriers present in common commercial buildings (see Figure 1).
2. Evaluate costs of the proposed barrier-immune radio communications if manufactured in high volume. The manufacturing cost of these wireless devices is expected to be negligible compared with the savings from eliminating wiring expenses.
3. Determine how the proposed barrier-immune radio communications (BIRC) technology should be integrated with existing and emerging Demand Response system architectures. An example of an integrated hybrid BIRC-wireless sensor network is shown in Figure 3.

8
Figure 1. TTraditional DR architecture: A hardwired Ethernet backbone is required to connect groups of networked wireless sensors, which communicate DR signals, but are separated by RF barriers.

9
Figure 2. PPurely wireless DR architecture: BIRC devices are integrated with load-shed equipment to communicate DR signals.
Barrier Immune Radio Communication (BIRC) devices, proposed herein, could obviate the need for wiring, by communicating through walls and floors to DR load-shed devices. The advantages of this architecture go far beyond economics and performance, to scalability and adoption, resulting in very low point-density with significantly wide coverage.

10
Figure 3. HHybrid BIRC/wireless sensor network DR architecture: BIRC devices provide coverage across barriers, and a gateway transmits BIRC DR signals to wireless sensor networks, which are integrated with load-shed equipment.
In the hybrid architecture, gateways would convert BIRC radio signals to sensor networks’ radio signals, and vice versa. In this scenario, wireless sensor nodes provide local communication between the wireless gateway and the DR load-shed devices, across relatively RF barrier-free regions of the facility. This architecture leverages wireless sensor networks that may exist in the building, relying upon gateways to bridge BIRC and networked sensor signals.

11
2.0 Methodology
2.1. Technical approach
The technical approach adopted for this study was dictated by the Phase I objectives to objectively evaluate conventional, emerging, and advanced wireless technologies for Demand Response applications, and to evaluate a promising set of candidates in a real commercial building. To begin the study, LLNL surveyed the commercial marketplace to identify suitable technologies to include in the testing.
While much research relies upon mesh networking to provide large-area sensor coverage through transmission across several nodes, this project focused on the propagation of a single-node link. To accommodate the specific needs of a DR communications framework, the goal was to interconnect the main electrical service locations in the building (see Figures 1-3), not to provide a building-wide network access or to network every electronic device in the structure. As a result, the technology evaluation concerned radio-specific features such as center frequency, receiver sensitivity, power output, frequency-hopping method, rather than high-level networking protocols or meshing capabilities.
In the initial market survey, LLNL focused on wireless technologies readily available for the U.S. ISM wireless bands. Conventional RF theory, which indicates that lower frequencies propagate better through materials and that at least 10 mW of output power would be needed for this application, was used to reduce the search space. Based on these initial system criteria, wireless technologies for the 400 MHz, 900 MHz, 2.4 GHz, and UWB bands were identified as most promising. Frequencies well above 2.4 GHz, such as 5.8 GHz ISM wireless systems, were ruled out due to poor penetration.
The key requirements for the radios were:
• Control over the output power- preferably from 1 mW up to the maximum power allowed on the band.
• Accurate measurement and reporting of signal to noise ratio (SNR) from each data packet received.
• Ability to disable error correction and retransmission, for accuracy in packet-loss measurements.
• Pure peer-to-peer operation to permit evaluation of individual link performance - the radios could not require a master coordinator, or association with an access point to operate.
After commercial research and theoretical calculations, the team chose to pursue technologies in three different wireless bands; 900 MHz ISM, 2.4 GHz ISM, and Ultra-Wideband (UWB). While lower-frequency ISM bands such as 433 and 315 MHz exist in the U.S. market, the FCC-regulated power output allowed those bands was determined to be insufficient for application to this problem. Instead, the common U.S. 900 MHz ISM band and the semi-global 2.4 GHz ISM bands were selected as the primary frequency regions for evaluation of commercial hardware.
Second, due to their reported multi-path resilience, UWB transmissions were tested for in-building propagation as well.

12
In considering specific products within the targeted frequency bands, there are many wireless protocols that are potentially useful for Demand Response applications. Table 1 lists the most common wireless protocols, their governing IEEE Standard, and key operational characteristics.
Table 1. Data communication and IEEE standards for major wireless
technologies
Within the narrowband frequencies, researchers elected to focus on the 802.15.4 protocol, because it underlies the emerging Zigbee standard. Zigbee was an attractive standard to include in this study as it is increasingly being adopted for Automated Metering Infrastructure (AMI) by California Investor-Owned Utilities (IOU) such as Pacific Gas and Electric (PG&E), Southern California Edison (SCE), and San Diego Gas and Electric (SDG&E). Conventional WiFi (802.11) was not a protocol that was directly evaluated in the study, yet recognizing the ubiquity of 802.11 in commercial environments, WiFi technologies were used to assess Zigbee and UWB in the presence of potentially interfering local area networks.
After defining the desired standards and frequencies for the study, a market survey of suitable products was conducted, including point-to-point and Zigbee links from Aerocomm, Freewave, MaxStream, Microhard, and a wide variety of wireless networking hardware intended for high-speed wireless local area networking (WLAN). For ease in high-volume data collection, and since the BIRC network was not intended to provide high-bandwidth communications, the team decided not to purchase 802.11 or Bluetooth WLAN radio hardware, opting instead for point-to-point, mesh, and Zigbee hardware that operated on the same bands. The large-protocol overheads in traditional WLAN hardware were not conducive to the type of data collection planned for this phase.
Ultimately, the team elected to use 900 MHz ISM radios from MaxStream™1 because of their short-term availability, similar specifications to other vendors, and extensive control over the radios’ operation. MaxStream’s 900 MHz Xtend and 2.4 GHz XBee product lines support low-level access to their radio hardware, permit direct access to individual packet statistics, and offer control over the radio’s retransmission and encryption. 1 The product descriptions and specifications included in the body of the following sections are as per information
available from manufacturer’s manuals and website, which are assumed to be accurate. Tests for validity of that
information is beyond the scope of this study.
Wireless Protocol
WLAN Bluetooth Dust
Networks
UWB Zigbee
IEEE
Standard
802.11a 802.11b 802.11g 802.15.1 802.15.4 802.15.3 802.15.4
Operational
Frequency
5 GHz 2.4
GHz
2.4
GHz
2.4 GHz 2.4 GHz 3.1-10.6
GHz
2.4 GHz
(900 MHz)
Maximum
Data Rate
54
Mbps
11
Mbps
54
Mbps
1 Mbps 250 Kbps >100
Mbps
250 Kbps
(115 Kbps)
Maximum
Range
100 M 100 M 100 M 10 M 100 M 10 M 50 M
(900 M)

13
The set of radios used in the study are detailed in Tables 2-4. The MaxStream 900MHz Xtend radio permits transmit powers of 1-1W, allows automatic retransmissions and error correction to be disabled, allows accurate SNR measurements of each packet received, and supports 256 bit AES link encryption. At 2.4 GHz, the MaxStream XBee Pro Series 1 supports mesh networking, but was limited to point-to-point operation for the purposes of the study. The low-power Ultra-Wideband radio was not expected to outperform the commercial narrowband radios in line-of-sight applications; however, it has the potential to better penetrate material and function in noisy RF environments where the 900MHz and 2.4 GHz commercial ISM bands could be overcrowded, compromising their performance.
Table 2. 900 MHz wireless technology core specifications
RF technology 900 MHz ISM
Power output 1mW, 10mW, 100mW, 500mW, 1W
Operational frequency 900 MHz
Data rate typical 115 Kbps
Indoor range typical 900 m
Power Varied
IEEE standard security 802.15.4256-bit AES encryption
Operational frequency 900 MHz
Data rate typical 115 Kbps
Indoor range typical 900 m
Power Varied
Security 256-bit AES encryption
Table 3. 2400 MHz Zigbee wireless technology core specifications
RF technology 2,400 MHz Zigbee
Power output 1mW, 16mW, 25mW, 40mW, 63mW
Operational frequency 2,400 MHz (or 2.4 GHz)
Data rate typical 250 Kbps
Indoor range typical 50 m
Power Varied
Security 256-bit AES encryption
Table 4. UWB wireless technology core specifications
RF Technology Ultra-Wideband (UWB)
Standard Power Output <1mW following FCC UWB mask
Operational Frequency 3,100 – 10,600 MHz (3.1 – 10.6 GHz) variable
Data Rate Typical > 100 Mbps
Indoor Range Typical 10 m
Power Varied
Security N/A
The purchase cost of hardware and software for the MaxStream products are listed below in Table 5.
14
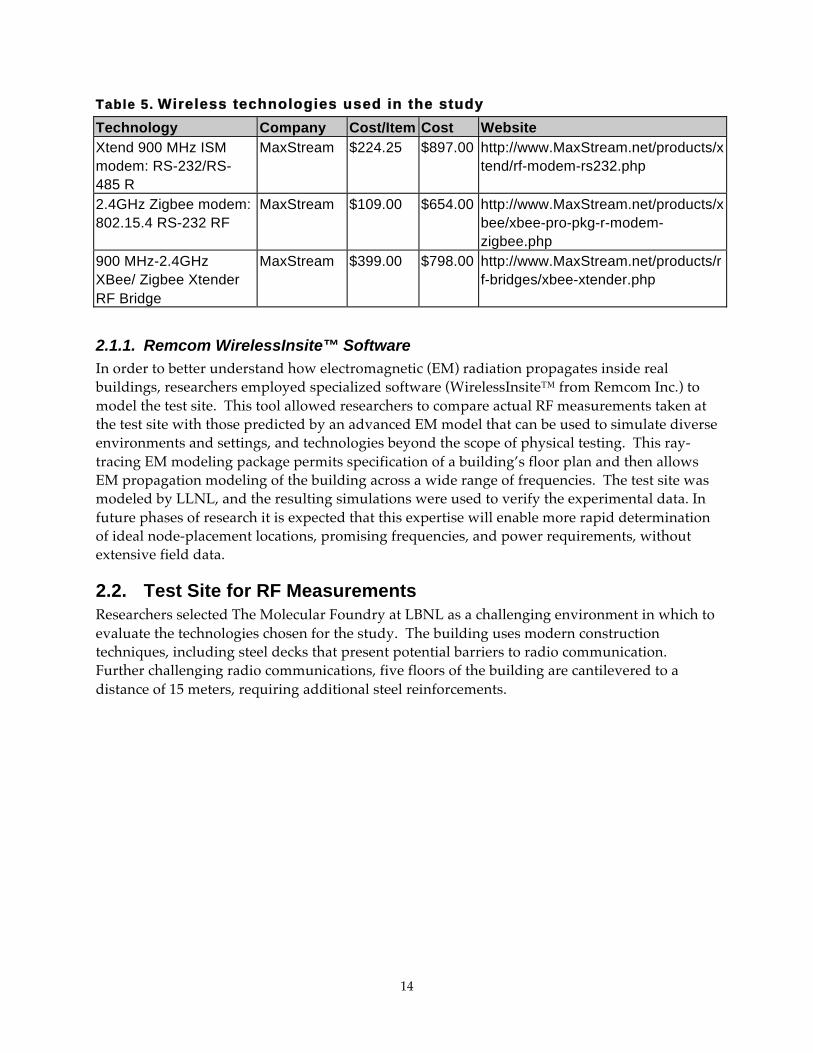
Table 5. Wireless technologies used in the study
Technology Company Cost/Item Cost Website
Xtend 900 MHz ISM
modem: RS-232/RS-
485 R
MaxStream $224.25 $897.00 http://www.MaxStream.net/products/x
tend/rf-modem-rs232.php
2.4GHz Zigbee modem:
802.15.4 RS-232 RF
MaxStream $109.00 $654.00 http://www.MaxStream.net/products/x
bee/xbee-pro-pkg-r-modem-
zigbee.php
900 MHz-2.4GHz
XBee/ Zigbee Xtender
RF Bridge
MaxStream $399.00 $798.00 http://www.MaxStream.net/products/r
f-bridges/xbee-xtender.php
2.1.1. Remcom WirelessInsite™ Software
In order to better understand how electromagnetic (EM) radiation propagates inside real buildings, researchers employed specialized software (WirelessInsite™ from Remcom Inc.) to model the test site. This tool allowed researchers to compare actual RF measurements taken at the test site with those predicted by an advanced EM model that can be used to simulate diverse environments and settings, and technologies beyond the scope of physical testing. This ray-tracing EM modeling package permits specification of a building’s floor plan and then allows EM propagation modeling of the building across a wide range of frequencies. The test site was modeled by LLNL, and the resulting simulations were used to verify the experimental data. In future phases of research it is expected that this expertise will enable more rapid determination of ideal node-placement locations, promising frequencies, and power requirements, without extensive field data.
2.2. Test Site for RF Measurements
Researchers selected The Molecular Foundry at LBNL as a challenging environment in which to evaluate the technologies chosen for the study. The building uses modern construction techniques, including steel decks that present potential barriers to radio communication. Further challenging radio communications, five floors of the building are cantilevered to a distance of 15 meters, requiring additional steel reinforcements.

15
Figure 4. EExperimental test site. Left: the Molecular Foundry building at LBNL. Right: view of the building during construction revealing the steel decks between floors.
Figure 4 contains images of the building showing its as-built appearance, and a construction photo in which the steel reinforcement decks are pictured. Table 5 summarizes the building’s unique characteristics, and Figures 5-7 contain plan and cross-section drawings.
Table 6. Test site building characteristics
Location: Lawrence Berkeley National Laboratory, Building 67
Height: 6 floors with total height of 102 feet from basement to rooftop
Gross floor space: 94,500 square feet with maximum 231 foot length and 59 foot width.
Purpose: Laboratory facility designed to produce molecules for research
purposes
Construction: Steel and glass
Construction
completed:
March, 2006
Key feature: 50 foot cantilever with reinforced steel and deck

16
Figure 5. SSection through test site looking east
Figure 6. SSection through the test site looking north

17
Figure 7. PPlan view of the test site at the cantilever floor (south is to the left)
2.3. Field Testing
Field testing was conducted in two iterations, both at the Molecular Foundry Building at LBNL. The first iteration took place on July 13, 2007, and the second on October 10, 2007. The first iteration of testing was effectively a dry-run, with discrete measurements and less sophisticated data acquisition procedures. In the second test continuous measurements were taken to generate the data set used to evaluate the technologies selected for the study. In addition, a portion of the second test was dedicated to analysis of increase in coverage that can be achieved with the use of a single repeater node.
In either testing iteration, a transmitter was placed in the basement electrical room, where the DR control base hardware would normally be located. A mobile data collection cart was then wheeled throughout the building to measure how reliably DR signals were able to propagate over each floor of the building. In particular, the reinforced steel deck that supports the building’s cantilever was interposed between the basement and the floors immediately above the cantilever, representing a formidable RF challenge. For both tests, the measurement cart was wheeled throughout the building while on-board instrumentation measured signal performance in real time. With the combined function of the DR control base and transmitter in the basement, and the mobile measurement cart, it was possible to measure the signal-to-noise ratio (SNR) of both transmit and receive paths of each wireless packet. The Ultra-Wideband measurements presented a procedural exception: to allow simultaneous data collection during the narrow band tests, the UWB base station was located on sixth floor. This was to account for sensitivity in the UWB RF receiver, which can be saturated by co-located power RF transmission for the 63 mW 2.4GHz and 1W 900 MHz systems.) Therefore, the mobile unit was only available to measure transmit paths for UWB packets. The commercial 900 MHz and 2.4 GHz radios on the base station and the mobile cart used standard 2.1dBi dipole (rubber whip type) antennas. The radios were configured to transmit approximately 30 packets per second, and each packet held 10 bytes (80 bits) of data payload.

18
In the second set of field tests a repeater was installed on the third floor, and the building was profiled to determine the resulting increase in coverage. The results from repeater nodes are designated “Location 2.” In addition, the data collection software was customized in the second iteration to automatically record and archive separate data files at each floor. In the first iteration, data was collected manually, beginning at the basement and ending at the roof, moving from east to west. The following two sections further detail the procedures and analyses conducted during the first and second iterations of field testing.
2.3.1. First Field Test
The first field test was intended to be exploratory in nature rather than comprehensive. Researchers benchmarked different wireless technologies at different power densities and frequencies, and profiled the entire building, including the roof. During the tests, measurements were collected at approximately sixteen discrete locations on each floor, at four to five fixed intervals along only the center of the building only. The images in Figure 8 illustrate the use of mobile data collection at floor and roof-level, the arrangement of instruments on the cart, a typical hallway ceiling configuration, and the basement DR control base for UWB technologies.
Results from this iteration of testing were used to inform the power levels and data collection format employed in the second iteration, and to screen out any technologies that immediately demonstrated prohibitively poor performance. Repeaters were not considered until the full-stage experiment in the second iteration of testing.
Data was collected solely for receive-path basement transmissions including:
• 900 MHz at 1 W and 100 mW power densities
• 2400 MHz at 63 mW power density
• UWB centered on 5 GHz and <1 mW power density
• Dust Networks’ SmartMesh™ at 2400 MHz and 32 mW power density

19
Figure 8. FField testing photos. From top-left clockwise: floor-level data collection; roof-level data collection; UWB wireless cart; a typical hallway ceiling; and UWB control base.
Dust Networks’ SmartMesh™ System
Although the focus of the study was single-link propagation without mesh networking, the first exploratory field test was also used to explore Dust Networks’ SmartMesh™ system. Were the cost per area of coverage no longer a driving concern for DR applications, mesh networking could provide a viable means of communicating DR events. In fact, such technologies are finding increasing application in process and industrial control. However, technical difficulty in properly configuring the dense mesh that is required for the tests prevented the completion of a meaningful test.
2.3.2. Second Field Test
The second field test was a comprehensive data-collection effort that was informed by the lessons learned in the first field test. In the second test, a broader spectrum of power levels were analyzed, continuous measurements were taken (every two footsteps), and a subset of first iteration data was collected to confirm repeatability. Measurements were collected moving toward the location of the basement transmitter, to ensure that there was no signal blockage by the individual pushing the cart. This test also explored the use of repeaters to extend coverage at lower power levels. Unfortunately, rooftop measurements were not possible during the second test, due to constraints on time, and access for the mobile data cart.
For the second field test, data collection was enhanced to capture both transmit and receive-path data, including:

20
• 900 MHz at 1 mW, 10 mW, 100 mW, 5001 W, 500 mW, 100 mW, 10 mW, and 1W1 mW power-densities in the basement (Location 1) and 100 mW power density at the third floor repeater (Location 2).
• 2400 MHz at 10mW, 16 mW, 25 mW, 40 mW, and 63mW power densities in the basement (Location 1) and only 63 mW power density at the third floor repeater (Location 2).
• UWB centered on 5 GHz with <1mW power density from the sixth fifth floor location, propagating downward. (This was a one-way link, and only TX data was collected.)
Figure 9. TTwo instances of mobile carts used during field tests one and two.
In the second field test, the cart was customized using a jig for elevating the receiver during testing. The carts used for both iterations of field testing are shown in Figure 9. A laptop with system control software was used to log data, and the cart’s wheels were fitted with positional encoders that accurately measured the trajectory along the building floor. Each measurement was logged automatically in a portable format file to be retrieved for further analysis, and researchers needed only to push the cart in a straight line and start a new data set for each floor or line segment. With this sophisticated data collection system, it was possible to:
• Significantly improve the speed of data collection, as no user interaction was required.
• Considerably increase the number of data points, through continuous rather than discrete acquisition.
• More completely characterize the data; the automated system saved the raw, transmit and receive-path SNR and packet-loss information, for comprehensive statistical measures including mean, and standard deviation.
UWB Data Collection

21
The UWB data took much longer to collect, as it was limited to manual processes. The immaturity of UWB radio technology relative to the highly commercialized 900 MHz and 2.4 GHz ISM radios, constrained the degree of automation that was possible. In addition, due to differences in the data interface, the data collection cart for testing the narrowband technologies was not suitable for the UWB products. In an effort to generate the necessary quantity of data for each technology, during a single field test, two cart/base configurations were leveraged simultaneously. While the narrowband bases were in the basement, the UWB base was located on the sixth floor electrical room, and the two technology types were tested at once. In this way, researchers could collect useful data, albeit “upside down,” without concern for interference between co-located RF products.
2.4. Data Analysis
Signal reliability is quantified using three related metrics: link quality, signal-to-noise (SNR) ratio and packet loss.
1. Signal-to-Noise Ratio: Signal-to-noise ratio is a measure of the signal strength of a received packet, relative to the background noise floor. Lost packets are not considered.
2. Packet-Loss or Bit Error Rate (BER): Packet loss is a measure of the percentage of packets returned at a given location, versus the number of packets that were sent.
3. Link quality: Link quality takes into account both the SNR and packet loss to show effective robustness of the link. If a packet was lost, it is counted as having a SNR below the known noise floor of the RX. If many packets were lost, the link quality decreases, even if the SNR of received packets was high.
The above measures of signal reliability were automatically collected and analyzed by the collection software, where data packets were saved as individual measurements and averaged into groups to make a series of data points at approximately 2 foot intervals. Figure 10 below contains a screen shot of the graphical user interface (GUI) for collection of both the RX and TX data sets.

22
Figure 10. FField testing data collection: software interface.

23
3.0 Results
For a given metric of signal reliability (link quality, SNR, and packet loss) two contour plots can be created: one for the transmit packet (TX) from the from the DR base to the target load (i.e. the mobile cart), and another for the receive packet (RX) confirming the load shed (i.e. the test signal from the load or mobile cart back to the DR base). Typically, these two values are very similar, if not identical, as the RF will usually traverse the same path given the same environment at the same time. Figures 11 and 12 illustrate the 900 MHz transmitter broadcasting at 1 watt. The plot of the receive packet is virtually indistinguishable from the plot of the transmit packet, providing validation of the experimental data. Consequently, for the sake of simplicity only the RX plots for all combination of frequency and power levels measured in the field tests are shown in the body of the report. In addition, only packet-loss or bit error rate (BER) data are presented in the body of the following sections, as barrier immunity was the focus of the BIRC study. Note that there is only one packet-loss or BER plot for any combination of frequency and power level, thus, when the packets are lost during transmission, there is no way to determine if they were lost during the RX or TX path.
Figure 11. RRX SNR from 900 MHz receiving at 1 W.

24
Figure 12. TTX SNR from 900 MHz transmitting at 1 W.
Due to the total amount of data generated and the exploratory nature of the first field test, only the results of the second field test are presented in the body of this report. The results from the second field test are presented from two perspectives:
1) The building-wide coverage obtained within a given frequency at increasing power levels.
2) The relative coverage across frequencies, at equivalent power levels.
For ease of interpretation, all signal propagation results are presented in the form of contour plots superimposed on the building cross-section. The cross sectional view represents the six-storey building with the cantilever (right-side) facing West direction. The lowest floor is shown as zero and the sixth floor is show as five in the figures. The measurements were taken from lowest floor on the East (left-side) corner of the building. Data measurements did not include measurements on the roof due to measurement constraints resulting from dense mechanical equipments and lack of space. Few simulated signal propagation for building are also included for the purposes of signal penetration results within floors.
3.1. Narrowband 900 MHz Results
Figures 13-17 reflect the packet-loss and resulting coverage at increasing power levels from 1mW to 1W, in the 900MHz ISM band.

25
Figure 13. PPacket loss from 900 MHz receiving at 1 mW.
Figure 14. PPacket loss from 900 MHz receiving at 10 mW.
26
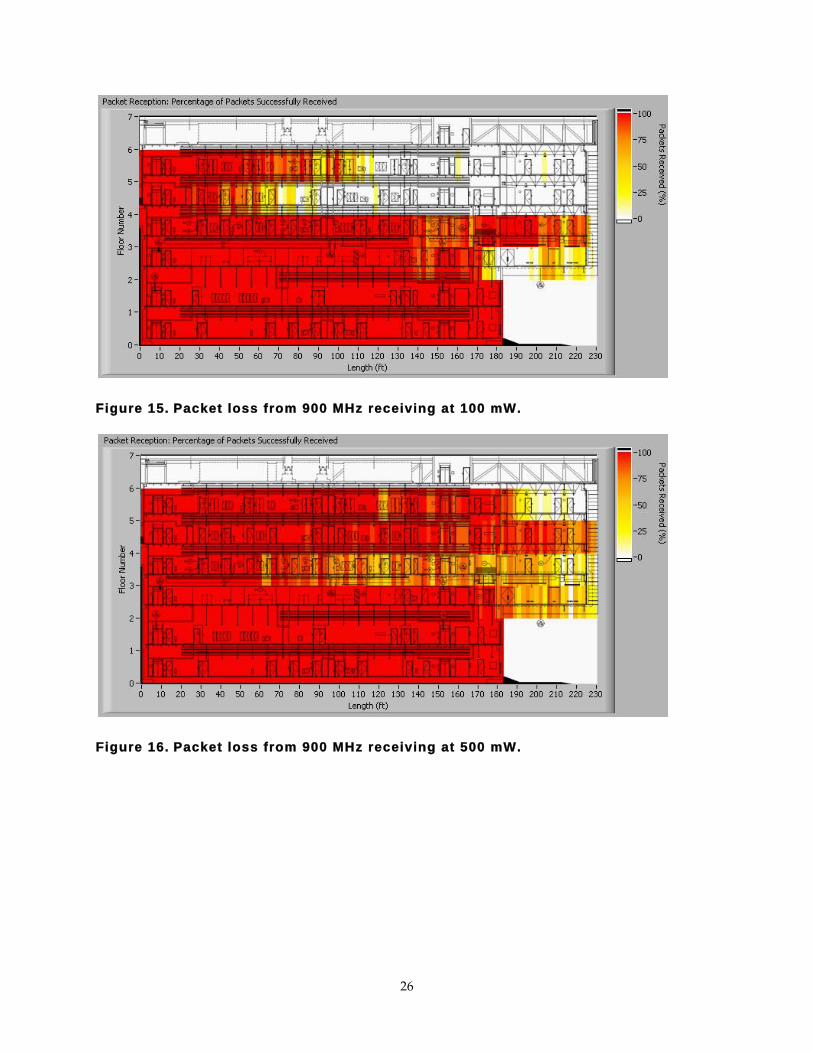
Figure 15. PPacket loss from 900 MHz receiving at 100 mW.
Figure 16. PPacket loss from 900 MHz receiving at 500 mW.

27
Figure 17. PPacket loss from 900 MHz receiving at 1 W.
Examination of the packet-loss data indicates that 900 MHz provided excellent coverage across the entire building at 500 mW and 1 Watt power levels. Even at the more modest 100 mW levels, significant coverage was provided up to the fourth floor, with some signal loss over the cantilever area. In total, 900 MHz achieves surprisingly broad coverage across the building at power levels as low as 100 mW.
3.2. Narrowband 2.4 GHz Results
Figures 18-22 reflect the packet-loss and resulting coverage at increasing power levels from 10mW to 1mW, in the 900MHz ISM band.
Figure 18. PPacket loss from 2.4 GHz receiving at 10mW.

28
Figure 19. PPacket loss from 2.4 GHz receiving at 16 mW.
Figure 20. PPacket loss from 2.4 GHz receiving at 25 mW.

29
Figure 21. PPacket loss from 2.4 GHz receiving at 40 mW.
Figure 22. PPacket loss from 2.4 GHz receiving at 63 mW.
Examination of the packet-loss data from the 2.4 GHz technology shows that at the higher power levels (40 mW and 63 mW) coverage reached to the sixth floor, provided that the lateral displacement was less than about 100 feet. However, below 40 mW, a significant decrease in coverage was observed.
3.3. Comparison of 900 MHz and 2.4 GHz Performance
We were interested in doing an “apples-to-apples” comparison of the 900 MHz and 2.4GHz technologies under the same ambient RF conditions. Under the test conditions that existed in the building (described earlier) for this study, 900 MHz communications at 100 mW is roughly equivalent to 2.4 GHz at 63 mW. For this comparison, we used the Link Quality (LQ) data

30
rather than the Packets Lost data as the LQ is more sensitive. The 900 MHz technology performed better (Figure 23) than the 2.4 GHz technology (Figure 24). Note that the 900 MHz “scales” the cantilever section while the 2.4 GHz did not reach the entire second floor, nor was it able to penetrate the cantilever section. The roof was not measured.
Figure 23. 9900 MHz at 100 mW power
Figure 24. 22.4 GHz at 63 mW power.
31
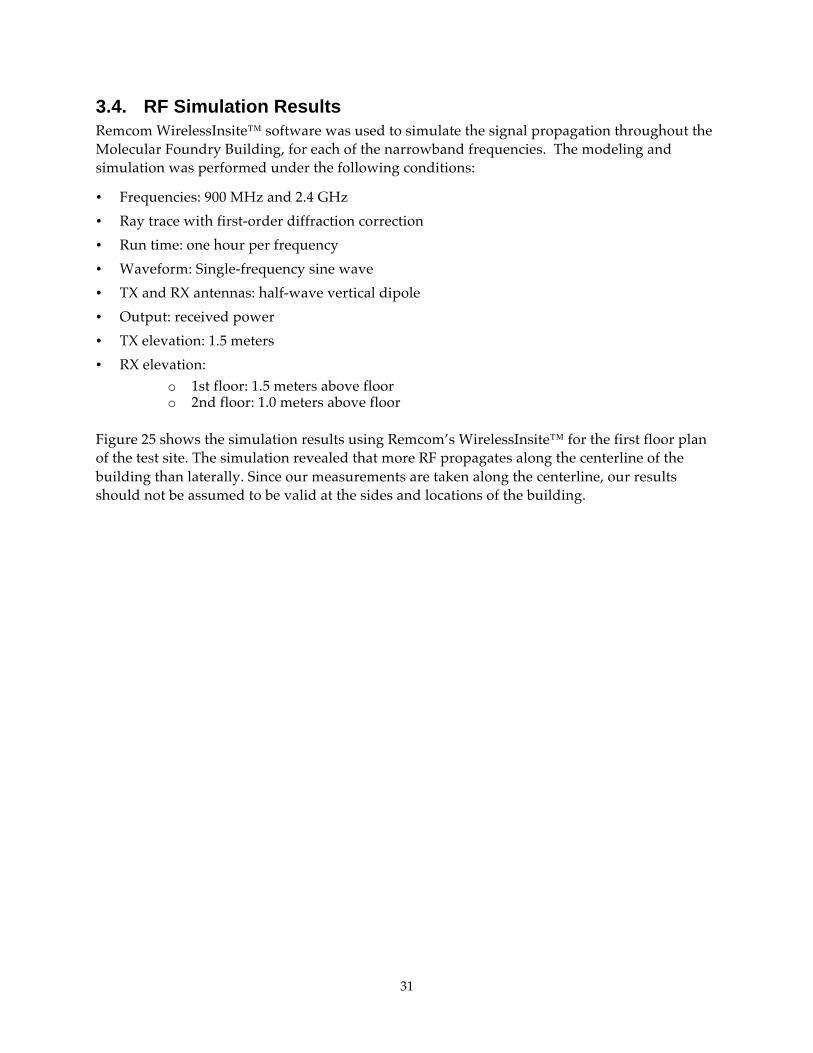
3.4. RF Simulation Results
Remcom WirelessInsite™ software was used to simulate the signal propagation throughout the Molecular Foundry Building, for each of the narrowband frequencies. The modeling and simulation was performed under the following conditions:
• Frequencies: 900 MHz and 2.4 GHz
• Ray trace with first-order diffraction correction
• Run time: one hour per frequency
• Waveform: Single-frequency sine wave
• TX and RX antennas: half-wave vertical dipole
• Output: received power
• TX elevation: 1.5 meters
• RX elevation: o 1st floor: 1.5 meters above floor o 2nd floor: 1.0 meters above floor
Figure 25 shows the simulation results using Remcom’s WirelessInsite™ for the first floor plan of the test site. The simulation revealed that more RF propagates along the centerline of the building than laterally. Since our measurements are taken along the centerline, our results should not be assumed to be valid at the sides and locations of the building.

32
Figure 25. FFirst floor simulation of RF signals penetration. Above: 900 MHz. Below: 2.4 GHz.
3.5. Repeater Coverage Improvements
To assess the improvement in coverage gained by adding a repeater node, researchers first examined the contour plots generated at moderate power levels (900 MHz at 100mW and 2.4.GHz at 63.mW) to identify a suitable location. In addition, the simulation results from each floor were examined to choose a single centralized location with consistent signal coverage to the basement base station. Ultimately, the team placed a node on the second floor. With the repeater located at the secondary location, field measurements with the cart were conducted for the two frequency/power combinations. To provide an understanding of additional and

33
overlapping coverage, measurements were taken with only the repeater active and with both the repeater and the primary node active.
3.5.1. Impact of Repeaters on 900 MHz Performance
The plots in Figures 25-27 indicate that with a single repeater placed on an intermediate floor, 900 MHz achieved nearly full-structure coverage while transmitting at only 100mW - essentially equivalent to a single node operating at 500 mW – 1W.
Figure 26. PPacket loss from 900 MHz receiving at 100 mW, from the primary location.
Figure 27. PPacket loss from 900 MHz receiving at 100mW, from the repeater location.

34
Figure 28. PPacket-loss from 900 MHz receiving at 100 mW from the both the primary and repeater locations.
3.5.2. Impact of Repeaters on 2.4 GHz Performance
The plots in Figures 28-30 show that with only one repeater on the second floor, 2.4 GHz achieved substantial coverage across the entire building at only 63 mW. Note however, that coverage is patchy above the cantilever section and in some parts of the mid section.
Figure 29. PPacket loss from 2.4 GHz receiving at 63 mW from the primary location.
35
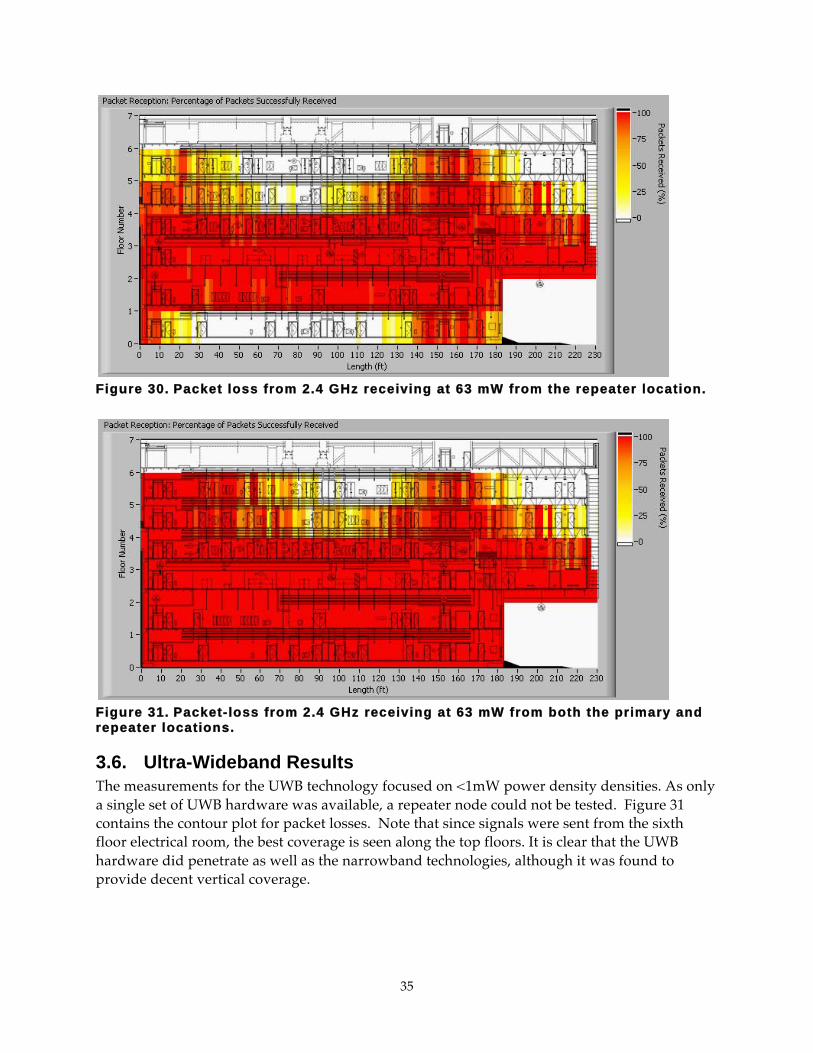
Figure 30. PPacket loss from 2.4 GHz receiving at 63 mW from the repeater location.
Figure 31. PPacket-loss from 2.4 GHz receiving at 63 mW from both the primary and repeater locations.
3.6. Ultra-Wideband Results
The measurements for the UWB technology focused on <1mW power density densities. As only a single set of UWB hardware was available, a repeater node could not be tested. Figure 31 contains the contour plot for packet losses. Note that since signals were sent from the sixth floor electrical room, the best coverage is seen along the top floors. It is clear that the UWB hardware did penetrate as well as the narrowband technologies, although it was found to provide decent vertical coverage.

36
Figure 32. TTransmitting link quality of UWB < 1mW
Figure 33. PPacket loss from UWB at 315mW

37
4.0 Discussion
At power levels of 500mW and 1 W, a single 900 MHz node was able to provide excellent coverage across the entire building. Yet, a significant study finding was that 900 MHz technologies were able to provide coverage across up to the fourth of sixth floors, at power levels as low as 100mW. Adding a repeater node at 100mW extended coverage to nearly the entire building. Thus, even a very low power levels, two 900 MHz radios were able to successfully penetrate a building with significant barriers to radio frequency communication. However, the option of using a repeater reveals a compelling tradeoff: the increased node count from using repeaters is countered by a reduction in unit cost because of decreased power requirements.
The 2.4 GHz technology generally showed decreased coverage compared to the 900 MHz at roughly equivalent power levels. Nonetheless, the fact that 2.4 GHz was transmitted through several steel decks at all is one of the more interesting findings of this research. In fact, at the higher power levels (40 and 63mW), coverage spanned the whole building, provided that the lateral displacement was less than about 100 feet.
4.1. Ultra-Wideband
The UWB technology did not perform as well as the narrowband technologies. Because of FCC power limitations, the UWB transmitter emitted much less power than the narrowband radios. UWB is reported to perform well in environments where the signal suffers multiple reflections and fading losses; however that did not appear to the case at this particular test site. The UWB hardware performed much as expected. With its set transmit power for approximately 300 feet, about the maximum anticipated range; it was able to vertically penetrate all floors of the building. Since UWB was able to penetrate the building vertically, it could be useful as a through-floor backbone in buildings where the narrowband performance is poor, in deployments where ISM band interference is prohibitive, or where standard wireless technologies are not allowed (as, for example, in hospitals).
4.2. Optimizing Coverage for DR Applications
In this study packets were received or transmitted at a rate of 30 per second, with each packet consisting of 80 bits (or 10 bytes or characters) of data. Although this is not very fast for modern computer networks, it is more than sufficient for the Demand Response application, which has a latency requirement on the order of minutes, rather than milliseconds. Furthermore, DR systems usually transmit small amounts of data, often just a few bytes. This would suggest that for DR, a high degree of packet loss could be tolerated, provided that ultimately the message is received within a minute. Additional research could reveal whether coverage could be increased at lower power levels simply by leveraging this relaxed latency requirement, or by averaging multiple RF data bursts in custom hardware to increase range at the expense of data rate.
4.3. Extending Results to Other Sites
The EM modeling and simulation results suggest that coverage is likely to degrade beyond the building centerline, as expected. As the measurements in this study were limited to the centerline, a degree of caution should be used in generalizing the results. In the test site

38
building the targeted load-control regions were centrally located, however in general, Demand Response end-use nodes can be spread about the entire floor plan. Additional research is required to determine the coverage along the perimeter of the building.

39
5.0 Recommendations and Future Directions
• Long-term monitoring and technology and building-type characterization for feasibility. Efforts will concentrate on long-term acquisition and study of data reliability, security, and improvement. Long-term monitoring is required to effectively capture deviations in the statistical profiles of SNR and packet-loss measures. Iteration over selected technologies within varied building types/zones will necessitate little or no additional hardware and software costs.
• Pilot program to reduce end-use load(s) in building types with significant DR potential. Knowledge of the use of promising wireless technologies in small and medium commercial buildings types is essential to identifying key strengths and improvements. The focus will be transmission of wireless signals within the building’s local area network (LAN). The DR signaling communication infrastructure, using proven technologies such as DR Automation Server (DRAS) and controls integration, will be considered.
• Examination of interference/collision with widely used wireless technologies. Although this study included data collection under different wireless protocols and frequencies in the presence of a WLAN network, a comprehensive examination of competing signals and relative performance was beyond the scope of this project.
• Identification of best-suited technologies using a combination of modes and frequencies. When considering application for varied building types, “hybrid” transformational emerging technologies may prove reliable and cost-effective for DR application, within existing or proposed standards. This includes direct application of a combination of approaches such as power line carrier or physical layer technologies such as UWB, to replace common architectures.
• Use of BIRC technologies for DR and control over lighting end-uses. BIRC technology can be used to transmit control sensor data to a building EMS or lighting-control system, provided that the latency requirements are as relaxed as for DR. For example, control photo-sensor data for a daylight-harvesting control system could be transmitted wirelessly, since the latency requirements for daylight sensing are on the order of minutes.

40
6.0 Conclusions
Researchers completed a detailed suite of RF measurements at a challenging building site that had few multi-path regions and/or low absorption. Several of the wireless technologies that were tested showed promise for wireless DR application, and a subset of frequency/power combinations exceeded expectation with respect to the BIRC research goals.
• The narrowband technologies performed well, penetrating the floors of the building with little loss and exhibiting better range than the wideband technology.
• 900 MHz provided full coverage at 1 watt and substantially complete coverage at 500 mW at the test site. 900 MHz was able to provide full coverage at 100 mW with only one additional relay transmitter, and was the highest-performing technology in the study.
• 2.4 GHz could not provide full coverage with only a single transmitter at the highest power level tested (63 mW). However, substantially complete coverage was provided at 2.4 GHz at 63 mW with the addition of one repeater node.
• In general the narrowband systems were well developed and mature, with strong packet-filtering on receivers. Narrowband signals fade primarily due to range rather than the type of building construction, floors, and walls.
• UWB was not a good candidate for buildings with few multi-path regions and/or low absorption, although the technology performed as expected. However, in the presence large multi-path regions, the technology may outperform narrowband solutions.
• The wireless mesh-network technology that was tested did not meet the project goals, although it might be useful in other contexts that require ease of BIRC implementation.
• Barrier immunity need not be continuous. In this study packets were received or transmitted at a rate more than sufficient for DR applications, which has a latency requirement on the order of minutes, rather than milliseconds. This suggests that for DR, a high degree of packet loss could be tolerated, provided that ultimately the message is received.

41

42
7.0 References
Dowla, F. et al., “Ultra-wideband communications: system analysis, design and research directions,” November 2002. UCRL-ID-151166
Dowla, F. et al., “Multiple access in ultra-wideband communications using multiple pulses and the use of least squares filters”, June 2003. UCRL-JC-153893
Dust Networks, SmartMesh-XT™ PM2130, 2.4 GHz Long Range Manager, http://www.dustnetworks.com/cms/sites/default/files/PM2130.pdf (Last accessed Jan. 2009)
Fontana, R., “Current Trends in UWB Systems in the USA,” 2002.
Ghatikar, G., D. Hennage. 2007. Client and Logic with Integrated Relay User Guide: Installation for Automated Demand Response. Technical Document to Southern California Edison (SCE), 2007.
Gunderson, S.J., et al, “Naval Total Asset Visibility (NTAV) Tests on the SS Curtis, Port Hueneme, CA, Appendix A USC UltRa Lab: Shipboard Environment Characterization,” March 2002.
House, John M., “National Building Controls Information Program Summary Report: Characterization of Building Controls and Economizers Using the Commercial Buildings Energy Consumer Survey,” 2003.
Ivanovich, M. and D. Gustavson. “The Future of Intelligent Buildings is Now” Heating/Piping/Air Conditioning Engineering, May 1999, pp. 73-79.
Kintner-Meyer, M. M. Brambley, American Council for an Energy-Efficient Economy (ACEEE) Summer Study on Energy Efficiency in Buildings: Wireless Sensors: Technology and Cost-Savings for Commercial Buildings 2002. (PNNL-SA-36346)
Kissick, W.A., “The Temporal and Spectral Characteristics of Ultra wideband Signals,” January 2001 National Telecommunications and Information Administration (NTIA). #01-383
Piette, M. A., O. Sezgen, D. Watson, N. Motegi, and C. Shockman, “Development and Evaluation of Fully Automated Demand Response in Large Facilities,” January 2005. CEC-500-2005-013. Available at http://drrc.lbl.gov/drrc-pubs1.html
Piette, M.A., D.S. Watson, N. Motegi, N. Bourassa, and C. Shockman. 2005. Findings from the 2004 Fully Automated Demand Response Tests in Large Facilities. CEC-500-03-026. LBNL-58178. Berkeley CA, September.
Lawrence Livermore National Laboratory, Science and Technology Principal Directorate, https://www-eng.llnl.gov/uwb_comm/uwb_comm_fatq.html (Last accessed Jan. 2009)
Win, M.Z., R.A. Scholtz, “On the Robustness of Ultra-Wide Bandwidth Signals in Dense Multipath Environments” February 1998.