Barrick Nevada Investor Tour -...
53
Barrick Nevada Investor Tour | June 20-21, 2017 A Company of Owners
Transcript of Barrick Nevada Investor Tour -...

Barrick Nevada
Investor Tour | June 20-21, 2017
A Companyof Owners

Certain information contained or incorporated by reference in this presentation prepared by Barrick Gold Corporation ("Barrick" or the "Company"), including any information as to our strategy, projects, plans, or future financial or operating performance, constitutes "forward-looking statements". All statements, other than statements of historical fact, are forward-looking statements. The words"believe", "expect", "anticipate", "contemplate", "target", "plan", "objective" "aspiration", "aim", "intend", "project", "goal", "continue", "budget", "estimate", "potential", "may", "will", "can", "should", "could", "would", and similar expressions identify forward-lookingstatements. In particular, this presentation contains forward-looking statements including, without limitation, with respect to: (i) production rates; (ii) potential mineralization and metal or mineral recoveries; (iii) Barrick's Best-in-Class program (including potential improvements to financial and operating performance that may result from certain Best-in-Class initiatives); (iv) potential improvements to financial and operating performance and mine life at Barrick's Nevada operations; (v) potential developments in the Cortez district and at Barrick’s Fourmile project; (vi) the potential to identify new reserves and resources; (vii) the potential underground potential at Goldstrike; (viii) our pipeline of projects at or near existing Nevada operations; (ix) the potential impact and benefits from Barrick's digital enterprise transformation strategy; (x) the ability to achieve impact through short interval control at Cortez; (xi) the potential benefits from the acquisition of the Robertson Property; (xii) the benefits achievable from integrating the Cortez and Goldstrike operations; and (xiii) the estimated timing and conclusions of technical reports and other studies.
Forward-looking statements are necessarily based upon a number of estimates and assumptions that, while considered reasonable by the Company as at the date of this presentation in light of management's experience and perception of current conditions and expecteddevelopments, are inherently subject to significant business, economic and competitive uncertainties and contingencies. Known andunknown factors could cause actual results to differ materially from those projected in the forward-looking statements, and unduereliance should not be placed on such statements and information. Such factors include, but are not limited to: fluctuations in the spot and forward price of gold, copper, or certain other commodities (such as silver, diesel fuel, natural gas, and electricity); the speculative nature of mineral exploration and development; changes in mineral production performance, exploitation, and exploration successes; risks associated with the fact that certain Best-in-Class and other initiatives are still in the early stages of evaluation, and additional engineering and other analysis is required to fully assess their impact; risks associated with the implementation of Barrick's digital transformation initiative, and the ability of the projects under this initiative to meet the Company's capital allocation objectives; diminishing quantities or grades of reserves; increased costs, delays, suspensions, and technical challenges associated with theconstruction of capital projects; operating or technical difficulties in connection with mining or development activities, including geotechnical challenges, and disruptions in the maintenance or provision of required infrastructure and information technology systems; failure to comply with environmental and health and safety laws and regulations; timing of receipt of, or failure to comply with, necessary permits and approvals; uncertainty whether some or all of the Best-in-Class initiatives and targeted investments and projects will meet the Company's capital allocation objectives; the impact of inflation; fluctuations in the currency markets; changes in U.S. dollar interest rates; risks arising from holding derivative instruments; changes in national and local government legislation, taxation, controls or regulations, and/or changes in the administration of laws, policies, and practices, expropriation or nationalization of property and political or economic developments in the United States; damage to the Company’s reputation due to the actual or perceived occurrence of anynumber of events, including negative publicity with respect to the Company’s handling of environmental matters or dealings withcommunity groups, whether true or not; the possibility that future exploration results will not be consistent with the Company’sexpectations; risks that exploration data may be incomplete and considerable additional work may be required to complete furtherevaluation, including but not limited to drilling, engineering and socio-economic studies and investment; risk of loss due to acts of war, terrorism, sabotage and civil disturbances; litigation; contests over title to properties, particularly title to undeveloped properties, or over access to water, power and other required infrastructure; business opportunities that may be presented to, or pursued by, the Company; risks associated with working with partners in jointly controlled assets; our ability to successfully integrate acquisitions or complete divestitures; employee relations; increased costs and risks related to the potential impact of climate change; and availability and increased costs associated with mining inputs and labor. In addition, there are risks and hazards associated with the business of mineral exploration, development and mining, including environmental hazards, industrial accidents, unusual or unexpected formations,pressures, cave-ins, flooding and gold bullion, copper cathode or gold or copper concentrate losses (and the risk of inadequate insurance, or inability to obtain insurance, to cover these risks).
Many of these uncertainties and contingencies can affect our actual results and could cause actual results to differ materially from those expressed or implied in any forward-looking statements made by, or on behalf of, us. Readers are cautioned that forward-lookingstatements are not guarantees of future performance. All of the forward-looking statements made in this presentation are qualified by these cautionary statements. Specific reference is made to the most recent Form 40-F/Annual Information Form on file with the SEC and Canadian provincial securities regulatory authorities for a more detailed discussion of some of the factors underlying forward- looking statements and the risks that may affect Barrick's ability to achieve the expectations set forth in the forward-looking statementscontained in this presentation.
The Company disclaims any intention or obligation to update or revise any forward-looking statements whether as a result of newinformation, future events or otherwise, except as required by applicable law.
CAUTIONARY STATEMENT ON FORWARD-LOOKING INFORMATION

Barrick Nevada Investor Tour | 3
Elko, NevadaWelcome & Opening Remarks Kelvin Dushnisky
Operations Overview Richard Williams
Barrick Nevada Overview and Growth Bill MacNevin
Codemine Ed Humphries
Nevada Analytics and Operations Center Rob Neitzel
CortezDistrict
Range Front Declines, Continuous Miner Don Schumacher
Short Interval Control, Remote/Semi-Auto/Auto Demo Miguel Lamadrid
GoldstrikeOperations
TCM Circuit, Water Treatment Plant, Resin-in-Leach Circuit Paul Wilmot
Operations Center / Process Controls Holly Saucier
Open Pit Operations – Betze-Post and Arturo Julius Stieger

Barrick Nevada Investor Tour | 5
Largest industry presence in Nevada
Largest gold producer in Nevada and North America
Two mines: Goldstrike & Cortez “Barrick Nevada”
One joint venture: Turquoise Ridge
30 years of operationLas Vegas
Reno
Elko
Carson City
N E V A D A
Turquoise Ridge JV Goldstrike Operations
Cortez District
Barrick Nevada Investor Tour | 6
> $1 B new capital invested in Nevada past two years
> 500 Nevada-based suppliers goods/services
~$1.2 B annual spend with contractors and suppliers in rural and urban Nevada
Generates Nevada jobs (>3,000 employees) and annual state taxes (~$112M)

Barrick Nevada Investor Tour | 7
Enabler of Change
First Step – What? Vision – How? Drive – Why?
Barrick Nevada Investor Tour | 8
PARTNERSHIPSCommunity EngagementRegulatory PartnershipsStakeholder Relationships
PEOPLERecruitDevelop Retain
SafetyEnvironmentOutperform PlanBiC/Digital DeliveryInnovation
Capital Rigor & ExecutionMaintenance Management SystemStrategic SourcingCapitalize on Geological ResourcesUnite Barrick Nevada
OPERATIONAL EXCELLENCE
FINANCIAL FLEXIBILITYDeliver Free Cash Flow Disciplined Capital AllocationDeliver All in Sustaining Costs Integrated Planning
GROWTHTier IV PlanningGrowthExploring New Partnerships

Barrick Nevada Investor Tour | 9
100 Year Vision requires investment in exploration, innovation and partnerships
Close to Technical Limits
Step Changes
Innovation& Global EX
$ Investment withknown ROI
$ Investment with uncertain ROI
Leadership/Systems investment
(Optimization Process)
Impact on Productivity &Sustainability
Time
Barrick Nevada Investor Tour | 10
Imagine all of the decision making that is required to constantly deliver the optimum blend for each of the process plants as the grade, carbon contents, mining rates and other variables change while also balancing risk and opportunity within the operation!
Imagine all of the decision making that is required to constantly deliver the optimum blend for each of the process plants as the grade, carbon contents, mining rates and other variables change while also balancing risk and opportunity within the operation!
Cortez OPCortez UG Goldrush Goldstrike OP Goldstrike UG
Heap Leach Oxide Mill/CIL Roaster Autoclave
Roaster
Oxide
Leach
Roaster
Autoclave
ORE SOURCES
PROCESS OPTIONS
CortezStockpiles
GoldstrikeStockpiles

On LeaseResources
Highest Value
LOM Plan
Sustaining ProjectSystem Evaluations
MINEX AcceleratedResource
Conversion
Global ExplorationNevada Projects
AcquisitionsEvaluations
Partnerships forOre Delivery
and Processing
Off LeaseOpportunities
New or expanded orebodies to feed production profileIntegrated Technical Growth and Organic GrowthInclusive of current sites and new opportunities
Barrick Nevada Investor Tour | 12
Stochastic model used to evaluate different scenarios to help identify areas of focus for the future
Base Case – optimize current plan on short term free cash flow without adding new reserves or infrastructure
“Re-Load” Option – Technical growth to reduce cutoff grades and organic growth through MINEX to fully use existing process infrastructure
Other “Re-Tool” Options assume differing capital spend on expanding processing and/or associated infrastructure

Barrick Nevada Investor Tour | 13
Barrick Nevada is not infrastructure constrained, particularly not post 2022
In the medium term (2017-2025), the best bang for Barrick’s buck comes from spending on MINEX and brownfield projects
Longer term (2025+), Best in Class/digital/innovation or bringing new assets into the portfolio through exploration, partnerships and acquisition to improve the economics to justify and catalyze significant one-off capital investment based on current economics
Barrick Nevada Investor Tour | 14
Increase oxide mill throughput and recovery through automation and improved carbon activity
Reach full potential for autoclave by maximizing benefit of acid and alkaline ores
Autoclave Throughput(tons per operating hour)
Oxide Mill Throughput(tons per operating hour)
488 473
526 539
562 554 558 546
576 566 566 593
571 565
620
Jan Feb Mar Apr May Jun Jul Aug Sep Oct Nov Dec Jan Feb Mar2016 2017
500Jan/Feb 2017
(APC1)
593
634
654
PotentialOct/Nov 2016Jan/Feb 2016
Best-in-
Class
Innovation/Digitization
Partnership
1. Automated Process Control (APC)

Barrick Nevada Investor Tour | 15
Blend roaster feed for margin to maximize free cash flow
Increase production from bulk mining methods from 5% to 30% of total UG production
Cortez UG Tons Mined(tons thousands)
Roaster Tons Processed(tons thousands)
477
425
524
249
401
477
507 508 507 532 524
498
528
367
545
Jan Feb Mar Apr May Jun Jul Aug Sep Oct Nov Dec Jan Feb Mar2016 2017
91
82
103
94 90
96 97
9188
100
94 96
106 102
126
Jan Feb Mar Apr May Jun Jul Aug Sep Oct Nov Dec Jan Feb Mar2016 2017
Mai
nten
ance
Mai
nten
ance
Barrick Nevada Investor Tour | 16
Design and incorporate new, bespoke, and industry-leading digital systems to further enhance efficiencies
Digital Barrick Initiatives1. UG Short Interval Control2. UG Automation3. Digital Maintenance Work Management4. Digital Processing5. Predictive Maintenance6. Consolidated Data Platform7. Analytics and Unified Operations Center8. Integrated Planning

Barrick Nevada Investor Tour | 17
0
50
100
150
200
250
300
M A M J J A S O N D
Short Interval Control(additional tons per day)
0.0
0.5
1.0
1.5
2.0
2.5
3.0
M A M J J A S O N D
Mill Uptime(additional hours per month)
0
50
100
150
200
250
300
M A M J J A S O N D
Automated Process Control(additional tons per day)
Barrick Nevada Investor Tour | 18
GET DATA
SUP GSMGR OPSGM
MAKE DECISIONS
LIBERATE DATA
UNIFIED OPERATIONSBARRICKNEVADA
BARRICKHEAD OFFICE
ANALYSTOPERATOR
MGR
GM
SUP
GS
ANALYZE DATA

Barrick Nevada Investor Tour | 19
80 miles southwest of Elko150 years of mining1,250 employeesNew discoveries
0 miles 1 2 3 4 5
Pipeline
Cortez Hills OP
Gold Acres
Cortez Pits
Cortez Hills UG
LasVegas
Reno
Elko
Carson City
N E V A D A
Cortez
2016 Reserves
Proven 0.8 Moz1
(1.52 g/t, 16M tonnes)
Probable 9.4 Moz1
(2.18 g/t, 135M tonnes)
1. See endnote #1
Barrick Nevada Investor Tour | 20
Identified 37 targets for Minex work: – target delineation– drill testing– advanced exploration– resource delineation– reserve conversion
0 miles 1 2 3 4 5
Pipeline
Gold Acres Window
Gold Acres
Cortez Pits
WestCortez
Window
Cortez Hills OP
Cortez Hills UG
LasVegas
Reno
Elko
Carson City
N E V A D A
Cortez

Barrick Nevada Investor Tour | 21
Access through Range Front Declines– Road header advancing ahead of schedule– 3,000 feet of advancement in east portal
and 800 feet in west portal
Feasibility Study – Added Renegade Zone to reserve– In progress, completion 3Q17– Completed geotechnical assessments– Optimized autonomous haulage
Water Management– EIS will include a focus on ground water – Extensive monitoring provides confidence
in ground water model
Permitting– Submitted Mine Plan of Operations – Record of decision (ROD) expected 2019/2020
Barrick Nevada Investor Tour | 22
Phase I FeasibilityOn track for YE 2017 completion
Underground surface infrastructure design work in progress
20 drill holes complete (6,075m)
– Program completed March 2017
2017 results to date (from 2016 drilling)
– Average grade vs. model: +44%
– Average thickness vs. model: +63%
Adding 60 holes in 2017 to complete Red Hill program
ExplorationDecline Portal
CHOPcomplex
Goldrush DepositUG Workings
Declines~3 mile haul road

Barrick Nevada Investor Tour | 23
Repetitive Tasks
Stationary:– Rail haulage– Automated chute delivery– Engineered bin systems– Automated hoisting– Smart conveyors– Auger feed systems– Ore pass delivery
In motion:– Autonomous drilling – Autonomous mucking
Barrick Nevada Investor Tour | 24
High grade, high value targets with small footprintTarget identification along 3km prospective corridorStep-out holes north of high grade interceptsTightened drilling within area of high grade
1. Potential quantities and grades in these preliminary results are conceptual in nature and there has been insufficient exploration to define a mineral resource at this time and it is uncertain that further exploration will result in the target being delineated as a mineral resource. See end note #1 and Appendix A for additional details including assay results for the significant intercepts.
2017 Step Out
Holes
Mill Canyon StockPre-mineral Intrusive Rock
5.2m @ 14.4 g/t
5.8m @ 10.9 g/t14.3m @ 31.7 g/t5.8m @ 49.6 g/t
8.4m @ 30.6 g/t
2017 Tightened
Drill spacing
GOLDRUSH
LegendDrillhole with >3m @ 5g/tDrillholeResource Footprint

Barrick Nevada Investor Tour | 25
0 miles 1 2 3 4 5
Pipeline
Cortez Hills OP
Gold Acres
Cortez Pits
Cortez Hills UG
Cortez Pits
Cortez HillsCrossroads
Gold Acres
Gold Acres Pit Expansion
Additional Pipeline andCrossroads Phases Expansion of Pediment
Area of Cortez Hills
Expansion of the Cortez/F-Canyon Pits
Current Optionality
Pipeline
Barrick Nevada Investor Tour | 26
Waste rock dump cutback at Crossroads open pit complete and stripping second 50 foot alluvial bench
Advancing Phase I of Crossroads

Barrick Nevada Investor Tour | 27
Acquisition from Coral GoldDeal closed June 7, 2017Cash consideration of US$15.75 MReturn of 4.15 M common shares Sliding scale 1% to 2.25% NSRShallow, open pit, non-refractory oreRobertson part of a large land package spanning ~8,480 acres
Robertson Property
Pipeline
Cortez Hills OP
Gold Acres
Cortez Pits
0 miles 1 2 3 4 5
Barrick Cortez Property
Barrick Cortez Property
Process Facilities
Barrick Nevada Investor Tour | 28
Growth, extends mining and milling life for Barrick NevadaRealize synergies with the neighboring Cortez operationRobertson deposit located 4 miles north of the Cortez Pipeline MillExpected to fill gap in mill feed to oxide Cortez Pipeline Mill in ~2025Extends Cortez Pipeline Mill life to enable processing of Deep South UG Oxide OrePotential for exploration upside in untested areasLow estimated construction capital
Cortez Hills Open Pit
Robertson Exploration

Barrick Nevada Investor Tour | 29
50 miles northeast of ElkoNorth America’s largest gold mining operation40 Moz produced to date1,700 jobsNew projects at Arturo and Meikle Expansion
Process, Autoclave,Truckshop and Admin.
Betze-PostOpen Pit
Roaster
Meikle UG
Arturo
0 miles 1 2 3
LasVegas
Reno
Elko
Carson City
N E V A D A
Goldstrike
2016 Reserves
Proven 6.1 Moz1
(3.29 g/t, 57.5M tonnes)
Probable 2.0 Moz1
(4.70 g/t, 13.2M tonnes)
1. See endnote #1
Barrick Nevada Investor Tour | 30
1918 Exploration activity in area for antimony1946 Bootstrap discovered as gold deposit (Newmont)1962 Goldstrike discovered by Atlas1975 Polar Res. delineates No. 9 and Diorite deposits 1976 Polar & Pancana start small heap leach 3,200 ozs.1978 Western States enters in 50/50 JV with Pancana1982 Post discovered, 110M tons containing 3.5M ozs.1987 American Barrick acquires Goldstrike for $62M 1987 Betze and Screamer discovered 1988 Rodeo and Meikle discovered1990 Commissioned first autoclaves1996 Underground production begins2000 Commissioned roaster2006 Goldstrike produced 30 millionth ounce2012 25th Anniversary – Produced 40 millionth ounce2015 TCM Commercial Production2016 20th Anniversary – Meikle production

Barrick Nevada Investor Tour | 31
Underground potential additions in color– East Banshee / Meikle Contact / Barrel Dike /
West Banshee / Griffin 3880 / Extension / Ren
Open pit potential additions– Arturo & Other near mine opportunities
Identified 30 targets for Minex work
A
A1
Long Section A – A1 Betze Post Open PitMeikle Underground
Barrick Nevada Investor Tour | 32
Permitting for Betze-Post 5NW layback underwayAdded production from Arturo open pit to mine planAdditional Phases of Arturo utilizing existing mine equipment Mining and process facilities are permittedUnder evaluation– Leach pad feasibility / Economics /
Recoveries / Mining costs / In-pit backfill (backfilling not permitted)
Mining will expose new geology and potential deep UG exploration targets
Phase 1 Expl. TargetPhase 2 Mining complete July 2017
Phase 3 Expl. Target
Arturo
Betze-Post
5NW3NW
4NW

Barrick Nevada Investor Tour | 33
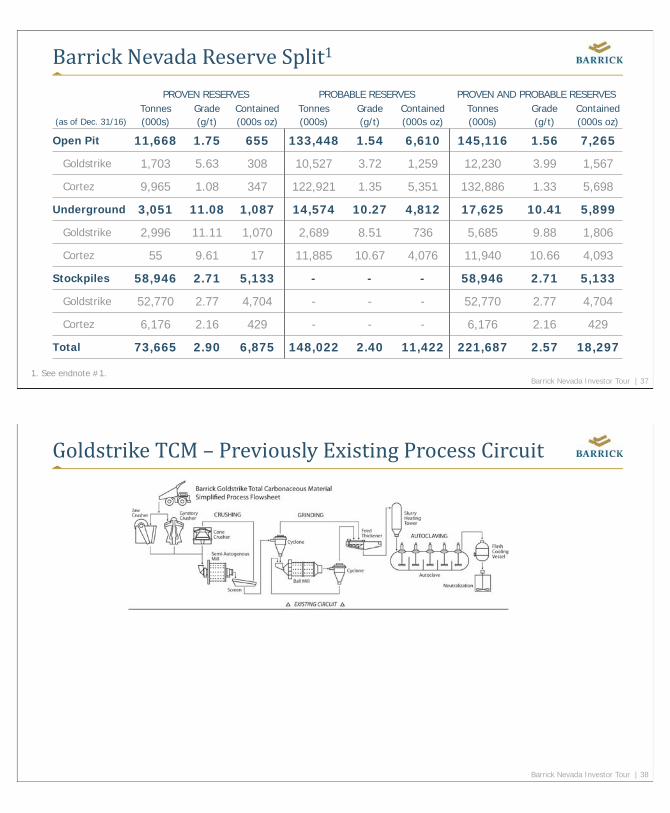
Evolving ore types dictate changing processes– Oxide heap leach and milling – Autoclaving for single refractory– Roasting for double refractory– TCM circuit for lower grade double
refractory ore
Currently processing TCM-Acid and Double Refractory RoasterTCM developed to treat double refractory ore stockpiled to dateBrings production forward and improves total mine economics 1987 1992 1997 2002 2007 2012 2017 2022 2027
Oxide
Single RefractoryAutoclave Double
Refractory Roaster
TCM-Acid Ore
Annual Gold Production (by process)
TCM-Alkaline Ore
CURRENT
Barrick Nevada Investor Tour | 34
TechnicalCost efficienciesEnabling technologiesLogistical improvementsLOM planning
OrganicExtending existing minesAdding new ore bodies to plan
PartneringNew ore bodiesNew process infrastructureOre swapping and tolls

Barrick Nevada Investor Tour | 35
ADDITIONAL INFORMATION
Barrick Nevada Investor Tour | 36
Tonnes Grade Contained(as of Dec. 31/16) (000s) (g/t) (000s oz)
P&P Reserves 221,687 2.57 18,297
Proven Reserves 73,665 2.90 6,875
Probable Reserves 148,022 2.40 11,422
Measured Resources 4,512 4.36 632
Indicated Resources 35,055 2.63 2,967
Inferred Resources 15,651 2.21 1,112
1. See endnote #1. Based on Barrick’s Cortez and Goldstrike mines as reported on pages 25-35 of Barrick’s 2016 Form 40- F/Annual Information Form.
Barrick Nevada Investor Tour | 37
PROVEN RESERVES PROBABLE RESERVES PROVEN AND PROBABLE RESERVESTonnes Grade Contained Tonnes Grade Contained Tonnes Grade Contained
(as of Dec. 31/16) (000s) (g/t) (000s oz) (000s) (g/t) (000s oz) (000s) (g/t) (000s oz)
Open Pit 11,668 1.75 655 133,448 1.54 6,610 145,116 1.56 7,265
Goldstrike 1,703 5.63 308 10,527 3.72 1,259 12,230 3.99 1,567
Cortez 9,965 1.08 347 122,921 1.35 5,351 132,886 1.33 5,698
Underground 3,051 11.08 1,087 14,574 10.27 4,812 17,625 10.41 5,899
Goldstrike 2,996 11.11 1,070 2,689 8.51 736 5,685 9.88 1,806
Cortez 55 9.61 17 11,885 10.67 4,076 11,940 10.66 4,093
Stockpiles 58,946 2.71 5,133 - - - 58,946 2.71 5,133
Goldstrike 52,770 2.77 4,704 - - - 52,770 2.77 4,704
Cortez 6,176 2.16 429 - - - 6,176 2.16 429
Total 73,665 2.90 6,875 148,022 2.40 11,422 221,687 2.57 18,297
1. See endnote #1.
Barrick Nevada Investor Tour | 38

Barrick Nevada Investor Tour | 39
Barrick Nevada Investor Tour | 40

Barrick Nevada Investor Tour | 41
Barrick Nevada Investor Tour | 42
Construction completed January 2015 at capital cost $610 million
Surpassed design production targets in Q2 2017– Currently processing acid ore, available
through Q2 2019– Trialling alkaline ore on a quarterly basis
starting in H2 2017
Alkaline ore impacts recovery negatively– Research ongoing at lab and plant scale
with respect to both autoclaving and CaTS leaching
– Alkaline ore variable cost per ton is ~34% lower than acid ore
Resin in leach Circuit
Reagent Recycle/Water Treatment
Thiosulphate Plant
AUTOCLAVES
Gold Elution

Barrick Nevada Investor Tour | 43
Mill Throughput(tons per operating hour)
562
554 558
546
576
566 566
593
571
565
620
May Jun Jul Aug Sep Oct Nov Dec Jan Feb Mar2016 2017
500May Jun Jul Aug Sep Oct Nov Dec Jan Feb Mar
2016 2017
TCM Recovery Rate(percent)
50
59.7
70.8
68.2 67.6
60.6
66.1 66.8
58.0
54.3
67.8
63.5
12 MonthRolling Avg.
Barrick Nevada Investor Tour | 44
Technology RefinementDesign defect eliminationMill throughput enhancementsReliability enhancementsStockpile analysis and validation
Best-in-ClassWTP modifications completeIncreased throughput by 80+ TPOH8.8% improvement in availabilityUnderstanding chemical impacts of acid vs alkaline ore

Barrick Nevada Investor Tour | 45
Cyanide free processing provides optionality to Barrick in jurisdictions where this is required
Allows Barrick to competitively explore for and exploit complex orebodies
Patented technology protects intellectual property and provides future revenue stream if leased
Barrick Nevada Investor Tour | 46
1 All significant intercepts calculated using a 5.0 g/t Au cutoff and are uncapped; internal dilution is less than 20% total width.2 True width of intercepts are uncertain at this stage.
A plan view DEM Hillshade image of Fourmile drilling showing significant intercepts as of February 9, 2017. Drill holes in red are high grade intercepts greater than 3.0 meters at greater than 5.0 gpt. The significant intercepts presented were calculated using a 5.0 g/t Au cutoff with internal dilution of no more than 20% included in the calculation. No capping grade was used to calculate the significant intercepts.
The drilling results for the Fourmile property contained in this presentation have been prepared in accordance with National Instrument 43-101 – Standards of Disclosure for Mineral Projects. All drill hole assay information has been manually reviewed and approved by staff geologists and re-checked by the project manager. Sample preparation and analyses are conducted by an independent laboratory. Procedures are employed to ensure security of samples during their delivery from the drill rig to the laboratory. The quality assurance procedures, data verification and assay protocols used in connection with drilling and sampling on the Fourmileproperty conform to industry accepted quality control methods.
Fourmile – Significant Intercepts1 GRC 0427D, GRC 0435D, FM16 05D, and FM16 10D
Core Drill Hole Azimuth Dip Interval (m) Width (m)2 Au (g/t)
GRC-0427D NA -90
666.9-672.7 5.8 10.9
695.3-709.6 14.3 31.8
921.4-927.2 5.8 49.6
GRC-0435D NA -90 702.2-707.4 5.2 14.4
FM16-05D NA -90 705.6-714.0 8.4 30.6
FM16-10D 357 -77 730.6-733.6 3.0 5.7

Barrick Nevada Investor Tour | 47
APPENDIX B –
Barrick Nevada Investor Tour | 48
Barrick Nevada
Tonnes Mined(000s)
Barrick NevadaTotal
Barrick NevadaGoldstrike
Barrick Nevada Cortez
2016 2015 2014 2016 2015 2014 2016 2015 2014
Total 192,753 223,661 233,556 67,834 72,304 81,410 124,919 151,357 152,146
Open Pit 189,941 221,501 231,369 66,040 70,836 79,807 123,901 150,665 151,562
Underground 2,812 2,160 2,187 1,794 1,468 1,603 1,018 692 584
APPENDIX B

Barrick Nevada Investor Tour | 49
Barrick Nevada
Average Mined Grade(grams/tonne)
Barrick NevadaTotal
Barrick NevadaGoldstrike
Barrick Nevada Cortez
2016 2015 2014 2016 2015 2014 2016 2015 2014
Open Pit Mined 1.74 1.87 1.43 5.74 4.17 4.67 1.30 1.06 0.62
Underground Mined 11.39 13.40 13.02 9.85 9.58 8.84 14.48 21.49 24.48
Processed 2.62 2.72 2.18 5.65 6.01 6.28 1.73 1.73 1.34
APPENDIX B
Barrick Nevada Investor Tour | 50
Barrick Nevada
Tonnes Processed (000s)
Barrick NevadaTotal
Barrick NevadaGoldstrike
Barrick Nevada Cortez
2016 2015 2014 2016 2015 2014 2016 2015 2014
Total 32,473 29,158 31,264 7,361 6,752 5,307 25,112 22,406 25,957
Oxide Mill 4,197 3,476 3,727 18 - - 4,179 3,476 3,727
Roasters 4,789 5,050 5,187 3,928 4,232 4,432 861 818 755
Autoclave 3,503 2,605 1,024 3,415 2,520 875 88 85 149
Heap Leach 19,984 18,027 21,326 - - - 19,984 18,027 21,326
APPENDIX B

Barrick Nevada Investor Tour | 51
Barrick Nevada
Cost per Tonnes Processed ($/tonnes)
Barrick Nevada
2016 2015 2014
Oxide Mill 12 13 12
Roasters 24 25 26
Autoclave 60 62 92
Heap Leach 0.97 1.17 1.40
APPENDIX B
Barrick Nevada Investor Tour | 52
Barrick Nevada
Recovery Rate(%)
Barrick Nevada
2016 2015 2014
Total 79% 80% 82%
Oxide Mill 88% 87% 84%
Roasters 90% 89% 86%
Autoclave 63% 59% 75%
APPENDIX B

Barrick Nevada Investor Tour | 53
Barrick Nevada
Production (k ounces)
Barrick Nevada
2016 2015 2014
Total 2,155 2,052 1,804
Oxide Mill 569 530 468
Roasters 1,115 1,177 963
Autoclave 242 204 148
Heap Leach 229 141 225
APPENDIX B
Barrick Nevada Investor Tour | 54
Barrick Nevada
Production Costs($/oz)
Barrick Nevada
2016 2015 2014
Cost of Sales 876 782 755
Operating Costs 477 477 505
Royalties and production taxes 25 27 31
Cash Cost1 502 504 536
Depreciation 372 270 219
Total Production Costs 874 774 755
All-in Sustaining Costs1 618 631 782
1. These are non-GAAP financial performance measures with no standardized meaning under IFRS and therefore may not be comparable to similar measures of performance presented by other issues. For further information and a detailed reconciliation of the non-GAAP measures used in this slide to the most directly comparable IFRS measure, please see Appendix C
APPENDIX B

Barrick Nevada Investor Tour | 55
Barrick Nevada
Capital Expenditures ($ millions)
Barrick Nevada
2016 2015 2014
Minesite Sustaining Capex 217 211 416
Project Capex 111 145 331
Total Capital Expenditures 328 356 747
APPENDIX B
Barrick Nevada Investor Tour | 56
1. Estimated in accordance with National Instrument 43-101 as required by Canadian securities regulatory authorities. Estimates are as of December 31, 2016, unlessotherwise noted. For United States reporting purposes, Industry Guide 7 under the Securities and Exchange Act of 1934 (as interpreted by Staff of the SEC),applies different standards in order to classify mineralization as a reserve. Complete mineral reserve and mineral resource data for all mines and projectsreferenced in this presentation, including tonnes, grades, and ounces, can be found on pages 25-35 of Barrick’s 2016 Form 40- F/Annual Information Form.
The following qualified persons, as that term is defined in National Instrument 43-101 – Standards of Disclosure for Mineral Projects, have reviewed and approved therelevant scientific and technical information contained in this presentation: Rob Krcmarov, Executive Vice President Exploration and Growth of Barrick, Rick Sims,Registered Member SME, Senior Director, Resources and Reserves of Barrick, Patrick Garretson, Registered Member SME, Senior Director, Life of Mine Planning ofBarrick and Steven Haggarty, P. Eng., Senior Director, Metallurgy of Barrick.

AAppendix C – Reconciliation of Gold Cost of Sales to Cash costs, All-in sustaining costs and All-in costs, including on a per ounce basis
"Cash costs" per ounce and "All-in sustaining costs" (also referred to as “AISC”) per ounce are non-GAAP financial performance measures. “Cash costs” start with our cost of sales related to gold production and removes depreciation, the non-controlling interest of cost of sales and includes by-product credits. “All-in sustaining costs” start with “cash costs” and include sustaining capital expenditures, general & administrative costs, minesite exploration and evaluation costs and reclamation cost accretion and amortization. Barrick believes that the use of "cash costs" per ounce and "all-in sustaining costs" per ounce will assist investors, analysts and other stakeholders in understanding the costs associated with producing gold, understanding the economics of gold mining, assessing our operating performance and also our ability to generate free cash flow from current operations and to generate free cash flow on an overall Company basis. "Cash costs" per ounce and "All-in sustaining costs" per ounce are intended to provide additional information only and do not have any standardized meaning under IFRS. Although a standardized definition of all-in sustaining costs was published in 2013 by the World Gold Council (a market development organization for the gold industry comprised of and funded by 18 gold mining companies from around the world, including Barrick), it is not a regulatory organization, and other companies may calculate this measure differently. These measures should not be considered in isolation or as a substitute for measures prepared in accordance with IFRS. Further details on these non-GAAP measures are provided in the MD&A accompanying Barrick's financial statements filed from time to time on SEDAR at www.sedar.com and on EDGAR at www.sec.gov.
($ millions, except per ounce information in dollars) For the years ended December 31
Footnote 2016 2015 2014
Cost of sales related to gold production $ 1,896 $ 1,551 $ 1,340
Depreciation (807) (537) (389)
By-product credits 1 (2) (2) (1)
Non-recurring items 2 - (12) -
Non-controlling interests - - -
Cash costs $ 1,087 $ 1,000 $ 950
General & administrative costs - - -
Minesite exploration and evaluation costs 3 10 12 3
Minesite sustaining capital expenditures 4 217 211 415
Rehabilitation - accretion and amortization (operating sites) 5 26 27 19
Non-controlling interests (4) - -
All-in sustaining costs $ 1,336 $ 1,250 $ 1,387
Project exploration and evaluation and project costs 3 19 40 68
Project capital expenditures 4 141 159 319
Non-controlling interests (30) (31) (5)
All-in costs $ 1,466 $ 1,418 $ 1,769
Ounces sold - equity basis (000s ounces) 2,162 1,981 1,773
Cost of sales per ounce 6,7 $876 $782 $755
Cash costs per ounce 7 $ 502 $ 504 $ 536
Cash costs per ounce (on a co-product basis) 7,8 $ 503 $ 505 $ 537
All-in sustaining costs per ounce 7 $ 618 $ 631 $ 782
All-in sustaining costs per ounce (on a co-product basis) 7,8 $ 619 $ 632 $ 783
All-in costs per ounce 7 $ 678 $ 715 $ 998
All-in costs per ounce (on a co-product basis) 7,8 $ 679 $ 716 $ 999

1 By-product credits
Revenues include the sale of by-products for our gold mines.
2 Non-recurring items
Non-recurring items in 2015 consist of $12 million of costs arising from a change in our supplies inventory obsolescence provision. These costs are not indicative of our cost of production and have been excluded from the calculation of cash costs.
3 Exploration and evaluation costs
Exploration, evaluation and project expenses are presented as minesite sustaining if it supports current mine operations and project if it relates to future projects.
4 Capital expenditures
Capital expenditures are related to our gold sites only and are presented on a 100% accrued basis. They are split between minesite sustaining and project capital expenditures. Project capital expenditures are distinct projects designed to increase the net present value of the mine and are not related to current production. Significant projects in the current year are Arturo and Cortez Lower Zone.
5 Rehabilitation - accretion and amortization
Includes depreciation on the assets related to rehabilitation provisions of our gold operations and accretion on the rehabilitation provision of our gold operations, split between operating and non-operating sites.
6 Cost of sales per ounce
Cost of sales related to gold per ounce is calculated using cost of sales on an attributable basis (removing the non-controlling interest from cost of sales), divided by attributable gold ounces.
7 Per ounce figures
Cost of sales per ounce, cash costs per ounce, all-in sustaining costs per ounce and all-in costs per ounce may not calculate based on amounts presented in this table due to rounding.
8 Co-product costs per ounce
Cash costs per ounce, all-in sustaining costs per ounce and all-in costs per ounce presented on a co-product basis remove the impact of by-product credits of our gold production (net of non-controlling interest) calculated as:
($ millions) For years ended December 31
2016 2015 2014
By-product credits $ 2 $ 2 $ 1
Non-controlling interest - - -
By-product credits (net of non-controlling interest) $ 2 $- $ 1

Barrick Nevada
Investor Tour | June 20-21, 2017
Digital EnterpriseTransformation
Strategy

Digital Enterprise Transformation Strategy
Investors Visit
20 June 2017
2Barrick
Our Strategic Intent is to transform Barrick into a Digital Enterprise
Substantial effort has been made in 2016 and Q1 2017 to initiate digital Barrick transformation
Multiple quick-wins achieved in Cortez test-site, under-time and under-budget.
Achieved significant levels of buy-in at every level of leadership.
Proven value of in-house product design system (CodeMine)
Early adoption of ‘Agile’ methods
Identified the value-adding and transformational potential of digital across the whole enterprise
An agile, highly productive, safe, environmentally friendly, socially responsible, and low cost digital enterprise that leverages technology and data as a competitive advantage.
“A tech company that does mining not a mining company that does tech”

3Barrick 3
Barrick is now moving from Digital Projects to Setting up the Digital Organization
SOURCE: Digital McKinsey
Digital Maturity for Companies
Initial initiatives Digital projects Derive vision and
overarching transformation roadmapCentralize projects Build up digital capabilities
Digital business contributes substantially to revenueDigital is integral to corporate design andoperations"Digital culture" is embraced
Digital is dominant corporate element Full digital organization with jointly drawn digital resources
DES
CR
IPTI
ON
Isolated initiatives in various areas Largely uncoor-dinated activities, no budgets
Set up digital orgEstablished digital org
Digital enterprise
Initial creation of transparency over existing initiatives Prioritization and first efforts to bundle activities into projects
OR
GA
NIZ
ATIO
N
Build up digital or-ganization including dedicated digital owners e.g. CDO Transform head-office functions, reducing central costs
Established digital organizationIncreased investment in innovation now possible
CDO organization removedDigital integral to all competency profiles
No dedicated digital unit
Small competence center Projects still managed by units
12
34
5
Moving from step to step in digital maturity requires transformational effort to succeed
4Barrick
What are our transformation
Principles1. 21st Century technology at every level
2. Built for miners by miners
3. Change the culture - every function will change.
4. Provide data and analytics insight at every level of the business
5. Achieve dominance of our data governance, privacy and security
6. Relentless pursuit of excellence

55
User-Centric Design Thinking ensures front-line input & buy-in
Design Thinking is a user-centered problem solving approach. It starts with an ideal or vision of what we need, and we work backwards to build a solution that gets us there. We balance user needs with business goals.
Here (1) Joe discusses the day’s plan with the team using paper maps of the mine. In the truck, Joe has a duplicate set of paper maps (2) that help him navigate from place to place to check progress. He has a planned route, but can get redirected via radio calls which are constant in the background. Joe describes his job as a Supervisor as being “open ended” after a certain point. After morning meetings and predefined planning for the day, anything can happen. This (3) was an impromptu meeting about how to address an issue in a heading.
1 2
3
By spending time with the frontline and creating ‘user councils’, we gain empathy for and a deep understanding of their daily pain points

77
Insights come from walkthroughs of major processes like Maintenance, seeing what workers experience every day
8
Start with the minimal viable product (covering 80% of customers)
Evolve over time for what we really need
Rapid digitization Agile approachTraditional “waterfall” project delivery
“This is a big and long project, let's make sure we capture everything, otherwise we are never going to get it”
What we want (and would originally build)
Solutions are created using an Agile approach: focusing on the “minimal requirements” onto which new features are progressively built

9
Agile is run on 2 week sprints ensuring constant prioritization of features and control of spend
Time-boxed “Sprint” Cycles
PRODUCT OWNER SCRUM MASTER
DEVELOPMENT TEAM DEVELOPMENT TEAM Development team
DEVELOPMENT TEAM
Time-boxedTest/Develop(No changes)
WORKING CODE READY FOR DEPLOYMENT
Sprint Planning Review product backlogEstimate sprint backlogCommit
Daily Stand upProgress since last stand upPlan for todayRoadblocks/Impediments?
Sprint Review Demo features to allRetrospective on the improving next sprintMake investment decision
Sprint RetrospectiveDone after each sprintAims to improve the process for next sprint
Sprint BacklogFeatures for a SprintEstimated by teamTeam commitment
Product BacklogUser-focused prioritized product features
Product Backlog Sprint Backlog
1011010011101000
The CodeMine creates a comfortable space for operators, executives and digital developers to collaborate in a natural way otherwise difficult in a traditional office or field context. In addition to facilitating collaboration, the CodeMine replicates a “Silicon Valley” environment that inspires innovation and creativity
11100001
We constructed this collaborative space to enable our digital transformation
s to collaborate in a natural way

Barrick Nevada
Investor Tour | June 20-21, 2017
Analytics andUnified Operations
Center

DIG
ITA
L TR
AN
SFO
RM
ATI
ON
AN
D
INN
OV
ATI
ON
IN N
EVA
DA
AN
ALY
TICS
AN
D U
NIF
IED
O
PERA
TIO
NS
CEN
TER
(AU
OPS
)
WH
AT
IS T
HE
AU
OPS
CEN
TER
?
The
Bar
rick
Nev
ada
An
alyt
ics
and
Un
ifi e
d
Ope
rati
ons
(AU
Ops
) C
ente
r w
ill g
et t
he r
ight
info
rmat
ion
to t
he r
ight
peo
ple
at t
he r
ight
tim
e to
en
hanc
e de
cisi
on-m
akin
g. It
wil
l
impr
ove
the
Com
pany
’s ab
ilit
y to
iden
tify
and
capi
tali
ze o
n o
ppor
tun
itie
s th
at m
itig
ate
risk
s
acro
ss o
pera
tion
s, h
ealt
h an
d sa
fety
and
the
envi
ron
men
t or
impr
ove
reve
nue
and
dri
ve
cost
-sav
ings
– a
ll in
rea
l or
near
-rea
l tim
e.
WH
AT
ARE
TH
E BE
NEF
ITS?
Eas
y-to
-rea
d vi
sual
s an
d gr
aph
ics
wil
l allo
w
anal
ysts
loca
ted
at t
he c
ente
r to
und
erst
and
how
min
ing
oper
atio
ns
are
perf
orm
ing
and
dri
ll do
wn
into
dat
a to
exa
min
e w
hat i
s d
rivi
ng
thos
e re
sult
s, d
evel
opin
g ac
tion
able
insi
ghts
muc
h m
ore
quic
kly.
An
alys
ts c
an t
hen
dec
ide
who
to c
onta
ct a
t the
ope
rati
ons,
fro
m f
ront
line
oper
ator
s to
sit
e ge
nera
l man
ager
s, w
ith
rele
vant
info
rmat
ion
and
adv
ise
them
acc
ord
ingl
y. T
his
give
s th
e C
ompa
ny r
eal-
tim
e ca
pabi
lity
to k
now
wha
t act
ion
s ar
e be
ing
take
n a
nd t
he p
oten
tial
impa
cts
of t
hose
act
ion
s.
BELO
W A
RE A
FEW
EX
AM
PLES
O
F H
OW
AU
OPS
WIL
L EN
HA
NCE
D
ECIS
ION
-MA
KIN
G.
•
Hea
lth
an
d s
afet
y al
erts
wil
l pop
up
on s
cree
n to
ind
icat
e th
e se
riou
snes
s of
a
situ
atio
n a
nd a
ctio
ns
requ
ired
to r
esol
ve
it. I
t wil
l dis
play
the
impa
ct to
cos
t and
tim
e an
d pr
oduc
e an
act
ion
log
for
use
as
a sy
stem
of r
ecor
d.
•
Pred
icti
ve a
nal
ysis
wil
l tri
gger
an
ala
rm
base
d on
the
pro
babi
lity
of e
quip
men
t
failu
re. I
t wil
l dis
play
the
cos
t to
repl
ace
equ
ipm
ent n
ow v
ersu
s th
e co
st to
rep
lace
it if
de-
prio
riti
zed.
•
Pred
icti
ve c
on
sum
able
s w
ill t
rigg
er
an a
larm
bas
ed o
n a
n o
verr
un
of a
mea
sure
d co
nsu
mab
le. T
his
wou
ld p
rom
pt
a d
iscu
ssio
n b
etw
een
an
an
alys
t and
an
oper
ator
or
supe
rvis
or to
und
erst
and
the
impa
ct o
f the
ir a
ctio
ns.
•
Pro
du
ctio
n s
tatu
s w
ill d
ispl
ay
perf
orm
ance
acr
oss
oper
atin
g te
ams,
iden
tify
the
equ
ipm
ent t
hey
are
usi
ng a
nd
mon
itor
key
per
form
ance
ind
icat
ors
and
perf
orm
ance
met
rics
. Th
is w
ill h
elp
to
iden
tify
team
s th
at a
re p
erfo
rmin
g w
ell a
nd
dri
ve b
est-
in-c
lass
ope
rato
r pe
rfor
man
ce.

To le
arn
mor
e ab
out
Barri
ck’s
digi
tal
trans
form
atio
n, p
leas
e sc
an th
e Q
R Co
de to
visi
t ou
r web
site.
HO
W A
U O
PS W
ORK
S

Barrick Nevada
Investor Tour | June 20-21, 2017
Cortez Hills Underground:Impact Drivers

IMPACT DRIVERS
Achieving impact through SIC at Cortez UG involves two main im-provements composed of several drivers
Beginning of shift Reduced time locating equipment Decrease length of lineout meeting Minimize time travelled from admin to UG
Effectiveshiftlength
Through-put
Impact
During shift Shorten of operator’s breaks
End of shiftEnsure operators are tasked until EOD Minimize travel from UG to admin
Improved bottleneck management
Improved reaction to unpredicted tasks
Increase traffic flow
a
b
c
d
f
e

PRODUCTION METRICS
UG – Total Feet Advanced
0
200
400
600
800
1000
1200
3/24/2017 3/31/2017 4/7/2017 4/14/2017 4/21/2017 4/28/2017 5/5/2017 5/12/2017 5/19/2017 5/26/2017 6/2/2017 6/9/2017
Feet
Adv
ance
d
Sum of Advance
Sum of Footage Target
4 per. Mov. Avg. (Sum of Advance)
UG – Development Feet
0
50
100
150
200
250
300
350
400
450
500
3/24/2017 3/31/2017 4/7/2017 4/14/2017 4/21/2017 4/28/2017 5/5/2017 5/12/2017 5/19/2017 5/26/2017 6/2/2017 6/9/2017
Development Feet
Sum of DevFeet
Sum of Dev Ft Target
4 per. Mov. Avg. (Sum of DevFeet)
UG – Mining Type
0
100
200
300
400
500
600
3/24/2017 3/31/2017 4/7/2017 4/14/2017 4/21/2017 4/28/2017 5/5/2017 5/12/2017 5/19/2017 5/26/2017 6/2/2017 6/9/2017
Sum of DrillFillFeet
4 per. Mov. Avg. (Sum of DrillFillFeet)
0
50
100
150
200
250
3/24/2017 3/31/2017 4/7/2017 4/14/2017 4/21/2017 4/28/2017 5/5/2017 5/12/2017 5/19/2017 5/26/2017 6/2/2017 6/9/2017
Stope Feet
Sum of StopeFeet
Sum of Stope Dev Target
4 per. Mov. Avg. (Sum of StopeFeet)
UG – Backfill (CRF)
0
2,000
4,000
6,000
8,000
10,000
12,000
14,000
16,000
18,000
20,000
3/24/2017 3/31/2017 4/7/2017 4/14/2017 4/21/2017 4/28/2017 5/5/2017 5/12/2017 5/19/2017 5/26/2017 6/2/2017 6/9/2017
CRF
Tons
Sum of CRF
Sum of CRF Target
4 per. Mov.Avg. (Sum of CRF)

PRODUCTION METRICS
UG – Drill - Availability
0
10
20
30
40
50
60
70
80
90
100
3/24/2017 3/31/2017 4/7/2017 4/14/2017 4/21/2107 4/28/2017 5/5/2017 5/12/2017 5/19/2017 5/26/2017 6/2/2017 6/9/2017
% A
vaila
ble
Bolter
Average of BolterAvail
Average of BolterAvail
4 per. Mov. Avg. (Average of BolterAvail)
0
10
20
30
40
50
60
70
80
90
100
3/24/2017 3/31/2017 4/7/2017 4/14/2017 4/21/2107 4/28/2017 5/5/2017 5/12/2017 5/19/2017 5/26/2017 6/2/2017 6/9/2017
% A
vaila
ble
Jumbo
Average of JumboAvail
Average of Drill Avail Target
4 per. Mov. Avg. (Average of JumboAvail)
UG – Loader/Truck - Availability
75
80
85
90
95
100
3/24/2017 3/31/2017 4/7/2017 4/14/2017 4/21/2017 4/28/2017 5/5/2017 5/12/2017 5/19/2017 5/26/2017 6/2/2017 6/9/2017
% A
vaila
ble
Loader
Average of LoaderAvail
Average of Loader Avail Tgt
4 per. Mov. Avg. (Average of LoaderAvail)
0
10
20
30
40
50
60
70
80
90
100
3/24/2017 3/31/2017 4/7/2017 4/14/2017 4/21/2017 4/28/2017 5/5/2017 5/12/2017 5/19/2017 5/26/2017 6/2/2017 6/9/2017
% A
vaila
ble
Trucks
Average of TruckAvail
Average of Truck Avail Tgt
4 per. Mov. Avg. (Average of TruckAvail)
UG – Drill/Bolter – Utilization
0
10
20
30
40
50
60
70
80
90
100
3/24/2017 3/31/2017 4/7/2017 4/14/2017 4/21/2017 4/28/2017 5/5/2017 5/12/2017 5/19/2017 5/26/2017 6/2/2017 6/9/2017
Bolter
0
10
20
30
40
50
60
70
80
90
100
3/24/2017 3/31/2017 4/7/2017 4/14/2017 4/21/2017 4/28/2017 5/5/2017 5/12/2017 5/19/2017 5/26/2017 6/2/2017 6/9/2017
Jumbo
per/. Mov. Avg. (Average of
UG – Loader/Truck – Utilization
0
10
20
30
40
50
60
70
80
90
100
3/24/2017 3/31/2017 4/7/2017 4/14/2017 4/21/2017 4/28/2017 5/5/2017 5/12/2017 5/19/2017 5/26/2017 6/2/2017 6/9/2017
Loader
0
10
20
30
40
50
60
70
80
90
100
3/24/2017 3/31/2017 4/7/2017 4/14/2017 4/21/2017 4/28/2017 5/5/2017 5/12/2017 5/19/2017 5/26/2017 6/2/2017 6/9/2017
Truck

WHAT IS SIC?
What is SIC?
Short Interval Control (SIC) is ensuring compliance to a detailed schedule of tasks and results. This is done by supervising the production in real-time and adjusting schedules as events occur during the shift.
Why are we doing this?
How is this going to affect me?
Higher production, lower costs, job security through extended mine life, developing a new skillset by being part of one of newest technological advances in mining, total familiarization with a system that soon will be a standard through-out mining and a safer work environment.
This system is just a tool to help safety, increase production,and efficiency. These are enhanced by availability of more accurate information, ability to make and communicate changes in real time, and reduced reaction time.

WAIT TIME
487
990
557282
1,649922
478
81
159 4422504773113
181233515
15:00-20:00
10:00-15:00
1,035
35:00-40:00
25:00-30:00
123
30:00-35:00
20:00-25:00
103
>40:00
69
147
194340
2,136
5:00-10:00
2:00-5:00
1,912
Number of Wait time for Haul trucks1
# - Count
1 Data excludes wait time under 2 min or above 2 hours
Average Daily Wait Time1 for Haul truck- 2017 Min
Wait time has been trending downward since MOC-C has been staffed and tablet issues have been minimized
2400+ instances where wait time has exceed more than 15 minutes
Avg wait at batch plant is 9:26
Avg. wait at loader 11:01
At Batchplant Other
0:00:00
0:02:53
0:05:46
0:08:38
0:11:31
0:14:24
0:17:17
0:20:10
0:23:02
5/17
/201
75/
18/2
017
5/19
/201
75/
20/2
017
5/21
/201
75/
22/2
017
5/23
/201
75/
24/2
017
5/25
/201
75/
26/2
017
5/27
/201
75/
28/2
017
5/29
/201
75/
30/2
017
5/31
/201
76/
1/20
176/
4/20
176/
5/20
176/
6/20
176/
7/20
176/
8/20
176/
9/20
176/
10/2
017
6/11
/201
7 6/
12/2
017
6/13
/201
7
Avg. wait time: 10:46

SHIFT EXTENDER
-
4/3/20
17
4/6/20
17
4/9/20
17
4/12/2
017
4/15/2
017
4/18/2
017
4/21/2
017
4/24/2
017
4/27/2
017
4/30/2
017
5/3/20
17
5/6/20
17
5/9/20
17
5/12/2
017
5/15/2
017
9:57:36
10:04:48
10:12:00
10:19:12
10:26:24
10:33:36
10:40:48
10:48:00
5/6/20
17
5/7/20
17
5/8/20
17
5/9/20
17
5/10/2
017
5/12/2
017
5/13/2
017
5/14/2
017
5/15/2
017
5/16/2
017
Avg. Shift Length for Haul TrucksTime
Daily production - 3 Day Rolling Avg. Tons per day
Avg. daily production has increased Inadequate data to monitor trends
Current avg. is same as avg. YTD shift length from Jigsaw
Avg. Shift length:10:22

OPERATOR EXCELLENCE: BOLTS BY CREW
5,490
3,384
4,3364,0474,475
3,954
2,673
3,994
7,280
5,9836,065
5,179
3,383
2,468
5,0694,876
AprFeb Mar May
Crew B Crew C Crew A Crew D Bolts1 installed by crew per month in 2017 Number of Bolts
1 8' bolts only. Excluding 12' & 16' bolts

OPERATOR EXCELLENCE: JUMBO
4,614
2,328
3,643
1,981
3,5553,400
2,336
3,608
4,844
4,0594,391
4,0634,423
3,556
4,662
3,354
AprFeb Mar May
Crew B Crew C Crew A Crew D Total Feet drilled by crew per month in 2017 Feet

List all operators
10
3040
60
80
50
0
70
20
Crew D Crew C Crew B Crew A
Buckets per operating hours Buckets per hour
By operator By crew
# of buckets # of buckets
OPERATOR EXCELLENCE: MUCKER
List alloperators
10
3040
60
80
50
0
70
20
Crew DCrew CCrew BCrew A
Buckets per operating hoursBuckets per hour
By operator By crew
# of buckets # of buckets
8
16
1210 10
18
1412
0
10
5
20
15
Miner 4 Miner 1 Miner 2 Miner 3
56
70
5450
6575
6260

OPERATOR EXCELLENCE: TRUCKS
8
1612
10 10
1814
1210
20
15
5
0Miner 4 Miner 3 Miner 1 Miner 2
5670
545065
756260
80
20
0
60
40
Crew A Crew C Crew D Crew B
Loads per operating hours Loads per hour
By operator By crew
Sample Charts for Mucker
# of loads # of loads
9
67
5
1
422 2
01
6 67
89
8
0
10
2
64
Miner 1 Miner 3 Miner 4 Miner 2
Ore to Surface Waste to Surface Wastefill CRF Backfill
90
6070
5026
40
9
4560
7090
4020
8060
100
0Crew B Crew C
4060
20
Crew A
1323
Crew D

OPERATOR EXCELLENCE: BOLTS BY OPERATOR
289
2,938
5,004
3,240
4,730
300726
3,510
5,505
387746
230
3,1513,057
5,503
359
2,113
941
4,312
323
3,0553,270
963
2,518
586
1,877
324364
387
3,8834,232
Min
er 6
Min
er 1
4
Min
er 1
1
Min
er 9
Min
er 1
0
Min
er 1
5
Min
er 1
2
Min
er 1
3
Min
er 8
Min
er 7
Min
er 1
6
Min
er 1
7
Min
er 1
8
Min
er 2
0
Min
er 2
2
Min
er 1
9
Min
er 2
5
Min
er 2
3
Min
er 2
6
Min
er 2
1
Min
er 2
4
Min
er 5
Min
er 2
9
Min
er 2
8
Min
er 3
2
Min
er 2
7
Min
er 3
3
Min
er 3
4
Min
er 3
0
Min
er 3
1
Min
er 3
5
656
2,237
Min
er 4
Min
er 1
Min
er 2
Min
er 3
1,861
Min
er 3
6
1,1811,608
Bolts1 installed by operator in Feb – May 2017 Number of Bolts2
1 8' bolts only. Excluding 12' & 16' bolts 2 Excludes all operators who installed under 200 bolts

OPERATOR EXCELLENCE: LOADER
551
1070
248
1,053
796
264
1,386
1,589
1,350
758935
584460482
914
AprFeb Mar May
Crew B Crew C Crew A Crew D Total bucket by crew per month in 2017 # of buckets