Barings International Umbrella Fund
124
Barings International Umbrella Fund (an umbrella fund constituted as an open-ended unit trust established pursuant to the Unit Trusts Act, 1990) Annual Report & Audited Financial Statements For the financial year ended 30 April 2021
Transcript of Barings International Umbrella Fund

Barings International Umbrella Fund(an umbrella fund constituted as an open-ended unit trustestablished pursuant to the Unit Trusts Act, 1990)
Annual Report & Audited Financial Statements For the financial year ended 30 April 2021

Barings International Umbrella FundAnnual Report and Audited Financial Statements
ContentsFor the financial year ended 30 April 2021
Directors and Other Information 1
Introduction 3
Investment Objective and Policy 4
Report of the Manager 6
Annual Depositary Report to Unitholders 8
Independent Auditors’ Report 9
Investment Managers’ Report 13
Statement of Financial Position 23
Statement of Comprehensive Income 27
Statement of Changes in Net Assets Attributable to Holders of Redeemable Participating Units 31
Notes to the financial statements 35
Schedule of InvestmentsBarings ASEAN Frontiers Fund 72
Barings Asia Growth Fund 75
Barings Australia Fund 78
Barings Europa Fund 80
Barings Hong Kong China Fund 82
Barings Global Bond Fund 86
General information (Unaudited) 90
Appendix 1 – Information for investors in Switzerland (Unaudited) 91
Appendix 2 – Information for Investors in Germany (Unaudited) 100
Appendix 3 – Additional information Hong Kong Code (Unaudited) 101
Appendix 4 – Significant Changes in Portfolio Composition (Unaudited) 114
Appendix 5 – Disclosure of Remuneration (Unaudited) 120

1
Barings International Umbrella FundDirectors and Other Information
Directors of the ManagerAlan Behen (Irish)Peter Clark (British)**James Cleary† (Irish)***David Conway† (Irish) Barbara Healy† (Irish) Timothy Schulze (United States)*Paul Smyth (Irish)Julian Swayne (British) * Timothy Schulze resigned as Director of the Manager with effect from10 August 2020.** Peter Clark resigned as Director of the Manager with effect from21 October 2020.*** James Cleary resigned as Director of the Manager with effect from31 December 2020.† Non-executive Directors independent of the Investment Manager.
ManagerBaring International Fund Managers (Ireland) Limited70 Sir John Rogerson’s QuayDublin 2D02 R296 Ireland
Investment Managers Baring Asset Management Limited 20 Old BaileyLondon EC4M 7BF United Kingdom
Baring Asset Management (Asia) Limited* 35th Floor, Gloucester Tower 15 Queen’s Road Central Hong Kong
Investment Managers (continued)Barings LLC*300 S. Tryon StreetSuite 2500 CharlotteNorth Carolina 28202United States
Baring Japan Limited**7F Kyobashi Edogrand 2-2-1,Kyobashi Chuo-ku Tokyo 104-0031 Japan
* Baring Asset Management (Asia) Limited and Barings LLC are the delegated Sub-Investment Managers of the relevant funds as detailed in the Investment Manager’s reports of the relevant funds.** Barings Japan Limited was appointed as an additional Sub-Investment Manager with effect from 5 November 2020.
Depositary Northern Trust Fiduciary Services (Ireland) LimitedGeorges Court54-62 Townsend StreetDublin 2D02 R156 Ireland

2
Barings International Umbrella FundDirectors and Other Information (continued)
Administrator and Registrar Northern Trust International Fund Administration Services (Ireland) Limited Georges Court54-62 Townsend StreetDublin 2D02 R156Ireland
Company SecretaryMatsack Trust Limited 70 Sir John Rogerson’s Quay Dublin 2 D02 R296Ireland
Independent Auditors PricewaterhouseCoopers One Spencer Dock North Wall Quay Dublin 1 D01 X9R7Ireland
Legal Advisers and Sponsoring BrokerAs to Irish Law Matheson70 Sir John Rogerson’s Quay Dublin 2 D02 R296 Ireland
As to Hong Kong Law Deacons Alexandra House 16-20 Chater RoadCentral Hong Kong
Paying agents UniCredit Bank Austria AG Schottengasse 6-8 1010 Vienna Austria
BNP Paribas Securities Services 9 rue du Débarcadère 93500 Pantin Cedex France
Deutsche Bank AG Global Transaction Banking Issuer Services - Global Securities Services Post IPO Services Taunusanlage 12 60325 Frankfurt am Main Germany
Baring Asset Management GmbH Ulmenstraße 5460325 Frankfurt am MainGermany
Northern Trust Global Services LimitedLuxembourg Branch 6, rue Lou Hemmer L-1748 SenningerbergGrand Duchy of Luxembourg
S.E. Banken Skandinaviska Enskilda Banken AB (publ)Transaction Banking KB BV, SE-106 40 Stockholm Sweden
BNP Paribas Securities Services, Paris,Succursale de Zurich Selnaustrasse 16 CH-8002 Zurich Switzerland

3
Barings International Umbrella FundIntroduction
Barings International Umbrella Fund (the “Unit Trust”) is a unit trust managed by Baring International Fund Managers (Ireland) Limited (the “Manager”). The Unit Trust was established pursuant to the Unit Trusts Act, 1990, and a Trust Deed dated 11 February 1992 (as supplemented or amended from time to time) (the “Trust Deed”) made between the Manager and Northern Trust Fiduciary Services (Ireland) Limited (the “Depositary”) and authorised by the Central Bank of Ireland (the “CBI”), pursuant to the European Communities (Undertakings for Collective Investment in Transferable Securities) Regulations 2011 (as amended) (the “UCITS Regulations”). The Unit Trust is also listed on the Euronext Dublin Global Exchange Market.
As the Unit Trust is registered for sale in Hong Kong, the Unit Trust has also been authorised by the Hong Kong Securities and Futures Commission (“SFC”) pursuant to the provisions of the Hong Kong Code on Unit Trusts and Mutual Funds, supplemented or consolidated from time to time. Further details of the Funds are contained in the supplement to the Prospectus. The assets of the Funds are invested in accordance with the investment objective and policy.
The Unit Trust is organised in the form of an umbrella fund. The Trust Deed provides that the Unit Trust may offer separate series of units, each representing an interest in a Unit Trust Fund (a “Fund”) comprised of a distinct portfolio of investments. A separate Fund is maintained for each series of units and is invested in accordance with the investment objective applicable to such Fund to date. Each Fund may create more than one class of units in relation to a Fund (a “class”) and these separate classes of units may be denominated in different currencies. A unit represents a beneficial interest in a Fund (a “unit”).
The Unit Trust has six active Funds as at 30 April 2021 which have been approved by the CBI:
Fund Fund launch dateBarings ASEAN Frontiers Fund 01/08/2008Barings Asia Growth Fund 03/02/1987Barings Australia Fund 04/12/1981Barings Europa Fund 24/01/1987Barings Hong Kong China Fund 03/12/1982Barings Global Bond Fund 07/07/1978
Each of the Funds had several classes of units on offer at the financial year-end, which are outlined in note 11 to these financial statements. Further details of the Funds are contained in the individual supplements to the full Prospectus.
The financial statements include all the trades received up until 12:00p.m. (Irish time) on 30 April 2021, the valuation point for the Unit Trust.

4
Barings International Umbrella FundInvestment Objective and Policy
Barings ASEAN Frontiers Fund The investment objective of the Barings ASEAN Frontiers Fund (the “Fund”) is to achieve long-term capital growth in the value of assets by investing in companies in Asia which the Manager believes will benefit from the economic growth and development of the region.
The Fund will seek to achieve its investment objective by investing at least 70% of its total assets at any one time in equities and equity-related securities of companies incorporated in, or exercising the predominant part of their economic activity in, countries which are members of the Association of South-East Asian Nations (“ASEAN”), or quoted or traded on the stock exchanges in those countries. The members of ASEAN include Singapore, Thailand, the Philippines, Malaysia, Indonesia and Vietnam.
The Fund will invest at least 50% of the Fund’s total assets in equities of companies that exhibit positive or improving environmental, social and governance ("ESG") characteristics.
Barings Asia Growth Fund The investment objective of Barings Asia Growth Fund (the “Fund”) is to achieve long-term capital growth in the value of assets by investing in Asia and the Pacific region excluding Japan. The Fund will seek to achieve its investment objective by investing at least 70% of its total assets in equities and equity-related securities of companies incorporated in, or exercising the predominant part of their economic activity in, the Asia Pacific region excluding Japan, or quoted or traded on the stock exchanges in those countries, including developed and emerging markets.
The Fund will invest at least 50% of the Fund’s total assets in equities of companies that exhibit positive or improving environmental, social and governance ("ESG") characteristics.
Barings Australia Fund The investment objective of the Barings Australia Fund (the “Fund”) is to achieve long-term capital growth in the value of assets by investing in Australia. The Fund will seek to achieve its investment objective by investing at least 70% of its total assets at any one time in equities and equity-related securities of companies incorporated in, or exercising the predominant part of their economic activity, in Australia, or quoted or traded on the stock exchanges in Australia.
The Fund will invest at least 50% of the Fund’s total assets in equities of companies that exhibit positive or improving environmental, social and governance ("ESG") characteristics.
Barings Europa FundThe investment objective of the Barings Europa Fund (the “Fund”) is to achieve long-term capital growth in the value of assets by investing in companies in Europe (including the United Kingdom). The Fund will seek to achieve its investment objective by investing at least 70% of its total assets at any one time in equities and equity-related securities of companies incorporated in, or exercising the predominant part of their economic activity in, any European country (including the United Kingdom), or quoted or traded on the stock exchanges in such countries.
The Fund will invest at least 50% of the Fund’s total assets in equities of companies that exhibit positive or improving environmental, social and governance ("ESG") characteristics.
Barings Hong Kong China FundThe investment objective of Barings Hong Kong China Fund (the “Fund”) is to achieve long-term capital growth in the value of assets by investing in Hong Kong, China and Taiwan.
The Fund will seek to achieve its investment objective by investing at least 70% of its total assets at any one time either directly in equities or through equity-related securities (including depositary receipts) of companies (i) incorporated, or (ii) exercising the predominant part of their economic activity, or (iii) quoted or traded on the stock exchanges in markets in Hong Kong or China.
The Fund will invest at least 50% of the Fund’s total assets in equities of companies that exhibit positive or improving environmental, social and governance ("ESG") characteristics.

5
Barings International Umbrella FundInvestment Objective and Policy (continued)
Barings Global Bond FundThe investment objective of the Barings Global Bond Fund (the “Fund”) is to achieve an attractive level of income together with long-term growth in the value of assets by investing in a diversified portfolio of fixed-interest securities.
The Fund will seek to achieve its investment objective by investing at least 70% of its total assets at any one time in an internationally diversified portfolio of both corporate and government fixed-interest securities. The portfolio may also, from time to time, include securities with floating interest rates.
Please refer to the Prospectus for the full investment objective and policy for all the Funds.
How the Funds are managedThe Manager of Barings ASEAN Frontiers Fund, Barings Asia Growth Fund, Barings Australia Fund and Barings Hong Kong China Fund has appointed Baring Asset Management Limited as the Investment Manager of the Funds. In turn, Baring Asset Management Limited has appointed Baring Asset Management (Asia) Limited as Sub-Investment Manager to the Funds.
At Barings, our equity investment teams share the philosophy of quality Growth at a Reasonable Price (“GARP”). We believe that earnings growth is the principal driver of equity market performance over the medium to long term, and favour high quality companies for their ability to outperform the market on a risk-adjusted basis. In particular, we believe that structured fundamental research and a disciplined investment process combining quality growth and upside disciplines can allow us to identify attractively priced, long-term growth companies which will outperform the market. Our approach emphasises quality criteria when looking at companies and a three- to five-year time horizon when forecasting company earnings. In determining upside, we use consistent and transparent methods to place emphasis on discounted earnings models.
The Manager of Barings Europa Fund has appointed Baring Asset Management Limited as the Investment Manager of the Fund.
The Fund is invested in European equity markets (including the United Kingdom), using a “bottom-up” investment approach. This means that we focus more on the individual merits of a specific company, rather than taking a stance on a sector of the market or macroeconomic trends such as interest rate rises. Within this, Barings manages the Fund using a GARP approach. This means that when researching candidates for the portfolio, we place just as much emphasis on the likely growth in corporate earnings at a company as we do on the unit price valuation before deciding whether to invest or not. We believe this approach combines the best features of both “growth” and “value” investment styles, to the benefit of investors. We invest in companies which we believe offer potential for delivering better than expected earnings growth. We do this by carefully researching a company’s corporate strategy and revenue sources. An important part of the investment process involves regular meetings with the management of companies in which we are considering investment. We then work to put a price on the units of the company in the light of our assessment of its earnings prospects and compare this to its peers in the sector and globally. When we are satisfied that a company meets our criteria for investing, we purchase an appropriate number of units.
The Manager of Barings Global Bond Fund has appointed Baring Asset Management Limited as the Investment Manager of the Fund. Barings LLC and Barings Japan Limited were appointed as Sub-Investment Managers of the Fund.
Baring Asset Management Limited seeks investment returns by investing in bond markets where we believe yields are likely to fall and avoiding those we think are expensive. The overall duration, or interest rate sensitivity, of the Fund will fluctuate as our expectations for economic developments change, relative to the market. We will also look to add value through foreign exchange management, identifying those markets where currencies are attractive, for example due to sound economic fundamentals or rising interest rates.
Please refer to the Prospectus for the full risk profile of each of the Funds. Investors should read the Prospectus and carefully consider the potential risk factors as well as reward factors before investing.

6
Barings International Umbrella FundReport of the Manager
For the financial year ended 30 April 2021
Statement of Manager’s responsibilitiesBaring International Fund Managers (Ireland) Limited (the “Manager”) is required by the European Communities (Undertakings for Collective Investment in Transferable Securities) Regulations 2011 (as amended) (the “UCITS Regulations”) to prepare financial statements for each financial year. The Manager has elected to prepare these financial statements in accordance with Financial Reporting Standard 102 (“FRS 102”), the FRS applicable in the UK and Republic of Ireland to give a true and fair view of the state of affairs of the Baring International Umbrella Fund (the “Trust”) at the financial year-end, and of the results and movements in net assets for the financial year then ended. In preparing these financial statements, the Manager must:
• select and consistently apply suitable accounting policies;• make judgements and estimates that are reasonable and prudent; and• prepare the financial statements on the going concern basis unless it is inappropriate to presume that the Trust will continue in
operation.
The financial statements must comply with the disclosure requirements of the UCITS Regulations. The Manager is responsible for keeping adequate accounting records which disclose with reasonable accuracy at any time the financial position of the Trust and enable it to ensure that the financial statements comply with the UCITS Regulations. The Manager is also responsible for taking reasonable steps for the prevention and detection of fraud and other irregularities.
Under the Central Bank of Ireland (the “CBI”) UCITS Regulations, the assets of the Unit Trust shall be entrusted to Northern Trust Fiduciary Services (Ireland) Limited (the “Depositary") for safekeeping, and therefore custody of the Fund’s assets rests with Northern Trust Fiduciary Services (Ireland) Limited.
The financial statements are published at www.barings.com. The Directors together with the Manager and Investment Manager are responsible for the maintenance and integrity of the website as far as it relates to Barings funds. Legislation in the Republic of Ireland governing the presentation and dissemination of the financial statements may differ from legislation in other jurisdictions.
Transactions with connected persons Any transaction carried out with the Trust by a management company or Depositary to the Trust, the delegates or sub-delegates of the management company or Depositary, and any associated or group of such a management company, Depositary, delegate or sub-delegate (“connected persons”) must be carried out as if negotiated at arm’s length. Transactions must be in the best interests of the unitholders.
The Directors of the Manager are satisfied that there are arrangements (evidenced by written procedures) in place to ensure that the obligations set out in Regulation 43(1) of the Central Bank UCITS Regulations are applied to all transactions with connected persons, and are satisfied that transactions with connected persons entered into during the year complied with the obligations set out in Regulation 43(1) of the Central Bank UCITS Regulations.
Remuneration code The UCITS V provisions require Management Companies to establish and apply remuneration policies and practices that promote sound and effective risk management, and do not encourage risk taking which is inconsistent with the risk profile of the UCITS.
The Manager has a Remuneration Policy in place, details of which are available on the Barings website at www.barings.com/investment-policies.
The purpose of the Manager’s remuneration policy is to seek to ensure that the remuneration arrangements of “Identified Staff”:
(i) are consistent with and promote sound and effective risk management and do not encourage risk-taking which is inconsistent with the risk profile, rules or instruments of incorporation of the Manager or any fund which the Manager is the manager of; and
(ii) are consistent with the Manager’s business strategy, objectives, values and interests and include measures to avoid conflicts of interest.
Please see Appendix 5 for the remuneration disclosure.
The Manager has a business model, policies and procedures which by their nature do not promote excessive risk taking and which take account of the nature, scale and complexity of the Manager and any of the Funds.

7
Barings International Umbrella FundReport of the Manager (continued)
For the financial year ended 30 April 2021
Managers statement
The financial statements were approved by the Directors of the Manager, Baring International Fund Managers (Ireland) Limited, on 20 August 2021 and signed on its behalf by:
Directors: Directors:
20 August 2021
crottyj
Alan B
crottyj
Barbara Healy

8
Barings International Umbrella FundAnnual Depositary Report to Unitholders
For the financial year ended 30 April 2021
We, Northern Trust Fiduciary Services (Ireland) Limited, appointed Depositary to Barings International Umbrella Fund (the “Unit Trust”), provide this report solely in favour of the unitholders of the Unit Trust for the year ended 30 April 2021, (the “Annual Accounting Period”). This report is provided in accordance with the UCITS Regulations European Communities (Undertakings for Collective Investment in Transferable Securities) Regulations 2011 (SI No 352 of 2011), which implemented Directive 2009/65/EU into Irish Law (the “Regulations”). We do not, in the provision of this report, accept nor assume responsibility for any other purpose or person to whom this report is shown.
In accordance with our Depositary obligation as provided for under the Regulations, we have enquired into the conduct of the management company of the Unit Trust for this Annual Accounting Period and we hereby report thereon to the unitholders of the Unit Trust as follows:
We are of the opinion that the Unit Trust has been managed during the Annual Accounting Period, in all material respects:
(i) in accordance with the limitations imposed on the investment and borrowing powers of the Unit Trust by the constitutional docu-ments and by the Regulations; and
(ii) otherwise in accordance with the provisions of the constitutional document and the Regulations.
_________________________________________For and on behalf of Northern Trust Fiduciary Services (Ireland) Limited Georges Court 54-62 Townsend StreetDublin 2D02 R156Ireland 20 August 2021
TO38
Stamp

Independent auditors’ report to the unitholders of the Funds of Barings International Umbrella Fund
Report on the audit of the financial statements
Opinion
In our opinion, Barings International Umbrella Fund’s financial statements:
• give a true and fair view of the Funds’ assets, liabilities and financial position as at 30 April 2021 and oftheir results for the year then ended;
• have been properly prepared in accordance with Generally Accepted Accounting Practice in Ireland(accounting standards issued by the Financial Reporting Council of the UK, including FinancialReporting Standard 102 “The Financial Reporting Standard applicable in the UK and Republic ofIreland” and Irish law); and
• have been properly prepared in accordance with the requirements of the European Communities(Undertakings for Collective Investment in Transferable Securities) Regulations 2011 (as amended).
We have audited the financial statements, included within the Annual Report & Audited Financial Statements, which comprise:
• the Statement of Financial Position as at 30 April 2021;
• the Statement of Comprehensive Income for the year then ended;
• the Statement of Changes in Net Assets Attributable to Holders of Redeemable Participating Units for theyear then ended;
• the Schedule of Investments for each of the Funds as at 30 April 2021; and
• the notes to the financial statements for each of the Funds, which include a description of the significantaccounting policies.
Basis for opinion
We conducted our audit in accordance with International Standards on Auditing (Ireland) (“ISAs (Ireland)”) and applicable law.
Our responsibilities under ISAs (Ireland) are further described in the Auditors’ responsibilities for the audit of the financial statements section of our report. We believe that the audit evidence we have obtained is sufficient and appropriate to provide a basis for our opinion.
Independence
We remained independent of the Trust in accordance with the ethical requirements that are relevant to our audit of the financial statements in Ireland, which includes IAASA’s Ethical Standard as applicable to listed entities, and we have fulfilled our other ethical responsibilities in accordance with these requirements.

Our audit approach
Overview
Materiality
• Overall materiality: 50 basis points of Net Assets Value ("NAV") at 30 April 2021 for each of the Trust’s Funds.
Audit scope
• The Trust is an open-ended investment Trust. We tailored the scope of our audit taking into account the types of investments within the Funds, the involvement of the third parties referred to overleaf, the accounting processes and controls, and the industry in which the Trust operates. We look at each of the Funds at an individual level.
Key audit matters
• Valuation of financial assets and financial liabilities at fair value through profit or loss.
• Existence of financial assets and financial liabilities at fair value through profit or loss.
The scope of our audit
As part of designing our audit, we determined materiality and assessed the risks of material misstatement in the financial statements. In particular, we looked at where the manager made subjective judgements, for example the selection of pricing sources to value the investment portfolio. As in all of our audits, we also addressed the risk of management override of internal controls, including evaluating whether there was evidence of bias by the manager that represented a risk of material misstatement due to fraud.
Key audit matters
Key audit matters are those matters that, in the auditors’ professional judgement, were of most significance in the audit of the financial statements of the current period and include the most significant assessed risks of material misstatement (whether or not due to fraud) identified by the auditors, including those which had the greatest effect on: the overall audit strategy; the allocation of resources in the audit; and directing the efforts of the engagement team. These matters, and any comments we make on the results of our procedures thereon, were addressed in the context of our audit of the financial statements as a whole, and in forming our opinion thereon, and we do not provide a separate opinion on these matters. This is not a complete list of all risks identified by our audit.
Key audit matter How our audit addressed the key audit matter
Valuation of financial assets and financial liabilities at fair value through profit or loss
Refer to note 2 for the accounting policies of Financial assets and financial liabilities at fair value through profit or loss on pages 36 and 37 and the Schedule of Investments in the financial statements on pages 72 to 89.
The financial assets and financial liabilities at fair value through profit or loss included in the Statements of Financial Position as at 30 April 2021 are valued at fair value in line with Generally Accepted Accounting Practice in Ireland.
This is considered a key audit matter as it represents the principal element of the financial statements.
We tested the investment portfolios by independently agreeing the valuation of investments to third party vendor sources at the year-end date.
No material misstatements were identified as a result of the procedures we performed.
Existence of financial assets and financial liabilities at fair value through profit or loss
Refer to note 2 for the accounting policies of Financial assets and financial liabilities at fair value through profit or loss on pages 36 and 37 and the Schedule of Investments in the financial statements on pages 72 to 89.
This is considered a key audit matter as it represents a principal element of the financial statements.
We obtained independent confirmation from the Funds' Depositary of the investment portfolios held as at 30 April 2021.
No material misstatements were identified as a result of the procedures we performed.

How we tailored the audit scope
We tailored the scope of our audit to ensure that we performed enough work to be able to give an opinion on the financial statements as a whole, taking into account the structure of the Trust, the accounting processes and controls, and the industry in which it operates.
The Manager controls the affairs of the Trust and is responsible for the overall investment policy which is determined by them. The Manager has delegated certain responsibilities to Baring Asset Management Limited (the ‘Investment Manager’) and to Northern Trust International Fund Administration Services (Ireland) Limited (the ‘Administrator’). The Annual Report & Audited Financial Statements, which remain the responsibility of the Manager, are prepared on their behalf by the Administrator. The Trust has appointed Northern Trust Fiduciary Services (Ireland) Limited (the “Depositary”) to act as Depositary of the Trust’s assets. In establishing the overall approach to our audit, we assessed the risk of material misstatement at a fund level, taking into account the nature, likelihood and potential magnitude of any misstatement. As part of our risk assessment, we considered the Trust’s interaction with the Administrator, and we assessed the control environment in place at the Administrator.
Materiality
The scope of our audit was influenced by our application of materiality. We set certain quantitative thresholds for materiality. These, together with qualitative considerations, helped us to determine the scope of our audit and the nature, timing and extent of our audit procedures on the individual financial statement line items and disclosures and in evaluating the effect of misstatements, both individually and in aggregate on the financial statements as a whole.
Based on our professional judgement, we determined materiality for the financial statements of each of the Trust’s Funds as follows:
Overall materiality and how we determined it
50 basis points (2020: 50 basis points) of Net Assets Value ("NAV") at 30 April 2021 for each of the Trust’s Funds.
Rationale for benchmark applied
We have applied this benchmark because the main objective of the Trust is to provide investors with a total return at a Fund level, taking account of the capital and income returns.
We agreed with the Board of Directors that we would report to them misstatements identified during our audit above 5 basis points of each Fund’s NAV, for NAV per share impacting differences (2020: 5 basis points of each Fund’s NAV, for NAV per share impacting differences) as well as misstatements below that amount that, in our view, warranted reporting for qualitative reasons.
Conclusions relating to going concern
Our evaluation of the manager’s assessment of the Funds’ ability to continue to adopt the going concern basis of accounting included:
• Obtaining an understanding of the key indicators that are monitored with respect to the going concern
assumption and management’s future plans for the Funds over the going concern period (being 12
months from the date of approval of the financial statements):
• Reviewing available board minutes during the period under audit and those available up to the date of
this report:
• Considering post year end capital activity as recorded in the underlying accounting records:
• Making enquiries of management with respect to any planned significant redemptions of which they
have been informed of:
• Considering the liquidity risk management techniques which are available to the Funds.
Based on the work we have performed, we have not identified any material uncertainties relating to events or conditions that, individually or collectively, may cast significant doubt on the Funds’ ability to continue as a going concern for a period of at least twelve months from the date on which the financial statements are authorised for issue.
In auditing the financial statements, we have concluded that the manager’s use of the going concern basis of accounting in the preparation of the financial statements is appropriate.
However, because not all future events or conditions can be predicted, this conclusion is not a guarantee as to the Funds’ ability to continue as a going concern.
Our responsibilities and the responsibilities of the manager with respect to going concern are described in the relevant sections of this report.
Reporting on other information
The other information comprises all of the information in the Annual Report & Audited Financial Statements other than the financial statements and our auditors’ report thereon. The manager is responsible for the other information. Our opinion on the financial statements does not cover the other information and, accordingly, we do not express an audit opinion or, except to the extent otherwise explicitly stated in this report, any form of assurance thereon. In connection with our audit of the financial statements, our responsibility is to read the other information and, in doing so, consider whether the other information is materially inconsistent with the financial statements or our knowledge obtained in the audit, or otherwise appears to be materially misstated. If we identify an apparent material inconsistency or material misstatement, we are required to perform procedures to conclude whether there is a material misstatement of the financial statements or a material misstatement of the other information. If, based on the work we have performed, we conclude that there is a material misstatement of this other information, we are required to report that fact. We have nothing to report based on these responsibilities.
Responsibilities for the financial statements and the audit
Responsibilities of the manager for the financial statements
As explained more fully in the Statement of Manager’s responsibilities set out on page 6, the manager is responsible for the preparation of the financial statements in accordance with the applicable framework giving a true and fair view.
The manager is also responsible for such internal control as the manager determines is necessary to enable the preparation of financial statements that are free from material misstatement, whether due to fraud or error.
In preparing the financial statements, the manager is responsible for assessing the Funds’ ability to continue as going concerns, disclosing as applicable, matters related to going concern and using the going concern basis of accounting unless the manager intends to cease operations, or has no realistic alternative but to do so.
Auditors’ responsibilities for the audit of the financial statements
Our objectives are to obtain reasonable assurance about whether the financial statements as a whole are free from material misstatement, whether due to fraud or error, and to issue an auditors’ report that includes our opinion. Reasonable assurance is a high level of assurance but is not a guarantee that an audit conducted in accordance with ISAs (Ireland) will always detect a material misstatement when it exists. Misstatements can arise from fraud or error and are considered material if, individually or in the aggregate, they could reasonably be expected to influence the economic decisions of users taken on the basis of these financial statements.
Our audit testing might include testing complete populations of certain transactions and balances, possibly using data auditing techniques. However, it typically involves selecting a limited number of items for testing, rather than testing complete populations. We will often seek to target particular items for testing based on their size or risk characteristics. In other cases, we will use audit sampling to enable us to draw a conclusion about the population from which the sample is selected.
A further description of our responsibilities for the audit of the financial statements is located on the IAASA website at:
https://www.iaasa.ie/getmedia/b2389013-1cf6-458b-9b8f-a98202dc9c3a/Description_of_auditors_responsibilities_for_audit.pdf.
This description forms part of our auditors’ report.
Use of this report
This report, including the opinion, has been prepared for and only for the unitholders of each of the Funds as a body in accordance with the European Communities (Undertakings for Collective Investment in Transferable Securities) Regulations 2011 (as amended) and for no other purpose. We do not, in giving this opinion, accept or assume responsibility for any other purpose or to any other person to whom this report is shown or into whose hands it may come save where expressly agreed by our prior consent in writing.
Pat Candon for and on behalf of PricewaterhouseCoopers Chartered Accountants and Statutory Audit Firm Dublin 20 August 2021

Barings International Umbrella FundInvestment Managers’ Report
For the financial year ended 30 April 2021
13
Barings ASEAN Frontiers Fund
Performance Barings ASEAN Frontiers Fund (the “Fund”) registered a gross return of 60.60% on the Class A USD Inc unit class. The Fund outperformed the performance comparator that delivered a return of 23.62%* during the reporting period, and generated a net return of 57.87% on the Class A USD Inc unit class.
ASEAN markets staged a powerful rally especially in the final quarter of 2020 after woefully lagging North Asia since markets troughed in March 2020. Fiscal stimulus and monetary policies have remained supportive across the region since the outbreak of COVID-19, aiming to help to mitigate economic shock from the epidemic and pave the way for recovery. Meanwhile, the approvals and imminent rollout of a few COVID-19 vaccines alongside conclusion of the US Presidential Elections in the last quarter of 2020 has removed some of the key risk factors for the markets. Nevertheless, the region still lagged the broad Asia ex-Japan market by a significant gap over the year, reflecting not only less effective COVID-19 containment versus North Asia, but also over-representation of COVID-19 challenged Old Economy sectors and the lack of tech players.
Over the 12 month reporting period, stock selection served as a key driver to relative outperformance, especially from sectors such as communication services and industrials. Our largest holding on an absolute and relative basis, SEA Ltd., which is ASEAN’s leading game developer and e-commerce marketplace, ended the year as a key contributor to the Fund. Share price enjoyed a rally thanks to the strong secular growth trends in online gaming and e-commerce accelerated by Covid-19, which led to robust business growth outlook of the company. Country-wise, stock selection in Singapore and Thailand made notable contributions to relative performance. For instance, KCE Electronics, a Thailand-based manufacturer of PCBs (Printed Circuit Board) which are used for automotive, industrial, telecoms and medical industries, added value to the Fund’s performance over the review period in light of resilient demand outlook of the automotive supple chain, with sales mainly directed to Europe and US markets.
On the other hand, the relatively negative exposure to financials ended as key drag to the Fund over the past year, particularly from the lack of exposure in Singapore-based Oversea-Chinese Banking Corporation that has resulted in detractions to relative performance on the back of the announcement of the new CEO appointment alongside improving outlook on earnings recovery, which led to a share price rebound. Elsewhere, the Fund’s zero investment in Malaysian glove manufacturer Top Glove was another notable detractor, largely due to glove sector rallies in 2020 on the back of strong demand growth on medical gloves amid the COVID-19 pandemic.
Market outlookLooking ahead, we remain positive on ASEAN equities outlook. COVID-19 situation is relatively under control now with governments across the region more prepared to better manage the situation in spite of the resurgence of new cases. Concurrently, the vaccine rollout in countries such as Indonesia, Singapore and Malaysia will provide a major boost to investor sentiment. This will help fuel consumption and restart investment as the recovery takes hold. Together with a supportive global economic backdrop, bolstered by government spending, corporate capital allocation and supply chain diversification will recommence and restart a new capital spending cycle. Therefore, economic momentum should shift back in favor of ASEAN towards the end of the year.

14
Barings International Umbrella FundInvestment Managers’ Report (continued)
For the financial year ended 30 April 2021
While being cognizant of near-term market headwinds driven by rising bond yields and inflation outlook, we remain disciplined and anchored by our bottom-up investment process, and take market corrections as attractive entry points to build up positions in companies with structural growth potentials and quality fundamentals. From a bottom-up perspective, there are many companies we favor across the region that are delivering strong earnings growth prospects through being positioned as the beneficiaries of secular growth trends accelerated by the outbreak of COVID-19, across sectors / thematic ranging from digital economy and infrastructure, health care to renewables. Meanwhile, we maintain a positive view on selective manufacturing and industrial companies which should benefit from the longer-term thematic of production bases relocation from China to ASEAN as well as the multi-year trend of supply chain diversification. We also continue to favor selective consumer companies that are backed by strong domestic franchises, particularly those that are expected to benefit from consumption pattern shifts or domestic consumption recovery amid and post the pandemic, while being further supported by long-term secular growth drivers such as demographic advantages and continuing urbanisation.
* The Fund return uses the midday prices, whereas the return of the comparator is calculated using global close prices.
Baring Asset Management (Asia) Limited and Barings LLC,appointed as Sub-Investment Manager byBaring Asset Management LimitedMay 2021 Baring Asset Management Limited (the “Investment Manager”) gives its portfolio managers full authority to manage their funds as they see fit, within the established guidelines set down. This includes the views that managers may take of the markets and sectors they invest in, which may differ from the views of other Barings portfolio managers.
Barings ASEAN Frontiers Fund (continued)
Market outlook (continued)

15
Barings International Umbrella FundInvestment Managers’ Report (continued)
For the financial year ended 30 April 2021
Barings Asia Growth Fund
PerformanceBarings Asia Growth Fund (the “Fund”) registered a gross return of 76.77% on the Class A USD Inc unit class, and managed to outperform the performance comparator that delivered a return of 47.95%* during the reporting period. The Fund generated a net return of 73.77% on the Class A USD Inc unit class.
Over the 12 month reporting period, Asian equities have shown strong resilience while global economies continue to navigate through the COVID-19 crisis. Market performance was buoyed by fiscal and monetary stimulations across the world as well as development on COVID-19 vaccine at a historic speed, which made investors see through the short-term impact of the pandemic. Having said that, stronger demand revival in key consumption categories without adequate supply normalization has pushed up commodity prices, and led to inflation concerns as well as a sharp rise in US interest rates towards the end of the review period.
Stock selection was a major driver to the Fund’s outperformance over the reporting period, particularly from sectors such as communication services and consumer discretionary. SEA Ltd., which is ASEAN’s leading game developer and e-commerce marketplace, ended the year as a key contributor to the Fund. Share price enjoyed a rally thanks to the strong secular growth trends in online gaming and e-commerce accelerated by COVID-19, which led to robust business growth outlook of the company. China Tourism Group Duty Free, a dominant duty-free operator in China, also added value to the Fund’s performance, as the company continues to benefit from government’s favorable policy support to bring back duty-free consumption from overseas to domestic market. In contrast, our relatively negative exposure to Baidu detracted from relative performance, as share price performed well on the back of electric vehicle potential of the company. Copper Clad Laminate (CCL) manufacturer Taiwan Union Technology was another drag to relative performance, largely due to concerns over potential order impacts from one of its major clients, Huawei, in light of new rounds of US sanctions.
Market outlookAs vaccination speeds up globally, economies will open up and start the normalization process with gradual recovery. While Asian economies have been slow in vaccination compared to Western counterparts, COVID-19 impact has also been relatively benign here. The U.S. economy is expected to lead the global economic recovery in the coming quarters, thanks to massive fiscal stimulus packages still being rolled out, while the US Federal Reserve maintains an accommodative stance. Within Asia, China is fine-tuning its economic growth recovery in a more sustainable fashion. This sets a positive outlook for key Asian exporters such as Taiwan and South Korea. Large domestic-oriented economies like India and Indonesia, will benefit from structural growth tailwinds as they navigate COVID-19 impact. Earnings season for the year has also commenced on a robust footing on lower base, despite the ongoing challenges such as supply chain disruptions. It is highly likely that a new capital expenditure cycle can take off, particularly in tech, but also across other industries, driven by the strong demand recovery and the faster-than-anticipated adoption of many secular growth products and services. This is visible in leading indicators of capital expenditure such as capital imports from Korea and Taiwan. Taking all into consideration, we believe Asian equities look attractive supported by an accelerating earnings outlook, relatively reasonable valuations, and still under-owned by global investors.

16
Barings International Umbrella FundInvestment Managers’ Report (continued)
For the financial year ended 30 April 2021
As we look across the markets today, we see particular value in companies exposed to secular growth themes such as technological ubiquity (the digitalisation and connectivity of everything), evolving lifestyle and societal values (sustainability, millennial/Gen Z consumption trends, wellness economy) and de-globalisation (supply chain diversification/bifurcation and reshoring). The recent share price corrections in some companies with exposure to these themes have resulted in more attractive valuations, at times creating opportunities to purchase well-positioned companies at attractive prices. Nevertheless, the current global economic recovery has also improved growth prospects beyond the abovementioned structural growth sectors, to sectors such as materials/commodities thereby broadening the opportunity set for us in our portfolio construction.
* The Fund return uses the midday prices, whereas the return of the comparator is calculated using global close prices.
Baring Asset Management (Asia) Limitedand Barings LLC,appointed as Sub-Investment Manager byBaring Asset Management LimitedMay 2021 Baring Asset Management Limited (the “Investment Manager”) gives its portfolio managers full authority to manage their funds as they see fit, within the established guidelines set down. This includes the views that managers may take of the markets and sectors they invest in, which may differ from the views of other Barings portfolio managers.
Barings Asia Growth Fund (continued)

17
Barings International Umbrella FundInvestment Managers’ Report (continued)
For the financial year ended 30 April 2021
Barings Australia Fund
PerformanceBarings Australia Fund (the “Fund”) generated a gross return of 58.66% on the Class A USD Inc unit class, and outperformed the performance comparator, which returned 53.31%* during the reporting period. The Fund generated a net return of 55.96% on the Class A USD Inc unit class. The Australian market rebounded significantly over the period as Australian and global policy makers responded to the COVID-19 challenge with large-scale monetary and fiscal easing. This proved effective in supporting the Australian economy with a better than expected recovery in employment and a strengthened housing market. The successful development of vaccines further improved sentiment and shifted market focus to the recovery. At sector level, banks were a large contributor to the market rebound given their cyclical exposure. The materials sector (miners) was also a key contributor, with share performance driven by commodity price inflation as a sharp global recovery in demand exceeded the constrained supply. The Fund outperformed against this backdrop due to individual stock selection. We focus on high quality, growth companies that offer attractive value over a long-term time horizon and exhibit a positive or improving ESG (Environmental, Social and Governance) impact. Goodman Group was among the top contributors to the outperformance and has been a longstanding holding in the Fund. It is a high quality commercial and industrial property business that is very well positioned to serve increasing demand for logistic facilities and data centres driven by the growth of e-commerce and cloud computing. It also demonstrated good earnings resilience in the COVID-19 environment. The market volatility in early 2020 also provided an opportunity for the Fund to acquire new positions in high quality, growth companies at depressed valuations that went on to perform strongly through the period. These included REA Group and Carsales.com, the leading online Australian property and auto portals. Both are highly cash generative and benefit from strong domestic market positions and international growth potential. Another new addition was Domino’s Pizza Enterprises, a restaurant franchise that spans Australia, Japan and parts of Europe. Growth in home delivery supported earnings during national lockdowns and the company has a very attractive long-term growth opportunity from greater digital ordering, rollout of new stores and continued innovation. The quality and growth focus of the Fund resulted in having proportionally less exposure to Banks than the market. The strong Bank sector performance over the period as the economic outlook improved was, therefore, a headwind to the Fund’s outperformance. At individual stock level, the largest detractor to performance was Fortescue Metals, an iron ore miner that benefited from iron ore price inflation. We are concerned over the sustainability of the iron ore price given long-term demand and supply dynamics. Our preference is for BHP Group and Rio Tinto, which supply a higher grade of iron ore from an environmental perspective (with better long-term price support) and are more diversified (i.e. produce copper which as a key component in the global transition to renewable energy generation and electric vehicles should see long-term demand growth). ESG analysis and engagement with management teams is a key part of our investment process. At period end, the Fund ranked in the 12th percentile of the Morningstar Sustainability rating. We also estimate that Carbon Scope 1 emissions of the Fund were 57% lower than the MSCI Australia benchmark (at portfolio NAV), and Carbon Scope 2 emissions were 42% lower. Certain healthcare holdings within the Fund played a very positive role in helping to save lives during the pandemic, such as through providing protective gear (Ansell), testing (Sonic Healthcare), respiratory care (Resmed), and plasma treatment and vaccine manufacture (CSL).
Market outlookThe Australian economic outlook is positive which should provide support to earnings growth and the market. The IMF April 21 update forecasts Australia real GDP to grow 4.5% in 2021 and 2.8% in 2022 supported by the labour market recovery, consumption and rising house prices. The Australian Budget (May 2021) forecasts unemployment to reduce to 5% in mid 2021 and lower beyond and for net debt as a proportion of GDP to peak at a lower than previously expected level of 40.9% of GDP in June 2025 (which could imply some leeway to step up fiscal support again if the economy requires it). The current rate of COVID-19 infection in Australia is very low due to the success of travel restrictions put in place last year and an effective track and trace program. However, the pandemic will remain a key risk until vaccines have been fully rolled-out both domestically and internationally (assuming vaccine efficacy to new strains remains high). We do not anticipate another significant wave of cases in Australia but will continue to manage this risk within the Fund.

18
Barings International Umbrella FundInvestment Managers’ Report (continued)
For the financial year ended 30 April 2021
We maintain our investment approach of focusing on high quality, growth companies that offer attractive value over a long-term time horizon. This includes ESG analysis and engagement. We still see attractive upside at the individual stock level for companies held in the Fund over the next five years despite the market recovering well over the last year. This is underpinned by attractive qualities such as high cash generation, competitive advantage and tech innovation and with long-term earnings growth drivers that span beyond the cyclical recovery. We also aim to continue to be disciplined on valuations. * The Fund return uses the midday prices, whereas the return of the comparator is calculated using global close prices. Baring Asset Management (Asia) Limitedand Barings LLC,appointed as Sub-Investment Manager byBaring Asset Management LimitedMay 2021 Baring Asset Management Limited (the “Investment Manager”) gives its portfolio managers full authority to manage their funds as they see fit, within the established guidelines set down. This includes the views that managers may take of the markets and sectors they invest in, which may differ from the views of other Barings portfolio managers.
Barings Australia Fund (continued)
Market outlook (continued)

19
Barings International Umbrella FundInvestment Managers’ Report (continued)
For the financial year ended 30 April 2021
Barings Europa Fund
PerformanceBarings Europa Fund (the “Fund”) generated a gross return of 42.01% on the Class A USD Inc unit class but underperformed against the performance comparator, which returned 43.05%* during the reporting period. The Fund generated a net return of 39.59% on the Class A USD Inc unit class.
The twelve-month reporting period coincided with a strong recovery in the broader European market from the lows of March 2020. As well as from the initial recovery from these lows as a more measured reaction to the pandemic took place, investor sentiment was also helped in the autumn by positive news on vaccine developments.
In this environment, a number of the Fund’s IT holdings performed particularly well, notably those that are expected to benefit from changing consumer behaviour in light of COVID-19, be that online shopping – such as payments processor Adyen - or a general rise in semiconductor demand - where ASML provides key equipment - for products used by both consumers and businesses in, for example, working from home applications. Companies that provide the materials for the expected increase in infrastructure spending, driven in part by programmes to enhance regional environmental profiles, such as mining groups Anglo American and Boliden, also contributed positively to the Fund’s performance over the period.
Partly offsetting these strong performances were weaknesses in the Fund’s healthcare holdings, namely Roche and AstraZeneca, as their share prices failed to keep pace with the market due in part to these companies seeing limited benefit from spending packages or a broader economic recovery. Oil & gas group Royal Dutch Shell also performed relatively poorly, despite a sharp recovery in the oil price as the economic outlook improved, as the market focused more on the current product profile of hydrocarbons and appeared to overlook the group’s increasing exposure to renewable energy.
Market outlookAs we move through 2021, equity markets have continued to extend their recovery from the lows of 2020, reflecting optimism that this year will see a strong rebound in economic activity worldwide as the impact of COVID-19 recedes due to the vaccination rollouts across the world. Whilst some of these programmes have admittedly not been without their issues, including in several European countries, the programme in the UK – a key market for numerous holdings in the portfolio – has been more successful.
Investor sentiment has been further improved by the launch of the EU’s Recovery & Resilience Fund, and the continued loose monetary policy of the European Central Bank. With these measures mirrored elsewhere across the world such as the US, the conditions for a favourable equity market environment are in place.
Whilst we are certainly not dismissive of the potential for new waves and new strains of the coronavirus in the years ahead, we do believe that the worst of the pandemic is behind us. As we continue to focus on the longer-term management of the Fund, we are certainly accepting of the view that the world has changed due to the pandemic. As a result, there are now new scenarios to assess when considering the growth prospects of existing and new investments, though our aim remains to identify attractively valued investment opportunities in companies whose strategic positioning, pricing power and competitive strengths can drive sustained growth and profitability over the long term.
* The Fund return uses the midday prices, whereas the return of the comparator is calculated using global close prices.
Baring Asset Management LimitedMay 2021 Baring Asset Management Limited (the “Investment Manager”) gives its portfolio managers full authority to manage their funds as they see fit, within the established guidelines set down. This includes the views that managers may take of the markets and sectors they invest in, which may differ from the views of other Barings portfolio managers.

20
Barings International Umbrella FundInvestment Managers’ Report (continued)
For the financial year ended 30 April 2021
Barings Hong Kong China Fund
PerformanceBarings Hong Kong China Fund (the “Fund”) registered a gross return of 61.96% on the Class A USD Inc unit class and outperformed the performance comparator with a return of 39.32%* during the reporting period. The Fund generated a net return of 59.21% on the Class A USD Inc unit class.
While disruptions and challenges from the COVID-19 pandemic have brought significant impact to global economies, Chinese equities still managed to pick up well and delivered a strong market rebound, particularly amid the second half of 2020. Markets later started to pull back in 2021 after the Lunar New Year on the back of pressure from renewed risk of inflation and surging long-term bond yields, not helped by near-term pressure on the policy front such as the announcement of stamp duty hike in the Hong Kong stock market as well as regulatory overhangs of Chinese American Depositary Receipts ("ADRs").
Stock selection was one of the key drivers of relative outperformance, especially in sectors such as communication services, information technology and financials. The holding in online video streaming platform Bilibili was a key contributor over the past 1 year, driven by resilient user base expansion and increasing user stickiness in light of continuing content enhancement and diversification. Meanwhile, the Fund’s lack of exposure to China Construction Bank contributed notably to relative performance, as share price went lower on expectations of profit contractions as well as asset quality pressure from the COVID-19 outbreak. Our zero investment in telecom player China Mobile also added value to relative performance, partly due to flat earnings results reported during the year which led to muted share price performance. On the other hand, our lack of exposure to EV (Electric Vehicle) manufacturer NIO ended as a key detractor to the Fund over the year. Share price rally was supported by the strong beat of quarterly earnings on resilient EV demand alongside improving operations of the company. Stock selection in health care also hurt relative performance, especially from the relatively negative exposure to pharmaceutical firm Wuxi Biologics, as market focuses on Covid-19 related programs such as vaccines and neutralizing antibodies have driven up the share price of the company over the year.
Market outlookLooking at year-to-date macro data in China, it has indicated an upbeat economic momentum especially on manufacturing and exports, along with signs of expansions into domestic consumption and services activities. The solid economic recovery is expected to continue this year as we move towards a post-COVID-19 era with increasing vaccinations globally, and this should provide a supportive backdrop for ongoing business recoveries alongside earnings upward revisions for Chinese companies. The resilient recovery path that has come ahead of many global peers so far is leading to expectations of a modest normalisation in policy support this year. That being said, we believe long-term policy support to develop structural growth in certain areas remains promising, especially those illustrated in the official 14th five-year-plan. Among these key topics we have seen deeper penetration of existing concepts, such as the continuation of economic transformation towards sustainable and high-quality growth, as well as further urbanisation and welfare improvements. Meanwhile, new structural changes were introduced, including self-sufficiency in the supply chain, technological innovations, and green ecology awareness with de-carbonisation targets set to strike a balance between economic development and sustainability. These should bolster the outlook on thematic such as new infrastructure, domestic consumption, health care, technology localization and sustainability, and we expect these long-term development landscapes to bring in more domestic and sustainable drivers for Chinese economic growth.

21
Barings International Umbrella FundInvestment Managers’ Report (continued)
For the financial year ended 30 April 2021
Although being cognizant of near-term market volatilities alongside uncertainties from external overhangs, such as evolving US-China relations and COVID-19 situation worldwide, we remain constructive on the Chinese equities in the medium to longer term driven by bottom-up fundamentals, and continue to find opportunities among quality companies that are well positioned to be the potential beneficiaries of continuing urbanisation, productivity innovation and consumption upgrade trend. As income growth continues while demand for higher quality goods and services increases in China, we remain constructive on leading domestic consumption plays with strong brand and pricing power, as well as companies that manage to capture market share and benefit from industry consolidation.
* The Fund return uses the midday prices, whereas the return of the comparator is calculated using global close prices.
Baring Asset Management (Asia) Limitedand Barings LLC,appointed as Sub-Investment Manager byBaring Asset Management LimitedMay 2021 Baring Asset Management Limited (the “Investment Manager”) gives its portfolio managers full authority to manage their funds as they see fit, within the established guidelines set down. This includes the views that managers may take of the markets and sectors they invest in, which may differ from the views of other Barings portfolio managers.
Barings Hong Kong China Fund (continued)
Market outlook (continued)

22
Barings International Umbrella FundInvestment Managers’ Report (continued)
For the financial year ended 30 April 2021
Barings Global Bond Fund
PerformanceBarings Global Bond Fund (the “Fund”) generated a gross return of 6.68% on the Class A USD Inc unit class and outperformed its index comparator with a return of 1.78%* during the reporting period. The Fund generated a net return of 5.40% on the Class A USD Inc unit class.
Over the 12 month reporting period, many countries have started using COVID-19 vaccines but there is uncertainty when vaccines will be available for most people. Most central banks have continued monetary easing on the back of uncertainty around the COVID-19 situation and economic growth. The U.S. government announced fiscal stimulus packages and is considering further fiscal stimulus with tax increase. U.S. bond yield rose due to the economic recovery and fiscal stimulus by the U.S. government.
The Fund has maintained a long-duration stance on the back of monetary easing by central banks. Within European countries, the fund has maintained positions on European peripherals. The Fund has also continued to own USD denominated Emerging bonds. Top contributors over the investment period have been due to spread tightening in USD and EUR denominated bonds as well as strong contributions from currencies in Mexico, New Zealand and Poland.
Market outlookBiden’s administration announced a proposed tax increase for further fiscal stimulus. The tax increase will contribute to lower yields. The yield curves will react with flattening if the markets discount the fiscal tapering. In terms of the global economy, we can expect a short-term economic recovery year-over-year due to base effect. However, we expect lower yields after the summer due to structural factor and diminishing base effect. We hold inflation linked bonds and quasi- sovereign bonds in preparation for higher yields. The bonds in Eastern European countries, like Poland, are attractive as the countries will benefit from the EU recovery fund and the central banks will continue monetary easing as a means of supporting their local economies. Australian rates are also attractive as the risk of fiscal expansion will be relatively limited in part to its success in containing COVID-19.
* The Fund return uses the midday prices, whereas the return of the comparator is calculated using global close prices.
Barings LLC and Barings Japan Limitedappointed as Sub-Investment Managers byBaring Asset Management LimitedMay 2021 Baring Asset Management Limited (the “Investment Manager”) gives its portfolio managers full authority to manage their funds as they see fit, within the established guidelines set down. This includes the views that managers may take of the markets and sectors they invest in, which may differ from the views of other Barings portfolio managers.

The accompanying notes form an integral part of these financial statements.
23
Barings International Umbrella FundStatement of Financial Position
As at 30 April 2021
Barings ASEAN Frontiers Fund
30 April 2021
Barings Asia Growth Fund 30 April 2021
Barings Australia Fund
30 April 2021Assets Notes US$ US$ US$Financial assets at fair value through profit or loss 2 454,592,329 240,381,019 75,256,911Cash and cash equivalents 3 6,755,879 1,628,533 636,573Securities sold receivable 2 9,819 1,357,795 1,435,719Receivable for units sold 2 1,101,810 655,012 56,811Dividends receivable 2 913,761 206,015 –Other assets 525 1,172 –Total assets 463,374,123 244,229,546 77,386,014
LiabilitiesFinancial liabilities at fair value through profit or loss 2 (567) – –Management fee payable 6 (402,978) (231,165) (67,449)Administration, depositary & operating fees payable 6 (143,176) (82,866) (23,891)Securities purchased payable 2 (1,013,372) (1,919,097) –Accrued capital gains tax – (1,013,002) –Payable for units redeemed 2 (1,301,802) (235,024) (1,671,754)Other liabilities – (4,047) –Total liabilities (excluding net assets attributable to holders of redeemable participating shares) (2,861,895) (3,485,201) (1,763,094)
Net assets attributable to holders of redeemable participating units 460,512,228 240,744,345 75,622,920

The accompanying notes form an integral part of these financial statements.
24
Barings International Umbrella FundStatement of Financial Position (continued)
As at 30 April 2021
Barings Europa Fund
30 April 2021
Barings Hong Kong China Fund
30 April 2021
Barings Global Bond Fund
30 April 2021Assets Notes US$ US$ US$Financial assets at fair value through profit or loss 2 31,378,965 2,419,299,817 77,006,533Cash and cash equivalents 3 146,522 15,503,976 1,133,956Securities sold receivable 2 – 11,729,870 –Receivable for units sold 2 2,387 6,672,397 24,325Interest receivable 2 – – 472,574Dividends receivable 2 66,670 1,432,201 –Other assets 13 3,620 –Total assets 31,594,557 2,454,641,881 78,637,388
LiabilitiesFinancial liabilities at fair value through profit or loss 2 – (10) (417,624)Management fee payable 6 (32,470) (2,462,143) (48,443)Administration, depositary & operating fees payable 6 (12,049) (888,610) (28,949)Securities purchased payable 2 – (10,933,345) –Payable for units redeemed 2 (29,334) (3,371,486) (53,622)Total liabilities (excluding net assets attributable to holders of redeemable participating shares) (73,853) (17,655,594) (548,638)
Net assets attributable to holders of redeemable participating units 31,520,704 2,436,986,287 78,088,750

The accompanying notes form an integral part of these financial statements.
25
Barings International Umbrella FundStatement of Financial Position (continued)
As at 30 April 2020
Barings ASEAN Frontiers Fund
30 April 2020
Barings Asia Growth Fund 30 April 2020
Barings Australia Fund
30 April 2020Assets Notes US$ US$ US$Financial assets at fair value through profit or loss 2 285,106,111 88,934,223 49,272,681Cash and cash equivalents 3 – 3,566,198 1,268,946Securities sold receivable 2 1,350,471 – –Receivable for units sold 2 172,282 1,093,647 39,729Dividends receivable 2 616,806 94,710 –Other assets 10,538 24 –Total assets 287,256,208 93,688,802 50,581,356
LiabilitiesFinancial liabilities at fair value through profit or loss 2 (11,767) – –Bank overdraft 3 (522,438) – –Management fee payable 6 (233,598) (85,787) (43,274)Administration, depositary & operating fees payable 6 (83,011) (30,844) (15,392)Securities purchased payable 2 (2,000,613) – (81,825)Accrued capital gains tax – (9,217) –Payable for units redeemed 2 (216,380) (39,500) (547,978)Other liabilities (2,989) – –Total liabilities (excluding net assets attributable to holders of redeemable participating shares) (3,070,796) (165,348) (688,469)
Net assets attributable to holders of redeemable participating units 284,185,412 93,523,454 49,892,887

The accompanying notes form an integral part of these financial statements.
26
Barings International Umbrella FundStatement of Financial Position (continued)
As at 30 April 2020
Barings Europa Fund
30 April 2020
Barings Hong Kong China Fund
30 April 2020
Barings Global Bond Fund*
30 April 2020Assets Notes US$ US$ US$Financial assets at fair value through profit or loss 2 26,390,411 1,487,343,646 69,991,600Cash and cash equivalents 3 55,609 1,097,738 2,209,946Securities sold receivable 2 – 2,661,889 –Receivable for units sold 2 6,138 1,205,302 32,094Interest receivable 2 – – 601,854Dividends receivable 2 30,889 – –Other assets – 34 –Total assets 26,483,047 1,492,308,609 72,835,494
LiabilitiesFinancial liabilities at fair value through profit or loss 2 – (2) (324,411)Bank overdraft 3 (41,222) (157,018) –Management fee payable 6 (25,043) (1,439,244) (44,112)Administration, depositary & operating fees payable 6 (9,429) (519,697) (26,377)Payable for units redeemed 2 (17,839) (1,524,902) (62,673)Total liabilities (excluding net assets attributable to holders of redeemable participating shares) (93,533) (3,640,863) (457,573)
Net assets attributable to holders of redeemable participating units 26,389,514 1,488,667,746 72,377,921
* Barings International Bond Fund changed its name to Barings Global Bond Fund effective 16 August 2019.

The accompanying notes form an integral part of these financial statements.
27
Barings International Umbrella FundStatement of Comprehensive Income
For the financial year ended 30 April 2021
Barings ASEAN Frontiers Fund
30 April 2021
Barings Asia Growth Fund 30 April 2021
Barings Australia Fund
30 April 2021Notes US$ US$ US$
IncomeBank interest income 2 927 571 1,269Dividend income 2 9,469,298 1,966,250 2,336,232Net fair value gain on financial assets and financial liabilities at fair value through profit or loss 2 148,301,747 75,159,745 27,361,085Total income 157,771,972 77,126,566 29,698,586
ExpensesManagement fees 6 (4,063,443) (1,988,427) (724,357)Administration, depositary & operating fees 6 (1,445,322) (712,150) (257,085)General expenses 6 (3,803) (1,439) (720)Total operating expenses (5,512,568) (2,702,016) (982,162)
Net profit before finance costs and taxation 152,259,404 74,424,550 28,716,424
Finance costsDistributions 5 (2,532,687) (245,230) (911,089)Bank interest expense 2 (6,652) (4,566) (2,587)Total finance costs (2,539,339) (249,796) (913,676)
Increase in net assets attributable to holders of redeemable participating units before taxation 149,720,065 74,174,754 27,802,748
TaxationWithholding tax on dividends and other investment income (904,083) (272,992) (559,535)Capital gains tax – (1,102,372) –Total taxation (904,083) (1,375,364) (559,535)
Increase in net assets attributable to holders of redeemable participating units 148,815,982 72,799,390 27,243,213

The accompanying notes form an integral part of these financial statements.
28
Barings International Umbrella FundStatement of Comprehensive Income (continued)
For the financial year ended 30 April 2021
Barings Europa Fund
30 April 2021
Barings Hong Kong China Fund
30 April 2021
Barings Global Bond Fund
30 April 2021Notes US$ US$ US$
IncomeBank interest income 2 129 1,490 353Interest income 2 – – 2,086,151Dividend income 2 713,649 20,992,499 –Net fair value gain on financial assets and financial liabilities at fair value through profit or loss 2 9,581,095 853,189,902 3,464,056Total income 10,294,873 874,183,891 5,550,560
ExpensesManagement fees 6 (369,604) (25,553,479) (841,819)Administration, depositary & operating fees 6 (133,057) (9,193,905) (503,751)General expenses 6 (4,313) (33,199) (1,292)Total operating expenses (506,974) (34,780,583) (1,346,862)
Net profit before finance costs and taxation 9,787,899 839,403,308 4,203,698
Finance costsDistributions 5 (267,975) (2,128,901) (1,195,433)Bank interest expense 2 (2,106) (14,487) (1,989)Total finance costs (270,081) (2,143,388) (1,197,422)
Increase in net assets attributable to holders of redeemable participating units before taxation 9,517,818 837,259,920 3,006,276
TaxationWithholding tax on dividends and other investment income (11,120) (1,294,920) (34,834)Total taxation (11,120) (1,294,920) (34,834)
Increase in net assets attributable to holders of redeemable participating units 9,506,698 835,965,000 2,971,442
Gains and losses solely from continuing operations. There were no gains or losses other than those dealt with in the Statement of Comprehensive Income.

The accompanying notes form an integral part of these financial statements.
29
Barings International Umbrella FundStatement of Comprehensive Income (continued)
For the financial year ended 30 April 2020
Barings ASEAN Frontiers Fund
30 April 2020
Barings Asia Growth Fund 30 April 2020
Barings Australia Fund
30 April 2020Notes US$ US$ US$
IncomeBank interest income 2 3,137 5,102 531Dividend income 2 10,927,103 2,073,201 3,301,258Net fair value loss on financial assets and financial liabilities at fair value through profit or loss 2 (74,349,124) (261,563) (11,775,461)Total (expense)/income (63,418,884) 1,816,740 (8,473,672)
ExpensesManagement fees 6 (3,992,728) (1,085,076) (778,504)Administration, depositary & operating fees 6 (1,420,039) (389,469) (279,613)General expenses 6 (9,193) (2,380) (1,509)Total operating expenses (5,421,960) (1,476,925) (1,059,626)
Net (loss)/profit before finance costs and taxation (68,840,844) 339,815 (9,533,298)
Finance costsDistributions 5 (2,183,266) (193,068) (1,433,163)Bank interest expense 2 (17,301) (2,647) (184)Total finance costs (2,200,567) (195,715) (1,433,347)
(Decrease)/increase in net assets attributable to holders of redeemable participating units before taxation (71,041,411) 144,100 (10,966,645)
TaxationWithholding tax on dividends and other investment income (923,792) (232,662) (847,789)Total taxation (923,792) (232,662) (847,789)
Decrease in net assets attributable to holders of redeemable participating units (71,965,203) (88,562) (11,814,434)

The accompanying notes form an integral part of these financial statements.
30
Barings International Umbrella FundStatement of Comprehensive Income (continued)
For the financial year ended 30 April 2020
Barings Europa Fund
30 April 2020
Barings Hong Kong China Fund
30 April 2020
Barings Global Bond Fund*
30 April 2020Notes US$ US$ US$
IncomeBank interest income 2 107 7,565 9,486Interest income 2 – – 1,817,374Dividend income 2 1,036,782 31,345,857 –Net fair value (loss)/gain on financial assets and financial liabilities at fair value through profit or loss 2 (5,939,316) 59,149,736 4,079,886Total (expense)/income (4,902,427) 90,503,158 5,906,746
ExpensesManagement fees 6 (432,323) (18,853,545) (539,111)Administration, depositary & operating fees 6 (155,636) (6,786,055) (322,913)General expenses 6 (5,343) (47,138) (847)Total operating expenses (593,302) (25,686,738) (862,871)
Net (loss)/profit before finance costs and taxation (5,495,729) 64,816,420 5,043,875
Finance costsDistributions 5 (466,026) (5,143,005) (664,773)Bank interest expense 2 (1,015) (45,592) (8,688)Total finance costs (467,041) (5,188,597) (673,461)
(Decrease)/increase in net assets attributable to holders of redeemable participating units before taxation (5,962,770) 59,627,823 4,370,414
TaxationWithholding tax on dividends and other investment income (126,639) (2,085,307) (12,233)Total taxation (126,639) (2,085,307) (12,233)
(Decrease)/increase in net assets attributable to holders of redeemable participating units (6,089,409) 57,542,516 4,358,181
* Barings International Bond Fund changed its name to Barings Global Bond Fund effective 16 August 2019.
Gains and losses solely from continuing operations. There were no gains or losses other than those dealt with in the Statement of Comprehensive Income.

The accompanying notes form an integral part of these financial statements.
31
Barings International Umbrella FundStatement of Changes in Net Assets Attributable to Holders of Redeemable Participating Units
For the financial year ended 30 April 2021
Barings ASEAN Frontiers Fund
30 April 2021
Barings Asia Growth Fund 30 April 2021
Barings Australia Fund
30 April 2021Notes US$ US$ US$
Net assets attributable to holders of redeemable participating units at the beginning of the financial year 284,185,412 93,523,454 49,892,887Increase in net assets attributable to holders of redeemable participating units 148,815,982 72,799,390 27,243,213Issue of redeemable participating units during the financial year 4 211,549,620 179,790,459 30,398,030Redemption of redeemable participating units during the financial year 4 (183,984,263) (105,381,482) (31,885,338)Income equalisation 5 (54,523) 12,524 (25,872)Net assets attributable to holders of redeemable participating units at the end of the financial year 460,512,228 240,744,345 75,622,920

The accompanying notes form an integral part of these financial statements.
32
Barings International Umbrella FundStatement of Changes in Net Assets Attributable to Holders of Redeemable Participating Units (continued)
For the financial year ended 30 April 2021
Barings Europa Fund
30 April 2021
Barings Hong Kong China Fund
30 April 2021
Barings Global Bond Fund
30 April 2021Notes US$ US$ US$
Net assets attributable to holders of redeemable participating units at the beginning of the financial year 26,389,514 1,488,667,746 72,377,921Increase in net assets attributable to holders of redeemable participating units 9,506,698 835,965,000 2,971,442Issue of redeemable participating units during the financial year 4 1,752,137 687,162,168 122,117,497Redemption of redeemable participating units during the financial year 4 (6,109,105) (574,504,334) (119,543,188)Income equalisation 5 (18,540) (304,293) 165,078Net assets attributable to holders of redeemable participating units at the end of the financial year 31,520,704 2,436,986,287 78,088,750

The accompanying notes form an integral part of these financial statements.
33
Barings International Umbrella FundStatement of Changes in Net Assets Attributable to Holders of Redeemable Participating Units (continued)
For the financial year ended 30 April 2020
Barings ASEAN Frontiers Fund
30 April 2020
Barings Asia Growth Fund 30 April 2020
Barings Australia Fund
30 April 2020Notes US$ US$ US$
Net assets attributable to holders of redeemable participating units at the beginning of the financial year 397,157,265 96,427,714 68,173,737Decrease in net assets attributable to holders of redeemable participating units (71,965,203) (88,562) (11,814,434)Issue of redeemable participating units during the financial year 4 124,780,227 41,740,373 33,885,913Redemption of redeemable participating units during the financial year 4 (165,581,853) (44,564,348) (40,067,328)Income equalisation 5 (205,024) 8,277 (285,001)Net assets attributable to holders of redeemable participating units at the end of the financial year 284,185,412 93,523,454 49,892,887

The accompanying notes form an integral part of these financial statements.
34
Barings International Umbrella FundStatement of Changes in Net Assets Attributable to Holders of Redeemable Participating Units (continued)
For the financial year ended 30 April 2020
Barings Europa Fund
30 April 2020
Barings Hong Kong China Fund
30 April 2020
Barings Global Bond Fund*
30 April 2020Notes US$ US$ US$
Net assets attributable to holders of redeemable participating units at the beginning of the financial year 39,337,424 1,631,811,336 71,045,776(Decrease)/increase in net assets attributable to holders of redeemable participating units (6,089,409) 57,542,516 4,358,181Issue of redeemable participating units during the financial year 4 2,000,804 249,958,174 34,998,883Redemption of redeemable participating units during the financial year 4 (8,811,283) (449,553,632) (38,012,590)Income equalisation 5 (48,022) (1,090,648) (12,329)Net assets attributable to holders of redeemable participating units at the end of the financial year 26,389,514 1,488,667,746 72,377,921
* Barings International Bond Fund changed its name to Barings Global Bond Fund effective 16 August 2019.

35
Barings International Umbrella FundNotes to the financial statements
For the financial year ended 30 April 2021
1. Basis of measurement
The financial statements have been prepared in accordance Irish Generally Accepted Accounting Practice, including Financial Reporting Standard 102, “The Financial Reporting Standard applicable in the UK and Republic of Ireland” (“FRS 102”) as issued by the UK Financial Reporting Council (“FRC”), and Irish law and certain provisions of the European Communities (Undertakings for Collective Investment in Transferable Securities) Regulations 2011(the “UCITS Regulations”). Accounting standards generally accepted in Ireland in preparing financial statements giving a true and fair view are those issued by the Financial Reporting Council (“FRC”).
Barings International Umbrella Fund (the “Unit Trust”) has been authorised by the Central Bank of Ireland (the “CBI”) pursuant to the Unit Trusts Act, 1990, and the Trust Deed. As the Barings ASEAN Frontiers Fund, Barings Asia Growth Fund, Barings Australia Fund, Barings Europa Fund, Barings Hong Kong China Fund and Barings Global Bond Fund (the “Funds”) are registered for sale in Hong Kong, the Unit Trust has also been authorised by the Hong Kong Securities and Futures Commission (“SFC”) pursuant to the provisions of the Hong Kong Code on Unit Trusts and Mutual Funds, supplemented or consolidated from time to time.
The Unit Trust meets all the conditions set out in FRS 102, section 7 and consequently has availed of the exemption available to certain funds not to prepare a statement of cash flows.
The preparation of financial statements requires management to make judgements, estimates and assumptions that affect the application of policies and the reported amounts of assets, liabilities, income and expenses. The estimates and associated assumptions are based on historical experience and various other factors that are believed to be reasonable under the circumstances, the results of which form the basis of the judgements made about carrying values of assets and liabilities that are not readily apparent from other sources. Actual results may differ from these estimates.
The financial statements have been prepared under the historical cost convention as modified by the revaluation of financial assets and financial liabilities, including derivative financial instruments held at fair value through profit or loss. The financial statements have been prepared on a going concern basis.
2. Significant accounting policies
(a) Fair value measurementBy fully adopting FRS 102, in accounting for its financial instruments, a reporting entity is required to apply either (a) the full requirements of FRS 102 relating to Basic Financial Instruments and Other Financial Instruments, b) the recognition and measurement provisions of IAS 39 Financial Instruments: Recognition and Measurement and only the disclosure requirements of FRS 102 relating to Basic Financial Instruments and Other Financial Instruments, or c) the recognition and measurement provisions of IFRS 9 Financial Instruments and only the disclosure requirements of FRS 102 relating to Basic Financial Instruments and Other Financial Instruments. The Unit Trust has chosen to implement (b) the recognition and measurement provisions of IAS 39 Financial Instruments: Recognition and Measurement and only the disclosure requirements of FRS 102 relating to Basic Financial Instruments and Other Financial Instruments.
The use of the IAS 39 recognition and measurement provisions is in line with the pricing policy, which outlines that the fair value of financial assets and financial liabilities be valued at the last traded prices. The financial statements include all the trades received up until 12:00p.m. (Irish time) on 30 April 2021, the valuation point for the Unit Trust.
(b) Foreign exchange transaction
Functional and presentation currencyItems included in the Unit Trust’s financial statements are measured using the currency of the primary economic environment in which it operates (the “functional currency”). The functional and presentation currency of the Unit Trust is the US dollar, which reflects the fact that a majority of the redeemable participating units have been subscribed and redeemed in US dollars.

36
Barings International Umbrella FundNotes to the financial statements (continued)
For the financial year ended 30 April 2021
Transactions and balancesForeign currency transactions are translated into the functional and presentation currency using the exchange rates prevailing at the dates of the transactions. Foreign exchange gains and losses resulting from the settlement of such transactions and from the translation at year-end exchange rates of monetary assets and liabilities denominated in foreign currencies are recognised in the Statement of Comprehensive Income.
Proceeds from subscriptions and amounts paid on redemption of redeemable participating units are translated into the functional currency using the exchange rates prevailing at the dates of the transactions.
They represent the difference between an instrument's initial carrying amount and disposal amount, or cash payments or receipts made on derivative contracts (excluding payments or receipts on collateral margin accounts for such instruments).
(c) Financial assets and financial liabilities at fair value through profit or loss
ClassificationThe Funds classify their investments in securities as financial assets or financial liabilities at fair value through profit or loss. These financial assets and financial liabilities are classified as held for trading or designated by the Directors of the Manager at fair value through profit or loss at inception.
Financial assets or financial liabilities held for trading are those acquired or incurred principally for the purposes of selling or repurchasing in the short term. Financial assets and financial liabilities designated at fair value through profit or loss at inception are those that are managed and whose performance is evaluated on a fair value basis in accordance with the Funds’ documented investment strategies. The Funds’ policy is for Baring Asset Management Limited (the “Investment Manager”) and the Directors of the Manager to evaluate the information about these financial assets on a fair value basis together with other related financial information. These financial assets and financial liabilities are expected to be realised within 12 months of the Statement of Financial Position date.
Recognition/derecognitionPurchases and sales of investments are recognised on the trade date – the date on which the Funds commit to purchasing or selling the investment. The financial statements include all the trades received up until the valuation point for each Fund as disclosed on page 3. Any trades received subsequent to these points are not reflected in the financial statements. Investments are de-recognised when the rights to receive cash flows from the investments have expired or the Funds have transferred substantially all risks and rewards of ownership. Realised gains and losses on disposals of financial assets and financial liabilities classified as 'at fair value through profit or loss' are calculated using the First In First Out (“FIFO”) method. They represent the difference between an instrument's initial carrying amount and disposal amount, or cash payments or receipts made on derivative contracts (excluding payments or receipts on collateral margin accounts for such instruments).
MeasurementFinancial assets and financial liabilities at fair value through profit or loss are initially recognised at fair value. Transaction costs are included in the ‘net fair value gain/(loss) on financial assets at fair value through profit or loss’ in the Statement of Comprehensive Income for each individual Fund. Subsequent to initial recognition, all financial assets and financial liabilities at fair value through profit or loss are measured at fair value at the relevant valuation point for each Fund as disclosed on page 3. Gains and losses arising from changes in the fair value of the ‘Financial assets or financial liabilities at fair value through profit or loss’ category are presented in the Statement of Comprehensive Income in the year in which they arise.
2. Significant accounting policies (continued)
(b) Foreign exchange transaction (continued)

37
Barings International Umbrella FundNotes to the financial statements (continued)
For the financial year ended 30 April 2021
Fair value estimationFair value is the price that would be received to sell an asset or paid to transfer a liability in an orderly transaction between market participants at the measurement date. As a result of the Unit Trust’s decision to implement the recognition and measurement provisions of IAS 39 Financial Instruments: Recognition and Measurement, the fair value of financial assets and liabilities traded in active markets (such as publicly traded derivatives and trading securities) are based on quoted market prices at the Fund's valuation point on the reporting date.
The Unit Trust’s fair valuation input utilises the last traded market price for both financial assets and financial liabilities where the last traded price falls within the bid-ask spread. In circumstances where the last traded price is not within the bid-ask spread, management will determine the point within the bid-ask spread that is most representative of fair value.
The fair value of financial instruments that are not traded in an active market (for example, over-the-counter derivatives) is determined by using valuation techniques. The Funds use a variety of methods and make assumptions that are based on market conditions existing at the Statement of Financial Position date. Unquoted investments are valued in accordance with the most recent valuation made by the Manager. In the absence of a price being available for a security, the Directors of the Manager can determine such a valuation where appropriate. Valuation techniques used include the use of comparable recent arm’s length transactions, discounted cash flow analysis, option pricing models and other valuation techniques commonly used by market participants. On the Barings Hong Kong China Fund portfolio, Tungda Innovative Lighting is valued at US$ nil (30 April 2020: US$ nil).
Forward foreign currency transactionsForward foreign currency transactions “FFCT’s” are measured at fair value based on the closing prices of the FFCTs contract rates on the relevant foreign exchange market on a daily basis. Realised and unrealised gains and/or losses are reported in the Statement of Comprehensive Income.
Futures contractsA futures contract is an agreement between two parties to buy and sell a security, index or currency at a specific price or rate at a future date. Upon entering into a futures contract, the Funds are required to deposit with a broker an amount of cash or cash equivalents equal to a certain percentage of the contract amount. This is known as the “initial cash margin”. Subsequent payments (“variation margins”) are made or received by the Funds each day, depending on the daily fluctuation in the value of the contract.
The daily changes in contract value are recorded as unrealised gains or losses, and the Funds recognise a realised gain or loss when the contract is closed. Unrealised gains and losses on futures contracts are recognised in the Statement of Comprehensive Income.
(d) Income
Interest income and interest expensesInterest income and interest expenses are recognised in the Statement of Comprehensive Income for all debt instruments and cash using the effective interest method. The effective interest method is a method of calculating the amortised cost of a financial asset or financial liability and of allocating the interest income or interest expense over the relevant year. The effective interest rate is the rate that exactly discounts estimated future cash payments or receipts throughout the expected life of the financial instrument, or a shorter year where appropriate, to the net carrying amount of the financial asset or financial liability.
Once a financial asset or a group of similar financial assets has been written down as a result of an impairment loss, interest income is recognised using the rate of interest used to discount the future cash flows for the purpose of measuring the impairment loss.
2. Significant accounting policies (continued)
(c) Financial assets and financial liabilities at fair value through profit or loss (continued)

38
Barings International Umbrella FundNotes to the financial statements (continued)
For the financial year ended 30 April 2021
Dividend IncomeDividends are credited to the Statement of Comprehensive Income on the dates on which the relevant securities are listed as "ex-dividend". Dividend income is shown gross of any irrecoverable withholding taxes, which are disclosed separately in the Statement of Comprehensive Income, and net of any tax credits.
(e) ExpensesAll expenses, including management fees, administration fees and depositary fees, are recognised in the Statement of Comprehensive Income on an accruals basis. The Manager meets all other expenses incurred by the Unit Trust in connection with its services.
(f) ReceivablesReceivables are non-derivative financial assets with fixed or determinable payments that are not quoted in an active market. Receivables are initially recognised at fair value plus transaction costs that are directly attributable to their acquisition origination. They are subsequently measured at amortised cost using the effective interest method, less provision for impairment.
(g) PayablesPayables are initially recognised at fair value and subsequently stated at amortised cost using the effective interest method. The difference between the proceeds and the amounts payable is recognised over the year of the payable using the effective interest method.
(h) Redeemable participating unitsRedeemable participating units are redeemable at the unitholder’s option and are classified as financial liabilities. The accounting policy for recognition of subscriptions and redemptions is that they were recorded effective from the trade date for financing reporting purposes.
The redeemable participating unit can be put back into the Unit Trust on any business day of the Fund for cash equal to a proportionate unit of the Fund’s Net Asset Value. The redeemable participating unit is carried at the redemption amount that is payable at the Statement of Financial Position date if the unitholder exercised their right to put the unit back into the Unit Trust.
In accordance with the provisions of the Trust Deed, listed investments and investments with prices quoted in over-the-counter markets or by market makers are stated at the last traded price on the valuation day for the purpose of determining the Net Asset Value per unit for subscriptions and redemptions and for various fee calculations.
Net assets attributable to holders of redeemable participating units represent a liability in the Statement of Financial Position, carried at the redemption amount that would be payable at the Statement of Financial Position date if the unitholder exercised the right to redeem the unit to the Fund.
(i) Transaction costsTransaction costs are incremental costs that are directly attributable to the acquisition, issue or disposal of a financial asset or financial liability. An incremental cost is one that would not have been incurred if the entity had not acquired, issued or disposed of the financial instrument. When a financial asset or financial liability is recognised initially, an entity shall measure it at its fair value through profit or loss plus transaction costs that are directly attributable to the acquisition or issue of the financial asset or financial liability. They include fees and commissions paid to agents, advisers, brokers or dealers. Transaction costs are included in the ‘net fair value gain/(loss) on financial assets at fair value through profit or loss’ in the Statement of Comprehensive Income for each individual Fund. See note 6, ‘Significant agreements and fees’, for further information on transaction costs.
2. Significant accounting policies (continued)
(d) Income (continued)

39
Barings International Umbrella FundNotes to the financial statements (continued)
For the financial year ended 30 April 2021
(j) DistributionsNote 5 discloses all distributions declared and paid during the year. Income distributions for the Barings Global Bond Fund Class A Inc units and Class I Inc units are normally paid twice annually no later than 31 July and 31 January of each year.
Distributions in respect of Barings ASEAN Frontiers Fund Class A Inc units, Barings Australia Fund Class A Inc units, Barings Europa Fund Class A Inc units and Barings Hong Kong China Fund Class A Inc units are normally paid annually no later than 31 July of each year. Distributions may be declared from net income and net fair value gains on financial assets. Unitholders should note that distributions below US$100/£50/€100 are automatically reinvested. The distribution on these units is recognised in the Statement of Comprehensive Income as finance costs on an ex-date basis. Distributions in respect of Barings Global Bond Fund distributions may be paid out of capital and/or any surplus net income and/or any capital gains less realised and unrealized capital losses.
(k) Net income equalisationNet income equalisation is accrued net income included in the price of units purchased and redeemed during the accounting year. The subscription price of units is deemed to include an equalisation payment calculated by reference to the accrued net income of the relevant Fund, and the first distribution in respect of any unit will include a payment of income usually equal to the amount of such equalisation payment. The redemption price of each unit will also include an equalisation payment in respect of the accrued net income of the relevant Fund up to the date of redemption. Income equalisation is detailed on the statement of changes in net assets of each Fund where applicable.
3. Cash and cash equivalents, margin cash and bank overdrafts
Cash, margin cash and cash equivalents is valued at their fair value with interest accrued, where applicable. Barings ASEAN Frontiers Fund held cash deposits of US$6,755,879 (30 April 2020: bank overdraft of US$522,438), Barings Asia Growth Fund held cash deposits of US$1,628,533 (30 April 2020: US$3,566,198), Barings Australia Fund held cash deposits of US$636,573 (30 April 2020: cash deposits of US$1,268,946), Barings Europa Fund held cash deposits of US$146,522 (30 April 2020: US$14,387), Barings Hong Kong China Fund held cash deposits of US$15,503,976 (30 April 2020: US$940,720) and Barings Global Bond Fund held cash deposits of US$1,133,956 (30 April 2020: US$2,209,946) maintained with The Northern Trust Company (“TNTC”), London branch, uninvested cash balances are being swept daily into the Northern Trust Global Funds.
Any margin cash is held by the broker as this is restricted cash. As at 30 April 2021 and 30 April 2020 the margin cash held was US$Nil.
4. Redeemable units
Financial year ended 30 April 2021
Baring ASEAN Frontiers Fund1.1 1.2 1.21 1.3
Class A USD Inc
No. of Units
Class A AUD Hedged Acc No. of Units
Class A CHF Hedged Acc* No. of Units
Class A EUR Inc
No. of UnitsBalance as at 1 May 2020 937,204 9,851 – 189,857Issued 356,957 17,003 9 58,915Redeemed (425,102) (13,117) – (32,783)Balance as at 30 April 2021 869,059 13,737 9 215,989
2. Significant accounting policies (continued)

40
Barings International Umbrella FundNotes to the financial statements (continued)
For the financial year ended 30 April 2021
1.4 1.5 1.5 1.6Class A GBP
Inc No. of Units
Class A EUR Acc
No. of Units
Class A RMB Hedged Acc No. of Units
Class A USD Acc
No. of UnitsBalance as at 1 May 2020 32,185 10 38 32,999Issued 9,865 9,398 – 61,407Redeemed (17,233) (55) – (50,963)Balance as at 30 April 2021 24,817 9,353 38 43,443
1.61 1.7 1.8 1.9Class I CHF
Hedged Acc** No. of Units
Class I EUR Acc
No. of Units
Class I GBP Acc
No. of Units
Class I USD Acc
No. of UnitsBalance as at 1 May 2020 – 65,806 280,361 56,446Issued 9 29,632 74,027 224,857Redeemed – (5,337) (190,731) (60,860)Balance as at 30 April 2021 9 90,101 163,657 220,443
* The Barings ASEAN Frontiers Fund Class A CHF Hedged Acc was launched on 8 April 2021.** The Barings ASEAN Frontiers Fund Class I CHF Hedged Acc was launched on 8 April 2021.
Barings Asia Growth Fund1.1 1.2 1.3 1.4
Class A USD Inc
No. of Units
Class A EUR Inc
No. of Units
Class A GBP Inc
No. of Units
Class I GBP Acc
No. of UnitsBalance as at 1 May 2020 865,051 66,199 18,831 22,195Issued 767,134 196,704 14,877 25,798Redeemed (567,384) (91,122) (9,851) (11,836)Balance as at 30 April 2021 1,064,801 171,781 23,857 36,157
1.5 1.6Class I USD
Acc No. of Units
Class I EUR Acc
No. of UnitsBalance as at 1 May 2020 29,471 3,651Issued 122,085 89,175Redeemed (5,032) (49,349)Balance as at 30 April 2021 146,524 43,477
Barings Australia Fund1.1 1.2 1.3 1.4
Class A USD Inc
No. of Units
Class A AUD Inc
No. of Units
Class A EUR Inc
No. of Units
Class A GBP Inc
No. of UnitsBalance as at 1 May 2020 338,122 18,477 28,656 2,752Issued 142,480 6,017 71,097 1,132Redeemed (166,221) (17,531) (72,049) (2,127)Balance as at 30 April 2021 314,381 6,963 27,704 1,757
4. Redeemable units (continued)
Financial year ended 30 April 2021 (continued)
Baring ASEAN Frontiers Fund (continued)

41
Barings International Umbrella FundNotes to the financial statements (continued)
For the financial year ended 30 April 2021
1.5 1.6Class I GBP
Acc No. of Units
Class I USD Acc
No. of UnitsBalance as at 1 May 2020 5,435 109,625Issued 28,309 –Redeemed (2,739) –Balance as at 30 April 2021 31,005 109,625
Barings Europa Fund1.1 1.2 1.3 1.4
Class A USD Inc
No. of Units
Class A EUR Inc
No. of Units
Class C EUR Inc
No. of Units
Class C USD Inc
No. of UnitsBalance as at 1 May 2020 438,930 134,099 4,460 3,563Issued 26,147 7,112 – –Redeemed (93,357) (17,593) (1) (855)Balance as at 30 April 2021 371,720 123,618 4,459 2,708
Barings Hong Kong China Fund1.1 1.2 1.3 1.4
Class A USD Inc
No. of Units
Class A EUR Inc
No. of Units
Class A GBP Inc
No. of Units
Class A HKD Inc
No. of UnitsBalance as at 1 May 2020 967,298 165,002 799 1,411Issued 229,205 62,589 4,630 10,025Redeemed (251,918) (47,135) (1,313) (6,251)Balance as at 30 April 2021 944,585 180,456 4,116 5,185
1.5 1.6 1.7 1.8Class A RMB Hedged Acc No. of Units
Class A USD Acc
No. of Units
Class C EUR Inc
No. of Units
Class C USD Inc
No. of UnitsBalance as at 1 May 2020 10 52,759 104 609Issued – 26,435 144 6Redeemed – (13,219) (30) (34)Balance as at 30 April 2021 10 65,975 218 581
1.9 2.1Class I GBP
Acc No. of Units
Class I USD Acc
No. of UnitsBalance as at 1 May 2020 2,200 4,207Issued 7,143 21,628Redeemed (3,110) (5,163)Balance as at 30 April 2021 6,233 20,672
4. Redeemable units (continued)
Financial year ended 30 April 2021 (continued)
Barings Australia Fund (continued)

42
Barings International Umbrella FundNotes to the financial statements (continued)
For the financial year ended 30 April 2021
Barings Global Bond Fund1.1 1.2 1.3 1.4
Class A USD Inc
No. of Units
Class A EUR Inc
No. of Units
Class A GBP Inc
No. of Units
Class I GBP Inc
No. of UnitsBalance as at 1 May 2020 2,376,449 247,431 5,211 6,681Issued 4,156,028 62,894 8,547 33,899Redeemed (4,068,715) (80,121) (3,633) (15,804)Balance as at 30 April 2021 2,463,762 230,204 10,125 24,776
1.5Class I USD
Acc No. of Units
Balance as at 1 May 2020 67,880Issued 26,373Redeemed (25,381)Balance as at 30 April 2021 68,872
Financial year ended 30 April 2020
Barings ASEAN Frontiers Fund1.1 1.2 1.3 1.4
Class A USD Inc
No. of Units
Class A AUD Hedged Acc No. of Units
Class A EUR Inc
No. of Units
Class A GBP Inc
No. of UnitsBalance as at 1 May 2019 1,040,278 11,518 199,359 33,084Issued 306,145 4,883 60,656 9,578Redeemed (409,219) (6,550) (70,158) (10,477)Balance as at 30 April 2020 937,204 9,851 189,857 32,185
1.5 1.5 1.6 1.7Class A EUR
Acc No. of Units
Class A RMB Hedged Acc No. of Units
Class A USD Acc
No. of Units
Class I EUR Acc
No. of UnitsBalance as at 1 May 2019 – 81 41,538 101,923Issued 217 – 26,855 60,483Redeemed (207) (43) (35,394) (96,600)Balance as at 30 April 2020 10 38 32,999 65,806
1.8 1.9Class I GBP
Acc No. of Units
Class I USD Acc
No. of UnitsBalance as at 1 May 2019 331,495 50,677Issued 62,380 61,777Redeemed (113,514) (56,008)Balance as at 30 April 2020 280,361 56,446
4. Redeemable units (continued)
Financial year ended 30 April 2021 (continued)

43
Barings International Umbrella FundNotes to the financial statements (continued)
For the financial year ended 30 April 2021
Barings Asia Growth Fund1.1 1.2 1.3 1.4
Class A USD Inc
No. of Units
Class A EUR Inc
No. of Units
Class A GBP Inc
No. of Units
Class I GBP Acc
No. of UnitsBalance as at 1 May 2019 868,150 67,373 17,070 19,562Issued 419,534 16,835 5,869 10,668Redeemed (422,633) (18,009) (4,108) (8,035)Balance as at 30 April 2020 865,051 66,199 18,831 22,195
1.5 1.6Class I USD
Acc No. of Units
Class I EUR Acc
No. of UnitsBalance as at 1 May 2019 41,348 1,511Issued 6,282 2,411Redeemed (18,159) (271)Balance as at 30 April 2020 29,471 3,651
Barings Australia Fund1.1 1.2 1.3 1.4
Class A USD Inc
No. of Units
Class A AUD Inc
No. of Units
Class A EUR Inc
No. of Units
Class A GBP Inc
No. of UnitsBalance as at 1 May 2019 522,957 16,709 30,713 2,440Issued 90,571 4,990 61,084 945Redeemed (275,406) (3,222) (63,141) (633)Balance as at 30 April 2020 338,122 18,477 28,656 2,752
1.5 1.6Class I GBP
Acc No. of Units
Class I USD Acc
No. of UnitsBalance as at 1 May 2019 5,539 82Issued 2,208 109,549Redeemed (2,312) (6)Balance as at 30 April 2020 5,435 109,625
Barings Europa Fund1.1 1.2 1.3 1.4
Class A USD Inc
No. of Units
Class A EUR Inc
No. of Units
Class C EUR Inc
No. of Units
Class C USD Inc
No. of UnitsBalance as at 1 May 2019 537,309 156,690 4,449 8,248Issued 31,676 6,797 11 20Redeemed (130,055) (29,388) – (4,705)Balance as at 30 April 2020 438,930 134,099 4,460 3,563
4. Redeemable units (continued)
Financial year ended 30 April 2020 (continued)

44
Barings International Umbrella FundNotes to the financial statements (continued)
For the financial year ended 30 April 2021
Barings Hong Kong China Fund1.1 1.2 1.3 1.4
Class A USD Inc
No. of Units
Class A EUR Inc
No. of Units
Class A GBP Inc
No. of Units
Class A HKD Inc
No. of UnitsBalance as at 1 May 2019 1,105,925 187,663 1,385 2,687Issued 149,137 15,497 602 4,438Redeemed (287,764) (38,158) (1,188) (5,714)Balance as at 30 April 2020 967,298 165,002 799 1,411
1.5 1.6 1.7 1.8Class A RMB Hedged Acc No. of Units
Class A USD Acc
No. of Units
Class C EUR Inc
No. of Units
Class C USD Inc
No. of UnitsBalance as at 1 May 2019 10 62,782 118 783Issued – 35,721 – –Redeemed – (45,744) (14) (174)Balance as at 30 April 2020 10 52,759 104 609
1.9 2.1Class I GBP
Acc No. of Units
Class I USD Acc
No. of UnitsBalance as at 1 May 2019 1,616 3,283Issued 1,789 969Redeemed (1,205) (45)Balance as at 30 April 2020 2,200 4,207
Barings Global Bond Fund*I
1.1 1.2 1.3 1.4Class A USD
Inc No. of Units
Class A EUR Inc
No. of Units
Class A GBP Inc
No. of Units
Class I GBP Inc
No. of UnitsBalance as at 1 May 2019 2,590,518 213,938 3,788 13,140Issued 1,122,699 75,201 1,883 10,019Redeemed (1,336,768) (41,708) (460) (16,478)Balance as at 30 April 2020 2,376,449 247,431 5,211 6,681
1.5Class I USD
Acc No. of Units
Balance as at 1 May 2019 1,782Issued 93,102Redeemed (27,004)Balance as at 30 April 2020 67,880
* Barings International Bond Fund changed its name to Barings Global Bond Fund effective 16 August 2019.
4. Redeemable units (continued)
Financial year ended 30 April 2020 (continued)

45
Barings International Umbrella FundNotes to the financial statements (continued)
For the financial year ended 30 April 2021
5. Distributions
The following distributions were declared by the below Funds during the financial year ended 30 April 2021 and 30 April 2020:
Distribution frequency
Distributed amount paid*
Income equalisation**
US$ US$Barings ASEAN Frontiers Fund - Class A Annual (2,532,687) (54,523)
US$ US$Barings Asia Growth Fund - Class A Annual (245,230) 12,524
US$ US$Barings Australia Fund - Class A Annual (911,089) (25,872)
US$ ,US$Barings Europa Fund - Class A Annual (267,975) (18,540)
US$ US$Barings Hong Kong China Fund - Class A Annual (2,128,901) (304,293)
US$ US$Barings Global Bond Fund - Class A USD Inc Semi Annual (1,113,141) 167,162
€ €Barings Global Bond Fund - Class A EUR Inc Semi Annual (66,722) (2,745)
£ £Barings Global Bond Fund - Class A GBP Inc Semi Annual (1,412) 96Barings Global Bond Fund - Class I GBP Inc Semi Annual (4,727) 835
US$ US$Total Barings Global Bond Fund (1,195,433) 165,078
*Includes distributions with an ex-date of 1 May 2020 which were paid during the current financial year. These distributions with an ex-date of 1 May 2020 reflect the undistributed income on the Fund as at 30 April 2020.** Income equalisation relates to the dealing activity of distributing classes for the year from 1 May 2020 to 30 April 2021. The income equalisation of the distributing classes is disclosed separately in the statement of changes in net assets attributable to holders of redeemable participating shares for the financial year ended 30 April 2021.

46
Barings International Umbrella FundNotes to the financial statements (continued)
For the financial year ended 30 April 2021
Comparative 30 April 2020Distribution
frequencyDistributed
amount paid*Income
equalisation**
US$ US$Barings ASEAN Frontiers Fund - Class A Annual (2,183,266) (205,024)
US$ US$Barings Asia Growth Fund - Class A Annual (193,068) 8,277
US$ US$Barings Australia Fund - Class A Annual (1,433,163) (285,001)
US$ US$Barings Europa Fund - Class A Annual (466,026) (48,022)
US$ US$Barings Hong Kong China Fund - Class A Annual (5,143,005) (1,090,648)
US$ US$Barings Global Bond Fund*** - Class A USD Inc Semi Annual (661,950) (11,931)
£ £Barings Global Bond Fund*** - Class I GBP Inc Semi Annual (2,165) (292)
US$ US$Total Barings Global Bond Fund*** (664,773) (12,329)
*Includes distributions with an ex-date of 1 May 2019 which were paid during the current financial year. These distributions with an ex-date of 1 May 2019 reflect the undistributed income on the Fund as at 30 April 2019.** Income equalisation relates to the dealing activity of distributing classes for the year from 1 May 2019 to 30 April 2020. The income equalisation of the distributing classes is disclosed separately in the statement of changes in net assets attributable to holders of redeemable participating shares for the financial year ended 30 April 2020.*** Barings International Bond Fund changed its name to Barings Global Bond Fund effective 16 August 2019.
5. Distributions (continued)

47
Barings International Umbrella FundNotes to the financial statements (continued)
For the financial year ended 30 April 2021
6. Significant agreements and fees
Management feesBarings International Fund Managers (Ireland) Limited (the “Manager”) is entitled under the Trust Deed to charge a management fee in respect of the Funds at the following percentage rate per annum of the Net Asset Value of the Funds:
Fund / class Management feeBarings ASEAN Frontiers Fund - Class A USD Inc 1.25%Barings ASEAN Frontiers Fund - Class A AUD Hedged Acc 1.25%Barings ASEAN Frontiers Fund - Class A CHF Hedged Acc* 1.25%Barings ASEAN Frontiers Fund - Class A EUR Inc 1.25%Barings ASEAN Frontiers Fund - Class A GBP Inc 1.25%Barings ASEAN Frontiers Fund - Class A RMB Hedged Acc 1.25%Barings ASEAN Frontiers Fund - Class A EUR Acc 1.25%Barings ASEAN Frontiers Fund - Class A USD Acc 1.25%Barings ASEAN Frontiers Fund - Class I CHF Hedged Acc** 0.75%Barings ASEAN Frontiers Fund - Class I EUR Acc 0.75%Barings ASEAN Frontiers Fund - Class I GBP Acc 0.75%Barings ASEAN Frontiers Fund - Class I USD Acc 0.75%Barings Asia Growth Fund - Class A USD Inc 1.25%Barings Asia Growth Fund - Class A EUR Inc 1.25%Barings Asia Growth Fund - Class A GBP Inc 1.25%Barings Asia Growth Fund - Class I EUR Acc 0.75%Barings Asia Growth Fund - Class I USD Acc 0.75%Barings Asia Growth Fund - Class I GBP Acc 0.75%Barings Australia Fund - Class A USD Inc 1.25%Barings Australia Fund - Class A AUD Inc 1.25%Barings Australia Fund - Class A EUR Inc 1.25%Barings Australia Fund - Class A GBP Inc 1.25%Barings Australia Fund - Class I GBP Acc 0.75%Barings Australia Fund - Class I USD Acc 0.75%Barings Europa Fund - Class A USD Inc 1.25%Barings Europa Fund - Class A EUR Inc 1.25%Barings Europa Fund - Class C EUR Inc 1.25%Barings Europa Fund - Class C USD Inc 1.25%Barings Hong Kong China Fund - Class A USD Inc 1.25%Barings Hong Kong China Fund - Class A EUR Inc 1.25%Barings Hong Kong China Fund - Class A GBP Inc 1.25%Barings Hong Kong China Fund - Class A HKD Inc 1.25%Barings Hong Kong China Fund - Class A RMB Hedged Acc 1.25%Barings Hong Kong China Fund - Class A USD Acc 1.25%Barings Hong Kong China Fund - Class C EUR Inc 1.25%Barings Hong Kong China Fund - Class C USD Inc 1.25%Barings Hong Kong China Fund - Class I GBP Acc 0.75%Barings Hong Kong China Fund - Class I USD Acc 0.75%Barings Global Bond Fund - Class A USD Inc 0.75%Barings Global Bond Fund - Class A EUR Inc 0.75%Barings Global Bond Fund - Class A GBP Inc 0.75%Barings Global Bond Fund - Class I GBP Inc 0.50%Barings Global Bond Fund - Class I USD Acc 0.50%
* The Barings ASEAN Frontiers Fund Class A CHF Hedged Acc was launched on 8 April 2021.** The Barings ASEAN Frontiers Fund Class I CHF Hedged Acc was launched on 8 April 2021.

48
Barings International Umbrella FundNotes to the financial statements (continued)
For the financial year ended 30 April 2021
The Unit Trust is managed by the Manager, which has delegated investment responsibilities to Baring Asset Management Limited (the “Investment Manager”). The Investment Manager is an investment management company incorporated in London on 6 April 1994. The Investment Manager is part of the Barings LLC Group and is a wholly owned subsidiary of Massachusetts Mutual Life Insurance Company (“MassMutual”). The Investment Manager has appointed Baring Asset Management (Asia) Limited, Barings LLC and Barings Japan Limited (together, the “Sub-Investment Managers”) as the Sub-Investment Managers to the relevant Funds. The Sub-Investment Managers are also part of the Barings LLC Group. Management fees charged during the financial year-end are disclosed on each Fund’s Statement of Comprehensive Income and the outstanding amounts payable for management fees as at the end of the financial year-end are disclosed on each Fund’s Statement of Financial Position.
The Manager will discharge the fees and expenses of the Investment Manager out of its own fee. The Investment Manager will discharge the fees and expenses of the Sub-Investment Managers out of its own fee. The management fee is payable monthly in arrears and is calculated and accrued by reference to the Net Asset Value of each Funds as at each business day (“valuation day”).
Where the Net Asset Value of any Fund includes interests in any Investment Fund managed by a subsidiary of the parent company (a “Barings Fund”), the fee payable to the Manager relating to the holding will be reduced by the percentage rate (if any) charged to the Barings Fund for comparable management services.
Administration, Depositary and Operating fees The Manager is entitled to receive an administration, depositary and operating fee. The fee payable is a percentage of the Net Asset Value of each class and is accrued daily and paid monthly in arrears. The Manager pays the aggregate fees and expenses of the Administrator and Depositary, in addition to certain other fees and ongoing expenses.
For Barings ASEAN Frontiers Fund, the Manager is entitled to receive a fee of 0.45% per annum for all A unit classes (A Hedged classes 0.4625%) and 0.25% per annum for all I unit classes (I Hedged classes 0.2625%).
For Barings Asia Growth Fund, the Manager is entitled to receive a fee of 0.45% per annum for all A unit classes (A Hedged classes 0.4625%) and 0.25% per annum for all I unit classes (I Hedged classes 0.2625%).
For Barings Australia Fund and Barings Global Bond Fund, the Manager is entitled to receive a fee of 0.45% per annum for all A unit classes (A Hedged classes 0.4625%) and 0.25% per annum for all I unit classes.
For Barings Europa Fund and Barings Hong Kong China Fund, the Manager is entitled to receive a fee of 0.45% per annum for all A and C unit classes (A Hedged classes 0.4625%) and 0.25% per annum for all I unit classes.
Please refer to the Prospectus for full details of the fees payable.
Investment fundsThe Funds currently invest in Northern Trust Global Funds managed by Northern Trust Global Funds a related party to the Administrator and Depositary. These holdings are detailed in the schedule of investments.
Trailer fees and reimbursementsTrailer fees (commissions for the marketing of the Funds) are paid to distribution, commission and sales agents out of the management fees. Reimbursements to institutional investors, who, from a commercial perspective, are holding the Funds’ redeemable participating units for third parties, are also paid out of the management fees.
6. Significant agreements and fees (continued)
Management fees (continued)

49
Barings International Umbrella FundNotes to the financial statements (continued)
For the financial year ended 30 April 2021
Transaction costsThe transaction costs incurred by the Funds for the years ended 30 April 2021 and 30 April 2020 were as follows:
Fund
30 April 2021
30 April 2020
Barings ASEAN Frontiers Fund US$743,979 US$942,210Barings Asia Growth Fund US$442,848 US$153,331Barings Australia Growth Fund US$16,712 US$27,039Barings Europa Fund US$29,785 US$22,893Barings Hong Kong China Fund US$4,427,484 US$3,506,705Barings Global Bond Fund* – –
* Barings International Bond Fund changed its name to Barings Global Bond Fund effective 16 August 2019.
7. Related party transactions
Julian Swayne is employed by Barings Investment Services Limited. Alan Behen and Paul Smyth are employees of the Manager. David Conway and Barbara Healy are non-executive Directors, independent of the Investment Manager. James Cleary was a non-executive Director, independent of the Investment Manager, prior to his resignation on 31 December 2020. Peter Clark was an employee of Barings Investment Services Limited and Timothy Schulze was an employee of Barings LLC prior to their resignations on 21 October 2020 and 10 August 2020, respectively. The Manager will discharge the fees and expenses of the Investment Manager out of its own fee. The Investment Manager is part of the Barings LLC Group and is a wholly owned subsidiary of Massachusetts Mutual Life Insurance Company (“MassMutual”). Baring Asset Management (Asia) Limited, Barings LLC and Barings Japan Limited (together, the “Sub-Investment Managers”) are also part of the Barings LLC Group. The Investment Manager will discharge the fees and expenses of the Sub-Investment Managers out of its own fee. Parties are considered to be related if one party has the ability to control the other party or exercise significant influence over the other party in making financial or operation decisions.
Significant unitholdingsThe following table details significant concentrations in unitholdings of each Fund, or instances where the units are beneficially held by other investment funds managed by the Investment Manager or one of its affiliates. As at 30 April 2021 and 30 April 2020, the following had significant unitholdings in the Unit Trust:
Fund name
Number of unitholders with
beneficial interest greater than 20%
of the units in issue
Total % of units held by unitholders with
beneficial interest greater than 20% of
the units in issue
Total % of units held by investment funds managed
by Barings International Fund Managers (Ireland)
LimitedBarings ASEAN Frontiers Fund Nil (30 April 2020: Nil) Nil (30 April 2020: Nil) 0.81% (30 April 2020: Nil)Barings Asia Growth Fund Nil (30 April 2020: Nil) Nil (30 April 2020: Nil) 6.29% (30 April 2020: Nil)
Barings Australia Fund 1 (30 April 2020: 1)22.29% (30 April 2020:
21.78%) Nil (30 April 2020: Nil)Barings Europa Fund Nil (30 April 2020: Nil) Nil (30 April 2020: Nil) Nil (30 April 2020: Nil)Barings Hong Kong China Fund 1 (30 April 2020: Nil) 20.28% (30 April 2020: Nil) 0.12% (30 April 2020: Nil)
Barings Global Bond Fund* 1 (30 April 2020: 1)24.50% (30 April 2020:
24.76%) Nil (30 April 2020: Nil)
* Barings International Bond Fund changed its name to Barings Global Bond Fund effective 16 August 2019.
6. Significant agreements and fees (continued)

50
Barings International Umbrella FundNotes to the financial statements (continued)
For the financial year ended 30 April 2021
8. Financial risk management
In accordance with FRS 102: Disclosure, this note details the way in which the Funds manage risks associated with the use of financial instruments.
The Funds of the Unit Trust are exposed to a variety of financial risks in pursuing their stated investment objectives and policies. These risks include, but are not limited to, credit risk, liquidity risk and market risk (which in turn includes foreign currency risk, interest rate risk and market price risk). The Funds assume exposure to certain of these risks to generate investment returns on their portfolios, although these risks can also potentially result in a reduction in the Funds’ net assets.
The Investment Manager will use its best endeavours to minimise the potentially adverse effects of these risks on the Funds’ performance where it can do so, while still managing the investments of the Funds in a way that is consistent with the Funds’ investment objectives.
The investment objective of the Funds is disclosed in the Prospectus and in the Investment Objective and Policy on page 4. The risks, and the measures adopted by the Funds for managing these risks, are detailed below.
The nature and extent of the financial instruments outstanding at the Statement of Financial Position date and the risk management policies employed by the Fund are discussed below. These policies have remained substantially unchanged since the beginning of the financial year to which these financial statements relate.
Market riskMarket risk embodies the potential for both losses and gains and included foreign currency risk, interest rate risk and price risk, which are discussed in detail under separate headings within this note.
The Funds' exposure to market risk is that the value of assets would generally fluctuate with, among other things, general economic conditions, the condition of certain financial markets, international political events and developments or trends in any particular industry that the Funds' invested in.
The Funds' market risk is managed on a daily basis by the Investment Manager in accordance with policy and procedures in place. The Funds' overall market positions are reported to the Board of Directors on a monthly basis.
As the majority of the financial instruments are carried at fair value through the profit or loss, all changes in market conditions directly impact the net assets of the Funds.
Foreign currency riskForeign currency risk is defined in FRS 102 as “the risk that the fair value or future cash flows of a financial instrument will fluctuate because of changes in foreign exchange rates.”
The Funds are exposed to foreign currency risk as assets and liabilities of the Funds may be denominated in a currency other than the functional currency of the Funds, which is the US dollar. The fluctuations in the rate of exchange between the currency in which the asset or liability is denominated and the functional currency could result in an appreciation or depreciation in the fair value of those assets and liabilities. The Investment Manager is permitted but not obliged to use hedging techniques to attempt to offset market and foreign currency risk.
In accordance with the Unit Trust’s policy, the Investment Manager monitors the Funds’ currency exposures on a daily basis and reports regularly to the Directors of the Manager, who review the information provided by the Investment Manager on any significant exposures at their periodic meetings.
The Investment Manager may have used FFCTs on Funds as a tool and technique to hedge these currency exposures. Barings Global Bond Fund’s sensitivity to changes in foreign currency rates is included in the VaR risk analysis above.
The Funds’ portfolio statements detail the currency, and therefore the foreign currency risk, of the underlying investments.

51
Barings International Umbrella FundNotes to the financial statements (continued)
For the financial year ended 30 April 2021
Foreign exchange transactions and other currency contracts may also be used to provide protection against exchange risks or to actively overlay currency views onto the Funds’ currency exposure resulting from investing in foreign markets. Such contracts may, at the discretion of the Investment Manager, be used to hedge some or all of the exchange risk/currency risk arising as a result of the fluctuation between the denominated currency of the Funds and the currencies in which the Funds’ investments are denominated, or to pursue an active currency overlay strategy.
A Fund may (but is not obliged to) enter into certain currency-related transactions in order to hedge the currency exposure of the assets of a Fund attributable to a particular class into the currency of denomination of the relevant class. Any financial instruments used to implement such strategies with respect to one or more classes shall be assets/liabilities of a Fund as a whole but will be attributable to the relevant class/es, and the gains/losses on, and the costs of, the relevant financial instruments will accrue solely to the relevant class.
Any currency exposure of a class may not be combined with or offset against that of any other class of a Fund. The currency exposure of the assets attributable to a class may not be allocated to other classes. A class will not be leveraged as a result of currency hedging transactions so that the use of such hedging instruments shall in no case exceed 100% of the Net Asset Value attributable to the relevant class of a Fund.
The tables below represent each Fund’s exposure to foreign currency as at 30 April 2021 and 30 April 2020. All amounts are stated in the functional currency of the relevant Fund.
For the financial year ended 30 April 2021
Barings ASEAN Frontiers Fund
Financial assets at fair value through
profit or loss
Cash and cash
equivalentsOther assets and liabilities Derivatives Net exposure
% of Net Assets
US$ US$ US$ US$ US$AUD – (1,995) (4) 3,148,891 3,146,892 0.68CHF – – – 2,034 2,034 –CLP – – – 11,775 11,775 –EUR – 27,188 (43) (14,582) 12,563 –GBP – 64,015 (116) (63,737) 162 –HKD 8,264,938 – – – 8,264,938 1.79IDR 79,249,721 9,898 (963,407) 299,432 78,595,644 17.07MYR 47,576,212 – – – 47,576,212 10.33PHP 19,234,191 – – – 19,234,191 4.18SGD 101,315,469 (2) 290,640 – 101,606,107 22.06THB 136,973,316 – 582,975 – 137,556,291 29.87VND 13,824,591 – – – 13,824,591 3.00
8. Financial risk management (continued)
Foreign currency risk (continued)

52
Barings International Umbrella FundNotes to the financial statements (continued)
For the financial year ended 30 April 2021
Barings Asia Growth Fund
Financial assets at fair value through
profit or loss
Cash and cash
equivalentsOther assets and liabilities Derivatives Net exposure
% of Net Assets
US$ US$ US$ US$ US$CNY 23,869,789 8,225 – – 23,878,014 9.92EUR – 21,358 (78) (21,214) 66 –GBP – 74,102 (6) (74,101) (5) –HKD 81,220,215 – 247,835 (173,191) 81,294,859 33.77INR 25,272,639 364,787 – – 25,637,426 10.65KRW 47,726,000 – (1,152,726) 1,223,303 47,796,577 19.85MYR 2,329,637 – – – 2,329,637 0.97SGD 3,675,690 – – – 3,675,690 1.53THB 6,422,404 – 60,794 – 6,483,198 2.69TWD 33,995,490 1 488,810 (488,810) 33,995,491 14.12VND 556,275 860 – – 557,135 0.23
Barings Australia Fund
Financial assets at fair value through
profit or loss
Cash and cash
equivalentsOther assets and liabilities Derivatives Net exposure
% of Net Assets
US$ US$ US$ US$ US$AUD 75,256,911 (1,466,128) 1,435,719 – 75,226,502 99.48EUR – 101,786 (11) – 101,775 0.13GBP – 95,920 – – 95,920 0.13
Barings Europa Fund
Financial assets at fair value through
profit or loss
Cash and cash
equivalentsOther assets and liabilities Derivatives Net exposure
% of Net Assets
US$ US$ US$ US$ US$CHF 6,173,403 – – – 6,173,403 19.59EUR 17,602,203 137,680 28,853 (20,042) 17,748,694 56.31GBP 6,335,565 – 21,817 – 6,357,382 20.17SEK 1,267,794 – 16,000 – 1,283,794 4.07
Barings Hong Kong China Fund
Financial assets at fair value through
profit or loss
Cash and cash
equivalentsOther assets and liabilities Derivatives Net exposure
% of Net Assets
US$ US$ US$ US$ US$CNY 324,659,262 5,227,481 – 22,282 329,909,025 13.54EUR – 372,653 (141) (361,458) 11,054 –GBP – 116,229 (51) (117,780) (1,602) –HKD 1,464,877,503 106,123 2,228,714 (900,351) 1,466,311,989 60.17KRW – (38) – – (38) –TWD 176,872,602 – – – 176,872,602 7.26
8. Financial risk management (continued)
Foreign currency risk (continued)
For the financial year ended 30 April 2021 (continued)

53
Barings International Umbrella FundNotes to the financial statements (continued)
For the financial year ended 30 April 2021
For the financial year ended 30 April 2020
Barings ASEAN Frontiers Fund
Financial assets at fair value through
profit or loss
Cash and cash
equivalentsOther assets and liabilities Derivatives Net exposure
% of Net Assets
US$ US$ US$ US$ US$AUD – 1,621 – 1,177,332 1,178,953 0.41CLP – – – 6,499 6,499 –EUR 1 92,022 (13) (72,221) 19,789 0.01GBP – (843,970) (24) 844,221 227 –HKD 1,777,648 – – – 1,777,648 0.63IDR 65,108,876 – 269,420 – 65,378,296 23.01MYR 27,492,562 – – – 27,492,562 9.67PHP 19,759,079 – – – 19,759,079 6.95SGD 65,608,873 (2) (1,326,024) 1,374,807 65,657,654 23.10THB 65,877,099 – 1,023,269 (712,002) 66,188,366 23.29VND 16,324,648 402,567 – – 16,727,215 5.89
Barings Asia Growth Fund
Financial assets at fair value through
profit or loss
Cash and cash
equivalentsOther assets and liabilities Derivatives Net exposure
% of Net Assets
US$ US$ US$ US$ US$CNY 3,775,235 – – – 3,775,235 4.04EUR – 20,293 – (20,162) 131 –GBP – 30,490 – (30,488) 2 –HKD 39,120,156 – – – 39,120,156 41.83IDR 2,152,477 – – – 2,152,477 2.30INR 9,165,863 – – – 9,165,863 9.80KRW 11,595,064 – 38,545 – 11,633,609 12.44MYR 1,455,842 – – – 1,455,842 1.56PHP 1,338,353 – – – 1,338,353 1.43SGD 533,872 – – – 533,872 0.57THB 3,189,224 – 23,877 – 3,213,101 3.44TWD 11,672,263 – 32,289 – 11,704,552 12.52VND 533,964 137,429 – – 671,393 0.72
Barings Australia Fund
Financial assets at fair value through
profit or loss
Cash and cash
equivalentsOther assets and liabilities Derivatives Net exposure
% of Net Assets
US$ US$ US$ US$ US$AUD 48,986,304 1,202,771 (81,825) – 50,107,250 100.43EUR 67,752 (21,306) (13) – 46,433 0.09GBP 12,510 40,981 – – 53,491 0.11
8. Financial risk management (continued)
Foreign currency risk (continued)

54
Barings International Umbrella FundNotes to the financial statements (continued)
For the financial year ended 30 April 2021
Barings Europa Fund
Financial assets at fair value through
profit or loss
Cash and cash
equivalentsOther assets and liabilities Derivatives Net exposure
% of Net Assets
US$ US$ US$ US$ US$CHF 6,512,338 34,928 – (34,928) 6,512,338 24.68EUR 14,778,312 20,681 6,371 29,979 14,835,343 56.22GBP 4,164,583 – 8,841 – 4,173,424 15.81NOK 407,415 – – – 407,415 1.54SEK 527,762 – 15,677 – 543,439 2.06
Barings Hong Kong China Fund
Financial assets at fair value through
profit or loss
Cash and cash
equivalentsOther assets and liabilities Derivatives Net exposure
% of Net Assets
US$ US$ US$ US$ US$CNY 212,937,550 – – 12,301 212,949,851 14.30EUR – 75,590 (17) (65,480) 10,093 –GBP – 8,453 (26) (8,369) 58 –HKD 852,163,566 1,013,694 2,661,889 (3,673,346) 852,165,803 57.24KRW – (35) – – (35) –TWD 61,526,483 – – – 61,526,483 4.13
8. Financial risk management (continued)
Foreign currency risk (continued)
For the financial year ended 30 April 2020 (continued)

55
Barings International Umbrella FundNotes to the financial statements (continued)
For the financial year ended 30 April 2021
Sensitivity analysis
The below currency sensitivity analysis information is a relative estimate of risk and is not intended to be a precise and accurate number. The calculations are based on historical data. Future rate movements and correlations between currencies could vary significantly from those experienced in the past.
At 30 April 2021, had the exchange rate between the US Dollar and other currencies increased or decreased by 5% (30 April 2020: 5%) with all other variables held constant, the increase or decrease in the value of the Net Assets attributable to holders of redeemable participating units would be as follows:
30 Apr 2021 Barings ASEAN Frontiers Fund
Barings Asia Growth Fund
Barings Australia Fund
US$ US$ US$AUD 157,345 – 3,761,325CHF 102 – –CLP 589 – –CNY – 1,193,901 –EUR 628 3 5,089GBP 8 – 4,796HKD 413,247 4,064,743 –IDR 3,929,782 – –INR – 1,281,871 –KRW – 2,389,829 –MYR 2,378,811 116,482 –PHP 961,710 – –SGD 5,080,305 183,785 –THB 6,877,815 324,160 –TWD – 1,699,775 –VND 691,230 27,857 –
30 Apr 2021 Barings Europa Fund
Barings Hong Kong China Fund
US$ US$CHF 308,670 –CNY – 16,495,451EUR 887,435 553GBP 317,869 (80)HKD – 73,315,599KRW – (2)SEK 64,190 –TWD – 8,843,630
8. Financial risk management (continued)
Foreign currency risk (continued)

56
Barings International Umbrella FundNotes to the financial statements (continued)
For the financial year ended 30 April 2021
30 Apr 2020 Barings ASEAN Frontiers Fund
Barings Asia Growth Fund
Barings Australia Fund
US$ US$ US$AUD 58,948 – 2,505,363CLP 325 – –CNY – 188,762 –EUR 989 7 2,322GBP 11 – 2,675HKD 88,882 1,956,008 –IDR 3,268,915 107,624 –INR – 458,293 –KRW – 581,680 –MYR 1,374,628 72,792 –PHP 987,954 66,918 –SGD 3,282,883 26,694 –THB 3,309,418 160,655 –TWD – 585,228 –VND 836,361 33,570 –
30 Apr 2020 Barings Europa Fund
Barings Hong Kong China Fund
US$ US$CHF 325,617 –CNY – 10,647,493EUR 741,767 505GBP 208,671 3HKD – 42,608,290KRW – (2)NOK 20,371 –SEK 27,172 –TWD – 3,076,324
Interest rate riskInterest rate risk defined in FRS 102 as “the risk that the fair value or future cash flows of a financial instrument will fluctuate because of changes in market interest rates”.
The Barings Global Bond Fund holds fixed-interest rate debt securities which are exposed to fair value interest rate risk where the value of these securities may fluctuate as a result of a change in market interest rates.
All other financial assets and financial liabilities, with the exception of cash at bank balances and overdrawn cash, held by the Funds are not directly exposed to interest rate risk. The Funds are exposed to interest rate risk on the interest earned on their cash and bank balances, and paid on overdrawn cash. This exposure is not considered to be significant.
Interest rate risks are managed by the Investment Manager, whose management of interest rate risk is monitored through regular performance reviews with senior managers as well as through monthly peer reviews of positioning held with senior managers. Individual managers are authorised to initiate fixed-income trades within pre-set limits.
Barings Global Bond Fund’s sensitivity to changes in interest rates is included in the VAR Analysis on page 65.
8. Financial risk management (continued)
Foreign currency risk (continued)Sensitivity analysis (continued)

57
Barings International Umbrella FundNotes to the financial statements (continued)
For the financial year ended 30 April 2021
Market price riskMarket price risk is defined in FRS 102 as “the risk that the fair value of a financial instrument or its future cash flows will fluctuate because of changes in market prices.”
The Funds’ assets consist principally of equity instruments except for Baring Global Bond Fund, which consists of bonds, futures and FFCTs. The values of these instruments are determined by market forces and accordingly there is a risk that market prices can change in a way that is adverse to the Funds’ performance. The Funds have adopted a number of investment restrictions set out in the Unit Trust’s Prospectus, which limit the exposure of the Funds to adverse changes in the price of any individual financial asset.
In accordance with the Funds’ policies, the Investment Manager monitors the Funds’ positions on a daily basis and reports regularly to the Directors of the Manager, which review the information on the Funds’ overall market exposures provided by the Investment Manager at its periodic meetings.
The Investment Manager uses three techniques to help in the risk management process: monitoring of compliance and quantitative limits, prevention of limit breaches and trade monitoring. These techniques allow the Investment Manager to ensure that the Funds remain in compliance with the restrictions in the Prospectus and the UCITS regulations under which the Funds are governed.
In addition, the Investment Manager manages the exposure of the portfolio to the risk of adverse changes in the general level of market prices, as determined by market forces, through adhering to its formal risk management process, which includes the use of systems and technology to monitor overall market and position risk on a daily basis.
Sensitivity analysis
The below price sensitivity analysis information is a relative estimate of risk and is not intended to be a precise and accurate number. The calculations are based on historical data. Future price movements could vary significantly from those experienced in the past.
A 5% increase or decrease in investment prices at 30 April 2021 and 30 April 2020 would have increased or decreased the value of investments at fair value through profit or loss as follows:
Fund
30 April 2021
30 April 2020
Barings ASEAN Frontiers Fund US$22,708,593 US$14,249,121Barings Asia Growth Fund US$12,019,051 US$4,446,711Barings Australia Growth Fund US$3,762,846 US$2,463,634Barings Europa Fund US$1,568,948 US$1,319,521Barings Hong Kong China Fund US$120,964,975 US$74,367,179
Liquidity riskLiquidity risk is defined in FRS 102 as “the risk that an entity will encounter difficulty in meeting obligations associated with financial liabilities that are settled by delivering of cash or another financial asset”.
The Funds are exposed to daily cash redemptions of units. However, the Manager is entitled, with the approval of the Depositary, to limit the number of units of any class realised on any dealing day to 10% of the total number of units of that class in issue. There are also a number of circumstances where the Manager may, with the approval of the Depositary, temporarily suspend the right of unitholders to require the realisation of units of any class and/or may delay the payment of any monies in respect of any such realisation.
The Funds invest the majority of their assets in securities and other instruments that are traded on an active market and which are considered to be liquid as they can be readily disposed of in the event that cash needs to be raised to meet redemptions or to pay expenses.
8. Financial risk management (continued)

58
Barings International Umbrella FundNotes to the financial statements (continued)
For the financial year ended 30 April 2021
In accordance with the Funds’ policy, the Investment Manager monitors the Funds’ liquidity on a daily basis and reports regularly to the Directors of the Manager, who review the information provided by the Investment Manager on significant exposures at their periodic meetings.
There is a bank overdraft facility in place with The Northern Trust Company (“TNTC”). An “uncommitted” multi-currency loan facility has been made available by TNTC to the Funds. During the financial year ended 30 April 2021, Barings Australia Fund had drawn down on this facility (30 April 2020: Barings ASEAN Frontiers Fund, Barings Europa Fund and Barings Hong Kong China Fund).
The tables below analyse the Funds’ financial derivative instruments that will be settled on a gross basis into relevant maturity groupings based on the remaining period at the Statement of Financial Position date to the contractual maturity date.
As at 30 April 2021Barings ASEAN Frontiers Fund Less than 1
month 1-3 monthsGreater than 3
months TotalLiabilities US$ US$ US$ US$Open forward foreign currency exchange contracts- Inflow 238,296 – – 238,296- Outflow (238,863) – – (238,863)Payable for fund shares redeemed (1,301,802) – – (1,301,802)Other payables and accrued expenses (1,559,526) – – (1,559,526)Net assets attributable to holders of redeemable shares – (460,512,228) – (460,512,228)Total (2,861,895) (460,512,228) – (463,374,123)
Barings Hong Kong China Fund Less than 1 month 1-3 months
Greater than 3 months Total
Liabilities US$ US$ US$ US$Open forward foreign currency exchange contracts- Inflow 700 – – 700- Outflow (710) – – (710)Payable for fund shares redeemed (3,371,486) – – (3,371,486)Other payables and accrued expenses (14,284,098) – – (14,284,098)Net assets attributable to holders of redeemable shares – (2,436,986,287) – (2,436,986,287)Total (17,655,594) (2,436,986,287) – (2,454,641,881)
Barings Global Bond Fund Less than 1 month 1-3 months
Greater than 3 months Total
Liabilities US$ US$ US$ US$Open forward foreign currency exchange contracts- Inflow 4,624,576 15,458,648 – 20,083,224- Outflow (4,646,316) (15,849,647) – (20,495,963)Open Futures contracts – (4,885) – (4,885)Payable for fund shares redeemed (53,622) – – (53,622)Other payables and accrued expenses (77,392) – – (77,392)Net assets attributable to holders of redeemable shares – (78,088,750) – (78,088,750)Total (152,754) (78,484,634) – (78,637,388)
8. Financial risk management (continued)
Liquidity risk (continued)

59
Barings International Umbrella FundNotes to the financial statements (continued)
For the financial year ended 30 April 2021
As at 30 April 2020Barings ASEAN Frontiers Fund Less than 1
month 1-3 monthsGreater than 3
months TotalLiabilities US$ US$ US$ US$Open forward foreign currency exchange contracts- Inflow – 185,865 – 185,865- Outflow – (197,632) – (197,632)Payable for fund shares redeemed (216,380) – – (216,380)Other payables and accrued expenses (2,842,649) – – (2,842,649)Net assets attributable to holders of redeemable shares – (284,185,412) – (284,185,412)Total (3,059,029) (284,197,179) – (287,256,208)
Barings Hong Kong China Fund Less than 1 month 1-3 months
Greater than 3 months Total
Liabilities US$ US$ US$ US$Open forward foreign currency exchange contracts- Inflow – 922 – 922- Outflow – (924) – (924)Payable for fund shares redeemed (1,524,902) – – (1,524,902)Other payables and accrued expenses (2,115,959) – – (2,115,959)Net assets attributable to holders of redeemable shares – (1,488,667,746) – (1,488,667,746)Total (3,640,861) (1,488,667,748) – (1,492,308,609)
Barings Global Bond Fund* Less than 1 month 1-3 months
Greater than 3 months Total
Liabilities US$ US$ US$ US$Open forward foreign currency exchange contracts- Inflow 16,668,192 – – 16,668,192- Outflow (16,992,603) – – (16,992,603)Payable for fund shares redeemed (62,673) – – (62,673)Other payables and accrued expenses (70,489) – – (70,489)Net assets attributable to holders of redeemable shares – (72,377,921) – (72,377,921)Total (457,573) (72,377,921) – (72,835,494)
* Barings International Bond Fund changed its name to Barings Global Bond Fund effective 16 August 2019.
Credit riskCredit risk is defined in FRS 102 as “the risk that one party to a financial instrument will cause a financial loss for the other party by failing to discharge an obligation.”
The Funds’ holdings/securities consist principally of equity instruments, and are not directly exposed to credit risk from these positions with the exception of Barings Global Bond Fund, which consists of bonds and is directly exposed to credit risk.
Credit risk statement
Northern Trust Fiduciary Services (Ireland) Limited (“NTFSIL”) is the appointed Depositary of the Unit Trust, responsible for the safe-keeping of assets. NTFSIL has appointed The Northern Trust Company (“TNTC”) as its global sub-custodian. Both NTFSIL and TNTC are wholly owned subsidiaries of Northern Trust Corporation (“NTC”). At the financial year-end date of 30 April 2021, NTC had a long-term credit rating from Standards and Poor’s (“S&P’s”) of A+.
8. Financial risk management (continued)
Liquidity risk (continued)

60
Barings International Umbrella FundNotes to the financial statements (continued)
For the financial year ended 30 April 2021
TNTC (as global sub-custodian of NTFSIL) does not appoint external sub-custodians within the U.S., the U.K., Ireland, Canada, Belgium, France, Germany, Netherlands and Saudi Arabia. However, in all other markets, TNTC appoints local external sub-custodians.
NTFSIL, in the discharge of its depositary duties, verifies the Unit Trust’s ownership of Other Assets, (as defined under Art 22, 5 of UCITS V Directive 2014/91/EU) by assessing whether the Unit Trust holds the ownership, based on information or documents provided by the Fund or, where available, on external evidence.
TNTC, in the discharge of its delegated depositary duties, holds in custody (i) all financial instruments that may be registered in a financial instruments account opened on the books of TNTC and (ii) all financial instruments that can be physically delivered to TNTC. TNTC ensures all financial instruments (held in a financial instruments account on the books of TNTC) are held in segregated accounts in the name of the Fund in question, clearly identifiable as belonging to that Fund, and distinct and separate from the proprietary assets of TNTC, NTFSIL and NTC.
In addition, TNTC, as banker, holds cash of the Funds on deposit. Such cash is held on the Statement of Financial Position of TNTC. In the event of the insolvency of TNTC, in accordance with standard banking practice, the Unit Trust will rank as an unsecured creditor of TNTC in respect of any cash deposits.
The insolvency of NTFSIL and/or one of its agents or affiliates may cause the Funds’ rights with respect to their assets to be delayed.
The Responsible Party manages risk by monitoring the credit quality and financial position of the Depositary, and such risk is further managed by the Depositary monitoring the credit quality and financial positions of sub-custodian appointments.
Northern Trust continually reviews its sub-custodian network to ensure clients have access to the most efficient, creditworthy and cost-effective provider in each market.
The Investment Manager reviews concentrations of credit risk on a fortnightly basis. All exposures to counterparty credit risk are monitored by Baring Asset Management Limited’s Counterparty Credit Committee and are subject to Baring Asset Management Limited’s Counterparty Credit Policy (“CCP”). Baring Asset Management Limited requires a minimum credit rating of Dunn and Bradstreet (“D&B”) 3, but also actively avoids exposure to entities having an S&P rating of less than AA-, even where the D&B rating is 3 or better. Adherence to the CCP is very rigidly enforced. Any changes to ratings which cause divergence from CCP are acted on immediately without exception. Application for Initial Public Offerings (“IPOs”), for example, is subject to the credit rating of the entity to whose Statement of Financial Position the application will expose the investing fund. Where no satisfactory rating is applied, Baring Asset Management Limited insists that monies are paid into a ring-fenced 'Client Money' account, hence avoiding exposure not permitted by the CCP. The Funds minimize concentrations of credit risk by undertaking transactions with a large number of regulated counterparties on recognised and reputable exchanges.
Credit risk arising from receivables relating to unsettled trades is considered small due to the short settlement period involved. The maximum exposure related to unsettled trades equals the amounts shown on the Statement of Financial Position. There were no past due or impaired assets as of 30 April 2021 with the exception Tungda Innovative Lighting in the Barings Hong Kong China Fund, as disclosed in the portfolio statements (30 April 2020: Tungda Innovative Lighting in the Barings Hong Kong China Fund).
The Funds are exposed to counterparty risk on parties with whom it trades and will bear the risk of settlement default. The Funds minimise concentration of credit risk by undertaking transactions with a large number of customers and counterparties on recognised and reputable exchanges. The Funds may enter into transactions with over the counter (“OTC”) counterparties, including counterparties to OTC derivative instruments, whereby margin or collateral is posted or received by the Fund with the counterparty, outside of the control of the Depositary or the Depositary’s agents.
8. Financial risk management (continued)
Credit risk (continued)

61
Barings International Umbrella FundNotes to the financial statements (continued)
For the financial year ended 30 April 2021
The net assets attributable to holders of redeemable participating units at fair value of investments, cash and receivables relating to securities exposed to credit risk at year-end amounted to:
Fund30/04/2021
US$30/04/2020
US$Barings ASEAN Frontiers Fund 463,373,598 287,245,670Barings Asia Growth Fund 244,228,374 93,688,778Barings Australia Fund 76,749,441 50,581,356Barings Europa Fund 31,594,544 26,483,047Barings Hong Kong China Fund 2,454,638,261 1,492,308,575
As at 30 April 2021 and 30 April 2020, the Baring Global Bond Fund exposure to credit risk was as follows:
Portfolio by rating categoryBarings Global
Rating Bond FundInvestment grade 94.91%Non-investment grade 5.09%
100.00%
For the financial year ended 30 April 2020Portfolio by rating category
Barings Global Rating Bond Fund*Investment grade 95.29%Non-investment grade 4.71%
100.00%
* Barings International Bond Fund changed its name to Barings Global Bond Fund effective 16 August 2019.
ESG riskThe Investment Manager integrates ESG (“Environmental, Social and Governance”) information into the investment process across all asset classes. Through bottom-up, fundamental analysis, the Investment Manager seeks to gain a comprehensive understanding of the factors that influence the sustainability of investments. The Investment Manager considers ESG information alongside other crucial variables that may impact an investment’s risks and returns over time. In particular, the Investment Manager considers ESG criteria in relation to specific industry and sector trends and characteristics to identify the risks of an investment. Once invested, the Investment Manager continues to monitor each investment to ensure their thesis, including that on ESG matters, remains intact and that an investment’s risk and return profile remains attractive relative to other opportunities available in the market.
The following Funds have been brought into scope of Article 8 of the Sustainable Finance Disclosure Regulation ("SFDR") and can be categorised as "Light Green" ESG products:
- Barings ASEAN Frontier Fund;
- Barings Asia Growth Fund;
- Barings Australia Fund;
- Barings Europa Fund;
- Barings Hong Kong China Fund;
Please refer to the Prospectus for further details on ESG integration.
8. Financial risk management (continued)
Credit risk (continued)

62
Barings International Umbrella FundNotes to the financial statements (continued)
For the financial year ended 30 April 2021
9. Fair value hierarchy
FRS 102 requires the Funds to classify fair value measurements using a fair value hierarchy that reflects the significance of the inputs used in making the measurements. The fair value hierarchy has the following levels:
• Level 1: Quoted prices (unadjusted) in active markets for identical assets or liabilities.• Level 2: Inputs other than quoted prices included within level 1 that are observable for the asset or liability, either directly (that
is, as prices) or indirectly (that is, derived from prices).• Level 3: Inputs for the asset or liability that are not based on observable market data (that is, unobservable inputs).
The level in the fair value hierarchy within which the fair value measurement is categorised in its entirety is determined on the basis of the lowest input that is significant to the fair value measurement in its entirety. For this purpose, the significance of an input is assessed against the fair value measurement in its entirety. If a fair value measurement uses observable inputs that require significant adjustment based on unobservable inputs, that measurement is a level 3 measurement. Assessing the significance of a particular input to the fair value measurement in its entirety requires judgement, taking into consideration factors specific to the asset or liability.
The determination of what constitutes ‘observable’ requires significant judgement by the Manager. The Manager considers observable data to be market data that is readily available, regularly distributed or updated, reliable and verifiable, not proprietary, and provided by independent sources that are actively involved in the relevant market.
The following tables analyse, within the fair value hierarchy, the fund’s financial assets and financial liabilities measured at fair value.
As at 30 April 2021Barings ASEAN Frontiers Fund Level 1 Level 2 Level 3 TotalFinancial assets US$ US$ US$ US$Equities 417,023,656 37,148,212 – 454,171,868Warrants 293,775 72,058 – 365,833Open forward foreign currency exchange contracts – 54,628 – 54,628
417,317,431 37,274,898 – 454,592,329
Financial liabilitiesOpen forward foreign currency exchange contracts – (567) – (567)
– (567) – (567)Total 417,317,431 37,274,331 – 454,591,762
Barings Asia Growth Fund Level 1 Level 2 Level 3 TotalFinancial assets US$ US$ US$ US$Equities 239,941,517 – 439,502 240,381,019Total 239,941,517 – 439,502 240,381,019
Barings Australia Fund Level 1 Level 2 Level 3 TotalFinancial assets US$ US$ US$ US$Equities 75,256,911 – – 75,256,911Total 75,256,911 – – 75,256,911
Barings Europa Fund Level 1 Level 2 Level 3 TotalFinancial assets US$ US$ US$ US$Equities 31,378,965 – – 31,378,965Total 31,378,965 – – 31,378,965

63
Barings International Umbrella FundNotes to the financial statements (continued)
For the financial year ended 30 April 2021
Barings Hong Kong China Fund Level 1 Level 2 Level 3 TotalFinancial assets US$ US$ US$ US$Equities 2,419,299,493 – – 2,419,299,493Open forward foreign currency exchange contracts – 324 – 324
2,419,299,493 324 – 2,419,299,817
Financial liabilitiesOpen forward foreign currency exchange contracts – (10) – (10)
– (10) – (10)Total 2,419,299,493 314 – 2,419,299,807
Barings Global Bond Fund Level 1 Level 2 Level 3 TotalFinancial assets US$ US$ US$ US$Fixed interest – 76,786,075 – 76,786,075Open forward foreign currency exchange contracts – 220,458 – 220,458
– 77,006,533 – 77,006,533
Financial liabilitiesOpen Futures contracts (4,885) – – (4,885)Open forward foreign currency exchange contracts – (412,739) – (412,739)
(4,885) (412,739) – (417,624)Total (4,885) 76,593,794 – 76,588,909
As at 30 April 2021, Barings Asia Growth Fund holds position in SK IE Technology which is an IPO and is priced at the lower end of the range until a firm Offer price is published in line with the Investment Manager’s internal pricing policy and so is held at level 3.
30 April 2021Level 3
US$Opening Balance 01/05/2020 –Transfer to Level 3 443,558Movement in unrealised loss (4,056)Closing Balance 439,502
As at 30 April 2020Barings ASEAN Frontiers Fund Level 1 Level 2 Level 3 TotalFinancial assets US$ US$ US$ US$Equities 231,073,502 43,286,908 – 274,360,410Investment Funds – 10,622,001 – 10,622,001Warrants – 31,789 – 31,789Open forward foreign currency exchange contracts – 91,911 – 91,911
231,073,502 54,032,609 – 285,106,111
Financial liabilitiesOpen forward foreign currency exchange contracts – (11,767) – (11,767)
– (11,767) – (11,767)Total 231,073,502 54,020,842 – 285,094,344
Barings Asia Growth Fund Level 1 Level 2 Level 3 TotalFinancial assets US$ US$ US$ US$Equities 85,744,999 3,189,224 – 88,934,223Total 85,744,999 3,189,224 – 88,934,223
9. Fair value hierarchy (continued)

64
Barings International Umbrella FundNotes to the financial statements (continued)
For the financial year ended 30 April 2021
Barings Australia Fund Level 1 Level 2 Level 3 TotalFinancial assets US$ US$ US$ US$Equities 48,582,419 – – 48,582,419Investment Funds – 690,262 – 690,262Total 48,582,419 690,262 – 49,272,681
Barings Europa Fund Level 1 Level 2 Level 3 TotalFinancial assets US$ US$ US$ US$Equities 25,842,784 – – 25,842,784Investment Funds – 547,627 – 547,627Total 25,842,784 547,627 – 26,390,411
Barings Hong Kong China Fund Level 1 Level 2 Level 3 TotalFinancial assets US$ US$ US$ US$Equities 1,470,471,581 – – 1,470,471,581Investment Funds – 16,872,000 – 16,872,000Open forward foreign currency exchange contracts – 65 – 65
1,470,471,581 16,872,065 – 1,487,343,646
Financial liabilitiesOpen forward foreign currency exchange contracts – (2) – (2)
– (2) – (2)Total 1,470,471,581 16,872,063 – 1,487,343,644
Barings Global Bond Fund* Level 1 Level 2 Level 3 TotalFinancial assets US$ US$ US$ US$Fixed interest – 68,481,891 – 68,481,891Open Futures contracts 78,320 – – 78,320Open forward foreign currency exchange contracts – 1,431,389 – 1,431,389
78,320 69,913,280 – 69,991,600
Financial liabilitiesOpen forward foreign currency exchange contracts – (324,411) – (324,411)
– (324,411) – (324,411)Total 78,320 69,588,869 – 69,667,189
* Barings International Bond Fund changed its name to Barings Global Bond Fund effective 16 August 2019.
The equities held at level 1 for the Barings Asia Growth Fund, Barings Australia Fund and Barings Hong Kong China Fund as at 30 April 2020 include some equities with fair value adjustments. The fair value adjustment is determined based off of the movement of index futures from market close to the valuation point of the Fund. There has been no transfers during the financial year ending 30 April 2021 or financial year ended 30 April 2020 from level 1 to level 2 or from level 2 to level 1. The financial assets classified as level 3 at 30 April 2021 for the Barings Asia Growth Fund were US$439,502 (30 April 2020: US$ Nil). Financial assets of US$439,502 transferred from level 1 to level 3 during financial year ended 30 April 2021.
Transfers between levels, when applicable, occur at the end of the financial year.
Cash includes deposits held with banks and other short-term investments in an active market and they are categorised as Level 1. All receivables and payables are categorised as Level 2.
9. Fair value hierarchy (continued)

65
Barings International Umbrella FundNotes to the financial statements (continued)
For the financial year ended 30 April 2021
10. Efficient portfolio management
The Funds may use Financial Derivative Instruments (“FDIs”) for efficient portfolio management. The efficient portfolio management purposes for which the Unit Trust intends to employ FDIs are reduction of risk, reduction of cost and the generation of additional capital or income for the relevant Fund with an appropriate level of risk, taking into account the risk profile of the Fund and the general provisions of the UCITS Regulations. The Unit Trust may use various types of derivatives for these purposes, including, without limitation, forwards, futures, options, swaps (including but not limited to total return swaps, credit default swaps, and IRSs) and contracts for differences for these purposes.
Risk Monitoring of Global Exposure
The method used to determine the global exposure for Barings Global Bond Fund is Value at Risk (“VaR”). VaR is calculated daily using Risk Metrics (one of the leading suppliers of risk management software).
Barings ASEAN Frontiers Fund, Barings Asia Growth Fund, Barings Australia Fund, Barings Europa Fund and Barings Hong Kong China Fund used the commitment approach to calculate their global exposure as described in detail in the risk management process of the Investment Manager.
The Commitment Approach has been calculated, in the case of FFCT’s, by converting the FFCT position into an equivalent position based on the market value of the underlying asset. As the Financial Derivative Instruments (“FDI”) are used for hedging purposes, the exposure of the FDI has been calculated and then netted against the instrument being hedged. The Global Exposure calculation is performed on a daily basis.
In no circumstances will the global exposure of a Fund exceed 100% of its Net Asset Value.
For relative VaR: the Fund’s VaR is shown as a percentage of the VaR of the performance comparator or reference portfolio to ensure that the relative figure is within an internal limit. This limit is set lower than a multiple of two (or 200%) of the performance comparison or reference portfolio VaR.
For absolute VaR: the Fund’s VaR is shown as a percentage of the Funds’ Net Asset Value and is monitored against an internal limit. This limit is set lower than 20%.
Fund NameFund Relative VaR over the past financial year Performance comparator
or reference portfolio
30 April
202130 April
2020Lowest Highest Mean
Barings Global Bond Fund* 98.81% 147.96% 94.26% 193.60% 125.52% FTSE WGBI
Fund Name Absolute VaR over the past financial year 30 April 2021 30 April 2020 Lowest Highest MeanBarings Global Bond Fund* 2.70% 10.39% 2.69% 15.03% 9.03%FTSE WGB 2.73% 7.02% 2.73% 7.94% 7.06%
* Barings International Bond Fund changed its name to Barings Global Bond Fund effective 16 August 2019.
Some limitations of VaR analysis are:
• the methodology is based on historical data and cannot take account of the fact that future market price movements, correlations between markets and levels of market liquidity in conditions of market stress may bear no relation to historical patterns; and
• the VaR is a point-in-time calculation, and does not necessarily reflect the risk position of the Funds at any time other than the date and time at which it is calculated.

66
Barings International Umbrella FundNotes to the financial statements (continued)
For the financial year ended 30 April 2021
11. NAV per redeemable participating units
30 April 2021 30 April 2020 30 April 2019Net assets attributable to holders of redeemable participating unitsBarings ASEAN Frontiers Fund US$460,512,228 US$284,185,412 US$397,157,265
NAV per redeemable unitsBarings ASEAN Frontiers Fund - Class A USD Inc US$269.30 US$172.83 US$214.73Barings ASEAN Frontiers Fund - Class A AUD Hedged Acc AU$297.73 AU$190.43 AU$242.09Barings ASEAN Frontiers Fund - Class A CHF Hedged Acc* CHF102.14 – –Barings ASEAN Frontiers Fund - Class A EUR Inc €222.93 €158.92 €191.54Barings ASEAN Frontiers Fund - Class A GBP Inc £193.71 £138.26 £165.16Barings ASEAN Frontiers Fund - Class A EUR Acc €116.12 €81.67 –Barings ASEAN Frontiers Fund - Class A RMB Hedged Acc ¥2,021.12 ¥1,258.37 ¥1,556.30Barings ASEAN Frontiers Fund - Class A USD Acc US$285.18 US$180.64 US$222.64Barings ASEAN Frontiers Fund - Class I CHF Hedged Acc** CHF102.18 – –Barings ASEAN Frontiers Fund - Class I EUR Acc €248.23 €173.44 €205.94Barings ASEAN Frontiers Fund - Class I GBP Acc £216.86 £151.71 £178.53Barings ASEAN Frontiers Fund - Class I USD Acc US$309.93 US$194.94 US$238.61
* The Barings ASEAN Frontiers Fund Class A CHF Hedged Acc was launched on 8 April 2021.** The Barings ASEAN Frontiers Fund Class I CHF Hedged Acc was launched on 8 April 2021.
30 April 2021 30 April 2020 30 April 2019Net assets attributable to holders of redeemable participating unitsBarings Asia Growth Fund US$240,744,345 US$93,523,454 US$96,427,714
NAV per redeemable unitsBarings Asia Growth Fund - Class A USD Inc US$160.90 US$92.86 US$94.87Barings Asia Growth Fund - Class A EUR Inc €133.16 €85.36 €84.61Barings Asia Growth Fund - Class A GBP Inc £115.65 £74.22 £72.91Barings Asia Growth Fund - Class I GBP Acc £120.62 £76.65 £74.61Barings Asia Growth Fund - Class I USD Acc US$167.78 US$95.87 US$97.06Barings Asia Growth Fund - Class I EUR Acc €138.88 €88.16 €86.57
Net assets attributable to holders of redeemable participating unitsBarings Australia Fund US$75,622,920 US$49,892,887 US$68,173,737
NAV per redeemable unitsBarings Australia Fund - Class A USD Inc US$144.43 US$95.08 US$117.68Barings Australia Fund - Class A AUD Inc AU$186.14 AU$145.26 AU$166.85Barings Australia Fund - Class A EUR Inc €119.50 €87.39 €104.94Barings Australia Fund - Class A GBP Inc £103.81 £76.01 £90.45Barings Australia Fund - Class I GBP Acc £127.59 £90.33 £104.51Barings Australia Fund - Class I USD Acc US$177.47 US$113.00 US$135.95

67
Barings International Umbrella FundNotes to the financial statements (continued)
For the financial year ended 30 April 2021
30 April 2021 30 April 2020 30 April 2019Net assets attributable to holders of redeemable participating unitsBarings Europa Fund US$31,520,704 US$26,389,514 US$39,337,424
NAV per redeemable unitsBarings Europa Fund - Class A USD Inc US$62.75 US$45.44 US$55.69Barings Europa Fund - Class A EUR Inc €51.94 €41.77 €49.67Barings Europa Fund - Class C EUR Inc €50.37 €40.49 €48.15Barings Europa Fund - Class C USD Inc US$61.00 US$44.13 US$54.11
Net assets attributable to holders of redeemable participating unitsBarings Hong Kong China Fund US$2,436,986,287 US$1,488,667,746 US$1,631,811,336
NAV per redeemable unitsBarings Hong Kong China Fund - Class A USD Inc US$1,977.89 US$1,244.25 US$1,192.64Barings Hong Kong China Fund - Class A EUR Inc €1,637.15 €1,144.03 €1,063.76Barings Hong Kong China Fund - Class A GBP Inc £1,421.50 £994.28 £916.46Barings Hong Kong China Fund - Class A HKD Inc HK$15,357.26 HK$9,644.02 HK$9,355.55Barings Hong Kong China Fund - Class A RMB Hedged Acc ¥14,292.41 ¥8,838.50 ¥8,474.29Barings Hong Kong China Fund - Class A USD Acc US$2,044.12 US$1,283.90 US$1,226.55Barings Hong Kong China Fund - Class C EUR Inc €1,510.79 €1,064.64 €996.58Barings Hong Kong China Fund - Class C USD Inc US$1,813.60 US$1,150.54 US$1,110.24Barings Hong Kong China Fund - Class I GBP Acc £1,524.31 £1,057.27 £964.39Barings Hong Kong China Fund - Class I USD Acc US$2,119.45 US$1,321.92 US$1,254.02
Net assets attributable to holders of redeemable participating unitsBarings Global Bond Fund* US$78,088,750 US$72,377,921 US$71,045,776
NAV per redeemable unitsBarings Global Bond Fund* - Class A USD Inc US$27.85 US$26.72 US$25.16Barings Global Bond Fund* - Class A EUR Inc €23.05 €24.57 €22.44Barings Global Bond Fund* - Class A GBP Inc £20.05 £21.39 £19.37Barings Global Bond Fund* - Class I GBP Inc £20.10 £21.45 £19.43Barings Global Bond Fund* - Class I USD Acc US$30.39 US$28.70 US$26.65
* Barings International Bond Fund changed its name to Barings Global Bond Fund effective 16 August 2019.
11. NAV per redeemable participating units (continued)

68
Barings International Umbrella FundNotes to the financial statements (continued)
For the financial year ended 30 April 2021
12. Exchange rates
The exchange rates used in the financial statements to convert to US dollars are as follows:
As at 30 April 2021
As at 30 April 2020
Australian dollar 1.2889 1.5277Canadian dollar 1.2288 1.3871Chinese renminbi 6.4652 7.0593Chinese yuan 6.4715 7.0521Czech Republic koruna 21.4121 –Euro 0.8277 0.9194Hong Kong dollar 7.7649 7.7509Hungarian forint 297.8812 324.3185Indian rupee 74.0725 75.0950Indonesian rupiah 14,445.0000 14,875.0000Israeli shekel 3.2428 –Japanese yen 108.8650 106.5950Malaysian ringgit 4.0964 4.3000Mexican peso 20.0985 23.7150New Zealand dollar 1.3843 1.6325Norwegian krone 8.2346 10.2860Philippines peso 48.1500 50.4100Polish zloty 3.7808 4.1706Pound sterling 0.7188 0.7994Singapore dollar 1.3281 1.4095South African rand 14.4188 18.0925South Korean won 1,112.3500 1,218.4500Swedish krona 8.4188 9.8104Swiss franc 0.9095 0.9705Taiwan dollar 27.9330 29.7365Thai baht 31.1375 32.3550Vietnamese new dong 23,055.0000 23,429.0000
13. Soft commission arrangements
The Investment Manager will pay for research from their own books, as commission paid on trades will be “execution only”, which is the agreed cost for that broker to settle the trade (30 April 2020: same).
14. Contingent liabilities
There are no contingent liabilities at financial year-end 30 April 2021 and financial year-end 30 April 2020.
15. Taxation
Under current Irish law and practice, the Unit Trust qualifies as an investment undertaking as defined in Section 739B of the Taxes Consolidation Act, 1997, as amended (the “TCA”). On that basis, it is not chargeable to Irish tax on its income or gains.
However, Irish tax may arise if a "chargeable event" occurs. A chargeable event includes any distribution payments to unitholders or any encashment, redemption, cancellation, transfer or deemed disposal of shares for Irish tax purposes arising as a result of holding shares in the Unit Trust for a period of eight years or more, or the appropriation or cancellation of shares of a unitholder by the Unit Trust for the purposes of meeting the amount of tax payable on a gain arising on a transfer.

69
Barings International Umbrella FundNotes to the financial statements (continued)
For the financial year ended 30 April 2021
No Irish tax will arise on the Unit Trust in respect of chargeable events due to:
(a) a unitholder who is neither Irish resident nor ordinarily resident in Ireland for tax purposes at the time of the chargeable event, provided that a relevant declaration is in place (in accordance with Schedule 2b of the TCA) and the Unit Trust is not in possession of any information which would reasonably suggest that the information contained therein is no longer materially correct; or
(b) a unitholder who is an exempt Irish investor (as defined in Section 739D TCA).
Dividends, interest and capital gains (if any) received on investments made by the Unit Trust may be subject to withholding taxes imposed by the country from which the investment income/gains are received and such taxes may not be recoverable by the Unit Trust or its unitholders.
The Finance Act 2010 provides that the Revenue Commissioners may grant approval for Unit Trust Investment Undertakings marketed outside of Ireland to make payments to non-resident investors without deduction of Irish tax where no relevant declaration is in place, subject to meeting “equivalent measures”. A Unit Trust Investment Undertakings wishing to receive approval must apply in writing to the Revenue Commissioners, confirming compliance with the relevant conditions.
16. Bank facilities
There is a bank overdraft facility in place with the Northern Trust Company (“TNTC”). An “uncommitted” multi-currency loan facility has been made available by TNTC to the Funds. During the financial year ended 30 April 2021, Barings Australia Fund had drawn down on this facility (30 April 2020: Barings ASEAN Frontiers Fund, Barings Europa Fund and Barings Hong Kong China Fund).
17. Material changes to the Prospectus
The Prospectus of the Unit Trust was updated on 31 August 2020 and 5 March 2021.
The following material changes were made to the Prospectus on 31 August 2020:
• Removal of Timothy Schulze from the board of the Manager following his resignation.
Benchmarks• New disclosures were introduced around benchmarks and their use within the context of each Fund.
Investments restrictions• The investment policy of the Barings Global Bond Fund was updated to provide that the Fund may invest in contingent convertible bond(s), up to a limit of 10% of the Fund’s NAV.
Fund operating mechanisms• The Redemption Deferral Policy was updated to provide for being able to limit redemptions on any dealing day to 10% of the NAV rather than 10% of the shares in issue, as per the current approach. A fourth supplemental Trust Deed has been put in place to facilitate this change in respect of the Unit Trust.
• The procedures regarding the Termination of a Fund were updated to provide for proceeds to be paid to charity at the expiration of 3 years from the date of a fund’s termination.
There are other immaterial changes to the Prospectus that are not listed above.
The following material changes were made to the Prospectus on 5 March 2021:
• Removal of Peter Clark and James Cleary from the board of the Manager following their resignations.
• Updated disclosures on the United Kingdom’s exit from the European Union.
• Updated distribution policy of the Barings Global Bond Fund to allow for distributions to also be paid out of capital.
15. Taxation (continued)

70
Barings International Umbrella FundNotes to the financial statements (continued)
For the financial year ended 30 April 2021
EU Sustainable Finance Disclosure Regulation (Regulation (EU) 2019/2088) (“SFDR”)
• Inclusion of additional disclosures to bring the Funds into compliance with Level 1 of the Sustainable Finance Disclosure Regulation ("SFDR").
• The following Fund has been categorised under Article 6 of the regulation (non-ESG financial products):
- Barings Global Bond Fund;
• The following Funds have been brought into scope of Article 8 of the regulation and can be categorised as “Light Green” ESG products:
- Barings Hong Kong China Fund;
- Barings ASEAN Frontier Fund;
- Barings Asia Growth Fund;
- Barings Australia Fund;
- Barings Europa Fund;
The Prospectus includes clarifications to the investment policy and strategy of the Funds.
There are other immaterial changes to the Prospectus that are not listed above.
18. Significant events
The Prospectus of the Unit Trust was updated on 31 August 2020 and 5 March 2021. The material changes to the Prospectus are outlined in note 17.
Mr. Timothy Schulze resigned as Director of the Manager with effect from 10 August 2020.
Mr. Peter Clark resigned as Director of the Manager with effect from 21 October 2020.
Mr. James Cleary resigned as a Director of the Manager with effect from 31 December 2020.
Barings Japan Limited was appointed as an additional Sub-Investment Manager of the Barings Global Bond Fund (the “Fund”) with effect from 5 November 2020 and will be involved in the discretionary investment management of the Fund’s assets together with Baring Asset Management Limited and Barings LLC, which will continue to be the Investment Manager and a Sub-Investment Manager of the Fund respectively.
The Barings ASEAN Frontiers Fund Class A CHF Hedged Acc unit class was launched on 8 April 2021.
The Barings ASEAN Frontiers Fund Class I CHF Hedged Acc unit class was launched on 8 April 2021.
COVID-19The spread of COVID-19 around the world in 2020 has caused significant volatility in international markets. There is still significant uncertainty around the breadth and duration of business disruptions related to COVID-19, as well as its impact on international economies and, as such, the Unit Trust is actively monitoring the extent of the impact to its operations, financial accounting and reporting.
17. Material changes to the Prospectus (continued)

71
Barings International Umbrella FundNotes to the financial statements (continued)
For the financial year ended 30 April 2021
BrexitThe United Kingdom (the “UK”) held a referendum on 23 June 2016 on whether to leave or remain in the European Union (the “EU”). The outcome of the referendum was in favour of leaving the EU. The UK officially withdrew from the EU on 31 January 2020, but continued to follow all of the EU rules and its trading relationship during a transitional period that ended on 31 December 2020. On 01 January 2021, the Trade and Cooperation Agreement between the UK and the EU came into force, and the UK left the EU single market and the EU customs union.
There remain a number of uncertainties in connection with the future of the UK and its relationship with the EU, including any agreements it reaches in relation to its future relationship with the EU and Barings continues to plan for a number of possible scenarios. Barings is committed to ensuring continuity of service for its investors and protecting its business against potential regulatory or other market access barriers related to Brexit.
In this regard, Baring International Fund Managers (Ireland) Limited (“BIFMI”), will continue as the Manager of the Unit Trust and the Funds will continue to be registered for distribution into relevant jurisdictions in the EU and elsewhere. Portfolio management in respect of European investments will continue to be delegated to Baring Asset Management Limited, a UK entity and portfolio management of US investments will continue to be conducted by Barings LLC, a US entity. The custodians and administrators of the Funds are also EU entities. In addition, BIFMI has enhanced its presence in Dublin and recruited locally at all levels to staff its new office, reflecting the increased significance of BIFMI’s role within the Barings business. Whilst the medium to long-term consequences of the decision to leave the EU remain uncertain in any scenario, there could be short-term volatility which could have a negative impact on general economic conditions, business and consumer confidence in both the UK and EU, which may in turn have negative political, economic and market impacts more widely. The longer-term consequences may be affected by the terms of any future arrangements the UK has with the EU. Among other things, the UK’s decision to leave the EU could lead to changes in the law and tax treatment of funds, instability in the equity, debt and foreign exchange markets, including volatility in the value of sterling or the euro.
There have been no other significant events to the financial year-end which, in the opinion of the Directors of the Manager, that may have had an impact on the financial statements for the financial year ended 30 April 2021.
19. Subsequent events
There have been no events subsequent to the financial year-end which, in the opinion of the Directors of the Manager, may have had a material impact on these financial statements for the financial year ended 30 April 2021.
20. Approval of financial statements
The financial statements were approved by the Board of Directors of the Manager on 20 August 2021.
18. Significant events (continued)

72
Barings International Umbrella Fund Barings ASEAN Frontiers Fund
Schedule of InvestmentsAs at 30 April 2021
Financial assets at fair value through profit or loss
Nominal SecurityFair value
US$% of
Net Assets
Investment Funds: 0.00% (30 April 2020: 3.74%)
Ireland: 0.00% (30 April 2020: 3.74%)
Equities: 98.62% (30 April 2020: 96.54%)
China: 1.79% (30 April 2020: 0.63%)2,674,000 Flat Glass 8,264,938 1.79
Indonesia: 17.21% (30 April 2020: 22.91%)38,180,200 Astra International 14,537,286 3.1610,804,800 Bank Central Asia 23,954,567 5.20
4,059,800 Bank Negara Indonesia Persero 1,601,998 0.3512,060,100 Bank Rakyat Indonesia 3,381,337 0.7327,339,200 Bank Tabungan Pensiunan Nasional Syariah 6,188,936 1.34
7,381,400 Indocement Tunggal Prakarsa 6,566,354 1.4341,464,300 Merdeka Copper Gold 7,520,697 1.6328,511,500 Surya Citra Media 3,108,731 0.6824,186,100 Telekomunikasi Indonesia Persero 5,357,945 1.1622,033,700 Vale Indonesia 7,031,870 1.53
79,249,721 17.21
Malaysia: 10.33% (30 April 2020: 9.67%)11,317,650 Frontken Corp 8,675,281 1.883,389,400 Hartalega 8,505,769 1.856,826,350 Pentamaster 9,715,267 2.119,228,600 Press Metal Aluminium 11,714,852 2.542,286,700 ViTrox 8,965,043 1.95
47,576,212 10.33
Philippines: 4.18% (30 April 2020: 6.95%)12,252,800 AllHome 2,020,503 0.44
3,563,120 International Container Terminal Services 9,612,654 2.098,317,950 Metropolitan Bank & Trust 7,601,034 1.65
19,234,191 4.18
Singapore: 31.65% (30 April 2020: 25.50%)1,608,000 AEM 4,964,271 1.082,363,500 Aztech Global 2,544,938 0.554,447,500 Credit Bureau Asia 4,353,564 0.941,506,200 DBS 33,922,249 7.371,605,100 iFast 8,109,801 1.765,502,116 Mapletree Logistics Trust Reits 8,244,577 1.792,947,500 NanoFilm Technologies International 11,097,097 2.41
173,045 Sea ADR 44,443,147 9.651,223,500 United Overseas Bank 24,496,717 5.32
236,100 Venture 3,582,256 0.78145,758,617 31.65
Thailand: 30.46% (30 April 2020: 25.13%)1,233,200 Airports of Thailand 2,455,509 0.53
18,868,500 Asian Sea 9,877,368 2.1419,199,400 Bangkok Dusit Medical Services 13,380,232 2.91
1,058,900 Carabao Group 3,825,813 0.83

73
Barings International Umbrella Fund Barings ASEAN Frontiers Fund
Schedule of Investments (continued)As at 30 April 2021
Financial assets at fair value through profit or loss (continued)
Nominal SecurityFair value
US$ % of
Net Assets
Equities: 98.62% (30 April 2020: 96.54%) (continued)
Thailand: 30.46% (30 April 2020: 25.13%) (continued) 5,369,100 CP ALL 10,776,997 2.34
39,762 Fabrinet 3,656,116 0.793,457,300 Hana Microelectronics 6,162,349 1.34
10,743,300 Ichitan 4,657,874 1.016,155,200 JMT Network Services PCL 8,895,512 1.934,566,700 KCE Electronics 8,543,084 1.865,602,700 Minor International 5,398,025 1.173,808,900 Osotspa 4,373,125 0.959,874,100 PTT Global Chemical 21,484,393 4.678,361,900 RS 6,713,689 1.465,422,400 Sri Trang Agro-Industry 8,228,291 1.792,835,005 Srisawad PCL 7,579,740 1.653,269,600 Thai Oil 6,221,559 1.35
11,268,300 United Paper 8,033,922 1.74140,263,598 30.46
Vietnam: 3.00% (30 April 2020: 5.75%)589,440 Saigon Beer Alcohol Beverage 4,272,194 0.93773,100 Vietnam Dairy Products 3,135,322 0.68
2,245,000 Vietnam Engine & Agricultural Machinery 3,972,934 0.86698,261 Viettel Post Joint Stock 2,444,141 0.53
13,824,591 3.00
Total Equities (Cost: US$346,139,691) 454,171,868 98.62
Warrants: 0.08% (30 April 2020: 0.01%)
Malaysia: 0.00% (30 April 2020: 0.00%)3,772,550 Frontken Corp – 0.00
Thailand: 0.08% (30 April 2020: 0.00%)795,427 JMT Network Services PCL 0.00% 293,775 0.06
1,672,380 RS – 0.00110,528 Srisawad PCL 0.00% 72,058 0.02
365,833 0.08
Total Warrants (Cost: US$Nil) 365,833 0.08
Open forward foreign currency exchange contracts: 0.01% (30 April 2020: 0.03%)
Currency bought
Currency sold Counterparty
Maturity date
Unrealised gain US$
% of Net Assets
AUD 4,161,655 USD 3,175,135 State Street 17/05/2021 53,884 0.01USD 131,714 AUD 169,536 State Street 17/05/2021 171 0.00CNH 73,616 USD 11,211 State Street 17/05/2021 165 0.00AUD 51,090 USD 39,489 State Street 17/05/2021 152 0.00AUD 4,829 USD 3,684 State Street 17/05/2021 62 0.00USD 20,018 AUD 25,722 State Street 17/05/2021 60 0.00AUD 1,679 USD 1,278 State Street 17/05/2021 25 0.00CHF 924 USD 996 State Street 17/05/2021 21 0.00CHF 924 USD 996 State Street 17/05/2021 21 0.00AUD 1,300 USD 992 State Street 17/05/2021 17 0.00

74
Barings International Umbrella Fund Barings ASEAN Frontiers Fund
Schedule of Investments (continued)As at 30 April 2021
Financial assets at fair value through profit or loss (continued)
Open forward foreign currency exchange contracts: 0.01% (30 April 2020: 0.03%) (continued)
Currency bought
Currency sold Counterparty
Maturity date
Unrealised gain US$
% of Net Assets
AUD 1,167 USD 890 State Street 17/05/2021 15 0.00AUD 44,555 USD 34,558 State Street 17/05/2021 12 0.00AUD 1,400 USD 1,076 State Street 17/05/2021 10 0.00USD 1,388 AUD 1,782 State Street 17/05/2021 5 0.00CNH 2,471 USD 379 State Street 17/05/2021 3 0.00AUD 1,300 USD 1,006 State Street 17/05/2021 3 0.00AUD 1,500 USD 1,161 State Street 17/05/2021 2 0.00CNH 109 USD 17 State Street 17/05/2021 0 0.00
Total unrealised gain on open forward foreign currency exchange contracts 54,628 0.01
Total financial assets at fair value through profit or loss 454,592,329 98.71
Financial liabilities at fair value through profit or loss
Open forward foreign currency exchange contracts: 0.00% (30 April 2020: 0.00%)
Currency bought
Currency sold Counterparty
Maturity date
Unrealised loss US$
% of Net Assets
USD 13,368 AUD 17,522 State Street 17/05/2021 (227) 0.00USD 105,853 AUD 136,707 State Street 17/05/2021 (217) 0.00USD 5,873 AUD 7,692 State Street 17/05/2021 (96) 0.00AUD 5,481 USD 4,268 State Street 17/05/2021 (15) 0.00AUD 137,880 USD 106,988 State Street 17/05/2021 (7) 0.00AUD 1,729 USD 1,345 State Street 17/05/2021 (4) 0.00USD 627 AUD 809 State Street 17/05/2021 (1) 0.00
Total unrealised loss on open forward foreign currency exchange contracts (567) 0.00
Total financial liabilities at fair value through profit or loss (567) 0.00
Total investments at fair value through profit or loss 454,591,762 98.71Cash and cash equivalents 6,755,879 1.47Other net liabilities (835,413) (0.18)Net assets attributable to holders of redeemable participating units 460,512,228 100.00
Analysis of Total Assets % of total assets*Deposits with credit institutions 0.00Transferable securities admitted to an official stock exchange listing or traded on a recognised market 98.09OTC financial derivative instruments 0.01Other assets 1.90
Total 100.00
* Calculation based on the total assets of the Fund (excluding liabilities). This summary is a UCITS requirement.

75
Barings International Umbrella Fund Barings Asia Growth Fund
Schedule of InvestmentsAs at 30 April 2021
Financial assets at fair value through profit or loss
Nominal SecurityFair value
US$% of
Net Assets
Equities: 99.85% (30 April 2020: 95.09%)
China: 39.51% (30 April 2020: 41.47%)102,615 21Vianet ADR 2,841,409 1.18324,748 Alibaba 9,410,137 3.91
11,734 Baidu ADR 2,491,011 1.04515,121 Centre Testing International 2,607,018 1.08
7,108,000 China Construction Bank 5,629,755 2.34129,723 China International Travel Service 6,260,068 2.60196,200 Hangzhou Tigermed Consulting 3,855,853 1.60119,850 JD Health International 1,867,628 0.7886,100 Kuaishou Technology 2,916,257 1.2112,520 Kweichow Moutai 3,886,203 1.6173,400 Li Auto ADR 1,434,970 0.60
829,000 Li Ning 6,768,785 2.81136,100 Meituan Dianping 5,223,256 2.17573,728 NARI Technology 2,837,958 1.18808,948 Sany Heavy Industry 3,863,841 1.61319,080 Shenzhen Inovance Technology 4,414,701 1.83966,000 SITC International 3,688,661 1.53206,800 Tencent 16,592,259 6.89
26,407 Tuya ADR 533,421 0.221,502,000 Xinyi Solar 2,514,665 1.04
234,000 Yidu Tech 1,271,731 0.53107,000 Yihai International 1,043,150 0.43
2,248,000 Zijin Mining 3,167,237 1.3295,119,974 39.51
Hong Kong: 7.17% (30 April 2020: 7.17%)482,200 AIA 6,141,726 2.55
76,900 Hong Kong Exchanges & Clearing 4,654,694 1.93153,000 Orient Overseas 2,478,786 1.03840,800 Sands China 3,995,636 1.66
17,270,842 7.17
India: 10.50% (30 April 2020: 9.80%)62,505 Dixon Technologies 3,545,628 1.47
134,903 HDFC Bank 2,572,122 1.0722,656 IndiaMart InterMesh 2,431,194 1.0167,771 Infosys 1,239,133 0.52
119,444 PI Industries 4,050,107 1.68180,049 Reliance Industries 4,848,057 2.01
92,362 Reliance Industries Limited 1,339,247 0.56102,536 SBI Life Insurance 1,285,567 0.53239,180 Tata Steel 3,338,784 1.39
30,927 Titan 622,799 0.2625,272,638 10.50
Indonesia: 0.00% (30 April 2020: 2.30%)
Malaysia: 0.97% (30 April 2020: 1.55%)1,636,900 Pentamaster 2,329,637 0.97

76
Barings International Umbrella Fund Barings Asia Growth FundSchedule of Investments (continued)
As at 30 April 2021
Financial assets at fair value through profit or loss (continued)
Nominal SecurityFair value
US$ % of
Net Assets
Equities: 99.85% (30 April 2020: 95.09%) (continued)
Philippines: 0.00% (30 April 2020: 1.43%)
Singapore: 4.86% (30 April 2020: 2.27%)976,300 NanoFilm Technologies International 3,675,690 1.53
31,196 Sea ADR 8,012,069 3.3311,687,759 4.86
South Korea: 19.82% (30 April 2020: 12.69%)27,880 Kakao 2,844,770 1.1859,561 Kia 4,122,980 1.71
5,490 LG Chem 4,599,883 1.9121,811 LG Electronics 3,088,266 1.2819,334 NAVER 6,248,549 2.6010,066 POSCO 3,293,949 1.37
196,511 Samsung Electronics 14,398,028 5.985,646 SK Bioscience 771,513 0.32
47,862 SK Hynix 5,507,561 2.294,656 SK IE Technology 439,502 0.18
25,962 Studio Dragon 2,410,999 1.0047,726,000 19.82
Taiwan: 14.12% (30 April 2020: 12.43%)569,718 Chailease 4,119,967 1.71199,000 Giant Manufacturing 2,536,212 1.05605,000 Hon Hai Precision Industry 2,512,440 1.04
81,000 MediaTek 3,436,258 1.43159,000 Pegavision 2,595,639 1.08875,000 Taiwan Semiconductor Manufacturing 18,794,974 7.81
33,995,490 14.12
Thailand: 2.67% (30 April 2020: 3.41%)5,736,300 Asian Sea 3,002,865 1.251,571,600 PTT Global Chemical 3,419,539 1.42
6,422,404 2.67
Vietnam: 0.23% (30 April 2020: 0.57%)76,750 Saigon Beer Alcohol Beverage 556,275 0.23
Total Equities (Cost: US$165,893,171) 240,381,019 99.85
Total financial assets at fair value through profit or loss 240,381,019 99.85
Total investments at fair value through profit or loss 240,381,019 99.85Cash and cash equivalents 1,628,533 0.68Other net liabilities (1,265,207) (0.53)Net assets attributable to holders of redeemable participating units 240,744,345 100.00

77
Barings International Umbrella Fund Barings Asia Growth FundSchedule of Investments (continued)
As at 30 April 2021
Analysis of Total Assets % of total assets*Transferable securities admitted to an official stock exchange listing or traded on a recognised market 98.42Other assets 1.58
Total 100.00
* Calculation based on the total assets of the Fund (excluding liabilities). This summary is a UCITS requirement.

78
Barings International Umbrella Fund Barings Australia Fund
Schedule of InvestmentsAs at 30 April 2021
Financial assets at fair value through profit or loss
Nominal SecurityFair value
US$% of
Net Assets
Investment Funds: 0.00% (30 April 2020: 1.39%)
Equities: 99.52% (30 April 2020: 97.37%)
Communication Services: 2.96% (30 April 2020: 0.72%)84,243 Carsales.com 1,300,009 1.72
708,359 oOh!media 939,782 1.242,239,791 2.96
Consumer Discretionary: 7.38% (30 April 2020: 3.62%)86,134 Aristocrat Leisure 2,483,962 3.29
271,788 Bapcor 1,627,891 2.1512,870 Domino's Pizza Enterprises 1,064,921 1.41
195,488 Marley Spoon 401,924 0.535,578,698 7.38
Consumer Staples: 9.87% (30 April 2020: 13.41%)192,197 Coles 2,433,574 3.22
47,874 Wesfarmers 2,009,810 2.6699,027 Woolworths 3,019,423 3.99
7,462,807 9.87
Energy: 3.19% (30 April 2020: 3.99%)135,882 Woodside Petroleum 2,409,994 3.19
Financials: 32.02% (30 April 2020: 29.92%)211,716 Australia & New Zealand Banking Group 4,720,828 6.2454,706 Commonwealth Bank of Australia 3,779,183 5.0046,839 Credit 1,054,951 1.40
484,193 Insurance Australia 1,840,740 2.4335,540 Macquarie 4,425,305 5.85
259,701 National Australia Bank 5,371,697 7.1010,575 REA 1,299,201 1.72
475,034 Stockland 1,724,838 2.2824,216,743 32.02
Health Care: 14.33% (30 April 2020: 16.22%)67,172 Ansell 2,202,397 2.91
9,615 Cochlear 1,659,805 2.2020,807 CSL 4,377,366 5.7951,137 ResMed 1,038,285 1.3756,077 Sonic Healthcare 1,561,044 2.06
10,838,897 14.33
Industrials: 3.25% (30 April 2020: 6.52%)150,574 ALS 1,231,313 1.63552,946 Cleanaway Waste Management 1,222,659 1.62
2,453,972 3.25
Materials: 21.27% (30 April 2020: 18.28%)140,967 Amcor 1,656,944 2.19192,346 BHP Billiton 7,118,350 9.41
54,226 James Hardie Industries 1,804,856 2.3977,812 Newcrest Mining 1,601,024 2.12

79
Barings International Umbrella Fund Barings Australia Fund
Schedule of Investments (continued)As at 30 April 2021
Financial assets at fair value through profit or loss (continued)
Nominal SecurityFair value
US$ % of
Net Assets
Equities: 99.52% (30 April 2020: 97.37%) (continued)
Materials: 21.27% (30 April 2020: 18.28%) (continued) 63,845 OZ Minerals 1,185,848 1.5728,900 Rio Tinto 2,716,433 3.59
16,083,455 21.27
Real Estate: 5.25% (30 April 2020: 4.69%)270,770 Goodman 3,972,554 5.25
Total Equities (Cost: US$53,647,601) 75,256,911 99.52
Total financial assets at fair value through profit or loss 75,256,911 99.52
Total investments at fair value through profit or loss 75,256,911 99.52Cash and cash equivalents 636,573 0.84Other net liabilities (270,564) (0.36)Net assets attributable to holders of redeemable participating units 75,622,920 100.00
Analysis of Total Assets % of total assets*Transferable securities admitted to an official stock exchange listing or traded on a recognised market 97.25Other assets 2.75
Total 100.00
* Calculation based on the total assets of the Fund (excluding liabilities). This summary is a UCITS requirement.
.

80
Barings International Umbrella Fund Barings Europa Fund
Schedule of InvestmentsAs at 30 April 2021
Financial assets at fair value through profit or loss
Nominal SecurityFair value
US$% of
Net Assets
Investment Funds: 0.00% (30 April 2020: 2.07%)
Equities: 99.55% (30 April 2020: 97.93%)
Communication Services: 4.65% (30 April 2020: 3.10%)60,058 Auto Trader 475,749 1.5123,109 Telenet 989,495 3.14
1,465,244 4.65
Consumer Discretionary: 1.80% (30 April 2020: 9.72%)5,235 Prosus 568,358 1.80
Consumer Staples: 11.71% (30 April 2020: 7.82%)13,932 Associated British Foods 443,659 1.4119,314 Nestle 2,319,931 7.3615,761 Unilever 927,390 2.94
3,690,980 11.71
Energy: 7.32% (30 April 2020: 10.72%)57,776 Galp Energia 670,966 2.1352,074 Royal Dutch Shell 938,167 2.9815,669 Total 698,375 2.21
2,307,508 7.32
Financials: 15.10% (30 April 2020: 20.69%)3,678 Allianz 963,185 3.06
42,945 AXA 1,217,508 3.8611,118 Julius Baer 708,315 2.2526,029 KBC Ancora 1,145,974 3.6433,971 Prudential 723,321 2.29
4,758,303 15.10
Health Care: 13.99% (30 April 2020: 15.66%)12,151 AstraZeneca 1,292,009 4.10
174,497 ConvaTec Group PLC 525,090 1.6613,085 Koninklijke Philips 733,631 2.33
5,651 Roche 1,858,812 5.904,409,542 13.99
Industrials: 10.82% (30 April 2020: 7.22%)26,560 Assa Abloy 761,269 2.4121,281 Prysmian 667,476 2.12
1,764 Schindler 509,154 1.615,181 Schneider Electric 834,040 2.65
17,565 Siemens Gamesa 639,844 2.033,411,783 10.82
Information Technology: 19.47% (30 April 2020: 14.22%)417 Adyen 1,035,097 3.28
2,754 ASML 1,796,454 5.708,202 Capgemini 1,502,800 4.77
10,275 Halma 366,942 1.1616,178 Infineon Technologies 657,536 2.09

81
Barings International Umbrella Fund Barings Europa Fund
Schedule of Investments (continued)As at 30 April 2021
Financial assets at fair value through profit or loss (continued)
Nominal SecurityFair value
US$ % of
Net Assets
Equities: 99.55% (30 April 2020: 97.93%) (continued)
Information Technology: 19.47% (30 April 2020: 14.22%) (continued) 5,226 Temenos 777,191 2.47
6,136,020 19.47
Materials: 12.71% (30 April 2020: 8.78%)15,068 Anglo American 643,237 2.0412,930 Boliden 506,526 1.6123,452 CRH 1,124,888 3.57
2,670 Koninklijke DSM 480,013 1.522,631 Linde 755,277 2.399,674 Smurfit Kappa Group 496,979 1.58
4,006,920 12.71
Utilities: 1.98% (30 April 2020: 0.00%)7,998 RWE 303,230 0.96
56,881 Snam 321,077 1.02624,307 1.98
Total Equities (Cost: US$22,879,496) 31,378,965 99.55
Total financial assets at fair value through profit or loss 31,378,965 99.55
Total investments at fair value through profit or loss 31,378,965 99.55Cash and cash equivalents 146,522 0.46Other net liabilities (4,783) (0.01)Net assets attributable to holders of redeemable participating units 31,520,704 100.00
Analysis of Total Assets % of total assets*Transferable securities admitted to an official stock exchange listing or traded on a recognised market 99.32Other assets 0.68
Total 100.00
* Calculation based on the total assets of the Fund (excluding liabilities). This summary is a UCITS requirement.

82
Barings International Umbrella Fund Barings Hong Kong China Fund
Schedule of InvestmentsAs at 30 April 2021
Financial assets at fair value through profit or loss
Nominal SecurityFair value
US$% of
Net Assets
Investment Funds: 0.00% (30 April 2020: 1.13%)
Equities: 99.27% (30 April 2020: 98.77%)
Basic Materials: 0.98% (30 April 2020: 0.00%)286,459 Daqo New Energy ADR 23,942,243 0.98
Communication Services: 9.47% (30 April 2020: 15.54%)1,446,503 iClick Interactive Asia Group ADR 18,558,633 0.762,645,400 Tencent 212,249,329 8.71
230,807,962 9.47
Communications: 5.32% (30 April 2020: 0.00%)254,919 Baidu ADR 54,116,755 2.22
1,302,800 Kuaishou Technology 44,126,596 1.81882,575 Yatsen ADR 9,028,742 0.37
2,272,646 Zhihu ADR 22,499,195 0.92129,771,288 5.32
Consumer Discretionary: 26.86% (30 April 2020: 22.75%)666,357 Alibaba ADR 156,047,482 6.40849,300 Alibaba 24,609,941 1.01
1,200,500 BYD Company 24,783,499 1.02974,420 China International Travel Service 47,022,775 1.93
7,179,000 Geely Automobile 18,629,703 0.77598,050 JD.com 23,013,624 0.94
14,546,500 JS Global Lifestyle 43,930,717 1.805,311,500 Li Ning 43,368,397 1.788,501,200 Man Wah 17,889,542 0.732,625,900 Meituan Dianping 100,776,989 4.14
514,394 New Oriental Education & Technology ADR 8,029,690 0.33313,431 Pinduoduo ADR 43,093,628 1.77
1,985,000 Shenzhou International 43,663,174 1.79323,211 TAL Education ADR 18,953,093 0.78500,009 XPeng ADR 15,260,275 0.63403,100 Yum China 25,416,816 1.04
654,489,345 26.86
Consumer Staples: 3.57% (30 April 2020: 5.23%)3,957,436 China Resources Beer 31,981,186 1.31
176,999 Kweichow Moutai 54,940,419 2.2686,921,605 3.57
Consumer, Cyclical: 1.29% (30 April 2020: 0.00%)1,470,450 JD Health International 22,914,087 0.941,119,500 Zhongsheng 8,484,720 0.35
31,398,807 1.29
Consumer, Non-cyclical: 0.93% (30 April 2020: 0.00%)761,200 Joinn Laboratories China 13,724,412 0.56576,090 New Oriental Education & Technology 8,947,559 0.37
22,671,971 0.93

83
Barings International Umbrella Fund Barings Hong Kong China Fund
Schedule of Investments (continued)As at 30 April 2021
Financial assets at fair value through profit or loss (continued)
Nominal SecurityFair value
US$ % of
Net Assets
Equities: 99.27% (30 April 2020: 98.77%) (continued)
Energy: 0.00% (30 April 2020: 1.60%)
Financials: 11.69% (30 April 2020: 10.27%)4,235,000 AIA 53,940,707 2.21
764,600 BOC Aviation 6,902,704 0.285,385,200 China International Capital 13,537,815 0.558,841,500 China Merchants Bank 71,336,855 2.932,047,584 China Resources Mixc Lifestyle Services 12,090,604 0.507,594,751 Ping An Bank 27,359,265 1.124,312,500 Ping An Insurance Group of China 47,180,161 1.94
80,800,000 Postal Savings Bank of China 52,653,689 2.16285,001,800 11.69
Health Care: 6.16% (30 April 2020: 9.53%)541,900 Hangzhou Tigermed Consulting 10,649,779 0.44
6,398,000 Hansoh Pharmaceutical 27,644,179 1.132,582,544 Hualan Biological Engineering 16,809,115 0.692,396,000 Innovent Biologics 26,043,311 1.071,939,759 Jiangsu Hengrui Medicine 25,232,784 1.031,614,095 Remegen 21,369,243 0.881,595,000 Wuxi Biologics Cayman 22,492,707 0.92
150,241,118 6.16
Industrial: 9.65% (30 April 2020: 5.88%)3,267,064 Centre Testing International 16,534,548 0.685,039,000 Hainan Meilan International Airport 21,415,352 0.886,342,000 Hon Hai Precision Industry 26,337,021 1.08
18,565,000 Impro Precision Industries 4,973,077 0.203,001,574 NARI Technology 14,847,349 0.61
976,500 Orient Overseas 15,820,486 0.656,937,739 Sany Heavy Industry 33,137,264 1.367,728,000 SITC International 29,509,289 1.212,090,500 Techtronic Industries 38,122,411 1.56
46,050,000 Tungda Innovative Lighting 0 0.003,738,885 Zhejiang Sanhua Intelligent Controls 12,387,480 0.51
694,100 ZTO Express Cayman 22,079,332 0.91235,163,609 9.65
Information Technology: 11.01% (30 April 2020: 15.78%)410,738 GDS Holdings Ltd ADR 34,415,737 1.41494,000 Globalwafers 15,279,991 0.63868,638 Glodon 9,817,464 0.40
3,481,665 Lens Technology 14,071,740 0.581,023,188 LONGi Green Energy Technology 15,731,249 0.644,090,986 Luxshare Precision Industry 23,387,368 0.96
572,000 MediaTek 24,265,922 1.001,384,000 Novatek Microelectronics 30,917,410 1.271,777,300 Sunny Optical Technology 43,351,851 1.782,655,000 Taiwan Semiconductor Manufacturing 57,029,320 2.34
268,268,052 11.01
Materials: 1.85% (30 April 2020: 1.71%)4,937,589 ENN Ecological 13,380,441 0.55

84
Barings International Umbrella Fund Barings Hong Kong China Fund
Schedule of Investments (continued)As at 30 April 2021
Financial assets at fair value through profit or loss (continued)
Nominal SecurityFair value
US$ % of
Net Assets
Equities: 99.27% (30 April 2020: 98.77%) (continued)
Materials: 1.85% (30 April 2020: 1.71%) (continued) 22,452,000 Zijin Mining 31,632,920 1.30
45,013,361 1.85
Real Estate: 4.31% (30 April 2020: 7.17%)6,639,000 Financial Street Property 4,275,034 0.176,447,000 Longfor Properties 40,227,068 1.656,130,000 Sunac China 23,881,015 0.98
11,775,614 Sunac Services 36,699,983 1.51105,083,100 4.31
Technology: 2.33% (30 April 2020: 0.00%)432,182 Cloopen Group ADR 4,563,842 0.19462,716 Tuya ADR 9,346,863 0.38
11,352,000 United Micro Electronics 23,042,939 0.953,654,000 Yidu Tech 19,858,568 0.81
56,812,212 2.33
Telecommunication Services: 1.44% (30 April 2020: 2.38%)305,653 Bilibili ADR 35,033,947 1.44
Utilities: 2.41% (30 April 2020: 0.93%)1,328,000 ENN Energy 22,643,992 0.93
33,550,000 Kunlun Energy 36,035,081 1.4858,679,073 2.41
Total Equities (Cost: US$1,532,152,830) 2,419,299,493 99.27
Open forward foreign currency exchange contracts: 0.00% (30 April 2020: 0.00%)
Currency bought
Currency sold Counterparty
Maturity date
Unrealised gain US$
% of Net Assets
CNH 142,481 USD 21,699 State Street 17/05/2021 320 0.00CNH 6,129 USD 943 State Street 17/05/2021 4 0.00CNH 171 USD 26 State Street 17/05/2021 0 0.00
Total unrealised gain on open forward foreign currency exchange contracts 324 0.00
Total financial assets at fair value through profit or loss 2,419,299,817 99.27
Financial liabilities at fair value through profit or loss
Open forward foreign currency exchange contracts: 0.00% (30 April 2020: 0.00%)
Currency bought
Currency sold Counterparty
Maturity date
Unrealised loss US$
% of Net Assets
USD 700 CNH 4,592 State Street 17/05/2021 (10) 0.00Total unrealised loss on open forward foreign currency exchange contracts (10) 0.00
Total financial liabilities at fair value through profit or loss (10) 0.00

85
Barings International Umbrella Fund Barings Hong Kong China Fund
Schedule of Investments (continued)As at 30 April 2021
Fair value US$
% of Net Assets
Total investments at fair value through profit or loss 2,419,299,807 99.27Cash and cash equivalents 15,503,976 0.64Other net assets 2,182,504 0.09Net assets attributable to holders of redeemable participating units 2,436,986,287 100.00
Analysis of Total Assets % of total assets*Transferable securities admitted to an official stock exchange listing or traded on a recognised market 98.56Other assets 1.44
Total 100.00
* Calculation based on the total assets of the Fund (excluding liabilities). This summary is a UCITS requirement.

86
Barings International Umbrella Fund Barings Global Bond Fund
Schedule of InvestmentsAs at 30 April 2021
Financial assets at fair value through profit or loss
Nominal SecurityFair value
US$% of
Net Assets
Fixed interest: 98.33% (30 April 2020: 94.62%)
Australian dollar: 9.23% (30 April 2020: 1.32%)200,000 New South Wales Treasury 1.00% 08/02/2024 158,138 0.20
6,200,000 New South Wales Treasury 3.00% 20/03/2028 5,358,425 6.86300,000 New South Wales Treasury 3.00% 20/02/2030 258,561 0.33200,000 New South Wales Treasury FRN 20/11/2025 247,257 0.32200,000 Queensland Treasury 5.75% 22/07/2024 182,043 0.23200,000 Treasury Corporation of Victoria 0.50% 20/11/2025 153,533 0.20900,000 Treasury Corporation of Victoria 1.50% 20/11/2030 680,222 0.87200,000 Western Australian Treasury 3.00% 21/10/2026 172,212 0.22
7,210,391 9.23
Canadian dollar: 1.69% (30 April 2020: 9.12%)450,000 Canada (Govt of) 5.70% 18/06/2029 471,400 0.60750,000 Canada (Govt of) 6.25% 01/06/2032 847,642 1.09
1,319,042 1.69
Czech koruna: 2.41% (30 April 2020: 0.00%)43,000,000 Czech (Republic of) 0.95% 15/05/2030 1,881,167 2.41
Euro: 34.60% (30 April 2020: 20.53%)1,240,000 France (Republic of) 1.50% 25/05/2031 1,712,561 2.19
860,000 France (Republic of) 3.25% 25/05/2045 1,621,945 2.081,430,000 Hellenic Republic Government Bond 3.38% 15/02/2025 1,954,880 2.50
950,000 Hellenic Republic Government Bond 3.50% 30/01/2023 1,224,700 1.57850,000 Ireland (Republic of) 1.10% 15/05/2029 1,123,957 1.44670,000 Ireland (Republic of) 1.70% 15/05/2037 962,952 1.23
1,430,000 Italy (Republic of) 0.60% 15/06/2023 1,760,515 2.253,700,000 Italy (Republic of) 1.50% 01/06/2025 4,740,264 6.071,430,000 Italy (Republic of) 2.20% 01/06/2027 1,920,917 2.461,240,000 Italy (Republic of) 2.70% 01/03/2047 1,778,161 2.28
570,000 Italy (Republic of) 5.00% 01/09/2040 1,086,469 1.39950,000 Italy (Republic of) 5.25% 01/11/2029 1,582,448 2.03500,000 Italy Buoni Poliennali Del Tesoro FRN 15/05/2030 663,542 0.85380,000 Romania (Republic of) 4.63% 03/04/2049 570,136 0.73370,000 Spain (Kingdom of) 1.45% 30/04/2029 490,845 0.63
1,810,000 Spain (Kingdom of) 1.95% 30/04/2026 2,423,527 3.10860,000 Spain (Kingdom of) 2.90% 31/10/2046 1,401,299 1.80
27,019,118 34.60
Hungarian forint: 0.00% (30 April 2020: 1.76%)
Israeli new shekel: 0.77% (30 April 2020: 0.95%)1,500,000 Israel (Govt of) 3.75% 31/03/2047 599,931 0.77
Japanese yen: 10.42% (30 April 2020: 2.88%)186,000,000 Japan (Govt of) 0.30% 20/12/2039 1,669,196 2.14192,000,000 Japan (Govt of) 0.30% 20/06/2046 1,655,226 2.12178,000,000 Japan (Govt of) 1.20% 20/03/2035 1,848,064 2.36225,300,000 Japan (Govt of) 1.80% 20/09/2043 2,630,581 3.37
39,700,000 Japan (Govt of) 0.40% 20/03/2056 333,996 0.438,137,063 10.42

87
Barings International Umbrella Fund Barings Global Bond FundSchedule of Investments (continued)
As at 30 April 2021
Financial assets at fair value through profit or loss (continued)
Nominal SecurityFair value
US$ % of
Net Assets
Fixed interest: 98.33% (30 April 2020: 94.62%) (continued)
Mexican pesos: 3.73% (30 April 2020: 3.60%)19,100,000 Mexican Bonos 7.75% 29/05/2031 1,011,447 1.2938,200,000 Mexican Bonos 7.75% 13/11/2042 1,904,618 2.44
2,916,065 3.73
New Zealand dollar: 3.81% (30 April 2020: 4.19%)480,000 New Zealand (Govt of) 1.75% 15/05/2041 306,376 0.39
2,300,000 New Zealand (Govt of) 2.75% 15/04/2025 1,775,783 2.281,050,000 New Zealand (Govt of) 4.50% 15/04/2027 889,664 1.14
2,971,823 3.81
Polish zloty: 5.68% (30 April 2020: 5.09%)15,300,000 Poland (Republic of) 2.75% 25/04/2028 4,431,610 5.68
Pound sterling: 3.53% (30 April 2020: 5.13%)2,000,000 UK (Govt of) 1.25% 22/10/2041 2,756,923 3.53
2,756,923 3.53
Singapore dollar: 1.01% (30 April 2020: 0.00%)950,000 Singapore (Govt of) 2.88% 01/07/2029 792,948 1.01
Swedish krona: 0.75% (30 April 2020: 0.00%)4,800,000 Kommuninvest I Sverige 1.00% 12/11/2026 588,544 0.75
Swiss franc: 0.00% (30 April 2020: 0.82%)
US dollar: 20.70% (30 April 2020: 39.23%)1,100,000 Indonesia Government International Bond 5.88% 15/01/2024 1,247,808 1.60
800,000 Kreditanstalt Für Wiederaufbau 2.13% 17/01/2023 826,389 1.06570,000 Petrobras Global Finance 8.75% 23/05/2026 727,462 0.93760,000 Petroleos Mexicanos 6.88% 04/08/2026 824,410 1.06850,000 Poland (Republic of) 3.25% 06/04/2026 940,530 1.20
1,400,000 Portugal (Republic of) 5.13% 15/10/2024 1,600,572 2.05960,000 US Treasury Bond 2.00% 15/02/2025 1,012,556 1.30
2,465,000 US Treasury Note 0.25% 30/06/2025 2,423,548 3.101,400,000 US Treasury Note 0.63% 15/08/2030 1,281,437 1.644,200,000 US Treasury Note 1.13% 28/02/2027 4,214,684 5.402,000,000 US Treasury STRIP 0.00% 15/02/2048 1,062,054 1.36
16,161,450 20.70
Total Fixed interest (Cost: US$75,029,279) 76,786,075 98.33
Open Futures contracts: 0.00% (30 April 2020: 0.11%)*
Open forward foreign currency exchange contracts: 0.28% (30 April 2020: 1.97%)
Currency bought
Currency sold Counterparty
Maturity date
Unrealised gain US$
% of Net Assets
USD 6,719,372 PLN 24,997,000 State Street 19/05/2021 107,336 0.14JPY 619,282,000 USD 5,644,347 State Street 15/07/2021 47,839 0.06CAD 660,000 USD 521,827 State Street 16/06/2021 15,325 0.02GBP 1,055,000 USD 1,456,144 Northern Trust 16/06/2021 11,742 0.02

88
Barings International Umbrella Fund Barings Global Bond FundSchedule of Investments (continued)
As at 30 April 2021
Financial assets at fair value through profit or loss (continued)
Open forward foreign currency exchange contracts: 0.28% (30 April 2020: 1.97%) (continued)
Currency bought
Currency sold Counterparty
Maturity date
Unrealised gain US$
% of Net Assets
CAD 560,000 USD 444,311 Standard Chartered 16/06/2021 11,455 0.02ILS 840,000 USD 254,670 Northern Trust 19/05/2021 4,405 0.01AUD 300,000 USD 228,713 State Street 15/07/2021 4,117 0.01NZD 180,000 USD 126,606 State Street 15/07/2021 3,385 0.00CAD 135,000 USD 107,557 State Street 16/06/2021 2,315 0.00USD 835,916 SEK 7,017,000 State Street 19/05/2021 2,308 0.00SGD 900,000 USD 675,486 State Street 19/05/2021 2,161 0.00GBP 115,000 USD 157,931 State Street 16/06/2021 2,076 0.00CZK 1,900,000 USD 86,990 Northern Trust 16/06/2021 1,748 0.00PLN 600,000 USD 157,033 State Street 19/05/2021 1,675 0.00GBP 200,000 USD 277,396 State Street 16/06/2021 876 0.00SEK 3,600,000 USD 427,171 State Street 19/05/2021 503 0.00SGD 60,000 USD 44,743 State Street 19/05/2021 433 0.00MXN 1,600,000 USD 78,821 Standard Chartered 16/06/2021 390 0.00SEK 206,000 USD 24,104 Standard Chartered 19/05/2021 369 0.00
Total unrealised gain on open forward foreign currency exchange contracts 220,458 0.28
Total financial assets at fair value through profit or loss 77,006,533 98.61
Financial liabilities at fair value through profit or loss
Open Futures contracts: 0.00% (30 April 2020: 0.00%)*
Nominal Amount
US$ DescriptionUnrealised
loss US$% of
Net Assets25 US 2 YR Note CBT Futures Jun 2021 (4,885) –
Unrealised loss on Open Futures contracts (4,885) –
Open forward foreign currency exchange contracts: (0.53%) (30 April 2020: (0.45%))
Currency bought
Currency sold Counterparty
Maturity date
Unrealised loss US$
% of Net Assets
USD 5,737,701 AUD 7,519,000 State Street 15/07/2021 (97,810) (0.13)USD 1,433,344 MXN 30,790,000 State Street 16/06/2021 (90,966) (0.12)USD 2,980,844 NZD 4,238,000 State Street 15/07/2021 (79,730) (0.10)USD 1,895,229 CZK 41,835,000 Northern Trust 16/06/2021 (58,652) (0.07)USD 794,203 CAD 1,010,000 State Street 16/06/2021 (27,804) (0.04)USD 1,303,211 EUR 1,093,800 State Street 15/07/2021 (20,344) (0.03)USD 239,763 MXN 5,000,000 State Street 16/06/2021 (7,770) (0.01)USD 1,228,204 SGD 1,640,000 Standard Chartered 19/05/2021 (6,619) (0.01)PLN 10,000,000 USD 2,651,399 State Street 19/05/2021 (6,267) (0.01)USD 582,893 ILS 1,907,000 Northern Trust 19/05/2021 (5,268) (0.01)USD 510,825 JPY 56,000,000 State Street 15/07/2021 (3,904) 0.00USD 168,347 PLN 650,000 Standard Chartered 19/05/2021 (3,586) 0.00USD 245,714 MXN 5,000,000 Standard Chartered 16/06/2021 (1,819) 0.00

89
Barings International Umbrella Fund Barings Global Bond FundSchedule of Investments (continued)
As at 30 April 2021
Financial liabilities at fair value through profit or loss (continued)
Open forward foreign currency exchange contracts: (0.53%) (30 April 2020: (0.45%)) (continued)
Currency bought
Currency sold Counterparty
Maturity date
Unrealised loss US$
% of Net Assets
USD 165,505 GBP 120,000 State Street 16/06/2021 (1,459) 0.00USD 152,309 GBP 110,000 State Street 16/06/2021 (741) 0.00
Total unrealised loss on open forward foreign currency exchange contracts (412,739) (0.53)
Total financial liabilities at fair value through profit or loss (417,624) (0.53)
Fair value US$
% of Net Assets
Total investments at fair value through profit or loss 76,588,909 98.08Cash and cash equivalents 1,133,956 1.45Other net assets 365,885 0.47Net assets attributable to holders of redeemable participating units 78,088,750 100.00
Analysis of Total Assets % of total assets**Transferable securities admitted to an official stock exchange listing or traded on a recognised market 97.65OTC financial derivative instruments 0.28Other assets 2.07
Total 100.00
* The counterparty for Open Future contracts is UBS.** Calculation based on the total assets of the Fund (excluding liabilities). This summary is a UCITS requirement.

90
Barings International Umbrella FundGeneral information (Unaudited)
For the financial year ended 30 April 2021
Market timingRepeatedly purchasing and selling units in the Funds in response to short-term market fluctuations – known as ‘market timing’ – can disrupt Baring Asset Management Limited’s (the “Investment Manager”) investment strategy and increase the Funds’ expenses to the prejudice of all unitholders. The Funds are not intended for market timing or excessive trading. To deter these activities, the Directors of Baring International Fund Managers (Ireland) limited (the “Manager”) may refuse to accept an application for units from persons that they reasonably believe are engaged in market timing or are otherwise excessive or potentially disruptive to the Funds.
The Directors of the Manager reserve the right to redeem units from a unitholder on the basis of the circumstances of the unitholder concerned, or if it has reasonable grounds to believe that the unitholder is engaging in any activity which might result in the Funds or their unitholders as a whole suffering any legal, regulatory, reputational or other material disadvantage which the Funds or their unitholders as a whole might not otherwise have suffered.
UK reporting fund statusUK taxable investors in UK reporting funds are subject to tax on their units of the UK reporting funds’ income attributable to their holdings in the Fund, whether or not distributed, while typically any gains on disposal of their holdings are subject to capital gains tax.
Details of the unit classes which currently have UK reporting fund status are available at the Her Majesty's Revenue and Customs (“HMRC”) Collective Investment Schemes Centre website:
http://www.hmrc.gov.uk/cisc/offshore-funds.htm.
As stated above UK tax payers should note that, for each unit class with reporting fund status, their share of any amounts of income, if any, that has not been distributed will be subject to tax.
Further details will be made available on the Barings website: www.barings.com.

91
Barings International Umbrella FundAppendix 1 – Information for investors in Switzerland (Unaudited)
For the financial year ended 30 April 2021
Baring International Fund Managers (Ireland) Limited (the “Manager”) has appointed BNP Paribas Securities Services, Paris, Succursale de Zurich, Selnaustrasse 16, CH-8002, Zurich, Switzerland, as representative and paying agent for Switzerland. Units are distributed in Switzerland by BNP Paribas Securities Services, Paris at the above address. Investors can obtain, free of charge, the Prospectus, the Key Investor Information Document(s) (“KIID(s)”), the last annual and interim reports, the Trusts Act 1990, as well as a list of the purchases and sales made on behalf of the Funds, in French, from the representative at the above address. Official publications for the Funds are found on the internet at www.fundinfo.com. Unit prices (Net Asset Value with the words "plus commissions") are published daily on the internet at www.fundinfo.com.
All the information appearing in these reports and accounts is solely with respect to those Funds of Barings International Umbrella Fund (the “Unit Trust”) which are licensed for public offer and marketing in or from Switzerland, namely: Barings ASEAN Frontiers Fund, Barings Asia Growth Fund, Barings Australia Fund, Barings Europa Fund, Barings Hong Kong China Fund and Barings Global Bond Fund.
Representative and paying agent for Switzerland
BNP Paribas Securities Services, Paris,Succursale de Zurich Selnaustrasse 16 CH-8002 Zurich Switzerland
Performance
Following a guideline from the Swiss Funds and Asset Management Association (the “SFAMA”) dated 16 May 2008, the Directors of the Manager are supplying performance data in conformity with the said guideline. This data can be found below on pages 94 to 99. Furthermore, the Directors of the Manager are required to provide the below additional information on performance.
The following comparative indices are used as, in the Directors’ opinion, and in the light of the investment policy of the relevant Fund, they are the most appropriate selection for comparison.
Barings ASEAN Frontiers Fund
The MSCI (Morgan Stanley Capital International) South East Asia Index.
Barings Asia Growth Fund
The MSCI (Morgan Stanley Capital International) AC Asia ex Japan Index.
Barings Australia Fund
The MSCI (Morgan Stanley Capital International) Australia 10/40 Index.
Barings Europa Fund
The MSCI (Morgan Stanley Capital International) Europe Index.
Barings Hong Kong China Fund
The MSCI (Morgan Stanley Capital International) China Index.
Barings Global Bond Fund
The FTSE World Government Bond Index (“WGBI”) is a market capitalisation–weighted Index.

92
Barings International Umbrella FundAppendix 1 – Information for investors in Switzerland (Unaudited) (continued)
For the financial year ended 30 April 2021
Performance (continued)
Investors should contact the Swiss representative at the above address should they require additional information, for example on performance including the comparison of the relevant indices where applicable.
Total Expense Ratio Pursuant to a guideline from the SFAMA dated 16 May 2008, the Funds are required to publish a total expense ratio (“TER”) for the financial year ended 30 April 2021.
The TERs for each Fund for the financial year ended 30 April 2021 and 30 April 2020 are as follows:
Name of Fund 30 April 2021 TER in %
30 April 2020 TER in %
Barings ASEAN Frontiers Fund - Class A 1.70 1.70Barings ASEAN Frontiers Fund - Class I 1.00 1.00Barings ASEAN Frontiers Fund - Class A AUD Hedged Acc 1.71 1.71Barings ASEAN Frontiers Fund - Class A CHF Hedged Acc* 0.09 -Barings ASEAN Frontiers Fund - Class I CHF Hedged Acc** 0.06 -Barings ASEAN Frontiers Fund - Class A RMB Hedged Acc 1.71 1.70Barings ASEAN Frontiers Fund - Class A EUR Acc 1.70 0.98Barings Asia Growth Fund - Class A 1.70 1.70Barings Asia Growth Fund - Class I GBP Acc 1.00 1.00Barings Asia Growth Fund - Class I USD Acc 1.00 1.00Barings Asia Growth Fund - Class I EUR Acc 1.00 1.00Barings Australia Fund - Class A 1.70 1.70Barings Australia Fund - Class I 1.00 1.00Barings Europa Fund - Class A 1.70 1.70Barings Europa Fund - Class C 2.70 2.69Barings Hong Kong China Fund - Class A 1.70 1.70Barings Hong Kong China Fund - Class C USD 2.70 2.69Barings Hong Kong China Fund - Class A RMB Hedged Acc 1.71 1.70Barings Hong Kong China Fund - Class A USD Acc 1.70 1.70Barings Hong Kong China Fund - Class I 1.00 1.00Barings Global Bond Fund*** - Class A USD Inc 1.20 1.20Barings Global Bond Fund*** - Class I GBP Inc 0.75 0.75Barings Global Bond Fund*** - Class A EUR Inc 1.20 1.20Barings Global Bond Fund*** - Class I USD Acc 0.75 0.75
* The Barings ASEAN Frontiers Fund Class A CHF Hedged Acc was launched on 8 April 2021.** The Barings ASEAN Frontiers Fund Class I CHF Hedged Acc was launched on 8 April 2021.*** Barings International Bond Fund changed its name to Barings Global Bond Fund effective 16 August 2019.
This information was established by the Manager, Baring International Fund Managers (Ireland) Limited, based on the data contained in the Statement of Comprehensive Income for the above reference year (Fund management fees, administration fees, depositary fees, taxes and duties, and all other commissions and expenses appearing as per the breakdown of the Statement of comprehensive income and not already included in any of the foregoing categories). The TER is calculated using the average daily Net Asset Value for the year.

93
Barings International Umbrella FundAppendix 1 – Information for investors in Switzerland (Unaudited) (continued)
For the financial year ended 30 April 2021
Trailer fees and reimbursementsTrailer fees (Bestandespflegekommissionen) may only be paid to the sales agents/partners indicated below:
• authorised sales agents (distributors) within the meaning of Article 19, Para 1, Collective Investment Funds Act (“CISA”);• sales agents (distributors) exempted from the authorisation requirement within the meaning of Article 13, Para 4, CISA and Article
8 Collective Investment Schemes Ordinance (“CISO”);• sales partners who place Fund units exclusively with institutional investors with professional treasury facilities; and/or• sales partners who place Fund units with their clients exclusively on the basis of a written commission-based asset management
mandate.Reimbursements (Rückvergütungen) may only be paid to the institutional investors detailed below who from a commercial perspective are holding the Fund units for third parties:
• life insurance companies (in respect of Fund units held for the account of insured persons or to cover obligations towards insured persons);
• pension funds and other retirement provision institutions (in respect of Fund units held for the account of beneficiaries);• investment foundations (in respect of Fund units held for the account of in-house funds);• Swiss fund management companies (in respect of Fund units held for the account of the funds managed);• foreign fund management companies and providers (in respect of Fund units held for the account of managed funds and investing
unitholders); and/or• investment companies (in respect of the investment of the company assets).

94
Barings International Umbrella FundAppendix 1 – Information for investors in Switzerland (Unaudited) (continued)
For the financial year ended 30 April 2021
Performance data
Barings ASEAN Frontiers Fund (including distribution payments where applicable)01 May 2020-30 April 2021
%
01 May 2019-30 April 2020
%
01 May 2018-30 April 2019
%
01 May 2017-30 April 2018
%
01 May 2016-30 April 2017
%Barings ASEAN Frontiers Fund - Class A USD Inc (USD terms)
57.87 (18.86) (4.52) 21.00 9.12
MSCI South East Asia Total, Net Return Index (USD terms)
23.62 (22.67) (4.14) 19.32 8.51
Barings ASEAN Frontiers Fund - Class A AUD Hedged Acc (AUD terms)
56.34 (21.34) (5.34) 20.80 9.50
Barings ASEAN Frontiers Fund - Class A CHF Hedged Acc* (CHF terms)
N/A N/A N/A N/A N/A
Barings ASEAN Frontiers Fund - Class A EUR Inc (EUR terms)
42.13 (16.36) 3.01 9.43 13.69
Barings ASEAN Frontiers Fund - Class A GBP Inc (GBP terms)
41.96 (15.62) 0.73 14.11 23.23
Barings ASEAN Frontiers Fund - Class A RMB Hedged Acc (RMB terms)
60.61 (19.14) (3.98) 23.40 12.27
Barings ASEAN Frontiers Fund - Class A USD Acc (USD terms)
57.88 (18.86) (4.51) 21.01 9.12
Barings ASEAN Frontiers Fund - Class I CHF Hedged Acc** (CHF terms)
N/A N/A N/A N/A N/A
Barings ASEAN Frontiers Fund - Class I EUR Acc (EUR terms)
43.12 (15.78) 3.73 10.16 14.24
Barings ASEAN Frontiers Fund - Class I GBP Acc (GBP terms)
42.95 (15.03) 1.44 14.85 23.85
Barings ASEAN Frontiers Fund - Class I USD Acc (USD terms)
58.98 (18.30) (3.84) 21.81 9.74
Performance figures are shown net of fees and charges, on a NAV per unit basis, with gross income reinvested. Source: Morningstar/Barings/MSCI.
For data sourced from Morningstar: © Morningstar. All Rights Reserved. The information contained herein: (1) is proprietary to Morningstar and/or its content providers; (2) may not be copied or distributed; and (3) is not warranted to be accurate, complete or timely. Neither Morningstar nor its content providers are responsible for any damages or losses arising from any use of this information.
The MSCI data is for Barings’ use only and may not be redistributed or used in connection with creating or offering any securities, financial products or indices.
The Fund was launched on 1 August 2008.
* The Barings ASEAN Frontiers Fund Class A CHF Hedged Acc was launched on 8 April 2021.** The Barings ASEAN Frontiers Fund Class I CHF Hedged Acc was launched on 8 April 2021. Past performance is no indication of current or future performance. The performance data does not take account of the commissions and costs incurred on the issue and redemption of units. Please note that changes in the rates of exchange may have an adverse effect on the value, price or income of an investment.

95
Barings International Umbrella FundAppendix 1 – Information for investors in Switzerland (Unaudited) (continued)
For the financial year ended 30 April 2021
Barings Asia Growth Fund (including distribution payments where applicable)01 May 2020-30 April 2021
%
01 May 2019-30 April 2020
%
01 May 2018-30 April 2019
%
01 May 2017-30 April 2018
%
01 May 2016-30 April 2017
%Barings Asia Growth Fund - Class A USD Inc (USD terms)
73.77 (1.91) (8.13) 30.99 17.73
MSCI AC Asia ex Japan Total, Gross Return Index (USD terms)
47.95 (7.20) (3.82) 24.35 21.46
Barings Asia Growth Fund - Class A EUR Inc (EUR terms)
56.43 1.12 (0.88) 18.47 22.62
Barings Asia Growth Fund - Class A GBP Inc (GBP terms)
56.25 2.02 (3.07) 23.51 32.96
Barings Asia Growth Fund - Class I GBP Acc (GBP terms)
57.34 2.73 (2.43) 24.24 33.59
Barings Asia Growth Fund - Class I USD Acc (USD terms)
74.99 (1.22) (7.54) 31.76 18.31
Barings Asia Growth Fund - Class I EUR Acc (EUR terms)
57.53 1.84 (0.30) 19.17 23.28
Performance figures are shown net of fees and charges, on a NAV per unit basis, with gross income reinvested. Source: Morningstar/Barings/MSCI.
For data sourced from Morningstar: © Morningstar. All Rights Reserved. The information contained herein: (1) is proprietary to Morningstar and/or its content providers; (2) may not be copied or distributed; and (3) is not warranted to be accurate, complete or timely. Neither Morningstar nor its content providers are responsible for any damages or losses arising from any use of this information.
The MSCI data is for Barings’ use only and may not be redistributed or used in connection with creating or offering any securities, financial products or indices.
The Fund was launched on 3 February 1987.
Past performance is no indication of current or future performance. The performance data does not take account of the commissions and costs incurred on the issue and redemption of units. Please note that changes in the rates of exchange may have an adverse effect on the value, price or income of an investment.
Performance data (continued)

96
Barings International Umbrella FundAppendix 1 – Information for investors in Switzerland (Unaudited) (continued)
For the financial year ended 30 April 2021
Barings Australia Fund (including distribution payments where applicable)01 May 2020-30 April 2021
%
01 May 2019-30 April 2020
%
01 May 2018-30 April 2019
%
01 May 2017-30 April 2018
%
01 May 2016-30 April 2017
%Barings Australia Fund - Class A USD Inc (USD terms)
55.96 (17.47) 2.81 5.98 5.73
MSCI Australia 10/40 Total, Gross Return Index (USD terms)
53.31 (16.11) 3.44 5.09 17.21
Barings Australia Fund - Class A AUD Inc (AUD terms)
31.51 (11.06) 10.02 4.90 8.05
Barings Australia Fund - Class A EUR Inc (EUR terms)
40.43 (14.93) 10.90 (4.16) 10.18
Barings Australia Fund - Class A GBP Inc (GBP terms)
40.24 (14.15) 8.44 (0.08) 19.41
Barings Australia Fund - Class I GBP Acc (GBP terms)
41.23 (13.56) 9.22 0.58 20.02
Barings Australia Fund - Class I USD Acc (USD terms)
57.05 (16.88) (7.54) 6.67 6.27
Performance figures are shown net of fees and charges, on a NAV per unit basis, with gross income reinvested. Source: Morningstar/Barings/MSCI.
For data sourced from Morningstar: © Morningstar. All Rights Reserved. The information contained herein: (1) is proprietary to Morningstar and/or its content providers; (2) may not be copied or distributed; and (3) is not warranted to be accurate, complete or timely. Neither Morningstar nor its content providers are responsible for any damages or losses arising from any use of this information.
The MSCI data is for Barings’ use only and may not be redistributed or used in connection with creating or offering any securities, financial products or indices.
Past performance is no indication of current or future performance. The performance data does not take account of the commissions and costs incurred on the issue and redemption of units. Please note that changes in the rates of exchange may have an adverse effect on the value, price or income of an investment.
Performance data (continued)
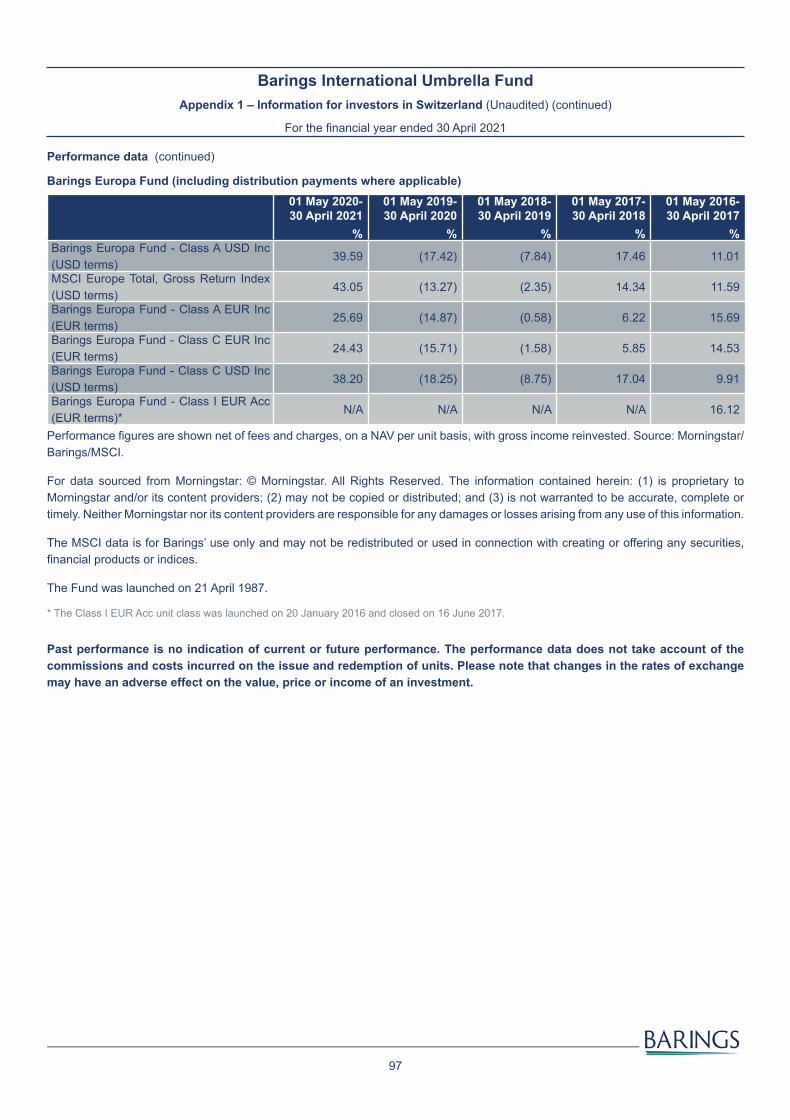
97
Barings International Umbrella FundAppendix 1 – Information for investors in Switzerland (Unaudited) (continued)
For the financial year ended 30 April 2021
Barings Europa Fund (including distribution payments where applicable)01 May 2020-30 April 2021
%
01 May 2019-30 April 2020
%
01 May 2018-30 April 2019
%
01 May 2017-30 April 2018
%
01 May 2016-30 April 2017
%Barings Europa Fund - Class A USD Inc (USD terms)
39.59 (17.42) (7.84) 17.46 11.01
MSCI Europe Total, Gross Return Index (USD terms)
43.05 (13.27) (2.35) 14.34 11.59
Barings Europa Fund - Class A EUR Inc (EUR terms)
25.69 (14.87) (0.58) 6.22 15.69
Barings Europa Fund - Class C EUR Inc (EUR terms)
24.43 (15.71) (1.58) 5.85 14.53
Barings Europa Fund - Class C USD Inc (USD terms)
38.20 (18.25) (8.75) 17.04 9.91
Barings Europa Fund - Class I EUR Acc (EUR terms)*
N/A N/A N/A N/A 16.12
Performance figures are shown net of fees and charges, on a NAV per unit basis, with gross income reinvested. Source: Morningstar/Barings/MSCI.
For data sourced from Morningstar: © Morningstar. All Rights Reserved. The information contained herein: (1) is proprietary to Morningstar and/or its content providers; (2) may not be copied or distributed; and (3) is not warranted to be accurate, complete or timely. Neither Morningstar nor its content providers are responsible for any damages or losses arising from any use of this information.
The MSCI data is for Barings’ use only and may not be redistributed or used in connection with creating or offering any securities, financial products or indices.
The Fund was launched on 21 April 1987.
* The Class I EUR Acc unit class was launched on 20 January 2016 and closed on 16 June 2017.
Past performance is no indication of current or future performance. The performance data does not take account of the commissions and costs incurred on the issue and redemption of units. Please note that changes in the rates of exchange may have an adverse effect on the value, price or income of an investment.
Performance data (continued)

98
Barings International Umbrella FundAppendix 1 – Information for investors in Switzerland (Unaudited) (continued)
For the financial year ended 30 April 2021
Barings Hong Kong China Fund (including distribution payments where applicable)01 May 2020-30 April 2021
%
01 May 2019-30 April 2020
%
01 May 2018-30 April 2019
%
01 May 2017-30 April 2018
%
01 May 2016-30 April 2017
%Barings Hong Kong China Fund - Class A USD Inc (USD terms)
59.21 4.68 (4.21) 26.99 20.14
MSCI China Total, Gross Return Index (USD terms)
39.32 (3.29) (3.75) 35.51 23.38
Barings Hong Kong China Fund - Class A EUR Inc (EUR terms)
43.33 7.91 3.34 14.85 25.18
Barings Hong Kong China Fund - Class A GBP Inc (GBP terms)
43.19 8.86 1.06 19.74 35.68
Barings Hong Kong China Fund - Class A HKD Inc (HKD terms)
59.49 3.42 (4.26) 28.14 20.46
Barings Hong Kong China Fund - Class A RMB Hedged Acc (RMB terms)
61.71 4.30 (3.73) 29.46 22.92
Barings Hong Kong China Fund - Class A USD Acc (USD terms)
59.21 4.68 (4.21) 26.99 20.14
Barings Hong Kong China Fund - Class C EUR Inc (EUR terms)
41.91 6.83 2.30 14.45 23.92
Barings Hong Kong China Fund - Class C USD Inc (USD terms)
57.63 3.63 (5.16) 26.54 18.94
Barings Hong Kong China Fund - Class I GBP Acc (GBP terms)
44.17 9.63 1.76 20.52 36.35
Barings Hong Kong China Fund - Class I USD Acc (USD terms)
60.33 5.41 (3.54) 27.85 20.71
Performance figures are shown net of fees and charges, on a NAV per unit basis, with gross income reinvested. Source: Morningstar/Barings/MSCI.
For data sourced from Morningstar: © Morningstar. All Rights Reserved. The information contained herein: (1) is proprietary to Morningstar and/or its content providers; (2) may not be copied or distributed; and (3) is not warranted to be accurate, complete or timely. Neither Morningstar nor its content providers are responsible for any damages or losses arising from any use of this information.
The MSCI data is for Barings’ use only and may not be redistributed or used in connection with creating or offering any securities, financial products or indices.
The Fund was launched on 3 December 1982.
Past performance is no indication of current or future performance. The performance data does not take account of the commissions and costs incurred on the issue and redemption of units. Please note that changes in the rates of exchange may have an adverse effect on the value, price or income of an investment.
Performance data (continued)

99
Barings International Umbrella FundAppendix 1 – Information for investors in Switzerland (Unaudited) (continued)
For the financial year ended 30 April 2021
Barings Global Bond Fund (including distribution payments where applicable)01 May 2020-30 April 2021
%
01 May 2019-30 April 2020
%
01 May 2018-30 April 2019
%
01 May 2017-30 April 2018
%
01 May 2016-30 April 2017
%Barings Global Bond Fund* - Class A USD Inc (USD terms)
5.40 7.19 (0.45) 3.95 (5.41)
FTSE World Govt Bond Index (USD Terms)
1.78 7.97 (0.18) 5.08 (3.61)
Barings Global Bond Fund* - Class A EUR Inc (EUR terms)
(5.06) 10.47 7.36 (5.98) (1.45)
Barings Global Bond Fund* - Class A GBP Inc (GBP terms)
(5.14) 11.47 5.01 (1.99) 6.88
Barings Global Bond Fund* - Class I GBP Inc (GBP terms)
(4.74) 11.92 5.48 (1.58) 7.08
Barings Global Bond Fund* - Class I USD Acc (USD terms)
5.92 7.65 0.00 4.34 (5.16)
Performance figures are shown net of fees and charges, on a NAV per unit basis, with gross income reinvested. Source: Morningstar/Barings/FTSE.
For data sourced from Morningstar: © Morningstar. All Rights Reserved. The information contained herein: (1) is proprietary to Morningstar and/or its content providers; (2) may not be copied or distributed; and (3) is not warranted to be accurate, complete or timely. Neither Morningstar nor its content providers are responsible for any damages or losses arising from any use of this information.
The MSCI data is for Barings’ use only and may not be redistributed or used in connection with creating or offering any securities, financial products or indices.
The Fund was launched on 7 July 1978.
* Barings International Bond Fund changed its name to Barings Global Bond Fund effective 16 August 2019.
Past performance is no indication of current or future performance. The performance data does not take account of the commissions and costs incurred on the issue and redemption of units. Please note that changes in the rates of exchange may have an adverse effect on the value, price or income of an investment.
Performance data (continued)

100
Barings International Umbrella FundAppendix 2 – Information for Investors in Germany (Unaudited)
For the financial year ended 30 April 2021
The Prospectus, the Key Investor Information Document(s) (“KIID(s)”), a list of portfolio changes, the Unit Trust Act 1990, as well as the annual and the interim reports are available free of charge in hard copy at the offices of the German Paying and Information Agent and the Further German Information Agent.
German Paying and Information Agent
Deutsche Bank AG Global Transaction Banking Issuer Services – Global Securities Services Post IPO Services Taunusanlage 12 60325 Frankfurt am Main Germany
Further German Paying and Information Agent
Baring Asset Management GmbH Ulmenstraße 5460325 Frankfurt am MainGermany
Special risks resulting from tax publication requirements in Germany Foreign investment companies (such as Baring International Fund Managers (Ireland) Limited (the “Manager”)) must provide documentation to the German fiscal authorities upon request, e.g. in order to verify the accuracy of the published tax information. The basis upon which such figures are calculated is open to interpretation and it cannot be guaranteed that the German fiscal authorities will accept the Manager’s calculation methodology in every material respect. In addition, if it transpires that these publications are incorrect, any subsequent correction will, as a general rule, not have retrospective effect and will, as a general rule, only take effect during the current financial year. Consequently, the correction may positively or negatively affect the investors who receive a distribution or an attribution of deemed income distributions in the current year.

101
Barings International Umbrella Fund Barings ASEAN Frontiers Fund
Appendix 3 – Additional information Hong Kong Code (Unaudited)For the financial year ended 30 April 2021
Barings ASEAN Frontiers Fund is registered for sale in Hong Kong.
Highest issue and lowest redemption pricesHighest issue prices during the year*
30 April 2021 30 April 2020 30 April 2019 30 April 2018 30 April 2017Class A USD Inc 275.67 226.11 223.84 242.33 189.31Class A AUD Hedged Acc 304.91 254.71 254.54 274.70 213.84Class A CHF Hedged Acc** 102.86 N/A N/A N/A N/AClass A EUR Inc 226.62 204.94 192.21 195.22 174.06Class A GBP Inc 198.10 181.67 166.03 173.18 150.68Class A EUR Acc 118.04 105.32 N/A N/A N/AClass A RMB Hedged Acc 2,058.63 1,651.77 1,613.41 1,730.41 1,319.11Class A USD Acc 291.92 236.33 232.08 249.99 195.15Class I CHF Hedged Acc*** 102.89 N/A N/A N/A N/AClass I EUR Acc 251.98 223.23 206.66 207.15 183.57Class I GBP Acc 221.46 199.75 179.46 184.75 159.39Class I USD Acc 316.81 254.56 247.01 265.59 205.63
Highest issue prices during the year* (continued)
30 April 2016 30 April 2015 30 April 2014 30 April 2013 30 April 2012Class A USD Inc 190.22 199.83 221.42 213.79 187.71Class A AUD Hedged Acc 211.54 217.74 N/A N/A N/AClass A CHF Hedged Acc** N/A N/A N/A N/A N/AClass A EUR Inc 170.76 183.26 172.14 163.52 132.30Class A GBP Inc 124.74 132.64 146.39 138.87 115.31Class A EUR Acc N/A N/A N/A N/A N/AClass A RMB Hedged Acc 1,265.12 1,294.76 1,409.29 1,353.47 1,099.48Class A USD Acc 195.18 204.24 224.08 215.14 175.03Class I CHF Hedged Acc*** N/A N/A N/A N/A N/AClass I EUR Acc 178.15 189.78 177.00 167.15 133.45Class I GBP Acc 130.77 138.18 150.58 142.03 116.19Class I USD Acc 203.76 212.07 205.76 N/A N/A
Lowest redemption prices during the year*
30 April 2021 30 April 2020 30 April 2019 30 April 2018 30 April 2017Class A USD Inc 165.90 133.46 184.89 187.74 163.95Class A AUD Hedged Acc 185.15 147.73 209.65 212.88 185.07Class A CHF Hedged Acc** 98.18 N/A N/A N/A N/AClass A EUR Inc 151.10 124.68 162.94 163.28 146.39Class A GBP Inc 132.27 115.78 144.31 144.25 112.33Class A EUR Acc 78.67 64.07 N/A N/A N/AClass A RMB Hedged Acc 1,223.33 973.94 1,342.20 1,321.94 1,120.31Class A USD Acc 175.67 139.49 191.70 193.69 169.00Class I CHF Hedged Acc*** 98.19 N/A N/A N/A N/AClass I EUR Acc 167.08 135.96 174.58 172.66 153.69Class I GBP Acc 147.06 127.01 155.40 153.09 118.58Class I USD Acc 189.59 150.43 204.74 204.82 177.76

102
Barings International Umbrella Fund Barings ASEAN Frontiers Fund
Appendix 3 – Additional information Hong Kong Code (Unaudited) (continued)For the financial year ended 30 April 2021
Lowest redemption prices during the year* (continued)
30 April 2016 30 April 2015 30 April 2014 30 April 2013 30 April 2012Class A USD Inc 147.79 179.86 163.85 154.23 134.70Class A AUD Hedged Acc 165.79 196.58 N/A N/A N/AClass A CHF Hedged Acc** N/A N/A N/A N/A N/AClass A EUR Inc 129.80 132.22 122.57 123.90 102.18Class A GBP Inc 94.92 108.53 101.17 100.08 87.60Class A EUR Acc N/A N/A N/A N/A N/AClass A RMB Hedged Acc 986.52 1,166.61 1,048.02 975.48 1,047.17Class A USD Acc 152.11 183.80 165.81 155.19 169.45Class I CHF Hedged Acc*** N/A N/A N/A N/A N/AClass I EUR Acc 135.60 137.95 126.27 126.09 102.98Class I GBP Acc 99.72 113.61 104.50 101.91 88.34Class I USD Acc 159.22 191.08 170.85 N/A N/A
* The above highest issue prices and lowest redemption prices during the year are quoted in their respective share classes’ denomination currency.** The Barings ASEAN Frontiers Fund Class A CHF Hedged Acc was launched on 8 April 2021.*** The Barings ASEAN Frontiers Fund Class I CHF Hedged Acc was launched on 8 April 2021.
Statement of movements in portfolio holdings30 April 2021
% of NAV30 April 2020
% of NAV30 April 2019
% of NAV30 April 2018
% of NAVChina 1.79 0.63 1.30 –Indonesia 17.21 22.91 25.37 23.14Malaysia 10.33 9.67 7.22 11.60Philippines 4.18 6.95 11.42 7.54Singapore 31.65 25.50 25.11 26.03Thailand 30.46 25.13 22.49 26.02Vietnam 3.00 5.75 5.75 4.23Warrants 0.08 0.01 0.01 0.01Investment Funds – 3.74 1.02 0.64Open forward foreign currency exchange contracts 0.01 0.03 – –Total investments 98.71 100.32 99.69 99.21(Cash/(bank overdraft) 1.47 (0.18) 0.12 1.34Other net (liabilities)/assets (0.18) (0.14) 0.19 (0.55)Total net assets 100.00 100.00 100.00 100.00 * Movements in portfolio holdings have been analysed above based on a % of Net Asset Value invested in each geographic location. The movement in each country’s position between years has to be inferred.

103
Barings International Umbrella Fund Barings ASEAN Frontiers Fund
Appendix 3 – Additional information Hong Kong Code (Unaudited) (continued)For the financial year ended 30 April 2021
Portfolio information
Top Ten Holdings % of Net Assets
Sea ADR 9.65
DBS 7.37
United Overseas Bank 5.32
Bank Central Asia 5.20
PTT Global Chemical 4.67
Astra International 3.16
Bangkok Dusit Medical Services 2.91
Press Metal Aluminum 2.54
NanoFilm Technologies International 2.41
CP ALL 2.34

104
Barings International Umbrella Fund Barings Asia Growth Fund
Appendix 3 – Additional information Hong Kong Code (Unaudited)For the financial year ended 30 April 2021
Barings Asia Growth Fund is registered for sale in Hong Kong.
Highest Issue and lowest redemption pricesHighest issue prices during the year*
30 April 2021 30 April 2020 30 April 2019 30 April 2018 30 April 2017Class A USD Inc 179.62 104.65 105.51 113.20 79.03Class A EUR Inc 179.61 94.16 89.20 92.49 72.51Class A GBP Inc 179.61 80.40 78.42 81.24 61.89Class I GBP Acc 187.07 82.87 79.78 82.45 62.54Class I USD Acc 187.04 107.83 107.33 114.90 79.88Class I EUR Acc 187.08 97.05 90.80 93.94 73.33
Highest issue prices during the year* (continued)
30 April 2016 30 April 2015 30 April 2014 30 April 2013 30 April 2012Class A USD Inc 78.07 77.35 65.11 64.40 69.30Class A EUR Inc 71.67 72.45 50.62 49.30 48.34Class A GBP Inc 50.74 52.24 42.97 43.09 43.22Class I GBP Acc 50.80 52.27 N/A N/A N/AClass I USD Acc 78.14 N/A N/A N/A N/AClass I EUR Acc 60.73 N/A N/A N/A N/A
Lowest redemption prices during the year*
30 April 2021 30 April 2020 30 April 2019 30 April 2018 30 April 2017Class A USD Inc 88.88 74.27 78.82 79.03 62.59Class A EUR Inc 88.88 69.24 69.45 71.98 55.81Class A GBP Inc 88.88 64.41 61.57 61.10 42.80Class I GBP Acc 92.06 66.47 62.77 61.76 43.06Class I USD Acc 92.04 76.63 80.37 79.89 62.97Class I EUR Acc 92.06 71.45 70.87 72.81 56.17
Lowest redemption prices during the year* (continued)
30 April 2016 30 April 2015 30 April 2014 30 April 2013 30 April 2012Class A USD Inc 59.46 61.96 54.98 52.74 48.23Class A EUR Inc 51.74 44.48 41.88 41.98 36.16Class A GBP Inc 37.82 36.56 35.59 33.83 31.21Class I GBP Acc 37.91 46.53 N/A N/A N/AClass I USD Acc 59.59 N/A N/A N/A N/AClass I EUR Acc 53.92 N/A N/A N/A N/A
*The above highest issue prices and lowest redemption prices during the year are quoted in their respective share classes’ denomination currency.

105
Barings International Umbrella Fund Barings Asia Growth Fund
Appendix 3 – Additional information Hong Kong Code (Unaudited) (continued)For the financial year ended 30 April 2021
Statement of movements in portfolio holdings30 April 2021
% of NAV30 April 2020
% of NAV30 April 2019
% of NAV30 April 2018
% of NAVChina 39.51 40.76 38.52 29.42Hong Kong 7.17 7.88 9.25 6.07India 10.50 9.80 12.56 11.53Indonesia – 2.30 3.03 4.55Malaysia 0.97 1.55 0.38 1.06Philippines – 1.43 0.99 1.28Singapore 4.86 2.27 2.45 2.98South Korea 19.82 12.69 12.53 13.16Taiwan 14.12 12.43 12.59 16.83Thailand 2.67 3.41 2.84 3.78Vietnam 0.23 0.57 1.25 4.22Investment Funds – – 2.46 1.54Total investments 99.85 95.09 98.85 96.42Cash 0.68 3.81 1.33 5.09Other net (liabilities)/assets (0.53) 1.10 (0.18) (1.51)Total net assets 100.00 100.00 100.00 100.00 * Movements in portfolio holdings have been analysed above based on a % of Net Asset Value invested in each geographic location. The movement in each country’s position between years has to be inferred. Portfolio information
Top Ten Holdings % of Net Assets
Taiwan Semiconductor Manufacturing 7.81
Tencent 6.89
Samsung Electronics 5.98
Alibaba 3.91
Sea ADR 3.33
Li Ning 2.81
NAVER 2.60
China International Travel Service 2.60
AIA 2.55
China Construction Bank 2.34

106
Barings International Umbrella Fund Barings Australia Fund
Appendix 3 – Additional information Hong Kong Code (Unaudited)For the financial year ended 30 April 2021
Barings Australia Fund is registered for sale in Hong Kong.
Highest Issue and lowest redemption pricesHighest issue prices during the year*
30 April 2021 30 April 2020 30 April 2019 30 April 2018 30 April 2017Class A USD Inc 146.24 126.76 123.36 124.61 114.11Class A AUD Inc 187.77 185.65 169.04 165.07 150.18Class A EUR Inc 120.90 114.84 107.65 103.01 106.46Class A GBP Inc 105.10 99.84 96.35 90.80 91.42Class I GBP Acc 129.14 118.05 110.77 101.84 100.29Class I USD Acc 179.69 150.36 141.85 139.76 124.89
Highest issue prices during the year* (continued)
30 April 2016 30 April 2015 30 April 2014 30 April 2013 30 April 2012Class A USD Inc 116.78 131.38 132.90 136.13 133.94Class A AUD Inc 148.24 153.98 140.45 131.58 123.45Class A EUR Inc 104.32 111.48 100.72 104.12 93.17Class A GBP Inc 76.50 80.93 85.37 90.02 82.06Class I GBP Acc 82.35 85.15 87.13 N/A N/AClass I USD Acc 118.38 N/A N/A N/A N/A
Lowest redemption prices during the year*
30 April 2021 30 April 2020 30 April 2019 30 April 2018 30 April 2017Class A USD Inc 87.89 71.74 101.97 104.77 99.96Class A AUD Inc 136.31 125.28 143.93 138.77 132.51Class A EUR Inc 80.02 66.99 89.36 86.60 90.49Class A GBP Inc 70.02 62.22 80.58 76.34 70.17Class I GBP Acc 85.45 73.90 92.87 85.26 76.65Class I USD Acc 107.25 85.21 117.52 117.01 109.45
Lowest redemption prices during the year* (continued)
30 April 2016 30 April 2015 30 April 2014 30 April 2013 30 April 2012Class A USD Inc 88.97 107.84 108.12 100.20 96.63Class A AUD Inc 125.96 128.93 117.26 102.18 102.00Class A EUR Inc 78.45 86.54 82.48 80.17 73.29Class A GBP Inc 59.76 68.54 69.46 64.33 62.83Class I GBP Acc 64.12 72.03 71.08 N/A N/AClass I USD Acc 95.70 N/A N/A N/A N/A *The above highest issue prices and lowest redemption prices during the year are quoted in their respective share classes’ denomination currency.

107
Barings International Umbrella Fund Barings Australia Fund
Appendix 3 – Additional information Hong Kong Code (Unaudited) (continued)For the financial year ended 30 April 2021
Statement of movements in portfolio holdings30 April 2021
% of NAV30 April 2020
% of NAV30 April 2019
% of NAV30 April 2018
% of NAVCommunication Services 2.96 0.72 – –Consumer Discretionary 7.38 3.62 4.83 6.24Consumer Staples 9.87 13.41 8.61 8.66Energy 3.19 3.99 8.89 5.93Financials 32.02 29.92 32.58 30.41Health Care 14.33 16.22 13.55 8.70Industrials 3.25 6.52 2.50 5.35Information Technology – – 3.14 4.15Materials 21.27 18.28 20.60 25.08Real Estate 5.25 4.69 4.55 4.79Investment Funds – 1.39 0.18 0.99Total investments 99.52 98.76 99.43 100.30Bank overdraft/(cash) (1.26) 2.54 0.71 (0.05)Other net liabilities 1.74 (1.30) (0.14) (0.25)Total net assets 100.00 100.00 100.00 100.00 * Movements in portfolio holdings have been analysed above based on a % of Net Asset Value invested in each industry sector. The movement in each sector’s position between years has to be inferred. Portfolio information
Top Ten Holdings % of Net Assets
BHP Billiton 9.41
National Australia Ban 7.10
Australia & New Zealand Banking Group 6.24
Macquarie 5.85
CSL 5.79
Goodman 5.25
Commonwealth Bank of Australia 5.00
Woolworth 3.99
Rio Tinto 3.59
Aristocrat Leisure 3.29

108
Barings International Umbrella Fund Barings Europa Fund
Appendix 3 – Additional information Hong Kong Code (Unaudited)For the financial year ended 30 April 2021
Barings Europa Fund is registered for sale in Hong Kong.
Highest Issue and lowest redemption pricesHighest issue prices during the year*
30 April 2021 30 April 2020 30 April 2019 30 April 2018 30 April 2017Class A USD Inc 63.68 57.84 62.19 66.02 52.67Class A EUR Inc 63.68 52.71 52.65 54.58 48.15Class C EUR Inc 61.76 51.19 51.52 53.32 46.74Class C USD Inc 61.90 56.34 61.00 64.64 51.24Class I EUR Acc N/A N/A N/A 50.14 48.76
Highest issue prices during the year* (continued)
30 April 2016 30 April 2015 30 April 2014 30 April 2013 30 April 2012Class A USD Inc 54.51 55.64 55.73 45.53 48.38Class A EUR Inc 49.08 49.19 40.40 34.03 33.10Class C EUR Inc 48.10 47.85 39.41 33.34 32.71Class C USD Inc 53.63 54.67 54.45 44.74 47.90Class I EUR Acc 42.18 N/A N/A N/A N/A
Lowest redemption prices during the year*
30 April 2021 30 April 2020 30 April 2019 30 April 2018 30 April 2017Class A USD Inc 41.95 33.33 44.98 52.10 41.77Class A EUR Inc 41.95 31.00 39.52 43.07 37.93Class C EUR Inc 41.07 30.08 38.45 42.18 37.13Class C USD Inc 41.16 32.41 43.84 51.13 40.98Class I EUR Acc N/A N/A N/A 48.71 38.28
Lowest redemption prices during the year* (continued)
30 April 2016 30 April 2015 30 April 2014 30 April 2013 30 April 2012Class A USD Inc 42.10 44.73 41.87 33.06 31.35Class A EUR Inc 37.13 35.10 31.94 26.82 23.35Class C EUR Inc 36.19 34.32 31.37 26.48 22.98Class C USD Inc 41.12 43.81 41.20 32.70 30.91Class I EUR Acc 37.13 N/A N/A N/A N/A
*The above highest issue prices and lowest redemption prices during the year are quoted in their respective share classes’ denomination currency.

109
Barings International Umbrella Fund Barings Europa Fund
Appendix 3 – Additional information Hong Kong Code (Unaudited) (continued)For the financial year ended 30 April 2021
Statement of movements in portfolio holdings30 April 2021
% of NAV30 April 2020
% of NAV30 April 2019
% of NAV30 April 2018
% of NAVCommunication Services 4.65 3.10 – –Consumer Discretionary 1.80 9.72 10.77 11.63Consumer Staples 11.71 7.82 4.65 5.73Energy 7.32 10.72 10.11 8.64Financials 15.10 20.69 25.90 30.08Health Care 13.99 15.66 8.71 7.33Industrials 10.82 7.22 13.81 12.53Information Technology 19.47 14.22 17.31 13.15Materials 12.71 8.78 8.66 11.66Utilities 1.98 – – –Investment Funds – 2.07 0.27 –Total investments 99.55 100.00 100.19 100.75Cash/(Bank overdraft) 0.46 0.05 (0.01) (0.86)Other net (liabilities)/assets (0.01) (0.05) (0.18) 0.11Total net assets 100.00 100.00 100.00 100.00
* Movements in portfolio holdings have been analysed above based on a % of Net Asset Value invested in each Industry sector. The movement in each sectors position between years has to be inferred. Portfolio information
Top Ten Holdings % of Net Assets
Nestle 7.36
Roche 5.90
ASML 5.70
Capgemini 4.77
AstraZeneca 4.10
AXA 3.86
KBC Ancora 3.64
CRH 3.57
Adyen 3.28
Telenet 3.14

110
Barings International Umbrella Fund Barings Hong Kong China Fund
Appendix 3 – Additional information Hong Kong Code (Unaudited)For the financial year ended 30 April 2021
Barings Hong Kong Fund is registered for sale in Hong Kong.
Highest Issue and lowest redemption pricesHighest issue prices during the year*
30 April 2021 30 April 2020 30 April 2019 30 April 2018 30 April 2017Class A USD Inc 2,419.60 1,336.81 1,328.56 1,368.57 985.11Class A EUR Inc 2,006.08 1,211.16 1,123.27 1,111.17 914.93Class A GBP Inc 1,745.27 1,024.98 987.26 975.60 783.45Class A HKD Inc 18,756.46 10,385.16 10,423.83 10,699.31 7,664.58Class A RMB Hedged Acc 17,420.18 9,518.35 9,409.77 9,629.11 6,814.08Class A USD Acc 2,500.61 1,379.40 1,366.36 1,406.45 1,010.31Class C EUR Inc 1,854.92 1,129.39 1,061.90 1,051.73 866.86Class C USD Inc 2,223.01 1,239.66 1,247.91 1,287.05 926.99Class I GBP Acc 1,868.96 1,087.70 1,032.42 2,031.77 810.73Class I USD Acc 2,589.15 1,417.39 1,388.22 1,425.34 1,018.81
Highest issue prices during the year* (continued)
30 April 2016 30 April 2015 30 April 2014 30 April 2013 30 April 2012Class A USD Inc 1,164.65 1,158.44 908.67 865.76 975.74Class A EUR Inc 1,067.64 1,090.90 671.37 657.81 676.07Class A GBP Inc 755.55 786.68 557.06 560.48 595.12Class A HKD Inc 9,029.26 8,978.65 7,044.26 6,712.29 7,580.03Class A RMB Hedged Acc 7,543.18 1,123.98 5,311.09 N/A N/AClass A USD Acc 1,186.21 1,174.37 914.09 865.87 825.44Class C EUR Inc 1,023.92 1,042.60 645.51 634.55 663.11Class C USD Inc 1,109.55 1,099.34 867.81 829.15 950.79Class I GBP Acc 769.38 796.71 509.71 N/A N/AClass I USD Acc 937.79 N/A N/A N/A N/A
Lowest redemption prices during the year*
30 April 2021 30 April 2020 30 April 2019 30 April 2018 30 April 2017Class A USD Inc 1,185.84 1,003.01 952.92 965.73 771.16Class A EUR Inc 1,094.35 928.30 839.71 881.20 681.73Class A GBP Inc 952.20 823.31 747.73 746.37 526.68Class A HKD Inc 9,193.17 7,786.44 7,476.62 7,516.38 5,988.92Class A RMB Hedged Acc 8,435.64 7,142.60 6,787.11 6,697.37 5,212.91Class A USD Acc 1,225.53 1,034.97 980.04 992.46 790.87Class C EUR Inc 1,019.85 869.27 790.68 836.05 651.83Class C USD Inc 1,098.08 928.53 891.51 910.37 732.50Class I GBP Acc 1,014.17 869.88 784.10 1,295.69 542.73Class I USD Acc 1,261.94 1,064.77 998.49 1,000.92 793.96
Lowest redemption prices during the year* (continued)
30 April 2016 30 April 2015 30 April 2014 30 April 2013 30 April 2012Class A USD Inc 711.44 781.84 705.93 695.05 645.35Class A EUR Inc 627.45 563.57 537.71 553.96 487.38Class A GBP Inc 489.77 462.74 457.00 437.12 419.67Class A HKD Inc 5,542.80 6,060.67 5,475.19 5,391.38 5,024.06Class A RMB Hedged Acc 4,733.71 566.61 4,971.59 N/A N/AClass A USD Acc 724.62 792.51 710.14 695.14 782.28Class C EUR Inc 597.34 543.66 519.26 536.15 476.10Class C USD Inc 672.92 749.13 677.15 668.20 626.18Class I GBP Acc 500.54 466.48 476.25 N/A N/AClass I USD Acc 726.47 N/A N/A N/A N/A
*The above highest issue prices and lowest redemption prices during the year are quoted in their respective share classes’ denomination currency.

111
Barings International Umbrella Fund Barings Hong Kong China Fund
Appendix 3 – Additional information Hong Kong Code (Unaudited) (continued)For the financial year ended 30 April 2021
Statement of movements in portfolio holdings30 April 2021
% of NAV30 April 2020
% of NAV30 April 2019
% of NAV30 April 2018
% of NAVBasic Materials 0.98 – – –Communication Services 9.47 15.29 – –Communications 5.32 – – –Consumer Discretionary 26.86 22.58 9.33 11.13Consumer Staples 3.57 5.17 6.52 5.75Consumer, Cyclical 1.29 – – –Consumer, Non-cyclical 0.93 – – –Energy – 1.56 4.13 3.59Financials 11.69 10.59 27.39 29.93Health Care 6.16 9.40 6.44 5.85Industrials 9.65 6.05 10.83 7.11Information Technology 11.01 15.88 28.31 33.06Materials 1.85 1.69 0.42 –Real Estate 4.31 7.28 2.05 –Technology 2.33 – – –Telecommunication Services 1.44 2.38 3.24 1.39Utilities 2.41 0.91 – 0.31P-notes – – – 1.04Investment Funds – 1.13 1.42 0.84Total investments 99.27 99.91 100.08 100.00Cash 0.64 0.06 0.22 0.62Other net assets/(liabilities) 0.09 0.03 (0.30) (0.62)Total net assets 100.00 100.00 100.00 100.00
* Movements in portfolio holdings have been analysed above based on a % of Net Asset Value invested in each industry sector. The movement in each sector’s position between years has to be inferred. Portfolio information
Top Ten Holdings % of Net Assets
Tencent 8.71
Alibaba ADR 6.40
Meituan Dianping 4.14
China Merchants Bank 2.93
Taiwan Semiconductor Manufacturing 2.34
Kweichow Moutai 2.26
Baidu ADR 2.22
AIA 2.21
Postal Savings Bank of China 2.16
Ping An Insurance Group of China 1.94

112
Barings International Umbrella Fund Barings Global Bond Fund
Appendix 3 – Additional information Hong Kong Code (Unaudited)For the financial year ended 30 April 2021
Barings Global Bond Fund is registered for sale in Hong Kong.
Highest Issue and lowest redemption pricesHighest issue prices during the year*
30 April 2021 30 April 2020 30 April 2019 30 April 2018 30 April 2017Class A USD Inc 29.55 28.73 25.47 26.03 26.80Class A EUR Inc 24.59 25.14 22.69 22.42 24.07Class A GBP Inc 22.44 22.66 19.91 19.94 21.16Class I GBP Inc 22.50 22.71 19.94 19.98 21.21Class I USD Acc 32.19 30.84 26.96 27.26 27.81
Highest issue prices during the year* (continued)
30 April 2016 30 April 2015 30 April 2014 30 April 2013 30 April 2012Class A USD Inc 26.07 27.70 28.02 28.77 29.25Class A EUR Inc 23.17 23.90 21.35 23.11 21.74Class A GBP Inc 18.48 17.25 18.07 18.47 18.33Class I GBP Inc 18.53 23.96 18.10 18.46 N/AClass I USD Acc 26.94 27.97 27.67 N/A N/A
Lowest redemption prices during the year*
30 April 2021 30 April 2020 30 April 2019 30 April 2018 30 April 2017Class A USD Inc 26.32 25.00 24.01 24.28 23.66Class A EUR Inc 23.02 22.36 20.96 20.62 22.39Class A GBP Inc 19.93 19.24 18.42 18.11 17.43Class I GBP Inc 19.97 19.26 18.44 18.16 17.46Class I USD Acc 28.48 26.59 25.37 25.30 24.62
Lowest redemption prices during the year* (continued)
30 April 2016 30 April 2015 30 April 2014 30 April 2013 30 April 2012Class A USD Inc 24.27 24.92 26.11 27.31 27.21Class A EUR Inc 21.64 19.73 19.31 20.54 19.05Class A GBP Inc 15.51 16.08 16.06 17.14 17.09Class I GBP Inc 15.53 19.76 16.09 17.35 N/AClass I USD Acc 24.86 25.39 26.80 N/A N/A
*The above highest issue prices and lowest redemption prices during the year are quoted in their respective share classes’ denomination currency.

113
Barings International Umbrella Fund Barings Global Bond Fund
Appendix 3 – Additional information Hong Kong Code (Unaudited) (continued)For the financial year ended 30 April 2021
Statement of movements in portfolio holdings30 April 2021
% of NAV30 April 2020
% of NAV30 April 2019
% of NAV30 April 2018
% of NAVAustralian dollar 9.23 1.32 4.05 4.65Canadian dollar 1.69 9.12 1.66 1.27Czech koruna 2.41 – – –Euro 34.60 20.53 27.97 34.95Hungarian forint – 1.76 1.91 –Israeli new shekel 0.77 0.95 – –Japanese yen 10.42 2.88 5.64 8.72Mexican pesos 3.73 3.60 2.68 1.12New Zealand dollar 3.81 4.19 3.79 2.44Polish zloty 5.68 5.09 3.70 4.01Pound sterling 3.53 5.13 6.65 6.76Singapore dollar 1.01 – – –South African rand – – 0.38 1.17Swedish krona 0.75 – – –Swiss franc – 0.82 1.14 –US dollar 20.70 39.23 39.24 32.57Investment Funds – – – 0.24Open forward foreign currency exchange contracts – 1.52 (0.09) 0.07Futures contracts (0.25) 0.11 – –Total investments 98.08 96.25 98.72 97.97Cash 1.45 3.05 0.50 2.01Other net assets 0.47 0.70 0.78 0.02Total net assets 100.00 100.00 100.00 100.00
* Movements in portfolio holdings have been analysed above based on a % of Net Asset Value invested in each geographic location. The movement in each country’s position between years has to be inferred. Portfolio information
Top Ten Holdings % of Net Assets
New South Wales Treasury 3.00% 20/03/2028 6.86
Italy (Republic of) 1.50% 01/06/2025 6.07
Poland (Republic of) 428 2.75% 25/04/2028 5.68
US Treasury Note 912828ZB9 1.13% 28/02/2027 5.40
UK (Govt of) 1.25% 22/10/2041 3.53
Japan (Govt of) 40 1.80% 20/09/2043 3.37
Spain (Kingdom of) 1.95% 30/04/2026 3.10
US Treasury Note 0.25% 30/06/2025 3.10
Hellenic Republic Government Bond 3.38% 15/02/2025 2.50
Italy (Republic of) 2.20% 01/06/2027 2.46
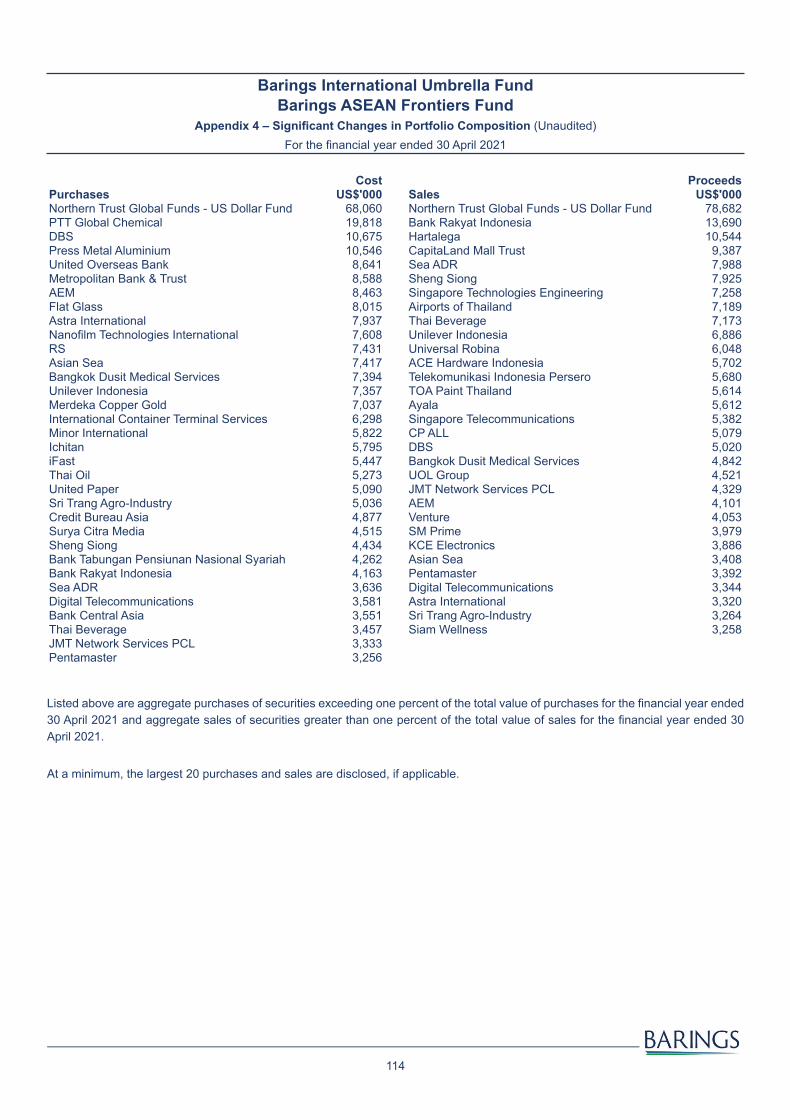
Barings International Umbrella Fund Barings ASEAN Frontiers Fund
Appendix 4 – Significant Changes in Portfolio Composition (Unaudited)For the financial year ended 30 April 2021
114
Cost Proceeds Purchases US$'000 Sales US$'000 Northern Trust Global Funds - US Dollar Fund 68,060 Northern Trust Global Funds - US Dollar Fund 78,682PTT Global Chemical 19,818 Bank Rakyat Indonesia 13,690DBS 10,675 Hartalega 10,544Press Metal Aluminium 10,546 CapitaLand Mall Trust 9,387United Overseas Bank 8,641 Sea ADR 7,988Metropolitan Bank & Trust 8,588 Sheng Siong 7,925AEM 8,463 Singapore Technologies Engineering 7,258Flat Glass 8,015 Airports of Thailand 7,189Astra International 7,937 Thai Beverage 7,173Nanofilm Technologies International 7,608 Unilever Indonesia 6,886RS 7,431 Universal Robina 6,048Asian Sea 7,417 ACE Hardware Indonesia 5,702Bangkok Dusit Medical Services 7,394 Telekomunikasi Indonesia Persero 5,680Unilever Indonesia 7,357 TOA Paint Thailand 5,614Merdeka Copper Gold 7,037 Ayala 5,612International Container Terminal Services 6,298 Singapore Telecommunications 5,382Minor International 5,822 CP ALL 5,079Ichitan 5,795 DBS 5,020iFast 5,447 Bangkok Dusit Medical Services 4,842Thai Oil 5,273 UOL Group 4,521United Paper 5,090 JMT Network Services PCL 4,329Sri Trang Agro-Industry 5,036 AEM 4,101Credit Bureau Asia 4,877 Venture 4,053Surya Citra Media 4,515 SM Prime 3,979Sheng Siong 4,434 KCE Electronics 3,886Bank Tabungan Pensiunan Nasional Syariah 4,262 Asian Sea 3,408Bank Rakyat Indonesia 4,163 Pentamaster 3,392Sea ADR 3,636 Digital Telecommunications 3,344Digital Telecommunications 3,581 Astra International 3,320Bank Central Asia 3,551 Sri Trang Agro-Industry 3,264Thai Beverage 3,457 Siam Wellness 3,258JMT Network Services PCL 3,333Pentamaster 3,256
Listed above are aggregate purchases of securities exceeding one percent of the total value of purchases for the financial year ended 30 April 2021 and aggregate sales of securities greater than one percent of the total value of sales for the financial year ended 30 April 2021.
At a minimum, the largest 20 purchases and sales are disclosed, if applicable.

Barings International Umbrella Fund Barings Asia Growth Fund
Appendix 4 – Significant Changes in Portfolio Composition (Unaudited) (continued)For the financial year ended 30 April 2021
115
Cost Proceeds Purchases US$'000 Sales US$'000NAVER 5,965 Alibaba 4,649China Construction Bank 5,851 Hartalega 2,876Sands China 5,425 China Resources Cement 2,825AIA 4,958 Offcn Education Technology 2,644Alibaba 4,928 RemeGen 2,642Baidu 4,903 China Merchants Bank 2,631Tencent 4,682 Kingsoft Cloud 2,608Shenzhen Inovance Technology 4,598 HDFC Bank 2,540Kia 4,584 Ping An Insurance Group of China 2,537NARI Technology 3,967 AIA 2,390Zijin Mining 3,902 CP ALL 2,342NanoFilm Technologies 3,626 TAL Education 2,275PTT Global Chemical 3,397 LG Household & Health Care 2,174Hangzhou Tigermed Consulting 3,355 Alchip Technologies 2,069HDFC Bank 3,293 Luxshare Precision Industry 2,042POSCO 3,223 NARI Technology 2,001SK Hynix 3,153 Xiaomi 1,970Offcn Education Technology 3,109 SK Biopharmaceuticals 1,949PI Industries 2,996 China Construction Bank 1,905Taiwan Semiconductor Manufacturing 2,882 NetEase 1,870SITC International 2,878 Bank Rakyat Indonesia 1,855Asian Sea 2,821 Hindustan Unilever 1,835IndiaMART InterMESH 2,811 China Life Insurance 1,829Sany Heavy Industry 2,794 Asian Sea 1,773Reliance Industries Limited 2,723 Indocement Tunggal Prakarsa 1,694Pentamaster 2,471 NHN KCP 1,686Studio Dragon 2,462 Poya International 1,655Yidu Tech 2,419 Bank Central Asia 1,57521Vianet 2,415 China Resources Land 1,527Orient Overseas 2,395 Sands China 1,439China Resources Cement 2,379 Reliance Industries Limited 1,379Samsung Electronics 2,297 Douzone Bizon 1,372Giant Manufacturing 2,266 Shenzhou International 1,356Yihai International 2,256 Taiwan Union Technology 1,302Tata Steel 2,206 Galaxy Entertainment 1,274Hon Hai Precision Industry 2,103 Yihai International 1,253China Life Insurance 2,103 Titan 1,251Xinyi Solar 2,033 Sino Biopharmaceutical 1,190Kuaishou Technology 2,024 POSCO 1,187LG Electronics 1,926 Sunny Optical Technology 1,127Centre Testing International 1,860 Shimao Property 1,048LG Chem 1,853 HCL Technologies 1,045Alchip Technologies 1,835PEGAVISION 1,805
Listed above are aggregate purchases of securities exceeding one percent of the total value of purchases for the financial year ended 30 April 2021 and aggregate sales of securities greater than one percent of the total value of sales for the financial year ended 30 April 2021. At a minimum, the largest 20 purchases and sales are disclosed, if applicable.
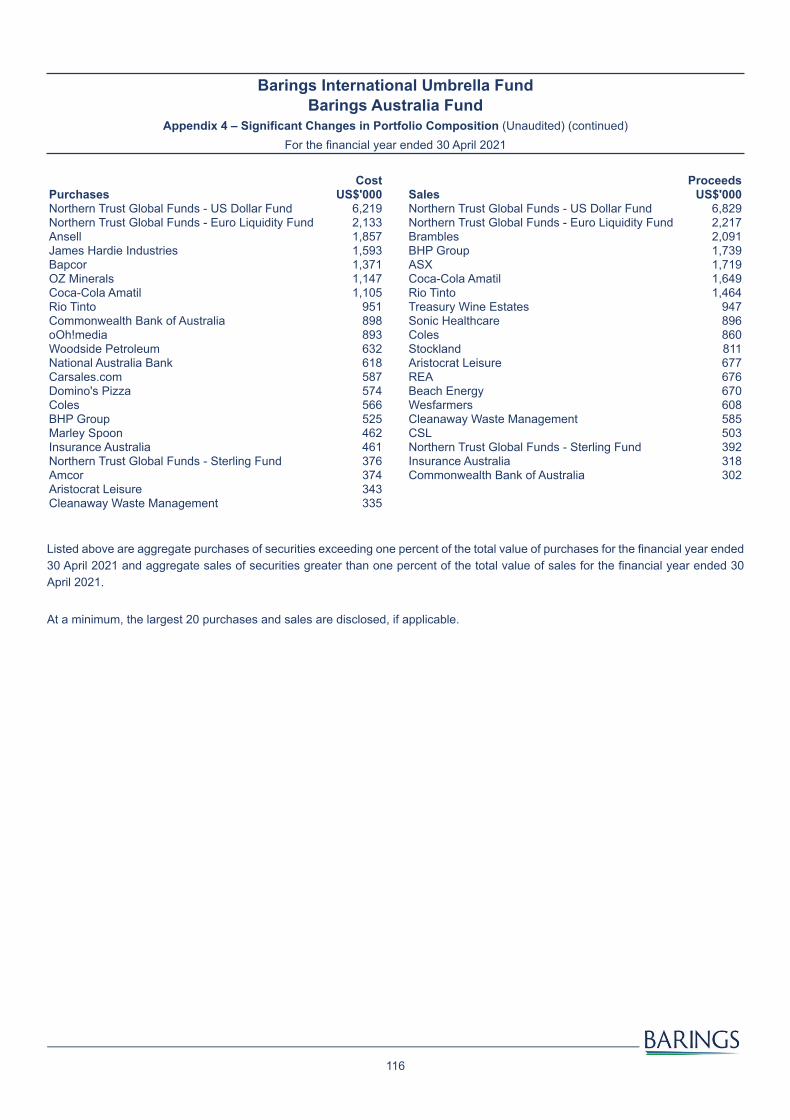
Barings International Umbrella Fund Barings Australia Fund
Appendix 4 – Significant Changes in Portfolio Composition (Unaudited) (continued)For the financial year ended 30 April 2021
116
Cost Proceeds Purchases US$'000 Sales US$'000 Northern Trust Global Funds - US Dollar Fund 6,219 Northern Trust Global Funds - US Dollar Fund 6,829Northern Trust Global Funds - Euro Liquidity Fund 2,133 Northern Trust Global Funds - Euro Liquidity Fund 2,217Ansell 1,857 Brambles 2,091James Hardie Industries 1,593 BHP Group 1,739Bapcor 1,371 ASX 1,719OZ Minerals 1,147 Coca-Cola Amatil 1,649Coca-Cola Amatil 1,105 Rio Tinto 1,464Rio Tinto 951 Treasury Wine Estates 947Commonwealth Bank of Australia 898 Sonic Healthcare 896oOh!media 893 Coles 860Woodside Petroleum 632 Stockland 811National Australia Bank 618 Aristocrat Leisure 677Carsales.com 587 REA 676Domino's Pizza 574 Beach Energy 670Coles 566 Wesfarmers 608BHP Group 525 Cleanaway Waste Management 585Marley Spoon 462 CSL 503Insurance Australia 461 Northern Trust Global Funds - Sterling Fund 392Northern Trust Global Funds - Sterling Fund 376 Insurance Australia 318Amcor 374 Commonwealth Bank of Australia 302Aristocrat Leisure 343Cleanaway Waste Management 335
Listed above are aggregate purchases of securities exceeding one percent of the total value of purchases for the financial year ended 30 April 2021 and aggregate sales of securities greater than one percent of the total value of sales for the financial year ended 30 April 2021.
At a minimum, the largest 20 purchases and sales are disclosed, if applicable.

Barings International Umbrella Fund Barings Europa Fund
Appendix 4 – Significant Changes in Portfolio Composition (Unaudited) (continued)For the financial year ended 30 April 2021
117
Cost
Proceeds
Purchases US$'000 Sales US$'000 Northern Trust Global Funds - Euro Liquidity Fund 3,234 Northern Trust Global Funds - Euro Liquidity Fund 3,825Unilever 877 Airbus 1,093Assa Abloy 706 Cembra Money Bank 987Prysmian 673 Wendel 933Siemens Gamesa 617 Persimmon 769Smurfit Kappa Group 481 Cie Generale des Etablissements Michelin 711Associated British Foods 476 Dalata Hotel 689Schindler 473 Rheinmetall 668Koninklijke DSM 460 Julius Baer 513Auto Trader 444 Boliden 460ConvaTec Group PLC 434 CRH 452Halma 307 AstraZeneca 436Snam 306 ASML 432Unibail-Rodamco-Westfield REITs 293 Adyen 430RWE 287 TGS NOPEC Geophysical 388Temenos 200 Unibail-Rodamco-Westfield REITs 354Capgemini 174 Amadeus IT 336Linde 158 SGS 328Telenet 157 Capgemini 316Koninklijke Philips 148 Ferrari 303Cie Generale des Etablissements Michelin 144 Infineon Technologies 233Schneider Electric 137 AXA 219Prudential 119 Prosus 204
Royal Dutch Shell 167Galp Energia 163
Listed above are aggregate purchases of securities exceeding one percent of the total value of purchases for the financial year ended 30 April 2021 and aggregate sales of securities greater than one percent of the total value of sales for the financial year ended 30 April 2021. At a minimum, the largest 20 purchases and sales are disclosed, if applicable.

Barings International Umbrella Fund Barings Hong Kong China Fund
Appendix 4 – Significant Changes in Portfolio Composition (Unaudited) (continued)For the financial year ended 30 April 2021
118
Cost Proceeds Purchases US$'000 Sales US$'000 Northern Trust Global Funds - US Dollar Fund 281,063 Northern Trust Global Funds - US Dollar Fund 297,935Baidu 60,021 Bilibili 66,976Postal Savings Bank of China 44,548 Xiaomi 54,175Yum China 35,235 JD.com 54,041Zijin Mining 34,684 Kingsoft Cloud ADR 40,990Meituan Dianping 34,186 Xinyi Solar 39,865Hon Hai Precision Industry 30,987 NetEase 33,270Kuaishou Technology 29,430 Innovent Biologics 32,050China International Travel Service 28,924 Glodon 31,596Ping An Bank 27,997 Alibaba 30,695Sunac China 26,809 China Tower 30,672Tencent 26,789 China Resources Land 29,72721Vianet 26,096 iQiyi 29,181Kunlun Energy 25,862 Unimicron Technology 28,864Alibaba 25,329 Weichai Power 28,497Hainan Meilan International Airport 25,002 21Vianet 25,541JD.com 24,746 SF Holding 23,020Alibaba 24,743 Li Auto 20,934Sany Heavy Industry 24,549 Geely Automobile 20,405ZTO Express Cayman 24,095 Pinduoduo 19,842Daqo New Energy 24,067 Tencent 19,303Yidu Tech 23,078 CNOOC 18,896United Micro Electronics 22,295 Shimao Property 18,673Lens Technology 21,678 Meituan Dianping 18,082Sunac Services 21,612 TAL Education 17,727Zhihu 21,590 CSPC Pharmaceutical 17,370Kingsoft Cloud 21,162 Anhui Conch Cement 15,546Wuxi Biologics Cayman 21,144Pinduoduo 20,709SITC International 20,239New Oriental Education & Technology 18,063Man Wah 17,705Yatsen 16,608
Listed above are aggregate purchases of securities exceeding one percent of the total value of purchases for the financial year ended 30 April 2021 and aggregate sales of securities greater than one percent of the total value of sales for the financial year ended 30 April 2021. At a minimum, the largest 20 purchases and sales are disclosed, if applicable.

Barings International Umbrella Fund Barings Global Bond Fund
Appendix 4 – Significant Changes in Portfolio Composition (Unaudited) (continued)For the financial year ended 30 April 2021
119
Cost
Proceeds
Purchases US$'000 Sales US$'000 New South Wales Treasury 3.00% 20/03/2028 6,304 Canada (Govt of) 5.70% 18/06/2029 4,782US Treasury Note 1.13% 28/02/2027 5,843 Romania (Republic of) 4.63% 03/04/2049 4,139Czech (Republic of) 0.95% 15/05/2030 5,475 Czech (Republic of) 0.95% 15/05/2030 3,706UK Gilt 1.25% 22/10/2041 5,064 Petroleos Mexicanos 6.88% 04/08/2026 3,607Italy (Republic of) 1.50% 01/06/2025 4,722 Philippines (Republic of) 4.00% 15/01/2021 3,500Japan (Govt of) 1.80% 20/09/2043 4,532 Portugal (Republic of) 5.13% 15/10/2024 3,286Hellenic Republic Government Bond 3.50% 30/01/2023 3,810 US Treasury Bond 2.00% 15/02/2025 3,248Japan (Govt of) 0.30% 20/12/2039 3,651 Petrobras Global Finance 8.75% 23/05/2026 3,013Japan (Govt of) 1.20% 20/03/2035 3,627 UK (Govt of) 4.25% 07/12/2046 2,880US Treasury Note 0.25% 30/06/2025 3,592 US Treasury STRIP 0.00% 15/02/2048 2,797Canada (Govt of) 5.70% 18/06/2029 3,454 Hellenic Republic Government Bond 3.50% US Treasury Note 0.63% 15/08/2030 3,112 30/01/2023 2,656Spain (Kingdom of) 1.95% 30/04/2026 2,966 Canada (Govt of) 5.60% 02/06/2035 2,650Romania (Republic of) 4.63% 03/04/2049 2,852 Ireland (Republic of) 5.40% 13/03/2025 2,605Italy (Republic of) 0.60% 15/06/2023 2,768 Italy (Republic of) 6.875% 27/09/2023 2,423Ireland (Republic of) 1.10% 15/05/2029 2,708 Canada Housing Trust 2.10% 15/09/2029 2,225Spain (Kingdom of) 2.90% 31/10/2046 2,547 Canada (Govt of) 6.25% 01/06/2032 2,140Hellenic Republic Government Bond 3.38% 15/02/2025 2,441 UK (Govt of) 4.75% 07/12/2030 2,115Japan (Govt of) 0.30% 20/06/2046 2,434 UK Gilt 1.25% 22/10/2041 2,088US Treasury Bond 2.00% 15/02/2025 2,368 US Treasury Bond 2.75% 15/02/2024 2,057Portugal (Republic of) 5.13% 15/10/2024 2,108 Poland (Republic of) 3.25% 06/04/2026 2,018Kommuninvest I Sverige 1.00% 12/11/2026 2,082 Spain (Kingdom of) 2.90% 31/10/2046 2,007Poland (Republic of) 2.75% 25/04/2028 2,051 Japan (Govt of) 1.80% 20/09/2043 2,006Singapore (Govt of) 2.88% 01/07/2029 2,046 Japan (Govt of) 0.30% 20/12/2039 1,875US Treasury STRIP 0.00% 15/02/2048 1,982 Japan (Govt of) 0.30% 20/06/2046 1,829Italy (Republic of) 2.70% 01/03/2047 1,975 Ireland (Republic of) 1.10% 15/05/2029 1,757Petrobras Global Finance 8.75% 23/05/2026 1,900 Japan (Govt of) 1.20% 20/03/2035 1,732UK (Govt of) 4.25% 07/12/2046 1,890 US Treasury Note 0.63% 15/08/2030 1,688Petroleos Mexicanos 6.88% 04/08/2026 1,868 Poland (Republic of) 2.75% 25/04/2028 1,672Treasury Corporation of Victoria 1.50% 20/11/2030 1,765 New Zealand (Govt of) 2.75% 15/04/2025 1,654New Zealand (Govt of) 2.75% 15/04/2025 1,705 Kommuninvest I Sverige 1.00% 12/11/2026 1,635Ireland (Republic of) 1.70% 15/05/2037 1,655 Italy (Republic of) 5.25% 01/11/2029 1,603Poland (Republic of) 1.25% 25/10/2030 1,638 Poland (Republic of) 1.25% 25/10/2030 1,553Canada Housing Trust 2.10% 15/09/2029 1,583 US Treasury STRIP 0.00% 15/11/2048 1,537France (Republic of) 3.25% 25/05/2045 1,527 Italy (Republic of) 2.70% 01/03/2047 1,480Australia (Commonwealth of) 1.75% 21/06/2051 1,368 Mexican Bonos 7.75% 13/11/2042 1,477UK (Govt of) 4.75% 07/12/2030 1,316 US Treasury Note 1.13% 28/02/2027 1,439Italy (Republic of) 2.20% 01/06/2027 1,237 US Treasury STRIP 0.00% 15/08/2042 1,405France (Republic of) 1.50% 25/05/2031 1,234 Spain (Kingdom of) 1.95% 30/04/2026 1,404Mexican Bonos 7.75% 13/11/2042 1,218 Hungary (Republic of) 3.25% 22/10/2031 1,321
Hellenic Republic Government Bond 4.20% 30/01/2042 1,270Singapore (Govt of) 2.88% 01/07/2029 1,244Italy (Republic of) 0.60% 15/06/2023 1,205Australia (Commonwealth of) 1.75% 21/06/2051 1,184
Listed above are aggregate purchases of securities exceeding one percent of the total value of purchases for the financial year ended 30 April 2021 and aggregate sales of securities greater than one percent of the total value of sales for the financial year ended 30 April 2021. At a minimum, the largest 20 purchases and sales are disclosed, if applicable.

120
Barings International Umbrella FundAppendix 5 – Disclosure of Remuneration (Unaudited)
For the financial year ended 30 April 2021
Baring International Fund Managers (Ireland) Limited (the “Manager”) remuneration policy ensures that the remuneration arrangements of “Identified Staff” as defined in ESMA’s “Guidelines on sound remuneration policies under the UCITS directive” the European Securities and Market Authority’s (the “ESMA’s Guidelines”) (as amended) are:
(i) consistent with and promote sound and effective risk management and do not encourage risk-taking which is inconsistent with the risk profile, rules or instruments of incorporation of the Manager or “the Unit Trust” and
(ii) consistent with the Manager’s business strategy, objectives, values and interests and includes measures to avoid conflicts of interest.
The Manager complies with the UCITS remuneration principles in a way and to the extent that is appropriate to its size and business.
Remuneration committeeDue to the size and nature of the Manager, the Board of Directors considers it appropriate to dis-apply the requirement to appoint a remuneration committee.
The Manager forms part of the Barings Europe Limited (UK) group of companies (“Barings”). Barings has two remuneration committees to take remuneration decisions, namely the Remunerations Committee and the Senior Compensation Committee. The remuneration committees ensure the fair and proportionate application of the remuneration rules and ensure that potential conflicts arising from remuneration are managed and mitigated appropriately.
Remuneration Code StaffThe Manager has determined its Remuneration Code Staff as the following:
a) Senior managementSenior Management comprises of Board of Directors.
b) Control FunctionsAll CBI Pre Approved Control Functions (“PCFs”) are included within the definition of Remuneration Code Staff.
c) Risk TakersRisk Takers are defined as the investment managers of the UCITS. Investment management is delegated to firms’ subject to an equivalent remuneration regime and therefore the Manager currently has no risk takers outside of senior management.
d) Employees in the same remuneration bracket as risk takersThe Manager will not treat a person as Remuneration Code Staff if a person’s professional activities do not have a material impact on the risk profiles of the firm or the Funds.
e) Staff responsible for heading the investment management, administration, marketing and human resourcesThere are no staff in this category that are not captured in other categories.

121
Barings International Umbrella FundAppendix 5 – Disclosure of Remuneration (Unaudited) (continued)
For the financial year ended 30 April 2021
Remuneration DisclosureThe disclosure below details fixed and variable remuneration paid to the Managers Remuneration Code Staff (for the financial year end 30 April 2021).
Number of beneficiaries
Total Remuneration Total Fixed Remuneration
Total Variable remuneration
Total remuneration paid by BIFMI in relation to the Funds*
9 EUR131,708 EU79,861 EUR51,847
Total Senior Management Remuneration paid by BIFMI**
5 EUR788,950 EUR415,104 EUR373,846
Risk Takers remuneration
0 n/a n/a n/a
Employees in the same remuneration bracket a risk takers
0 n/a n/a n/a
Carried interest paid by the Funds
n/a n/a n/a n/a
The Manager’s Remuneration Policy is reviewed annually both in respect of the general principles it contains and its own implementation.
The above disclosures are made in line with Barings' interpretation of currently available regulatory guidance on quantitative remuneration disclosures. As market or regulatory practice develops, Barings may consider it appropriate to make changes to the way in which quantitative remuneration disclosures are calculated. Where such changes are made, this may result in disclosures in relation to a fund not being comparable to the disclosures made in the prior year, or in relation to other Barings fund disclosures in that same year.
Notes: * The Manager does not make any direct payments to staff, who are paid by other Barings Group entities. Figures shown are apportioned on a fund AUM basis as a proportion of Barings total AUM as at 30 April 2021. Accordingly, the figures are not representative of any individual's actual remuneration.
**Senior management remuneration is apportioned on the basis of the Manager’s total AUM as a proportion of Barings total AUM.
Variable remuneration consists of Short Term Incentive awards, Long Term Incentive awards and any other variable payments including benefits in kind and discretionary pension awards.
The funds do not charge a performance fee or award carried interest.

Registered address: Baring International Fund Managers (Ireland) Limited 70 Sir John Rogerson’s QuayDublin 2D02 R296Ireland
Contact:Tel: + 353 1 542 2930 Fax: + 353 1 670 1185 www.barings.com
Important information: This document is approved and issued by Baring International Fund Managers (Ireland) Limited.
Disclosure: Baring International Fund Managers (Ireland) Limited Authorised and regulated by the Central Bank of Ireland 70 Sir John Rogerson’s Quay, Dublin 2, D02 R296, Ireland