Barefoot versus Shod Training: Effects on Navicular Drop ...
63
University of North Dakota UND Scholarly Commons Physical erapy Scholarly Projects Department of Physical erapy 2017 Barefoot versus Shod Training: Effects on Navicular Drop and Foot Pressure Analysis Evan Condry University of North Dakota Daniel Himmerick University of North Dakota Tiffany VanHaaſten University of North Dakota Follow this and additional works at: hps://commons.und.edu/pt-grad Part of the Physical erapy Commons is Scholarly Project is brought to you for free and open access by the Department of Physical erapy at UND Scholarly Commons. It has been accepted for inclusion in Physical erapy Scholarly Projects by an authorized administrator of UND Scholarly Commons. For more information, please contact [email protected]. Recommended Citation Condry, Evan; Himmerick, Daniel; and VanHaaſten, Tiffany, "Barefoot versus Shod Training: Effects on Navicular Drop and Foot Pressure Analysis" (2017). Physical erapy Scholarly Projects. 541. hps://commons.und.edu/pt-grad/541
Transcript of Barefoot versus Shod Training: Effects on Navicular Drop ...

University of North DakotaUND Scholarly Commons
Physical Therapy Scholarly Projects Department of Physical Therapy
2017
Barefoot versus Shod Training: Effects on NavicularDrop and Foot Pressure AnalysisEvan CondryUniversity of North Dakota
Daniel HimmerickUniversity of North Dakota
Tiffany VanHaaftenUniversity of North Dakota
Follow this and additional works at: https://commons.und.edu/pt-grad
Part of the Physical Therapy Commons
This Scholarly Project is brought to you for free and open access by the Department of Physical Therapy at UND Scholarly Commons. It has beenaccepted for inclusion in Physical Therapy Scholarly Projects by an authorized administrator of UND Scholarly Commons. For more information,please contact [email protected].
Recommended CitationCondry, Evan; Himmerick, Daniel; and VanHaaften, Tiffany, "Barefoot versus Shod Training: Effects on Navicular Drop and FootPressure Analysis" (2017). Physical Therapy Scholarly Projects. 541.https://commons.und.edu/pt-grad/541

BAREFOOT VERSUS SHOD TRAINING: EFFECTS ON NAVICULAR DROP AND
FOOT PRESSURE ANALYSIS
By
Evan Condry
Bachelor of Science
University of North Dakota
Daniel Himmerick
Bachelor of Arts
Saint John's University
Tiffany VanHaaften
Bachelor of Science
Bemidji State University
A Scholarly Project Submitted to the Graduate Faculty of the
Department of Physical Therapy
School of Medicine
University of North Dakota
In partial fulfillment of the requirements for the degree of
Doctor of Physical Therapy
Grand Forks, North Dakota
May, 2017


iv
Table of Contents
LIST OF FIGURES ...................................................................................................................... vi
LIST OF TABLES ....................................................................................................................... vii
Acknowledgements ..................................................................................................................... viii
Abstract .......................................................................................................................................... ix
CHAPTER I ................................................................................................................................... 1
Introduction ................................................................................................................................ 1
Kinetic, Kinematic, and Muscle Activity ............................................................................. 3
Foot Anatomy and Dynamics ................................................................................................ 4
Arch Dynamics and Injury ................................................................................................... 6
Gait Patterns in Barefoot and Shod Running ..................................................................... 7
GAITRite Pressure Mapping ................................................................................................ 8
CHAPTER II ................................................................................................................................ 10
Methods ..................................................................................................................................... 10
Subjects ................................................................................................................................. 10
Informed Consent ................................................................................................................ 11
Measurements/Instruments................................................................................................. 12
Navicular Drop ................................................................................................................. 12
Reliability Testing ............................................................................................................ 13
GAITRite .......................................................................................................................... 15
Post Survey ....................................................................................................................... 17
Retraining Program ............................................................................................................. 18
Data Analysis ........................................................................................................................ 24

v
Ensuring Internal Validity .................................................................................................. 24
CHAPTER III .............................................................................................................................. 26
Results ....................................................................................................................................... 26
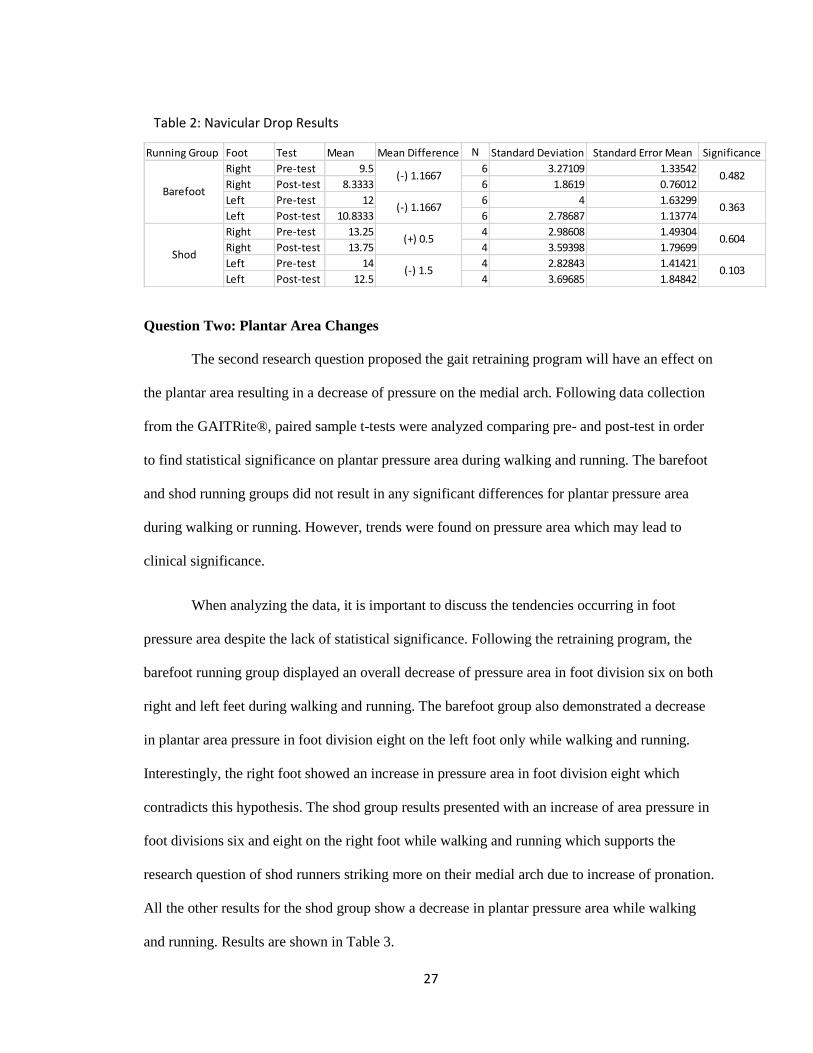
Question One: Navicular Drop Changes ........................................................................... 26
Question Two: Plantar Area Changes ............................................................................... 27
Question Three: Plantar Pressure Changes ...................................................................... 29
Post Survey Results .............................................................................................................. 31
CHAPTER IV .............................................................................................................................. 33
Discussion ................................................................................................................................. 33
Adverse Effects ..................................................................................................................... 34
Limitations ............................................................................................................................ 34
Future Research ................................................................................................................... 35
APPENDIX A: UND IRB Approval ........................................................................................... 37
APPENDIX B: Informed Consent Form ................................................................................... 38
APPENDIX C: Barefoot Running Survey ................................................................................. 43
APPENDIX D: Exercise Log Sheet ............................................................................................ 46
References ..................................................................................................................................... 47

vi
LIST OF FIGURES
Figure 1. Navicular Drop Testing………………………………..……………………………….15
Figure 2. GAITRite® System…………………………………………………………………….16
Figure 3. Dynamic Stretches…………...…………………………………………………………20
Figure 4. Static Stretches……..…………………………………………………………………..23

vii
LIST OF TABLES
Table 1: Subject Demographics…………………………………………………………………..11
Table 2: Navicular Drop Results………………………………………………………………….27
Table 3: Plantar Pressure Area…………………………………………………………………....28
Table 4: Plantar Peak Pressure……………………………………………………………………30
Table 5: Post-Survey Results……………………………………………………………………..32

viii
Acknowledgements
The authors would like to thank our advisor, Gary Schindler, for his direction, support, and
expertise in the development and completion of this research study. Without your guidance and
generous time commitment this pilot study would not have been possible. We would also like to
thank Dr. Meridee Danks for her knowledge and expertise on the GAITRite® system and
providing additional technical assistance. We would like to express our gratitude to Dr. Renee
Mabey for her assistance with statistical analysis on our research data.
Thank you to all of the subjects for volunteering their time and effort to this study. We
recognize the value of the time the subjects dedicated to the completion of this study. Without
your participation, this pilot study would not have been successful. Lastly, we would like to
extend our appreciation for the love and support we have received from our friends and family
throughout our time working on this research study and journey through physical therapy school.

ix
Abstract
Background and Purpose: Running is a popular form of exercise around the world. The running
population generally runs in a rear-foot strike pattern (RFSP), yet there is questioning on the
possible benefits of running in a forefoot strike pattern (FFSP). The main goal of FFSP is the
possible reduction of running related injuries by reducing the stress on the medial longitudinal
arch. The purpose of this research study is to determine if a barefoot running retraining program
will have an effect on navicular drop height, plantar pressure area, and peak plantar pressure of
the medial aspect of the foot.
Material/Methods: Eleven first and second year physical therapy students participated in this
study. Each subject was randomly assigned to a barefoot running group (N = 6) and shod running
group (N =5). Measurements of foot pronation were taken using the navicular drop test.
Spatiotemporal foot pressures and area were evaluated through the GAITRite® system to
measure plantar pressure area and peak plantar pressure. Each subject completed pre-testing a
week prior to beginning a 5-week retraining program designed from relevant literature. Post-
testing was completed one week following the retraining program to assess changes in arch
dynamics. The data collected from the pre- and post-testing was processed and analyzed using the
Statistical Package for Social Sciences (SPSS) software. An alpha (α) level <0.05 was used to
determine statistical significance. Following the completion of the study, a post survey was used
to determine subject’s perception of this study.
Results: The statistically significant result came from the barefoot running group, in which peak
plantar pressure decreased in foot division 6 from 0.70 to 0.2920 (p=0.035). There were no other
statistically significant changes to note from the plantar pressure area or navicular drop

x
examinations. The post survey results included the perceived adverse effects of pain along the
heads of metatarsals, blisters and, muscle tightness.
Discussion: There may be clinical relevance for barefoot running versus shod running despite the
lack of statistically significant results from this study. Due to the one statistically significant
result coming from a dynamic assessment, it may be possible that barefoot running has more of
an effect on foot pronation during dynamic activities as opposed to static activities. This increase
in dynamic stability may lead to a decrease in running related injuries thus possibly making
barefoot running a clinically relevant intervention. Limitations of this study included: a small
sample size, narrow population, too rapid of running progression, running on treadmills with
socks on, researcher did not remain blinded to subject group, length of the study was too short,
inability to directly measure dynamic navicular drop, and GAITRite® mapping system provided
occasionally inconsistent measurements with additional running/walking trials needed. Future
research could address these limitations through creation of an ongoing study and/or open it to the
public to improve subject population.

1
CHAPTER I
Introduction
During the past decade, a trend developed among the running population which involved
the conversion from conventional shoes to barefoot running or the use of a minimalist style
running shoe. In conventional running shoes, there is increased cushion in the sole and heel of the
foot; however, barefoot or minimalist running shoes lack this cushion, which encourages the
individual to convert from a rear-foot strike (RFSP) running pattern to more of a forefoot strike
(FFSP) running pattern.1,2 RFSP occurs when the heel of the runner makes the initial contact with
the ground, whereas FFSP occurs when the ball of the foot, or the forefoot, makes initial contact
with the ground.1,2 Thus, it is important to understand changes which may occur when converting
from RFSP to FFSP with respect to kinematics, kinetics, lower leg muscle activity, and foot
dynamics. In regards to foot dynamics, navicular drop is an important risk factor and has been
speculated as a significant factor in many running related injuries. Since increased navicular drop
may lead to additional overuse injuries it must be studied further to identify any role that FFSP
may have in altering the height of navicular drop.3–5 The goal of this research study is to
determine if a barefoot running retraining program will have an effect on navicular drop height,
along with plantar pressure of the medial aspect of the foot.
With the change from RFSP to FFSP, researchers have shown a decreased incidence of
running related injuries.6,7 To our knowledge, only two studies identified a decrease in pain from
a running related injury. Diebal et al6 found that barefoot running could be used as an intervention
in Chronic Exertional Compartment Syndrome (CECS). Diebal et al6 conducted a barefoot
retraining program for ten military recruits who were scheduled for a fasciotomy to relieve

2
pressure in the anterior compartment due to CECS. Following the study, recruits did not require
the scheduled fasciotomy due to abolishment of symptoms.6 In a separate case series involving
three female runners who were experiencing unilateral patellofemoral pain, Cheung and Davis7
utilized audio biofeedback to convert their running gait from a RFSP to a FFSP. Following eight
sessions of audio biofeedback and gait retraining, all three individuals were able to maintain the
converted running gait three-months post-training. They reported a decrease in pain and
improvements in function.7 In addition, Barton et al8 conducted interviews with 16 international
experts on their recommendations for gait retraining. The 16 experts recommended running
retraining for a variety of running related injuries including: iliotibial band syndrome, plantar
fasciopathy, lower extremity tendinopathies, calf pain, and medial tibial stress syndrome. As
shown by these studies, healthcare professionals may optimize therapeutic outcomes for running
related injuries by retraining an individual’s running pattern.6–8
As healthcare professionals see a need for running retraining, additional evidence is
needed to support barefoot running and subsequently FFSP running as a therapeutic or
preventative measure. This evidence must start with an understanding of kinetic and kinematic
differences between FFSP and RFSP. Upon immediate investigation of FFSP and RFSP, FFSP
includes a greater ankle plantarflexion, knee flexion, and knee internal rotation upon initial
contact.2,9,10 Biomechanical studies identified a greater eccentric contraction of the gastrocnemius
and soleus muscles during barefoot running, which led to a decreased axial force transmitted
through the tibia, fibula, and ultimately the knee.2,9 Research also found decreased peak forces
through the rectus femoris, vastus lateralis, and vastus medialis.9 It was theorized, the incidence
of running related injuries may be minimalized if the axial force transmitted through the lower
extremity was reduced.
In addition to increased gastrocnemius and soleus activity during barefoot running,
Sinclair et al9 revealed a significant reduction in quadriceps and tibialis anterior muscle activity

3
during barefoot running. The authors of the study concluded barefoot running caused a decrease
in stride length, and did not require a larger force output to control the knee. This decrease in
force output also decreased the peak force transmitted through the knee, which may reduce the
amount of wear and tear the knee experiences.9
Kinetic, Kinematic, and Muscle Activity
Not only has converting from a RFSP to FFSP shown to have changes in running
biomechanics and muscle activity, it has also revealed a change in joint loading. Rooney and
Derrick11 found that FFSP runners had increased ankle joint loading compared to RFSP runners.
This increase in joint loading is thought to be from an increase in plantarflexor muscle activity.
Rooney and Derrick11 state that it has yet to be proven if this enhanced muscle activity caused
increased compression to the tibia due to the additional axial compression, or caused a decrease in
compression to the tibia due to decreased bending moments. An additional study investigated the
muscle activity in natural FFSP versus natural RFSP, particularly of the tibialis anterior and
plantarflexor musculature.12 This study12 supported Rooney and Derrick11 by establishing FFSP
increased gastrocnemius and soleus muscle activity. Furthermore, Cooper, Leissring, and
Kernozek13 studied the force distribution throughout the foot in shod and barefoot runners.
Cooper et al13 found those who converted to a forefoot or midfoot strike pattern demonstrate
lower total forces and a more uniform distribution of forces along the metatarsal region than those
who continue to run with a RFSP. Based on the above studies, FFSP has an effect on force
distribution and an overall decrease in risk of running related injury.11,13
In addition to differences in kinetic, kinematic, and muscle activity between FFSP and
RFSP, there are also spatiotemporal differences. Running with a FFSP, gait patterns typically
demonstrate an increased step cadence, decreased step length, and decreased vertical ground
reaction force (vGRF).2,14–16 Studies revealed several benefits for runners who utilized a FFSP
running pattern. Increased step cadence and decreased stride length as seen with a FFSP are two

4
benefits and provide for an increase in knee flexion angle. By increasing the knee flexion angle at
initial contact, there is a decrease in force impact at the knee and hip.15 Increased step cadence
and decreased stride length also decreased the overall peak hip adduction and hip internal rotation
angles.15 In addition, researchers15 found reduced stride length had significantly decreased vGRF
and sagittal plane joint moments. Therefore, FFSP may decrease the load on the knee and hip
joints which may reduce the risk of running related injuries.15
As seen with changes to the leg, there should also be kinetic, kinematic, and muscle activity
changes in the foot. These changes are likely observed in high mobility areas of the foot, such as
the navicular bone and the medial longitudinal arch of the foot. The degree of mobility in these
areas is important for the health of a runner. Thus, it is important to understand the dynamics of
the navicular bone and the arch of the foot as runners change from a RFSP to a FFSP. This
understanding would also help healthcare professionals in utilizing gait transitions to optimize
therapeutic outcomes in foot related running injuries.
Foot Anatomy and Dynamics
The arch of the foot is a complex formation with three supporting structures including the
medial longitudinal arch, lateral longitudinal arch, and transverse arch. The medial, lateral, and
transverse arches act to support the weight of the body during lower extremity physical activity.
The metatarsal bones play a role in the structure of the arch while ligaments aid in overall
stability. A variety of muscles serve to allow proper foot function with tibialis posterior playing a
significant role in maintaining the medial longitudinal arch.17
The medial longitudinal arch of the foot is a compound structure made up of several different
tissues interacting to produce functional stability with optimal mobility. It is comprised of nine
small bones and the joints between them: the calcaneus, talus, navicular, medial cuneiform,
intermediate cuneiform, lateral cuneiform, first metatarsal, second metatarsal, and third
metatarsal. The soft tissue structures are comprised of ligaments, muscles, and tendons. The
5
primary ligament supporting these bones on the plantar surface is the plantar calcaneonavicular
ligament which is also referred to as the “spring” ligament. Laxity in the calcaneonavicular
ligament can cause flattening of the arch during weight bearing which may lead to pain in the foot
and ankle as well as problems going up the kinetic chain. There are also two main muscles and
associated tendons that provide stability in the joint during weight bearing activities. Tendons of
both tibialis anterior and tibialis posterior cross the plantar surface of the medial longitudinal arch
running posterior to anterior.18 Tibialis anterior inserts onto the plantar surface of the first
metatarsal, and tibialis posterior tendon inserts onto the navicular and medial cuneiform. Both of
these muscles support the medial longitudinal arch, but tibialis posterior has a more direct effect
due to its insertion site.17 Damage or weakness of the tibialis posterior could result in the collapse
of the medial longitudinal arch. Olin et al19, using EMG on lower extremity musculature,
indicated the average muscular activity in barefoot runners is greater than shod runners while
peak EMG between barefoot and shod runners is similar. The increased average lower extremity
muscular activity along with similar peak EMG suggested the plantar flexor muscles were firing
longer with a greater use of quadriceps musculature. Therefore, transitioning to barefoot running
too quickly may lead to development of overuse injuries due to increased muscle fatigue.19 The
dynamic interactions of the bones and soft tissue structures of the foot determine the stability and
mobility of the medial longitudinal arch.
Within the medial longitudinal arch, the navicular bone is the most mobile bone. Given the
posterior tibialis inserts directly on to the navicular bone, it will directly control pronation of the
foot. The navicular bone is a marker used to determine if an individual’s foot is considered
pronated, normal, or supinated. A certain amount of pronation is a normal motion during the
stance phase of gait. It consists of three actions including eversion, abduction, and dorsiflexion.17
An increase in pronation, also known as hyper-pronation, can be detrimental to an athlete. Hyper-
pronated pes planus arches can be labeled as fixed or flexible in nature. Fixed arches occur when

6
the degree of pronation does not change when transitioning from weight bearing to non-weight
bearing. Flexible arches are defined as a medial longitudinal arch which flattens during weight
bearing and reappears when non-weight bearing or when pressure is taken off of the arch. Laxity
in the calcaneonavicular ligament, structural abnormalities, and the length and activity of the
tibialis posterior and anterior all play a role in arch height.17 The average navicular drop in males
is 6mm and in females is 4mm as determined by Adhikari et al.20 Additional studies indicate
hyper-pronation as a navicular drop greater than 8-10 mm.21 Nielsen et al21 found the effect of
foot length on navicular drop to be significant in both genders with the drop increasing by
0.40mm in males and 0.31mm in females for every 10 mm increase in foot length. These studies
provided a standard range for determining hyper-pronation, thus aiding in the determination of
appropriate of foot pronation levels for subjects in this study.
Having either an abnormally supinated or pronated foot may cause injuries. For runners
in particular, high-arches have been associated with a greater incidence of ankle injuries, bony
injuries and lateral injuries including stress fractures and plantar fasciitis, while low arches have
been associated with more knee injuries, soft tissue injuries and medial injuries including ankle
sprains and tendinitis.22 Hyper-pronation or flexible arches have also been reported to have a
significantly higher prevalence in people diagnosed with Patellofemoral Pain Syndrome (PFPS).23
Hyper-pronation may be a risk factor associated with Iliotibial Band Friction Syndrome (ITBS),
Medial Tibial Stress Syndrome, Plantar Fasciitis, and Tibial Stress Fractures.5
Arch Dynamics and Injury
Although research identified foot pronation as a potential cause of LE injury, current
evidence is controversial on the efficacy of barefoot running in controlling foot pronation.24
Hoffman et al24 conducted a study that assessed the dynamic navicular drop in barefoot,
minimalist shoe, and motion-controlled shoe conditions. Hoffman et al24 concluded motion
controlled shoes have a slower navicular drop than barefoot and minimalist shoes. These results

7
contradicted previous theories in which foot pronation was better controlled via barefoot running.
However, the results were obtained by having the subjects run in all three conditions without
conducting a gait retraining program. A separate study identified the opposite affect: an increased
barefoot weight-bearing activity increased strength of the intrinsic muscles of the feet which led
to a decrease in the span of the medial arch.25 This shortening of the medial arch span coincided
with a reduced navicular drop height which reinforced the importance of barefoot running in
potentially limiting the risk of running related injuries. Navicular drop measurement and pressure
mapping analysis can be used for assessing arch dynamics. When analyzing spatiotemporal foot
patterns, it is important to detect where the person’s foot is striking. If pressure is decreased on
the medial longitudinal arch, the navicular drop height may be decreased. Therefore, indicating
the subject may be striking more on the lateral longitudinal arch. Understanding the arch
dynamics through assessing gait patterns will aid in discovering how injuries occur.
Gait Patterns in Barefoot and Shod Running
In a typical gait pattern, there are two different phases: stance and swing phase. A
substantial amount of research has involved the stance phase, which occurs when the foot comes
in contact with the ground.26 The reason for emphasis on the stance phase is to better understand
different foot striking patterns relevant to spatial and temporal pressure mapping. The stance
phase is approximately 60% of walking time, yet decreases while running due to the increased
velocity or distance traveled per unit of time.27 Included in the stance phase is heel strike, mid-
stance, heel off, and toe off which all can be measured through ground reaction forces. Whereas
swing phase has no connection with surface or what is considered the float phase. Each stance
phase component provides a unique assessment of the foot strike patterns; therefore, evaluating
the dynamics of the arch structures. Robbins et al25 analyzed the adaptive patterns of the medial
longitudinal arch of 17 recreational runners. Robbins et al25 hypothesized, with increased weight
bearing, barefoot activity acted as a mechanism to which reduced shock absorption. In this

8
experiment, using X-ray analysis, the effects showed a positive impact in shortening the medial
longitudinal arch with an increase in weight bearing activity, thus potentially decreasing
injuries.25 Recent research continues to question whether arch dynamics play a role in lower
extremity injuries.22 Lieberman et al1 theorized through five different subject groups of varying
ages that barefoot runners were better suited to utilize the eccentric contractions of gastrocnemius
and soleus and arch of the foot mechanics as compared to shod runners. Furthermore, Titianova et
al28 assessed the depth and width of medial and lateral longitudinal arches through pressure
distribution on the runner’s foot. Although there is limited research on pressure mapping in
runners, Titianova et al28 found peak active areas having occurred on heel strike and toe off in
stance phase during normal walking. Therefore, footprint analysis and in particular, the forefoot
peak pressure, may help in the clinical assessment of rehabilitation strategies.28 Despite proposed
negative effects of rear foot striking there are no studies directly examining the efficiency of
forefoot or midfoot strike patterns on running injuries as compared to rear foot contact.27
GAITRite Pressure Mapping
The GAITRite® is a computer based instrumented walkway which measures spatial and
temporal gait characteristics. It includes a roll-up walkway available in various lengths with
embedded pressure sensors.29 This GAITRite® system will assist in measuring the area and
pressure of plantar surface contact in barefoot runners following the 5-week running retraining
program. There is a lack of evidence on the effects of a gait retraining program focused on
converting from a RFSP to a FFSP and the changes of navicular drop and plantar pressure. This
study utilized a 5-week gait retraining program to convert from RFSP to FFSP in a small sample
group of healthy young adults. This study hypothesized that runners who convert from a RFSP to
a FFSP will reduce the height of the navicular drop most likely due to the strengthening of the
tibialis posterior muscle. Given the insertion of the tibialis posterior on the navicular bone, by
strengthening the tibialis posterior there should be a decrease in navicular drop height. In theory,

9
the navicular drop may lead to a decrease in hyper-pronation and running related pain and injury.
We will be measuring the navicular drop before and after the retraining period. The GAITRite®
system will be utilized to evaluate the plantar pressure of the foot during the stance phase of gait
in walking and running. The GAITRite® will allow us to measure any change along the medial
aspect of the longitudinal arch to assess a change in plantar pressure. A decrease in the plantar
pressure of the medial longitudinal arch may suggest a reduction of hyper-pronation, further
supporting barefoot running as a way to decrease running related pain and injury.

10
CHAPTER II
Methods
Outlined in this chapter is information regarding how this study was organized and
includes: information regarding the subjects and recruitment, informed consent,
measurements/instruments, the study’s retraining program, post-survey, data analysis, and
ensuring internal validity.
Subjects
To ensure that the rights and welfare of human subjects in social behavioral and
biomedical research were protected, the investigators in this study obtained approval from the
Institutional Review Board of the University of North Dakota (UND). See Appendix A for the
approval letter. After approval, recruitment of subjects commenced. Subjects were recruited from
the first and second year physical therapy classes at the University of North Dakota. All students
received an email describing the study and inclusion/exclusion criteria for them to evaluate their
own interest and ability to participate. The inclusion criteria included: no pain in the lower
extremities in the past 3-months, age between 20-30, greater than 7 mm navicular drop, must run
with a rear foot striking pattern, no current use of NSAIDs, no cardiopulmonary pathologies or
significant medical history, and must currently complete a minimum of 2-10 miles of running per
week, not exceeding 25 miles over the past month. If any student was interested and qualified,
they attended the pre-testing to affirm that their navicular drop was greater than 7 mm, and if so
went through the entire pre-testing. Eleven subjects were interested in participating and met the
inclusion criteria. See Table 1 for subject demographics. The eleven subjects were randomly
assigned into either the shod running group or the barefoot running group by using small pieces

11
of paper with each one containing the name of subject, being put into a hat. The pieces of paper
were then randomly chosen with the first subject drawn being placed in the barefoot group and
the second subject being placed in the shod group with the alternating pattern continuing. Six
subjects were selected for the barefoot group and five for the shod group. Each subject was
informed of their assignment via email.
Informed Consent
Prior to the pre-testing, each subject filled out and signed an informed consent form. The
informed consent explained the details of the study to the subjects. See Appendix B for the
consent form in its entirety. The consent form described the purpose of the study as well as the
testing and training program protocols. Subjects were educated on the risks of taking part in the
study which included the chance of muscle strains, fatigue, tendinitis, stress fractures, delayed
onset muscle soreness (DOMS), and/or a general pain response. The benefits of participation
were also included and consisted of a potential decrease in navicular drop possibly leading to
injury prevention, improved cardiorespiratory fitness, decreased BMI, evidence that may impact
Mean N Percentage
Gender Male 5 45.5
Female 6 55.5
BMI 24.0667
Age 24.09
22 3 27.3
23 2 18.2
24 2 18.2
25 2 18.2
27 1 9.1
28 1 9.1
Weekly Running Miles 3.27
Don't Run 2 18.2
0-2 miles 2 18.2
4-6 miles 6 54.5
8-10 miles 1 9.1
Table 1: Subject Demographics

12
how physical therapists practice, and information that may alter how people train and exercise.
Subjects were informed there were no financial factors in this study leading to biases as there was
no funding for the study and there would be no cost or compensation for those taking part. It was
reiterated that this was a voluntary study and that each subject could leave at any time for any
reason, but it was requested that they inform the head researcher before doing so. The process of
maintaining patient confidentiality was described which included the five-digit code that would
be used to identify each subject. The code consisted of the first two digits being the subject’s
mother’s birth day, while the last three were the last three digits of the zip code of their residence
while attending high school.
Measurements/Instruments
Navicular Drop
The navicular drop test is a tool for measuring the height of the navicular bone in both
non-weight bearing and weight bearing scenarios and determining the difference. Navicular drop
is measured by palpating the navicular tuberosity and measuring the height from the floor with
the ankle in sub-talar neutral during sitting and again measured in natural stance.13–15 An analysis
by Menz and Munteanu30 assessment found navicular drop assessment to be a useful clinical
measure and valid test due to its accurate representation of the anatomical structure, compared to
their radiographic findings, of the medial longitudinal arch. Studies on the reliability of the
navicular drop test are contradictory. Picciano et al31 assessed the intra-tester and inter-tester
reliabilities of the navicular drop test with two inexperienced physiotherapy students and found
them both to be poor (intra-tester: 0.61 & 0.79, inter-tester: 0.57). The authors concluded the
navicular drop test could be a useful tool, but should be used by clinicians that are experienced
with the examination procedure to improve their reliability of the measurements.31 Another
study32 included low experienced physiotherapy students and experienced clinicians to assess the
reliability of the navicular drop test and deemed it reliable in both inter-tester (0.94)and intra-

13
tester (0.91)parameters.32 The difference in experience between the studies conducted by
Sporndly-Nees et al32 and Picciano et al31 appeared to have an impact on intra-tester reliability.
By receiving standardized training and practicing the particular method, the use of the navicular
drop test can be a reliable tool to assess the level of foot pronation.
Reliability Testing
The researcher assessing navicular drop, in this study, was blinded to subject assignment
throughout the study, and thus did not attend training sessions. Prior to pre-testing, the tester
assessed their reliability with navicular drop and foot length by recruiting twelve second year
physical therapy students to volunteer as subjects in an assessment whom were not involved in
the study. These student’s navicular drop and foot length were measured twice with one day off
between measurements. The same protocol was used for foot length measurements and navicular
drop testing as were performed in the pre- and post-testing protocols. The tester’s intra-rater
reliability was determined to be 0.97 for right foot length, 0.98 for left foot length, 0.91 for right
navicular drop height, and 0.85 for left navicular drop height. These results compared favorably
with a study by Vauhnik et al.33 They found their intra-rater reliability to be .78 for the dominant
leg and .88 for the non-dominant leg, which they considered moderate to good results for the use
of the navicular drop test in a clinical setting.33
During pre-testing, the subjects first entered the pre-testing room and provided a security
code to protect their privacy which consisted of a five-digit code where the first two digits were
their mother’s day of birth and the final three digits were the last three digits of the zip code of
their residence while attending high school. This was written on their 3”x5” pre-testing notecard.
Subjects filled out an informed consent form before proceeding. Subjects then removed their
shoes and sock and their height and weight were taken respectively using a Detecto™ Scale and
both were recorded on the notecard.

14
Next, each subject’s navicular drop was assessed bilaterally. The protocol performed in
this study was modeled off of Anthony Redmond’s Foot Posture Index©.34 They sat in a chair in
approximately 90 degrees of hip and knee flexion with their feet on the floor. In this position,
their foot length was measured using a segmometer from the right side of each foot, and this was
recorded on their notecard. The subject moved to a different chair and assumed the 90 degrees of
hip and knee flexion as before while sitting up tall with their feet on the ground. Their navicular
drop measurements were taken by the tester first palpating the most prominent portion of the
navicular bone on the right and marking it with a dot using a black fine point Sharpie permanent
marker, and the same step was repeated on the left foot. The tester then palpated the talus of the
right foot on the subject and put the ankle into sub-talar neutral. Participants were directed to
maintain that position as best as possible during the initial marking of the notecard. The subject’s
card was placed perpendicular to and touching the floor as well as the ankle. The height of the
navicular was measured by making a mark on the index card at the location of the center of the
dot. See Figure 1 for an illustration of this procedure. The same step was repeated on the left foot.
The subject was told to stand without moving their feet and stand in a relaxed foot posture. The
navicular height was measured in millimeters by measuring the distance between the two tick
marks for the right foot and then the two for the left foot using a McCoy Medical™ retractable
fiberglass tape measure. Subjects were directed out of the room to complete the active portion of
testing with the GAITRite®.
The post-testing procedure was similar to the pre-testing with a few exceptions. First, the
height of the subjects and their foot length were not measured as it was assumed that they would
not have changed from the training program and were thus deemed an insignificant factor in our
study. Second, each subject completed a paper based post-survey regarding their perceptions of
the study and of barefoot running.

15
GAITRite®
The GAITRite® system provided measurements of spatial and temporal parameters and
identified striking patterns and medial and lateral arch pressures of subjects during walking and
jogging. The GAITRite® system consists of a portable walkway embedded with pressure-
activated sensors which is pictured in Figure 2. The walkway detects the timing of sensor
activation distances between the activated sensors, and feeds this information into application
software that calculates spatial and temporal gait parameters for individual footfalls.35
Prior to initiation of the study, the GAITRite® system was tested appropriately by
researchers through multiple runs and walks on the embedded walkway in order to confirm
accurate measurements of walking and jogging speed. Each subject completed pre-testing a week
prior to beginning a 5-week retraining program. Post-testing was completed one week following
the retraining program. Pre and post testing procedures lasted approximately 2 hours in
conjunction with height, weight, and navicular drop measurements.
Figure 1. Navicular Drop Testing

16
With use of this system, each
of the subjects walked and jogged
barefoot on the GAITRite® in the
UND physical therapy hallway. Each
subject walked across the 16-foot
walkway at a comfortable pace three
times. Taped lines were utilized to
indicate the starting point, which were
placed three feet from the walkway to
ensure consistent starting and ending
points during post-testing. The
subjects were cued to engage in
walking through verbal commands to
allow enough time for the computer to
process information before beginning another trial. Therefore, each subject walked barefoot 22
feet on the GAITRite® system for each of the three trials. The GAITRite® system has proven to
be reliable and valid while walking barefoot through a number of different studies.29,35–37
McDonough et al36 concluded the GAITRite® system to be a valid and reliable tool for
measuring selected gait components: spatial and temporal parameters. The analysis of our data
will be strengthened secondary to using a valid and reliable instrument.
Following the three walking trials, the subjects jogged barefoot at a comfortable rate five
times across the GAITRite®. Taped lines were placed 55 feet in front of and three feet beyond
the GAITRite® to indicate when to begin and end jogging. Subjects were asked to jog through
the final taped line at a normal jogging speed. The total amount of jogging was approximately 75
feet. Following each trial, the subjects walked back to the starting position. Subjects were cued
Figure 2. GAITRite® System

17
with verbal commands and hand demonstrations of a thumbs up to begin jogging again. The
increase of speed created variability and uncertainty due to the system difficulties of detecting the
separation of right and left foot markings. Therefore, each of the trials were suspended allowing
time for researchers to process accurate correct data. The suspension mode in the GAITRite®
software enabled the researchers to save the walks in order to separate the footfalls at a later time.
Therefore, this aspect was useful for time management since the subjects were performing
multiple walks throughout pre and post testing. The three most accurate spatiotemporal patterns
of the five trials were used in data collection. Completing multiple trials allowed for walkway
malfunctions, computer glitches, and the best representation of the spatiotemporal patterns of
each subject. Although the GAITRite® system is valid and reliable when using step and stride
lengths while walking, there has been little to no documented research in measuring spatial and
temporal parameters while running at higher speeds. One study38 assessed the walk to run
transition using the GAITRite® system. The small sample size of three participants and
methodology of participants only asked to step at least one time on the GAITRite® mat while
running showed this study was not applicable. To accommodate the unreliable measures of
running on the GAITRite®, part of the retraining program included slower speeds including 4.0
mph for one minute and 5.0 mph for one minute.
Post Survey
At the post-testing, subjects began filling out the post-survey by writing their five-digit
code at the top of the form. Then, they answered demographics questions including gender, age,
height, and weight. Subjects were asked about their running activities prior to taking part in the
study such as weekly running mileage, use of orthotics, and their interest in barefoot running.
After this point, the subjects were asked if they were in the shod or barefoot running group and
directed to different portions of the survey accordingly. The remainder of post-survey included
opinionated questions on how subjects felt about the program including appropriateness of

18
intensity, structure, time to complete the program, and their opinions on barefoot running. The
post survey finished with a question that allowed subjects to report any and all injuries that they
incurred throughout the running program. See Appendix C for the post-survey in its entirety.
Retraining Program
All of the subjects were part of the retraining program designed by researchers based
on relevant literature. A common fear and risk with converting to an FFSP of running is doing too
much too soon. Utilizing a retraining program is vital to the success of converting as well as
staying injury free. Research conducted by Hart and Smith39 provided some general guidelines
for habituation programs. They suggested that during weeks 1-2 of the program, runners should
only run barefoot for 30 minutes total each week and use multiple sessions to reach that goal as
needed. Then during weeks 3-16, the athletes should be doing 1 session a week for 1 hour.39
Increasing to FFSP quickly should be reserved for more experienced runners. In a study involving
military personnel and with significant running experience and barefoot habituation programs,
weeks 1-3 involved 15-20 minutes of FFSP training drills and a 0.25 Km run with a 2-minute
walking interval between. During weeks 4-6, they progressed both the speed and endurance of the
program gradually.6 When working with novice runners, the progression should be more cautious
and slow. A study by Warne and Warrington40 used a 4 week program that gradually retrained the
runners into an FFSP. The runners performed two 15 minute runs in the first week and progressed
gradually to 3-4, 30 minutes runs in the 4th week.40 Despite the variation, caution and a slow
progression is safest when retraining to prevent injuries and optimize the benefits.
The subjects were randomly assigned to either the barefoot or shod group. Six subjects
were selected to run barefoot and five were selected to run in their preferred workout shoes. All
individuals engaged in an identical 5-week running programs on Tuesday and Thursday mornings
at the UND Wellness Center despite designated group. The routine consisted of an identical
19
warm-up, running program, and cool-down procedures in order to maintain consistent and
reliable measures.
Prior to the warm-up, subjects were asked how they were feeling and if any adverse
effects were present. The warm-up consisted of biking, dynamic stretching, and three minutes of
treadmill walking at 3.0 miles per hour (mph). Barefoot subjects wore socks on the treadmill to
comply with the UND Wellness health code while shod runners utilized their preferred footwear.
Each subject biked five minutes on either LifeFitness 95R Lifecyle® recumbent bike or
LifeCycle GX® upright exercise bike followed by dynamic stretches. The dynamic stretches
included: flexion/extension leg swings, abduction/adduction leg swings, lunge with a twist, knee
to chest, and hip stretch with a twist. Demonstrations of these exercises can be found in Figure 3.
Ten repetitions of leg swing stretches were performed on each leg while 5-repetitions of the
remaining three stretches were performed on individual legs. Following the stretches, each of the
subjects began walking at 3.0 mph for three minutes on a Precor TRM® 885 treadmill. A total of
three-minutes of the warm-up phase of the retraining program. Therefore, the total warm-up
consisted of 10-15 minutes.

20
Fig
ure
3.
Dyn
amic
Str
etch
es. (a
) F
lex
ion
/Exte
nsi
on l
eg s
win
gs
(b)
Knee
to c
hes
t (c
) L
unge
wit
h a
tw
ist.
(d)
Abduct
ion/A
dd
uct
ion l
eg s
win
gs
(e)
Hip
str
etch
wit
h a
tw
ist
(a )
(b )
(c )
(d )
(e )

21
Following the warm-up, the subjects began the retraining program designed by
researchers (see Appendix D). All subjects completed identical training speeds and time. After
three minutes of walking during the warm-up phase, the treadmill speed was increased to 4.0 mph
for one-minute then 5.0 mph for an additional minute progressing to 6.0 mph at the three-minute
mark. The subjects were asked to jog at these elevated speeds. Subjects in the barefoot group,
were instructed to run on their toes when the training program began. During the first week of the
retraining program, the subjects ran a total of 8-12 minutes on both days. Therefore, the runners
engaged in 6-10 minutes of running at 6.0 mph. The subjects were instructed to run to the
suggested time of 8 minutes but if they felt capable, they could continue toward the full training
schedule of 12 minutes. Following each run, the researchers recorded the amount of minutes each
subject ran on the exercise log sheet. Due to the intensity of the retraining program, if subjects
felt they were unable to complete the 8 minutes they were told to stop and perform cool down
immediately. Allowing the subjects the ability to terminate their daily training due to increased
symptoms was consistent throughout each week despite the increase of total time running. The
second week the subjects engaged in 12-16 minutes of running therefore, resulting in an increase
of four minutes from the previous week. The retraining program stayed consistent throughout the
process with a gradual increase of 4 minutes per week therefore, week three the subjects ran 16 to
20 minutes and week four 20 to 24 minutes. Finally, during the fifth week, the subjects were
running a total of 24 to 28 minutes. Subjects were reminded if they felt the mileage was too much
due to pain or discomfort, they could terminate the training for the day and begin the cool-down
process.
Following the retraining program, subjects walked for three minutes at 3.0 mph on the
Precor TRM® 885 treadmill to encourage adequate decrease in heart rate and provide adequate
recovery time cool-down. Subsequently, static stretches were performed 30 seconds on each leg
for two repetitions. These stretches, in order of performance, included: standing gastrocnemius

22
stretch leg straight, standing soleus stretch with knee bent, standing quadriceps stretch, seated
hamstring stretch by reaching hand toward toes while other leg is in butterfly position, standing
hip flexors stretch in lunge positioning with knee in contact with the floor, and supine piriformis
stretch of one leg straight and other knee bent and brought toward chest. Demonstrations of the
above seven stretches can be found in Figure 4. Following static stretching, the subjects had
concluded the cool-down and completed the retraining program for the day.

23
Fig
ure
4. S
tati
c S
tret
ches
. (a
) G
astr
ocn
emiu
s (b
) S
ole
us
(c)
Quad
rice
ps
(d)
Hip
Fle
xors
(e)
Ham
stri
ng (
f) P
irif
orm
is
(a)
(e)
(d)
(c)
(b)
(f)

24
Data Analysis
Data collected from the pre- and post-testing was processed and analyzed using the
Statistical Package for Social Sciences (SPSS) software. Independent variables included whether
the subject was placed in the shod or barefoot running group. Dependent variables included:
navicular drop height, heel-to-heel base of support, toe in/out angle peak pressure and pressure
area of foot divisions 6 and 8 from the GAITRite® system. Other dependent variables that may
considered for analysis include: BMI and weight change. All dependent variables were taken
bilaterally. Confounding variables include adverse effects during the study, subject running
outside of study, running surface, and efficacy of retraining program. The GAITRite® divides the
foot into twelve trapezoidal divisions in order to map the pressure to certain areas of the foot.
These twelve trapezoidal foot divisions were numbered starting from posterior-lateral at the heel
of the foot, running lateral to medial. Foot divisions 6 and 8 were used as these correlate with the
medial longitudinal arch, and will show any changes in foot pronation. According to the
GAITRite® Electronic Technical Reference41, pressure is represented by a switching level. Each
sensor along the GAITRite® pressure mat is activated when pressure is applied. Peak pressure for
a given foot division is the “maximal sectional switching level expressed as a percent of the
overall maximum switching level.” Sectional switching levels occur at the peak time of the
section. Further changes in pressure were not analyzed as these data were not pertinent to our
research question. Repeated measures paired sample t-tests were used to measure significance of
the change in navicular drop height and pressure changes along the medial longitudinal arch with
an α level of less than 0.05.
Ensuring Internal Validity
In order to ensure internal validity, the following steps were taken: all subjects completed
identical warm-up, retraining protocol, cool-down, pre- and post-testing were conducted in the
same order, fashion, time of day, and setting. Warm-up, retraining protocol, cool-down, pre- and

25
post-testing were discussed above. Navicular drop intra-rater reliability was assessed along with
testing of the GAITRite equipment prior to pre- and post-testing procedures.

26
CHAPTER III
Results
This chapter contains the results of this research as it pertains to the study’s three
research questions: Does a barefoot running retraining program reduce navicular drop height,
decrease the plantar area, and reduce the plantar pressure on the medial longitudinal arch of the
foot? Each of the three research questions were analyzed using repeated measures paired sample
t-tests to determine clinical significance (p < 0.05). The pre- and post-test results for navicular
drop and GAITRite® assessment from one subject in the shod running group were dropped
leaving results from four subjects to be analyzed in the shod group (N=4). The post-test
GAITRite® results from one subject in the barefoot running group were not included leading to
pre-test GAITRite® results from six subjects (N=6) being analyzed and post-test GAITRite®
results from 5 subjects being analyzed (N=5).
Question One: Navicular Drop Changes
The first research question intended to assess if a barefoot running retraining program
could decrease navicular drop. After Navicular Drop Testing was completed for post-testing, the
pre- and post-testing results were computed using paired sample T-tests to evaluate for
statistically significant change. The statistical analysis showed that there were no statistically
significant changes in either the barefoot running group or shod running group for navicular drop
height following the retraining program. Despite the lack of statistically significant results, the
barefoot group did show an overall reduction in navicular drop height bilaterally. The shod
running group displayed an overall reduction in left foot navicular drop height; however, the shod
group displayed an increase in right navicular drop height. Results are displayed in Table 2.
27
Question Two: Plantar Area Changes
The second research question proposed the gait retraining program will have an effect on
the plantar area resulting in a decrease of pressure on the medial arch. Following data collection
from the GAITRite®, paired sample t-tests were analyzed comparing pre- and post-test in order
to find statistical significance on plantar pressure area during walking and running. The barefoot
and shod running groups did not result in any significant differences for plantar pressure area
during walking or running. However, trends were found on pressure area which may lead to
clinical significance.
When analyzing the data, it is important to discuss the tendencies occurring in foot
pressure area despite the lack of statistical significance. Following the retraining program, the
barefoot running group displayed an overall decrease of pressure area in foot division six on both
right and left feet during walking and running. The barefoot group also demonstrated a decrease
in plantar area pressure in foot division eight on the left foot only while walking and running.
Interestingly, the right foot showed an increase in pressure area in foot division eight which
contradicts this hypothesis. The shod group results presented with an increase of area pressure in
foot divisions six and eight on the right foot while walking and running which supports the
research question of shod runners striking more on their medial arch due to increase of pronation.
All the other results for the shod group show a decrease in plantar pressure area while walking
and running. Results are shown in Table 3.
Running Group Foot Test Mean Mean Difference N Standard Deviation Standard Error Mean Significance
Right Pre-test 9.5 6 3.27109 1.33542
Right Post-test 8.3333 6 1.8619 0.76012
Left Pre-test 12 6 4 1.63299
Left Post-test 10.8333 6 2.78687 1.13774
Right Pre-test 13.25 4 2.98608 1.49304
Right Post-test 13.75 4 3.59398 1.79699
Left Pre-test 14 4 2.82843 1.41421
Left Post-test 12.5 4 3.69685 1.84842
0.482
0.363
0.604
0.103
Barefoot
Shod
(-) 1.1667
(-) 1.1667
(+) 0.5
(-) 1.5
Table 2: Navicular Drop Results

28
Ru
nn
ing
Gro
up
Wa
lkin
g/R
un
nin
gFo
ot
Foo
t D
ivis
ion
Me
an
Me
an
Dif
fere
nce
NSt
d. D
evi
ati
on
Std
. Err
or
Me
an
Sig
nif
ica
nce
Pre
-te
st0
.78
20
1.4
89
87
0.6
66
29
Po
st-t
est
0.1
34
00
.29
96
30
.13
40
0
Pre
-te
st0
.77
20
0.4
38
03
0.1
95
89
Po
st-t
est
0.8
98
00
.83
86
70
.37
50
7
Pre
-te
st0
.27
80
0.6
21
63
0.2
78
00
Po
st-t
est
0.1
88
00
.42
03
80
.18
80
0
Pre
-te
st0
.91
60
0.6
13
54
0.2
74
38
Po
st-t
est
0.4
68
00
.36
39
60
.16
27
7
Pre
-te
st0
.99
60
1.2
59
69
0.5
63
35
Po
st-t
est
0.4
34
00
.78
02
40
.34
89
4
Pre
-te
st2
.27
00
0.6
65
47
0.2
97
61
Po
st-t
est
3.6
16
02
.37
96
31
.06
42
0
Pre
-te
st1
.36
60
2.9
27
59
1.3
09
26
Po
st-t
est
0.9
62
01
.72
19
10
.77
00
6
Pre
-te
st2
.72
00
1.6
05
88
0.7
18
17
Po
st-t
est
2.7
44
01
.91
52
10
.85
65
1
Pre
-te
st0
.09
50
0.1
17
05
0.0
58
52
Po
st-t
est
0.1
87
50
.23
59
90
.11
80
0
Pre
-te
st1
.70
75
0.6
70
14
0.3
35
07
Po
st-t
est
1.8
07
50
.38
12
60
.19
06
3
Pre
-te
st0
.17
25
0.2
49
98
0.1
24
99
Po
st-t
est
0.0
45
00
.09
00
00
.04
50
0
Pre
-te
st1
.07
00
0.4
65
83
0.2
32
92
Po
st-t
est
0.7
50
00
.36
60
60
.18
30
3
Pre
-te
st2
.44
25
2.0
59
08
1.0
29
54
Po
st-t
est
1.5
05
00
.55
54
90
.27
77
4
Pre
-te
st4
.66
75
2.3
27
05
1.1
63
52
Po
st-t
est
3.0
10
00
.57
28
90
.22
86
4
Pre
-te
st1
.84
00
1.8
98
02
0.9
49
01
Po
st-t
est
0.8
72
50
.60
91
20
.30
45
6
Pre
-te
st4
.57
50
2.3
16
27
1.1
58
13
Po
st-t
est
3.2
02
51
.35
84
40
.67
92
2
0.3
01
Left
Div
isio
n 6
-0.4
04
05
0.4
98
Div
isio
n 8
0.0
24
05
0.8
79
0.0
95
Ru
nn
ing
Rig
ht
Div
isio
n 6
-0.5
62
05
0.0
82
Div
isio
n 8
1.3
46
05
Left
Div
isio
n 6
-0.0
90
05
0.3
74
5
0.4
03
Div
isio
n 8
0.1
26
05
0.7
50
5
Ba
refo
ot
Wa
lkin
g
Rig
ht
Div
isio
n 6
-0.6
48
0
Div
isio
n 8
-0.4
48
0
Sho
d
Wa
lkin
g
Rig
ht
Div
isio
n 6
0.0
92
5
Left
Div
isio
n 6
-0.1
27
5
Ru
nn
ing
Rig
ht
Div
isio
n 6
-0.9
37
5
Left
Div
isio
n 6
-0.9
67
5
40
.36
1
Div
isio
n 8
0.1
00
04
0.5
85
40
.22
3
Div
isio
n 8
-0.3
20
04
0.4
04
40
.40
6
Div
isio
n 8
-1.6
57
54
0.2
51
40
.23
4
Div
isio
n 8
-1.3
72
54
0.1
10
Tab
le 3
: Pla
nta
r P
ress
ure
Are
a

29
Question Three: Plantar Pressure Changes
The third research question speculated that a gait retraining program will have a decrease
in plantar pressure in the medial longitudinal arch of the foot. After the data from the GAITRite®
was collected during post-testing, paired-sample t-tests were conducted to compare pre- and post-
test data in order to measure significant differences. In the barefoot group, the peak plantar
pressure of foot division six had a statistically significant decrease of 0.70 to 0.2920 (p=0.035).
No other statistically significant changes in peak plantar pressure were noted in the barefoot
group during running or walking. No statistically significant changes in peak plantar pressure
were noted in the shod running group during running or walking. Results are shown in table 4.
Although there was only one statistically significant change in the peak plantar pressure,
it is important to note any trends that a retraining program may have on peak plantar pressure.
After the completion of the retraining program, the barefoot group displayed an overall decrease
in peak plantar pressure of foot division 6during walking on both the right and the left foot. Foot
division 8 showed an overall decrease during walking on the left and no change on the right foot.
During running, foot division 6 demonstrated an overall decrease in peak plantar pressure in both
right and left feet. Foot division 8 had no change on the right and a decrease on the left foot.
When comparing the barefoot running group to the shod running group there was an increase in
foot division eight while walking, and all other results show a decrease in peak plantar pressure
while walking and running.

30
Running Group Walking/Running Foot Foot Division Mean Mean Difference N Std. Deviation Std. Error Mean Significance
Pre-test 0.782 1.48987 0.66629
Post-test 0.134 0.29963 0.134
Pre-test 1.204 1.10119 0.49247
Post-test 1.234 1.46948 0.65717
Pre-test 0.286 0.6952 0.286
Post-test 0.18 0.40249 0.18
Pre-test 1.768 1.44325 0.64544
Post-test 0.662 0.50549 0.22606
Pre-test 0.7 0.82671 0.36972
Post-test 0.292 0.6092 0.27244
Pre-test 4.136 1.37158 0.61339
Post-test 4.13 1.04437 0.46705
Pre-test 0.608 1.32075 0.59066
Post-test 0.516 0.91703 0.40729
Pre-test 3.3 1.45064 0.64874
Post-test 4.608 2.5824 1.15488
Pre-test 0.313 0.53575 2.6787
Post-test 0.285 0.38726 0.19363
Pre-test 3.278 1.39416 0.69708
Post-test 2.303 1.36353 0.68177
Pre-test 0.113 0.18715 0.09357
Post-test 0.023 0.045 0.0225
Pre-test 2 1.76467 0.88234
Post-test 1.045 0.58552 0.29276
Pre-test 1.23 1.81205 0.90603
Post-test 1.01 0.98207 0.49104
Pre-test 6.57 2.09082 1.04541
Post-test 3.925 0.87291 0.43645
Pre-test 1.373 1.46322 0.73161
Post-test 0.82 0.75202 0.37601
Pre-test 6.615 1.49743 0.74872
Post-test 4.775 2.57804 1.28902
4 0.226
Division 8 -1.84 4 0.099
4 0.336
Division 8 -2.645 4 0.085
4 0.297
Division 8 -0.955 4 0.459
4 0.796
Division 8 -0.975 4 0.377
Shod
Walking
Right
Division 6 -0.0275
Left
Division 6 -0.09
Running
Right
Division 6 -0.22
Left
Division 6 -0.5525
Running
Walking
Barefoot
Division 6
Division 8
Division 6
Division 8
Right
Left
Right
Left
Division 8
0.341
0.973
Division 6
Division 8
Division 6
0.035
-0.006 0.995
-0.092 0.6565
51.308 0.322
-0.648
0.374
0.03
0.096
-0.106
-1.106
-0.408
5
5
5
5
5
5
Table 4: Plantar Peak Pressure

31
Post Survey Results
Other data noted concern the survey given to the subjects after the completion of the gait
retraining program. The subjects answered questions regarding interest in barefoot running,
retraining program structure, intensity, and time to complete, any adverse effects obtained during
the program, whether they would continue with barefoot running after the conclusion of the
study, and any other comments they have regarding the retraining program. Six subjects agreed or
were neutral to interest in barefoot running prior to the study. One subject strongly agreed with
the intensity of the program, eight subjects agreed with the intensity of the program, and one
subject was neutral to the intensity of the program. All eleven subjects either agreed or strongly
agreed with the structure of the program. All eleven subjects agreed or strongly agreed that the
program allowed an appropriate amount of time to complete the program. Five of the subjects had
adverse of effects during the running program, most notably pain along the heads of the
metatarsals and blisters developing while running. Nine of the subjects felt supervised instruction
from a professional would be the most helpful when transitioning to barefoot running. Ten
subjects reported not being interested in transitioning to barefoot running after the study if given
the proper resources, with one stating they would transition to barefoot running. Four subjects
stated a fear of injury would be the most prevalent barrier to beginning a retraining program,
whereas five subjects stated a lack of adequate training surfaces would be the most prevalent
barrier to starting a retraining program. Some comments the subject had after the completion of
the retraining program included allowing the runner to choose their own running speed. Results
of the survey can be seen in Table 5. Overall, this study showed statistically significant changes
only in foot division six in regards to peak plantar pressure. There were no other statistically
significant changes to note from the results of this study. What these results mean to the clinician,
limitations to the study, and future research will be discussed in the next section.

32
Tab
le 5
: Po
st-S
urv
ey R
esu
lts

33
CHAPTER IV
Discussion
This research study proposed that barefoot running may promote a decreased navicular drop
height, plantar pressure area, and plantar pressure along the medial longitudinal arch. This study
investigated changes by utilizing the navicular drop height in standing and the GAITRite®
system to measure plantar pressure of the foot during walking and running. Habitual shod runners
will be conditioned to perform a heel-to-toe running gait pattern and may have difficulty
transitioning to a toe to heel pattern since approximately 75% of shod runners heel strike.40 This
led the researchers to question the effects barefoot running may have on navicular drop and
plantar pressure of the foot while walking and running. The results of the study indicate that there
was no statistical significance between the barefoot group and the shod group in the navicular
drop height and plantar pressure area. However, the barefoot group showed a significant change
in plantar pressure along cell six of the right foot while running when compared to the shod
running group.
Since this study found no statistically significant changes in navicular drop height or
plantar pressure area, the benefits of barefoot running may not have occurred due to the limited
amount of changes noted in navicular drop height and plantar pressure area. There may, however,
be benefits from a decreased plantar pressure in cell six of the foot which correlates with the
navicular bone. Therefore, barefoot running may assist the runner during pronation. This is
especially important because dynamic navicular drop is a more significant factor of pronation as
opposed to static navicular drop. Since dynamic navicular drop is related to the level of pronation,
we can utilize barefoot running to create adaptations in the running in order to reduce hyper-

34
pronation. This is relevant because researchers have shown that reducing hyper-pronation can
reduce the risk of running related injuries.5–7,24
Adverse Effects
While conducting a retraining program, there is an increased chance of acquiring any
adverse effects from a change in stress to the feet. This study found a high incidence of adverse
effects from the retraining program, most notably pain located at the heads of the metatarsals.
These adverse effects may be attributed to the running surface or to a rapid progression of the
retraining program. Other adverse effects to this study occurred, however, they are not
attributable to any injuries acquired during the retraining program.
Limitations
Limitations were noted while conducting this study that could have affected the results of
the retraining program. The small sample size (N=11) and narrow population of only physical
therapy students did not allow for a diverse patient population. Having a more diverse group of
subjects brings more relevance to the clinical setting. Also, the navicular drop tester did not
remain blinded to subject group assignments which may have hindered unbiased results. This was
partially due to the close interaction of the researchers and subjects on a daily basis, but it could
be corrected by opening up the subject population to a more public audience.
Time constraints were a significant factor in the results of this study. Due to the deadlines
for completing the research, the training program was shorter than ideal which lead to a
progression that was too aggressive. This vigorous advancement may have been a contributing
factor causing the adverse side effects that were reported in the post survey. Also, the short time
duration may have not allowed sufficient time for the training program to induce sufficient
results. Allowing more time for a longer training program with a slower progression could lead to
less adverse effects while also enhancing the benefits of barefoot running.

35
The running surface on the treadmill may have contributed to adverse effects specifically
pain on metatarsal heads and blisters because of the friction of the socks and landing on a hard
surface. A more natural way to begin barefoot running would be starting on a softer surface such
as grass; therefore, subjects would be able to absorb the initial impact of barefoot running. The
reason for treadmill use in this study was to keep the same variables for all subjects. Also,
researchers were present and available while runner's performed the retraining program to
subjectively assess the adverse effects of each subject. Another factor contributing to the poor
running surface was the need for subjects in the barefoot running group to wear socks while
running on the treadmills. This was a requirement by the UND Wellness Center to maintain their
sanitation standards. The socks could have caused slight slipping on the treadmill surface which
could have caused some adverse forces on the structures of the foot and ankle. Having the
subjects run in a true barefoot fashion could have avoided some of the adverse effects noted in the
post survey results.
Due to limited resources, researchers were unable to directly measure dynamic navicular
drop. The incapability of doing a dynamic navicular drop was addressed with use of the static
navicular drop test therefore, this study still obtained relevant data related to the navicular drop
height. Along with only providing static measurements of navicular drop, the GAITRite®
mapping system providing occasionally inconsistent spatiotemporal and area measurements. This
may be the result of the increase of subject's speed on the embedded walkway and glitches within
the actual mat. The GAITRite® is not accustomed to accurately measure jogging speed because
the system's software is created for measuring walking speeds therefore, the data acquired from
the GAITRite® often times had to be edited based on accuracy of subject's footfalls.
Future Research
In order to address some of these limitations, future researchers can create an ongoing
study throughout the year to increase our sample size and open our sample population to more

36
students or to the public. Opening the study to the public may also assist in maintaining the
assessor’s blindness to the study. Future researchers may also change the running surface, such as
running on grass in barefoot rather than in socks on a treadmill or concrete. By utilizing a softer
surface, the runners will be able to tolerate the changes from RFSP to FFSP. This may decrease
the incidence of adverse effects during the retraining program.
Future research may also investigate correlations between pressure mapping systems and
dynamic navicular drop, increased length in the retraining program with a slower progression, or
utilize more specialized research tools. We propose a study that investigates the use a treadmill
mapping system to assess dynamic navicular drop. Also, future research ventures could look at
the optimal time length and intensity of a barefoot retraining program to assess running
adaptations. A more clinically relevant study could be performed as well on injured runners to
determine the efficacy of a barefoot retraining program being used in a clinical setting.
The results of the current study showed only one statistically significant change in the
pressure area of the foot. Other improvements were made in all areas assessed but did not reach
statistical significance. This illustrates that adaptations may occur from barefoot running and may
be used in a clinical setting. It is up to future research to expand on the knowledge of the clinical
use of barefoot running retraining programs.

37
APPENDIX A

38
APPENDIX B INFORMED CONSENT DOCUMENT TEMPLATE: NON-MEDICAL PROJECTS
IC 701- B 04/18/2013
THE UNIVERSITY of NORTH DAKOTA
INSTRUCTIONS FOR WRITING AN INFORMED CONSENT DOCUMENT
NON-MEDICAL CONSENT TEMPLATE
INSTRUCTIONS:
This consent document template is recommended for non-medical studies because it
contains all required elements of consent.
The text in bold throughout this document offers suggestions and guidance. It should be
deleted and replaced with information specific to your study. The headers and footers are
not meant to be edited and should remain on your consent document.
CONSENT DOCUMENT INSTRUCTIONS:
Consent documents should be written in the second person (e.g., “You are invited to
participate”). Use of the first person (e.g., “I understand that…”) can be interpreted as
suggestive and can constitute coercive influence over a subject.
The consent form should be written at about an eighth grade reading level. Clearly define
complicated terms and put technical jargon in lay terms.
The consent form must be signed and dated by the subject or the subject’s legally
authorized representative. The signed consent from each subject must be retained by the
investigator and a copy of the consent form must be provided to the subject.
CONSENT DOCUMENT FORMAT:
To facilitate the IRB review process, the sample format below is recommended for consent
forms.
Prepare the entire document in 12 point type, with no blank pages or large blank
spaces/paragraphs, except for a 2 inch by 2 ½ inch blank space on the bottom of each page
of the consent form for the IRB approval stamp.
Multiple page consent documents should contain page numbers and a place for the subject
to initial each page.
ASSISTANCE
If you have questions about or need assistance with writing an informed consent please call
the Institutional Review Board office at 701 777-4279.

39
THE UNIVERSITY OF NORTH DAKOTA
CONSENT TO PARTICIPATE IN RESEARCH
TITLE: Barefoot versus Shod Running: Training Effects on Navicular Drop and Foot Pressure
Analysis
PROJECT DIRECTOR: Gary Schindler
PHONE # 701-777-6081
DEPARTMENT: Physical Therapy
STATEMENT OF RESEARCH
A person who is to participate in the research must give his or her informed consent to such
participation. This consent must be based on an understanding of the nature and risks of the
research. This document provides information that is important for this understanding. Research
projects include only subjects who choose to take part. Please take your time in making your
decision as to whether to participate. If you have questions at any time, please ask.
WHAT IS THE PURPOSE OF THIS STUDY?
You are invited to be in a research study that is interested in investigating how training barefoot
running versus shod (shoe) running effects navicular drop (the amount that the navicular bone
drops to the ground with weight bearing activities) and foot pressure. Literature identifies the
barefoot runners complete more of a forefoot strike than shod runners (rear foot) which can lead
to more gastrocnemius (calf) and quadriceps (thigh) activation creating more supinated
(walking/running more on the outside of the foot) foot mechanics. This study aims to investigate
whether training in barefoot running versus shod running reduces the amount of navicular drop
and reduces the amount of medial arch pressure during walking and running activities. You have
been identified as a potential participant because you are a first or second year physical therapy
student at the University of North Dakota, a novice runner, and meet this study’s inclusion
criterion.
The purpose of this research study is to understand what effect barefoot training has on navicular
motion during walking and running activities, which may assist in future injury prevention.
HOW MANY PEOPLE WILL PARTICIPATE?
A minimum of 6 participants will be take part in this study at the University of North Dakota.
Each participant will be randomly placed in either the shoe running group or barefoot running
group with each group having a minimum of 3 participants. Each group will complete pre- and
post-test navicular drop, walking/running pressure analysis utilizing the GAITRite ® system, and
complete a post-survey analysis to determine compliance and training schedule. The GAITRite
® system is an instrument to measure the foot pressure along the bottom of your foot during
walking and running activities and will be used to determine if changes occur between training
groups. In between the pre- and post-tests each individual will complete a 6-week training
schedule involving running on a treadmill with a gradual progression of distance and time per
week as symptoms allow. Surveys will be completed at the time of the post-testing at the School
of Medicine and Health Sciences in the Physical Therapy Department on the campus of the
University of North Dakota.

40
HOW LONG WILL I BE IN THIS STUDY?
Your participation in the study will last approximately 8 weeks. Each participant will complete a
pre-test navicular drop test and a walking/running pressure analysis utilizing the GAITRite ®
system. Following the pre-testing, each participant will complete a 6-week training program in
either the barefoot running or shod running groups with a gradual progression of both distance
and time per week as symptoms allow. Following the 6-week training period, each participant
will complete a post-test navicular drop test and a walking/running pressure analysis utilizing the
GAITRite ® system and complete a post-survey analysis to determine compliance and training
schedule.
WHAT WILL HAPPEN DURING THIS STUDY? Those who choose to participate will be screened to determine qualification to participate in the
study according to the inclusion criteria which includes: no pain in the lower extremities in the
past 3-months, age between 20-30, greater than 7 mm navicular drop, must be a rear foot striker,
no current use of NSAIDs, no cardiopulmonary pathologies or significant medical history, and
must currently complete between 2-10 miles of running per week. If you are included in this
research, this study will take place over approximately an 8-week period. A bilateral navicular
drop test and foot pressure analysis will be performed on you prior to beginning the program.
Then you will be randomly placed into either the barefoot or shod group. Each group will
complete the same 6-week training program. You will run 2 mornings per week (Monday and
Thursday) progressing from 8-12 minutes per session during the first week in 4 minute
increments to 28-32 per session during the sixth week as tolerated. After completing the program,
a navicular drop test and foot pressure analysis will be performed again, and each participant will
complete a survey. No personal identifications are used on any written document and all
descriptions of participants are anonymous. Participants are allowed to skip any questions in the
survey that he/she would prefer not to answer.
WHAT ARE THE RISKS OF THE STUDY?
There are no foreseeable risks of physical, emotional, or financial risks to the participants with
this study; however, since physical activity is taking place there may be a chance of muscle
strains, fatigue, tendinitis, stress fractures, delayed onset muscle soreness (DOMS), or a general
pain response, but minimal risk is anticipated. A certified athletic trainer, licensed physical
therapist, sports/orthopedic specialist, and certified strength and conditioning specialist will be on
site for all training sessions to answer any questions and to direct activity progression to limit
adverse reactions. If adverse reactions occur the participant will be evaluated by the primary
investigator and will be referred for further medical evaluation if deemed necessary.
WHAT ARE THE BENEFITS OF THIS STUDY?
Each participant may not benefit personally from being in this study. It is possible that the
participants may see a decrease in their navicular drop and decreased medial arch pressure which
may aid in injury prevention. Participants may also see improved cardiorespiratory fitness and a
decrease in BMI. Also, we hope that in the future other people might benefit because a better
understanding of how barefoot running training may affect navicular placement and movement
and alter foot pressure, which may assist in reduced pain, improved function, and prevention of
future overuse injuries for some patients. It will also provide evidence supporting or refuting the
impact barefoot running training may have on arch dynamics. This research may impact how
physical therapists practice clinically, therefore impacting the lives of their patients and their

41
families. This research may lead to alterations in exercise training that may lead to less future
injuries.
WILL IT COST ME ANYTHING TO BE IN THIS STUDY?
You will not have any costs for participating in this research study.
WILL I BE PAID FOR PARTICIPATING?
You will not be paid for participating in this research study.
WHO IS FUNDING THE STUDY?
No funding is needed for this study. The University of North Dakota and the research team are
receiving no payments from any agencies, organizations, or companies to conduct this research
study. Treadmills at the Wellness Center on the campus of the University of North Dakota will be
utilized for this study.
CONFIDENTIALITY
The records of this study will be kept private to the extent permitted by law. In any report about
this study that might be published, you will not be identified. Your study record may be reviewed
by Government agencies, the UND Research Development and Compliance office, and the
University of North Dakota Institutional Review Board.
Any information that is obtained in this study and that can be identified with you will remain
confidential and will be disclosed only with your permission or as required by law. You should
know, however, that there are some circumstances in which we may have to show your
information to other people. For example, the law may require us to show your information to a
court or to tell authorities if we believe you have abused a child, or you pose a danger to yourself
or someone else. Confidentiality will be maintained with anonymous surveys conducted. All
data collections will be kept anonymous by means of a 5-digit code that will include the
participant’s mother’s or father’s day of birth and the last three digits of their zip code while in
high school. Consent forms will be kept in a locked and secure location for a minimum of three
years, with only Gary Schindler having access to the consent forms and personal data.
If we write a report or article about this study, we will describe the study results in a summarized
manner so that you cannot be identified.
IS THIS STUDY VOLUNTARY?
Your participation is voluntary. You may choose not to participate or you may discontinue your
participation at any time without penalty or loss of benefits to which you are otherwise entitled.
Your decision whether or not to participate will not affect your current or future relations with the
University of North Dakota.
If you decide to leave the study early, we ask that you inform Gary Schindler that you would like
to withdraw.

42
CONTACTS AND QUESTIONS?
The researchers conducting this study are Gary Schindler. You may ask any questions you have
now. If you later have questions, concerns, or complaints about the research please contact Gary
Schindler at 701-777-6081 or at [email protected].
If you have questions regarding your rights as a research subject, you may contact The University
of North Dakota Institutional Review Board at (701) 777-4279 or [email protected].
You may also call this number about any problems, complaints, or concerns you have
about this research study.
You may also call this number if you cannot reach research staff, or you wish to talk with
someone who is independent of the research team.
General information about being a research subject can be found by clicking
“Information for Research Participants” on the web site:
http://und.edu/research/resources/human-subjects/research-participants.cfm
Your signature indicates that this research study has been explained to you, that your questions
have been answered, and that you agree to take part in this study. You will receive a copy of this
form.
Subjects Name: ______________________________________________________
__________________________________ ___________________
Signature of Subject Date
I have discussed the above points with the subject or, where appropriate, with the subject’s
legally authorized representative.
__________________________________ ___________________
Signature of Person Who Obtained Consent Date

43
APPENDIX C
Barefoot Running Survey
Q1 Gender
Male (1)
Female (2)
Q2 Age in years _____
Q3 What ethnicity do you most associate with?
Caucasian (1)
Hispanic (2)
African American (3)
Asian (4)
Native American (5)
Pacific Islander (6)
Q4 Weekly running mileage prior to this study
I did not run (1)
0-2 miles (2)
2-4 miles (3)
4-6 miles (4)
6-8 miles (5)
8-10 miles (6)
10+ miles (7)
Q5 Do you currently use orthotics?
Yes, while running (1)
Yes, while walking (2)
Yes, during running and walking (3)
No (4)
Q6 I was interested in barefoot running prior to this study?
Strongly Agree (1)
Agree (2)
Neutral (3)
Disagree (4)
Strongly Disagree (5)

44
Q7 I felt the training intensity was appropriate?
Strongly Agree (1)
Agree (2)
Neutral (3)
Disagree (4)
Strongly Disagree (5)
Q8 I felt the program was well structured?
Strongly Agree (1)
Agree (2)
Neutral (3)
Disagree (4)
Strongly Disagree (5)
Q9 I felt there was sufficient amount of time to complete the program?
Strongly Agree (1)
Agree (2)
Neutral (3)
Disagree (4)
Strongly Disagree (5)
Q10 Did you have any adverse effects from this study? If yes, please describe the injury and
where it occurred.
Yes (1) ____________________
No (2)
Q11 Did you abide by the study's protocol? If no, please describe what you did outside of the
program (i.e. run additional miles, started resistance training program, etc.).
Yes (1)
No (2) ____________________
Q12 What do you feel is the most prevalent barrier to starting barefoot running?
Fear of possible injury (1)
Lack of adequate instruction (2)
Lack of adequate training surfaces (3)
Fear of decline in performance (4)
Other (5) ____________________
Q13 Which resource would be the most helpful when transitioning to barefoot running?
Supervised instruction by a reputable coach or running professional (1)
Internet (2)
Book on barefoot running (3)
Other (4) ____________________

45
Q14 I would start or continue barefoot running if given the proper resources?
Strongly Agree (1)
Agree (2)
Neutral (3)
Disagree (4)
Strongly Disagree (5)
Q15 Which of the following best describes your perception of barefoot running? (Click all that
apply)
I felt great while running barefoot (1)
I will continue to always run barefoot (2)
I would recommend barefoot running to my friends (3)
I would not recommend barefoot running to my friends (4)
I never want to run barefoot again (5)
**I was placed in the shod running group (6)
Q16 Is there anything else you would like to comment on regarding this study?

46
APPENDIX D
Exe
rcis
e Lo
g Sh
eet

47
References
1. Lieberman DE, Venkadesan M, Werbel WA, et al. Foot strike patterns and collision forces
in habitually barefoot versus shod runners. Nature. 2010;463(7280):531-535.
doi:10.1038/nature08723.
2. Almeida MO, Davis IS, Lopes AD. Biomechanical Differences of Foot-Strike Patterns
During Running: A Systematic Review With Meta-analysis. J Orthop Sport Phys Ther.
2015;45(10):738-755. doi:10.2519/jospt.2015.6019.
3. Boling MC, Padua D a, Marshall SW, Guskiewicz K, Pyne S, Beutler A. A prospective
investigation of Biomechanical Risk Factors for Patellofemoral Pain Syndrome. The Joint
Undertakeing to monitor and prevent ACL injury cohort. Am J Sports Med.
2009;37(11):2108-2116. doi:10.1177/0363546509337934.A.
4. Bennett JE, Reinking MF, Pluemer B, Pentel a, Seaton M, Killian C. Factors contributing
to the development of medial tibial stress syndrome in high school runners. J Orthop
Sports Phys Ther. 2001;31(9):504-510. doi:10.2519/jospt.2001.31.9.504.
5. Krivickas LS. Anatomical Factors Associated with Overuse Sports Injuries. Sport Med.
1997;24(2):132-146. doi:10.2165/00007256-199724020-00005.
6. Diebal AR, Gregory R, Alitz C, Gerber JP. Forefoot running improves pain and disability
associated with chronic exertional compartment syndrome. Am J Sports Med.
2012;40(5):1060-1067. doi:10.1177/0363546512439182.

48
7. Davis IS, Cheung RTH. Landing Pattern Modification to Improve Patellofemoral Pain in
Runners: A Case Series. J Orthop Sports Phys Ther. 2011;41(12):914-919.
doi:10.2519/jospt.2011.3771.
8. Barton CJ, Bonanno DR, Carr J, et al. Running retraining to treat lower limb injuries: a
mixed-methods study of current evidence synthesised with expert opinion. Br J Sports
Med. February 2016. doi:10.1136/bjsports-2015-095278.
9. Sinclair J, Atkins S, Richards J, Vincent H. Modelling of Muscle Force Distributions
during Barefoot and Shod Running. J Hum Kinet. 2015;47(1):9-17. doi:10.1515/hukin-
2015-0057.
10. Squadrone R, Gallozzi C. Biomechanical and physiological comparison of barefoot and
two shod conditions in experienced barefoot runners. J Sports Med Phys Fitness.
2009;49(1):6-13. doi:10.1002/jbm.b.31861.
11. Rooney BD, Derrick TR. Joint contact loading in forefoot and rearfoot strike patterns
during running. J Biomech. 2013;46(13):2201-2206. doi:10.1016/j.jbiomech.2013.06.022.
12. Yong JR, Silder A, Delp SL. Differences in Muscle Activity between Natural Forefoot
and Rearfoot Strikers during Running. J Biomech. 2014;47(15):3593-3597.
doi:10.1016/j.jbiomech.2014.10.015.
13. Cooper DM, Leissring SK, Kernozek TW. Plantar loading and foot-strike pattern changes
with speed during barefoot running in those with a natural rearfoot strike pattern while
shod. Foot. 2015;25(2):89-96. doi:10.1016/j.foot.2015.02.001.
14. Thompson MA, Lee SS, Seegmiller J, McGowan CP. Kinematic and kinetic comparison
of barefoot and shod running in mid/forefoot and rearfoot strike runners. Gait Posture.
2015;41(4):957-959. doi:10.1016/j.gaitpost.2015.03.002.

49
15. Heiderscheit BC, Chumanov ES, Michalski MP, Wille CM, Ryan MB. Effects of step rate
manipulation on joint mechanics during running. 2012;43(2):296-302.
doi:10.1249/MSS.0b013e3181ebedf4.Effects.
16. McCallion C, Donne B, Fleming N, Blanksby B. Acute differences in foot strike and
spatiotemporal variables for shod, barefoot or minimalist male runners. J Sport Sci Med.
2014;13(2):280-286.
17. Moore KL, Agur AMR, Dalley AF. Clinically Oriented Anatomy. 7th ed. Wolters Kluwer;
2013.
18. Moore KL, Dalley II AF, Agur AMR. Clinically Oriented Anatomy. 7th Ed. Baltimore,
MD: Lippincott Williams & Wilkins; 2014.
19. Olin ED, Gutierrez GM. EMG and tibial shock upon the first attempt at barefoot running.
Hum Mov Sci. 2013;32(2):343-352. doi:10.1016/j.humov.2012.11.005.
20. Adhikari U, Arulsingh W, Pai G, Raj JO. Normative values of Navicular drop test and the
effect of demographic parameters - A cross sectional study. 2014;5(7):40-48.
21. Nielsen RG, Rathleff MS, Simonsen OH, Langberg H. Determination of normal values for
navicular drop during walking: a new model correcting for foot length and gender. J Foot
Ankle Res. 2009;2:12. doi:10.1186/1757-1146-2-12.
22. Williams DS, McClay IS, Hamill J. Arch structure and injury patterns in runners. Clin
Biomech. 2001;16(4):341-347. doi:10.1016/S0268-0033(01)00005-5.
23. Barton CJ, Bonanno D, Levinger P, Menz HB. Foot and ankle characteristics in
patellofemoral pain syndrome: a case control and reliability study. J Orthop Sport Phys
Ther. 2010;40(5):286-296. doi:10.2519/jospt.2010.3227.

50
24. Hoffman SE, Peltz CD, Haladik JA, Divine G, Nurse MA, Bey MJ. Dynamic in-vivo
assessment of navicular drop while running in barefoot, minimalist, and motion control
footwear conditions. Gait Posture. 2015;41(3):825-829.
doi:10.1016/j.gaitpost.2015.02.017.
25. Robbins SE, Hanna AM. Running-related injury prevention through barefoot adaptations.
Med Sci Sports Exerc. 1987;19(2):148-156.
http://www.ncbi.nlm.nih.gov/pubmed/2883551.
26. Scafetta N, Marchi D, West BJ. Understanding the complexity of human gait dynamics.
Chaos. 2009;19(2):1-10. doi:10.1063/1.3143035.
27. Lohman III EB, Balan Sackiriyas KS, Swen RW. A comparison of the spatiotemporal
parameters, kinematics, and biomechanics between shod, unshod, and minimally
supported running as compared to walking. Phys Ther Sport. 2011;12(4):151-163.
doi:http://dx.doi.org/10.1016/j.ptsp.2011.09.004.
28. Titianova EB, Mateev PS, Tarkka IM. Footprint analysis of gait using a pressure sensor
system. J Electromyogr Kinesiol. 2004;14(2):275-281. doi:10.1016/S1050-
6411(03)00077-4.
29. van Uden CJT, Besser MP. Test-retest reliability of temporal and spatial gait
characteristics measured with an instrumented walkway system (GAITRite). BMC
Musculoskelet Disord. 2004;5(1):13. doi:10.1186/1471-2474-5-13.
30. Menz HB, Hons B, Munteanu SE, Hons B. Validity of 3 Clinical Techniques for the
Measurement of Static Foot Posture in Older People.

51
31. Picciano AM, Rowlands MS, Worrell T. Reliability of open and closed kinetic chain
subtalar joint neutral positions and navicular drop test. J Orthop Sports Phys Ther.
1993;18(4):553-558. doi:10.2519/jospt.1993.18.4.553.
32. Spörndly-Nees S, Dåsberg B, Nielsen RO, Boesen MI, Langberg H. The navicular
position test - a reliable measure of the navicular bone position during rest and loading. Int
J Sports Phys Ther. 2011;6(3):199-205.
33. Vauhnik, R.; Turk, Z.; Pilih, I.; Micetic-Turk D. Intra-rater reliability of using the
navicular drop test for measuring foot pronation. 2006:8-11.
34. Redmond A. The foot posture index: easy quantification of standing foot posture: six item
version: FPI-6: user guide and manual. United Kingdom. 2005;(August):1-19.
http://www.leeds.ac.uk/medicine/FASTER/fpi.htm\nhttp://www.leeds.ac.uk/medicine/FA
STER/z/pdf/FPI-manual-formatted-August-
2005v2.pdf\nhttp://scholar.google.com/scholar?hl=en&btnG=Search&q=intitle:The+Foot
+Posture+Index+(FPI)+-+Easy+quantification+of+standi.
35. Menz HB, Latt MD, Tiedemann A, Kwan MMS, Lord SR. Reliability of the GAITRite??
walkway system for the quantification of temporo-spatial parameters of gait in young and
older people. Gait Posture. 2004;20(1):20-25. doi:10.1016/S0966-6362(03)00068-7.
36. McDonough AL, Batavia M, Chen FC, Kwon S, Ziai J. The validity and reliability of the
GAITRite system’s measurements: A preliminary evaluation. Arch Phys Med Rehabil.
2001;82(3):419-425. doi:10.1053/apmr.2001.19778.
37. Webster KE, Wittwer JE, Feller JA. Validity of the GAITRite?? walkway system for the
measurement of averaged and individual step parameters of gait. Gait Posture.
2005;22(4):317-321. doi:10.1016/j.gaitpost.2004.10.005.

52
38. Robertson AMB. Muscle Acivity During Gait Transitions. Univ Houst.
39. Hart PM, Smith DR. Preventing Running Injuries Through Barefoot Activity. J Phys Educ
Recreat Danc. 2008;79(4):50-53. doi:10.1080/07303084.2008.10598165.
40. Warne JP, Warrington GD. Four-week habituation to simulated barefoot running improves
running economy when compared with shod running. Scand J Med Sci Sport.
2014;24(3):563-568. doi:10.1111/sms.12032.
41. No Authors Listed. GAITRite Electronic Walkway Technical Reference Manual.; 2015.