Barclays Australia NZ Economics Weekly - The RBAs Fair Value Model for the Exch
27
Economics Research 5 February 2014 PLEASE SEE ANALYST CERTIFICATIONS AND IMPORTANT DISCLOSURES STARTING AFTER PAGE 24 Australia and New Zealand Economics Weekly The RBA’s fair value model for the exchange rate Australia The RBA’s fair value model for the exchange rate ............................................................ 2 We have replicated the RBA’s model of the exchange rate to get a better sense of how it views the currency. It models fair value as a function of the goods terms of trade and the Australia-G3 real interest rate differential, with the CRB commodity price index, US real stock prices and the VIX index influencing the currency in the short term. The terms of trade is the dominant influence and the model suggests that the currency is now close to fair value after being 10-12% overvalued in late 2012-early 2013. The RBA does not formally forecast the exchange rate, but we think it would expect it to trend lower, given it expects the greatly increased supply of commodities will push export prices down, which helps explain why Governor Stevens has talked of the currency falling to 85 US cents. Based on the RBA’s sensitivity work, the lower currency poses a clear upside risk to both inflation and growth. Our own view is that the currency could fall further, reaching 80 US cents by end-2014, which poses a greater upside risk to our economic outlook and underscores our concern that the RBA could start raising rates sooner than our current forecast of Q1 2015. Weekly forecasts and calendars Economic and financial forecasts ...................................................................................... 11 Upcoming economic indicators and events ..................................................................... 13 Key central bank dates ........................................................................................................ 18 Long-term calendar ............................................................................................................. 19 Recent research .................................................................................................................... 24 Economics Research Kieran Davies +61 2 9334 6164 [email protected] FX Strategy Hamish Pepper +65 6308 2220 [email protected] www.barclays.com
description
Barclays Australia NZ Economics Weekly - The RBAs Fair Value Model for the Exch
Transcript of Barclays Australia NZ Economics Weekly - The RBAs Fair Value Model for the Exch
Economics Research 5 February 2014
PLEASE SEE ANALYST CERTIFICATIONS AND IMPORTANT DISCLOSURES STARTING AFTER PAGE 24
Australia and New Zealand Economics Weekly
The RBA’s fair value model for the exchange rate
Australia
The RBA’s fair value model for the exchange rate ............................................................ 2 We have replicated the RBA’s model of the exchange rate to get a better sense of how it views the currency. It models fair value as a function of the goods terms of trade and the Australia-G3 real interest rate differential, with the CRB commodity price index, US real stock prices and the VIX index influencing the currency in the short term. The terms of trade is the dominant influence and the model suggests that the currency is now close to fair value after being 10-12% overvalued in late 2012-early 2013. The RBA does not formally forecast the exchange rate, but we think it would expect it to trend lower, given it expects the greatly increased supply of commodities will push export prices down, which helps explain why Governor Stevens has talked of the currency falling to 85 US cents. Based on the RBA’s sensitivity work, the lower currency poses a clear upside risk to both inflation and growth. Our own view is that the currency could fall further, reaching 80 US cents by end-2014, which poses a greater upside risk to our economic outlook and underscores our concern that the RBA could start raising rates sooner than our current forecast of Q1 2015.
Weekly forecasts and calendars
Economic and financial forecasts ...................................................................................... 11
Upcoming economic indicators and events ..................................................................... 13
Key central bank dates ........................................................................................................ 18
Long-term calendar ............................................................................................................. 19
Recent research .................................................................................................................... 24
Economics Research Kieran Davies +61 2 9334 6164 [email protected] FX Strategy Hamish Pepper +65 6308 2220 [email protected] www.barclays.com
Barclays | Australia and New Zealand Economics Weekly
5 February 2014 2
AUSTRALIA: ANALYSIS
The RBA’ fair value model for the exchange rate Kieran Davies, Hamish Pepper
We have replicated the RBA’s model of the exchange rate to get a better sense of how it views the currency. It models fair value as a function of the goods terms of trade and the Australia-G3 real interest rate differential, with the CRB commodity price index, US real stock prices and the VIX index influencing the currency in the short term. The terms of trade is the dominant influence and the model suggests that the currency is now close to fair value after being 10-12% overvalued in late 2012/early 2013. The RBA does not formally forecast the exchange rate, but we think it would expect it to trend lower, given it expects the greatly increased supply of commodities will push export prices down, which helps explain why Governor Stevens has talked of the currency falling to 85 US cents. Based on the RBA’s sensitivity work, the lower currency poses a clear upside risk to both inflation and growth. Our own view is that the currency could fall further, reaching 80 US cents by end-2014, which poses a greater upside risk to our economic outlook and underscores our concern that the RBA could start raising rates sooner than our current forecast of Q1 2015.
The RBA has published detail on its fair value model for the exchange rate
The Reserve Bank recently released a number of documents under the Freedom of Information Act covering:
1. the “appropriate levels for the exchange rate considering the needs of the economy”; and
2. whether the bank has “examined the possibility of acting to curb appreciation of the currency and/or its ability to do so”.1
The documents reported a limited discussion of intervention in the currency, with a focus on the drivers of the exchange rate.
In terms of the drivers of the currency, the Reserve Bank’s current preferred model is a quarterly error-correction model of the real exchange rate:
• ∆real exchange ratet = constant + γreal exchange ratet-1 + α1terms of tradet-1 + α2real interest rate differentialt-1 + β1∆CRB commodity price indext + β2∆CRB commodity price indext-1 + β3∆real US stock pricest-1 + β4∆VIXt
where:
• The real exchange rate is the real trade-weighted index of the exchange rate;
• The terms of trade is for goods only (ie, the price of exports of goods divided by the price of imports of goods);
• The real interest rate differential is for Australia versus the G3;
• The CRB commodity price index is the Commodity Research Bureau commodity price index;
1 See the Reserve Bank file RBAFOI-131412, entitled Documents prepared since 1 July 2012 discussing what the RBA regards as appropriate levels for the exchange rate considering the needs of the economy and whether the RBA has examined the possibility of acting to curb appreciation of the currency and/or its ability to do so, 28 January 2014.

Barclays | Australia and New Zealand Economics Weekly
5 February 2014 3
• US real stock prices are the S&P 500 share price index divide by the US CPI; and
• VIX is the options-based measure of volatility in the S&P 500 share price index.
The short- and long-run influences on the exchange rate.
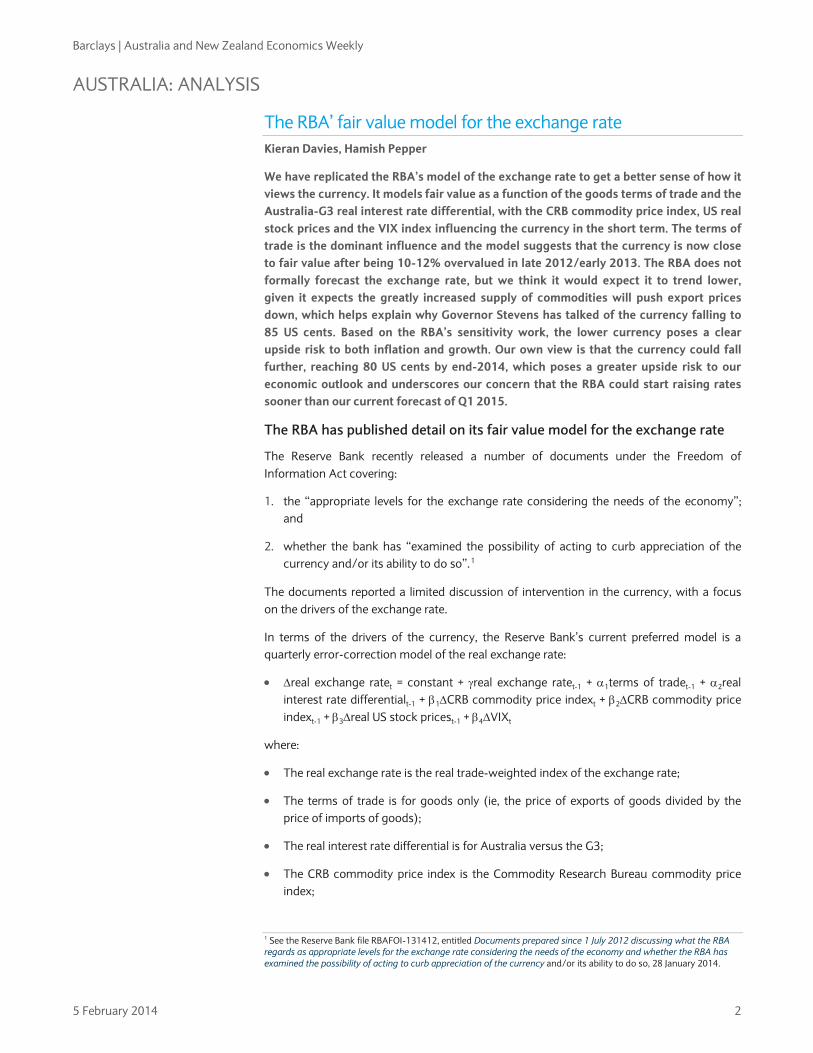
The structure of the bank’s model embeds a long-run equilibrium relationship between the real exchange rate and: 1) the goods terms of trade; and 2) the real interest rate differential. This relationship provides the bank’s fair value of the exchange rate.
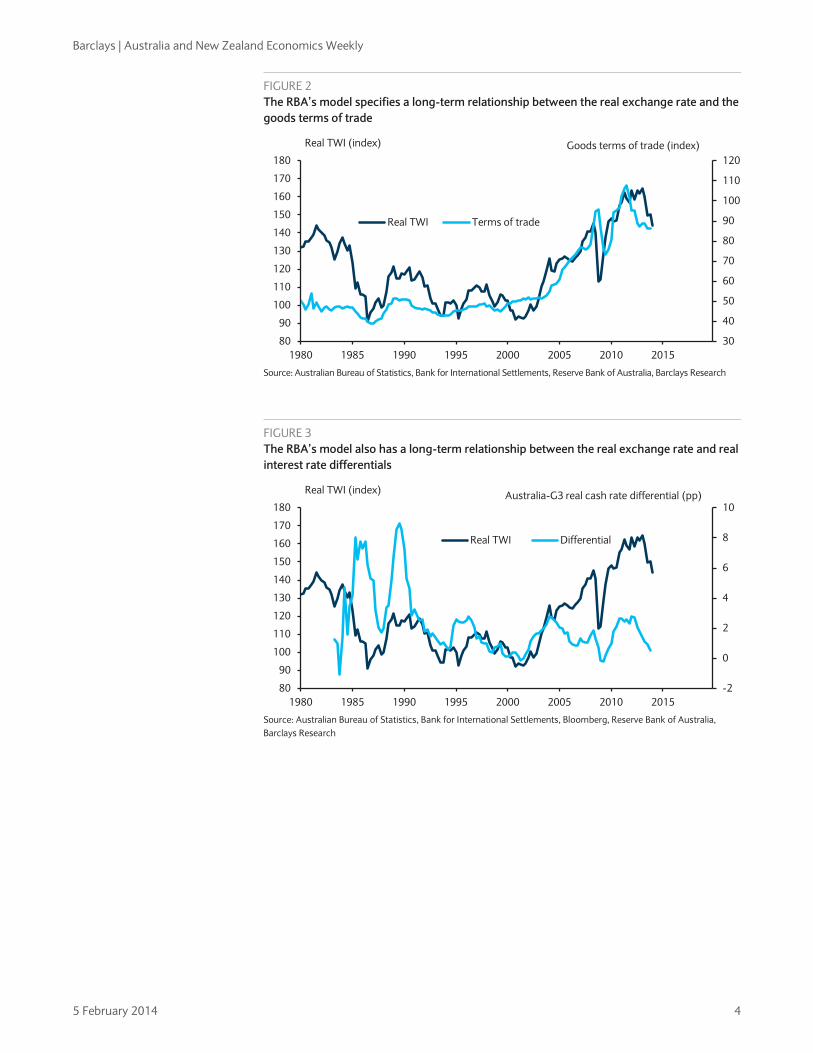
This means that growth in the real exchange rate is determined by: 1) last quarter’s deviation from fair value; 2) growth in the CRB commodity price index in the current and previous quarter; 3) growth in US real stock prices; and 4) the change in the VIX measure of volatility.
It is unusual for the CRB and the US financial indicators to be included compared with past Reserve Bank research into the exchange rate.
• As is well known, the CRB commodity price index has almost no relationship to Australia’s export mix, but is included because the Reserve Bank notes it is a “widely-followed market-based commodity measure”.
• US stock prices and the VIX measure of volatility are included to capture “risk sentiment” in financial markets.
FIGURE 1 The CRB commodity price index has almost no relationship with Australia’s export mix
CRB spot commodity price index Main Australian exports of goods
Components Goods % of exports*
1. Burlap 1. Iron ore 23.1
2. Butter 2. Coal 15.6
3. Cocoa beans 3. Gold 6.2
4. Copper scrap 4. Natural gas 5.8
5. Corn 5. Crude petroleum 3.9
6. Cotton 6. Wheat 2.7
7. Hides 7. Aluminium ores 2.3
8. Hogs 8. Copper ores 2.2
9. Lard 9. Beef 2.0
10. Lead scrap 10. Aluminium 1.5
11. Print cloth 11. Medicine 1.4
12. Rosin 12. Copper 1.3
13. Rubber 13. Refined petroleum 1.2
14. Soybean oil 14. Cotton 1.1
15. Steel scrap 15. Meat other then beef 1.0
16. Steers 16. Wool 1.0
17. Sugar 17. Oil seeds and fruits 0.9
18. Tallow 18. Alcohol 0.8
19. Wheat 19. Cars 0.7
20. Wool tops 20. Zinc ores 0.6
21. Zinc All other exports of goods 24.7
Note: * as at 2012-13 Source: Commodity Research Bureau, Department of Foreign Affairs and Trade, Barclays Research
Barclays | Australia and New Zealand Economics Weekly
5 February 2014 4
FIGURE 2 The RBA’s model specifies a long-term relationship between the real exchange rate and the goods terms of trade
Source: Australian Bureau of Statistics, Bank for International Settlements, Reserve Bank of Australia, Barclays Research
FIGURE 3 The RBA’s model also has a long-term relationship between the real exchange rate and real interest rate differentials
Source: Australian Bureau of Statistics, Bank for International Settlements, Bloomberg, Reserve Bank of Australia, Barclays Research
30
40
50
60
70
80
90
100
110
120
80
90
100
110
120
130
140
150
160
170
180
1980 1985 1990 1995 2000 2005 2010 2015
Real TWI Terms of trade
Real TWI (index) Goods terms of trade (index)
-2
0
2
4
6
8
10
80
90
100
110
120
130
140
150
160
170
180
1980 1985 1990 1995 2000 2005 2010 2015
Real TWI Differential
Real TWI (index) Australia-G3 real cash rate differential (pp)
Barclays | Australia and New Zealand Economics Weekly
5 February 2014 5
FIGURE 4 The RBA thinks that the CRB commodity price index helps determine the exchange rate in the short term
Source: Bank for International Settlements, Commodity Research Bureau, Reserve Bank of Australia, Barclays Research
FIGURE 5 The RBA believes there is a short-term relationship between the real exchange rate and US real stock prices
Source: Bank for International Settlements, Reserve Bank of Australia, Shiller, Barclays Research
-40
-30
-20
-10
0
10
20
30
40
-30
-20
-10
0
10
20
30
40
1980 1985 1990 1995 2000 2005 2010 2015
Real TWI CRB
Real TWI (% y/y) CRB commodity prices (% y/y)
-50
-40
-30
-20
-10
0
10
20
30
40
50
-30
-20
-10
0
10
20
30
40
1980 1985 1990 1995 2000 2005 2010 2015
Real TWI Stock prices
Real TWI (% y/y) US real stock prices (% y/y)
Barclays | Australia and New Zealand Economics Weekly
5 February 2014 6
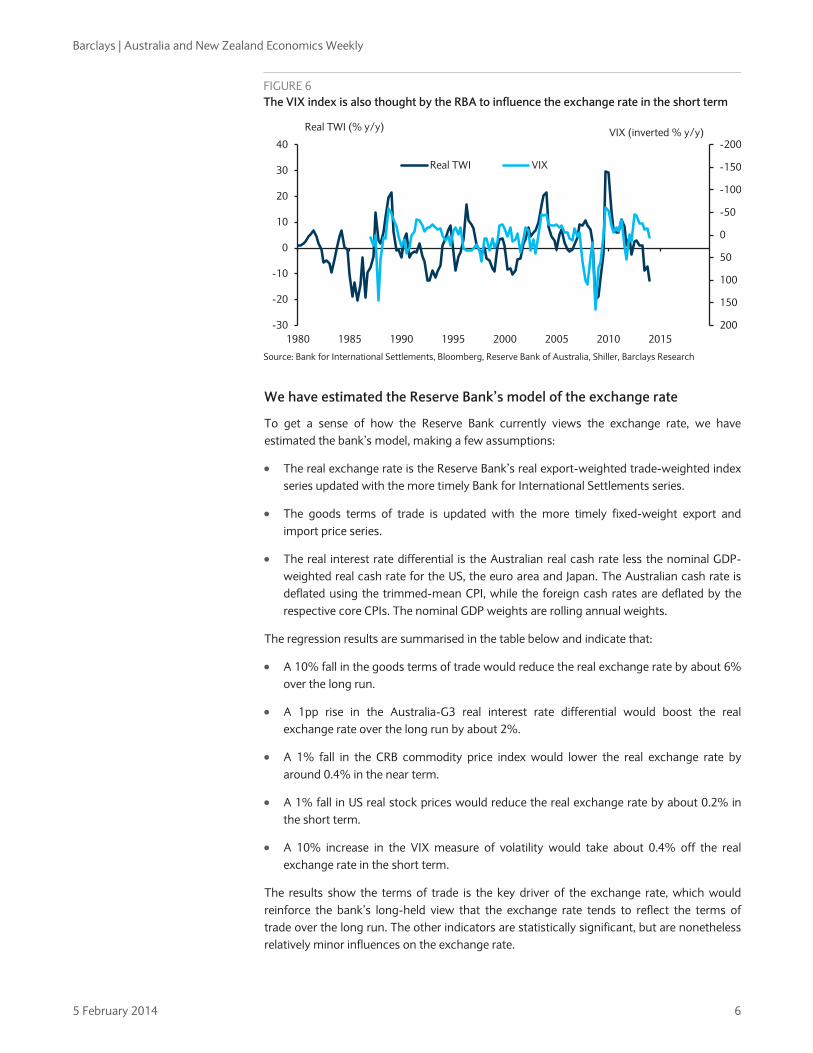
FIGURE 6 The VIX index is also thought by the RBA to influence the exchange rate in the short term
Source: Bank for International Settlements, Bloomberg, Reserve Bank of Australia, Shiller, Barclays Research
We have estimated the Reserve Bank’s model of the exchange rate
To get a sense of how the Reserve Bank currently views the exchange rate, we have estimated the bank’s model, making a few assumptions:
• The real exchange rate is the Reserve Bank’s real export-weighted trade-weighted index series updated with the more timely Bank for International Settlements series.
• The goods terms of trade is updated with the more timely fixed-weight export and import price series.
• The real interest rate differential is the Australian real cash rate less the nominal GDP-weighted real cash rate for the US, the euro area and Japan. The Australian cash rate is deflated using the trimmed-mean CPI, while the foreign cash rates are deflated by the respective core CPIs. The nominal GDP weights are rolling annual weights.
The regression results are summarised in the table below and indicate that:
• A 10% fall in the goods terms of trade would reduce the real exchange rate by about 6% over the long run.
• A 1pp rise in the Australia-G3 real interest rate differential would boost the real exchange rate over the long run by about 2%.
• A 1% fall in the CRB commodity price index would lower the real exchange rate by around 0.4% in the near term.
• A 1% fall in US real stock prices would reduce the real exchange rate by about 0.2% in the short term.
• A 10% increase in the VIX measure of volatility would take about 0.4% off the real exchange rate in the short term.
The results show the terms of trade is the key driver of the exchange rate, which would reinforce the bank’s long-held view that the exchange rate tends to reflect the terms of trade over the long run. The other indicators are statistically significant, but are nonetheless relatively minor influences on the exchange rate.
-200
-150
-100
-50
0
50
100
150
200-30
-20
-10
0
10
20
30
40
1980 1985 1990 1995 2000 2005 2010 2015
Real TWI VIX
Real TWI (% y/y) VIX (inverted % y/y)
Barclays | Australia and New Zealand Economics Weekly
5 February 2014 7
• In terms of deviations from fair value, the model implies that the exchange rate will eventually reflect movements in the terms of trade (and the real interest rate differential) after about six quarters.
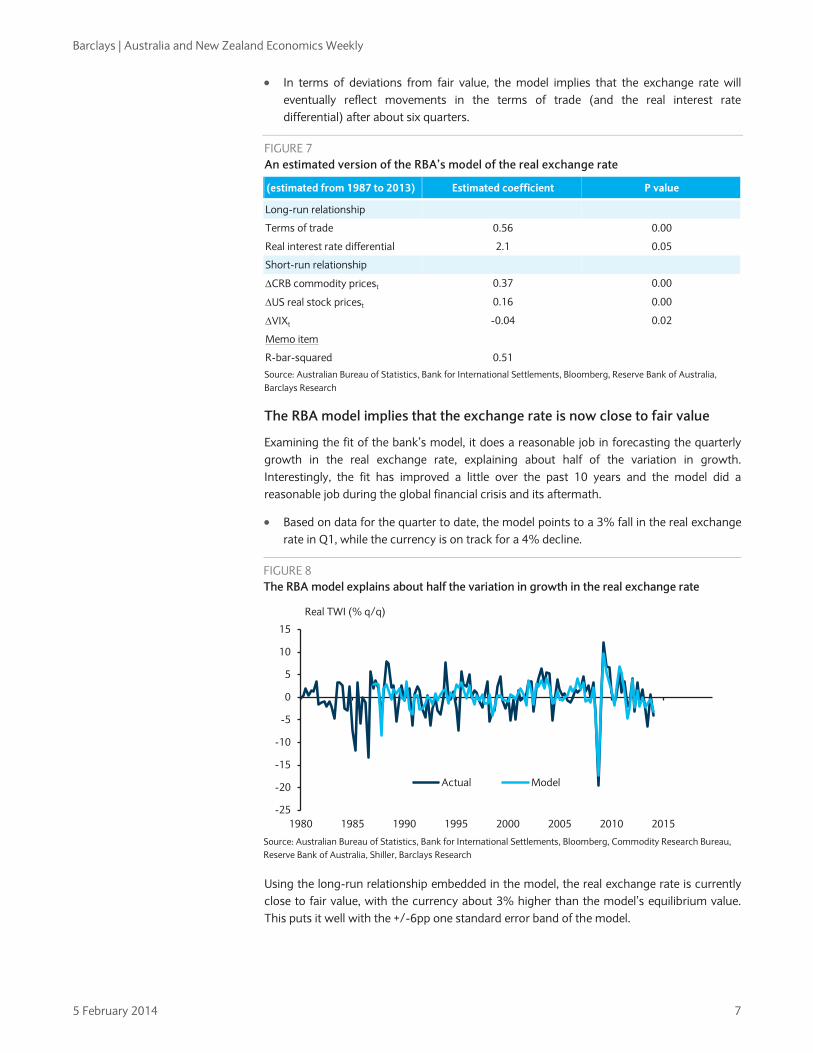
FIGURE 7 An estimated version of the RBA’s model of the real exchange rate
(estimated from 1987 to 2013) Estimated coefficient P value
Long-run relationship
Terms of trade 0.56 0.00
Real interest rate differential 2.1 0.05
Short-run relationship
∆CRB commodity pricest 0.37 0.00
∆US real stock pricest 0.16 0.00
∆VIXt -0.04 0.02
Memo item
R-bar-squared 0.51
Source: Australian Bureau of Statistics, Bank for International Settlements, Bloomberg, Reserve Bank of Australia, Barclays Research
The RBA model implies that the exchange rate is now close to fair value
Examining the fit of the bank’s model, it does a reasonable job in forecasting the quarterly growth in the real exchange rate, explaining about half of the variation in growth. Interestingly, the fit has improved a little over the past 10 years and the model did a reasonable job during the global financial crisis and its aftermath.
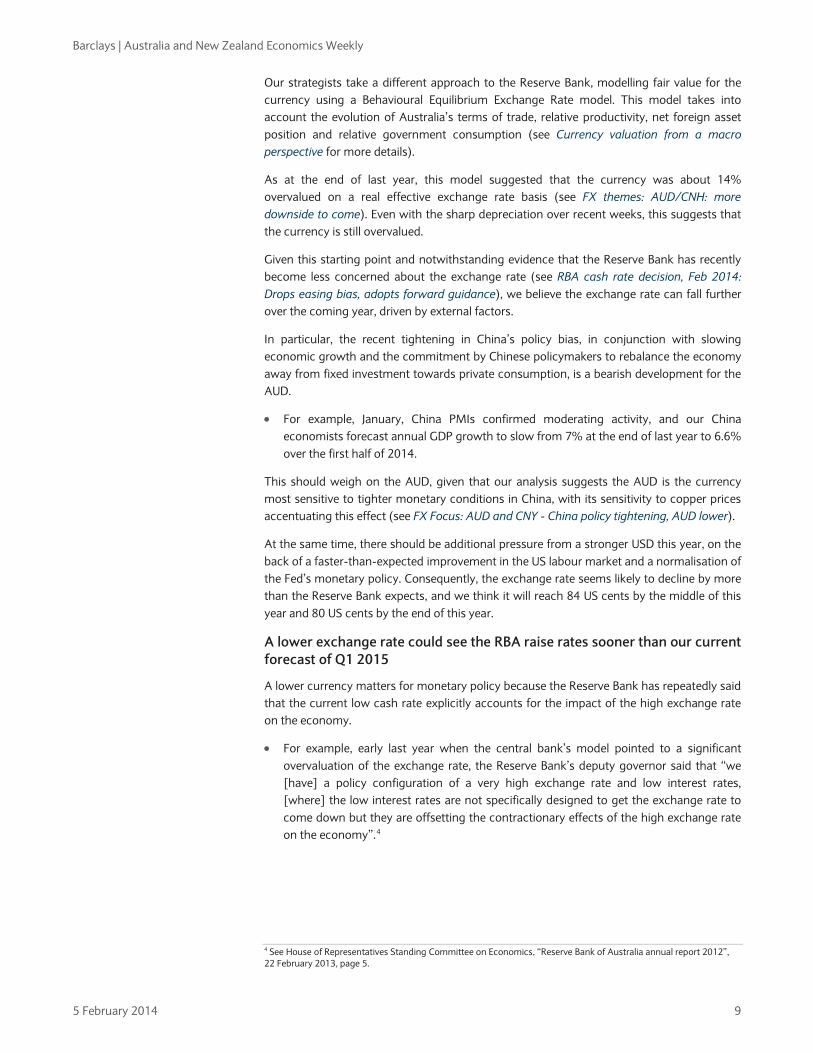
• Based on data for the quarter to date, the model points to a 3% fall in the real exchange rate in Q1, while the currency is on track for a 4% decline.
FIGURE 8 The RBA model explains about half the variation in growth in the real exchange rate
Source: Australian Bureau of Statistics, Bank for International Settlements, Bloomberg, Commodity Research Bureau, Reserve Bank of Australia, Shiller, Barclays Research
Using the long-run relationship embedded in the model, the real exchange rate is currently close to fair value, with the currency about 3% higher than the model’s equilibrium value. This puts it well with the +/-6pp one standard error band of the model.
-25
-20
-15
-10
-5
0
5
10
15
1980 1985 1990 1995 2000 2005 2010 2015
Actual Model
Real TWI (% q/q)

Barclays | Australia and New Zealand Economics Weekly
5 February 2014 8
• This contrasts with the experience of late 2012-early 2013, when the real exchange rate was 10-12% above fair value and the Reserve Bank became more vocal about calling for a lower currency.
FIGURE 9 The long-run model points to the real exchange rate being close to fair value
Source: Australian Bureau of Statistics, Bank for International Settlements, Bloomberg, Commodity Research Bureau, Reserve Bank of Australia, Shiller, Barclays Research
A lower exchange rate poses an upside risk to the RBA’s outlook
Although the Reserve Bank does not forecast the exchange rate, relying instead on the technical assumption of an unchanged currency, RBA Governor Stevens recently called for the exchange rate to fall to 85 US cents.2 This may seem surprising given that the above model suggests that the exchange rate is currently close to fair value, but it is consistent with the bank’s view that the terms of trade should trend lower in response to the greatly increased supply of bulk commodities, which in the bank’s analysis should drag the currency lower.
With the exchange rate down about 13% over the past year and with a further fall to 85 US cents implying an additional 3% decline, a declining currency would likely change the bank’s view of the risks around its outlook. Based on the Reserve Bank’s calculations, a 10% drop in the exchange rate would normally: 1) boost GDP by 0.5-1pp over two years; and 2) add 0.25-0.5pp per annum to inflation over two years.3
• Taking the midpoint of these ranges, this suggests that the exchange rate could add about 1pp to growth over 2 years based on the drop in the exchange rate to date, with a further 0.2pp boost if the currency falls to 85 US cents.
• Similarly, the depreciation to date could add 0.5pp per annum to inflation over two years, with a further 0.1pp if the exchange rate drops further.
Our FX strategists expect a larger depreciation, which would significantly raise the upside risks to the outlook
We expect the exchange rate to fall by further than the governor, with our FX strategists expecting a decline to 80 US cents by the end of 2014.
2 See Reserve Bank Governor, Transcript of interview with the Australian Financial Review, 13 December 2013. 3 See Reserve Bank Statement on Monetary Policy, August 2013.
80
90
100
110
120
130
140
150
160
170
180
1980 1985 1990 1995 2000 2005 2010 2015
+/- 1 SD Actual Model
Real TWI (% q/q)
Barclays | Australia and New Zealand Economics Weekly
5 February 2014 9
Our strategists take a different approach to the Reserve Bank, modelling fair value for the currency using a Behavioural Equilibrium Exchange Rate model. This model takes into account the evolution of Australia’s terms of trade, relative productivity, net foreign asset position and relative government consumption (see Currency valuation from a macro perspective for more details).
As at the end of last year, this model suggested that the currency was about 14% overvalued on a real effective exchange rate basis (see FX themes: AUD/CNH: more downside to come). Even with the sharp depreciation over recent weeks, this suggests that the currency is still overvalued.
Given this starting point and notwithstanding evidence that the Reserve Bank has recently become less concerned about the exchange rate (see RBA cash rate decision, Feb 2014: Drops easing bias, adopts forward guidance), we believe the exchange rate can fall further over the coming year, driven by external factors.
In particular, the recent tightening in China’s policy bias, in conjunction with slowing economic growth and the commitment by Chinese policymakers to rebalance the economy away from fixed investment towards private consumption, is a bearish development for the AUD.
• For example, January, China PMIs confirmed moderating activity, and our China economists forecast annual GDP growth to slow from 7% at the end of last year to 6.6% over the first half of 2014.
This should weigh on the AUD, given that our analysis suggests the AUD is the currency most sensitive to tighter monetary conditions in China, with its sensitivity to copper prices accentuating this effect (see FX Focus: AUD and CNY - China policy tightening, AUD lower).
At the same time, there should be additional pressure from a stronger USD this year, on the back of a faster-than-expected improvement in the US labour market and a normalisation of the Fed’s monetary policy. Consequently, the exchange rate seems likely to decline by more than the Reserve Bank expects, and we think it will reach 84 US cents by the middle of this year and 80 US cents by the end of this year.
A lower exchange rate could see the RBA raise rates sooner than our current forecast of Q1 2015
A lower currency matters for monetary policy because the Reserve Bank has repeatedly said that the current low cash rate explicitly accounts for the impact of the high exchange rate on the economy.
• For example, early last year when the central bank’s model pointed to a significant overvaluation of the exchange rate, the Reserve Bank’s deputy governor said that “we [have] a policy configuration of a very high exchange rate and low interest rates, [where] the low interest rates are not specifically designed to get the exchange rate to come down but they are offsetting the contractionary effects of the high exchange rate on the economy”.4
4 See House of Representatives Standing Committee on Economics, “Reserve Bank of Australia annual report 2012”, 22 February 2013, page 5.
Barclays | Australia and New Zealand Economics Weekly
5 February 2014 10
This provides the context for the governor’s more recent comments, where he said “to the extent that we get some more easing in financial conditions, at this point it’s probably more preferable for that to be via a lower currency at the margin than lower interests, given that lower interest rates are doing already the sorts of things that we would normally expect them to do”.5
This highlights that a declining exchange rate may change the balance of risks around the outlook for the cash rate as the year progresses. At the moment, the cash rate is on hold at 2.5%, and we expect the bank to start raising rates in Q1 15. This is consistent with the Reserve Bank’s new forward guidance, where it thinks “on present indications, the most prudent course is likely to be a period of stability in interest rates”. However, pronounced currency weakness raises the risks around growth and inflation, and could see the bank raise rates sooner than we expect.
• This may seem surprising given that the starting point for growth is in the low 2s, but we think that potential growth has fallen from around 3% to 2.5%, which points to less spare capacity in the economy than is commonly thought. This helps square why domestic costs have remained more solid than the bank had expected and highlights that in a Taylor rule framework policy is already on the easy side.
5 See Reserve Bank Governor, Transcript of interview with the Australian Financial Review, 13 December 2013.
Barclays | Australia and New Zealand Economics Weekly
5 February 2014 11
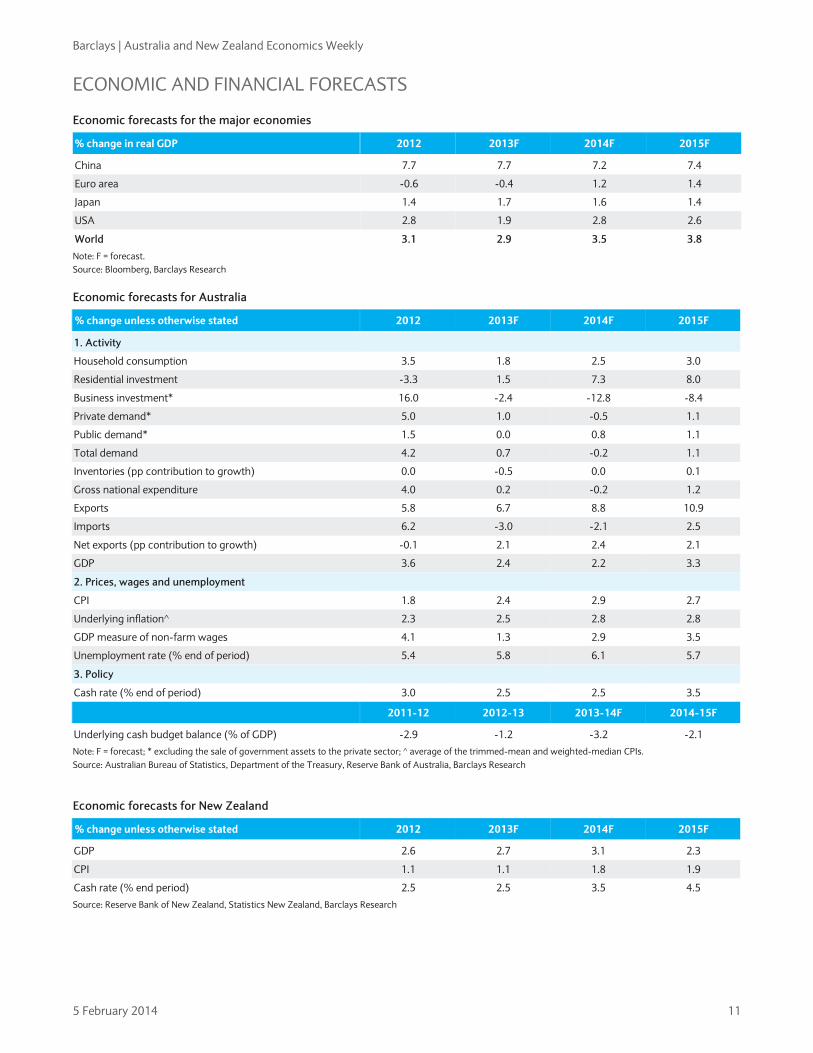
ECONOMIC AND FINANCIAL FORECASTS
Economic forecasts for the major economies
% change in real GDP 2012 2013F 2014F 2015F
China 7.7 7.7 7.2 7.4
Euro area -0.6 -0.4 1.2 1.4
Japan 1.4 1.7 1.6 1.4
USA 2.8 1.9 2.8 2.6
World 3.1 2.9 3.5 3.8 Note: F = forecast. Source: Bloomberg, Barclays Research
Economic forecasts for Australia
% change unless otherwise stated 2012 2013F 2014F 2015F
1. Activity
Household consumption 3.5 1.8 2.5 3.0
Residential investment -3.3 1.5 7.3 8.0
Business investment* 16.0 -2.4 -12.8 -8.4
Private demand* 5.0 1.0 -0.5 1.1
Public demand* 1.5 0.0 0.8 1.1
Total demand 4.2 0.7 -0.2 1.1
Inventories (pp contribution to growth) 0.0 -0.5 0.0 0.1
Gross national expenditure 4.0 0.2 -0.2 1.2
Exports 5.8 6.7 8.8 10.9
Imports 6.2 -3.0 -2.1 2.5
Net exports (pp contribution to growth) -0.1 2.1 2.4 2.1
GDP 3.6 2.4 2.2 3.3
2. Prices, wages and unemployment
CPI 1.8 2.4 2.9 2.7
Underlying inflation^ 2.3 2.5 2.8 2.8
GDP measure of non-farm wages 4.1 1.3 2.9 3.5
Unemployment rate (% end of period) 5.4 5.8 6.1 5.7
3. Policy
Cash rate (% end of period) 3.0 2.5 2.5 3.5
2011-12 2012-13 2013-14F 2014-15F
Underlying cash budget balance (% of GDP) -2.9 -1.2 -3.2 -2.1
Note: F = forecast; * excluding the sale of government assets to the private sector; ^ average of the trimmed-mean and weighted-median CPIs. Source: Australian Bureau of Statistics, Department of the Treasury, Reserve Bank of Australia, Barclays Research
Economic forecasts for New Zealand
% change unless otherwise stated 2012 2013F 2014F 2015F
GDP 2.6 2.7 3.1 2.3
CPI 1.1 1.1 1.8 1.9
Cash rate (% end period) 2.5 2.5 3.5 4.5
Source: Reserve Bank of New Zealand, Statistics New Zealand, Barclays Research
Barclays | Australia and New Zealand Economics Weekly
5 February 2014 12
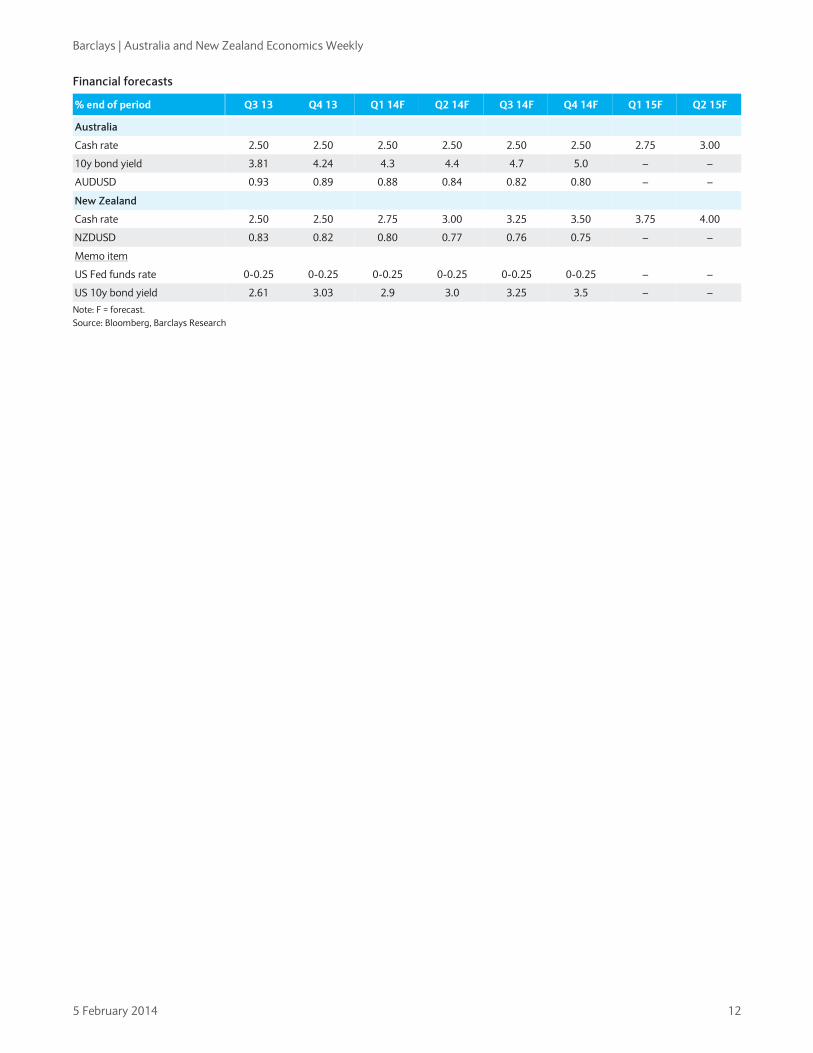
Financial forecasts
% end of period Q3 13 Q4 13 Q1 14F Q2 14F Q3 14F Q4 14F Q1 15F Q2 15F
Australia
Cash rate 2.50 2.50 2.50 2.50 2.50 2.50 2.75 3.00
10y bond yield 3.81 4.24 4.3 4.4 4.7 5.0 – –
AUDUSD 0.93 0.89 0.88 0.84 0.82 0.80 – –
New Zealand
Cash rate 2.50 2.50 2.75 3.00 3.25 3.50 3.75 4.00
NZDUSD 0.83 0.82 0.80 0.77 0.76 0.75 – –
Memo item
US Fed funds rate 0-0.25 0-0.25 0-0.25 0-0.25 0-0.25 0-0.25 – –
US 10y bond yield 2.61 3.03 2.9 3.0 3.25 3.5 – –
Note: F = forecast. Source: Bloomberg, Barclays Research
Barclays | Australia and New Zealand Economics Weekly
5 February 2014 13
CALENDARS
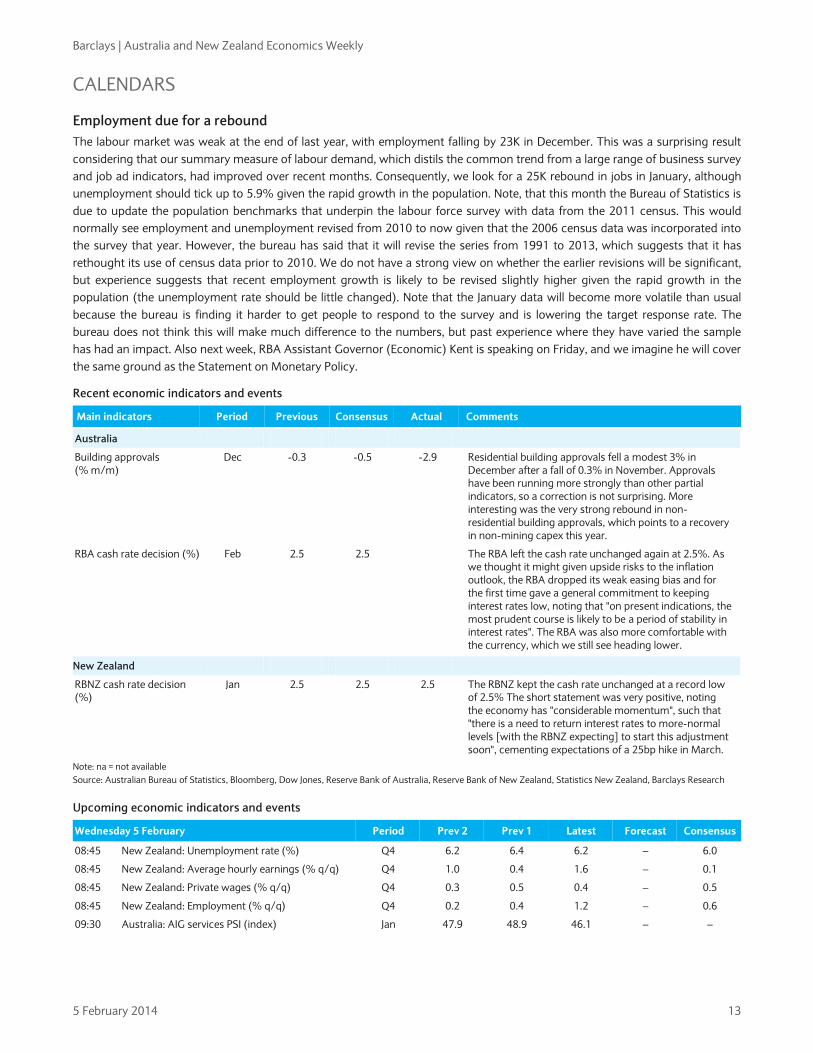
Employment due for a rebound The labour market was weak at the end of last year, with employment falling by 23K in December. This was a surprising result considering that our summary measure of labour demand, which distils the common trend from a large range of business survey and job ad indicators, had improved over recent months. Consequently, we look for a 25K rebound in jobs in January, although unemployment should tick up to 5.9% given the rapid growth in the population. Note, that this month the Bureau of Statistics is due to update the population benchmarks that underpin the labour force survey with data from the 2011 census. This would normally see employment and unemployment revised from 2010 to now given that the 2006 census data was incorporated into the survey that year. However, the bureau has said that it will revise the series from 1991 to 2013, which suggests that it has rethought its use of census data prior to 2010. We do not have a strong view on whether the earlier revisions will be significant, but experience suggests that recent employment growth is likely to be revised slightly higher given the rapid growth in the population (the unemployment rate should be little changed). Note that the January data will become more volatile than usual because the bureau is finding it harder to get people to respond to the survey and is lowering the target response rate. The bureau does not think this will make much difference to the numbers, but past experience where they have varied the sample has had an impact. Also next week, RBA Assistant Governor (Economic) Kent is speaking on Friday, and we imagine he will cover the same ground as the Statement on Monetary Policy.
Recent economic indicators and events
Main indicators Period Previous Consensus Actual Comments
Australia
Building approvals (% m/m)
Dec -0.3 -0.5 -2.9 Residential building approvals fell a modest 3% in December after a fall of 0.3% in November. Approvals have been running more strongly than other partial indicators, so a correction is not surprising. More interesting was the very strong rebound in non-residential building approvals, which points to a recovery in non-mining capex this year.
RBA cash rate decision (%) Feb 2.5 2.5 The RBA left the cash rate unchanged again at 2.5%. As we thought it might given upside risks to the inflation outlook, the RBA dropped its weak easing bias and for the first time gave a general commitment to keeping interest rates low, noting that "on present indications, the most prudent course is likely to be a period of stability in interest rates". The RBA was also more comfortable with the currency, which we still see heading lower.
New Zealand
RBNZ cash rate decision (%)
Jan 2.5 2.5 2.5 The RBNZ kept the cash rate unchanged at a record low of 2.5% The short statement was very positive, noting the economy has "considerable momentum", such that "there is a need to return interest rates to more-normal levels [with the RBNZ expecting] to start this adjustment soon", cementing expectations of a 25bp hike in March.
Note: na = not available Source: Australian Bureau of Statistics, Bloomberg, Dow Jones, Reserve Bank of Australia, Reserve Bank of New Zealand, Statistics New Zealand, Barclays Research
Upcoming economic indicators and events
Wednesday 5 February Period Prev 2 Prev 1 Latest Forecast Consensus
08:45 New Zealand: Unemployment rate (%) Q4 6.2 6.4 6.2 – 6.0
08:45 New Zealand: Average hourly earnings (% q/q) Q4 1.0 0.4 1.6 – 0.1
08:45 New Zealand: Private wages (% q/q) Q4 0.3 0.5 0.4 – 0.5
08:45 New Zealand: Employment (% q/q) Q4 0.2 0.4 1.2 – 0.6
09:30 Australia: AIG services PSI (index) Jan 47.9 48.9 46.1 – –

Barclays | Australia and New Zealand Economics Weekly
5 February 2014 14
Thursday 6 February Period Prev 2 Prev 1 Latest Forecast Consensus
11:30 Australia: NAB business confidence (index) Q4 2 -1 3 - -
11:30 Australia: Trade balance (AUD mn) Dec -601 -358 -118 -50 -200
11:30 Australia: Nominal retail trade (% m/m) Dec 0.9 0.5 0.7 0.3 0.4
11:30 Australia: Real retail trade (% q/q) Q4 2.0 -0.1 0.7 1.2 1.0
Friday 7 February Period Prev 2 Prev 1 Latest Forecast Consensus
09:30 Australia: AIG construction PCI (index) Jan 54.4 55.2 50.8 – –
11:30 Australia: RBA Statement on Monetary Policy Feb
Monday 10 February Period Prev 2 Prev 1 Latest Forecast Consensus
No major data are due
Tuesday 11 February Period Prev 2 Prev 1 Latest Forecast Consensus
08:00 New Zealand: ANZ truckometer (% m/m) Jan 0.3 -2.0 1.4 – –
11:30 Australia: Owner-occupied housing finance (% m/m) Dec 3.6 1.1 1.1 – –
11:30 Australia: Investor housing finance (% m/m) Dec 6.5 8.2 1.5 – –
11:30 Australia: NAB business conditions (index) Jan – – –
11:30 Australia: NAB business confidence (index) Jan – – –
Australia: Retail trade – Although we think that the trend in nominal retail sales has improved, we are only expecting a small increase of 0.3% in December, given that expectations nearly always overestimate spending in December owing to shifting seasonal patterns (ie, households have held off buying until after Christmas and into January, such that January sales nearly always exceed expectations). For Q4, we expect a rise in real retail trade of 1.2%, although there is the risk that higher inflation pares this increase.
Australia: Trade balance – The trade deficit should shrink slightly, to AUD50mn, in December with exports and imports both posting large increases.
FIGURE 10
Australia: Nominal retail trade
FIGURE 11
Australia: Real retail trade
Source: Australian Bureau of Statistics, Bloomberg, Dow Jones, Reuters, Barclays Research
Source: Australian Bureau of Statistics, Bloomberg, Dow Jones, Reuters, Barclays Research
Australia: RBA Statement on Monetary Policy – The RBA is likely to raise its near-term inflation forecast for Q2 14 to 2.75% from 2.5%. The medium-term forecast range of 2-3% will probably remain unchanged, although the higher starting point and lower exchange rate will likely make the RBA uneasy that inflation could temporarily exceed the 2-3% target. The growth profile will likely be broadly unchanged, although the RBA may bump up its starting point given the recent pickup in surveyed business conditions.
-2
-1
0
1
2
3
4
2005 2007 2009 2011 2013
First published estimate
Median market forecast
Nominal retail trade (% m/m)
-1.0
-0.5
0.0
0.5
1.0
1.5
2.0
2.5
2005 2007 2009 2011 2013
First published estimate
Median market forecast
Real retail trade (% q/q)
Barclays | Australia and New Zealand Economics Weekly
5 February 2014 15
Wednesday 12 February Period Prev 2 Prev 1 Latest Forecast Consensus
08:45 New Zealand: Card spending (% m/m) Jan 1.2 0.3 1.0 – –
08:45 New Zealand: card spending – retail (% m/m) Jan 1.9 0.7 0.6 – –
Thursday 13 February Period Prev 2 Prev 1 Latest Forecast Consensus
08:30 New Zealand: Business NZ PMI (index) Jan 54.2 55.9 56.7 – –
11:30 Australia: Employment (‘000 monthly change) Jan 1.7 15.4 -22.6 – –
11:30 Australia: Unemployment rate (%) Jan 5.8 5.8 5.8 – –
14:30 Australia: RBA Assistant Governor (Financial markets) Debelle speaks (Sydney)
Friday 14 February Period Prev 2 Prev 1 Latest Forecast Consensus
08:45 New Zealand: Food prices (% m/m) Jan -1.0 -0.2 -0.1 – –
09:05 Australia: RBA Assistant Governor (Economics) Kent speaks on the economy (Sydney)
Monday 17 February Period Prev 2 Prev 1 Latest Forecast Consensus
08:30 New Zealand: PSI (index) Jan 56.4 57.7 56.3 – –
08:45 New Zealand: Real retail sales (% q/q) Q4 0.8 1.5 0.3 – –
11:30 Australia: New motor-vehicle sales (% m/m) Jan -0.9 2.1 1.7 – –
Tuesday 18 February Period Prev 2 Prev 1 Latest Forecast Consensus
11:30 Australia: RBA board minutes (4 Feb meeting)
Wednesday 19 February Period Prev 2 Prev 1 Latest Forecast Consensus
11:00 Australia: DEWR skilled vacancies (% m/m) Jan – – – – –
11:30 Australia: Wage price index (% q/q) Q4 0.7 0.7 0.5 – –
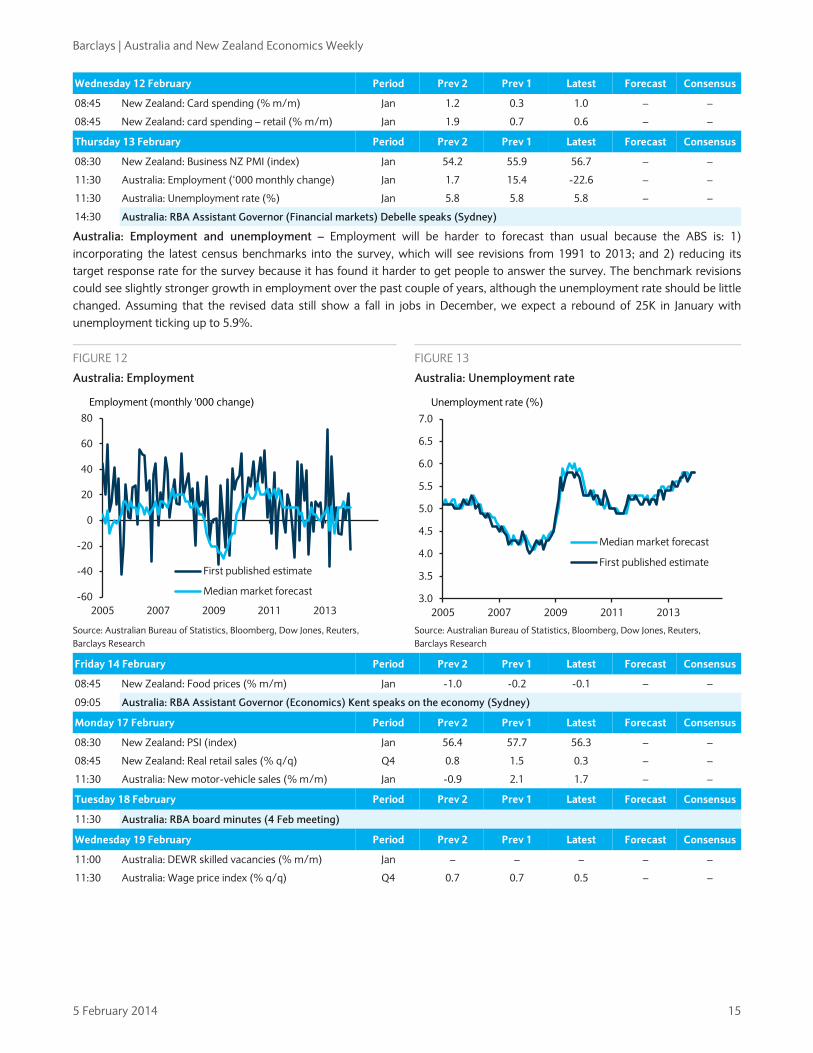
Australia: Employment and unemployment – Employment will be harder to forecast than usual because the ABS is: 1) incorporating the latest census benchmarks into the survey, which will see revisions from 1991 to 2013; and 2) reducing its target response rate for the survey because it has found it harder to get people to answer the survey. The benchmark revisions could see slightly stronger growth in employment over the past couple of years, although the unemployment rate should be little changed. Assuming that the revised data still show a fall in jobs in December, we expect a rebound of 25K in January with unemployment ticking up to 5.9%.
FIGURE 12
Australia: Employment
FIGURE 13
Australia: Unemployment rate
Source: Australian Bureau of Statistics, Bloomberg, Dow Jones, Reuters, Barclays Research
Source: Australian Bureau of Statistics, Bloomberg, Dow Jones, Reuters, Barclays Research
-60
-40
-20
0
20
40
60
80
2005 2007 2009 2011 2013
First published estimate
Median market forecast
Employment (monthly '000 change)
3.0
3.5
4.0
4.5
5.0
5.5
6.0
6.5
7.0
2005 2007 2009 2011 2013
Median market forecast
First published estimate
Unemployment rate (%)
Barclays | Australia and New Zealand Economics Weekly
5 February 2014 16
Thursday 20 February Period Prev 2 Prev 1 Latest Forecast Consensus
08:00 New Zealand: ANZ job ads (% m/m) Jan 1.3 4.4 -2.1 – –
08:45 New Zealand: PPI (% q/q) Q4 0.8 1.0 2.4 – –
11:00 New Zealand: ANZ consumer confidence (% m/m) Feb 2.9 5.0 0.8 – –
11:30 Australia: AWOTE (% h/h) H2 – – – – –
Friday 21 February Period Prev 2 Prev 1 Latest Forecast Consensus
11:30 Australia: RBA FX transactions Jan – – – – –
Monday 24 February Period Prev 2 Prev 1 Latest Forecast Consensus
13:00 New Zealand: Credit card spending (% m/m) Jan Flat -0.5 3.5 – –
Tuesday 25 February Period Prev 2 Prev 1 Latest Forecast Consensus
13:00 New Zealand: RBNZ 2y inflation expectation (%) Q1 2.1 2.4 2.3 – –
11:30 Australia: Real imports of goods (% q/q) Q4 -4.6 4.0 -2.4 – –
11:30 Australia: Trade balance (AUD bn) Q4 -1.4 -2.7 -2.6 – –
Wednesday 26 February Period Prev 2 Prev 1 Latest Forecast Consensus
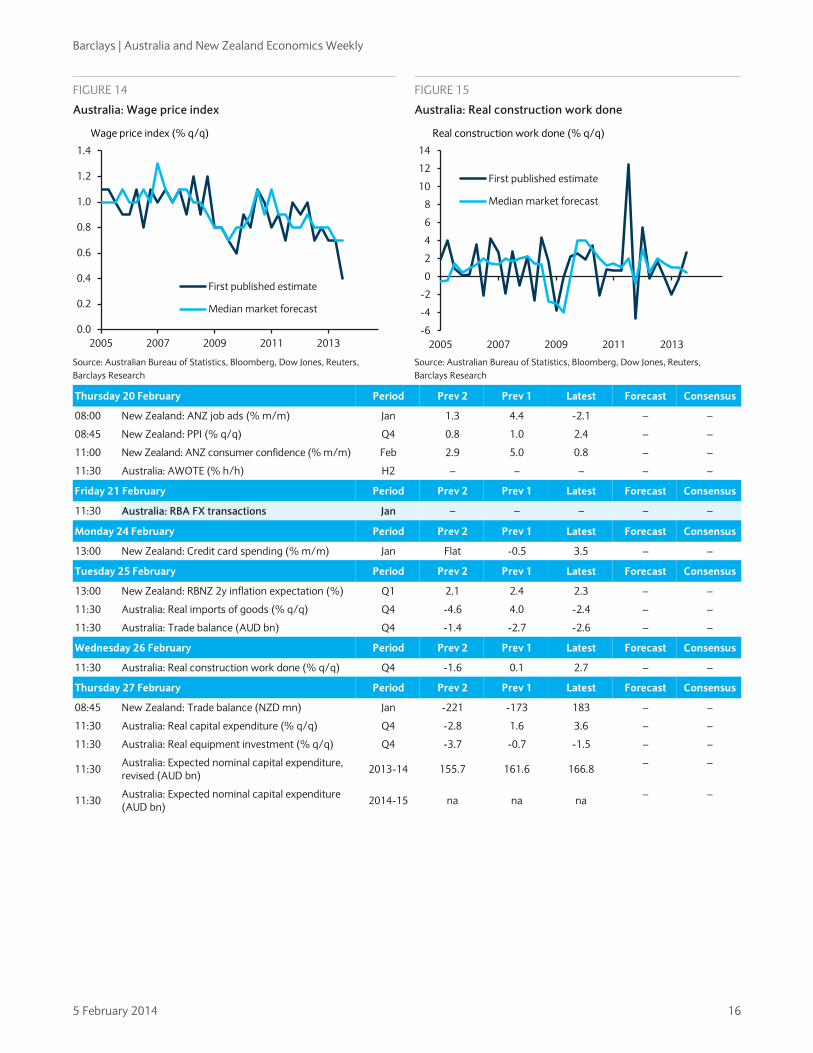
11:30 Australia: Real construction work done (% q/q) Q4 -1.6 0.1 2.7 – –
Thursday 27 February Period Prev 2 Prev 1 Latest Forecast Consensus
08:45 New Zealand: Trade balance (NZD mn) Jan -221 -173 183 – –
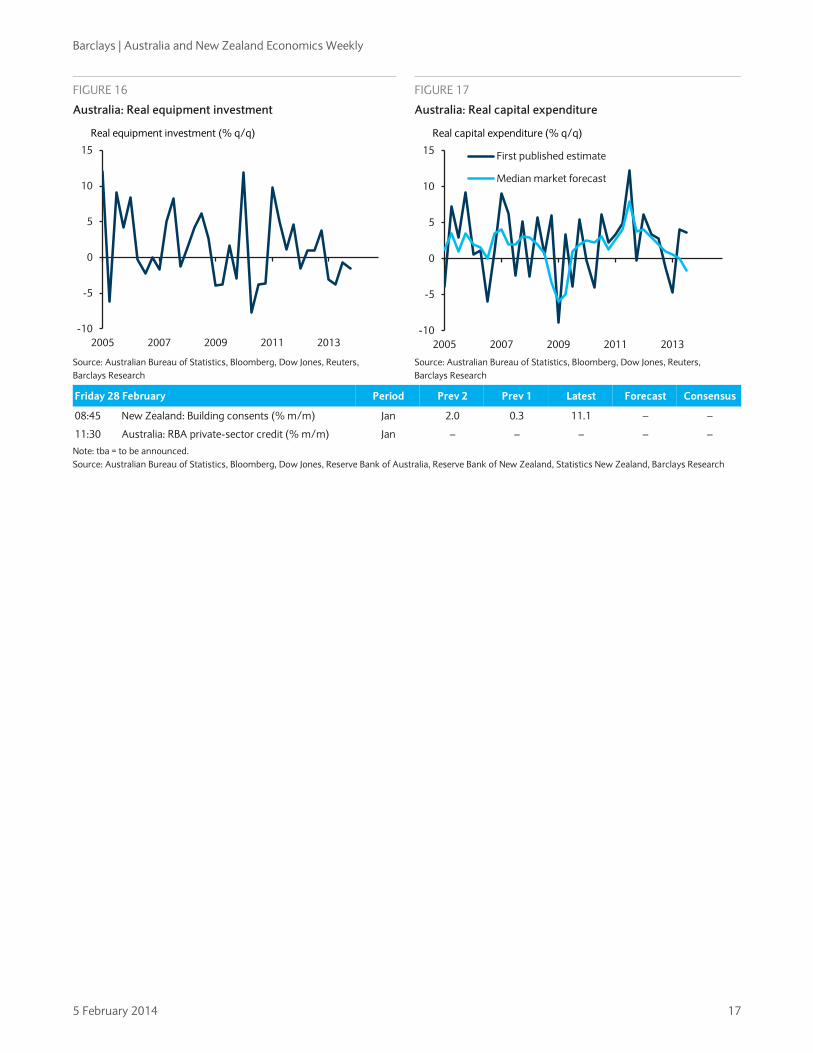
11:30 Australia: Real capital expenditure (% q/q) Q4 -2.8 1.6 3.6 – –
11:30 Australia: Real equipment investment (% q/q) Q4 -3.7 -0.7 -1.5 – –
11:30 Australia: Expected nominal capital expenditure, revised (AUD bn) 2013-14 155.7 161.6 166.8 – –
11:30 Australia: Expected nominal capital expenditure (AUD bn) 2014-15 na na na – –
FIGURE 14
Australia: Wage price index
FIGURE 15
Australia: Real construction work done
Source: Australian Bureau of Statistics, Bloomberg, Dow Jones, Reuters, Barclays Research
Source: Australian Bureau of Statistics, Bloomberg, Dow Jones, Reuters, Barclays Research
0.0
0.2
0.4
0.6
0.8
1.0
1.2
1.4
2005 2007 2009 2011 2013
First published estimate
Median market forecast
Wage price index (% q/q)
-6
-4
-2
0
2
4
6
8
10
12
14
2005 2007 2009 2011 2013
First published estimate
Median market forecast
Real construction work done (% q/q)
Barclays | Australia and New Zealand Economics Weekly
5 February 2014 17
Friday 28 February Period Prev 2 Prev 1 Latest Forecast Consensus
08:45 New Zealand: Building consents (% m/m) Jan 2.0 0.3 11.1 – –
11:30 Australia: RBA private-sector credit (% m/m) Jan – – – – –
Note: tba = to be announced. Source: Australian Bureau of Statistics, Bloomberg, Dow Jones, Reserve Bank of Australia, Reserve Bank of New Zealand, Statistics New Zealand, Barclays Research
FIGURE 16
Australia: Real equipment investment
FIGURE 17
Australia: Real capital expenditure
Source: Australian Bureau of Statistics, Bloomberg, Dow Jones, Reuters, Barclays Research
Source: Australian Bureau of Statistics, Bloomberg, Dow Jones, Reuters, Barclays Research
-10
-5
0
5
10
15
2005 2007 2009 2011 2013
Real equipment investment (% q/q)
-10
-5
0
5
10
15
2005 2007 2009 2011 2013
First published estimate
Median market forecast
Real capital expenditure (% q/q)
Barclays | Australia and New Zealand Economics Weekly
5 February 2014 18
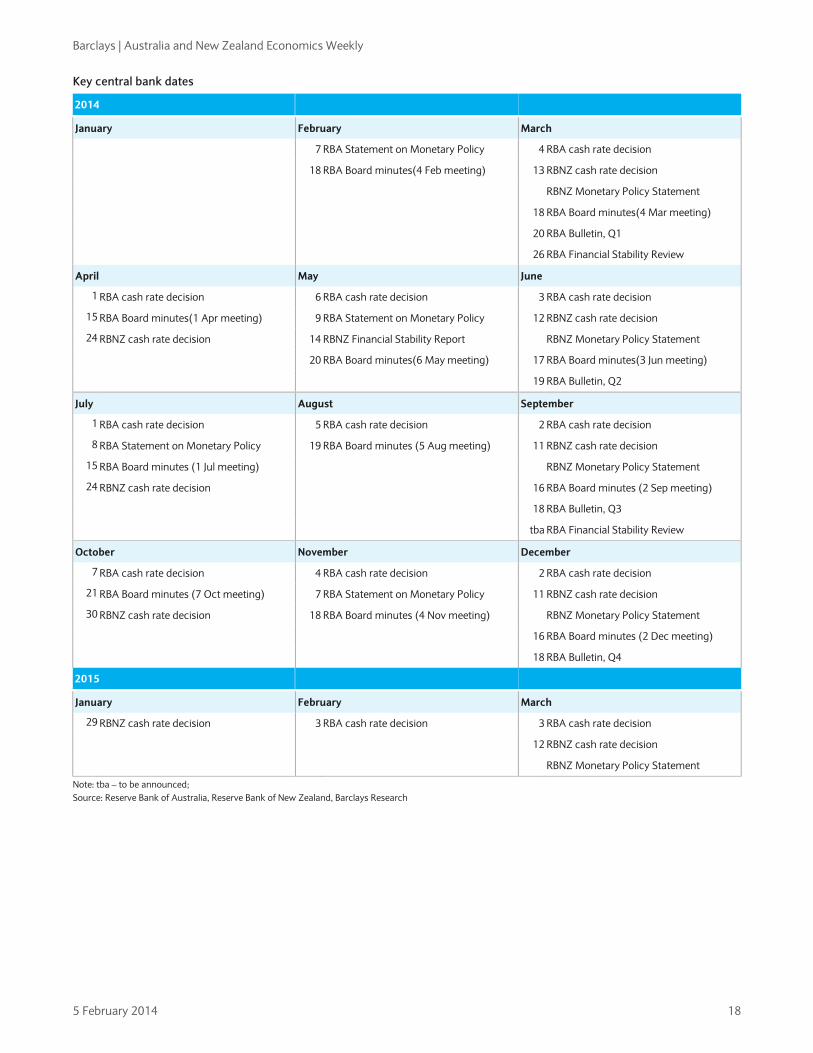
Key central bank dates
2014
January February March
7 RBA Statement on Monetary Policy 4 RBA cash rate decision
18 RBA Board minutes(4 Feb meeting) 13 RBNZ cash rate decision
RBNZ Monetary Policy Statement
18 RBA Board minutes(4 Mar meeting)
20 RBA Bulletin, Q1
26 RBA Financial Stability Review
April May June
1 RBA cash rate decision 6 RBA cash rate decision 3 RBA cash rate decision
15 RBA Board minutes(1 Apr meeting) 9 RBA Statement on Monetary Policy 12 RBNZ cash rate decision
24 RBNZ cash rate decision 14 RBNZ Financial Stability Report RBNZ Monetary Policy Statement
20 RBA Board minutes(6 May meeting) 17 RBA Board minutes(3 Jun meeting)
19 RBA Bulletin, Q2
July August September
1 RBA cash rate decision 5 RBA cash rate decision 2 RBA cash rate decision
8 RBA Statement on Monetary Policy 19 RBA Board minutes (5 Aug meeting) 11 RBNZ cash rate decision
15 RBA Board minutes (1 Jul meeting) RBNZ Monetary Policy Statement
24 RBNZ cash rate decision 16 RBA Board minutes (2 Sep meeting)
18 RBA Bulletin, Q3
tba RBA Financial Stability Review
October November December
7 RBA cash rate decision 4 RBA cash rate decision 2 RBA cash rate decision
21 RBA Board minutes (7 Oct meeting) 7 RBA Statement on Monetary Policy 11 RBNZ cash rate decision
30 RBNZ cash rate decision 18 RBA Board minutes (4 Nov meeting) RBNZ Monetary Policy Statement
16 RBA Board minutes (2 Dec meeting)
18 RBA Bulletin, Q4
2015
January February March
29 RBNZ cash rate decision 3 RBA cash rate decision 3 RBA cash rate decision
12 RBNZ cash rate decision
RBNZ Monetary Policy Statement
Note: tba – to be announced; Source: Reserve Bank of Australia, Reserve Bank of New Zealand, Barclays Research

Barclays | Australia and New Zealand Economics Weekly
5 February 2014 19
LONG-TERM CALENDAR
MONDAY TUESDAY WEDNESDAY THURSDAY FRIDAY
3 FEBRUARY 4 5 6 7
Australia Building approvals, Dec TDMI inflation gauge, Jan AIG manufacturing PMI, Jan New Zealand Visitor arrivals, Dec
Australia RBA cash rate decision (2:30pm) New Zealand ANZ commodity price index, Jan
Australia RBA chartpack Job search experience, Jul AIG services PSI, Jan New Zealand Employment and unemployment rate, Q4 Quarterly employment survey, Q3 Labour cost index, Q4
New Zealand Waitangi Day public holiday Australia Trade balance, Dec Nominal retail trade, Dec Real retail trade, Q4 NAB business survey, Q4
Australia RBA Statement on Monetary Policy AIG construction PCI, Jan New Zealand QV house prices, Jan
10 FEBRUARY 11 12 13 14
Australia Housing finance, Dec ABS existing house price, Q4 New Zealand Population, Q4 ANZ truckometer, Jan
Australia Overseas arrivals and departures, Dec New Zealand Electronic card transactions, Jan
Australia RBA Assistant Governor (Financial markets) Debelle is a panel discussant at a conference on markets (Sydney, 12:25pm) Employment and unemployment, Jan ANZ job ads, Jan
Australia RBA Assistant Governor (Economics) Kent speaks on the economy (Sydney, 9:05am) Lending finance, Dec New Zealand Food price index, Jan
17 FEBRUARY 18 19 20 21
Australia New motor-vehicle sales, Jan New Zealand Real retail trade, Q4
Australia RBA board minutes (4 Feb meeting) Imports of goods, Jan
Australia Wage price index, Q4
Australia RBA FX transactions, Jan AWOTE and AWE, H2 New Zealand PPI, Q4 Capital goods price index, Q4 ANZ job ads, Jan
24 FEBRUARY 25 26 27 28
New Zealand Credit card spending, Jan
Australia Trade balance (revised), Q4 Real imports of goods, Q4 Household use of IT, 2012-13 New Zealand RBNZ 2y inflation expectations, Q1
Australia RBA Governor Stevens is a panel discussant at an Australia-Canada economics forum (Melbourne, 7:45am) Real construction work done, Q4 Underemployed workers, Sep
Australia Real equipment investment, Q4 Real capital expenditure, Q4 Expected nominal capital expenditure (revised), 2013-14 Expected nominal capital expenditure, 2014-15 New Zealand Trade balance, Jan Net migration, Jan
Australia RP Data-Rismark house price, Jan Production of selected construction materials, Jan RBA private-sector credit, Jan New Zealand Building consents, Jan
Barclays | Australia and New Zealand Economics Weekly
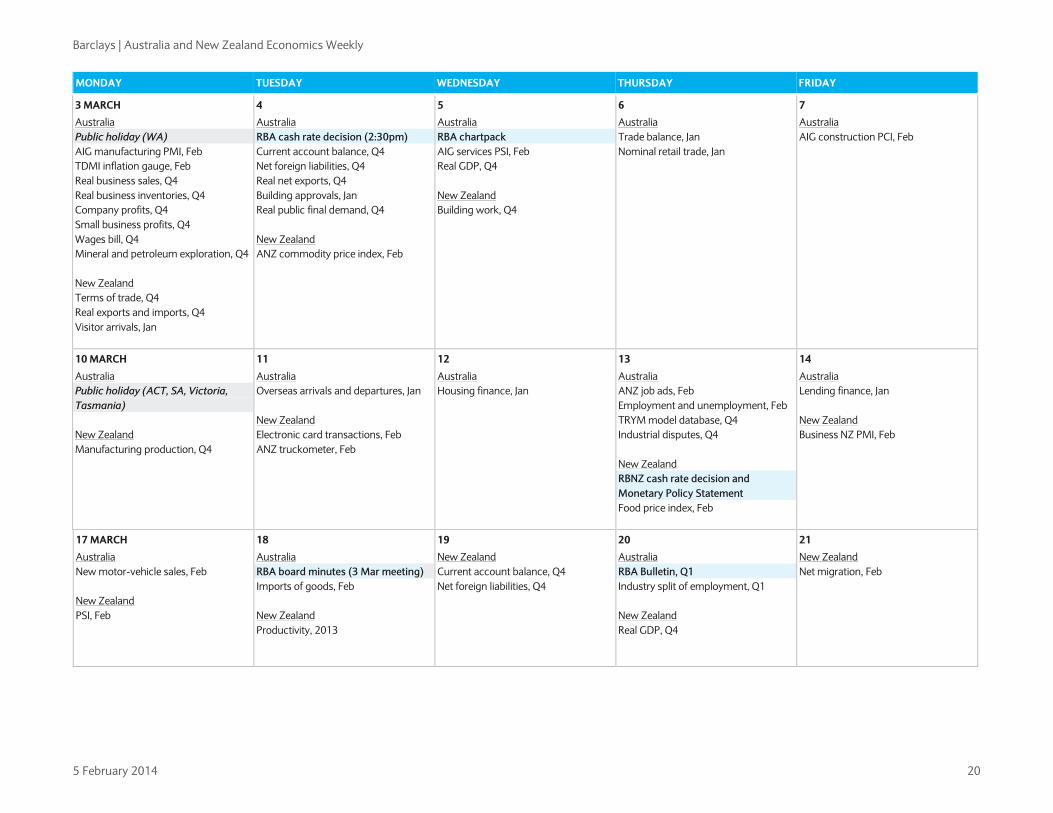
5 February 2014 20
MONDAY TUESDAY WEDNESDAY THURSDAY FRIDAY
3 MARCH 4 5 6 7
Australia Public holiday (WA) AIG manufacturing PMI, Feb TDMI inflation gauge, Feb Real business sales, Q4 Real business inventories, Q4 Company profits, Q4 Small business profits, Q4 Wages bill, Q4 Mineral and petroleum exploration, Q4 New Zealand Terms of trade, Q4 Real exports and imports, Q4 Visitor arrivals, Jan
Australia RBA cash rate decision (2:30pm) Current account balance, Q4 Net foreign liabilities, Q4 Real net exports, Q4 Building approvals, Jan Real public final demand, Q4 New Zealand ANZ commodity price index, Feb
Australia RBA chartpack AIG services PSI, Feb Real GDP, Q4 New Zealand Building work, Q4
Australia Trade balance, Jan Nominal retail trade, Jan
Australia AIG construction PCI, Feb
10 MARCH 11 12 13 14
Australia Public holiday (ACT, SA, Victoria, Tasmania) New Zealand Manufacturing production, Q4
Australia Overseas arrivals and departures, Jan New Zealand Electronic card transactions, Feb ANZ truckometer, Feb
Australia Housing finance, Jan
Australia ANZ job ads, Feb Employment and unemployment, Feb TRYM model database, Q4 Industrial disputes, Q4 New Zealand RBNZ cash rate decision and Monetary Policy Statement Food price index, Feb
Australia Lending finance, Jan New Zealand Business NZ PMI, Feb
17 MARCH 18 19 20 21
Australia New motor-vehicle sales, Feb New Zealand PSI, Feb
Australia RBA board minutes (3 Mar meeting) Imports of goods, Feb New Zealand Productivity, 2013
New Zealand Current account balance, Q4 Net foreign liabilities, Q4
Australia RBA Bulletin, Q1 Industry split of employment, Q1 New Zealand Real GDP, Q4
New Zealand Net migration, Feb

Barclays | Australia and New Zealand Economics Weekly
5 February 2014 21
MONDAY TUESDAY WEDNESDAY THURSDAY FRIDAY
24 MARCH 25 26 27 28
Australia RBA Deputy Governor Lowe speaks on “Opportunities and challenges for market-based financing” (Sydney, 3:45pm) New Zealand Visitor arrivals, Feb Industry split of productivity, 2013
Australia RBA Financial Stability Review (11:30am) Persons not in the labour force, Sep
Australia Population, Q3 ABS information paper “Review of interstate migration method” Financial accounts, Q4 ABS “Producer and international trade price indexes: Concepts, sources and methods, 2013” New Zealand Trade balance, Feb
Australia Production of selected construction materials, Feb
31 MARCH 1 APRIL 2 3 4
Australia RP Data-Rismark house prices, Feb Counts of Australian businesses, Q2 RBA private-sector credit, Feb New Zealand Building consents, Feb
Australia RBA cash rate decision (2:30pm) AIG manufacturing PMI, Mar
Australia RBA chartpack ABS job vacancies, Q1 Building approvals, Feb Engineering construction (revised), Q4 New Zealand Business operations survey, 2013
Australia AIG services PSI, Mar Trade balance, Feb Nominal retail trade, Feb
7 APRIL 8 9 10 11
Australia AIG construction PCI, Mar TDMI inflation gauge, Mar New Zealand Dwelling and household estimates, Q1
Australia Housing finance, Feb New Zealand Electronic card transactions, Mar
Australia Employment and unemployment, Mar
Australia Lending finance, Feb New Zealand Food price index, Mar
14 APRIL 15 16 17 18
Australia RBA board minutes (1 Apr meeting)
Australia Building activity (revised), Q4 New Zealand CPI, Q1
Australia Imports of goods, Mar New motor-vehicle sales, Mar
Australia and New Zealand Good Friday public holiday
Barclays | Australia and New Zealand Economics Weekly
5 February 2014 22
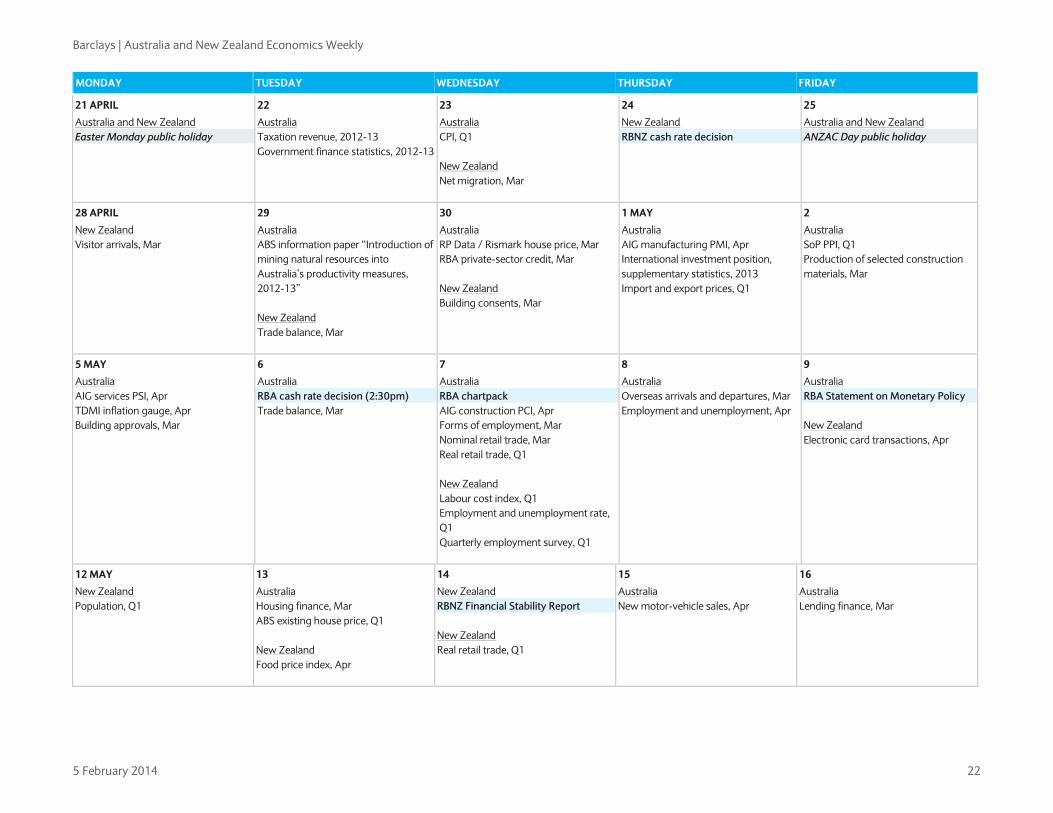
MONDAY TUESDAY WEDNESDAY THURSDAY FRIDAY
21 APRIL 22 23 24 25
Australia and New Zealand Easter Monday public holiday
Australia Taxation revenue, 2012-13 Government finance statistics, 2012-13
Australia CPI, Q1 New Zealand Net migration, Mar
New Zealand RBNZ cash rate decision
Australia and New Zealand ANZAC Day public holiday
28 APRIL 29 30 1 MAY 2
New Zealand Visitor arrivals, Mar
Australia ABS information paper “Introduction of mining natural resources into Australia’s productivity measures, 2012-13” New Zealand Trade balance, Mar
Australia RP Data / Rismark house price, Mar RBA private-sector credit, Mar New Zealand Building consents, Mar
Australia AIG manufacturing PMI, Apr International investment position, supplementary statistics, 2013 Import and export prices, Q1
Australia SoP PPI, Q1 Production of selected construction materials, Mar
5 MAY 6 7 8 9
Australia AIG services PSI, Apr TDMI inflation gauge, Apr Building approvals, Mar
Australia RBA cash rate decision (2:30pm) Trade balance, Mar
Australia RBA chartpack AIG construction PCI, Apr Forms of employment, Mar Nominal retail trade, Mar Real retail trade, Q1 New Zealand Labour cost index, Q1 Employment and unemployment rate, Q1 Quarterly employment survey, Q1
Australia Overseas arrivals and departures, Mar Employment and unemployment, Apr
Australia RBA Statement on Monetary Policy New Zealand Electronic card transactions, Apr
12 MAY 13 14 15 16
New Zealand Population, Q1
Australia Housing finance, Mar ABS existing house price, Q1 New Zealand Food price index, Apr
New Zealand RBNZ Financial Stability Report New Zealand Real retail trade, Q1
Australia New motor-vehicle sales, Apr
Australia Lending finance, Mar

Barclays | Australia and New Zealand Economics Weekly
5 February 2014 23
MONDAY TUESDAY WEDNESDAY THURSDAY FRIDAY
19 MAY 20 21 22 23
Australia Imports of goods, Apr New Zealand Capital goods price index, Q1 PPI, Q1 Farm expenses price index, Q1
Australia RBA board minutes (6 May meeting) Trade in services by country and state, 2013
Australia Wage price index, Q1 New Zealand Net migration, Apr
New Zealand Visitor arrivals, Apr
26 MAY 27 28 29 30
New Zealand Trade balance, Apr
Australia Real imports of goods, Q1 Trade balance (revised), Q1
Australia Employee earnings, benefits and trade union membership, Q3 Australian industry, 2012-13 Real construction work done, Q1
Australia Real capital expenditure, Q1 Real equipment investment, Q1 Expected nominal capital expenditure (revised), 2013-14 Expected nominal capital expenditure (revised), 2014-15 Characteristics of Australian exporters, 2012-13
Australia RBA private-sector credit, Apr New Zealand Building consents, Apr
2 JUNE 3 4 5 6
Australia Public holiday (WA) AIG manufacturing PMI, May TDMI inflation gauge, May Real business sales, Q1 Real business inventories, Q1 Company profits, Q1 Small business profits, Q1 Wages bill, Q1 Mineral and petroleum exploration, Q1 Building approvals, A[r New Zealand Public holiday
Australia RBA cash rate decision (2:30pm) Current account balance, Q1 Real net exports, Q1 Net foreign liabilities, Q1 Real public final demand, Q1 Nominal retail trade, Apr New Zealand Export and import prices, Q1 Real exports and imports, Q1
Australia RBA chartpack AIG services PSI, May Real GDP, Q1 Overseas arrivals and departures, Apr New Zealand Building work, Q1
Australia Trade balance, Apr Industrial disputes, Q1
Australia AIG construction PCI, May
9 JUNE 10 11 12 13
Australia Queen’s birthday public holiday New Zealand Wholesale trade, Q1
Australia Housing finance, Apr New Zealand Manufacturing production, q1
New Zealand Electronic card transactions, May
Australia TRYM model database, Q1 Employment and unemployment, May New Zealand RBNZ cash rate decision and Monetary Policy Statement
Australia Lending finance, Apr New Zealand Food price index, May
Source: Australian Bureau of Statistics, Bloomberg, Reserve Bank of Australia, Reserve Bank of New Zealand, Statistics New Zealand, Barclays Research

Barclays | Australia and New Zealand Economics Weekly
5 February 2014 24
RECENT RESEARCH
Australia analysis
January 2014 − Overshooting the target: The RBA’s view on the currency and inflation − Strong migration, dismal per capita growth and the end of the mining boom − Gauging inflation pressure from the business surveys
December 2013 − Baby boomers and the decline in the participation rate − Cutting to the chase: The capex survey and GDP
November 2013 − Business indicators, the economy and monetary policy − Q&A on RBA FX intervention − An improvement in the demand for labour − Fiscal austerity − Dismal productivity, the output gap and the neutral cash rate
October 2013 − Housing and non-mining construction unlikely to offset falling mining capex − Losing your job − The market and economists: Which is best at forecasting rate hikes? − Leading indicators of rate rises − Risk-taking in the housing market
September 2013 − A bounce in business confidence − New data on the quality of home loans show Australia in the same boat as NZ − Macro influences on the Australian-US bond spread
August 2013 − The dynamics of Australian swap spreads − Does the RBA believe its own forecasts when setting interest rates? − The RBA updates its estimate of the boost to growth from a lower exchange rate − House prices reach an all-time high
New Zealand analysis
December 2013 − Baby boomers in NZ, the participation rate and retirement savings
September 2013 − A modified Taylor Rule for New Zealand
July 2013 − A first look at spillover effects from a potential hard landing in China to New Zealand
April 2013 − Can the RBNZ forecast rates better than the market?
Analyst Certification We, Kieran Davies and Hamish Pepper, hereby certify (1) that the views expressed in this research report accurately reflect our personal views about any or all of the subject securities or issuers referred to in this research report and (2) no part of our compensation was, is or will be directly or indirectly related to the specific recommendations or views expressed in this research report. Important Disclosures: Barclays Research is a part of the Corporate and Investment Banking division of Barclays Bank PLC and its affiliates (collectively and each individually, "Barclays"). For current important disclosures regarding companies that are the subject of this research report, please send a written request to: Barclays Research Compliance, 745 Seventh Avenue, 14th Floor, New York, NY 10019 or refer to http://publicresearch.barclays.com or call 212-526-1072. Barclays Capital Inc. and/or one of its affiliates does and seeks to do business with companies covered in its research reports. As a result, investors should be aware that Barclays may have a conflict of interest that could affect the objectivity of this report. Barclays Capital Inc. and/or one of its affiliates regularly trades, generally deals as principal and generally provides liquidity (as market maker or otherwise) in the debt securities that are the subject of this research report (and related derivatives thereof). Barclays trading desks may have either a long and / or short position in such securities, other financial instruments and / or derivatives, which may pose a conflict with the interests of investing customers. Where permitted and subject to appropriate information barrier restrictions, Barclays fixed income research analysts regularly interact with its trading desk personnel regarding current market conditions and prices. Barclays fixed income research analysts receive compensation based on various factors including, but not limited to, the quality of their work, the overall performance of the firm (including the profitability of the investment banking department), the profitability and revenues of the Fixed Income, Currencies and Commodities Division and the potential interest of the firm’s investing clients in research with respect to the asset class covered by the analyst. To the extent that any historical pricing information was obtained from Barclays trading desks, the firm makes no representation that it is accurate or complete. All levels, prices and spreads are historical and do not represent current market levels, prices or spreads, some or all of which may have changed since the publication of this document. Barclays produces various types of research including, but not limited to, fundamental analysis, equity-linked analysis, quantitative analysis, and trade ideas. Recommendations contained in one type of research may differ from recommendations contained in other types of research, whether as a result of differing time horizons, methodologies, or otherwise. Unless otherwise indicated, Barclays trade ideas are provided as of the date of this report and are subject to change without notice due to changes in prices. In order to access Barclays Statement regarding Research Dissemination Policies and Procedures, please refer to https://live.barcap.com/publiccp/RSR/nyfipubs/disclaimer/disclaimer-research-dissemination.html. In order to access Barclays Research Conflict Management Policy Statement, please refer to: http://group.barclays.com/corporates-and-institutions/research/research-policy.
Disclaimer: This publication has been prepared by the Corporate and Investment Banking division of Barclays Bank PLC and/or one or more of its affiliates (collectively and each individually, "Barclays"). It has been issued by one or more Barclays legal entities within its Corporate and Investment Banking division as provided below. It is provided to our clients for information purposes only, and Barclays makes no express or implied warranties, and expressly disclaims all warranties of merchantability or fitness for a particular purpose or use with respect to any data included in this publication. Barclays will not treat unauthorized recipients of this report as its clients. Prices shown are indicative and Barclays is not offering to buy or sell or soliciting offers to buy or sell any financial instrument. Without limiting any of the foregoing and to the extent permitted by law, in no event shall Barclays, nor any affiliate, nor any of their respective officers, directors, partners, or employees have any liability for (a) any special, punitive, indirect, or consequential damages; or (b) any lost profits, lost revenue, loss of anticipated savings or loss of opportunity or other financial loss, even if notified of the possibility of such damages, arising from any use of this publication or its contents. Other than disclosures relating to Barclays, the information contained in this publication has been obtained from sources that Barclays Research believes to be reliable, but Barclays does not represent or warrant that it is accurate or complete. Barclays is not responsible for, and makes no warranties whatsoever as to, the content of any third-party web site accessed via a hyperlink in this publication and such information is not incorporated by reference. The views in this publication are those of the author(s) and are subject to change, and Barclays has no obligation to update its opinions or the information in this publication. The analyst recommendations in this publication reflect solely and exclusively those of the author(s), and such opinions were prepared independently of any other interests, including those of Barclays and/or its affiliates. This publication does not constitute personal investment advice or take into account the individual financial circumstances or objectives of the clients who receive it. The securities discussed herein may not be suitable for all investors. Barclays recommends that investors independently evaluate each issuer, security or instrument discussed herein and consult any independent advisors they believe necessary. The value of and income from any investment may fluctuate from day to day as a result of changes in relevant economic markets (including changes in market liquidity). The information herein is not intended to predict actual results, which may differ substantially from those reflected. Past performance is not necessarily indicative of future results. This communication is being made available in the UK and Europe primarily to persons who are investment professionals as that term is defined in Article 19 of the Financial Services and Markets Act 2000 (Financial Promotion) Order 2005. It is directed at, and therefore should only be relied upon by, persons who have professional experience in matters relating to investments. The investments to which it relates are available only to such persons and will be entered into only with such persons. Barclays Bank PLC is authorised by the Prudential Regulation Authority and regulated by the Financial Conduct Authority and the Prudential Regulation Authority and is a member of the London Stock Exchange. The Corporate and Investment Banking division of Barclays undertakes U.S. securities business in the name of its wholly owned subsidiary Barclays Capital Inc., a FINRA and SIPC member. Barclays Capital Inc., a U.S. registered broker/dealer, is distributing this material in the United States and, in connection therewith accepts responsibility for its contents. Any U.S. person wishing to effect a transaction in any security discussed herein should do so only by contacting a representative of Barclays Capital Inc. in the U.S. at 745 Seventh Avenue, New York, New York 10019. Non-U.S. persons should contact and execute transactions through a Barclays Bank PLC branch or affiliate in their home jurisdiction unless local regulations permit otherwise. Barclays Bank PLC, Paris Branch (registered in France under Paris RCS number 381 066 281) is regulated by the Autorité des marchés financiers and the Autorité de contrôle prudentiel. Registered office 34/36 Avenue de Friedland 75008 Paris. This material is distributed in Canada by Barclays Capital Canada Inc., a registered investment dealer and member of IIROC (www.iiroc.ca). Subject to the conditions of this publication as set out above, Absa Capital, the Investment Banking Division of Absa Bank Limited, an authorised financial services provider (Registration No.: 1986/004794/06. Registered Credit Provider Reg No NCRCP7), is distributing this material in South Africa. Absa Bank Limited is regulated by the South African Reserve Bank. This publication is not, nor is it intended to be, advice as defined and/or contemplated in the
(South African) Financial Advisory and Intermediary Services Act, 37 of 2002, or any other financial, investment, trading, tax, legal, accounting, retirement, actuarial or other professional advice or service whatsoever. Any South African person or entity wishing to effect a transaction in any security discussed herein should do so only by contacting a representative of Absa Capital in South Africa, 15 Alice Lane, Sandton, Johannesburg, Gauteng 2196. Absa Capital is an affiliate of Barclays. In Japan, foreign exchange research reports are prepared and distributed by Barclays Bank PLC Tokyo Branch. Other research reports are distributed to institutional investors in Japan by Barclays Securities Japan Limited. Barclays Securities Japan Limited is a joint-stock company incorporated in Japan with registered office of 6-10-1 Roppongi, Minato-ku, Tokyo 106-6131, Japan. It is a subsidiary of Barclays Bank PLC and a registered financial instruments firm regulated by the Financial Services Agency of Japan. Registered Number: Kanto Zaimukyokucho (kinsho) No. 143. Barclays Bank PLC, Hong Kong Branch is distributing this material in Hong Kong as an authorised institution regulated by the Hong Kong Monetary Authority. Registered Office: 41/F, Cheung Kong Center, 2 Queen's Road Central, Hong Kong. Information on securities/instruments that trade in Taiwan or written by a Taiwan-based research analyst is distributed by Barclays Capital Securities Taiwan Limited to its clients. The material on securities/instruments not traded in Taiwan is not to be construed as 'recommendation' in Taiwan. Barclays Capital Securities Taiwan Limited does not accept orders from clients to trade in such securities. This material may not be distributed to the public media or used by the public media without prior written consent of Barclays. This material is distributed in South Korea by Barclays Capital Securities Limited, Seoul Branch. All equity research material is distributed in India by Barclays Securities (India) Private Limited (SEBI Registration No: INB/INF 231292732 (NSE), INB/INF 011292738 (BSE), Registered Office: 208 | Ceejay House | Dr. Annie Besant Road | Shivsagar Estate | Worli | Mumbai - 400 018 | India, Phone: + 91 22 67196363). Other research reports are distributed in India by Barclays Bank PLC, India Branch. Barclays Bank PLC Frankfurt Branch distributes this material in Germany under the supervision of Bundesanstalt für Finanzdienstleistungsaufsicht (BaFin). This material is distributed in Malaysia by Barclays Capital Markets Malaysia Sdn Bhd. This material is distributed in Brazil by Banco Barclays S.A. This material is distributed in Mexico by Barclays Bank Mexico, S.A. Barclays Bank PLC in the Dubai International Financial Centre (Registered No. 0060) is regulated by the Dubai Financial Services Authority (DFSA). Principal place of business in the Dubai International Financial Centre: The Gate Village, Building 4, Level 4, PO Box 506504, Dubai, United Arab Emirates. Barclays Bank PLC-DIFC Branch, may only undertake the financial services activities that fall within the scope of its existing DFSA licence. Related financial products or services are only available to Professional Clients, as defined by the Dubai Financial Services Authority. Barclays Bank PLC in the UAE is regulated by the Central Bank of the UAE and is licensed to conduct business activities as a branch of a commercial bank incorporated outside the UAE in Dubai (Licence No.: 13/1844/2008, Registered Office: Building No. 6, Burj Dubai Business Hub, Sheikh Zayed Road, Dubai City) and Abu Dhabi (Licence No.: 13/952/2008, Registered Office: Al Jazira Towers, Hamdan Street, PO Box 2734, Abu Dhabi). Barclays Bank PLC in the Qatar Financial Centre (Registered No. 00018) is authorised by the Qatar Financial Centre Regulatory Authority (QFCRA). Barclays Bank PLC-QFC Branch may only undertake the regulated activities that fall within the scope of its existing QFCRA licence. Principal place of business in Qatar: Qatar Financial Centre, Office 1002, 10th Floor, QFC Tower, Diplomatic Area, West Bay, PO Box 15891, Doha, Qatar. Related financial products or services are only available to Business Customers as defined by the Qatar Financial Centre Regulatory Authority. This material is distributed in the UAE (including the Dubai International Financial Centre) and Qatar by Barclays Bank PLC. This material is distributed in Saudi Arabia by Barclays Saudi Arabia ('BSA'). It is not the intention of the publication to be used or deemed as recommendation, option or advice for any action (s) that may take place in future. Barclays Saudi Arabia is a Closed Joint Stock Company, (CMA License No. 09141-37). Registered office Al Faisaliah Tower, Level 18, Riyadh 11311, Kingdom of Saudi Arabia. Authorised and regulated by the Capital Market Authority, Commercial Registration Number: 1010283024. This material is distributed in Russia by OOO Barclays Capital, affiliated company of Barclays Bank PLC, registered and regulated in Russia by the FSFM. Broker License #177-11850-100000; Dealer License #177-11855-010000. Registered address in Russia: 125047 Moscow, 1st Tverskaya-Yamskaya str. 21. This material is distributed in Singapore by the Singapore branch of Barclays Bank PLC, a bank licensed in Singapore by the Monetary Authority of Singapore. For matters in connection with this report, recipients in Singapore may contact the Singapore branch of Barclays Bank PLC, whose registered address is One Raffles Quay Level 28, South Tower, Singapore 048583. Barclays Bank PLC, Australia Branch (ARBN 062 449 585, AFSL 246617) is distributing this material in Australia. It is directed at 'wholesale clients' as defined by Australian Corporations Act 2001. IRS Circular 230 Prepared Materials Disclaimer: Barclays does not provide tax advice and nothing contained herein should be construed to be tax advice. Please be advised that any discussion of U.S. tax matters contained herein (including any attachments) (i) is not intended or written to be used, and cannot be used, by you for the purpose of avoiding U.S. tax-related penalties; and (ii) was written to support the promotion or marketing of the transactions or other matters addressed herein. Accordingly, you should seek advice based on your particular circumstances from an independent tax advisor. © Copyright Barclays Bank PLC (2014). All rights reserved. No part of this publication may be reproduced in any manner without the prior written permission of Barclays. Barclays Bank PLC is registered in England No. 1026167. Registered office 1 Churchill Place, London, E14 5HP. Additional information regarding this publication will be furnished upon request.

AS7265