Barcelona objectives - European Commission · Barcelona objectives The development of childcare...
48
Barcelona objectives The development of childcare facilities for young children in Europe with a view to sustainable and inclusive growth Report from the Commission to the European Parliament, the Council, the European Economic and Social Committee and the Committee of the Regions Justice
Transcript of Barcelona objectives - European Commission · Barcelona objectives The development of childcare...

Barcelonaobjectives
The development of childcare facilities for young children in Europe with a view to sustainable and inclusive growth
Report from the Commission to the European Parliament, the Council, the European Economic
and Social Committee and the Committee of the Regions
Justice

Europe Direct is a service to help you find answers to your questions about the European Union.
Freephone number (*) :
00 800 6 7 8 9 10 11(*) Certain mobile telephone operators do not allow access to 00 800 numbers or these calls may be billed.
More information on the European Union is available on the Internet (http://europa.eu).
Cataloguing data can be found at the end of this publication.
Luxembourg: Publications Office of the European Union, 2013
ISBN 978-92-79-29898-1doi:10.2838/43161
© European Commission, 2013Reproduction is authorised provided the source is acknowledged
Photos: © Fotolia
Printed in Belgium
Printed on elemental chlorine-free bleached paper (ECF)

Barcelonaobjectives
The development of childcare facilities for young children in Europe with a view to sustainable and inclusive growth
Report from the Commission to the European Parliament, the Council, the European Economic
and Social Committee and the Committee of the Regions


Table of contents1. Introduction . . . . . . . . . . . . . . . . . . . . . . . . . . . . . . . . . . . . . . . . . . . . . . . . . . . . . . . . . . . . . . . 4
2. Achieving the Barcelona objectives: a necessity . . . . . . . . . . . . . . . . . . . . . . . . . . . . . . 5
3. State of play . . . . . . . . . . . . . . . . . . . . . . . . . . . . . . . . . . . . . . . . . . . . . . . . . . . . . . . . . . . . . . . 7
4. Quality: Still uneven across Europe . . . . . . . . . . . . . . . . . . . . . . . . . . . . . . . . . . . . . . . . . . 14
5. Achieving the Barcelona objectives, a renewed commitment in the Europe 2020 Strategy . . . . . . . . . . . . . . . . . . . . . . . . 17
Graphs and tables . . . . . . . . . . . . . . . . . . . . . . . . . . . . . . . . . . . . . . . . . . . . . . . . . . . . . . . . . . . 19

1. Introduction The availability of high quality, affordable childcare facilities for young children from birth to compulsory school age (1) is a priority for the European Union. These facilities include day nurseries and other daycare centres including family daycare, professional certified childminders, pre-school education or equivalent, mandatory school education and centre-based services outside school hours.
In 2002, the Barcelona European Council set objectives in this area: ‘Member States should remove disincentives to female labour force participation, taking into account the demand for childcare facilities and in line with national patterns of provision, to provide childcare by 2010 to at least 90 % of children between 3 years old and the mandatory school age and at least 33 % of children under 3 years of age (2)’.
Since then, achieving the Barcelona objectives has been at the heart of European priority setting, first in the Lisbon Strategy and subsequently in the Europe 2020 Strategy (3). Indeed, the ability of the Member States to significantly and sustainably increase the employment rate depends on, among other things, the opportunities men and women have to achieve a work-life balance. The availability of quality childcare facilities is crucial in this respect. Together
(1) In this report, the terms ‘childcare services’ ‘childcare facilities’ and ‘early childhood education and care (ECEC)’ are used interchangeably.
(2) http://www.consilium.europa.eu/uedocs/cms_data/docs/pressdata/en/ec/71025.pdf
(3) COM(2010) 2020.
with flexible working arrangements and the provision of a suitable system of family leave, it forms a raft of measures for achieving a work-life balance promoted at European level. It is also an essential investment in the development of children and the fight against premature school leaving and against the transmission of inequalities (4).
Although some progress has been made since 2002, and despite the commitment of the Member States through two successive European pacts for equality between women and men (5), the provision of childcare facilities at European level in 2010 was still not in line with these objectives. Furthermore, the situation appeared to deteriorate in some Member States in 2011.
It is necessary to reopen the debate on this deficit and its causes, while at the same time proposing solutions and policy approaches to reaching these objectives. This third European Semester is a political opportunity to reaffirm the importance of childcare facilities and their contribution to the objectives of the European Union.
Against this background and as announced in the Strategy for equality between women and men 2010-15 (6), the aim of this document is to report on the state of play of the implementation of the Barcelona objectives in the Member States. It identifies the obstacles and challenges faced by Member States in developing their childcare facilities for young children, it highlights the need to reaffirm these objectives and serves as a reminder of the commitments the European Commission has made to supporting the Member States, and, together with the recent, additional initiatives from the Commission such as the proposal for a Directive on gender balance on company boards (7), it represents a real contribution from the Commission to the attainment of the Europe 2020 Strategy’s objectives and the promotion of gender equality.
(4) COM(2013) 83. (5) 2011/C 155/02. (6) COM(2010) 491. (7) COM(2012) 614.
4 Barcelona objectives
2. Achieving the Barcelona objectives: a necessity
…if we are to achieve the objectives of the Europe 2020 Strategy
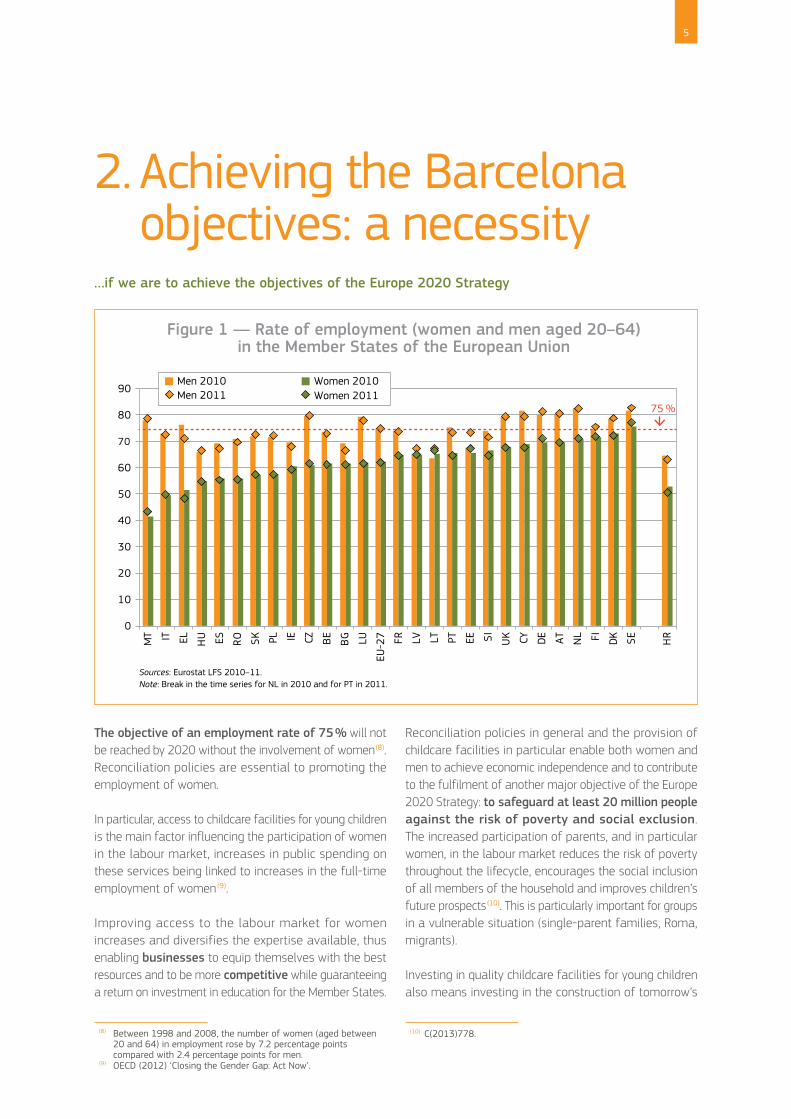
Figure 1 — Rate of employment (women and men aged 20–64) in the Member States of the European Union
Sources: Eurostat LFS 2010–11. Note: Break in the time series for NL in 2010 and for PT in 2011.
0
10
20
30
40
50
60
70
80
90
75 %
MT IT EL HU ES RO SK PL IE CZ BE
BG LU
EU-2
7 FR LV LT PT EE SI UK CY DE AT NL FI DK SE HR
Men 2010 Women 2010 Men 2011 Women 2011
The objective of an employment rate of 75 % will not be reached by 2020 without the involvement of women (8). Reconciliation policies are essential to promoting the employment of women.
In particular, access to childcare facilities for young children is the main factor influencing the participation of women in the labour market, increases in public spending on these services being linked to increases in the full-time employment of women (9).
Improving access to the labour market for women increases and diversifies the expertise available, thus enabling businesses to equip themselves with the best resources and to be more competitive while guaranteeing a return on investment in education for the Member States.
(8) Between 1998 and 2008, the number of women (aged between 20 and 64) in employment rose by 7.2 percentage points compared with 2.4 percentage points for men.
(9) OECD (2012) ‘Closing the Gender Gap: Act Now’.
Reconciliation policies in general and the provision of childcare facilities in particular enable both women and men to achieve economic independence and to contribute to the fulfilment of another major objective of the Europe 2020 Strategy: to safeguard at least 20 million people against the risk of poverty and social exclusion. The increased participation of parents, and in particular women, in the labour market reduces the risk of poverty throughout the lifecycle, encourages the social inclusion of all members of the household and improves children’s future prospects (10). This is particularly important for groups in a vulnerable situation (single-parent families, Roma, migrants).
Investing in quality childcare facilities for young children also means investing in the construction of tomorrow’s
(10) C(2013)778.
5

human capital. It gives each child a better start in life and lays the foundations for success in terms of education, social integration, personal development and later, fitness for work (11). This is a social investment with high potential.
Providing a quality service and universal access to quality pre-school education has been identified as one of the preventive policies to combat early school leaving (12)
, as also confirmed by the Council of the European Union (13).
…if we are to achieve the objective of equality between men and women
The participation of women in paid work is linked to the distribution of family responsibilities between the sexes. Women still adjust their working arrangements when they have children by taking leave, by working part time or by withdrawing from the labour market. This has an impact on their pay and on their pension. The pay difference between women and men remains intolerably high (16.2 % per hour on average (14)) in the European Union. The greatest differences can be observed in countries where there is little provision of childcare facilities for young children (15). The lack of promotion of work-life balance policies in general and the lack of childcare facilities in particular present a major obstacle to the economic independence of women and their progression towards positions of responsibility (16).
…if we are to face the demographic challenge head on
Finally, against the background of the current demographic slowdown in Europe, the availability of childcare facilities encourages people to plan a family. It transpires that the Member States which currently have the highest birth rates are those which have also done most to facilitate the work-life balance for parents and which have a high rate of female employment.
(11) COM(2011) 66. (12) COM(2011) 18. (13) 2011/C 191/01. (14) Eurostat, 2011 tsdsc340. (15) OECD (2012) ‘Closing the Gender Gap: Act Now’. (16) COM(2012) 615.
6 Barcelona objectives

3. State of playIn 2008, a first review (17) revealed that the demand for formal systems of childcare was far from being met, in particular for children under 3. It highlighted the high costs incurred by parents and the opening hours of facilities, which were incompatible with full-time work. Five years on, despite a slight improvement, the challenges remain.
Considerable improvements still need to be made in the availability of services for children under 3
According to the European data (18), in 2010 only 10 Member States (DK, SE, NL, FR, ES, PT, SI, BE, LU and UK) had achieved the Barcelona objective for children under 3. Altogether 15 Member States were below 25 % (see figure 2). Availability was particularly poor in the Czech Republic, Poland and Slovakia, where the rate of childcare
(17) COM(2008) 638. (18) This measures the proportion of children cared for by formal
services such as those listed in the introduction.
was less than 5 %. In most countries there was a clear difference between urban areas and more rural areas and/or between regions (e.g. in Germany and in Italy).
Between 2006 and 2010 the childcare rate for the under 3s increased slightly…
…from an EU average of 26 % to 29 % (19). However, there were noticeable changes in some Member States, notably in France where the childcare rate went from 31 % in 2006 to 43 % in 2010. This figure should continue to rise owing to a significant plan to develop the provision of childcare which aims to create 200 000 new childcare solutions between 2009 and 2012. Another noticeable change was in Slovenia (+8 percentage points), probably linked to a 2008 amendment to the law on kindergartens which introduced state -funded childcare for second and subsequent children.
(19) EU-25. In 2011 the childcare rate was 30 % on average in the EU-25 and 27.
Figure 2 — Percentage of children under 3 cared for in formal structures (and, for information, by weekly time spent in care) 2010–11
Source: Eurostat — EU-SILC 2010–11.Note: Some of the data have been compiled from small samples and are statistically unreliable, including the total for: AT, BG, CY, CZ, EL, HR, LT, MT, PL, RO and SK.
0
10
20
30
40
50
60
70
80
90
CZ PL SK BG RO EL AT HU MT LT LV DE EE IT CY
EU-2
7 FI IE UK BE LU PT SI ES FR NL SE DK HR
CH IS NO
33 %
30 h and more in 2010
1 to 29 h in 2010total 2011
7

The diversified and decentralised French system combines individual and group childcare for the 0–3 age group.
Professional childminders are the most popular form of childcare. Since its introduction in 1991, this form of childcare accounts for around one third of children under 3 whose parents both work. Parents who choose this form of childcare receive a monthly allowance which varies depending on the childminder’s status and remuneration, the child’s age and the household income. The childminder profession has evolved significantly over the years. The statutory number of hours of training has doubled and a contract with the parents is now compulsory. Regular health and safety checks are carried out. However, there are still some problems to overcome. It remains a profession that is not widely respected and low-income families sometimes think twice before using this type of childcare. Also, many childminders will be retiring in the next few years.
For several years, the French public authorities have been encouraging private companies to finance staff nurseries. Also known as company crèches, they are opened and run by private companies, public enterprises or hospitals to care for the children of their staff members.
Number of places in 2010
Childcare in a group or home setting
Group day nurseries 86 767
of which are company crèches 8 315
Drop-in day nurseries 30 484
Kindergartens 8 030
Mixed type childcare facilities 177 984
With a childminder 59 060
Number of childminders 855 400*
* number of places in theory — Source: DREES 2012.
Use of childcare facilities increases with children’s age
In 2010 for the category of children between 3 and the compulsory school age (20), 11 Member States (BE, ES, FR, SE, DE, EE, NL, SI, IE, DK and UK) achieved the objective of 90 % irrespective of the number of hours of attendance. In 2011 Italy also achieved the objective, but the childcare rate in Ireland, the Netherlands and Spain declined noticeably, sinking below the objective of 90 %. In all, 13 Member States are below 80 % and still need to make significant improvements. Croatia and Poland are below 50 % (figure 3).
The childcare rate for children between 3 and the compulsory school age has remained fairly stable...
… in the EU, rising from 84 % in 2006 to 86 % in 2010 (21). This very slight average increase hides more noticeable variations in countries where a combination of measures has been introduced. In Luxembourg (+22 percentage points), maisons-relais [childcare centres offering before and after school care for children up to the age of 18] were introduced in 2005, the school system was reorganised
(20) Compulsory school age is 4, 5, 6 or 7 depending on the Member State.
(21) EU-25. In 2011 the childcare rate was 86 % on average in the EU-25 and 27.
in 2009 (the year the child turns 3, still optional, was integrated into the first cycle of basic schooling) and childcare vouchers were introduced in 2009. In Austria (+13 percentage points), a federal contribution to the expansion of the number of nursery places (24 500 new places for children aged between 0 and 6 between 2008 and 2010) was implemented. Also, 20 hours of free childcare per week, introduced in 2009, has had a positive influence on the childcare rate. Between 2010 and 2011, there was a decline in the childcare rate in several countries, in particular Romania (-25 percentage points), Spain (-9 percentage points), Cyprus (-8 percentage points) and Ireland (-8 percentage points).
Figure 3 — Percentage of children between the age of 3 and the mandatory school age cared for in formal structures
(and, for information, by weekly time spent in care) 2010–11
Source: Eurostat — EU-SILC 2010–11.
0
20
40
60
80
100
120
PL BG LV RO LT EL CZ SK MT FI HU LU PT CY AT
EU-2
7 IT UK
DK IE NL SI DE EE FR SE ES BE HR
CH NO IS
90 %
30 h and more in 2010
from 1 to 29 h in 2010total 2011
8 Barcelona objectives

in 2009 (the year the child turns 3, still optional, was integrated into the first cycle of basic schooling) and childcare vouchers were introduced in 2009. In Austria (+13 percentage points), a federal contribution to the expansion of the number of nursery places (24 500 new places for children aged between 0 and 6 between 2008 and 2010) was implemented. Also, 20 hours of free childcare per week, introduced in 2009, has had a positive influence on the childcare rate. Between 2010 and 2011, there was a decline in the childcare rate in several countries, in particular Romania (-25 percentage points), Spain (-9 percentage points), Cyprus (-8 percentage points) and Ireland (-8 percentage points).
Figure 3 — Percentage of children between the age of 3 and the mandatory school age cared for in formal structures
(and, for information, by weekly time spent in care) 2010–11
Source: Eurostat — EU-SILC 2010–11.
0
20
40
60
80
100
120
PL BG LV RO LT EL CZ SK MT FI HU LU PT CY AT
EU-2
7 IT UK
DK IE NL SI DE EE FR SE ES BE HR
CH NO IS
90 %
30 h and more in 2010
from 1 to 29 h in 2010total 2011
The childcare voucher system (CSA) was introduced on 1 March 2009 in Luxembourg by the Ministry of Family and Integration together with local authorities. It gives the holder 3 hours of educational childcare free of charge per week. For the next 21 hours of educational childcare, parents pay a heavily reduced rate of at most EUR 3 per hour. This rate is calculated on the basis of the household income and the position of the child within the family. The system was introduced in order to ensure maximum benefit for children at risk of poverty or living on the edge of exclusion. For these children, the system offers more hours of help per week during the school year and during school holidays.
In January 2011, 69.27 % of children aged 0–12 were enrolled in this system (22). This policy is accompanied by a constant increase in the number of childcare places, including in childcare facilities for children of school age up to the age of 12.
(22) Ministry of Equal Opportunities, 2011.
9

A snapshot of the situation in the Member States with regard to the Barcelona objectives in 2011
� 6 Member States had achieved both objectives: Sweden, Belgium, France, Slovenia, Denmark and the United Kingdom.
� In the next category, 7 Member States had achieved one of the two objectives. These are Portugal, Spain, the Netherlands and Luxembourg for the first age group and Germany, Italy and Estonia for the oldest children.
� 3 Member States were about to achieve one of the objectives. Finland had a childcare rate of more than 25 % for the first age group, Ireland and Austria had a childcare rate of 80 % for the second age group.
� 11 Member States still needed to make significant improvements, in particular Poland, Bulgaria, Greece, Romania, Slovakia and the Czech Republic, as well as Croatia.
AT
BE
BG
CY CZ
DE
DK
EE
EL
ES
FR
HU
IE
IT
LT
LU LV MT
NL
PL
PT
RO
SI
SK
UK
HR
SE
FI
30
40
50
60
70
80
90
100
0 10 20 30 40 50 60 70 80 90 100
Sources: Eurostat — EU-SILC 2010.Notes: ‘Close to an objective’ refers to countries that had around 25 % of coverage for children under 3 (Finland) or around 80 % coverage of children aged 3 to the mandatory school age (Austria, Ireland).
Figure 4 — Formal child care by age category — 2011Children cared for as a percentage of all children in the same age category
% Children less than 3 years
Both of the objectives achieved
None of the objectives achieved
One of the objectives achieved
Close to an objective
Barcelona target for
second age category: met
Barcelona target for first age category: met
% c
hild
ren
from
3 y
ears
to
com
puls
ory
scho
ol a
ge
Attendance is almost exclusively part time…
…in some of the countries that have achieved the objective. The hours of attendance at childcare services vary enormously from one country to another. In several countries the services are used part time and do not cover a full working week. In the United Kingdom, the Netherlands and Ireland the services are essentially used on a part-time basis regardless of age group. It should be noted that, in some cases, attendance is well below 30 hours per week. In the United Kingdom, for example, a significant number of places are provided for less than 20 hours for the youngest children. It is worth knowing that using these services on a part-time basis is either a choice or a result of constraints. In the latter case, the lack of full-time services could act as an obstacle to full-time employment, in particular for single mothers.
10 Barcelona objectives

Alternative strategies for looking after young children…
…can be introduced. For this reason, the relatively low childcare rate in some countries is not necessarily linked to a penury of childcare services. For example, family leave rights can have an impact on the demand for childcare for the youngest children. It is common in the Nordic countries and in Slovenia for children to be looked after by their parents during the first year, after which they are entitled to group childcare. In other countries, the leave available is much longer and, combined with a penury of childcare services, can have a negative influence on the participation of women in the labour market. It is, therefore, essential, in addition to providing childcare services in line with parental leave, to create the possibility for fathers to take family leave.
Recourse to informal childcare (23) (provided in most cases by grandparents) is significant in both age categories, but in the majority of cases is had only on a part-time basis and cannot be a solution that allows parents to work full time. Also, the tendency to extend working life could make the option of using grandparents more difficult.
(23) This means childcare by a childminder (who is not checked by an organised structure) at the child’s home or that of the childminder, or childminding by grandparents, other members of the family (other than the parents), other parents, friends or neighbours.
Sources: European Commission’s Expert Group on Gender and Employment issues — EGGE. Note: Paternity leave included when at least 1 week leave.
Figure 5 — Maternity leave, paternity leave and parental leave benefiting from a replacement rate of at least 2/3 of pay.
Total leave in months, 2010
0
5
10
15
20
25
30
LT HU
RO EE SE DE BG LV SI DK FI PT CZ SK IE PL IT ES FR CY BE EL LU NL AT MT
UK
Attitudes vary in most countries depending on the age of the child
Day nurseries and other formal childcare services are generally viewed positively for older children, but positive perception is lower for very young children even if the benefits of quality childcare for the development of children (in particular those from underprivileged backgrounds) have largely been proven (24). Figure 6 shows a certain reciprocity between the level of approval of the fact that women with young children work full time, on the one hand, and the childcare rate of the under 3s in childcare facilities and the employment rate of mothers, on the other. DK, FI, SE and SI combine a strong approval rate with high childcare rates and high rates of employed mothers. Figure 6 also shows disapproval rates of more than 50 % for the Netherlands, Austria and Estonia. Finally, although the full-time employment of young mothers is generally approved of in countries such as Poland and Cyprus, the availability of childcare services still needs to be developed to allow mothers to fulfil their intentions on the labour market.
(24) OECD (2012) Starting strong III.
11

Cost is still an obstacle for a good many parents
Formal childcare services for young children are a way for parents to enter and/or remain in the labour market only if they are financially accessible. However, 53 % of mothers who declare that they do not work or that they work part time for reasons linked to formal childcare services (25) consider price to be an obstacle. This figure is higher than 70 % in Ireland, the Netherlands, Romania and the United Kingdom.
The governments of most Member States subsidise formal childcare services (in the form of direct grants, income-dependent parental allowances, tax breaks, vouchers). Figure 7 shows that the cost for families is still high, in particular in the United Kingdom and in Ireland, where they account for 41 % of net income in households where both parents work. Also, the cost of these services has to be considered in relation to the other social and fiscal policies that have an impact on family incomes, as even with heavily subsidised childcare services there can be few advantages for parents, and in particular the lower earner, to work if the work is heavily taxed.
(25) Source: LFS ad-hoc module 2010 Reconciliation between work and family life — 23 % and 18 % of mothers whose youngest child is under 3 or between 3 and the compulsory school age respectively work part time or do not work for reasons related to childcare.
Source: European Social Survey 2006–07. Note: Here, EU corresponds to the average among 20 Member States.
Figure 6 — (Dis)approval of the fact that a woman with a child under 3 works full time
0 %
10 %
20 %
30 %
40 %
50 %
60 %
70 %
80 %
90 %
100 %
EE DE AT UK
HU SK BG IE NL
EU FR PT ES SE SI PL BE CY FI DK CH NO
ApproveNeutralDisapprove
The cost of childcare services does not have the same impact on high-income households as on low-income households…
…and the extent of the differences is striking. In France, for example, 64 % of households in the top income quintile use childcare services compared with just 15 % of households in the bottom quintile. The situation is similar in other countries where the childcare rate is significant, such as Belgium, Finland and Ireland, but also in countries where the childcare rate is lower. Conversely, in Denmark the childcare rate is very high among households in the bottom quintile, while in Sweden, Slovenia and Germany use of childcare facilities is the same across all households (26). It will not be possible to achieve the Barcelona objectives without accessibility, including financial accessibility, to childcare services for all social groups.
(26) EU-SILC, 2010.
-60
-50
-40
-30
-20
-10
0
10
20
30
40
50
60
70
80
EL BE HU EE PL SE SK PT ES LU CZ DK FI NL
DE FR AT
OEC
D-3
0 SI UK IE IS NO CH
Child
care
-rel
ated
cos
ts a
nd b
enefi
ts, %
of
AW
Source: OECD (2011), Doing Better for Families, Figure 4.A2.1 A.
Figure 7 — Childcare costs incurred by parents as a % of the average wage — 2008
Childcare fee Childcare benefitsTax reductions Other benefits
Net cost% of net family income
12 Barcelona objectives

Priority criteria can also be a barrier…
…if there is a penury of provision, notably for parents who do not work or are unemployed when precedence is given to working parents and in particular to two-income households, thereby preventing the second parent from returning to work.
In Belgium (Flanders), demand for childcare places is greater than the supply. Structural measures have been introduced by the Flemish Community to improve access to these facilities. A parental financial participation system (PFP) based on income for (non)-subsidised group childcare or childminder services, which already existed in the subsidised sector, has been introduced. Also, an official priority system has been established in childcare facilities that work with the PFP system. 20 % of places must be reserved for single-parent families and low-income families (who in both cases are unemployed or on labour market inclusion programmes, etc.).
The cost of childcare services does not have the same impact on high-income households as on low-income households…
…and the extent of the differences is striking. In France, for example, 64 % of households in the top income quintile use childcare services compared with just 15 % of households in the bottom quintile. The situation is similar in other countries where the childcare rate is significant, such as Belgium, Finland and Ireland, but also in countries where the childcare rate is lower. Conversely, in Denmark the childcare rate is very high among households in the bottom quintile, while in Sweden, Slovenia and Germany use of childcare facilities is the same across all households (26). It will not be possible to achieve the Barcelona objectives without accessibility, including financial accessibility, to childcare services for all social groups.
(26) EU-SILC, 2010.
-60
-50
-40
-30
-20
-10
0
10
20
30
40
50
60
70
80
EL BE HU EE PL SE SK PT ES LU CZ DK FI NL
DE FR AT
OEC
D-3
0 SI UK IE IS NO CH
Child
care
-rel
ated
cos
ts a
nd b
enefi
ts, %
of
AW
Source: OECD (2011), Doing Better for Families, Figure 4.A2.1 A.
Figure 7 — Childcare costs incurred by parents as a % of the average wage — 2008
Childcare fee Childcare benefitsTax reductions Other benefits
Net cost% of net family income
13

4. Quality: Still uneven across Europe
Perceived quality remains a major factor for parents…
…although it is not high on the list of factors that dissuade parents from using formal childcare services for young children. It is a problem for 27 % of people on average in Europe, after cost (59 %), availability (58 %) and access–distance and opening hours (41 %) (27).
Measuring quality: a vast field of study
Much work is being done on the quality of early childhood education and care (ECEC) services for young children in the EU.
In its Communication on ECEC (28), the European Commission reiterated the need to further improve access and to provide universal services. It listed the key areas for quality, such as curricula, staff, governance and financing, where public cooperation at European level could improve the accessibility and quality of childcare services. At the invitation of the Ministers of Education (29), and within the framework of the open coordination method, the Commission has recently introduced a thematic working group of political decision-makers, university lecturers and ECEC practitioners with the aim of establishing a European ECEC quality framework.
Among the structural characteristics of the services, the size of the group varies on average from 10 to 14 children for the 0–3 age group and from 20 to 25 children for the 3–6 age group (30). The ratio of staff to children is around 1:15 in most Member States, ranging from 1:6 in Estonia to 1:21.5 in France for pre-school education (31).
(27) Eurofound 3rd EQLS 2012. (28) COM(2011) 66. (29) 2011/C 175/03. (30) EGGE 2009. (31) SWD(2012) 373.
Many unqualified people still work in the sector
The educational background of the staff providing ECEC services varies enormously from one country to another and ability requirements for auxiliary staff and assistants (who account for up to 40–50% of the staff) are often neglected even though research and international policy documents recommend that at least 60 % of staff should hold a three-year post-secondary diploma (32). Assistants (who often deal with personal care and contact with parents) are likely to have little or no initial training and limited access to further training, unlike the teaching staff (who work with the children), who are often highly qualified and often benefit from these opportunities (33).
Working conditions in the sector are still precarious…
…in most countries. High staff turnover due to part-time or atypical contracts is common and has a negative impact on the quality of service. Career prospects are very limited and the sector does not convey the image of a provider of quality employment (34).
The sector is characterised by a mainly female workforce...
…with 2 % to 3 % being men, with the exception of Denmark (8 %). Experts agree that the number of men working in the sector should reach 10 % in order to combat gender stereotyping (35).
(32) International Standard Classification of Education, level 5. (33) CORE study for EC/DG EAC2011. (34) Eurofound 2012. (35) CORE study for EC/DG EAC2011.
14 Barcelona objectives

Denmark, where ECEC services are integrated into the social protection system, is a pioneer in the development of competencies for professionals working in the sector (pædagoguddannelsen). The generic approach (36) (which qualifies students to work in a variety of educational settings and also enables greater occupational mobility) and the recognition of previous experience have helped attract more men to the ECEC sector in Denmark compared with the other Member States of the EU.
(36) As opposed to the specialist approach where practitioners are trained and qualified to work with specific age groups in certain types of establishment (e.g. day nursery, pre-school). CORE study for EC/DG EAC2011.
Direct public financing makes for more efficient management…
…by the public authorities, economies of scale, better quality at national level, more efficient training of teaching staff and fairer access than the system of paying benefits to parents (37).
In 2009, the share of spending allocated to ECEC as a percentage of GDP was particularly high in Denmark, Sweden, the United Kingdom and France, which were all above the threshold of 1 % recommended by experts (38).
(37) OECD 2011 Doing Better for Families. (38) European Commission Childcare Network 1996 — Quality targets
in services for young children.
Source: OECD Family database, Indicator PF3.1 2009).Note 1: CY refers to Southern Cyprus only. Note 2: Figures for Spain cannot be disaggregated by educational level. Note 3: Pre-primary spending as a % of GDP not available for Greece and Luxembourg.
Public expenditure on childcare and early educational services includes all public financial support (in cash, in-kind or through the tax system) for families with children participating in formal daycare services (e.g. crèches, daycare centres and family daycare for children under 3) and pre-school institutions (including kindergartens and daycare centres which usually provide educational content as well as traditional care for children aged from 3 to 5 inclusive).
Figure 8 — Public spending on early childhood education and care as a % of GDP 2009
0
0.2
0.4
0.6
0.8
1.0
1.2
1.4
1.6
1.8
DK SE UK FR FI NL BG RO BE HU IT LV LT ES SI DE MT IE LU CZ AT PT EE SK CY PL EL IS NO CH
Spending on pre-school education as a % of GDP ( 3–6 years)
Spending on childcare for young children as a % of GPD ( 0–3 years)
15

However, this spending takes different forms and does not have the same impact on the development and quality of the services.
Integrated systems seem to offer more coherence…
…between childcare structures and the rest of the education system, more resources for the under 3s and better staff training (39). The split model, under which childcare for young children (under the age of 3) and pre-school education (up to compulsory school age) are separate, is the most common in Europe. In other countries, the political decision-makers have evolved towards a system where the provision for young children is integrated into the education system, as in Latvia, Slovenia, England, Scotland and Sweden, or into the pedagogical system in the wider sense, as in Finland. These two models coexist in just a few countries (Denmark, Greece, Spain, Cyprus and Lithuania). Integrating childcare services into a large entity requires a unitary structure and a shared approach to access, subsidies, programmes and staff. This results in greater financial efficiency (40). It would appear to be necessary to favour interaction between the care and the education of children, even in a split system, if all their needs (cognitive, social, emotional and physical) are to be met (41).
(39) Kaga Y., Bennett J. and Moss P. (2010), Caring and Learning Together, A Cross-national Study of Integration of Early Childhood Care and Education within Education, Paris, UNESCO.
(40) Eurydice 2009 — ECEC: Tackling social and cultural inequalities. (41) COM(2011) 66.
The responsibility for developing ECEC policies is shared…
…in many countries between central government and local authorities. One of the positive consequences of decentralisation has been the integration of early childhood education and care at local level and improved consideration of local needs. Decentralisation can also engender certain risks. The delegation of powers and responsibilities can accentuate differences in access and quality between regions (42). A systemic and more integrated approach to ECEC services at local, regional and national level involving all the relevant stakeholders — including families — is required, together with close cross-sectoral collaboration between different policy sectors, such as education, culture, social affairs, employment, health and justice (43).
(42) OECD Starting Strong II: Early Childhood Education and Care. (43) Council conclusions on ECEC. 2011/C 175/03.
16 Barcelona objectives

5. Achieving the Barcelona objectives, a renewed commitment in the Europe 2020 Strategy
More than 10 years after they were adopted, the Barcelona objectives have not been achieved by most Member States. Furthermore, the situation is deteriorating in several Member States. Significant improvements still need to be made to achieve a satisfactory level of availability, especially for children under 3. Also, the cost of services is still a significant obstacle for parents, as are opening hours, which are not always compatible with their occupational commitments. Investment in quality education and care services that are universal and accessible to all must be continued. This effort must be made largely at Member State level. The Commission is providing support on several fronts.
The development of childcare services under supervision as part of the European Semester
Opening up access to the labour market and to employ-ment for a second wage-earner from the household thanks to suitable tax incentives and the introduction of afford-able, quality childcare services was identified as a priority in the Annual Growth Survey (44). Nine Member States (AT, CZ, DE, HU, IT, MT, PL, SK, UK) received a recommendation on the employment of women and on the availability of childcare services in 2012. Seven of these countries had already received a recommendation in 2011, while Malta and Slovakia received one for the first time in 2012.
(44) COM(2012) 750.
The Structural Funds are an important lever
In the 2007–13 period, it is estimated that EUR 2.6 billion from the Structural Funds was allocated to actions aiming to promote the employment and sustainable participation of women in the labour market and a work-life balance, including measures to facilitate access to care services for dependants. In addition, around EUR 616 million from the European Development Fund was made available to Member States between 2007 and 2013 to finance childcare infrastructures (45). Almost all the Member States allocated resources to childcare services. However, the total expenditure varies enormously from one Member State to another depending on the budget available under the Structural Funds and the current state of provision of services.
(45) By the end of 2011, 74 % of this budget had been allocated to selected projects.
17

The ESF plays an important role in the implementation and the functioning of institutional childcare services in Poland under the Human Capital Operational Programme (HC OP). Since 2012, one action with a budget of EUR 46 million has made it possible to cofinance (at 85 %) projects involving:
� support for the implementation and func-tioning of day nurseries and children’s clubs, including covering childcare costs for the under 3s if at least one of the parents returns to the labour market after a break related to the birth or education of the children;
� support for childminder services.
The first call for proposals will make it possible to set up 171 day nurseries, 23 children’s clubs and 7 agreements for the provision of services by a childminder. This measure is part of a wider initiative for regulatory reform and enlargement of the type and quantity of childcare services provided (Mulash programme).
There is a similar action to cofinance projects related to pre-school education for children aged between 3 and 5 years with a budget of EUR 369 million.
The Commission continues to work with social partners…
…who play a key role in the area of work-life balance in cooperation with the public authorities.
The Commission will also strengthen cooperation between its departments…
…working on policies relevant to ECEC (such as justice, fundamental rights and citizenship, education and culture, employment, social policy, health, etc.).
The Commission will continue to monitor the Barcelona objectives…
…by helping the Member States to develop their statistical capacity by improving data collection and refining the way the use of childcare services is measured for the
EU-SILC survey, in particular by collecting comparable information on the barriers to these services (cost, unmet demand, etc.).
The Commission will continue to support the Member States
� Whenever necessary throughout the European Semesters, the Commission will continue to adopt specific recommendations calling on the Member States to achieve the Barcelona objectives and to maintain public investment despite the economic crisis.
� When programming the European Funds, the Commission will work together with the Member States to make full use of the cofinancing options offered by the Structural Funds and other Community programmes such as ‘Erasmus for all’, including during the next programming period, for developing ECEC services and services for other dependent people, staff training and improving service quality.
Developing childcare services for pre-school children is not enough in itself to give women and men free choice of how to best achieve a work-life balance and it does not take into account the difficulties faced at different stages in life. The Commission must therefore act:
� by promoting a combination of measures to achieve a work-life balance consisting of flexible working methods, a family leave system and the availability of affordable, quality care services for pre-school children as well as for pre-adolescent children outside school hours and for other dependants;
� by also encouraging the Member States to remove barriers (including tax constraints) to occupational activity for women and to encourage fathers to take on more family responsibilities, for example by taking family leave in the same way as women.
This report reflects the Commission’s own commitment, within the limits of its competences, to supporting the achievement of the Barcelona objectives and the development of affordable, accessible and quality childcare services in order to eliminate the obstacles to parents’ participation in employment, to foster social inclusion and to promote equality of opportunity between women and men.
18 Barcelona objectives

Graphs and tables
19


Table of contents1. Relation between childcare services and employment rate . . . . . . . . . . . . . . . . . . . . 22
1.1. Impact of parenthood on employment . . . . . . . . . . . . . . . . . . . . . . . . . . . . . . . . . . . . . . . . . . . . . . . . . 22
1.2. Relation between the employment rate of women 20-49 with at least one child below 6 years of age and the proportion of children in formal childcare (2010) . . . . . . . . . . . . . . . . . . 24
1.3. Relation between the provision of formal childcare services and the gender pay gap . . . . . . . . . . . . . . . . . . . . . . . . . . . . . . . . . . . . . . . . . . . . . . . . . . . . . . . . . . . . . . 24
1.4. Female employment and total fertility rates (1980–2009) . . . . . . . . . . . . . . . . . . . . . . . . . . . . . . . 25
2. Assessing achievement of the Barcelona targets . . . . . . . . . . . . . . . . . . . . . . . . . . . . . 26
2.1. Indicators . . . . . . . . . . . . . . . . . . . . . . . . . . . . . . . . . . . . . . . . . . . . . . . . . . . . . . . . . . . . . . . . . . . . . . . . . . . 26
2.2. Availability . . . . . . . . . . . . . . . . . . . . . . . . . . . . . . . . . . . . . . . . . . . . . . . . . . . . . . . . . . . . . . . . . . . . . . . . . . . 282.2.1. Percentage of children up to 3 years of age cared for under formal arrangements
by weekly time spent in care (2010-11) . . . . . . . . . . . . . . . . . . . . . . . . . . . . . . . . . . . . . . . . . . . . . . . . . . . . . . . . . . . . . . . . . . . . . . . 28
2.2.2. Trends in the percentage of children up to 3 years of age cared for under formal arrangements 2006–10 . . . . . . . . . . 29
2.2.3. Percentage of children from 3 years of age to the mandatory school age cared for under formal arrangements
by weekly time spent in care (2010-11) . . . . . . . . . . . . . . . . . . . . . . . . . . . . . . . . . . . . . . . . . . . . . . . . . . . . . . . . . . . . . . . . . . . . . . . 30
2.2.4. Trends in the percentage of children from 3 years of age to the mandatory school age cared
for under formal arrangements (2006–10) . . . . . . . . . . . . . . . . . . . . . . . . . . . . . . . . . . . . . . . . . . . . . . . . . . . . . . . . . . . . . . . . . . . . . 31
2.2.5. Percentage of children up to 3 years of age and from 3 years
of age to the mandatory school age in informal childcare, (2010) . . . . . . . . . . . . . . . . . . . . . . . . . . . . . . . . . . . . . . . . . . . . . . . 32
2.3. Affordability, quality accessibility . . . . . . . . . . . . . . . . . . . . . . . . . . . . . . . . . . . . . . . . . . . . . . . . . . . . . . 342.3.1. Impact of the inadequacy of childcare services as a reason for women (aged 15–64 and with children up
to the mandatory school age) not working or working part time . . . . . . . . . . . . . . . . . . . . . . . . . . . . . . . . . . . . . . . . . . . . . . . . . 34
2.3.2. Main reasons for women (aged 15–64 and with children up to the mandatory school age)
not working or working part time by perceived shortcomings of childcare . . . . . . . . . . . . . . . . . . . . . . . . . . . . . . . . . . . . . . . 35
2.3.3. Components of net childcare cost (2008) . . . . . . . . . . . . . . . . . . . . . . . . . . . . . . . . . . . . . . . . . . . . . . . . . . . . . . . . . . . . . . . . . . . . . . 36
2.3.4. Percentage of children up to 3 years of age cared for in formal care by income quintiles in European countries,
households with at least one child <3 years, 2010 (%) . . . . . . . . . . . . . . . . . . . . . . . . . . . . . . . . . . . . . . . . . . . . . . . . . . . . . . . . . . 38
2.3.5. Indicators of early childhood care quality . . . . . . . . . . . . . . . . . . . . . . . . . . . . . . . . . . . . . . . . . . . . . . . . . . . . . . . . . . . . . . . . . . . . . . 39
2.3.6. Child/staff ratio . . . . . . . . . . . . . . . . . . . . . . . . . . . . . . . . . . . . . . . . . . . . . . . . . . . . . . . . . . . . . . . . . . . . . . . . . . . . . . . . . . . . . . . . . . . . . . 40
3. Support for efforts to achieve the Barcelona targets . . . . . . . . . . . . . . . . . . . . . . . . . 41
3.1. Amounts allocated to childcare infrastructures from European Regional Development Funds . . . .41
21

1. Relation between childcare services and employment rate
1.1. Impact of parenthood on employment The Member States where the impact of parenthood on the employment rate is high (greater than or equal to 20 pp) need to make the most effort to achieve the goal.
Source: Eurostat — EU-LFS 2010.
Empl
oym
ent
gap
betw
een
pare
nts
and
non
pare
nts
Employment impact of parenthood for women and men (25-49 y), 2010
-35
-30
-25
-20
-15
-10
-5
0
5
10
15
20
CZ HU SK IE MT
DE EE UK BG AT FI PL
EU-2
7 LV LU FR IT EL ES CY RO NL BE LT PT SE DK SI HR
Men
Women
In the Czech Republic the employment rate of mothersis 29.9 pp lower than that of women without children whereas the employment rate of fathers is 6.3 pp higher than that of men without children.
22 Barcelona objectives

Employment rate of women and men (aged from 25 to 49) according to their family status
Women without children
Women with a child under
12 yearsGap
Men without children
Men with a child under 12 years
Gap
CZ 86.3 56,3 -29,9 88,6 95.0 6.3
HU 78.8 51.4 -27.4 77.2 83.4 6.2
SK 81.1 56.0 -25.2 78.5 87.7 9.1
IE 77.4 57.5 -19.9 71.7 79.2 7.5
MT 61.5 42.5 -19.0 86.9 92.9 6.1
DE 84.0 65.7 -18.4 84.8 91.7 6.9
EE 82.3 64.9 -17.4 72.8 82.0 9.2
UK 82.5 66.1 -16.4 82.9 90.0 7.1
BG 78.5 65.1 -13.3 77.1 81.4 4.3
AT 85.7 73.6 -12.1 87.4 92.6 5.2
FI 84.1 72.1 -12.0 80.3 92.2 11.9
PL 79.1 67.5 -11.6 79.6 90.2 10.6
EU-27 77.3 65.8 -11.5 81.0 89.1 8.1
LV 79.0 69.6 -9.4 69.7 79.2 9.6
LU 79.1 69.9 -9.2 90.6 95.2 4.6
FR 81.5 72.8 -8.7 83.4 91.4 8.0
IT 63.2 54.6 -8.6 78.7 90.1 11.4
EL 66.4 58.5 -7.9 81.7 92.8 11.1
ES 68.3 60.5 -7.8 72.0 80.6 8.6
CY 81.3 74.6 -6.7 85.1 93.1 8.0
RO 71.8 65.8 -6.0 80.2 85.4 5.2
NL 83.1 78.3 -4.8 88.1 94.0 5.9
BE 78.5 73.9 -4.6 82.7 90.5 7.8
LT 78.6 74.8 -3.8 66.8 79.1 12.3
PT 77.3 74.0 -3.3 79.6 90.3 10.7
SE 81.7 80.3 -1.4 85.1 92.7 7.6
DK 82.3 83.9 1.6 79.5 89.9 10.4
SI 82.9 84.8 1.9 81.9 93.0 11.1
HR 70.3 70.7 0.4 72.2 83.6 11.4
Source: Eurostat — EU-LFS 2010.
23

1.2. Relation between the employment rate of women 20-49 with at least one child below 6 years of age and the proportion of children in formal childcare (2010)
Source: EU-SILC and Labour Force Survey.Note: Trend lines: 1) Left: y = 0.523x + 47.326, R2 = 0.504; 2) Right: y = 0.121x + 50.914, R2 = 0.018.
0 10 20 30 40 50 60 70 800
10
20
30
40
50
60
70
80
90
100
30 40 50 60 70 80 90 100 1100
10
20
30
40
50
60
70
80
90
Share of children aged 0–3 in formal childcare
DK
PL
BG
LV
LT
DKSI
NL SE
BEFR
ESDEEE
IEIT
UK
AT
CYPTLU
FI
EL
MT
HUSK
CZ
RO
NLSE
SI
PTBELU FR
ESUKFI
IE
LT
LV
CY
ATRO
PL
ELBG
DEIT
EEMT
SK HUCZ
1.2. Relation entre le taux d'emploi des femmes âgées de 20 à 49 ans avec aumoins un enfant de moins de 6 ans et la proportion d'enfants gardés dans
des structures formelles en 2010
Empl
oym
ent
rate
of
fem
ales
age
d 20
–49
with
yo
unge
st c
hild
bel
ow 6
yea
rs o
ld
Empl
oym
ent
rate
of
fem
ales
age
d 20
–49
with
yo
unge
st c
hild
bel
ow 6
yea
rs o
ld
Share of children aged 0–3 in formal childcare
1.3. Relation between the provision of formal childcare services and the gender pay gap
The provision of formal childcare services and parental leave policies are inversely correlated to the gender pay gap between women and men (aged 30 to 34):
1.3. Relation between the provision of formal childcare services and the gender pay gap
Source: OECD Family Database 2012; OECD Database on Earnings Distribution.
Gen
der
pay
gap
age
30–3
4
Enrolment rates of children under 3 in formal care, 2008
Panel A. Gender pay gap and childcare
0 20 40 60 80 %0
5
10
15
20
25
30%
R² = 0.5641
SKCZ
AT JP
FI
CAKP
US
AU UK
IENZ
BE
NODK
DE
Gen
der
pay
gap
age
30–3
4
Number of paid weeks of parental leave
Panel B. Gender pay gap and parental leave
0
%
50 100 150 200
R² = 0.6043
0
5
10
15
20
25
30
NO
DE
SK AT
CZFI
KP
JP
DK
BEIE
NZ
AUUK
US
CA
24 Barcelona objectives

1.4. Female employment and total fertility rates (1980–2009)
Source: OECD (2010b), OECD Family Database, SF2.1.Note: The y-axis (total fertility rate) scale is 1.0–3.5 for 1980 and 1.0–2.2 for 2009.
IE
KP
PTEL
NZ
BE
MX IEUS
NZ
AUUK
FR
IS
NOSV
DKFI
NL
CA
BE
ET
LUSL
CH
ATDEPT
PLSK
CZELES
JPHU
KP
IT
NL
LU
AUFR UK
JP
CADE
NOFI
DKSV
USIT
30 40 50 60 70 801.0
1.5
2.0
2.5
3.0
Tota
l fer
tility
rat
e
Tota
l fer
tility
rat
e
3.51980 2009
50 60 70 80 901.0
1.2
1.4
1.6
1.8
2.0
2.2
Employment rates of women aged 25-54 years Employment rates of women aged 25-54 years
1.4. Taux d’emploi féminin et indicateurs conjoncturels de fécondité, 1980-2009
25

2. Assessing achievement of the Barcelona targets
2.1. Indicators
In collaboration with the Member States in the Employment Committee (46), the European Commission has been working since 2002 to develop a methodology for collecting data to measure progress towards these targets on a harmonised EU basis. The following indicators were agreed upon in 2004 by the Employment Committee, and the EU Survey on Income and Living Conditions (EU-SILC) was chosen as the statistical instrument for measuring them:
Number of children cared for (under formal arrangements other than by the family) up to 30 hours in a normal week / 30 hours or more in a normal week as a proportion of all children in the same age group. Breakdown by:
� Children aged under 3 (0–2 years); � Children aged between 3 years and the mandatory
school age; � Children aged between the mandatory school age and
12 years in compulsory primary (or secondary) education.
The third age group (school children) is not covered by the Barcelona targets.
Definition of formal arrangements
The Employment Committee has also defined which childcare services are to be considered ‘formal arrangements’ and, as such, to be counted towards the Barcelona targets. ‘Formal arrangements’ are the sum of four variables of EU-SILC (47) (pre-school or equivalent, compulsory education, centre-based services outside school hours, a collective crèche or another daycare centre, including family daycare, professional certified childminders). Therefore, formal arrangements include all kinds of care organised and/or controlled by a structure (whether public or private). Care provided by childminders without any structure between the carer and the parents (direct arrangements) was excluded from the definition of ‘formal care’ in order to take account only of childcare recognised as fulfilling certain quality criteria.
(46) Art.150 of the Treaty on the Functioning of the European Union. (47) RL010, RL020, RL030 and RL040.
Interpretation of coverage rates
The indicators measure the coverage rates: they measure the number of children cared for under formal arrangements as a proportion of all children of the same age group. They measure the actual proportion of children benefiting from existing childcare provision in the EU for the two age groups and not directly from Member States’ provision e.g. in terms of number of childcare places.
When interpreting the coverage rate’s statistics, it should be borne in mind that the use of childcare facilities does not directly answer the question of whether demand is fully met. Actual demand for childcare can be influenced by the level of unemployment, the use of informal arrangements inside the family and the possibilities offered by the maternity/parental leave system. In addition, some children do not need childcare since a parent is on maternity/parental leave for a younger child. Therefore, for some countries, a relatively low coverage rate might indicate not a shortage, but an alternative way of looking after young children, e.g. in the form of extended parental leave options. However, for most countries, the influence of parental leave systems on the coverage rate is quite limited, notably due to the limited period for which parents can still receive a significant part of their income (less than six months in most countries).
26 Barcelona objectives

Number of hours of childcare per week
The indicators are calculated for two main categories based on the number of hours of childcare per week: from 1 to 29 hours and 30 hours or more. This distinction is important, since care provided for less than 30 hours per week does not necessarily enable the parents to work full time.
Mandatory school age (MSA)
Mandatory school age is the age at which compulsory schooling begins. It is generally between 5 and 7 years, but differs from one country to another:
CountriesMandatory school
age
Luxembourg 4
Cyprus, Greece, Hungary, Latvia, Malta, Netherlands, United Kingdom 5Austria, Belgium, Czech Republic, Denmark, France, Germany, Ireland, Italy, Poland, Portugal,
Slovakia, Slovenia, Spain, Romania6
Bulgaria, Estonia, Finland, Lithuania, Sweden 7
Source: Eurostat (2011) Childcare arrangement. Available at:http://epp.eurostat.ec.europa.eu/cache/ITY_SDDS/en/ilc_ca_esms.htm [accessed on 4 June 2012].
27

2.2. Availability
2.2.1. Percentage of children up to 3 years of age cared for under formal arrangements by weekly time spent in care (2010-11)
2010 2011
Countries From 1 to 29 hours
30 hours or over Total From 1 to
29 hours30 hours or over Total
AT 6u 3u 9u 11 3u 14u
BE 17 19 36 19 20 39
BG 1u 6u 7u 0u 7u 7u
CY 11u 13u 24u 7u 16u 23u
CZ 2u 0u 2u 4u 1u 5u
DE 7u 13 20 9 15 24
DK 10u 68 78 5u 69 74
EE 2u 19 21 4u 15 19
EL 3u 5u 8u 4u 15u 19u
ES 20 18 38 20 19 39
FI 8 20 28 6u 20 26
FR 17 26 43 18 26 44
HU 1u 8 9 1u 7u 8
IE 21 8u 29 10u 11u 21
IT 6 16 22 9 17 26
LT 2u 11u 13u 1u 6u 7u
LU 17 19 36 16 28 44
LV 1u 15 16 1u 14 15
MT 7u 4u 11u 8u 3u 11u
NL 44 6u 50 46 6u 52
PL 0u 2u 2u 0u 3u 3u
PT 5u 32 37 1u 34 35
RO 4u 3u 7u 1u 1u 2u
SE 18 33 51 19 32 51
SI 4u 33 37 3u 34 37
SK 0u 3u 3u 1u 3u 4u
UK 31 4u 35 30 5u 35
EU-27 14 14 28 15 15 30
HR 3u 37 40u 1u 14 15u
CH 15 14u 29 4 20 24
NO 1u 7u 8 7u 35u 42
IS 14u 14 28 4 35 39 Source: Eurostat SILC [ilc_caindformal].Note: u: data points computed based on small samples and therefore not considered statistically reliable.
28 Barcelona objectives

2.2.2. Trends in the percentage of children up to 3 years of age cared for under formal arrangements 2006–10
2006 2007 2008 2009 2010
AT 4u 8u 7u 10u 9u
BE 40 44 43 33 35
BG 16u 8u 11u 8u 7u
CH 27 26
CY 25 19u 26 22u 23u
CZ 2u 2u 2u 3u 3u
DE 17 17 19 19 20
DK 73 70 73 73 77
EE 19 15u 16 25 21
EL 10u 9u 12u 11 8u
ES 39 41 38 36 38
EU-25 26 27 29 29 29
EU-27 26 28 28 28
FI 26 26 26 27 28
FR 31 27 40 41 42
HR 8u
HU 8u 8u 7u 7u 9
IE 18 23 24 20 29
IS 33 40 40 41 40
IT 25 24 27 25 22
LT 5u 20u 9u 10u 13u
LU 31 25 26 34 36
LV 16u 17u 14u 15 16
MT 8u 13u 15u 8u 11u
NL 45 42 47 49 50
NO 100 36 48
PL 3u 3u 3u 3u 2u
PT 33 27u 33u 36 37
RO 6u 9u 5u 8u
SE 44 47 49 63 51
SI 28 30 30 31 36
SK 5u 2u 2u 3u 3u
UK 33 38 35 35 35 Source: Eurostat SILC [ilc_caindformal]Note: u: data points computed based on small samples and therefore not considered statistically reliable.
29

2.2.3. Percentage of children from 3 years of age to the mandatory school age cared for under formal arrangements by weekly time spent in care (2010-11)
2010 2011
CountriesFrom 1 to 29 hours
30 hours or over
Total From 1 to 29 hours
30 hours or over
Total
AT 58 26 84 57 28 85
BE 36 63 99 32 66 98
BG 4u 50 54 2u 58 60
CY 35 46 81 35 38 73
CZ 32 39 71 29 45 74
DE 46 46 92 46 44 90
DK 15 75 90 11 87 98
EE 6u 86 92 9u 83 92
EL 46 23 69 43 32 75
ES 45 50 95 45 41 86
FI 21 56 77 20 57 77
FR 47 47 94 43 52 95
HU 14 65 79 16 59 75
IE 73 17 90 68 14 82
IT 17 70 87 20 75 95
LT 9u 58 67 9u 56 65
LU 42 37 79 46 27 73
LV 5u 59 64 7u 66 73
MT 25u 49 74 29 44 73
NL 76 15 91 76 13 89
PL 10 32 42 9 34 43
PT 11u 68 79 7u 74 81
RO 49 17u 66 30 11u 41
SE 29 65 94 31 64 95
SI 14 77 91 11 81 92
SK 8u 64 72 13u 62 75
UK 67 22 89 66 27 93
EU-27 39 45 84 37 47 84
HR 13u 29 42 10u 41 51
CH 62 10u 72 65 12 77
NO 15 65 80 10u 77 87
IS 6u 92 98 8u 91 99 Source: Eurostat SILC [ilc_caindformal].Note: u: data points computed based on small samples and therefore not considered statistically reliable.
30 Barcelona objectives

2.2.4. Trends in the percentage of children from 3 years of age to the mandatory school age cared for under formal arrangements (2006–10)
2006 2007 2008 2009 2010
AT 71 70 71 80 83
BE 99 100 98 99 99
BG 58 59 66 55 54
CH 74 72
CY 81 80 78 81 81
CZ 67 68 69 64 71
DE 90 86 90 89 92
DK 96 97 97 84 90
EE 85 86 87 92 92
EL 61 65 55 58 69
ES 91 92 95 94 95
EU-25 83 82 85 85 86
EU-27 81 83 83 84
FI 77 76 77 78 77
FR 94 92 96 95 94
HR 42
HU 71 80 75 74 79
IE 93 86 85 87 90
IS 95 98 97 99 98
IT 90 90 91 92 87
LT 56 59 61 54 67
LU 57 66 77 71 79
LV 60 52 71 74 64
MT 57 64 76 77 74
NL 89 91 90 87 91
NO 100 81 81
PL 28 31 35 38 42
PT 75 74 78 81 79
RO 57 54 63 66
SE 92 91 94 94 94
SI 81 84 84 90 91
SK 73 76 60 76 72
UK 89 84 87 91 90
Source: Eurostat SILC [ilc_caindformal].Note: u: data points computed based on small samples and therefore not considered statistically reliable.
31

2.2.5. Percentage of children up to 3 years of age and from 3 years of age to the mandatory school age in informal childcare, (2010)
Informal care means care by independent childminders in the child’s or the childminder’s home, or care by grandparents, household members (who are not the parents), friends, neighbours or relatives.
Source: Eurostat — EU-SILC 2010.
2.2.5. Percentage of children up to three years of age and from three years of age to mandatory school age in informal childcare, (2010)
0
10
20
30
40
50
60
70
BG DK SE FI LT LV DE BE ES FR HU
EU-2
7 IE IT MT
SK EE PL UK
LU AT CZ SI CY RO PT EL NL
NO HR IS CH
% of children younger than 3
% of children between 3 and the MSA
32 Barcelona objectives
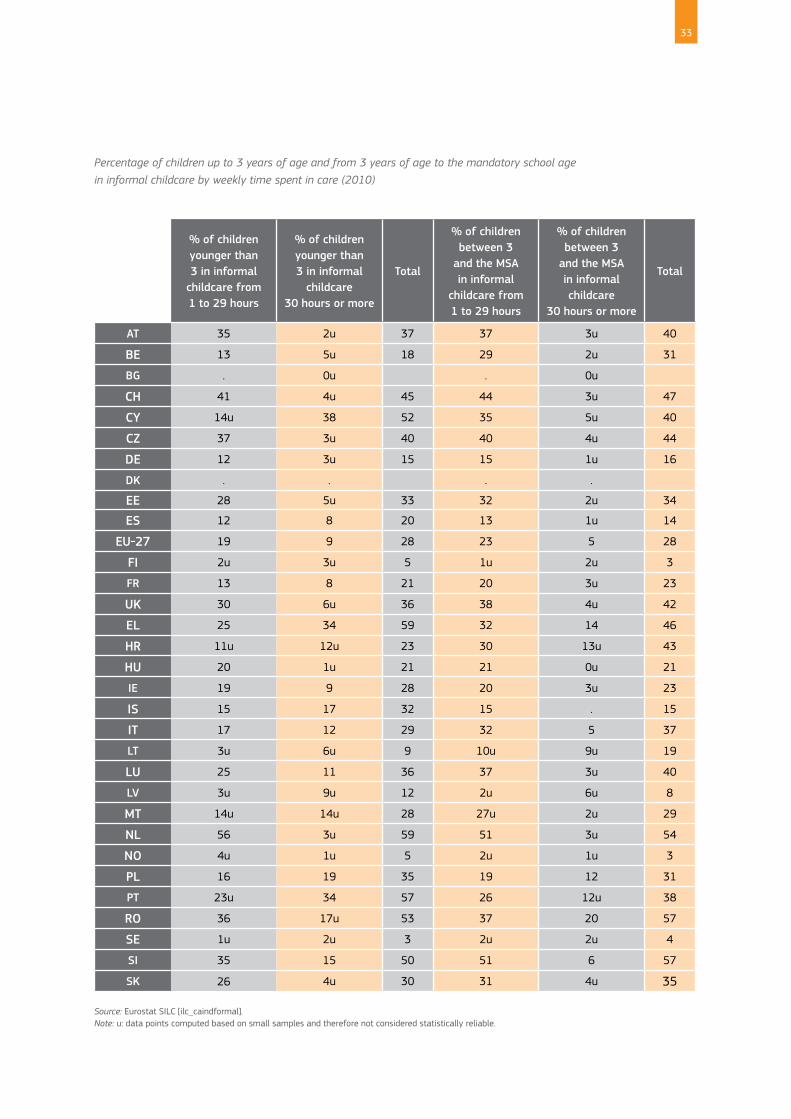
Percentage of children up to 3 years of age and from 3 years of age to the mandatory school age in informal childcare by weekly time spent in care (2010)
% of children younger than 3 in informal
childcare from 1 to 29 hours
% of children younger than 3 in informal
childcare 30 hours or more
Total
% of children between 3
and the MSA in informal
childcare from 1 to 29 hours
% of children between 3
and the MSA in informal childcare
30 hours or more
Total
AT 35 2u 37 37 3u 40
BE 13 5u 18 29 2u 31
BG . 0u . 0u
CH 41 4u 45 44 3u 47
CY 14u 38 52 35 5u 40
CZ 37 3u 40 40 4u 44
DE 12 3u 15 15 1u 16
DK . . . .
EE 28 5u 33 32 2u 34
ES 12 8 20 13 1u 14
EU-27 19 9 28 23 5 28
FI 2u 3u 5 1u 2u 3
FR 13 8 21 20 3u 23
UK 30 6u 36 38 4u 42
EL 25 34 59 32 14 46
HR 11u 12u 23 30 13u 43
HU 20 1u 21 21 0u 21
IE 19 9 28 20 3u 23
IS 15 17 32 15 . 15
IT 17 12 29 32 5 37
LT 3u 6u 9 10u 9u 19
LU 25 11 36 37 3u 40
LV 3u 9u 12 2u 6u 8
MT 14u 14u 28 27u 2u 29
NL 56 3u 59 51 3u 54
NO 4u 1u 5 2u 1u 3
PL 16 19 35 19 12 31
PT 23u 34 57 26 12u 38
RO 36 17u 53 37 20 57
SE 1u 2u 3 2u 2u 4
SI 35 15 50 51 6 57
SK 26 4u 30 31 4u 35
Source: Eurostat SILC [ilc_caindformal].Note: u: data points computed based on small samples and therefore not considered statistically reliable.
33
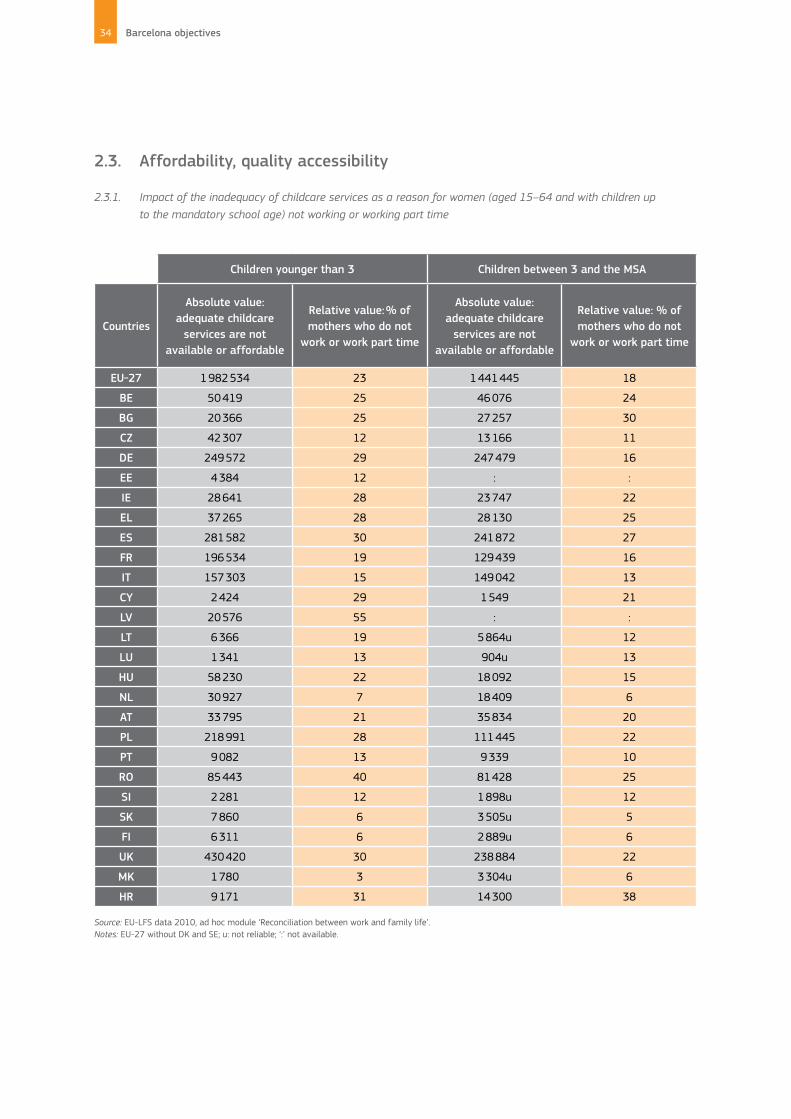
2.3. Affordability, quality accessibility
2.3.1. Impact of the inadequacy of childcare services as a reason for women (aged 15–64 and with children up to the mandatory school age) not working or working part time
Children younger than 3 Children between 3 and the MSA
Countries
Absolute value: adequate childcare
services are not available or affordable
Relative value: % of mothers who do not
work or work part time
Absolute value: adequate childcare
services are not available or affordable
Relative value: % of mothers who do not
work or work part time
EU-27 1 982 534 23 1 441 445 18
BE 50 419 25 46 076 24
BG 20 366 25 27 257 30
CZ 42 307 12 13 166 11
DE 249 572 29 247 479 16
EE 4 384 12 : :
IE 28 641 28 23 747 22
EL 37 265 28 28 130 25
ES 281 582 30 241 872 27
FR 196 534 19 129 439 16
IT 157 303 15 149 042 13
CY 2 424 29 1 549 21
LV 20 576 55 : :
LT 6 366 19 5 864u 12
LU 1 341 13 904u 13
HU 58 230 22 18 092 15
NL 30 927 7 18 409 6
AT 33 795 21 35 834 20
PL 218 991 28 111 445 22
PT 9 082 13 9 339 10
RO 85 443 40 81 428 25
SI 2 281 12 1 898u 12
SK 7 860 6 3 505u 5
FI 6 311 6 2 889u 6
UK 430 420 30 238 884 22
MK 1 780 3 3 304u 6
HR 9 171 31 14 300 38
Source: EU-LFS data 2010, ad hoc module ‘Reconciliation between work and family life’. Notes: EU-27 without DK and SE; u: not reliable; ‘:’ not available.
34 Barcelona objectives

2.3.2. Main reasons for women (aged 15–64 and with children up to the mandatory school age) not working or working part time by perceived shortcomings of childcare
Countries Not available Too expensive Insufficient quality
EU-27 25 53 4
BE 62 32 0u
BG 30 35 13
CZ 47 10u 3u
DK : : :
DE 25 31 :
EE : 63u :
IE 8 85 3
EL 21 67 6u
ES 18 60 2u
FR 33 57 :
IT 37 57 5
CY : 57 :
LV 27u 35 :
LT : : :
LU 34u 28u :
HU 32 25 20
MT : : :
NL 13u 71 :
AT 57 22 :
PL 35 57 4u
PT : 60 :
RO 13 80 6u
SI : 46u :
SK 29u 36u :
FI 27u : :
SE : : :
UK 10 73 4
HR 48 34u :
MK 22u 59u :
Source: EU-LFS data 2010, ad hoc module ‘Reconciliation between work and family life’. Notes: EU-27 without DK and SE; u: not reliable; ‘:’ not available.
53 % of women (aged 15–64 and with children up to the mandatory school age) who do not work or work part time because of inadequate childcare services in the EU report that childcare is too expensive.
35

2.3.3. Components of net childcare cost (2008)
Couple where the male earns 100 % of the average wage and the female earns 50 % of the average wage.
Source: OECD 2008 Tax-Benefit Models.Note: The childcare cost calculations for Austria reflect the situation in Vienna; for Belgium, the French-speaking community; the Czech Republic in villages and towns with more than 2 000 inhabitants; for Germany, Hamburg; for Iceland, Reykjavík; for Switzerland, Zurich; and for the United Kingdom, England. These results do not represent the situation in the rest of the country.
2.3.3. Components of net childcare cost (2008)
-60
-50
-40
-30
-20
-10
0
10
20
30
40
50
60
70
80
BE EL PT HU EE LU PL SE SK IS ES NL CZ DK FR FI DE SI
OEC
D-3
0
NO AT UK IE CH
Child
care
-rel
ated
cos
ts a
nd b
enefi
ts, %
of
AW
Childcare fee Childcare benefitsTax reductions Other benefits
Net cost% of net family income
36 Barcelona objectives

Childcare cost can reach half of the net income of a sole parent paid at 100% of the average wage (2008)
0
-60
-50
Source: OECD (2008b), Tax-Benefit Models.Note: Results are for 2008. Each family includes two children aged 2 and 3. ‘Family net income’ is the sum of gross earnings plus cash benefits minus taxes and social contributions. All fee reductions, including free pre-school education for certain age groups, are shown as rebates where possible. The childcare cost calculations for Austria reflect the situation in Vienna; for Belgium, the French-speaking community; the Czech Republic in villages and towns with more than 2 000 inhabitants; for Germany, Hamburg; for Iceland, Reykjavík; for Switzerland, Zurich; and for the United Kingdom, England. Childcare fees used are those determined by government, at either the national or local level, in Belgium, the Czech Republic, Finland, France, Hungary, Iceland, Latvia, Lithuania, Poland, the Slovak Republic and Slovenia. Childcare fees for Greece are calculated according to national guidelines.
-40
-30
-20
-10
10
20
30
40
50
60
70
80
Child
care
-rel
ated
cos
ts a
nd b
enefi
ts, %
of
AW
Panel B: Sole parent earns 50% of the average wage
HU BE PT LU EL SE IS NL FR EE PL SK DK ES CZ UK
OEC
D-3
0 FI AT SI DE
NO CH IE
Childcare fee Childcare benefitsTax reductions Other benefits
Net cost% of net family income
0
-60
-50
-40
-30
-20
-10
10
20
30
40
50
60
70
80
Child
care
-rel
ated
cos
ts a
nd b
enefi
ts, %
of
AW
Panel A: Sole parent earns 100% of the average wage
HU BE PT LU EL SE IS NL FR EE PL SK DK ES CZ UK
OEC
D-3
0 FI AT SI DE
NO CH IE
Childcare fee Childcare benefitsTax reductions Other benefits
Net cost% of net family income
37

2.3.4. Percentage of children up to 3 years of age cared for in formal care by income quintiles in European countries, households with at least one child <3 years, 2010 (%)
Income quintile 1
The poorest
Income quintile 2
Income quintile 3
Income quintile 4
Income quintile 5
The richest
AT 10 9 8 12 9
BE 17 27 38 43 57
BG 10(u) 10(u) 11(u) 15
CY 16(u) 13 19 32 30(u)
CZ 3 2 3 2 4
DE 21 17 22 17 23
DK 87 73 72 76 83
EE 16 29 22 31 14
EL 6 3 11 9 12
ES 29 33 30 50 45
EU-27 17(s) 23(s) 34(s) 34(s) 37(s)
FI 18 23 27 27 41
FR 15 34 60 53 64
HU 7 10 14 11 15
IE 8 8 12 21 34
IT 17 19 26 27 28
LT 2(u) 20(u) 16(u) 15 10
LU 23 22 34 57 56
LV 7 13 24 20 11
MT (u) 5 16 21 15(u)
NL 27 35 55 59 70
PL 0 1 2 2 4
PT 14(u) 30(u) 44 32 36
RO 5(u) 6(u) 5(u) 10(u) 13(u)
SE 44 56 56 53 32
SI 41 33 39 43 38
SK 2 6 5 2
UK 20 26 51 43 53
Source: EU-SILC, 2010.Note: (u): unreliable
(s): estimate
38 Barcelona objectives

2.3.5. Indicators of early childhood care quality
Qualifications of certified childcare workers and main place of work.
Source : OECD (2011), OECD Family Database, Paris. Indicator PF4.2. (Last updated: 01/07/2010).
Main type of staffInitial training requirements
Age rangeMain place of
workContinuous
trainingChild-to-staff
ratio
AT Erzieherinnen, Kindergartenpädagoginnen
5-year vocational secondary
0–5Krippen, Hort, Kindergarten
3-5 days per year; funding by
provinces8.7
BE Kinderverzorgster / Puéricultrice
3-year post-16 vocational
secondary0–3
Kinderdagverblijf /Crèches (or
assistant in école maternelle)
7.0
CZ Detska sestra4-year secondary
nursing school0–3 Crèche
Voluntary; offered by regional centres
DK Paedagog
3- to 5-year vocational, or
tertiary education (depending on
prior experience)
0–5
Educational, social care, special
needs institutions (incl. daycare)
Funding decentralised to municipalities
3.3 (0–2 years), 7.2 (3–5 years)
FISosionomi (social
pedagogues), Lähihoitaja (practical nurses)
3-year secondary vocational
0–6
Päiväkoti (children’s daycare
centre), Avoin päiväkoti
Municipalities have to provide
3–10 days annual training
4.0 (0–3 years), 7.0 (3+ years)
FR
PuéricultricesNurse / mid-
wife + 1-year specialisation
0–3Crèches / assistant
in école maternelle
5.0 (0–2 years),
Éducateurs de jeunes enfants
27-month post-Bac in training
centre0–6 8.0 (2–3 years)
DE Kinderpflegerinnen2-year secondary vocational training
0–6 Kindergarten
HU Gondozó (child care worker)
3-year post-secondary
voc. training or specialist certificate
0–3Bölcsode (for children < 3)
6.0
IE Childcarer / childminder Wide variation 0–6 Childcare centres3.0 (>1),
6.0 (2–3 years)
IT EducatriceSecondary vocational diploma
0–3 Asili nidoMunicipality or
director / inspector decides
7
NL Leidster kinder-centra2-year post-18
training0–4 Kinderopvang
Funding decentralised to municipalities
4 (1 year), 5 (2 years), 6 (3 years)
NO Assistents2-year post-16 apprenticeship
0–7 Barnehager / SFO 8 (>3 years)
PT Educadora de infância4-year university
or polytechnic0–6 Crèches, ATL
Offered by regional teacher
centres and universities to all
teachers
11
SE Barnskötare2-year post-16
secondary0–7
Oppen Förskola, Fritidshem
Funding decentralised to municipalities
5.5
CH Childcare worker Varies per canton Creches, nurseries4–5 (0–2), 7–8 (2–3)
UK Trained nursery teacher, Nursery nurse
2-year post-16 secondary
3–11, 0–5Nurseries (or assistant in
above)
Limited for day-care workers
3 (>2 years), 4 (2–3 years), 8 (3–5 years)
39

2.3.6. Child/staff ratio
Child to staff ratio for pre-primary education, full-time staff (FTU)
2010
EU-27 13.4
BE 15.9
BG 12
CZ 13.9
DK :
DE 12.6
EE 6
IE 19.8
EL :
ES 13
FR 21.5
IT 11.8
CY 17
LV 12.1
LT 7.8
LU 12
HU 11
MT 15.2
NL :
AT 14.7
PL 18.7
PT 15.7
RO 17.5
SI 9.4
SK 12.5
FI 11
SE 6.3
UK 15.9
HR 12.1
IS 6.9
NO :
Source: SWD(2012)373 — Education and training monitor.
40 Barcelona objectives

3. Support for efforts to achieve the Barcelona targets
3.1. Amounts allocated to childcare infrastructures from European Regional Development Funds
SF Community amount (€) 2007–13
(A)
EU amount decided and allocated for childcare
infrastructures(€)(B)
Proportion/total %
Total of projects selected (AIR) EU amount (€) (end of 2011)
(C)
Rate of selection %
(C) / (B)
AT 680 066 021
BE 990 283 172 1 727 774 0,2 % 3 248 012 188,0 %
BG 5 488 168 381 62 530 104 1,1 % 63 139 508 101,0 %
CY 492 665 838
CZ 22 751 854 293 62 627 277 0,3 % 36 558 565 58,4 %
DE 16 107 574 792 14 265 105 0,1 % 8 283 200 58,1 %
DK 254 788 620
EE 3 011 942 552 24 059 284 0,8 % 31 366 762 130,4 %
ES 26 595 884 632 29 891 611 0,1 % 27 996 463 93,7 %
FI 977 401 980
FR 8 054 673 061 9 957 500 0,1 % 11 903 899 119,5 %
EL 15 846 461 042 74 070 000 0,5 % 75 998 438 102,6 %
HU 21 292 060 049 76 594 248 0,4 % 54 158 862 70,7 %
IE 375 362 372
IT 21 025 331 585 81 689 451 0,4 % 26 943 354 33,0 %
LT 5 747 186 096
LU 25 243 666
LV 3 947 343 917 29 920 000 0,8 % 29 736 185 99,4 %
MT 728 123 051 1 325 000 0,2 % 1 269 978 95,8 %
NL 830 000 000
PL 57 178 151 307 34 250 132 0,1 % 15 269 974 44,6 %
PT 14 558 172 647 4 200 000 0,0 % 3 296 728 78,5 %
RO 15 528 889 094
SE 934 540 730
SI 3 345 349 266 30 000 000 0,9 % 11 412 294 38,0 %
SK 9 998 728 328 66 235 543 0,7 % 49 359 364 74,5 %
UK 5 416 019 735
CB 7 904 136 117 12 691 808 0,2 % 7 660 215 60,4 %
EU-27 270 086 402 344 616 034 837 0,2 % 457 601 804 74,3 %
Source: European Commission DG REGIO.
41


European Commission
Barcelona objectives
Luxembourg: Publications Office of the European Union, 2013
2013 — 41 pp. — 21 cm x 29.7 cm
ISBN 978-92-79-29898-1doi:10.2838/43161


How to obtain EU publicationsFree publications:• via EU Bookshop (http://bookshop.europa.eu);• at the European Union’s representations or delegations. You can obtain their contact details on the Internet
(http://ec.europa.eu) or by sending a fax to +352 2929-42758.
Priced publications:• via EU Bookshop (http://bookshop.europa.eu).
Priced subscriptions (e.g. annual series of the Official Journal of the European Union and reports of cases before the Court of Justice of the European Union):• via one of the sales agents of the Publications Office of the European Union (http://publications.europa.eu/others/agents/index_en.htm).
DS-03-13-058-EN
-C
doi:10.2838/43161