Banking Crises in Transition - World Bank€¦ · Banking Crises in Transition How 12 transition...
90
WPS 2)-L 84k POLICY RESEARCH WORKING PAPER 2484 Banking Crises in Transition How 12 transition economies Economies dealt with banking crises. Economies Fiscal Costs and Related Issues Helena Tang Edda Zoli Irina Klytchnikova The World Bank Europe and Central Asia Region Poverty Reduction and Economic Management Sector Unit November 2000 Public Disclosure Authorized Public Disclosure Authorized Public Disclosure Authorized Public Disclosure Authorized
Transcript of Banking Crises in Transition - World Bank€¦ · Banking Crises in Transition How 12 transition...

WPS 2)-L 84k
POLICY RESEARCH WORKING PAPER 2484
Banking Crises in Transition How 12 transition economiesEconomies dealt with banking crises.
Economies
Fiscal Costs and Related Issues
Helena Tang
Edda Zoli
Irina Klytchnikova
The World BankEurope and Central Asia Region
Poverty Reduction and Economic Management Sector Unit
November 2000
Pub
lic D
iscl
osur
e A
utho
rized
Pub
lic D
iscl
osur
e A
utho
rized
Pub
lic D
iscl
osur
e A
utho
rized
Pub
lic D
iscl
osur
e A
utho
rized

POLICY RESEARCH WORKING PAPER 2484
Summary findings
Tang, Zoli, and Klytchnikova look at strategies for and low levels of intermediation. The Baltic states appear
dealing with banking crises in 12 transition economies- to have struck a good balance, incurring modest fiscal
five from Central and Eastern Europe (CEE): Bulgaria, costs while making their systems sounder and more
the Czech Republic, Hungary, Macedonia, and Poland; efficient.
the three Baltic states: Estonia, Latvia, and Lithuania; The findings suggest the following:
and four countries from the Commonwealth of - Operational, financial, and institutional restructuring
Independent States (CIS): Georgia, Kazakhstan, the should be undertaken in parallel.
Kyrgyz Republic, and Ukraine. * Financial restructuring should involve adequate
Three types of strategies were used to deal with the recapitalization to deter moral hazard and repeated
crises. The CEE countries generally pursued extensive recapitalization.restructuring and recapitalizing of banks; most CIS * Operational restructuring should entail privatization
countries pursued large-scale liquidation; and the Baltic to core investors (particularly to reputable foreign
states generally pursued a combination of liquidation and banks).
restructuring. * The enterprise problems underlying banking
The strategy pursued reflected macroeconomic problems must also be addressed.
conditions and the level of development in a country's e Fiscal costs were reduced when governments dealt
banking sector. There were more new banks in the only with bad debt inherited from the socialist period;
former Soviet Union (FSU-the CIS and Baltic states), when small banks that held few deposits were allowed to
but they tended to be small, undercapitalized, and not fail, where the social costs of such failure were low; and
deeply engaged in financial intermediation. when only banks that got into trouble because of
The CEE countries generally incurred higher fiscal external shocks were rescued while those suffering from
costs than the FSU countries but ended up with sounder, poor management were liquidated.
more efficient banking systems, with many of the * The government, not the central bank, should
recapitalized banks being privatized to strategic foreign undertake bank restructuring. Central bank refinancing is
investors. The CIS countries pursued a less fiscally costly not transparent and could lead to hyperinflation.
approach but have been left with weak banking systems
This paper-a product of the Poverty Reduction and Economic Management Sector Unit, Europe and Central Asia
Region-is part of a larger effort in the region to review lessons of experience in transition economies. Copies of the paper
are available free from the World Bank, 1818 H Street NW, Washington, DC 20433. Please contact Armanda Carcani, room
H4-326, telephone 202-473-0241, fax 202-522-2751, email address [email protected]. Policy Research Working
Papers are also posted on the Web at www.worldbank.org/research/workingpapers. The authors may be contacted at
[email protected] or [email protected]. November 2000. (78 pages)
The Policy Research Working Paper Series disseminates the findings of work in progress to encourage the exchange of ideas about
development issues. An objective of the series is to get the findings out quickly, even if the presentations are less than fully polished. Thepapers carry the names of the authors and should be cited accordingly. The findings, interpretations, and conclusions expressed in this
paper are entirely those of the authors. They do not necessarily represent the view of the World Bank, its Executive Directors, or the
countries they represent.
Produced by the Policy Research Dissemination Center

Banking Crises in Transition Countries:
Fiscal Costs and Related Issues
Helena Tang, Edda Zoli and Irina Klytchnikova*
*Tang is a Lead Economist at the World Bank; Zoli is an Economist at the International Monetary Fund;and Klytchnikova is a consultant at the World Bank. The paper benefited from valuable comments fromPatrick Honahan, Jo Ann Paulson and Stijn Claessens, although the authors alone are responsible for thecontents.


Contents
Executive Summary i
1. Introduction 1
2. Banking Crises in Transition Countries 22.1. Banking Sector Conditions 22.2. Episodes of Banking Crises 42.3. Causes of Banking Crises 10
3. Institutional, Operational and Financial Restructuring of Banks 12in Transition Countries3.1 Institutional Restructuring 123.2 Operational Restructuring 153.3 Financial Restructuring 18
4. Costs of Banking Crises 194.1 Cost of Bank Restructuring for the Government 214.2 Cost of Bank Restructuring for the Central Bank 264.3 Cost of Deposit Compensation for the Government 304.4 Total Fiscal and Quasi-Fiscal Costs of Banking Crises 34
5. Bad Debt Recovery 375.1 Implications of Choice of Debt Recovery Strategy on Fiscal Costs 385.2 Country Experiences 385.3 Results of Bad Debt Recovery 44
6. Results of Crisis Resolution 44
7. Summary, Conclusions and Policy Lessons 47
References 50


Executive Summary
All transition countries have experienced banking crises or severe banking distress during thetransition process. Key factors contributing to banking crises in these countries have been the largeamounts of bad debt inherited from the previous socialist regimes, and the lack of familiarity ofenterprises and banks with the functioning of market economies. Therefore, the resolution of bankingcrises in these countries can also be viewed as a challenge of transition, or as a challenge of bankingsector development in the transition context.
While some transition countries have progressed more than others in developing and strengtheningtheir banking systems, many have not completed the "transition" process. To this extent, new bankingcrises remain a risk. A pertinent question for policy makers therefore is how to resolve such crises in away that would minimize the costs to the economy and the risks of such crises recurring in the future.
This paper reviews the experience of banking crises during 1990-98 in twelve transition countries:five countries from Central and Eastern Europe (CEEs) - Bulgaria, the Czech Republic, Hungary,Macedonia and Poland; the three Baltic states - Estonia, Latvia and Lithuania; and four countries fromthe Commonwealth of Independent States (CIS) - Georgia, Kazakhstan, the Kyrgyz Republic andUkraine. These countries have experienced either episodes of obvious crisis such as bank runs, orepisodes of severe banking distress involving a large share of non-performing loans in the banking sector.Both types of episodes are referred to in this paper as banking crisis episodes.
The paper reviews the crisis resolution strategies adopted by these twelve countries, and assesseswhich strategy minimized fiscal costs while at the same time strengthened the banking sector. Astrengthened banking sector will be less prone to future crisis, which also helps minimize fiscal costs overthe longer term.
The crisis resolution strategies pursued by the twelve transition countries fall into three broadcategories: (a) extensive restructuring and recapitalization of banks, which was generally pursued by theCEEs; (b) large-scale liquidation of banks pursued by most CIS countries; and (c) a combination of bankliquidation and restructuring, which was generally pursued by the Baltic states.
The different strategies adopted by the authorities in these countries appear to depend on two keyfactors in the early years of transition. First is the macroeconomic condition at the beginning oftransition, in particular the developments in inflation. Hyperinflation in the countries of the former SovietUnion (FSU) - the CIS and the Baltics - at the beginning of transition drastically reduced the real value oftheir inherited bad debts. By contrast, inflation never reached the same hyper levels in the CEEs, and thepre-transition bad loans remained a burden on the banking system. The second factor is the developmentof the banking system. There was a much larger increase in the number of banks in the FSU countriesthan in the CEEs in the early transition years. The new banks in the countries of FSU were generally ofpoorer quality, being small, undercapitalized and not engaged in much financial intermediation. As aresult, banks could be closed in the FSU countries with limited economic and social impact. By contrast,in the CEEs, there was much less proliferation of low quality banks, and therefore much less of a need forliquidation of such banks. Furthermore, financial intermediation was also deeper in the CEEs, with someof the troubled banks being considered "too big to fail". Given their size, liquidation would have meantwiping out most of the banking system, imposing huge economic and political costs. For these reasons,the FSU countries pursued bank liquidation on a much larger scale than the CEE countries, while thelatter generally restructured and recapitalized banks.
These initial conditions and related bank crisis resolution strategies largely determined the fiscalcosts of banking crises, with the CEEs generally incurring higher costs than the FSU countries. In
i

addition, the amount of fiscal costs incurred also depended on the extent to which bank shareholders anddepositors bore some of the costs. In the FSU countries, the fiscal costs of banking crises were generallylower because governments relied more on recapitalization by private shareholders and when this was notpossible, liquidated banks without compensating depositors. Also, the restructuring operationsundertaken by the CEEs suffered from several weaknesses (see later para. on lessons), which raised fiscaland quasi-fiscal costs.
For the transition countries covered by this study, the fiscal and quasi-fiscal costs of banking crises- including for bank restructuring and deposit compensation - ranged from 7 to 42 percent of GDP for theCEEs, 0.1 to 18 percent of GDP for the CIS, and from 2 to 3 percent in the Baltics. These fiscal costs donot adjust for savings associated with recoveries of bad loans absorbed by the government. However, theexperience of the transition countries covered by the study was not very positive in this regard. Amongthe countries where loan recoveries accrued to the govemment, Hungary had the best results with loanrecoveries amounting to 16 percent of total bad loans. Poland also had a similar recovery rate, althoughrecoveries accrued to the banks themselves. In comparison, recovery rates of around 30 percent havebeen achieved elsewhere in the world.
All three country groups enjoyed positive results from the resolution of banking crises. Theoutcomes were generally better in the CEEs and the Baltics than in the CIS, particularly in regard toimproving banking sector efficiency and raising the confidence in the banking sector. However, thereneeds to be further financial deepening in all three country groups, and especially so in the CIS. Althoughnon-performing loans as a share of total loans have generally declined in these countries, they remained aconcem in many of them, especially the Czech Republic, Macedonia, Lithuania and Kazakhstan.
To sum up, the CEEs incurred the most substantial fiscal costs, but ended up with sounder andmore efficient banking systems, with many of the recapitalized banks being privatized to strategic foreigninvestors. By contrast, the approach pursued by the CIS was less fiscally costly, but they have been leftwith weak banking systems and low levels of intermediation. The Ballics appear to have struck a goodbalance, incurring modest fiscal costs, while improving the soundness and efficiency of their bankingsystems. Estonia, in particular, appeared to have done the best. At a total cost of 2 percent of GDP atend-1998, the crisis resolution strategy pursued by Estonia (combination of liquidation and restructuring,with the strategy differentiated according to the cause of the crisis) has resulted in substantial increase infinancial intermediation, a large decline in non-performing loans (which stood at slightly over I percentof total loans in 1998), significant improvements in banking sector efficiency and higher confidence in thebanking sector.
The lessons derived from the crisis resolution experience of these countries are consistent with theconventional wisdom on how to restructure banks to minimize the recurrence of banking crises, and henceto minimize fiscal costs. Specifically, the experience of the twelve transition countries suggest thefollowing:* the three elements of banking system restructuring - operational, financial and institutional - need to
be undertaken in parallel for the successful resolution of banking crises;* financial restructuring of banks should entail adequate recapitalization to deter the risk of moral
hazard and repeated recapitalization;* operational restructuring of banks needs to entail privatization to core investors; the experience in the
transition countries indicates that privatization to reputable foreign banks could be a useful way tostrengthen their banking systems;
* enterprise problems need to be addressed in parallel with bank restructuring because in manytransition economies the former are the underlying causes of banking problems;
ii

* differentiation of the crisis resolution strategy according to the cause of the crisis could help reducefiscal costs; specifically, for the transition countries covered by the study, fiscal costs were reducedwhen: (i) governments only dealt with that portion of the bad debt inherited from the socialist period;(ii) small banks were allowed to fail when they did not affect financial intermediation very much (thatis they held very little deposits) and when the social costs of such bank failure were low; and (iii) onlybanks that got into trouble because of external shocks were rescued while those that suffered frompoor management were liquidated; and
* bank restructuring should be undertaken by the government and not the central bank because: (i)central bank financing is non-transparent and the costs will eventually fall on the budget; and (ii)central bank financing could lead to hyperinflation with severely negative economic consequences.
The experience of the transition countries under consideration also supports the establishedprinciple that for bad debt recovery to be successful, the bad debt collector (be it a central agency or abank) needs to operate within an adequate legal environment (in particular effective collateral, foreclosureand bankruptcy laws) and be given appropriate incentives, and the enterprises in question need to besubject to hard budget constraints. This implies that if a centralized approach is adopted, then the baddebt collection agency should be private rather than state-owned. It also implies that a "good bank/badbank" approach to bad debt collection might be preferable as it entails a finite time of operation of the"bad bank". Among the transition countries covered, the approach adopted by Poland - where banksthemselves pursued the collection of bad debt - appears to have some merit. Although the Polish modelwas not very successful in restructuring enterprises (which was one of its objectives), it appeared to havemore success in strengthening the institutional capacity of banks. Finally, however, it should be notedthat successful bad debt recovery requires adequate capacity for the task. Given the relatively recentintroduction of transition economies to commercial banking, the capacity of collecting bad debt whichentails restructuring of enterprises will take some time to build up, more so for the countries from theFSU than the CEEs. Therefore, only modest results from bad debt recovery may be expected from thesecountries for some time.
..i


1. Introduction
Over the last few decades, banking crises have occurred in both developed and developingcountries around the world, and it has been no different with the transition countries. In fact, almost allthe transition countries have suffered from significant banking problems'. This paper reviews thedifferent approaches to resolving banking crises in the transition countries and their effects on theresulting fiscal costs.
The study covers the experience of banking crises during 1990-98 in twelve transition countries:five countries from Central and Eastern Europe (CEEs) - Bulgaria, the Czech Republic, Hungary,Macedonia and Poland; the three Baltic states - Estonia, Latvia and Lithuania; and four countries fromthe Commonwealth of Independent States (CIS) - Georgia, Kazakhstan, the Kyrgyz Republic, andUkraine. These countries were selected because they had experienced banking crises or severe bankingdistress, and because they encompass a wide range of experiences. A number of countries, includingRussia and Romania, were excluded because their crises were still unfolding at the time the research forthe paper was initiated.
There are many ways of defining banking crises (see Frydl, 1999). This paper includes episodes ofobvious crisis such as bank runs, as well as episodes of severe banking distress involving a large share ofnon-performing loans in the banking sector, both of which will be referred to as episodes of "bankingcrisis" in the rest of this paper. Analysis in this paper ends in 1998, and excludes the effects of theRussian financial crisis on the banking sectors in the sample countries.
Following this introduction, section 2 reviews the banking sector conditions in transition countries,the episodes of banking crises and their causes. A key factor that contributed to the eruption of bankingproblems in these countries was the large debt burden inherited from the previous socialist regimes.Another key factor that contributed to the eruption of banking problems in these countries was the lack offamiliarity of both enterprises and banks with the functioning of a market economy. This may have beenan inevitable cost of transition, as both banks and enterprises were learning to operate in a completelynew environment. There has been a lot of learning by doing, and a lot of mistakes made along the way.Therefore, banking crises in transition countries could be viewed as an integral element of the transitionchallenge, or as an issue of banking sector development in the transition context.
While some transition countries have progressed more than others in developing and strengtheningtheir banking systems, many have not completed the "transition" process. To this extent, new bankingcrises remain a risk. A pertinent question for policy makers therefore is how to resolve such crises in away that would minimize the costs to the economy and the risks of such crises recurring in the future.
Banking crises are costly in two dimensions. First, they can undermine economic growth bydisrupting credit intermediation. Second, banking crises can also impose large fiscal costs. This isbecause, unlike in the case of firm failures where shareholders are the residual loss-takers, when banksfail governments commonly assume part or all of the cost of the bank failure because of concerns over thestability of the financial system, or because of political or social reasons. To the extent that governmentsdo not assume the entire cost of bank failure, the residual losses are assumed either by shareholders ordepositors or both.
Given the poor data and poor accounting in transition countries, the costs borne by shareholdersand depositors are difficult to ascertain. This paper will instead focus on the fiscal costs of banking
See Appendix Table I on experience of banking crises in transition countries.
1

crises, which are the more readily observable portion of the total cost of banking crises2. Obviously, thesefiscal costs are eventually borne by the public either through higher tax rates or higher inflation.
For the transition countries under consideration, the fiscal cost of resolving banking crisis wasdetermined in large part by the authorities' strategy in restructuring the banking system, discussed insection 3. There are three elements in such a restructuring strategy: operational, institutional andfinancial. Successful resolution of banking crisis or systemic banking problems requires that all threeelements be undertaken. When banking crises are successfully resolved, it means that the remainingbanks in the system are strong and the risk of future banking crises is minimized, which also helpsminimize fiscal costs.
Section 4 reviews the costs of banking crises incurred during the 1990s by the twelve transitioncountries. The section will review the distribution of these costs between shareholders, depositors and thegovernment. The focus of the discussion will be on the latter - that is, the fiscal costs - for reasons justdiscussed. The fiscal costs of banking crises include the cost of government assistance to the bankingsector, the quasi-fiscal cost assumed by the central bank in assisting the banking sector, plus the directcost of compensating depositors. These costs could be alleviated by the recovery of bad loans, which isreviewed in section 5. Section 6 discusses the results of the resolution of banking crises, and section 7summarizes the findings and draws some conclusions and lessons from the experiences of these transitioncountries.
2. Banking Crises in Transition Countries
This section reviews the banking conditions in the sample countries under consideration during the1 990s, the episodes of banking problems they experienced, and the factors that led to these banking crises
2.1 Banking Sector Conditions
While the banking systems differed for transition economies in the 1990s, all regimes had evolvedfrom the Soviet model, under which a unique bank (monobank) was responsible both for monetary policyand commercial banking. Among the countries under consideration, Yugoslavia was ahead in separatingout these two functions and creating a two-tier banking system during the 1960s. In the other CEEcountries and the Baltic countries, the monobank structure was demolished only in the late 1980s, whilethe CIS countries introduced the two-tier system in the early 1990s. Generally, the elimination of themonobank system was followed by a rapid expansion of the banking sector with the entry of a largenumber of new banks.
Among the transition economies, the CEEs have more developed banking sectors than the Balticsor the CIS, as measured by credit to the private sector as a share of GDP, and by broad money as a shareof GDP (Table 1). In the CEEs, the average ratio of private credit to GDP through the 1990s (for whichdata was available) was higher than in the other two groups of countries. In turn, the Baltics had, onaverage, higher shares of credit to the private sector than the CIS members since 1993.
There was a dramatic increase in the number of banks (in absolute terms and in terms of banks perpopulation) in the early years of transition in the countries of the FSU, followed by a dramatic decline as a
2 This paper will not address the issue of the cost of banking crises to economic growth, which is an almost,intractable question.
2
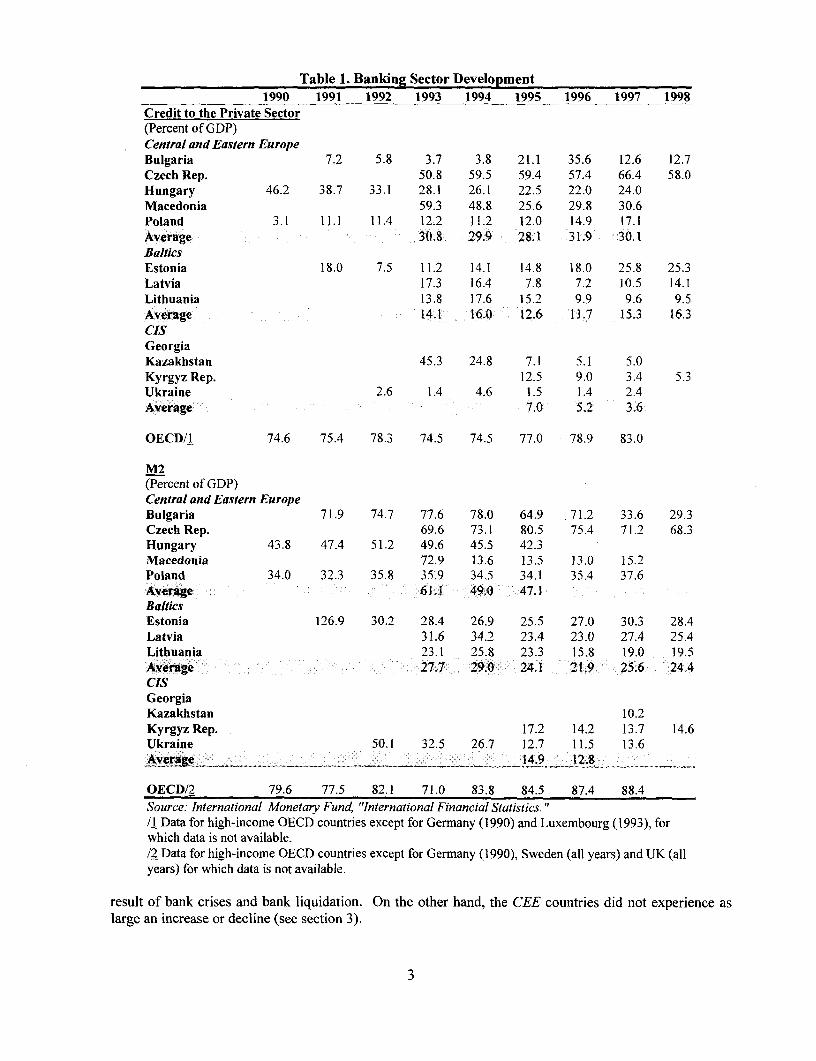
Table 1. Banking Sector Development1990 1991 1992 1993 1994 1995 1996 1997 1998
Credit to the Private Sector(Percent of GDP)Central and Eastern EuropeBulgaria 7.2 5.8 3.7 3.8 21.1 35.6 12.6 12.7Czech Rep. 50.8 59.5 59.4 57.4 66.4 58.0Hungary 46.2 38.7 33.1 28.1 26.1 22.5 22.0 24.0Macedonia 59.3 48.8 25.6 29.8 30.6Poland 3.1 11.1 11.4 12.2 11.2 12.0 14.9 17.1Average 30.8 29.9 28.1 31.9 30.1BalticsEstonia 18.0 7.5 11.2 14.1 14.8 18.0 25.8 25.3Latvia 17.3 16.4 7.8 7.2 10.5 14.1Lithuania 13.8 17.6 15.2 9.9 9.6 9.5Average 14.1 16.0 12.6 11.7 15.3 16.3CisGeorgiaKazakhstan 45.3 24.8 7.1 5.1 5.0Kyrgyz Rep. 12.5 9.0 3.4 5.3Ukraine 2.6 1.4 4.6 1.5 1.4 2.4Average 7.0 5.2 3.6
OECD/1 74.6 75.4 78.3 74.5 74.5 77.0 78.9 83.0
M2(Percent of GDP)Central and Eastern EuropeBulgaria 71.9 74.7 77.6 78.0 64.9 71.2 33.6 29.3Czech Rep. 69.6 73.1 80.5 75.4 71.2 68.3Hungary 43.8 47.4 51.2 49.6 45.5 42.3Macedonia 72.9 13.6 13.5 13.0 15.2Poland 34.0 32.3 35.8 35:9 34.5 34.1 35.4 37.6Average 61.1 49.0 47.1BalticsEstonia 126.9 30.2 28.4 26.9 25.5 27.0 30.3 28.4Latvia 31.6 34.2 23.4 23.0 27.4 25.4Lithuania 23.1 25.8 23.3 15.8 19.0 19.5Average 27.7 29.0 24.1 21.9 25.6 24.4CIsGeorgiaKazakhstan 10.2Kyrgyz Rep. 17.2 14.2 13.7 14.6Ukraine 50.1 32.5 26.7 12.7 11.5 13.6Averae_ 14.9 12.8
OECD/2 79.6 77.5 82.1 71.0 83.8 84.5 87.4 88.4Source: International Monetary Fund, "International Financial Statistics. "/I Data for high-income OECD countries except for Germany (1990) and Luxembourg (1993), forwhich data is not available./2 Data for high-income OECD countries except for Germany (1990), Sweden (all years) and UK (allyears) for which data is not available.
result of bank crises and bank liquidation. On the other hand, the CEE countries did not experience aslarge an increase or decline (see section 3).
3

Most of the twelve countries experienced a decline in state ownership of the banking system duringthe 1990s, as reflected in the asset share of state banks (Table 2). For the CEEs (with the exception ofMacedonia), this was the result of privatization of state banks following the resolution of bankingproblems and, in some cases, the entry of foreign banks3. For the Baltic countries (except for Lithuania),this was due to consolidation of state banks through liquidation or mergers, and large entry of foreignbanks. For the CIS countries under consideration (except for Ukraine), this resulted from liquidation ordownsizing of state banks.
The banking systems in transition economies were marked by extensive non-performing loans(Table 3)4. The incidence of such loans was larger than for many non-transition countries that wentthrough banking crises. For instance, before the start of a banking crisis, the ratio of bad loans to totalloans was 9.1 percent in Argentina (end- 1980), 9.3 percent in Finland (end- 1 992), 10.6 percent in Mexico(September 1994) and 9.3 percent in Venezuela (end-1993) (Pazarba*ioglu and Van der Vossen, 1997).
In some countries (Bulgaria, Hungary, Poland, Georgia and the Kyrgyz Republic), the share of badcredits was high in the early stages of the transition, declining subsequently as these countries underwentrestructuring programs. In other cases (the Czech Republic, Macedonia, Lithuania, Kazakhstan and, to aless extent, Latvia), non-performing loans were consistently high. Estonia was the only country in theregion where the share of non-performing loans had always been moderate.
2.2 Episodes of banking crises
Most of the twelve countries under consideration suffered from more than one crisis during the1990s (Table 4). The problems experienced by the different countries were different in nature. Althoughit is not possible to draw rigid distinctions, two broad types of banking crisis episodes can be identified.
A number of crisis episodes arose from solvency problems in state-owned or formerly state-ownedbanks that were related to bad loans inherited from the Socialist system. These conditions of severebanking distress led to implementation of bank restructuring programs (Bulgaria in 1991-94; the CzechRepublic in 1991-93; Hungary in 1992-1994).
In other cases, non-performing loans were not a legacy of the central planning system, butgenerally the result of unsound practices during the transition process. These episodes were associatedwith widespread insolvency in the banking sector (Bulgaria in 1996-97; Hungary in 1995-97; Macedoniain 1994; Poland in 1993-94; Estonia in 1992-4; Latvia in 1995; Lithuania in 1995-96; the Czech Republicin 1996-97; Georgia in 1995-97; Kazakhstan in 1994-96 and the Kyrgyz Republic in 1994-96) or withnon-compliance with newly introduced banking regulations (Georgia in 1994 and Ukraine in 1995-98).
In some instances these banking crises involved also significant bank runs. This was the case ofBulgaria in 1995 and 1996-97; the Czech Republic in 1996-97; Hungary in 1997; Macedonia in 1994;Estonia in 1994; Latvia in 1995; Lithuania in 1995-96; Georgia in 1995-97 and Kazakhstan in 1996.
Foreign banks in Table 2 are defined as banks with foreign ownership exceeding 50%, end-of-year.4 The definition and measurement of non-performing loans vary across countries and therefore the figures in Table 3are not directly comparable. However, they are indicative of the magnitude of banking sector problems in individualcountries.
4

Table 2. Structure of the Banking Sector
1990 1991 1992 1993 1994 1995 1996 1997 1998Central and Eastern EuropeBulgariaNumber of banks 67 75 79 41 40 41 42 28
o/w domestic 39 38 39 21foreign 1 3 3 7
Asset share of state banks, % 82.2 66.0Banks (per mln people) 7.7 8.7 9.3 4.8 4.7 4.9 5.0 3.4
Czech Rep.Number of banks 45 55 55 53 50 45
o/w domestic 33 43 43 40 36 32Foreign 12 12 12 13 14 13
Asset share of state banks. % 20.6 20.1 19.5 18.0 18.1 18.8Banks (per mln people) 4.4 5.3 5.3 5.1 4.9 4.4
HungaryNumber of banks 32 35 35 40 43 42 41 41 40o/w domestic 21 27 23 25 26 21 16 11 13
Foreign 11 8 12 15 17 21 25 30 27Asset share of state banks_% 85.5 81.2 75.3 74.4 74.9 62.8 52.0 16.3 10.8Banks (per mln people) 3.1 3.4 3.4 3.9 4.2 4.1 4.0 4.0 4.0
MacedoniaNumber of banks 6 6 22 22 24o/w domestic 3 3 17 17 19
Foreign 3 3 5 5 5Asset share of state banks, % 0.0 0.0 0.7Banks (per mln people) 3.1 3.1 11.1 11.0 11.9
PolandNumber of banks 87 82 81 81 83 83olw domestic 77 71 63 56 54 52
Foreign 10 11 18 25 29 31Asset share of state banks, % 86.2 80.4 71.1 69.8 51.6 48.0Banks/Population (per mln people) 2.3 2.1 2.1 2.1 2.1 2.1
BalticsEstoniaNumber of banks 21 22 18 15 12 6o/w domestic 20 21 14 12 9 4
foreign I 1 4 3 3 2Asset share of state banks, % 25.7 28.1 9.7 6.6 0.0 7.8Banks (per mln people) 13.9 14.7 12.1 10.2 8.2 4.2
5

Table 2 (Cont.). Structure of the Banking Sector
1990 1991 1992 1993 1994 1995 1996 1997 1998
LatviaNumber of banks 14 50 62 56 42 35 32 27
o/w domestic 31 21 17 12Foreign 11 14 15 15
Asset share of state banks, % 7.2 9.9 6.9 6.8 8.5Banks (per mln people) 5.3 19.0 24.0 22.0 16.7 14.1 13.0 11.1
LithuaniaNumber of banks 26 22 12 12 11 10o/w domestic 26 22 12 9 7 5
foreign 0 0 0 3 4 5Asset share of state banks. % 53.6 48.0 62.5 54.9 48.8 45.3Banks (per min people) 7.0 5.9 3.2 3.2 3.0 2.7
CisGeorgiaNumber of banks 75 179 226 101 61 53 43o/w domestic 225 98 55 45 34
foreign 1 3 6 8 9Asset share of state banks. % 98.4 92.5 77.6 72.7 67.9 45.8 0.0 0.0 0.0Banks (permln people) 13.7 32.9 41.7 18.6 11.3 9.8 7.9
KazakhstanNumber of banks 30 72 155 204 184 130 101 82 71o/w domestic 71 154 199 176 122 92 60 51
foreign 1 1 5 8 8 9 22 20Asset share of state banks. % 19.3 4.6 n.a. n.a. 24.3 28.4 45.4 23.0Banks (per mln people) 1.8 4.4 9.4 12.4 11.3 8.1 6.3 5.2 4.5
Kyrgyz Rep.Number of banks 6 10 15 20 18 18 18 20 23o/w domestic 6 10 14 19 15 15 15 17 17
foreign 0 0 1 1 3 3 3 3 6Asset share of state banks. % 100.0 98.8 n.a. n.a. 77.3 69.7 5.0 9.8 0.0Banks (per mln people) 1.4 2.2 3.3 4.5 4.0 4.0 3.9 4.3 4.9
UkraineNumber of banks 133 211 228 230 229 227 n.a.o/w domestic 227 229 223 215 n.a.
foreign I 1 6 12 n.a.Asset share of state banks. %Banks (per mln people) 2.5 4.1 4.4 4.5 4.5 4.5
Source: EBRD Transition Report, 1999
6

Table 3. Soundness of the Banking Sector: Non-performing Loans(Percent of total loans, end of period)
1990 1991 1992 1993 1994 1995 1996 1997 1998Central and Eastern EuropeBulgaria 54 7 13 15 13 10Czech Rep. 2 /l 19 /1 23/1 37 33 30 27 29Hungary 29 28 20 12 8Macedonia 80 44 36Poland 16 30 29 28 21 13 10 10
BalticsEstonia 7 3 3 2 1 1Latvia 5 10 19 20 10Lithuania 27 17 32 28
CIsGeorgia 24 41 7 7Kazakhstan 33 41 25 27Kyrgyz Rep. 92 72 26 8Ukraine /2 5 13 12 11
/I Estimates reported in Capek (1994). According to other estimates, non-performing loans were 50-66% of totalloans in the early 1990s (OECD, 1996)./2 Official data that probably underestimate the actual share of non-performing loans.Source: EBRD Transition Report, 1998; International Monetary Fund; Central Banks.
There were significant differences in the magnitude of crises. For those crises arising from non-performing loans inherited from the centralized system, estimates of bad loans as a share of total loansrange from about 21 percent in Hungary to 50-66 percent in the Czech Republic. For those episodes ofacute financial distress, not related to inherited bad debt, the ratio of bad loans in total loans varied from40 percent (in Georgia in 1995) to more than 90 percent (in the Kyrgyz Republic in 1994). Whilequantitative information on the magnitude of bank runs is not available for those crises involving liquidityproblems, it appears that on some occasions liquidity problems were widespread (as in Bulgaria in 1996-97 and in Kazakhstan in 1996), while in others they were limited to one or two banks (as in Hungary in1997 and in Bulgaria in 1995).
With regard to the ownership structure of the financial institutions involved in banking crises, bothstate-owned and private banks incurred insolvency and liquidity problems. However, in governmentrestructuring programs directed to clean up banks' portfolios from non-performing loans inherited fromthe Socialist period, mainly state-owned banks were involved.
7

Table 4: Episodes of Banking Crises
Country Period Nature of the crisis Magnitude of the crisis Private vs. public Liquidity vs.banks affected Solvency
problemsBulgaria 1990s. 1991-1994: Clean up of In 1990 non-performing Former state owned Solvency.
banks' portfolios from loans were about 54 banks.bad loans inherited from percent of total loans.the centralized system.1995: Solvency and State-owned banks. Solvency andliquidity problems in liquidity.two state-owned banks.1996-1997: Widespread About one third of the Both state and private Solvency andliquidity problems. Also total number of banks banks. liquidity.currency crisis. was found insolvent and
closed.
Czech Rep. 1990s. 1991-1993: A clear evaluation of bad Former state-owned Solvency.Consolidation Program loans size at the banks and formerI to clean the portfolios beginning of the trade organization.of former state-owned transition is impossible.banks/organizations. Estimates of the share of
bad credits vary from2.4-19 percent to 50-66percent.
1996-1997: Eighteen banks involved Mainly private banks. Mainly solvencyConsolidation Program in the Consolidation problems. AlsoIf to clean the portfolios Program (of which three some liquidityof small-medium banks were liquidated). Six problems in 1996.and Stabilization banks involved in theProgram to provide Stabilization Program.cash-flow relief todistressed banks.
Hungary 1990s. 1992-1993: Loan According to some State-owned banks. Solvency.Consolidation Program estimates, in 1992 non-to clean up of banks' performing loans wereportfolios from 20.7 percent of totalinherited bad loans. loans.1993-1994: Bank-led In 1993 non-performing State-owned banks. Solvency.Restructuring and Loan loans were nearly 30Consolidation Program. percent of total loans.1995: Solvency problems State-owned bank. Solvency.in a state-owned bank(Agrobank).1997: Run on the second Private banks. Liquidity andlargest retail bank solvency.(Postabank). Solvencycrisis in a small private bank.
Macedonia 1990s. 1994: Clean up of the In 1993 non-performing State-owned bank. Solvency andportfolio of the largest assets were about 80 liquidity.bank from non- percent of total assets.performing loans.1997: Eight saving houses Solvencywere closed.
8

Table 4 (Cont.): Episodes of Banking Crises
Country Period Nature of the crisis Magnitude of the crisis Private vs. public Liquidity vs.banks affected Solvency
problems
Poland 1990s. 1991: Clean up of Four banks had State-owned banks. Solvency.banks' portfolios from experienced significantforeign exchange losses foreign exchange losses.due to the 1989devaluation.1993-1994: Enterprises In 1992 about 30 percent State-owned banks. Solvency.and Banks of total loans were non-Restructuring Program performing.to clean the portfolios ofstate-owned banks.1991-1994: Solvency State-owned banks. Solvency.problems in twospecialized banks.1994-1998: Solvency Two-hundred Mostly state-owned Solvency.problems in agricultural cooperatives qualified cooperatives.cooperatives banks. for bankruptcy and sixty
were suspended.
Estonia 1992, 1992: Four banks faced Total bad assets: 40 Private banks. Solvency.1994. solvency problems. percent of banking
system assets.1994: The country Withdrawal of over one- Private bank, with Liquidity andsecond largest bank half of this bank residual government solvency.(Social Bank) faced deposits. ownership.liquidity problems andhad weak loan portfolio.It was closed in 1995.
Latvia 1993- 1993-1994: In 1993 non-performing State-owned banks. Solvency.1994, Restructuring operation loans were about 51995 in two banks. percent of total banking
system assets.1995: Closure of the Total compromised Private banks. Solvencylargest private bank assets were 40 percent of problems, that(Baltija); three small banking system assets. produced depositand medium sized banks withdrawals.declared insolvent.Fifteen bank licensesrevoked.
Lithuania 1995- Insolvency in four In 1996 non-performing Private and state- Solvency1996. banks (including the loans were 32 percent of owned banks. problems, that
two largest). banking assets. produced depositWidespread solvency withdrawals.problems in the wholebanking system.
9

Table 4 (Cont.): Episodes of Banking Crises
Country Period Nature of the crisis Magnitude of the Private vs. public Liquidity vs.crisis banks affected Solvency
problemsGeorgia 1994, 1994: Insolvency of five Bad loans in 1995 State owned and Solvency.
1995- state-owned banks. Many reached 40 percent of private banks.1997. small private banks did total loans.
not conform withregulations.
1995-1997: Solvency and Insolvent bank's assets Private. Liquidity andliquidity problem in a were 7 percent of total solvency.bank (Agrobank). banking system assets.
Kazakhstan 1994, 1994-95: Restructuring In 1994 about 50-55 State-owned and Solvency.1996 program to clean-up percent of commercial private banks.
banks' portfolios. loans were eitherdoubtful or loss.
1996: Four large banks N/A State owned and Solvency andexperienced solvency and private banks. liquidity.liquidity problems.
Kyrgyz Rep. 1994- Clean up of banks' In 1994 approximately Former state-owned Solvency.1996 portfolios from bad loans 92.2 percent of banks.
(FINSAC). banking loans werenon-performing. Alsothe four largest bankswere insolvent.
Ukraine 1995, 1995: Central Bank N/A State owned and Solvency.1996- intervened in private banks.1998. approximately twenty
banks.1996-1998: more than 50 According to some State owned and Solvency.banks were liquidated. estimates, in 1998 bad private banks.
assets were still 40percent of total assets.
2.3 Causes of Banking Crises
Several factors contributed to the eruption of banking crises in the transition countries. The mostimportant are summarized below.
The transition process. The transition process led to vulnerability of the banking sector in variousways. First, a large number of commercial banks in the transition economies were carved out fromformner state banks. As a result, they inherited loans extended under the central planning system to state-owned enterprises which had not been subject to hard budget constraints under the previous regime anddid not have the habit of repaying debts. In addition, the transition process - removal of enterprisesubsidies and internal and external liberalization - also cut enterprises profitability in many sectors of theeconomy and reduced their ability to repay loans. Finally, both enterprises and the newly commercializedbanks lacked experience doing business with a profit-oriented approach.
10

External shocks. Transition countries in Europe and Central Asia suffered from the collapse of theCouncil for Mutual Economic Assistance (CMEA) foreign trade system which had isolated the conditionsof foreign trade in socialist countries from those prevailing in the world's hard currency trade. Starting in1991, foreign trade of the former socialist countries was conducted on a hard currency basis. Nopayments union among former CMEA countries was established, and trading relationships among thesecountries collapsed.
In addition, some countries were hit by idiosyncratic external shocks. For instance, certain bankslocated in some countries of the former Soviet Union (for example in Estonia and in the Kyrgyz Republic)lost access to part of their assets held in Russia after the collapse of the Soviet empire. In Latvia andLithuania, banks profitability was sharply reduced by the decline of trade financing opportunitiesresulting from price liberalization in Russia.5
Macroeconomic conditions. The transition process and external shocks led to severe outputcontraction in all countries at the onset of transition). These downturns precipitated banking crises inmany countries.
Table 5. Growth
1990 1991 1992 1993 1994 1995 1996 1997 1998(GDP annual percent change)
Central and Eastern EuropeBulgaria -9.1 -11.7 -7.3 -1.5 1.8 2.1 -10.9 -6.9 4.0Czech Rep. -0.4 -14.2 -3.3 0.6 2.7 5.9 4.1 1.0 -2.2Hungary -3.5 -11.9 -3.1 -0.6 2.9 1.5 1.3 4.6 5.0Macedonia -9.9 -12.1 -21.1 -9.4 -2.7 -1.6 0.9 1.5 5.0Poland -11.6 -7,0 2.6 3.8 5.2 7.0 6.1 6.9 4.8Average -6.9 -11.4 -6.4 -1.4 2.0 3.0 0.3 1.4 3.3
BalticsEstonia -8.1 -7.9 -21.6 -8.2 -1.8 4.3 4.0 11.4 4.0Latvia 2.9 -11.1 -35.2 -16.1 2.1 0.3 2.8 6.5 3.8Lithuania -5.0 -6.0 -19.6 -17.1 -11.2 2.3 5.1 6.1 4.4Average -3.4 -8.3 -25.5 -13.8 -3.6 2.3 4.0 8.0 4.1
cisGeorgia -12.4 -20.6 -44.8 -25.4 -11.4 2.4 10.5 11.0 4.0Kazakhstan -0.4 -11.0 -5.3 -10.6 -12.6 -8.2 0.5 2.1 -2.5Kyrgyz Rep. 3.2 -7.9 -13.9 -15.5 -20.1 -5.4 5.6 9.9 2.0Ukraine -3.4 -10.6 -17.0 -14.2 -22.9 -12.2 -10.0 -3.0 -1.7Average -3.3 -12.5 -20.3 -16A4 -16.8 -5.9 1.7 5.0 0.5Source: International Monetary Fund "World Economic Outlook" (1998, 1999), EBRD "TransitionReport" (1997. 1998).
The implementation of macroeconomic stabilization policies also made some countries moresusceptible to crises. In fact, tight monetary policies, introduced as part of stabilization programs, forcedup nominal interest rate and reduced inflation, thus raising real interest rates and affecting the borrowers'ability to service their debt. This occurred in Estonia in 1992 following the introduction of the currencyboard; Latvia after 1993; the Czech Republic in 1996; and Macedonia in 1992.
5 Latvian and Lithuanian banks were instrumental in financing East/West trade. In particular, special financingopportunities arose in 1993/94, when commodities prices in Russia were well below world market prices.
11

As an interesting aside, there was no obvious correlation between the kind of exchange rate regimearrangement and the occurrence of banking crises or systemic banking distress in the sample countries.Banking crises erupted under flexible exchange rate regimes in Bulgaria, Georgia, Kazakhstan andLatvia; managed floats in the Kyrgyz Republic and Macedonia; an adjustable peg in Hungary; crawlingpegs in Poland and the Czech Republic; and a currency board arrangement in Estonia and Lithuania.
Of the twelve countries, Bulgaria was the only one that suffered a currency crisis in conjunctionwith its banking crisis, leading to a large devaluation in 1996-97 and subsequent adoption of a currencyboard6. In this regard, the experience of the transition economies is different from that of the experiencein Latin America and East Asia, where banking crises commonly coincided with currency crises(Kaminski and Reinhart, 1999).
Deficiencies in supervision and in the legal framework. In the early 1990s the legal frameworkregulating the banking system was extremely poor in most transition countries. Adequate supervisorysystems and prudential regulations were not in place. In addition, central bank and banking laws wereweak, being deficient in regards to loan collection and bankruptcy, conflict of interest between banks andtheir shareholders, and rules on collateral.
Poor internal govemance. Fraud, corruption practices, insider lending, and inadequate disclosurecontributed to weaken the banking system in most transition countries. For example, bad loan portfolioswere generated by management misconduct and insider lending in two banks in Estonia (these wereliquidated respectively in 1992 and 1994), in the largest bank in Latvia (liquidated in 1995), and in thesecond largest bank in Hungary (which suffered from substantial liquidity problems in 1997).
In addition, extensive use of directed credit and on-lending under government instruction wasbehind the weak bank portfolios in Georgia, Kazakhstan, Kyrgyz Republic, and Ukraine and, to a lesserextent, also in Lithuania. Repetitive banks bailout from the government in the Czech Republic, Hungary,Bulgaria and Lithuania created moral hazard leading to risky lending, thus intensifying these countries'banking sector solvency problems.
3. Institutional, Operational and Financial restructuring of banks in transition countries
The eruption of banking crises or severe banking distress in the transition countries led thegovernment to restructure the banking system. This section discusses the experiences of these countriesin the three key areas of restructuring: institutional, operational and financial. All three kinds ofrestructuring need to be pursued in tandem for the successful resolution of banking crises.
3.1 Institutional Restructuring
Institutional restructuring addresses the environment within which banks operate. Key elements tobe addressed include: the legal framework, prudential regulations, accounting standards and bankingsupervision.
On the legal side, effective collateral and bankruptcy laws are particularly important for supportingbanking operations and loan recoveries. Prudential regulations are aimed at limiting bank credit riskexposure and at creating a cushion against potential losses (Talley et al, 1998). The limits on large creditexposure and enterprise share ownership are especially important for banking systems in transitioneconomies given the prevalence of cross-ownership between banks and enterprises and lending to owners.
6 The Czech Republic experienced a currency crisis in 1997, although this was not connected to its banking crisis.
12

Minimum capital, capital adequacy, loan classifications, loan loss provisioning and liquidityrequirements are aimed at creating a cushion against potential losses. Effective implementation of theserequirements require internationally acceptable accounting standards, which are essential for monitoringthe banking system, regulating bank performance, and for the implementation of effective bankingsupervision.
As mentioned earlier, the sample countries began transition with a weak institutional frameworkfor the banking system. Liberal licensing policies and lax prudential regulations resulted in a rapidincrease in the number of new banks in the system, most notably in the CIS and Baltic countries (seesection 3.2). Many of the new banks were small, undercapitalized and non-viable. In the face of thesedevelopments, some countries began to strengthen the institutional framework for their banking sectors bytightening licensing policies and introducing or raising minimum capital and capital adequacyrequirements. In some cases, the introduction of accounting standards, loan classification andprovisioning requirements revealed the scope of non-performing loans in the banking systems. This ledto financial and/or operational restructuring, with banks that could not comply with the requirementsbeing either recapitalized, merged with other banks, or liquidated.
The cases of Hungary and Poland illustrate this sequence of developments. Both countries pursuedliberal licensing policies in the early years of transition that led to the entry of new banks, many of whichran up large losses and were undercapitalized. In response to these developments, both countries beganto strengthen the institutional frameworks for banking. In 1991, Hungary introduced new accountingstandards (the Accounting Act), the Bankruptcy Act, and the Banking Act (which addressed loanqualification, regulations on provisions, large exposure and related party lending). In 1992, Polandrevised the Banking Law giving the central bank authority to enforce provisioning requirements, capitaladequacy and exposure limits. The new standards and laws made it clear that a major financial andoperational restructuring program for banks was necessary in both countries, which they subsequentlyundertook.
In most of the countries under consideration, the eruption of banking crises led to the strengtheningof the institutional framework (Table 6). Prudential regulations were introduced or, if they were alreadyin place, tightened in the aftermath of banking crises or bank restructuring programs. Licensingrequirements were tightened in Estonia (1994), Latvia (1995) and Lithuania (1995-96) following thebanking crises in these countries, which led to the consolidation of the banking sector through bankliquidation. In some other countries, such as Georgia (1995) and Kazakhstan (1994), institutionalrestructuring followed the introduction of restructuring programs in the banking sectors. In manycountries there was a second wave of prudential regulation tightening in the latter part of the 1990s; forsome countries this was to comply with European Union (EU) regulations.
Prudential regulations are generally tighter in the CEEs and the Baltics than in the CIS. The Balticsand CEEs have in place a minimum capital requirement of at least (and in some cases exceeding) ECU 5million as required by the EU regulations, whereas this requirement is lower in all the CIS countries underconsideration. All the CEEs and Baltic countries have a capital adequacy requirement (CAR) of at least 8percent (the Basle requirement), and in some countries even higher. Two of the CIS countries underconsideration (Georgia and the Kyrgyz Republic) have a 12 percent CAR (information on CARs is notavailable for Kazakhstan and Ukraine). The actual CARs in most transition economies in this study arefairly high, exceeding the required level: 15.5% in Poland (1998), 18.3% in Hungary (1997), 12% in theCzech Republic (1998)7 (Table 17).
' Even though the actual CAR in the Czech Republic (12% in 1998) is well above the 8% required by BIS, the IMFdoes not consider it a comfortable level, when compared to other Central European countries (IMF, 1999).
13

Table 6: Key Elements of the Banking Institutional Framework 1/Date crisis Date of Date BIS CAR 3/ Date Current 1998 EBRD(distress) introducton of (8%)enteredin LMSin minimum Ranking ofpeaked prudential force (date of force 4/ capital extensiveness
regulations and increase) requirement 5/ (effectiveness) ofsupervision (date financial laws
offurther andtightening)21 regulations 6/
Bulgaria 1996-1997 1997 (1998) 1993 (1998:10%; 1998 USD 5.9 ml 4(4-)1999:12%)
Czech Republic 1991-1993 1995 (1998) 1996 NA USD 16.8 mln 3 (3-)1996- 1997
Hungary 1992 1993 (1996) 1992 1996 From 4 (4)1995-1996 USD 100,000
to 9.8 mln
FYR Macedonia 1994-1996 NA (1998) 1993 1996 From 3 (3-)USD 4.2 min to
12.6 mln
Poland 1992-1993 1993-1994 (1998) 1993a/ 1994 ECU 5 mln 4 (3)
Latvia 1995-96 1996 (1999) 1994 (1999:10%) 1992 ECU 5 mln 3 (3)
Lithuania 1995-96 1997 (1999) 1996(1997:10%) 1997 ECU 5 mln 3- (2+)Estonia 1992; 1994 1997 1994 (1997:1 0%) 1995 ECU 5 mln 3 (3)
Georgia 1995-1997 1996 (1999:12%) Propose USD 2.8 min 2 (2)d date (for new banks)
12/2000Kazakhstan 1994-1996 NA NA 1997 From 2 (2)
USD 0.5 mln toUSD 3 mln
Kyrgyz Republic 1994-1996 1996 (1999) 1995(1999:12%) 1997 From USD 3- (2)850,000
to 1.4 mln
Ukraine 1995; 1996- 1996 (1998) NA 1998 ECU I min 2+ (2)1998
Notes.a/ In 1999 CAR was raised for some banks. For banks that were operating prior to 1993, CAR remained at 8%, andfor newer banks it was raised to 15% during the first year of operations, and to 12% in subsequent years of operation.1/ For detailed explanation of the regulations and their comparison with the BIS and EU standards see AppendixTable 2.2/This refers to the dates of the introduction or tightening of one or more of the following prudential regulations (fordetails see Appendix Table 2): capital adequacy requirement, large credit exposure limit, liquidity requirement, openforeign exchange exposure limit, loan classification and provisioning requirements, limits on equity holdings in non-financial enterprises, and limits on connected lending.3/ This is the Capital Adequacy Ratio standard set by the Bank for International Settlements.4/ IAS is International Accounting Standard. Source: EBRD Transition Reports.5/ Expressed in USD equivalent of local currency at end- 1998 market exchange rate, or in ECU if requirement isexpressed in ECU and not in local currency. Where there is only a single number, it refers to minimum capitalrequirements for banks only. Where there is a range of numbers, they refer to minimum capital requirements foreither different types of financial institutions or ownership - for details see Appendix Table 2.6/ The EBRD rankings are on a scale from I to 4.
However, the extensiveness of prudential regulations does not guarantee compliance. A 1998 EBRDsurvey found that transition economies had a better record for the extensiveness of financial laws and
14

regulations for the banking sector than for their enforcement8. The same survey found that the CIScountries were rated lower in both extensiveness and effectiveness than the CEEs and the Baltics. Amongthe CEEs, Hungary, Poland and Bulgaria were rated higher in both counts than the Czech Republic andMacedonia. Estonia was rated the highest among the Baltic countries.
The issue of effectiveness of financial sector legal framework is closely related to the quality ofbanking supervision. As in the case of strengthening prudential regulations and introduction ofinternational accounting standards (IAS), improvements in the quality of banking supervision took placein the aftermath of banking crises or after the initiation of financial sector reforms to address bankingdistress. However, the lack of financial resources and technical expertise have made the implementationof effective banking supervision problematic. Countries that are most advanced in terms of legal reformin the financial sector (Hungary and Poland) are planning to introduce bariking supervision on aconsolidated basis, which is important to prevent excessive credit risk exposure and inadequatecapitalization in the financial institutions not covered by the regulations.
In sum, a strong institutional framework is a key element for a sound banking sector. Thestrengthening of the institutional framework in the aftermath of banking crises in the sample countrieshave helped produce positive results of bank crisis resolution in all of them (see section 6 for results ofcrisis resolution). By the same token, the greater extensiveness and effectiveness of financial laws andregulations in the CEEs and the Baltics compared with the CIS are accompanied by stronger bankingsystems in the first two country groups compared with the last one.
3.2 Operational Restructuring
Operational restructuring of banks is aimed at improving their corporate governance. It deals withthe flow problems in banks caused by non-perforning loans and high operating costs. Operationalrestructuring can take two forms: bank closure and liquidation; or bank restructuring, which could entailchange of management or privatization.
The experience of the twelve countries under consideration was that the CEE countries generallyrestructured banks rather than close them, whereas the CIS countries tended to favor theliquidation approach. The Baltic countries pursued a combination of liquidations andrestructuring.
The strategy adopted by the authorities for resolving banking crises seem to depend, in part, on twofactors: (i) the development of the banking sector, including the degree of financial penetration; and (ii)macroeconomic conditions. The impact of these factors on the operational restructuring strategy pursuedin the different country groups is discussed next.
The CIS and the Baltics. At the onset of transition, the banking systems in the CIS and the Balticswere developed mainly through liberal entry of new banks in combination with the spontaneous breakupand privatization of state banks, and in some cases liquidation of old banks. This approach was notalways a deliberate choice, but happened spontaneously when the former Soviet Union collapsed. Theresult was an explosion of the number of new banks that entered the system (in absolute terms and in
8 EBRD Transition Report, 1998. Academic and practicing lawyers and other experts familiar with the financiallaws and regulations of the region were surveyed. The survey questions were based in part on the core principlesdeveloped by the Basle Committee, including questions on: banking regulations and supervision; minimum financialrequirements (capital adequacy standards) and criteria for banking operations; use of internationally acceptableaccounting standards; and ability of banking regulators to engage in enforcement and corrective action.
15

terms of banks per population) (Table 2).9 Some of the new banks were engaged mostly in financingexisting inefficient enterprises (the so-called "pocket" banks). Many of them were small andundercapitalized, and did not even meet the lax licensing requirements inherited from the former SovietUnion (FSU). These banks obviously did not have proper governance, nor did they engage in muchdeposit mobilization. Therefore, although many new banks were established, financial intermediation inthose economies did not increase.
Given the low "value-added" provided by these new banks, the authorities were able to respond tobanking crises by closing the insolvent institutions. Indeed, the low level of financial intermediation inthese countries also meant that a large number of banks could be closed without generating widespreadeffects on the economy. At the same time, the authorities did not have to tackle the problem of a largeamount of inherited bad debt in the state-owned banks because hyper inflation (reaching 4 to 5 digits)'°had greatly reduced the real value of this bad debt (although depositors bore the costs through erosion ofthe real value of their deposits). Therefore, resolution of banking problems in these countries did notentail significant restructuring or recapitalization of state-owned banks, nor sizeable fiscal costs (section4). Furthernore, high fiscal deficits in the CIS countries may also have diminished their appetite forincurring fiscal costs to bail out the banking system.
A large number of banks were closed in the CIS countries. In Kazakhstan, where the numeroussmall banks accounted for only a very small share of household deposits, the number of domestic bankswas reduced from 204 to 71 between 1993 and 1998. In Georgia, where about 80 percent of the newprivate banks had no more than three to five customer accounts, the number of domestic banks wasreduced from 226 to 43 between 1994 and 1998 (Table 2). Ukraine is the only country in this groupwhere there was not much banking consolidation. In none of these countries did substantial consolidationof the banking sector lead to sector-wide systemic risks, high costs, or social problems. Among the CIS,the Kyrgyz Republic stood out in that even major banks, including state-owned banks such as the SavingsBank, were liquidated.
All three Baltic states also experienced a major consolidation in the number of banks through the1990s, although in some instances there was restructuring and recapitalization. In Estonia, the number ofbanks fell from 22 to 6 between 1994 and 1998; in Latvia from 62 to 27 between 1993 and 1998; and inLithuania from 26 to 10 over the same period. Most of the liquidated banks were small. For example,thirteen of the Lithuanian banks that were liquidated accounted for only 3 percent of the deposits.However, there were a few exceptions. For instance, in Latvia, the largest commercial bank was closed in1995, and in Lithuania, the country's largest bank was liquidated in 1997.
The CEE countries. In the CEEs, the development of the banking system since transition differedfrom that in the CIS countries and the Baltics in focusing on the rehabilitation and transformation ofexisting state-owned financial institutions which were then recapitalized to prepare them for privatization.Although the CEEs did allow the entry of new banks to introduce competition into the system, entry wasmore limited than in the CIS and the Baltics (as can been seen in the smaller number of banks perpopulation in Table 2). Moreover, these new entrants included foreign banks, which were generallysounder than the new domestic private banks". Since the entry of new banks was more limited and thequality of the new banks was better in the CFEEs than in the other two country groups, there was not asmuch a need for liquidation of these banks.
9 Another indicator, number of bank branches per population (rather than banks per population), may have beenbetter, but such information is not available.'Appendix Table 3 presents inflation figures for the twelve countries.
For instance, Citibank, an obviously reputable foreign bank, entered Hungary in 1985.
16

Furthermore, in contrast to the CIS and the Baltic countries where non-performing loans were
generally accumulated during the transition process, the main cause of banking unsoundness in the CEEs
was the large amount of inherited bad debt that had not been wiped out by hyper inflation. Since the
newly-commercialized banks were not viewed as responsible for these bad loans, the CEE authorities
chose to restructure and recapitalize these banks despite the high costs (section 4). Interestingly and
contrary to what one would expect, despite their higher level of government indebtedness at the onset of
banking crises, the CEEs did not pursue a less costly approach to crisis resolution than the other two
country groups.
In addition, financial intermediation was deeper in the CEEs, and some of the troubled banks were
considered "too big to fail". Given their size, liquidation would have meant wiping out most of the
banking system, imposing huge economic and political costs. As a consequence, in the CEEs (with the
exception of Bulgaria), resolution of the banking crises did not result in any significant downsizing of the
number of banks in the banking system. Indeed, Bulgaria was the only country among the CEEs that
experienced a significant reduction in the number of banks, while in Hungary and Macedonia the number
of banks in the system actually increased through the 1990s.
a. Privatization and Foreign Entry
In some of the transition countries, operational restructuring involved privatization of banks,
including to foreign investors. The experience appears to be that privatization was the best way to
achieve the goal of operational restructuring, which is to improve the corporate governance of banks.
The countries' experience shows that if privatization resulted in dispersed ownership or cross-ownership by enterprises or even the government, it did not improve corporate governance. This was the
case for all the banks in the Czech Republic after voucher privatization at the beginning of transition, the
state banks in Georgia, Postabank in Hungary, and still the case in many of the banks in Macedonia.Privatization to a core investor which is a reputable bank appears to have been the best approach for
bringing about independent governance to the banking sector. Independent governance for banks means
that the banks are free of the control of governments and clients, can exercise hard budget constraints and
develop capability to manage financial risks (Bonin et al, 1999). A core investor could also bring veryuseful and valuable banking skills to the incumbent bank.
In a region where experience in commercial banking was limited and capital insufficient,privatization to a strategic foreign and reputable investor appears to have been a useful approach for
strengthening the domestic banking sector (Bonin et al, 1999; Bonin and Wachtel, 1999). Entry of foreign
banks helped to modernize the domestic banking sector through introduction of modern bankingpractices, as well as product and service innovation. It also introduced competition into the banking
sector, which is essential for improving the efficiency of financial intermediation12 . Moreover, for thosecountries which had already allowed in de novo foreign banks, such as Hungary, privatizing state-ownedbanks to foreign strategic investors helped these incumbent banks better compete with the new foreignentrants.
Two main factors determine the size of the foreign bank presence in a particular country. The first
is the policy environment. The CEEs and the Baltic countries were much more open to foreign entry into
their banking systems than the CIS countries. In fact, the CEE countries under consideration (with the
exception of Macedonia) had actively attracted foreign banks for bank privatization. The foreign banks
that invested in these countries tended also to be sound and reputable. The second factor is the
12 An econometric study done by Claessens and others (1998) found that foreign entry increased competition in thebanking sector in 80 countries for the period 1988-95.
17

attractiveness of local conditions, including the presence of a vibrant private sector and a sound legalframework that is enforced. In this regard, the CEEs and the Baltics were also more attractive than theCIS. It is therefore not surprising to find greater foreign presence in the banking sectors in the CEEs andthe Baltics than in the CIS countries.
Among the countries under consideration, foreign bank activities are most extensive in the Balticcountries, especially in Latvia and Estonia, while Lithuania had begun to acquire a larger foreign bankpresence. In Estonia, foreign banks (from Finland, Germany and Sweden) have played an increasinglyimportant role in the system since 1994. Swedish banks owned majority shares in the two largestdomestic banks which accounted for 85 percent of total banking sector assets as of mid-March 1999. InLatvia at end-1998, of the 27 banks in the country, 2 were state-owned and 15 were foreign-owned.Subsidiaries of Estonian, Finnish, German and Russian banks as well as a branch of a French bankoperated in Latvia. By end-1998, majority foreign-owned banks were responsible for almost 85 percentof total bank assets. Among the Baltic countries, the presence of foreign banks is the lowest in Lithuaniaalthough this has recently increased. The two large domestic banks which account for 42 percent of totalbanking system assets are majority-owned by foreign investors.
There has also been an increasing presence of foreign banks in the CEEs. Among the CEEcountries, Hungary has been at the forefront in attracting foreign banks for bank privatization. Since thefirst foreign bank was established in 1979, foreign presence in the Hungarian banking sector has risensubstantially. Currently, the share of private sector in total bank equity exceeds 80 percent, and foreignintermediaries own 60 percent of the banks13. Bulgaria has recently been actively pursuing theprivatization of its state-owned banks to foreign strategic investors and, to date, around 80 percent of theassets in the banking system are owned by foreign banks. The Czech Republic has been stepping up theprivatization of its state-owned banks to strategic foreign investors recently. Three of the big five state-owned banks are already privatized to strategic foreign investors (from Japan, the U.S. and Belgium,respectively) and preparations are underway for the privatization of the remaining two, the completion ofwhich will bring foreign-owned banks' market share to about 90 percent of total assets in the system.After an initial period of liberal entry for foreign banks, Poland is now lagging behind in terms of foreignbanking presence, with majority-owned foreign banks accounting for only 35 percent of the country'stotal banking assets. The foreign presence in Macedonia's banking system is even smaller, comprising in1998 of only one branch of a Russian bank.
Foreign participation in the CIS countries remains very limited, and foreign banks that are presenttend to be Russian. Georgia has some foreign presence in its banking sector. In the Kyrgyz Republic,there are banks that have foreign participation. In Kazakhstan, there are 10 foreign banks in 1997, butthese banks are limited to own no more than 25 percent of a domestic bank's stock (Kalyuzhnova andTridimas, 1998). In Ukraine, only thirty of the 190 banks in 1998 boast foreign (largely Russian) capitalholdings.
In sum, of the twelve countries under consideration, those which have the larger foreign bankingpresence also happen to have the stronger banking systems (in particular Estonia and Hungary). Thisgives some credence to the proposition that privatization to foreign investors could be an importantelement of bank operational restructuring.
3.3 Financial Restructuring
Financial restructuring deals with the stock problems in banks, that is the problem of negative networth. Financial restructuring generally employs one or more of the following instruments: (i) injection
3 Hungary Country Economic Memorandum (1999).
18
of new capital; (ii) reduction of bank liabilities; (iii) transfer of non-performing loans to a special agencyand (iv) improvement in the management of non-performing loans (Hoelscher, 1998). The last twoinstruments are related to the recovery of bad loans, which is discussed in section 5.
Tables 7 and 8 summarize the main methods of financial restructuring by the government and thecentral bank in the transition countries under consideration. Financial restructuring by the governmentincluded recapitalization of banks through the issuance of public debt. Generally, the transferred bondswere swapped for non-performing loans14. In some cases, instead, the issuance was unrequited.Occasionally, governments directly improved banks' net worth through the transfer of cash or propertyassets, the reduction of bank liabilities, repurchase agreements and the provisions of public guarantees onoutstanding loans. Finally, in a few occasions, governments intervened in enterprises to facilitate debtservicing or repayment. Only in Ukraine did the government not embark on any form of intervention insupport of the banking sector. Financial restructuring by the central bank involved provision of short andlong terms loans, and refinancing of troubled banks' assets.
In the CEEs, financial restructuring of the problem banks usually involved injection of new capital,after which the banks were to be privatized. This was the case in Hungary, Poland, the Czech Republicand Bulgaria. In the CIS countries, financial restructuring was limited to the cleaning of balance sheets(removing bad loans from the books), which basically shrank the size of the banks' balance sheets,accompanied by reduction of liabilities and capital (with depositors and bank shareholders bearing theloss in most instances). The experience of the Baltics was mixed; there was injection of new capital intothe banks in Estonia and Lithuania, but not in Latvia. The fiscal costs were obviously higher where therewas injection of new capital.
4. Costs of Banking Crises
The cost of a banking crisis can be measured by the shortfall in banks' capital - that is, thedifference between their assets and the sum of their liabilities and the regulatory minimum level ofcapital. In transition countries, depositors had initially bore some of the cost of banking crises arisingfrom inherited bad debt through the hyper or very high inflation at the onset of transition. The remainderof the inherited costs, as well as new costs incurred post-transition, were distributed between thegovernment, bank shareholders, and depositors.
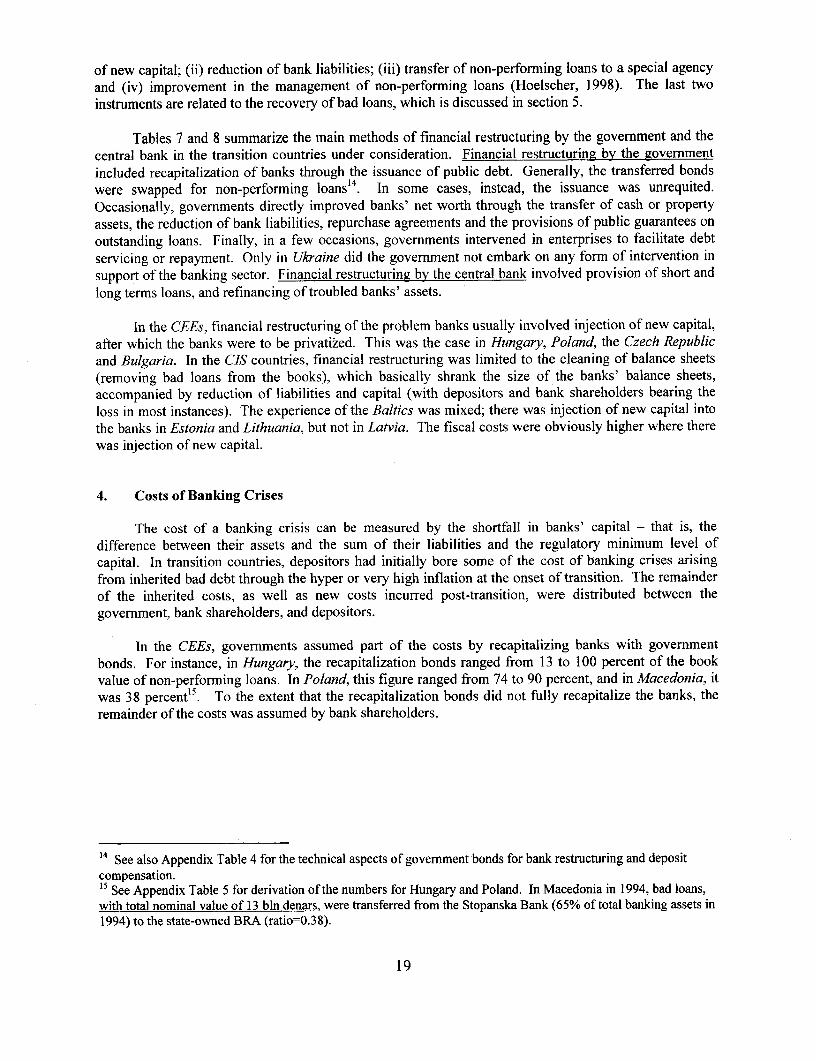
In the CEEs, governments assumed part of the costs by recapitalizing banks with governmentbonds. For instance, in Hungary, the recapitalization bonds ranged from 13 to 100 percent of the bookvalue of non-performing loans. In Poland, this figure ranged from 74 to 90 percent, and in Macedonia, itwas 38 percent15. To the extent that the recapitalization bonds did not fully recapitalize the banks, theremainder of the costs was assumed by bank shareholders.
14 See also Appendix Table 4 for the technical aspects of govemment bonds for bank restructuring and depositcompensation.15 See Appendix Table 5 for derivation of the numbers for Hungary and Poland. In Macedonia in 1994, bad loans,with total nominal value of 13 bln denars, were transferred from the Stopanska Bank (65% of total banking assets in1994) to the state-owned BRA (ratio=0.38).
19

Table 7. Methods of Financial Restructuring and Government Assistance tothe Banking Sector
Method Country and date1. Capital injectionA. Bond trasfer
A. I Exchange for bad loans Bulgaria (1991-94, 1995, 1996-97); Czech Republic (1991-92);Hungary (1992-93); Macedonia (1994); Estonia (1992);Lithuania (1996); Kyrgyz Republic (1996-97)
A.2 Unrequited Czech Republic (1991-92); Hungary (1993-94); Poland (1991,1993-94); Latvia (1994); Estonia (1993); Kazakhstan (1996-97)
B. Cash transfer Czech Republic (1991-92, 1993-96); Lithuania (1996)
C. Transfer of property assets Lithuania (1996)
2. Reduction of bank liabilities
A. Write-off of bank liabilities to the Georgia (1998)government (in exchange for bank assets)
B. Assumption of bank liabilities Estonia (1995)
3. Repurchase agreement Czech Republic (1993, 1996-97)
4. Provision of guarantees on outstanding Czech Republic (1991, 1993, 1996)Loans Hungary (1991)
Lithuania (1997)
5. Short/medium term loan
Placement of deposits Lithuania (1995)
6. Actions on enterprises to allow servicing/repayment of bank debt
A. Assumption of enterprise debt Georgia (1998) (directed credits extended under governmentinstruction).Kazakhstan (1994-95) (directed credits extended undergovernment instruction and payments of governmentguarantees) /L.
B. Equity conversion of government claims Hungary (1992)on enterprises.
C. Rescheduling or writing-off of government Hungary (1992)claims on enterprises.
7. No action Ukraine/1 In exchange the government received an equity position in the enterprises.
20

Table 8. Methods of Central Bank Assistance to the Banking Sector.Method Country and dateLiquidity support Bulgaria (1991-1994,1995,1996-97); Czech Republic (1996);
Macedonia (1995); Poland (1993); Estonia (1992-1994); Latvia(1995); Lithuania (1995); Kazakhstan (1994-95, 1996); KyrgyzRepublic (1994); Ukraine.
Loan to asset management agencies Czech Republic (early 1990s, 1997); Macedonia (1994)
Capitalization of asset managment Macedonia (1996)agency, through bond issue
Transfer of assets (in exchange for Estonia (1997)bad loans).
Long term loan to banks Poland (1993)
Rescheduling of loans to banks Kazakhstan (1997); Kyrgyz Republic (1994)
Writing off of central bank shares in Estonia (1995)banks to cover their losses
In the CIS and Baltic States, the governments generally adopted a lower cost approach, relying onrecapitalization by private shareholders. To the extent that this was not possible, the banks wereliquidated with minimal compensation for depositors. This was the case in Georgia, Kazakhstan,Estonia, Latvia, and to a smaller extent in Ukraine 6. With the exception of Lithuania, recapitalizationwith state funds in the CIS and Baltic countries generally occurred only for the inherited portion of badloans, and even then not for the entire amount.
In most of the countries covered, there is no information on the shortfall in banks' capital, that is,the entire cost of the banking crisis. The only portion of the cost that is observable is that borne by thegovernment - that is, the fiscal cost - which will be reviewed in the rest of this section (4.1 to 4.3). Thefiscal cost includes the cost to the government of recapitalizing banks (including with recapitalizationbonds, as discussed above) and compensating depositors. It also includes, in some cases, the quasi-fiscalcosts incurred by the central bank. These fiscal costs are reduced when governments recover bad loans(section 5).
4.1 Cost of Bank Restructuring for the Government
The cost of bank restructuring for the government includes the bonds issued for bankrecapitalization (both unrequited and in return for non-performing loans); cash and property transfers;called government guarantees; bank's or enterprise's liabilities assumed by the government; and transfersto the central bank connected with banking sector restructuring (Table 9), There are also additional costs,not quantifiable, which arise from revenues losses due to lower bank profits. Cumulatively over theperiod 1991-98, the costs of government assistance to the banking sector ranged from 5 to 27 percent ofGDP in the CEEs, 0.1 to 18 percent in the CIS, and I to 3 percent in the Baltics.
16 In Ukraine the consolidation of the banking sector has begun only recently under the banking sector reformprogram that began in 1996. Some small, marginal banks were liquidated. For details see Report of the President forProposed Financial Sector Adjustment Loan for Ukraine, February 24, 1998.
21

Table 9: Cost of Bank Restructuring for the Government (1991-98)(percent of GDP)
1991 1992 1993 1994 1995 1996 1997 1998 Total/BulariaBond issued 0.0 2.1 10.9 23.1 0.3 0.0 0.5 0.0 26.5Interest payments on bonds 0.0 1.3 1.3 2.9 2.9 10.7 0.8 0.4Total 2
Czech Republic 2'Bond issued 4.0 0.0 0.0 0.0 0.0 0.0 0.0 0.0 3.4Cash transfers 0.0 0.0 0.9 0.7 0.3 0.0 N/A N/A 1.5Purchase of bad loans 10.9 1.8 2.7 0.3 0.0 0.1 0.7 1.0 15.7Total 2O6
Hun2aryBond issued 0.0 2.7 3.6 2.1 0.1 0.1 0.0 1.6 12.4Interest payments on bonds 0.0 0.0 0.0 1.2 1.7 1.5 1.0 0.5Guarantees called less recovered 0.0 0.1 0.0 0.0 0.1 0.0 0.1 0.0 0.5Total 12.9
MacedoniaBond issued 0.0 0.0 0.0 3.3 0.0 0.0 0.0 0.0 5.1Interest payments on bonds 0.0 0.0 0.0 0.0 0.4 0.4 0.2 N/ATotal S.1
PolandBonds issued 7.1 0.0 1.3 0.8 0.0 0.0 0.0 0.0 8.2o/w placed in Central Bank 1.5 0.0 0.0 0.0 0.0 0.0 0.0 0.0 1.3Interest payments on bonds 0.3 0.4 0.5 0.7 0.6 0.4 0.3 0.2o/w to Central Bank 0.1 0.1 0.1 0.1 0.1 0.04 0.03 0.02Total 8.2
EstoniaBonds issued 0.0 0.0 2.0 0.0 0.0 0.0 0.0 0.0 1.0Interest payments on bonds 0.0 0.0 0.1 0.1 0.1 0.1 0.0 0.0Purchase of bad loans 0.0 0.0 0.0 0.0 0.05 0.0 0.0 0.0 0.0Recapitalization of Central Bank3' 0.0 0.0 0.0 0.0 0.0 0.4 0.0 0.0 0.3Total I
LatviaBonds issued 0.0 0.0 1.6 1.9 0.0 0.0 0.0 0.0 2.5Interest payments on bonds 0.0 0.0 0.3 0.4 0.04 0.03 0.03 0.03Total 2
LithuaniaBonds issued 0.0 0.0 0.0 0.0 0.0 0.7 0.4 0.5 1.6Interest payments on bonds 0.0 0.0 0.0 0.0 0.0 0.0 0.1 0.1Cash 0.0 0.0 0.0 0.0 0.0 0.03 0.0 0.0 0.0Property transfer 0.0 0.0 0.0 0.0 0.0 0.02 0.0 0.0 0.0Called guarantee on interbank loan 0.0 0.0 0.0 0.0 0.0 0.0 0.1 0.0 0.1Total .
22
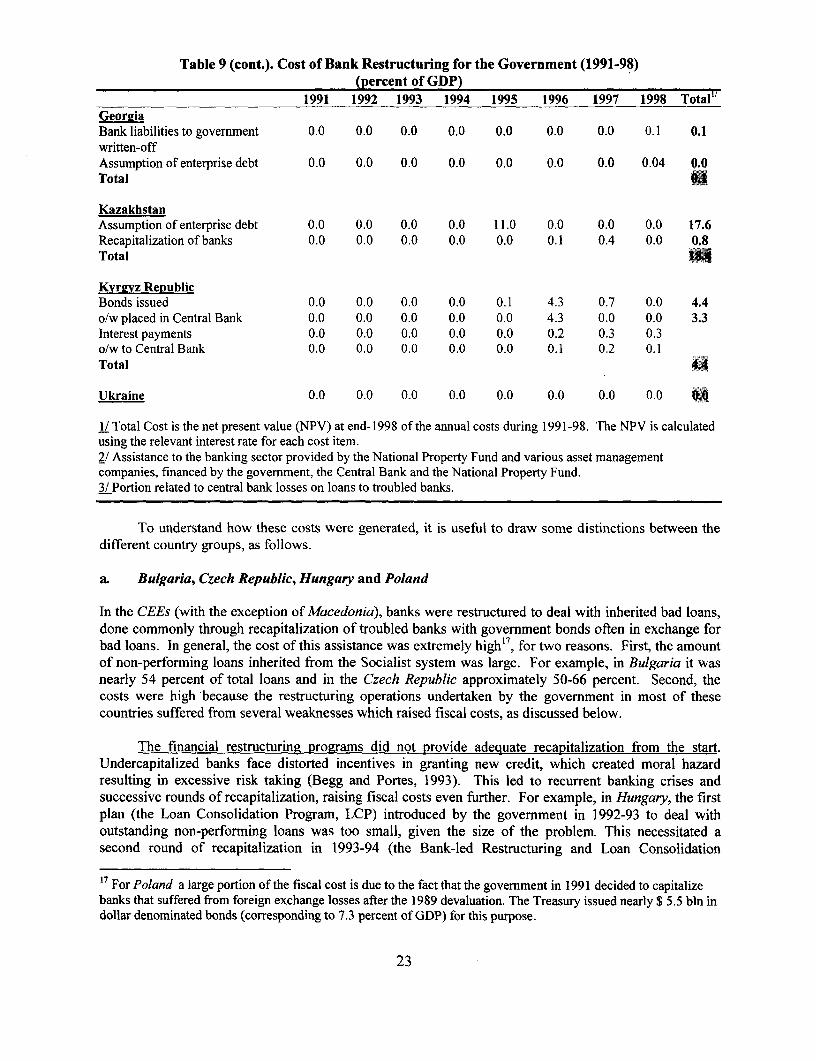
Table 9 (cont.). Cost of Bank Restructuring for the Government (1991-98)(percent of GDP)
1991 1992 1993 1994 1995 1996 1997 1998 Total"GeorgiaBank liabilities to government 0.0 0.0 0.0 0.0 0.0 0.0 0.0 0.1 0.1written-offAssumption of enterprise debt 0.0 0.0 0.0 0.0 0.0 0.0 0.0 0.04 0.0Total
KazakhstanAssumption of enterprise debt 0.0 0.0 0.0 0.0 11.0 0.0 0.0 0.0 17.6Recapitalization of banks 0.0 0.0 0.0 0.0 0.0 0.1 0.4 0.0 0.8Total 18
Kvrevz RepublicBonds issued 0.0 0.0 0.0 0.0 0.1 4.3 0.7 0.0 4.4o/w placed in Central Bank 0.0 0.0 0.0 0.0 0.0 4.3 0.0 0.0 3.3Interest payments 0.0 0.0 0.0 0.0 0.0 0.2 0.3 0.3o/w to Central Bank 0.0 0.0 0.0 0.0 0.0 0.1 0.2 0.1Total 4.4
Ukraine 0.0 0.0 0.0 0.0 0.0 0.0 0.0 0.0 0O.
i/ Total Cost is the net present value (NPV) at end- 1998 of the annual costs during 1991-98. The NPV is calculatedusing the relevant interest rate for each cost item.2/ Assistance to the banking sector provided by the National Property Fund and various asset managementcompanies, financed by the government, the Central Bank and the National Property Fund.3/ Portion related to central bank losses on loans to troubled banks.
To understand how these costs were generated, it is useful to draw some distinctions between thedifferent country groups, as follows.
a. Bulgaria, Czech Republic, Hungary and Poland
In the CEEs (with the exception of Macedonia), banks were restructured to deal with inherited bad loans,done commonly through recapitalization of troubled banks with government bonds often in exchange forbad loans. In general, the cost of this assistance was extremely high"7, for two reasons. First, the amountof non-performing loans inherited from the Socialist system was large. For example, in Bulgaria it wasnearly 54 percent of total loans and in the Czech Republic approximately 50-66 percent. Second, thecosts were high because the restructuring operations undertaken by the government in most of thesecountries suffered from several weaknesses which raised fiscal costs, as discussed below.
The financial restructuring programs did not provide adequate recapitalization from the start.Undercapitalized banks face distorted incentives in granting new credit, which created moral hazardresulting in excessive risk taking (Begg and Portes, 1993). This led to recurrent banking crises andsuccessive rounds of recapitalization, raising fiscal costs even further. For example, in Hungary, the firstplan (the Loan Consolidation Program, LCP) introduced by the government in 1992-93 to deal withoutstanding non-performing loans was too small, given the size of the problem. This necessitated asecond round of recapitalization in 1993-94 (the Bank-led Restructuring and Loan Consolidation
17 For Poland a large portion of the fiscal cost is due to the fact that the government in 1991 decided to capitalizebanks that suffered from foreign exchange losses after the 1989 devaluation. The Treasury issued nearly $ 5.5 bln indollar denominated bonds (corresponding to 7.3 percent of GDP) for this purpose.
23

Program). Equally, in Bulgaria, the 1991-1994 operation to clean up banks' portfolios from bad creditsdid not provide adequate capitalization 8. Further recapitalization was necessary after the eruption of thebanking crisis in 1996-97.
Financial restructuring was not coupled with operational and institutional restructuring. This led torenewed banking crisis, requiring further recapitalization and raising fiscal costs. Hungary is a well-known case in point. Not only did the 1992-93 LCP not provide adequate capitalization (see abovepoint), it was also not accompanied by operational restructuring of banks, and the bad loan problemdeteriorated after a temporary improvement'9, necessitating another round of recapitalization. This wasalso the case in Bulgaria, where the recapitalization of banks in the first part of the 1990s was notaccompanied by operational restructuring, with the result that banks continued to roll over outstandingcredits to state-owned enterprises while capitalizing interests, leading to the eruption of the large-scalebanking crisis in 1996 and 1997. The Czech Republic is another example illustrating how financialassistance not contingent on comprehensive restructuring could be very costly.
Bank restructuring was not coupled with enterprise restructng. In most CEEs, adequateenterprise restructuring was missing. As a consequence, banks continued to lend to bankrupt enterprises,which further worsened their financial positions. As discussed above, in Bulgaria this problem resultedin a more severe banking crisis. Equally, in the Czech Republic, bank recapitalization was notaccompanied by a full restructuring of enterprises. Poland was an exception for undertaking a parallelbank and enterprise restructuring program, the Enterprise and Bank Restructuring Program (for details seesection 5). While the enterprise restructuring part of the program had mixed results (Gray and Holle,1 996b), the outcome for the banking sector was more successful.
Repetitive bailouts induced moral hazard behavior. In some CEE countries (Bulgaria, the CzechRepublic and Hungary), repetitive bank bailouts because of the reasons just discussed further encouragedmoral hazard in lending decisions and induced excessive risk taking. In addition, in Hungary thegovernment established from the beginning its reputation as a soft bargainer, by first moving the date forloans eligible for bailouts from 1987 to 1992 and by renegotiating the terms of the securities it issued forbank recapitalization.
No clear lines between old and new loans were established. The purpose of the governmentrecapitalization operations undertaken in the early years of the transition was to clean banks' balancesheets of inherited bad debt. However, in some cases the authorities also provided support to non-performing loans extended after the collapse of the socialist system. In Hungary, for example, thegovernment included in the bond/debt swap operation bad loans created during 1992, after theestablishment of a market-based banking system.
The government recapitalized banks by placing dollar and local currency denominated bonds in their balancesheet. However, the interest yields on local currency bonds were below market and below banks' cost of funds.Besides, these bonds had a minimum selling price and, so were largely illiquid. As result, the holders of largeamount of these bonds suffered from liquidity problems and required further government intervention.19 There was a temporary improvement in banks' portfolio as bad loans were taken off the books of the banks. Thevalue of bad loans fell from 187bn. forint to 85bn. forint (both figures for the last quarter of 1992), but rose againimmediately after the program to reach 186bn. forint in the fourth quarter of 1993 (see Bonin and Schaffer, 1995).Bonin and Schaffer attributed this rise in bad loans to the ex-post recognition of bad loans by banks to reduce theirtax burden, rather than the result of new bad lending by banks. Regardless of the reason, the bad loan problemworsened.
24

b. Macedonia
The Macedonia banking sector was highly concentrated. As a result, the government decided toprovide assistance to those banks that were considered "too large to fail". The largest bank (StopanskaBanka) which accounted for 65 percent of banking sector assets was recapitalized.
C. Baltic Countries
In the Baltics, the authorities differentiated their approach according to the source of problems andthe size of the troubled banks. Some banks were liquidated, while others were recapitalized. Estonialiquidated banks which got into trouble because of management problems, while those which sufferedexternal shocks were merged and recapitalized. Lithuania liquidated private banks and restructured andrecapitalized state banks. Latvia widely liquidated problem banks.
The fiscal cost of banking restructuring for the government was not very large in Estonia (around1.4 percent of GDP for the period 1991-98) because the government decided to bail out only two banksthat faced solvency problems after they lost access to part of their assets, held in Moscow20. The otherbanks were liquidated. The cost incurred by the government in connection with banking sector problemsincludes a transfer to the central bank, extended in 1996, that enabled the monetary institution to cover theloss suffered in 1994, partly as a result of banking sector crises (section 4.2).
In Latvia, treasury bills were issued in 1993 and 1994 in conjunction with the restructuring of twostate-owned banks. Nevertheless, when a full fledged crisis erupted in 1995 after the publication of thebanks' audited reports for 1994, the government did not intervene to recapitalize troubled banks andseveral banks, including the largest private banks, were liquidated. As a result, the fiscal costs of bankrestructuring for the Latvian government were also not very high (around 2.5 percent of GDP for theperiod 1991-98).
In Lithuania, the banking sector was highly concentrated, leading the government to intervene insupport of the banks that were considered "too big to fail", while smaller private ones were closed.Capital injection by the government was directed mainly to three state banks that together accounted fornearly 50 percent of deposits and 50 percent of banking sector assets. Altogether, the costs to theLithuanian government for bank restructuring was around 1.7 percent of GDP. The Lithuanian caseillustrates the point that financial restructuring without operational restructuring is a waste of resources, asone of the recapitalized banks (Innovation Bank) required substantial continuous aid from the state budgetand still had to be liquidated at the end.
d. Georgia, Kazakhstan the Kyrgyz Republic and Ukraine
In the CIS countries, government intervention was largely motivated by the decision to compensatebanks for the directed credits extended under government instruction and for the unrepaid loans carryinggovernment guarantees.
During the early years of the transition, the CIS governments intervened quite extensively in thecredit markets. Specifically, in Georgia, Kazakhstan, the Kyrgyz Republic and Ukraine large amounts ofcredit were extended directly, under government instruction or under government guarantees (IMF,1996). The quality of these loans was generally very poor. Because of this and other reasons (discussedin section 2.3), non-performing loans became a serious problem. In response, the governments of
20 The two banks (Northern Estonian Bank and Union Baltic Bank) were merged. The newly created bank wasrecapitalized and finally privatized in 1997.
25

Georgia, Kazakhstan, the Kyrgyz Republic provided financial assistance to compensate for non-performing loans that were granted under government pressure or guarantee. In Ukraine, however, thegovernment did not offer any financial compensation. In all the CIS countries, there was large-scaleliquidation of private banks, and in some instances even of state-owned banks.
In Kazakhstan, government support was mostly related to compensation for directed or publiclyguaranteed credits. During 1994-95 a large share of the banks' bad debt (largely constituted by loansextended under government instruction or carrying government guarantees) was transferred to threenewly created asset management institutions. However, this operation did not involve significantinjection of capital, nor operational nor institutional restructuring of the banks. In 1996-1998 the fourlargest banks incurred further financial difficulties. In response, the fiscal authorities decided to bailoutand merge recapitalize two of them. The cost of recapitalization was small (around 0.8 percent of GDP).The Kazakhstan case illustrates how bank restructuring without adequate capitalization and notaccompanied by operational and institutional restructuring cannot resolve banking sector problems andmay require successive government interventions.
In Georgia, government assistance was mainly limited to the repayment of directed credits, whichwas very small (around 0.1 percent of GDP). Resolution of problems in the state banks basically entaileddownsizing and mergers, while private banks were liquidated. In the Kyrgyz Republic, the treasury issuedinterest bearing bonds during 1995-97 and placed them in troubled banks, in exchange for non-performing loans. The costs to the Kyrgyz government for bank restructuring were around 4.4 percent ofGDP. There was liquidation of both private and state banks. The state banks that were not liquidatedwere substantially downsized and restructured through private rather than government recapitalization.There was also no major operational restructuring of these banks either.
Differently from the other three CIS countries, in Ukraine the fiscal authorities did not compensatethe banking sector for loans extended under government pressure. In addition, often they did not honorexplicit or implicit state guarantees on bank credits. At least until 1998, no formal government financedrecapitalization has occurred. Even the simple repayment of guaranteed bad debt would have constituteda significant financial rescue of the banking sector.
4.2 Cost of Bank Restructuring for the Central Bank
As a principle, the costs of banking crises should be borne by the government and not by thecentral bank (Daniel, 1997). Central banks should only be engaged in liquidity support. However, it isdifficult for the authorities to ascertain at the time of a crisis whether it is a solvency or a liquidity crisis.As a result, sometimes the central bank intervenes on the belief that it is facing a liquidity crisis, when thecrisis is actually generated by widespread insolvency.
In some cases the central bank assumes a leading role in the bank restructuring process, in additionto its core monetary policy functions. This causes several difficulties. Specifically, direct ownership inbanks and medium-term lending by the central bank generates conflicts of interest, in particular when thecentral bank has a supervisory role. Moreover, active central bank intervention in the banking sector canimpose substantial costs on the monetary institution that, ultimately, will be borne by the governmentbudget21 .
In most of the countries under consideration, the central bank granted only liquidity support, whilein some countries, it intervened extensively, providing both short and long term loans and refinancing
21 See Dziobek and Pazarbasioglu (1997) for an analysis of the different types of central bank instruments to supportthe banking sector and their costs and incentives.
26

troubled banks' assets. The costs of central bank interventions in these countries mainly consist ofprovisions and losses on credit extended to distressed banks (Table 10). Overall, for the twelve countries,the direct costs of banking problems arising from government assistance far outweighs the costs arisingfrom central bank assistance.
With regards to the actions taken by the central bank and to the cost suffered by the monetaryinstitution, some distinctions among the different groups of countries can be drawn.22 (a) In Bulgaria, theCzech Republic, Estonia and the Kyrgyz Republic, the monetary authorities intervened extensively in thebanking sector and the cost to the central bank was sizable, ranging from 1 percent of GDP to 12 percentof GDP. (b) In Hungary, Poland, Macedonia, Latvia, Lithuania and Georgia, central bank interventionwas limited and related costs were low (less than I percent of GDP).
a. Problems arising from extensive central bank involvement in bank restructuring
The experience of Bulgaria, the Czech Republic, Estonia and the Kyrgyz Republic shows howcentral bank involvement in banking sector restructuring can lead to a number of problems.
First, losses incurred by the central bank are ultimately borne by the government budget. In theCzech Republic the government, through several agencies", bore most of the cost of bank restructuring.The central bank bore the cost of the "Consolidation Program II", launched at the end of 1995, thatfocused on small and medium sized banks, newly created in the early years of the transition. However,the government had to issue a guarantee (for an amount equivalent to 1.2 percent of the 1998 GDP) to theCzech Republic National Bank to cover losses from this program. As the central bank intends to take
24advantage of the guarantee ', part of the cost of central bank assistance to the banking sector willeventually fall on the government budget. In addition, in the early 1990s, the central bank of the CzechRepublic extended a credit to the asset management company Konsolidacni Banka.25 As KonsolidacniBanka's obligations are guaranteed by the state, the government budget will ultimately bear the residualcost.
In Estonia the central bank intervened extensively to support the banking sector during the 1992and the 1994 crises despite the presence of a currency board. Partly as a result of this assistance, themonetary authority suffered losses in 1994. To cover the loss, in 1996 the government recapitalized thecentral bank to the amount of 0.3 percent of GDP (Table 9).26
In the Kyrgyz Republic the central bank extended sizable loans to the bank specialized in directedcredit to the agricultural sector (Agromprombank) in the early 1990s. When this insolvent bank waseventually liquidated, the outstanding loans of the National Bank (equivalent to nearly 4.3 percent of the1996 GDP) represented a loss. Consequently, in 1996 the government replaced this amount in the centralbank balance sheet by a long term, interest bearing, bond.
22 Information on Georgia, Kazakhstan and Ukraine on methods and cost of central bank intervention is extremelyscanty, and therefore not discussed here.23 The privatization agency (National Property Fund) and two asset management companies (Konsolidacni Bankaand Ceska Insaksni).24 See Czech Republic National Bank, Annual Report, 1998, p. 4.25 At the end of 1998 the outstanding credit amounted to nearly 2.4 percent of GDP. A small part of this loan (0.7percent ) has been provisioned.26 The central bank dealt with the 1992 crisis differently from the 1994 crises. In 1992 the monetary authority actedquickly to close the troubled banks and rescued only those credit institutions whose problems were generated byexogenous events (two banks, facing solvency problems after losing access to part of their assets in Moscow, weremerged and recapitalized with the support from the government and the central bank). By contrast, in 1994 thecentral bank tried to rescue a large insolvent bank and bail out creditors.
27

A further drawback of direct central bank involvement in bank restructuring is the loss oftransparencv. This is particularly evident in the case of the Czech Republic, where the financingmechanisms among the government budget, the asset management companies, the privatization agencyand the central bank are quite complex and opaque27. In these circumstances, it is very difficult toidentify the potential fiscal risks and the actual costs of banking sector problems.
Central bank support to the banking sector can also generate significant inflationary pressures. Forinstance, in Bulgaria, during the period 1995-97, and especially during the 1996 crisis, the central banklargely refinanced distressed banks' assets and extended massive loans to banks (and to the government).This produced hyperinflation in early 1997, which was associated with a decline in GDP. Only after theintroduction of the currency board did the Bulgarian National Bank stop such practices.
Table 10. Cost of Bank Restructuring to the Central Bank (1991-1998)Percent of GDP
1991 1992 1993 1994 1995 1996 1997 1998 TotalBulgariaProvisions for losses NA NA NA NA 2.8 6.6 2.3 0.004on credit extended tobanksRecoveries (-) NA NA NA NA NA NA 0.05 0.1Total U.S
Czech RepublicCost of Consolidation 0.0 0.0 0.0 0.0 0.0 0.0 2.1 2.9Program (provisionsand losses)Provision on credit to 0.0 0.0 0.0 0.0 0.0 0.0 0.0 0.02asset managementagencyTotal
Hun2arv 0.0 0.0 0.0 0.0 0.0 0.0 0.0 0.0 0.0
MacedoniaBonds issued for 0.0 0.0 0.0 0.0 0.0 0.6 0.0 0.0 0.7capitalization of assetmanagement companyInterest payments NA NA NA NA NA NA NA NATotal e
PolandTotal cost of central NA NA NA NA NA NA NA NAbank intervention
27 On this aspect, see Czech Republic: Towards EUAccession, 1999, the World Bank, Chapters 3 and 7.
28

Table 10 (Cont.) Cost of Bank Restructuring for the Central Bank (1991-1998)Percent of GDP
1991 1992 1993 1994 1995 1996 1997 1998 TotalEstoniaLoss on assets 0.0 0.0 0.0 0.4 0.0 0.0 0.0 0.0 0.2purchased fromtroubled banksProvisions on loans 0.0 0.0 0.0 0.3 0.3 0.0 0.0 0.0 0.4unrequited by theliquidated banksWriting off of CB 0.0 0.0 0.0 0.0 0.02 0.04 0.0 0.0 0.05shares in banks tocover their lossesTransfer of assets 0.0 0.0 0.0 0.0 0.0 0.0 0.2 0.0 0.2Recoveries (-) 0.0 0.0 0.0 0.0 0.0 0.002 0.005 0.02 0.03Total
LatviaProvisions for losses on 0.0 0.0 0.0 0.0 0.1 0.0. 0.0 0.0 0.1credit extended tobanks
LithuaniaLosses on credit 0.0 0.0 0.0 0.0 0.0 0.1 0.1 0.0 4.extended to banks
Georgia NA NA NA NA NA NA NA NA NA
Kazakhstan NA NA NA NA NA NA NA NA NA
Kvrgyz RepublicLosses on credit 0.0 0.0 0.0 0.0 0.0 4.3 0.0 0.0 8extended to banks
Ukraine NA NA NA NA NA NA NA NA NA1/ Total Cost is the net present value (NPV) at end-I 998 of the annual costs during 1991-98. The NPV is calculated usingthe relevant interest rate for each cost item.2/ Kawalec (1999), p.29
Central bank involvement can also give rise to conflict of interest and moral hazard. For example,in the Czech Republic the "Consolidation Program II" has been carried out through a subsidiary of thecentral bank (Ceska Financni). This agency not only buys non-performing assets at a negotiated price,but also engages in direct equity investments in troubled banks. As a result, the central bank is now in theposition of supervising banks in which it has a direct economic interest.
Last, continuous assistance to insolvent banks provides perverse incentives and fails to address theunderlying problems. The experience of Bulgaria clearly shows how repetitive liquidity injections andrefinancing credits do not solve undercapitalized and insolvent banks' problems. In 1994-1995 two stateowned banks (Mineral Bank and Economic Bank), accounting for nearly 20 percent of banking systemassets, displayed sustained liquidity problems. The central bank provided almost daily cash infusion tomeet depositors' demands and assure settlements in the interbank system. However, it did not address theunderlying reasons for the problems which were: loans extended without sufficient attention to
29

borrowers' credit-worthiness; inadequate loan-loss provisioning; and inadequate capitalization. At theend of 1994 these two banks accounted for nearly 90 percent of central bank refinancing. Nevertheless,only in 1995 was action taken to improve their level of capitalization and only in 1996 were they placedunder conservatorship.
b. Experience with more minor central bank intervention
In Hungary and Georgia, the central bank did not have any significant role in bank restructuring.In Latvia the central bank bore minor losses on credits extended to banks whose licenses were revoked.In Lithuania the central bank response to the 1995 crisis was limited by the currency board arrangement.The monetary authority used its excess foreign exchange reserves to provide liquidity loans to thedistressed banks (part of which were not recovered). However, the central bank refrained from extendingfinancial assistance to recapitalize failing banks. In Macedonia the central bank bore the cost of thecapitalization of the bank rehabilitation agency.
In Poland, while the government bore the cost of recapitalizing state-owned enterprises, the centralbank bore the cost of the rehabilitation or liquidation of several small private banks. In some cases thedistressed institutions were taken over by the central bank and sold after restructuring. In others, thetroubled banks were taken over by other banks with central bank support (for example, long-tern softfinancing from the monetary authority). Nevertheless, the total cost of central bank intervention was notvery high.8
4.3 Cost of Depositor Compensation for the Government
The third component of the fiscal costs of banking crises is the direct cost incurred by thegovernment to compensate depositors. While adding this component provides a full picture of the fiscalcosts involved, it should be borne in mind that this component alone does not represent the full protectionto depositors in these countries. In fact, virtually all the fiscal costs assumed by the authorities for bankrestructuring are for protecting depositors.
Governments compensate depositors to avert a loss in confidence in the banking system (if thescale of the problem is large), or for social protection reasons. Many countries have deposit insuranceschemes which lay out the framework for compensating depositors in the case of a crisis.
Deposit Insurance Schemes. The experience of the sample countries was that the CEEs and theBaltics introduced deposit insurance schemes (DIS) after the emergence of banking problems or bankingcrises, while among the CIS countries Ukraine was the only one that introduced a DIS after the bankingcrisis. No DIS has yet been introduced in Georgia, Kazakhstan or the Kyrgyz Republic (Table 11).
The introduction of an explicit deposit insurance scheme after a banking crisis is a commonoccurrence around the world29, with the objective of restoring depositor confidence. In transitioneconomies, however, the objective was primarily to limit governments' liabilities, which were extensiveunder the previous centrally-planned regimes when all deposits were implicitly guaranteed by the state.
Macedonia introduced a DIS to limit the commitments of the authorities following the freezing ofhousehold foreign currency deposits (amounted to over 20 percent of GDP) when the counterpart assetswere lost following the breakup of former Yugoslavia. Bulgaria, on the other hand, introduced an ad-hoc
28 According to some estimates (Kawalek, 1999), the total cost could have been about 0.5 percent of GDP.29 Cull (1998) found that the probability of adopting explicit deposit insurance increases by 25 to 30 percent forcountries that experienced systemic banking crises within the preceding five years.
30

DIS in 1996 in the middle of a banking crisis in an effort to stem a collapse in public confidence in thebanking system (a formal DIS was introduced later in 1999). However, the ad-hoc DIS did not restorepublic confidence, and the financial situation in the country did not stabilize until early 1997 when thecurrency board was introduced. This illustrates the point made by some authors that deposit insuranceschemes should only be introduced after the banking system has been recapitalized and restructured, butnot while it is still weak30.
Depositor Compensation. For most of the countries under consideration, depositors werecompensated - although not fully in all cases - when banks were liquidated. This meant that mostdepositors bore some of the costs of banking crises. This addresses the moral hazard problem, whicharises if depositors are automatically bailed out by the government, because neither the bank nor thedepositors would have the incentive to exercise caution in lending (in the case of the former) or indeciding in where to place their deposits (in the case of the latter) in the future. However, in many of thecountries under consideration, the underlying rationale for sharing losses with depositors probably hadless to do with moral hazard and more to do with fiscal constraints, especially in the CIS countries. Table12 provides a summary of the deposit compensation experiences in these countries, and Table 13 thefiscal costs of compensating depositors.
In the CEEs, compensation for depositors follows the framework of the DIS in these countries,which in all cases provide for only partial coverage. The DIS coverage as a ratio of GDP per capita isusually not too high (ranging from a little less than 1 in the case of Hungary to 2.7 in the case ofMacedonia), which is positive from the viewpoint of minimizing moral hazard, and compensation isusually partial3".
For the Baltics, depositor compensation in many instances occurred prior to the introduction ofDIS. Even without the presence of a DIS to limit the extent of compensation, depositor compensation inthose instances was still only partial. In Latvia, for instance, the government had promised partialcompensation to be spread over a few years, but it appears that after the first year, the governmentstopped fulfilling its promise. Lithuania adopted a mix of different approaches to depositorcompensation, including conversion of deposits to equity and the issuance of non-interest payinggovernment bonds, all of which imply less than full compensation for the depositors.
The CIS countries engaged in minimal depositor compensation. The governments in Georgia andKazakhsatan were not involved in depositor compensation at all. In fact, depositors in these twocountries were compensated partially from the assets of the private banks which were liquidated. TheKyrgyz Republic was an exception among the group of CIS countries under consideration in that thegovernment budget was used to compensate depositors, although compensation was only partial, withpriority given to compensation for small depositors.
30 Garcia (1999). Cull (1998) also found that adopting explicit insurance to counteract instability in the financialsector does not appear to solve the problem, as the typical reaction to this type of decision has been negative, at leastwith regard to financial depth in the three years' after the program's inception.31 The IMF recommends a ratio of between I and 2 for DIS coverage/GDP per capita, see Garcia (1999). Garciaalso has an extensive discussion on the issue of the level of DIS coverage in relation to moral hazard.
31
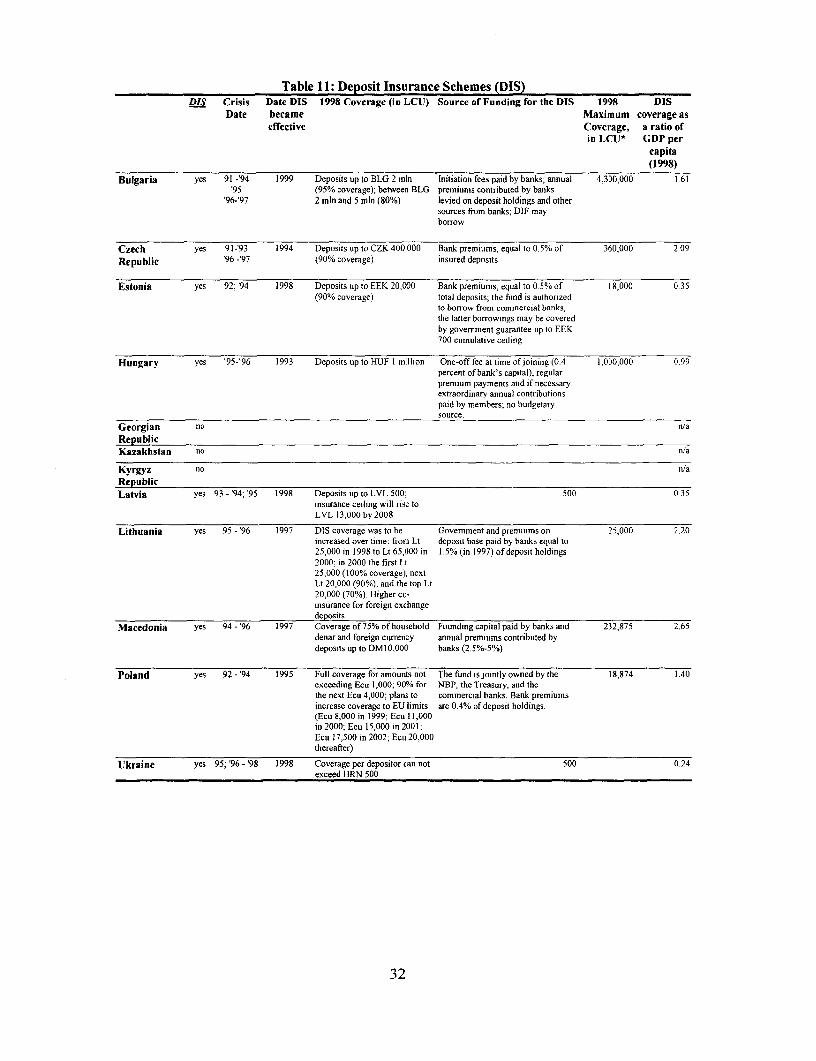
Table 11: Deposit Insurance Schemes (DIS)DIS Crisis Date DIS 1998 Coverage (in LCU) Source of Funding for the DIS 1998 DIS
Date became Maximum coverage aseffective Coverage, a ratio of
in LCU* GDP percapita(1998)
Bulgaria yes 91 -'94 1999 Deposits up to BLG 2 min Initiation fees paid by banks; annual 4,300,000 1.61'95 (95% coverage); between BLG premiums contributed by banks
'96-'97 2 min and 5 min (80%) levied on deposit holdings and othersources from banks; DIF mayborrow
Czech yes 91-'93 1994 Deposits up to CZK 400000 Bank premiums, equal to 0.5% of 360,000 209Republic '96 -'97 (90% coverage) insured deposits
Estonia yes 92; '94 1998 Deposits up to EEK 20,000 Bank premiums, equal to 0.5% of 18,000 03 5(90% coverage) total deposits; the fund is authorized
to borrow from commercial banks,the latter borrowings may be coveredby government guarantee up to EEK700 ctimulative ceiling
Hungary yes '95-'96 1993 Deposits up to HUF I mIllion One-off fee at time of joining (0.4 1,ODO,000 0.99percent of bank's capital), regularpremium payments and if necessaryextraordinary annual contributionspaid by members; no budgetarysource.
Georgian no n/aRepublicKazakhstan no n/a
Kyrgyz no n/a
RepublicLatvia yes 93 - '94; '95 1998 Deposits up to LVL 500: 500 0.35
insurance ceiling will rist toLVL 13,000 by 2008
Lithuania yes 95 -'96 1997 DIS coverage was to be Govemment and premiums on 25,000 2.20increased over time: from Lt deposit base paid by banks equal to25,000 in 1998 to Lt 65,000 in 1.5% (in 1997) of deposit holdings2000; in 2000 the first Lt25,000 (100% coverage), nextLt 20,000 (90%), and the top Lt20,000 (70%). Higher cc-insurance for foreign exchangedeposits.
Macedonia yes 94 -'96 1997 Coverage of75% ofhousehold Founding capital paid by banks and 232,875 2.65denar and foreign currency annual premiums contributed bydeposits up to DMI 0,000 banks (2.50-5%)
Poland yes 92-'94 1995 Full coverage for amounts not The fund is jointly owned by the 18,874 1.40exceeding Ecu 1,000, 90% for NEP, the Treasury, and thethe next Ecu 4,000; plans to commercial banks. Bank premiumsincrease coverage to EU limits are 0.4% of deposit holdings.(Ecu 8,000 in 1999; Ecu 11,000in 2000; Ecu 15,000 in 2001;Ecu 17,500 in 2002; Ecu 20,000thereafter)
Ukraine yes 95; '96 -'98 1998 Coverage per depositor can not 500 0.24exceed HRN 500
32

Table 12: Depositor CompensationBulgaria 1996: ad hoc deposit insurance scheme was established during the crisis; household
deposits and half of enterprise deposits were fully guaranteed; government securities wereissued to cover cost of deposit protection.
Czech The CNB was obliged to compensate clients in Ceska Banka (closed in December 1995Republic and now being liquidated) to the amount of CZK 4 million.Hungary 1995: Agrobank suffered a bank run; deposits were fully covered by the deposit insurance
fund (not financed by the budget).1997: Realbank was put under liquidation; depositors were paid fully by dcposit insurancefund (not financed by the budget).__
Macedonia 1995: The government assumed the obligation for the repayment of households foreigncurrency deposits that were lost after the dissolution of the former Socialist Republic ofYugoslavia.March 1997: large savings house TAT collapsed; over 20,000 clients lost their deposits;every affected household was to receive monthly compensation of 13500 denars for sixmonths (ratio of coverage to GDP per capita around 1) after the enactment of the law ondeposit insurance.
Poland 1995 to 1997: losses to depositors were paid out of Deposit Insurance Fund which is jointlyowned by the NBP, the Treasury and the commercial banks.
Estonia 1992: Tartu Commercial Bank was liquidated; depositors were partially paid.1994: Social Bank was liquidated; deposits were transferred to the North Estonian Bank(explicit Central Bank guarantee on deposits).
Latvia 1995: Baltiia Bank collapsed; the government promised to compensate depositors for LVL500 ($1000) per depositor (LVL 200 in 1995 and LVL 100 over next 3 years) butapparently extended compensation only in 1995. Ratio of coverage to GDP per capita wasonly 0.6 (very low).
Lithuania May 1996: depositors of Litimpex Bank had their deposits converted to equity.Sept 1996: depositors of Vakaru and Aura Bank were compensated in cash through theemergency deposit law on retroactive compensation.1997 and 1998: depositors of Innovation Bank which had its license revoked (summer1997) received minimal cash compensation (Lt.4000 in 1997 and Lt.4000 in 1998 perperson) and non-interest-bearing government bonds ( 5 year maturity) payable in 3 annualinstallments beginning in 1999; legal entities received non-tradable, non-interest bearingnotes for entire claims (10 year maturity), payable in 5 annual installments beginning noearlier than 2002; certain public organizations, embassies, charities, etc received cashduring 1998; other creditors received their pari-passu share of residual funds left fromcollection of Innovation Bank's assets; government deposits were written off.1997: depositors of Tauro Bank were compensated out of DIS fund.1998: State Commercial Bank was liquidated; deposits were transferred to Savings Bank.
Georgia 1994: self-liquidation of small private banks; depositors compensated by these banksthemselves because these banks had very few customer accounts.
Kazakhstan Depositors were reimbursed from sale of assets of a liquidated private bank (KramdsBank). Depositors suffered some losses but losses were not large since most deposits wereheld in the People's Bank (savings bank).
Kyrgyz 1995: small commercial banks were liquidated. NBK compensated small depositors inRepublic Adil Bank (up to 1000 Soms).
1996: Elbank was liquidated in February 1996. Payment of small depositors (up to 3000soms) was undertaken immediately (they made up 78 percent of deposit base). Payment ofdeposits from 3000 to 5000 soms started in April 1996; 5000 to 10000 soms in May 1996.The government promised to return deposits above 10000 soms after small claims werepaid out. Deposits of lower priority for compensation were changed into bonds.1997: Agroprombank was liquidated. Depositors were compensated in cash from statebudget.
Ukraine No information on deposit compensation.
33

Table 13. Deposit Compensation Cost for the Government
1991 1992 1993 1994 1995 1996 1997 1998 Total
BuleariaBonds issued 0.0 0.0 0.0 0.0 0.0 3.3 1.3 0.04 3.3Interest payments 0.0 0.0 0.0 0.0 0.0 1.4 0.2 0.1Total
MacedoniaCash 0.0 0.0 0.0 0.0 0.0 0.0 0.2 0.0 0.2Increase in government 0.0 0.0 0.0 0.0 22.5 0.0 0.0 0.0 24.3debt 2'
Total
PolandFrom 1995 to 1998 the Deposit Protection Fund paid $ 51.4 Mln to depositors, whichcorresponds to less than 0.01 percent of GDP per year. The Fund is partly financed by thebudget.
LatviaCash 0.0 0.0 0.0 0.0 0.04 0.0 0.0 0.0 O
LithuaniaCash compensation and 0.0 0.0 0.0 0.0 0.0 0.3 0.0 0.0 0.3write-off of governmentdepositsBonds issued 0.0 0.0 0.0 0.0 0.0 0.0 0.8 0.0 0.9Interest payments 0.0 0.0 0.0 0.0 0.0 0.0 0.0 0.0Deposit compensation 0.0 0.0 0.0 0.0 0.0 0.0 0.1 0.0 0.1from Deposit InsuranceFund paid by thegovernmentTotal *
Kvr2yz ReDublicCash 0.0 0.0 0.0 0.0 0.0 0.0 0.3 0.0
1/TotalCostisthenetpresentvalue(NPV)atend-1998oftheannualcostsduring991-98. The NPV is calculatedusing the relevant interest rate for each cost item.2/ The government assumed the obligation for the repayment of households foreign currency deposits that were lostafter the dissolution of the former Socialist Republic of Yugoslavia.
4.4 Total fiscal and quasi-fiscal costs of banking crises
Table 14 gives the total fiscal and quasi-fiscal costs of banking crises in the twelve transitioncountries. These include the costs to the government and the central bank for restructuring banks, and thecosts to the government for compensating depositors.32 The bulk of these costs comes from bankrestructuring costs incurred by the government, which are typically several times the size of directpayments to depositors or the costs incurred by the central bank.
The CEEs incurred by far the largest costs, which ranged from around 7 percent of GDP for Polandto 42 percent of GDP for Bulgaria cumulatively over the period 1991-98. The costs incurred by the CIS
32 See Appendix Table 6 on consolidated fiscal costs.
34

and the Baltics were more moderate; in the CIS they ranged from a mere 0. 1 percent of GDP for Georgiato 18 percent for Kazakhstan, and in the Baltics they ranged from around 2 percent of GDP in Estonia to3 percent in Lithuania.
Table 14: Total Costs of Banking Crises, 1991-98(percent of GDP)
CEEsBulgaria 41.6Czech Republic 25.4Hungary 12.9Macedonia 30.3Poland 7.4
BalticsEstonia 1.9Latvia 2.7Lithuania 3.1
CISGeorgia 0.1Kazakhstan 18.4Kyrgyz Republic 10.6
The much higher fiscal and quasi-fiscal costs incurred by the CEEs than the Baltics and theCIS can be explained by three factors. First, the different restructuring strategies followed by the threecountry groups entailed different fiscal costs. The CEE authorities pursued intensive restructuring andrecapitalization of banks involving injection of new capital, and incurred large costs as a result. On theother hand, the Baltic and CIS governments rarely restructured or injected new capital into banks, andincurred lower fiscal costs as a result. Second, there was more loss-sharing with depositors and bankshareholders in the Baltics and the CIS than in the CEEs through two channels. The much higherinflation in the FSU countries than the CEE countries implies larger cost-sharing by depositors in the FSUcountries. Also, when the FSU countries liquidated banks, the bank shareholders and depositors boremuch of the costs. Third, the restructuring operations undertaken by the CEEs suffered from severalweaknesses (as discussed in section 4.1), which raised fiscal and quasi-fiscal costs.
The higher fiscal costs incurred by the CEEs are reflected in the higher levels of fiscal expendituresincurred due to banking crises compared with the general government deficits in those countries (Table15). These fiscal expenditures did not always appear in the central government budget, and did notnecessarily contribute to the government deficit; nonetheless, they represent a cost to the public sector33.
The fiscal costs raised the government's debt burdens, more so in the CEEs than the CIS. For thecountries under consideration for which data is available, government debt was raised from a low of 5percent (in the case of the Kyrgyz Republic) to a high of 11 percent in the case of Bulgaria (Chart 1).34
33 In the Czech Republic, for example, the deficit recorded in the budget does not include the quasi-fiscal activitiesundertaken by asset management companies involved in the restructuring of the banking sector. If these off-budgetoperations were taken into account, the fiscal deficit would be much higher (see Czech Republic: Toward EUAccession, 1999, the World Bank).34 See Appendix Table 7 for data on government debt incurred due to banking crises.
35

Chart 1: Contribution of Recapitalization and DepositorCompensation Bonds to Total Domestic Central
Government Debt (1998)
60 !I I
soIa.
w4 0
U 1998 Outstanding Recapitalization and Depositor Compensation Bonds
1998 Central Government Debt less Recapitalization & Depositor* Compensation Bonds
36

Table 15. Fiscal Expenditures Due to Banking Crisis"' and Fiscal Deficit1991 1992 1993 1994 1995 1996 1997 1998 Total
BulgariaFiscalExpenditures,%ofGDP 0.0 1.3 1.3 2.9 2.9 12.1 1.0 0.5 22.0General Govt. Deficit (Surplus), % 4.5 4.9 12.1 4.6 5.2 15.4 (2.1) (0.9)of GDP
HungaryFiscal Expenditures, % of GDP 0.0 0.1 0.0 1.2 1.9 1.5 1.2 0.5 6.4General Govt. Deficit (Surplus), % 3.8 7.8 9.2 8.6 6.2 3.1 4.8 4.8of GDP
MacedoniaFiscal Expenditures, % of GDP 0.0 0.0 0.0 0.0 0.4 0.4 0.4 0.0 1.2General Govt. Deficit (Surplus), % 8.7 12.1 2.9 0.7 0.3 0.4 1.6of GDP
Poland2'
Fiscal Expenditures, % of GDP 0.3 0.4 0.5 0.7 0.6 0.4 0.3 0.2 3.4General Govt. Deficit (Surplus), % 3.6 6.1 3.1 3.3 3.3 3.4 2.7 2.4of GDP
EstoniaFiscal Expenditures, % of GDP 0.0 0.0 0.2 0.1 0.1 0.5 0.1 0.1 0.8General Govt. Deficit (Surplus), % (5.0) 0.2 0.7 (1.4) 1.3 1.9 (2.2) 0.3of GDP
LatviaFiscal Expenditures, % of GDP 0.0 0.0 0.3 0.4 0.1 0.0 0.0 0.0 0.9General Govt. Deficit (Surplus), % 0.8 (0.6) 4.0 3.5 1.8 (0.3) 0.8of GDP
Lithuania3'Fiscal Expenditures, % of GDP 0.0 0.0 0.0 0.0 0.0 0.4 0.2 0.1 0.7General Govt. Deficit (Surplus), % (2.6) (0.5) 3.3 5.5 4.5 4,5 1.8 5.8of GDP
Kyrgyz RepublicFiscal Expenditures, % of GDP 0.0 0.0 0.0 0.0 0.0 0.2 0.6 0.3 1.1General Govt. Deficit (Surplus), % (4.6) 17.4 14.4 11.6 17.3 9.5 9.0 8.1of GDP
Notes:The Czech Republic, Georgia and Kazakhstan have been omitted from this table because of the difficulty in ascertainingprecisely which of the government costs listed in Table 9 were actually fiscal expenditures.1/ Fiscal Expenditures include expenditures of the government resulting from bank recapitalization and depositcompensation, such as interest payment on bonds and other expenditures (see Tables 9 and 13 for details).2/ Excludes compensation paid to depositors from Deposit Insurance Fund (this is only partly financed by the budget;from 1995 to 1998 DPF paid $51.4 Mln to depositors. This corresponds to less than 0.01 percent of GDP per year, seeTable 13).3/ Includes government deposits which were written off.
5. Bad Debt Recovery
The above estimates for the costs of banking crises do not allow for possible cost recoveries on baddebt, which would mitigate some of these costs for the authorities. The choice of the bad debt recoverystrategy by a country could have implications on its success in recovering bad loans and therefore on thefiscal costs it incurs from banking crises.
37

There are three basic approaches to bad debt recovery: centralized, decentralized, and "goodbank/bad bank". Under the centralized approach, non-performing loans are removed from banks and aretransferred to an asset management company (AMC) or a bank liquidation agency, which then pursuesrecovery of the bad loans. The AMC could be state-owned or private, although in most countries it is thestate-owned. Under the decentralized approach, non-performing loans remain on the bank's books, andwork-out units are usually created within the banks to pursue the recovery of these non-performing loans.By design, banks act as the "agents of change" and pursue enterprise restructuring or liquidation35. The"good bank/bad bank" is a variation of the decentralized approach, whereby a "bad bank" which is spunoff from the original troubled bank takes over its non-performing assets and pursues their recovery. Theremaining "good bank" may be privatized or merged with a healthier bank.
5.1 Implications of the Choice of Debt Recovery Strategy on Fiscal Costs
The centralized and decentralized approaches to bad debt recovery each has direct and indirectcosts and benefits. These have implications on the fiscal costs of resolving banking crises.
Under the centralized approach, the direct fiscal costs of a state-owned AMC are its operationalcosts. There could be indirect costs as well if there is absence of political will to enforce hard budgetconstraints on enterprises, which could lead to recurrence of non-performing loan problems and furtherfiscal costs. This is especially the case with state-owned AMCs, as their mere existence creates moralhazard for continuing bad performance of banks, since banks know that they could always transfer futurebad loans to the AMCs. Direct fiscal benefits come from the recovered loans that are channeled to thestate directly or indirectly.
Under the decentralized approach, the indirect fiscal costs are the forgone revenues which thegovernment would have received from a state-owned AMC. The extent to which such recoveries do notaccrue to the government depends on the profit-sharing arrangement between the banks and thegovernment. The arrangement could entail either the entire amount or a share of the recoveries to bechanneled back to the budget. The trade-off here is that revenues retained by the banks provide incentivesfor the banks to collect.
An indirect benefit under either approaches is that the loan work-out activities could help in theoperational restructuring of banks (Dziobek and Pazarbasioglu, 1997). This could minimize the risk of arecurrence of banking sector distress, and hence the long-term fiscal costs of banking crises. Anotherindirect benefit under either approaches is the restructuring or liquidation of enterprises which is animportant element of bad debt collection. This helps improve the corporate governance of enterprises,which could also reduce the possibility of future enterprise and hence banking problems.
5.2 Country Experiences
International experience shows that a centralized approach is chosen over a decentralized one whenthe following issues are important: (i) quick removal of bad loans from the balance sheet of distressedbanks to facilitate bank privatization; (ii) there is a close "symbiotic" relationship between banks andenterprises that needs to be cut and persistent bank lending to loss-making firns that needs to be stopped;and (iii) enabling a centralized agency to pursue enterprise restructuring after gaining control over
36enterprises
35 Van Wijnbergen (1998) points out that banks should be the 'agents of change' in the restructuring of enterprisesdue to the informational advantage they have over publicly owned centralized collection agencies.36 Fries and Lane (1994).
38

Of the twelve countries under consideration, eight adopted the centralized approach, nine thedecentralized approach, and six both approaches (either sequentially or simultaneously for different badloan categories). The "good bank/bad bank" approach was followed by two countries. Table 16 belowpresents the strategies adopted for bad asset recovery by the countries in this study.
Table 16. Approaches to Bad Asset RecoveryCentralized Decentralized
Bulgaria As a condition of recapitalization throughgovemment bonds, banks were required to creatework-out units to pursue bad debt collections.
Czech Republic Konsolidaeny Banka (1991-present): created to Currently considering adopting the so-calledrestructure inherited debts on books of London approach to loan recovery which entailscommercial banks; later also received non- out-of-court settlements between the banks andperforming loans from commercial banks; debtor enterprises. This approach consists of a setCeska Inkasni (1993-present): created to take of rules for reaching out-of court settlementsover debt obligations of foreign trade companies between the banks and debtor enterprises3 7 . Theto facilitate privatization of Ceskoslovensko London rules may enable the reaching ofObhodni Banka, foreign trade bank from pre- conciliation agreements with government mediationtransition period; without recourse to enterprise liquidationCeska Finaneni (1996-present): established as proceedings on a broad-scale. By following thesubsidiary of central bank to finance the 1996 London rules, KoB management also hopes to avoidStabilization Program which has the objective excessive enterprise bankruptcies for political andof preventing liquidity crises in small banks. social considerations.
Hungary The Credit Consolidation Fund was created at (I) Decentralized work-out units were created atthe Hungarian Industrial Development Bank banks as part of the 1992 Loan Consolidation(MBFB Rt) in 1992 to manage bad assets. Only Program;1/3 of the total assets that were carved out from (2) The 'good bank/bad bank' approach was usedbanks was transferred to the Fund at MBFB Rt, in the case of Magyar Hitel Banka (MHB); badwith the rest remaining on commercial banks' assets of MHB were transferred to its newlybooks subject to contracts with the Ministry of established subsidiary, Risk Kft (July 1995), whichFinance. was to be wound up in three years while the good
bank was successfull rivatizedMacedonia Bank Rehabilitation Agency (BRA)
(1994-present) exchanged bonds for the equityof enterprises held by commercial banks. BRAaccumulated dispersed enterprise shareholdingsformerly held by banks to obtain control overenterprises and pursue their restructuring.
Poland Enterprise and Bank Restructuring Program: asa condition for participating in EBRPrecapitalization, banks were obliged to create work-out units and actively pursue collection throughseveral instruments.
Estonia Work-out units were created at commercial banks.In addition, the 'good bank/bad approach' waspursued when good assets from the Social bankwere transferred to the Northem Estonia Bank andthe remainder of Social Bank was tumed into a loanrecovery agency in March 1995 to pursuecollections of bad loan until it declared bankruptcy
_ in August 1996.Latvia No information was available to the authors about bad asset recovery activities.Lithuania Turto Bankas (1996-present) was created as an
asset management company out of the shell of aliquidated bank (Aurabankas).
Georgia Non-performing loans of liquidated banks were A pilot work-out unit was established (with Worldtransferred to the bank recovery unit of the Bank assistance) in a former state-ownedcentral bank. commercial bank. Work-out units were not
established on a large-scale because of the small._____________________ .________________________________________ scale of non-performing loans.
37 The London approach was first introduced by the Bank of England in 1989; a modified version of this approachwas subsequently used in Thailand and Korea. For details see Mark Stone (1998).
39

Table 16 (cont.). Approaches to Bad Asset RecoveCentralized Decentralized
Kazakhstan Rehabilitation Agency (1994-present) took In 1998 the government gave a mandate to a specialover loans of largest insolvent debtors (mostly enterprise restructuring agency to provide creditor-mining and metallurgical enterprises); led restructuring if the farrn or enterprise is viableAgricultural Support Fund (1994-present) and has developed a restructuring plan.took over agricultural credits;Exim Bank (I 994-present) took over most ofthe outstanding trade-related loans that carriedgovemment guarantees.
Kyrgyz Republic DEBR4 (Debt Restructuring Agency) (1996- The government encouraged commercial banks topresent) was established with the mandate to create work-out units for pursuing collection ofperform receivership function for liquidated loans to small and medium enterprises. Nobanks. information was available to the authors on theKyrgyz Agricultural Finance Corporation performance of these work-out units.(1997-present) was launched to take over baddebts of the agricultural sector.
Ukraine Bank Recovery Unit (BRU) was created at the Work-out units were created at three large formerBank Supervision Department of the central state owned banks to pursue loan recovery.bank in late 1996 to identify private banks forrestructuring or liquidation. No information wasavailable to the authors about the scope andoutcome of bank/assets restructuring activitiesof the BRU.
Appropriate incentives are important for the collection of bad debts regardless of the approachadopted for bad debt recovery. Similarly, effective collateral, foreclosure and bankruptcy laws arenecessary for enabling either debt collection agencies or banks to take control of insolvent enterprises andproceed with their restructuring or liquidation. Finally, the presence of political will to impose hardbudget constraints on enterprises is also necessary to ensure that insolvent enterprises are either liquidatedor have no access to new financing. The following discusses the bad debt recovery experiences of thecountries under consideration in light of these factors.
a. Centralized Approach
The countries under consideration set up three types of centralized agencies for bad debtrecovery: asset management companies, bank liquidation agencies and special divisions within a centralbank to manage bank liquidation and/or asset recovery. AMCs were created in the Czech Republic (whereit was referred to as an "asset hospital"), and in Lithuania, Kazakhstan and Macedonia. In Hungary, aseparate division of the development bank performed the asset recovery function. The Kyrgyz Republic,Georgia and Uj'kraine all set up bank recovery units in their central banks.
Asset Management Companies in all the countries covered in the study, and in the transitioneconomies in general, are typically state-owned38. This has some negative implications in light of theabove-mentioned factors that are important for successful bad debt recovery.
(i) It is generally more difficult to structure incentives for active loan recovery by a state-ownedcentralized agency. By contrast, under the decentralized approach, banks are provided the incentives torecover bad loans as they retain at least some (and sometimes all) of the recovered debt.
The experience of the Czech Republic illustrates the importance of having appropriate incentivesfor loan recovery. The Czech govemment has introduced perverse incentives for bad debt recovery in two
38 In international practice AMCs are also typically state owned, although there are some examples of privatelyowned AMCs. One such example is the Japanese Cooperative Credit Purchasing Company, which was "establishedby Japanese banks to buy non-performing loans from individual banks at market price." Source: Andrew Sheng
(1996).
40

ways. In the first place, it has either explicitly or implicitly guaranteed repurchase of bad loans at fullaccounting value from the three loan recovery agencies through a web of complex funding arrangements.In addition, while the ownership of non-performing loans was transferred to two of the debt recoveryagencies, Ceska Finaneni and Ceska Inkasni, the assets themselves remained on the balance sheets of thecommercial banks which were required to pursue work-out activities. Without ownership of the non-perfortning loans, the commercial banks did not really have any incentive to pursue their recoveries.
(ii) There is a potential disincentive for a state-owned AMC to be successful in collecting baddebt as that would bring the AMC closer to its date of dissolution. The risk of creating a self-perpetuatingAMC could in principle be addressed by limiting the length of time during which an AMC will operate.However, the authors found no examples of AMCs among the countries considered which have apredetermined limited operations time. The international experience in this regard has not been muchbetter either, as most AMCs around the world have been self-perpetuating. Another problem with a self-perpetuating AMC is that its mere existence creates moral hazard for continuing banking problems asbanks now have a dumping ground for future bad loans.
(iii) Some AMCs also take on other functions, which could lead to undesirable consequencesespecially if the AMCs are state-owned. The Czech case provides a very good example. KonsolidacnyBanka (KoB), one of the three state-owned bad debt recovery agencies in the Czech Republic, is also adevelopment bank which has commercial banking and deposit-taking functions. The high share of badassets in KoB creates tremendous moral hazard for it to undertake risky activities, which could lead tofurther fiscal costs.
(iv) A state-owned debt recovery agency is likely to succumb to political pressure and delayenterprise restructuring or liquidation. In other words, it is less likely that hard budget constraints wouldbe imposed on enterprises if the AMC is state-owned. In both the Czech Republic and Macedonia, forexample, soft budget constraints have inhibited enterprise restructuring, resulting in low rates of bad loanrecoveries. In Macedonia, the Bank Rehabilitation Agency (BRA), created to intervene in failing banksand to sell or liquidate them, was also envisioned to promote enterprise restructuring. However,enterprises whose ownership were transferred to the BRA continued to make losses, with some evensetting up subsidiaries to borrow under different names (Paulson, 1999).
(v) Public officials at an AMC are unlikely to be familiar with the clients of the banks, whichinhibits successful bad debt recovery.
The AMCs in the countries considered had modest results in recovering bad debt. The recoveryrates (defined as loans recovered as a share of the total value of bad loans) were 3 to 5 percent in theCzech Republic, around 5 percent in Lithuania and 16 percent in Hungary3 9. By contrast, in other parts ofthe world recovery rates were over 30 percente.
A bank liquidation agency or a special division within a central bank has the mandate to takereceivership of distressed banks and to liquidate them. The quality of assets that are transferred to suchan agency is likely to be higher than the quality of bad debts that are carved out and placed in an "assethospital", as assets placed in the former include performing loans as well as non-performing ones. Of thetwelve countries under consideration, the only country which has a bank liquidation agency for whichdata on asset recovery is available is the Kyrgyz Republic, where the recovery rate was around 10 percent
39 See Appendix 8 on Asset Management Companies and Bad Debt Recoveries.40 Klingebiel (2000) found that in the U.S. and Ghana, recovery rates were around 32 percent.
41

In some instances more than one agency was created to proceed with different types of loans.Agricultural credits in particular presents a special challenge in transition economies because of thedifficulty of reforming the rural sector. Among the countries covered in this study, those with a relativelylarge agricultural sector have adopted a separate strategy to deal with the recovery of agricultural credits.This was the case in Kazakhstan, the Kyrgyz Republic and Lithuania, where special agencies were createdfor collecting agricultural credits. In Poland loans to the agricultural sector also did not easily lendthemselves to the bank-led decentralized work out procedures which were used for all the other loans41.Sometimes a separate agency was also created to deal with the loans that were extended by foreign tradebanks because of the special nature of trade-related claims. This approach was followed in the CzechRepublic and in the Kyrgyz Republic.
The experience of the Czech Republic illustrates the potential problems with multiple loanrecovery agencies. The three Czech bad debt recovery agencies have overlapping functions and non-transparent financing mechanisms, which multiplied operating costs. The government is now proposingto consolidate the three agencies into one.
b. Decentralized Approach
The decentralized approach allows for the simultaneous treatment of banking sector distress andits underlying problems in the real sector. This could be particularly useful in transition economies wherebanking problems are usually caused by problems in the enterprises.
Among the countries under consideration, Poland and Bulgaria pursued the decentralized approachsolely. Hungary adopted this approach after the centralized approach did not produce good results. TheCzech Republic is considering modifying its centralized approach which has not produced satisfactoryresults to one that is more decentralized, entailing out-of-court settlements between banks and enterprises.In Georgia, the Kyrgyz Republic, Kazakhstan and Ukraine, the decentralized approach is adopted inconjunction with a centralized one, with work-out units being created at banks for pursuing the recoveryof loans. Estonia pursued the decentralized approach through work-out units created at commercial banksin addition to the "good bank/bad bank approach".
Under the decentralized approach, bad asset recovery would only be successful if bankmanagement is willing and able to pursue debtor enterprises. However, in transition economies ingeneral, creditors are generally unwilling to pursue their debtors for a variety of reasons (the so-called"creditor passivity" in the literature), which undermines the bankruptcy constraint and slows down theprocess of resource reallocation and restructuring. Three reasons have been identified for creditorpassivity: (i) the persistence of soft budget constraints for banks and enterprises; (ii) the pervasiveness ofconnected lending; and (iii) the oligopolistic structure of the banking system (Hoshi and others, 1999).
The persistence of soft budget constraints, especially for state banks, may undermine theirincentives to pursue debtors, and strong interdependence between creditors and debtors may create adisincentive for bank management to pursue their debtors. This was the case in Bulgaria, where thedecentralized bank-led bad asset work out process did not succeed largely because of the pervasiveness ofconnected lending.
The oligo olistic structure of the banking system may allow a few large banks to retain highmargins in spite of the high share of non-performing loans, and create a disincentive to acknowledge bad
41 Out of all the banks that were covered by the Enterprise and Bank Restructuring Program in Poland, the only bankthat remains problematic is BGZ (Bank Gospodarki Zywnosciowej), the bank that supports agriculturalcooperatives.
42

debt and pursue debtors. This was a common feature of the majority of the banking systems in transitioneconomies at the early stages of transformation to market economy.
The capacity of banks to deal with non-performing loans is also an important factor in the successof the decentralized approach. In some countries, banks did not have the capacity to become the 'agentsof change' in the real sector. It is especially true for most of the countries of the formner Soviet Union.For example, having analyzed the banking sector in the Baltics, Fink and others (1998) concluded thatdistressed banks which had difficulties managing themselves would probably not be able to improvecorporate governance in enterprises.
In addition to these factors, a decentralized approach to bad loan recovery also needs to be part ofa broad design that takes into account economic incentives and the legal framework for it to besuccessful. A decentralized approach that was part of a broad design was adopted in Poland4 2 , and inHungary during the 1993-94 Bank Restructuring and Loan Consolidation Program. On the other hand,Hungary (during the 1992 Loan Consolidation Program), Bulgaria, Estonia, Czech Republic andKazakhstan (for debts to small and medium enterprises), Georgia (which created a pilot work-out unit)and Ukraine (which set up work-out units in three large state banks) did not follow this comprehensiveapproach.
In light of these factors, the decentralized approach to bad debt recovery has not been verysuccessful for the countries under consideration. Poland is perhaps an exception, with recoveries for asample of banks averaging around 17 percent (Johnson, 1999). Kazakhstan appears to have achievedsome measure of success, with the integrated approach for bank loan and enterprise restructuring yieldingpositive results43. On the other hand, Hungary and Bulgaria were not very successful, and there is noinfornation on how Estonia, Georgia and Ukraine fared with their work-out units, while it is too early totell for the Czech Republic.
The relative success of Poland, which is a pioneer of the decentralized approach in the region,compared with the lack of success of Hungary which pursued a similar approach, highlights theimportance of incentives and the legal framework in the collection of bad loans. Both countries requiredbanks to create work-out units and pursue financial restructuring of their portfolios through a conciliationprocess with the enterprises. Comparison of the Polish and Hungarian experiences with the negotiationof these agreements provides useful insights about the implications of government participation in thenegotiation of agreements between banks and enterprises. In Poland, the government's withdrawal fromthe out-of-court conciliation and the imposition of strict conditionality on new bank lending together senta signal to banks that they could not rely on the government for additional support for dealing withproblem debtors. By contrast, in Hungary the government's participation in the negotiation of suchagreements tended to soften the budget constraint on banks and enterprises (Baer and Gray, 1995).
c. 'Good bank/bad bank' approach
Under this approach, a subsidiary "bad bank" is spun off from the original bank, allowing quickfinancial restructuring of the balance sheet of the remaining "good bank". The "bad bank" pursuescollection of bad assets and is self-liquidated within a limited period of time. Of the countries underconsideration, Hungary in 1995 and Estonia in 1996 pursued this approach. In Estonia, the "bad bank"that was spun out of the Social Bank (which was itself liquidated) was turned into a loan recovery agency
42 Several authors have undertaken detailed analysis of the incentive structure and evaluation of Poland's Enterpriseand Bank Restructuring Program. See van Wijnbergen (1998); Belka (1994; 1998); Baer and Gray (1995) and Grayand Holle (1996).43 Kazakhstan, Implementation Completion Report for Financial Sector Adjustment Loan, June 18, 1998.
43

and operated for only a short period of time. In Hungary, the bad bank "Risk Kft" that was spun out fromthe Magyar Hitel Banka was designed to be wound up in three years while the good bank wassuccessfully privatized. The ability to quickly relieve a bank of its non-performing loans, and yet avoidthe creation of a potentially ineffective state-owned AMC, is often seen as the main advantage of the'good bank/bad bank' approach.
5.3 Results of Bad Debt Recovery
None of the three approaches used for bad debt recovery by these countries has been verysuccessful. Based on available data, results of bad debt recovery were not very different under thecentralized and the decentralized approaches, with bad debt recoveries ranging from 3 to 16 percent underthe former, and up to 17 percent (in Poland) for the latter44. While the bad debt recoveries under thecentralized approach accrue to the government and alleviate the fiscal cost of banking crises in thosecountries, they accrue to the banks in the case of Poland and therefore do not help alleviate the fiscalcosts. However, in Poland's case, the work-out activities have helped build institutional capacity in thebanks, which strengthens the banking sector and should help in minimizing recurrence of banking crisesand incurrence of further fiscal costs.
The bad debt recovery rates are low compared with those elsewhere in the world, which is notentirely surprising since much of the bad debt in the transition economies have been inherited from theprevious regimes, and owed by enterprises which have either collapsed or have not been restructured andcontinue to have problems. In addition, the poor results were also due to insufficient political will toimpose hard budget constraints; lack of an effective legal framework to support debt collection andbankruptcy; and the inability to eliminate connected lending.
6. The Results of Crises Resolution
All three country groups experienced positive results from the resolution of banking crises, with theoutcomes being generally better for the CEEs and the Baltics than the CIS countries. Furtherimprovements are necessary, however, in several areas for all country groups. First, non-performingloans continue to be a major source of concern, especially in the Czech Republic, Macedonia, Lithuaniaand Kazakhstan. Second, financial intermediation is low, particularly in the CIS countries, but also in theCEEs and the Baltics. Third, banking sector efficiency needs to be improved in the CIS, and also in theCzech Republic and Hungary. Fourth, confidence in the banking sector is still extremely weak in the CIS.
The generally better performance of the CEEs and the Baltics may have been the outcome of thecrisis resolution strategy adopted by the countries, although the results must also have been affected bythe overall economic situations in these countries. The generally better economic environment in theCEEs and the Baltics, and the earlier growth recovery (Table 5), in all likelihood contributed to therecovery and better performance of the banking sector in these countries.
The next sections review the results of crises resolution in the twelve countries in terms offinancial intermediation, banking sector soundness, banking sector efficiency, and confidence in thebanking sector.
a. Financial Intermediation
Two measures of financial intermediation - credit to the private sector as a share of GDP and broadmoney as a share of GDP (Table 1) - show that there has not been much increase in financial depth as a
44 No data was available on the recovery rates in Hungary and Estonia under the "good bank/bad bank" approach.
44

result of bank crisis resolution in the twelve countries under consideration. If anything, there has been adecrease in financial depth in most of the countries. Financial intermediation in all three country groupsremains considerably lower than in OECD countries, with financial intermediation in the CIS being thelowest.
b. Banking Sector Soundness
Two measures of banking sector soundness - the ratio of non-performing loans to total loans(Table 3) and the capital to asset ratio (Table 17) - indicate that the results of bank crisis resolution in thetwelve transition countries were generally positive, although improvements are still necessary.
With respect to the ratio of non-perforning loans to total loans, all the CEE countries showed largeimprovements during the 1990s, ranging from a 20 percent reduction in the case of the Czech Republic toan over 70 percent reduction in the case of Hungary. For the Baltic countries, this ratio fell sharply inLatvia and Estonia, but in Lithuania the initial improvements were subsequently reversed somewhat.Among the CIS countries, all showed improvements except for Ukraine, where the ratio actuallyworsened which is not surprising since there was no bank restructuring in Ukraine. Despite the generallypositive trend, however, the bad loan problem remains critical in most countries. In fact, at the end of the1990s, the share of nonperforming loans was close to or higher than 10 percent in all the sample countriesexcept for Estonia, and was significantly higher than 10 percent in the Czech Republic, MIacedonia,Lithuania and Kazakhstan.
Data on the capital adequacy ratio suggest that the level of capitalization is satisfactory in thosecountries for which data is available. Even in countries where the authorities did not undertake majorinjections of capital, as in the Baltics, the restructuring and downsizing operations have produced bettercapitalized banking systems. Among the CEEs, Bulgaria had the highest capital adequacy ratio in 1998of around 37 percent due to revaluation gains.
c. Banking Sector Efficiency
The effects of bank crisis resolution on banking sector efficiency were mixed. One measure,interest rate spreads45, indicates that the banking sector has become more efficient in the CEEs andBaltics, while it remains far from efficient in the CIS countries. Another measure - central bank credit tocommercial banks as a share of GDP46 - indicate that there were improvements in this area for all threecountry groups.
In the CEEs and the Baltics, interest rate spreads have, by and large, been declining in the latterpart of the 1990s, suggesting increasing banking sector efficiency during that period. In 1998, theaverage interest rate spreads of the two country groups were around 8 percent, which was still twice thelevel in the OECD countries. By contrast, in the four CIS countries, interest margins were extremelyhigh, averaging 33 percent in 1998, reflecting the lack of competition and inefficiency in their bankingsystems.
For all three country groups, central bank credit to banks as a share of GDP generally declinedthrough the 1990s, reflecting a decrease in the reliance of the banking system on the central bank, andsuggesting an increase in efficiency. By 1998, this ratio had fallen to around I percent or smaller in the
45 See Appendix Table 9 for data on interest rate spreads for the twelve countries and for OECD countries.46 See Appendix Table 10 for data on central bank credit to banks as a share of GDP for the twelve countries and forOECD countries.
45

Baltics and the CIS, as compared to around 2 in OECD countries. By contrast, two CEE countries - theCzech Republic and Hungary - had significantly higher shares of 4 to 5 percent.
Table 17. Capital Adequacy Ratio(End of Period)
1990 1991 1992 1993 1994 1995 1996 1997 1998Central and Eastern EuropeBulgaria 8.6 4.6 17.6 26.7 37.3Czech Rep. 10.2 9.8 9.5 12.0Hungary 16.9 17.6 18.3Poland 16.5 20.8 18.5 17.5 16.9 15.0Average 12.5 15.6 17.9
BalticsEstonia 13.4 13.7 12.1 13.5 16.9Latvia 14.0 20.0 23.0 21.0 17.4Lithuania 10.5 10.8 23.8Average 15.2 15.1 19.4
CEEGeorgia 4.0Kazakhstan ' 3.0 19.0 23.0 30.0Kyrgyz Rep. 5.0Ukraine l.0 4.0Average 4.0
Source: EBRD (1998) "Transition Report", International Monetary Fund, Central Banks.1/ Data for 1996-1998 are taken from IMF (1999) "IMF Staff Country Report, pp. 69-70." The IMFnoted that these figures should be used with care.
d. Confidence in the Banking Sector
The experience of the twelve countries was generally positive with respect to confidence in thebanking sector in the aftermath of bank crisis resolution as measured by the currency to deposit ratio47 andthe ratio of MI to M2 (Chart 5)48
Virtually all twelve countries experienced a decline in the confidence in the banking sector duringbanking crises, as measured by the currency to deposit ratio. Confidence did not recover in all thecountries after the crises. Among the CEEs, there was recovery in confidence (that is, the ratio fell) onlyin Macedonia and Poland, while in the CIS countries, there was recovery only in Georgia. On the otherhand, in all three Baltics states, and in particular in Estonia, confidence in the banking sector rose aftercrisis resolution. In 1998, confidence in the banking sector as measured by the currency to deposit ratiowas similar in the CEEs and the Baltics, where the ratio was between 90 to 95 percent in these countries,compared with around 30 percent in OECD countries. The confidence in the banking sector was muchlower in the CIS, where the ratio was over 400 percent.
Data on the ratio of MI to M2 shows a generally positive experience for all the countries. With theexception of Macedonia, all the countries showed a decline in the ratio in the aftermath of bank crisisresolution, reflecting an increase in confidence in the banking sector.
47 See Appendix Table 11 for data on currency deposit ratios for the twelve countries and for OECD countries.48 See Appendix Table 12 for data on MI/M2 for the twelve countries and for OECD countries.
46

7. Summary, Conclusions and Policy Lessons
a. Summary
The experience of banking crises in transition economies differs from that in many other parts ofthe world in part because of the very different initial conditions facing these countries. One initialcondition that is unique to the transition economies is the large debt stock inherited from previouscommunist regimes, owed by enterprises that did not have the custom of repaying. Another initialcondition unique to the transition economies was the lack of experience on the part of both enterprisesand banks in operating under market conditions. Also, the transition process brought along severe growthcontraction throughout the transition world, which helped precipitate banking crises in these countries.Given these initial conditions, banking crises in transition countries could be more broadly viewed as achallenge of transition, or a challenge of banking sector development in the transition context.
Broadly speaking, the bank crisis resolution strategy pursued by the countries under considerationcould be differentiated according to three country groups. The CEEs generally pursued restructuring ofbanks coupled with injection of capital; the CIS pursued large-scale liquidation of banks; while the Balticspursued a combination of bank liquidation and restructuring with injection of capital in some instances.
The different strategies adopted by the authorities in these countries appear to depend on twomain factors - initial macroeconomic conditions and development of the banking sector. On themacroeconomic side, the key factor was inflation. Hyper inflation in the countries of the FSU (CIS andthe Baltic countries) at the beginning of transition had drastically reduced the real value of the bad debt inthe banking system. By contrast, while some CEEs began transition with high inflation, inflation in thesecountries was far lower than in the FSU, which means that the CEEs were saddled with a much largerstock of bad debt that the authorities needed to tackle.
Banking sector development also had implications for the bank crisis resolution strategy adoptedby the different country groups. While both the FSU and CEEs pursued liberal licensing policies initially,entry of new banks was on a much larger scale in the FSU than in the CEEs. Furthermore, while in theCEEs new banks were allowed to enter to foster competition in the banking sector, in the FSU many newbanks emerged to finance inefficient state-owned enterprises. As a result, that there was a much greaterproliferation of banks of poor quality in the FSU compared to the CEEs. Also, financial intermediationwas much deeper in the CEEs (with some banks considered "too big to fail") than in the FSU countries,which meant that liquidation of banks in the FSU would not have much economic or social impact,whereas it could in the CEEs. Because of these reasons, countries in the CEEs did not undertake bankliquidation on the large-scale that the FSU did.
These initial conditions and bank crisis resolution strategies had a direct impact on the fiscal costsof banking crises. Further, the amount of fiscal costs incurred also depended on the extent to which bankshareholders and depositors bore some of the costs. The CIS and Baltic States, the fiscal costs weregenerally lower because they relied more on recapitalization by private shareholders than by thegovernment. There was also minimal compensation for depositors in the event of bank liquidation in theCIS and the Baltics. Also, the restructuring operations undertaken by the CEEs suffered from severalweaknesses, which raised fiscal and quasi-fiscal costs.
Taking together the costs of bank restructuring and depositor compensation incurred by thegovernment and the central bank, the total fiscal costs of banking crises were by far the highest in theCEEs, where they ranged from 7 to over 40 percent of GDP, compared with a range of 0.1 to 18 percentof GDP for the CIS, and from 2 to 3 percent for the Baltics. The bulk of these costs were incurred by the
47
government for bank restructuring, which were typically several times the costs of direct payments todepositors or the costs incurred by the central bank.
The higher fiscal costs incurred by the CEEs are reflected in the higher levels of fiscal outlaysarising from banking crises compared with the general government deficits in these countries. Theresolution of banking crises also raised central government indebtedness more in the CEEs than in theCIS, by around 5 percent in the case of the Kyrgyz Republic to around 1 I percent in the case of Bulgaria.
While these upfront costs of banking crises (that is costs of bank restructuring and directdepositor compensation) could in principle be offset by recoveries of bad loans, the experience of thesample countries was not very positive in this respect. For those countries for which data is available, baddebt recoveries were low and did not contribute much to reducing fiscal costs. Among the countrieswhere loan recoveries accrued to the government, Hungary had the best results with loan recoveriesamounting to 16 percent of total bad loans. Poland also had a similar recovery rate, although bad debtrecoveries accrued to the banks themselves. In comparison, recovery rates of around 30 percent havebeen achieved around the world. The low recovery rate in the transition countries is not surprising sincemuch of the bad debt was owed by enterprises which had either collapsed or not been restructured and notcapable of repaying.
All three country groups enjoyed positive results from the resolution of banking crises, althoughthe outcomes were generally better in the CEEs and the Baltics than in the CIS, particularly in regard toimproving banking sector efficiency and raising the confidence in the banking sector. There needs to befurther financial deepening in all three country groups, and especially so in the CIS. Finally, althoughnon-performing loans as a share of total loans has declined, they remain a concern in several countries inall three country groups.
b. Conclusions and Policy Lessons
All transition countries have suffered from banking crises. Governments have a range of optionsof how to respond, from doing nothing and allowing banks to fail, to absorbing the entire cost of thebanking crisis which is not only fiscally expensive but run the risk of moral hazard in the case of privatebanks.
The incurrence of at least some fiscal costs may have been inevitable for the transition countriesbecause of the need to deal with the inherited bad debt. Because of the moral hazard created byundercapitalization, these banks needed to be recapitalized before sound commercial banking could takeplace. The CEEs broadly adopted the approach of rehabilitating and injecting capital into banks.Although they incurred quite substantial fiscal costs in the process, the result was a sounder and moreefficient banking system, in particular because many of the recapitalized banks have since been privatizedto strategic foreign investors.
An alternative approach would have been to close all the old banks and allow new banks to enter.This approach was broadly adopted by the CIS countries, but these countries encountered difficulties inattracting reputable and sound banks to do business in their high risk environments. The outcome wasthat in the CIS countries, the new banks that entered into the system were generally small,undercapitalized and unsound, and had to be liquidated soon after entry, leaving the CIS countries withweak banking systems and low levels of financial intermediation.
In contrast to the CEEs and the CIS, the Baltics appeared to have struck a good balance in termsof incurring some, but not too substantial, fiscal costs, while at the same time achieving some success inresolving banking crises. In particular, Estonia appears to have done the best in terns of resolving its
48

banking crises while minimizing cost. At a total cost of 2 percent of GDP as of end-1998, the crisisresolution has resulted in a substantial increase in financial intermediation, a large decline in non-performing loans (which stood at slightly over I percent of total loans in 1998), significant improvementsin banking sector efficiency and higher confidence in the banking sector.
The experience of the twelve transition countries also highlights the following lessons - consistentwith conventional wisdom - on the approach to bank restructuring which minimizes the recurrence ofbanking crises and hence minimize fiscal costs. First, the three elements of banking system restructuring- operational, financial and institutional - need to be undertaken in parallel for the successful resolutionof banking crises. Second, financial restructuring of banks should entail adequate recapitalization to determoral hazard. Third, operational restructuring of banks needs to entail privatization to core investors.The experience in the transition countries indicates that privatization to reputable foreign banks could be auseful way to strengthen their banking systems. Fourth, enterprise problems need to be addressed inparallel with bank restructuring because in many transition economies enterprise problems are theunderlying causes of banking problems. Fifth, differentiation of the crisis resolution strategy according tothe cause of the crisis could help reduce fiscal costs. Specifically, fiscal costs were reduced when: (i)governments only dealt with that portion of the bad debt inherited from the socialist period; (ii) smallbanks were allowed to fail when they did not affect financial intermediation very much (that is they heldvery little deposits) and when the social costs of such bank failure were low; and (iii) only banks that gotinto trouble because of external shocks were rescued while those that suffered from poor managementwere liquidated. Sixth, bank restructuring should be undertaken by the government and not the centralbank because: (i) central bank financing is non-transparent and the costs will eventually fall on thebudget; and (ii) central bank financing could lead to hyperinflation with severely negative economicconsequences.
The experience of the transition countries under consideration also supports the establishedprinciple that for bad debt recovery to be successful, the bad debt collector (be it a central agency or abank) needs to operate within an adequate legal environment (in particular effective collateral, foreclosureand bankruptcy laws) and be given appropriate incentives, and the enterprises in question need to besubject to hard budget constraints. This implies that if a centralized approach is adopted, then the baddebt collection agency should be private rather than state-owned. It also implies that a "good bank/badbank" approach to bad debt collection might be preferable as it entails a finite time of operation of the"bad bank".
The approach adopted by Poland, where the banks themselves pursue the collection of bad debts,appears to have some merit. Since the recovered debts accrue to the banks, they have the incentive tocollect. Bad debt collection by banks also helped them build institutional capacity, which shouldstrengthen the banking system and help minimize the recurrence of banking crisis. Another key incentiveprovided for bad debt collection in the Polish model was the complete withdrawal of governmentparticipation in the negotiation of agreements between the banks and the enterprises. This addresses the"soft budget constraint" factor that tends to undermine bad debt collection efforts by creditors in othertransition economies. The Polish banks were also supported by an adequate legal framework. Othertransition countries covered in this study which also adopted a similar decentralized approach to bad debtcollection were not very successful because either an adequate legal framework or appropriate incentivesor both were absent.
Finally, it is important to note that successful bad debt recovery requires adequate capacity for thetask. Given the relatively recent introduction of transition economies to commercial banking, the capacityof collecting bad debt which entails restructuring of enterprises will take some time to build up, more sofor the countries from the FSU than the CEEs. Therefore, only modest results from bad debt recoverymay be expected from these countries for some time.
49

References
Alexander, William E., Jeffrey M. Davis, Liam P. Ebrill, and Carl-Johan Lindgren, 1997, Systemic BankRestructuring and Macroeconomic Policy (Washington: International Monetary Fund).
Anderson, Ronald W., Eric Berglof, Kalman Mizsei, et al., 1996, Banking Sector Development in Centraland Eastern Europe. Forum Report on the Economic Policy Initiative No. 1 (Warsaw, Prague,Budapest, Kosice, New York: Institute for EastWest Studies).
Anderson, Ronald W., and Chantal Kegels, 1998, Transition Banking. Financial Development of Centraland Eastern Europe (Oxford: Clarendon Press).
Baer, Herbert L., and Gerard Caprio, Jr., 1995, "Bank Recapitalization: If and When," The World BankDevelopment Economics (DEC) Policy Review Note No. 2 (Washington: World Bank).
Baer, Herbert L., and Cheryl W. Gray, 1995, "Debt as a Control Device in Transitional Economies. TheExperiences of Hungary and Poland," The World Bank Policy Research Working Paper No.1480(Washington: World Bank, June).
Balcerowicz, Leszek, Cheryl Gray, and Iraj Hoshi, 1998, Enterprise Exit Processes in TransitionEconomies (Budapest: Central European University Press).
Balyozov, Zdravko, 1999, "The Bulgarian Financial Crisis of 1996-97", Bulgarian National BankDiscussion Papers, DP/7/1999.
Bank for International Settlements, 1998, Handbook on Central Banks of Central & Eastern Europe(Basle: Bank for International Settlements, August).
Bank of Lithuania, 1995, 1996, 1997, 1998, Annual Report (Vilnius: Bank of Lithunia).
Begg, David, and Richard Portes, 1993, "Enterprise Debt and Economic Transformation: FinancialRestructuring in Central and Eastern Europe," in Capital Markets and Financial Intermediation,eds. Colin Mayer and Xavier Vives (Cambridge: Cambridge University Press).
Belka, Marek, 1994, "Financial Restructuring of Banks and Enterprises in Poland," Moct-Most, No. 3, pp.71-84.
Belka, Marek and Anna Krajewska, "The Polish Bank and Enterprise Restructuring Programme:Expectations and Reality", in Balcerowicz et al (1998).
Berengaut Julian, et al., 1998, "The Baltic Countries. From Economic Stabilization to EU Accession,"IMF Occasional Paper No. 173 (Washington: International Monetary Fund).
Blejer, Mario, and Marko Skreb, eds., 1999, Financial Sector Transformation. Lessonsfrom theEconomies in Transition (New York and Cambridge: Cambridge University Press).
Bonin, John P., Kalman Mizsei, Istvan Szekely, and Paul Wachtel, 1999, Banking in TransitionEconomies. Developing Market Oriented Banking Sectors in Eastern Europe (Cheltenham, UK andNorthhampton, MA, USA: Edward Elgar Publishing Ltd).
50

Bonin, John P., and Mark E. Schaffer, 1995, "Banks, Firms, Bad Debts and Bankruptcy in Hungary1991-94," Centre for Economic Performance Discussion Paper No. 234 (London: Centre forEconomic Performance of the London School of Economics, April).
Bonin, John P., and Paul Wachtel, 1999, "Lessons from Bank Privatization in Central Europe," Paperprepared for the World Bank and Federal Reserve Bank of Dallas Conference on Privatization ofBanks (Washington, March 15-16).
Borish, Michael S., Millard F. Long, and Michel Noel, 1995, "Restructuring Banks and Enterprises.Recent Lessons from Transition Countries," World Bank Discussion Paper No. 279 (Washington:World Bank).
Borish, Michael S., Wei Ding and Michel Noel, 1996, "On the Road to EU Accession. Financial SectorDevelopment in Central Europe", World Bank Discussion Paper No. 345 (Washington: WorldBank).
Borish, Michael S., Wei Ding, and Michael Noel, 1997, "Restructuring the State-Owned Banking Sector:A Comparative Assessment of Approaches in Central Europe," Moct-Most, Vol. 7, No. 1, pp.49-77.
Brock, Philip, 1998, "Financial Safety Nets and Incentive Structures in Latin America," World BankPolicy Research Working Paper No. 1993 (Washington: World Bank, October).
Bulgarian Ministry of Finance, Government Debt Management, various issues.
Bulgarian National Bank, Annual Report, various issues.
Bulgarian National Bank, Bulgarian National Bank Review, various issues.
Bulgarian National Bank, Monthly Bulletin, various issues.
Capek, Ales, 1994, "The Bad Debts Problem in the Czech Economy", Moct-Most, No. 3, pp. 59-70.
Caprio, Jr., Gerard, and Daniela Klingebiel, 1996a, "Bank Insolvency: Bad Luck, Bad Policy, or BadBanking?" Paper present at the World Bank Annual Bank Conference on Development EconomicsPaper (Washington, April 25-26).
Caprio, Jr., Gerard, and Daniela Klingebiel, 1996b, "Bank Insolvencies. Cross-Country Experience,"World Bank Policy Research Working Paper No. 1620 (Washington: World Bank, July).
Caprio, Jr., Gerard, David Folkerts-Landau, and Timothy D. Lane, eds., 1994, Building Sound Finance inEmerging Market Economies (Washington: International Monetary Fund).
Claessens, Stign, Asli Demirguc-Kunt and Harry Huizinga, 1998, "How Does Foreign Entry Affect theDomestic Banking Market," World Bank Policy Research Working Paper No. 1918 (Washington:World Bank, June).
Coricelli, Fabrizio, 1999, "Financial Market Development and Financial Liberalization in Economies inTransition: Tales of Failure and Success," Paper presented at the World Bank Workshop "FinancialLiberalization: How Far? How Fast?" (Washington, March 18-19).
51

Cull, Robert, 1998, "How Deposit Insurance Affects Financial Depth. (A Cross-Country Analysis)," TheWorld Bank Policy Research Working Paper No. 1875 (Washington: World Bank, January).
Czech National Bank, Annual Report, various issues (Prague: Czech National Bank).
Czech National Bank, 1998, "Building Stable Market-Oriented Financial Systems in Central and EasternEuropean and CIS Countries" (Prague: Czech National Bank).
Daniel, James A., 1997, "Fiscal Aspects of Bank Restructuring," IMF Working Paper No. 97/52(Washington: International Monetary Fund, April).
Daniel, James A., Jeffrey M. Davis, and Andrew M. Wolfe 1997, "Fiscal Accounting of BankRestructuring", IMF Paper on Policy Analysis and Assessment No. 97/5 (Washington: InternationalMonetary Fund, May).
de Castello Branco, Marta, Alfred Kammer, and L. Effie Psalida, 1996, "Financial Sector Reform andBanking Crises in the Baltic Countries," IMF Working Paper No. 96/134 (Washington:International Monetary Fund, December).
Demirguc-Kunt, Asti, and Enrica Detragiache, 1997, "The Determinants of Banking Crises: Evidencefrom Developing and Developed Countries," IMF Working Paper No. 97/106 (Washington:International Monetary Fund, September).
Demirguc-Kunt, Asli, and Enrica Detragiache, 1998, "Financial Liberalization and Financial Fragility,"Paper presented at the World Bank Annual Bank Conference on Development Economics(Washington, April 20 -21).
Drees, Burkhard, and Ceyla Pazarbasioglu, 1998, "The Nordic Banking Crises: Pitfalls in FinancialLiberalization?" IMF Occasional Paper No. 161 (Washington: International Monetary Fund, April).
Dziobek, Claudia, and Ceyla Pazarbasioglu, 1997, "Lessons from Systemic Bank Restructuring: ASurvey of 24 Countries," IMF Working Paper No. 97/161 (Washington: International MonetaryFund, December).
Economist Intelligence Unit, "Country Profile. Kazakhstan," various issues.
Economist Intelligence Unit, "Country Report. Kazakhstan," various issues.
Economist Intelligence Unit, "Country Profile. Ukraine," various issues.
Economist Intelligence Unit, "Country Report. Ukraine," various issues.
Eesti Pank (Bank of Estonia), Annual Report, various issue, http://www.ee/epbe/.
Eesti Pank (Bank of Estonia), Bulletin, various issues, http://www.ee/epbe/.
Eesti Pank (Bank of Estonia), Newsletters, various issues, http://www.ee/epbe/.
Eesti Pank (Bank of Estonia), Quaterly Review, various issues.
52

European Bank for Reconstruction and Development, 1997, 1998, 1999, Transition Reports (London:EBRD).
Fink, Gerhard, Peter Haiss, and Nobuko Inagawa, 1998, "Financial Markets in the Baltic States: Fit forthe EU?" Journal of International Development, Vol. 10, July-August, pp. 659-679.
Fleming, Alex, Lily Chu, and Marie-Renee Bakker, 1996, "The Baltics - Banking Crises Observed,"World Bank Policy Research Working Paper No. 1647 (Washington: World Bank, September).
Fleming, Alex and Samuel Talley, 1996, "The Latvian Banking Crisis - Lessons Learned", World BankPolicy Research Working Paper No. 1590 (Washington: World Bank, April).
Folkerts-Landau, David, Carl-Johan Lindgren, et al., 1998, Toward a Frameworkfor Financial Stability,World Economic and Financial Surveys (Washington: International Monetary Fund).
Fries, Steven M., and Timothy D. Lane, 1994, "Financial and Enterprise Restructuring in EmergingMarket Economies," in Building Sound Finance in Emerging Market Economies, ed. by GerardCaprio, Jr., David Folkerts-Landau, and Timothy D. Lane (Washington: International MonetaryFund).
Frydl, Edward, 1999, "The Length and Cost of Banking Crises," IMF Working Paper No. 99/30(Washington: International Monetary Fund, March).
Garcia, Gillian G. H., 1999, "Deposit Insurance: A Survey of Actual and Best Practices," IMF WorkingPaper No. 99/54 (Wasington: International Monetary Fund, April).
Gaspar, Pal, 1997, "Exchange-Rate Policies in Economies in Transition," Russian and East EuropeanFinance and Trade, May-June, pp. 6-28.
Glaessner, Thomas, and Ignacio Mas, 1995, "Incentives and the Resolution of Bank Distress," The WorldBank Research Observer, Vol. 10, No. 1, February, pp. 53-73.
Gray, Cheryl W., and Arnold Holle, 1996a, "Bank-led Restructuring in Poland. Bankruptcy and itsAlternatives," World Bank Policy Research Department Paper No.1651 (Washington: World Bank,September).
Gray, Cheryl W., and Arnold Holle, 1996b, "Bank-led Restructuring in Poland. An Empirical Look at theBank Conciliation Process," World Bank Policy Research Working Paper No. 1650 (Washington:World Bank, September).
Gray, Cheryl W., and Arnold Holle, 1998, "Classical Exit Processes in Poland: Court Conciliation,Bankruptcy, and State Enterprise Liquidation," in Enterprise Exit Processes in TransitionEconomies. Downsizing, Workouts, and Liquidation, ed. by Leszek Balcerowicz, Cheryl W. Gray,and Iraj Hoshi (Budapest: Central European University Press).
Gray, Cheryl W., Sabine Schlorke, and Miklos Szanyi, 1995, "Hungary's Bankruptcy Experience, 1992-93," The World Bank Policy Research Working Paper No. 1510 (Washington: World Bank,September).
Hoelscher, David S., June 1998, "Banking System Restructuring in Kazakhstan," IMF Working PaperNo. 98/96 (Washington: International Monetary Fund, June).
53
Hoshi, Iraj, Jan Mladek, and Alison Sinclair, 1998, "Bankruptcy and Owner-Led Liquidation in the CzechRepublic," in Enterprise Exit Processes in Transition Economies, eds. Leszek Balcerowicz, CherylGray, and Iraj Hoshi (Budapest: Central European University Press).
Hungarian State Banking Supervision, 1998, Annual Report (Budapest: Hungary).
International Monetary Fund, 1999, International Financial Statistics (Washington).
International Monetary Fund, 1996, World Economic Outlook (Washington).
Johnson, Gordon, "State-owned Enterprise Insolvency: Treatment of Financial Distress", draft, the WorldBank, September 1999.
Jones, Colin, 1993, "Banking and Financial Sectors in East and Central Europe," Financial TimesManagement Report (London: Financial Times Business Information).
Jovanovski, Zoran, 1998, "Deposit Insurance in the Republic of Macedonia" (Skopje: National Bank ofthe Republic of Macedonia, September).
Kalyuzhnova, Yelena, and George Tridimas, 1998, "Dilemmas of Financial Development in Kazakhstan,"Journal of International Development. Vol. 10, No. 5, July-August, pp. 681-693.
Kawalec, Stefan, 1999, "Banking Sector Systemic Risk in Selected Central European Countries", Mimeo.
Keuschnigg, Mirela, 1997, "Banking in Central and Eastern Europe," Moct-Most, No.3, pp.7 -35 .
Klingebiel, Daniela, 2000, "The Use of Asset Management Companies in the Resolution of BankingCrises: Cross-Country Experience", The World Bank Policy Research Working Paper No. 2284(Washington: World Bank, February).
Koford, Kenneth, and Adrian Tschoegl, 1999, "Problems of Bank Lending in Bulgaria: InformationAsymmetry and Institutional Learning," Moct-Most, Vol. 9, No. 2, pp.12 3-152 .
Lindgren, Carl-Johan, Gillian Garcia, and Matthew I. Saal, 1996, Bank Soundness and MacroeconomicPolicy (Washington: International Monetary Fund).
Mayer, Colin, and Xavier Vives, eds., 1993, Capital Markets and Financial Intermediation (Cambridge:Cambridge University Press).
Mishkin, Frederic S., 1996, "Understanding Financial Crises: A Developing Country Perspective," Paperpresented at the World Bank Annual Bank Conference on Development Economics (Washington,April 25-26).
Miurin, Paolo, and Andrea Sommariva, 1993, "The Financial Reforms in Central and Eastern EuropeanCountries and China," Journal of Banking and Finance, Vol. 17, pp. 883-911.
Mondschean, Thomas S., and Timothy P. Opiela, 1997, "Banking Reform in a Transition Economy: theCase of Poland," Economic Perspectives, Vol. XXI, No. 2, March/April, pp.1 6-31.
54

Mondschean, Thomas S., and Timothy P. Opiela, 1998, "Bank Time Deposit Rates and Market Disciplinein Poland: The Impact of State Ownership and Deposit Insurance Reform," Working Paper Seriesof the Research Department of the Federal Reserve Bank of Chicago, Paper No. WP-98-13(Chicago: Federal Reserve Bank of Chicago, November).
Montes-Negret, Fernando, and Luca Papi, 1996, "Poland. Country Assistance Review. Enterprise andFinancial Sector Adjustment Loan," World Bank Project Document (unpublished, June).
Montes-Negret, Fernando, and Luca Papi, 1997, "The Polish Experience with Bank and EnterpriseRestructuring," World Bank Policy Research Working Paper No. 1705 (Washington: World Bank,January).
Moody's Investor Service, 1998, "Banking System Outlook. Kazakhstan," October.
Mullineux, Andrew, and Christopher Green, eds., 1999, Economic Performance and Financial SectorReform in Central and Eastern Europe. Capital Flows, Bank and Enterprise Restructuring(Cheltenham, UK and Northhampton, MA, USA: Edward Elgar Publishing Ltd).
National Bank of Hungary, 1995, 1996, 1997, 1998, 1999, Annual Reports (Budapest: National Bank ofHungary).
National Bank of Kazakhstan, 1997, 1999, Annual Report.
Organization for Economic Cooperation and Development, 1997, "1996-1997 Bulgaria," OECDEconomic Surveys (Paris: OECD).
Organization for Economic Cooperation and Development, 1994, "1993-1994 Czech Republic," OECDEconomic Surveys (Paris: OECD).
Organization for Economic Cooperation and Development, 1996, " 1995-1996 Czech Republic," OECDEconomic Surveys (Paris: OECD).
Organization for Economic Cooperation and Development, 1999, "1998-1999 Hungary," OECDEconomic Surveys (Paris: OECD).
Organization for Economic Cooperation and Development, 1997, "1996-1997 Poland," OECD EconomicSurveys (Paris: OECD).
Oxford Analytica Brief, 1999, "Kyrgyz Republic: Banking Regulation," June 30.
Paulson, Jo Ann, and Wang Jun, 1999, "International Lessons on AMCs and Implications for China,"World Bank Analytical Paper (unpublished, August).
Pazarbasioglu, Ceyla, and Jan Willem van der Vossen, 1997, "Main Issues and Challenges in DesigningBank Restructuring Strategies," in Central Bank Reform in the Transition Economies, ed. byVasudevan Sundararajan, Arne B. Petersen, and Gabriel Sensenbrenner (Washington: InternationalMonetary Fund).
Polackova Brixi, Hana, Anita Papp, and Allen Schick, 1999, "Hungary: Fiscal Risks and the Quality ofFiscal Adjustment," World Bank Analytical Paper (unpublished, July).
55

Saunders, Anthony, and Andrea Sommariva, 1993, "Banking Sector and Restructuring in EasternEurope," Journal of Banking and Finance, Vol. 17, pp.9 3 1-957.
Schnitzer, Monika, 1998, "Bank Competition and Enterprise Restructuring in Transition Economies,"Centre for Economic Policy Research Discussion Paper No. 2045 (London: CEPR, December).
Sheng, Andrew, 1996, "Bank Restructuring Techniques," in Bank Restructuring. Lessons from the 1980s,ed. by Andrew Sheng (Washington: World Bank).
Steinherr, Albert, 1993, "An Innovatory Package for Financial Sector Reforms in Eastern EuropeanCountries," Journal of Banking and Finance, Vol. 17, No.5, September, pp.1 033-1057.
Standart & Poor's, 1997, "Financial System Stress and Sovereign Credit Risk", Sovereign RatingsService, December, pp. 1-9.
Stiglitz, Joseph, 1993, "Financial Systems for Eastern Europe's Emerging Democracies," InternationalCenter for Economic Growth Occasional Paper No. 38 (San Francisco: International Center forEconomic Growth).
Stone, Mark R., 1998, "Corporate Debt Restructuring in East Asia: Some Lessons from InternationalExperience," IMF Paper on Policy Analysis and Assessment (Washington: International MonetaryFund, October).
Sundararajan, V., and J. T. Balino, eds., 1991, Banking Crises. Cases and Issues (Washington:International Monetary Fund).
Talley, Samuel, Marcelo M. Giugale, and Rossana Polastri, 1998, "Capital Inflow Reversals, BankingStability, and Prudential Regulation in Central and Eastern Europe," World Bank Policy ResearchWorking Paper No. 2023 (Washington: World Bank, December).
Turto Bankas, 1997, 1998, Annual Reports (Vilnius: Turto Bankas).
van Brabant, Josef M., 1994 "Transforming Bank and Enterprise Balance Sheets in Eastern Europe",Moct-Most, No.3, pp. 7-36.
van Wijnbergen, Sweder, 1998a, "Bank Restructuring and Enterprise Reform," EBRD Working PaperNo. 29 (London: EBRD, March).
van Wijnbergen, Sweder, 1998b, "On the Role of Banks in Enterprise Restructuring: The PolishExample," Journal of Comparative Economics, Vol. 24, No. 1, February, pp. 44-64.
Varhegyi, Eva, 1993, "Key Elements of the Reform of the Hungarian Banking System: Privatization andPortfolio Cleaning," Centre for Economic Policy Research Discussion Paper No. 826 (London:CEPR, September).
Wang, Jian-Ye, 1999, "The Georgian Hyperinflation and Stabilization," IMF Working Paper No. 99/65(Washington: International Monetary Fund, May).
Word Bank, 1995, "Bank Recapitalization: If and When," A DEC Policy Review Note No. 2(Washington: World Bank, April).
56

World Bank, Financial Sector Holistic Review, Czech Republic,http://eca/ecspf/holistic/reports/Czech.html.
Ziegler, Kamil, and Tomas Krones, 1999, "Accord Among Creditors Could Reap Many Benefits,"Bankovnictvi, August 2.
World Bank Documents
Czech RepublicCzech Republic, 1999, Czech Republic. Toward EUAccession, A World Bank Country Study(Washington: World Bank).
Georgia1996, Georgia. Banking Sector Policy Note, Vol. 1: Main Report, October.1997, Georgia, Report of the President (ROP), Structural Adjustment Credit (SAC), Report No. P-7165-GE, August.
1998, Georgia - Financial Sector Review Issues Paper, Back to Office Report, December.
Hungary1995, Hungary. Structural Reforms for Sustainable Growth, A World Bank Country Study (Washington:World Bank).1997, Hungary, ROP, Enterprise and Financial Sector Adjustment Loan (EFSAL), Report No. P-6826HU, February.1999, Hungary. On the Road to the EU, A World Bank Country Study (draft).1999, Hungary, Implementation Completion Report (ICR), EFSAL, Report No. 19345, June.
Kazakhstan1996, Kazakhstan, ROP, Financial Sector Adjustment Loan (FSAL), Report No. P-6880-KZ, May.1996, Kazakhstan, Memorandum of President (MOP), Financial Sector Adjustment Loan(FINSAL), May.1998, Kazakhstan, ICR, FINSAL, June.
Kyrgyz Republic996, Kyrgyz Republic, MOP, Financial Sector Adjustment Credit (FINSAC), Report No. P-689 1-KG, May.
Latvia1994, Latvia, MOP, EFSAL, August.1994, Latvia, Public Expenditure Review, Report No. 12793-LV, July.
Lithuania1995, Lithuania, Staff Appraisal Report (SAR), Enterprise and Financial Sector Assistance Project(EFSAP), March 27, 1995, Report No. 13659-LT.1998, Lithuania An Opportunity for Economic Success, Vol. 2, A World Bank Country Study(Washington: World Bank).1999, Lithuania, ICR, Structural Adjustment Loan (SAL), Report No. 19068, April.1999," Lithuania. Macroeconomic and Financial Sector Vulnerability Review," August.
Macedonia1995, Macedonia, FYR.. An Introductory Economic Report (Washington: World Bank).
57

1995, Macedonia, FYR, MOP, FINSAC, April.1998, Macedonia, FYR.. Enhancing Growth, Country Economic Memorandum (CEM), November.
Poland1994, Poland: Policiesfor Growth with Equity, A World Bank Country Study (Washington: WorldBank).1995, Understanding Poverty in Poland, A World Bank Country Study (Washington: World Bank).1997, Poland: Reform and Growth on the Road to the EU, CEM, Report. No. 16858-POL(Washington: World Bank).
Ukraine1998, Ukraine, ROP, FSAL, Report No. P7226UA, February.1998, Ukraine, MOP, FINSAL, February.
International Monetary Fund Staff Country Reports:
Bulgaria: Report No. 96/13, No. 97/86, No. 99/26.Czech Republic: Report No. 95/85, No. 96/147, No. 98/36, No. 98/37, No. 99/90, No. 99/91.Estonia: Economic Review, 1993; Report No. 95/40, No. 96/96, No. 98/12, No. 99/74.Georgia: Report No. 95/112, No. 96/116, No. 97/36, No. 98/99.Hungary: Report No. 95/35, No. 96/109, No. 96/110, No. 97/103, No. 97/104, No. 99/27.Kazakhstan: Report No. 95/7, No. 97/67, No. 98/84, No. 99/95.Kyrgyz Republic: Report No. 95/3 8, No. 96/98, No. 98/08, No. 99/31.Latvia: Report No. 95/125, No. 96/143, No. 98/47, No. 99/99.Lithuania: Report No. 95/82, No. 96/72, No. 97/78, No. 98/92, No. 99/96.Macedonia, FYR: Report No. 95/50, No. 97/45, No. 98/82.Poland: Report No. 96/10, No. 96/20, No. 97/33, No. 98/51, No. 99/32.Ukraine: Report No. 96/2 1, No. 97/109, No. 99/42.
58

Appendix I
Appendix Table 1: Incidence of Banking Crises in Transition Countries
Country Study Period Magnitude of the crisis Cost (existingestimates)
Scope of crisis Private vs. Liquidity vs.- a~~~~~public banks solvency crisis
Albania LGS (1996) 1992- 31% of loans granted Some bankssignificant after 1992 cleanup facedJ liquidityproblems were non-performing problems.
Armenia LGS (1996) 1994- Half of active bankssignificant were closed after 1994.problems Saving Bank had
negligible capital.
Azerbaijan LGS (1996) 1995- One large state-owned 4 large state One large statesignificant bank faced liquidity banks faced bank facedproblems problems; 12 private problems; 12 liquidity problem;
banks were closed; 3 private banks 3 faced solvencylarge state banks had were closed. problems.sizable share of non-performing loans.
Daniel (1997) 1995
Belarus LGS (1996) 1995- Many banks weresignificant undercapitalized.problems
Bosnia- LGS (1996) 1992- Loans extended in lateHerzegovina 1980s and early I 990s
were in default.
Bulgaria LGS (1996); 1991- Crisis In 1995 75% of Liquidity and CK: banking sectorCK (1996) nongovernmnt loans solvency losses were
were non-performing. problems. approximately 14%of GDP.
Croatia LGS (1996) 1995 Banks accounting forSignificant 47% of bank creditsproblems were unsound.
Czech Rep. LGS (1996), 1991- 1994-95: 38% of loans State and private 12% of 1994 GDPS&P (1997) Significant were not performing. commercial was spent on bank
problems Many banks were banks; saving support throughclosed after 1993. banks. 1994.
Estonia LGS (1996) 1992-1995 Insolvent banks held Commeraal 1.8% of 1993 GDPCrisis 41% of banking banks
sysytem assets; thelicenses of 5 bankswere revoked, 2 bankswere nationalized andmerged, 2 banks weremerged and convertedto a loan recoveryagency.
CK (1996) 1992 Insolvent banks recapitalizabon forsystemic represented 41% of new entty: 1.4% of
financial system assets. GDP
CK (1996) 1994 Crisis of Social Banksystemic (which controlled 10%
of financial systemassets).
Georgia LGS(1996) 1991- Ablou 1130 of banks SolvencySignificant loans were non- problemsproblems performing,
59

Appendix 1
Appendix Table 1: Incidence of Banking Crises in Transition Countries
Country Study Period Magnitude of the crisis Cost (existing__ _ _ __ _ _ __ _ _ _ __ _ _ __ _ _ _ __ _ _ __ _ _ _ __ _ _ __ _ _ _ __ _ _ __ _ ___ ,stjm ates)
DScope of crisis Pr vate vs. Liquidity vs.pubic banks solvency crisis
Hungary LGS (1996), 1987- 8 banks, accounting for State and private Solvency 9% of 1993 GDPS&P (1997) Significant 25% of financial system commercial problems. was spent between
problems assets became banks. 1992-95; interest oninsolvent. debt issued to
support banksamounted to 1.75%of GOP in 1995.
CK (1996) 1991-95 1993: 8 banks (25% of Overall resolutionsystemic financial system assets) cost was
insolvent. approximately 10%of GDP.
DP (1 995) 1993- 12.2% of GDP
Kazakhstan LGS (1996), 1991-1995 45% of assets were Private Solvency 3-6% of the averageS&P (1997) Significant non-performing. commercial problems of 1994 and 1995
problems banks GDP.
Kyrgyz Rep. LGS (1996) 1995- 80-90% of loanswereSignificant doubfful; 4 small banksproblems closed were closed in
1995 and 2 large statebanks faced problemsin 1996.
Latvia LGS (1996), 1995-Crisis 2/3 of banks recorded Private banksS&P (1997) losses in 1994; 23
licenses were revokedin 1994-95; closure of 3major banks in 1995.
CK (1996) 1995 Crisis in 10 bankssystemic (accounting for 40% of
banking system assets)
Lithuania LGS (1996), 1 995-Crisis 12 small banks wereS&P (1997) liquidated, 4 larger
ones did not meetcapital adequacyrequirements; the fourthlargest bank wasclosed.
CK (1996) 1995-96 1995: crsis in 4 bankssystemic (including the largest in
the country).
Macedonia LGS (1996) 1993-1994 70% of loans were non-Crisis performing; the second
largest bank wasclosed.
Moldova LGS (1996) 1994- Substantial nonSignificant performing loans.problems
60

Appendix I
Appendix Table 1: Incidence of Banking Crises in Transition Countries
Country Study Period Magnitude of the crlsis Cost (existing________ _______________________________________estimates)
Scope of crisis Private vs. Liquidity vs.public banks solvency crisisaffected
Poland LGS (1996), 1991- 16% of loans were State and prvate Bonds issued toS&P (1997) Significant classified as losses, commercial recapitalize bank
problems 22% as doubtful, 24% banks, amounted to 2% ofas substardard in 1991. cooperatives, GDP in 1993-94.
specializedbanks
CK (1996) 1990s 1991: crisis in 7 of 9 1991: crisis in 7 1993:systemic treasury owned banks of 9 treasury recapitalization cost
(25% of banking owned banks & for severalsystem assets) & in in Bank for Food commercial banksBank for Food Economy and was $1.65 bin (ofEconomy and coooperative which 900 for Bankcoooperative banking banking sector for Food Economysector (20% of banking (private) and cooperativesystem assets) banking sector).
DP (1995) 1993- 5.7% of GDP
Romania LGS (1996) 1990- Five major state-owned StateSignificant commercial banks hadproblems 35% of their accrued
receivables overdue inJune 1994.
CK (1996) 1990-93 Many loans to state-systemic owned enterprises were
doubfful.
Russia LGS (1996), 1992- Loan arrears were 40%S&P (1997) Significant of total credit to private
problems sector in 1995.CK (1996) 1995 On August 24, 1995 the
systemic interbank loan marketstopped working.
Slovak Rep. LGS (1996) 1991-95 At the end of 1995 No bank runsSignificant nonstandard loansproblems were large; the 5 major
banks requiredgovernment sponsoredrestncturingoperations.
Slovenia LGS (1996) 1992-94 3 banks (accounting forSignificant 2/3 of banking systemproblems assets) were
restructured.
Tajikistan LGS (1996) 1996- One of the largest bankSignificant was insolvent; 2 smallproblems banks were dosed.
Uzbekistan LGS (1996) 1993- Almost 1 0% of loansSignificant were reported to beproblems overdue in 1995.
CK (1996): Capno G. and D. Klingebiel "Bank Insolvencies. Cross Country Experience", World Bank Policy ResearchWorking Paper No. 1620.DP (1997): Dziobek C. and C. Pazarbasioglu "Lessons from Systemic Bank restructurng: A Survey of 24 Countries",IMF Working Paper No. 97/161Daniel (1997): Daniel J. 'Fiscal Aspects of Bank Restructring", IMF Working Paper No. 97152LGS (1996): Lindgren, C-J, C. Garcia and M. I. Saal "Bank Soundness and Macroeconomic Policy",Internabonal Monetary Fund.S&P (1997): Standard & Poor, "Sovereign Ratings Services", December.
61

Appendix 2
Appendix Table 2: Institutional Framework of Banking Systems in Transition Economies
Date cnsis Banking Date Minimum Large Credit Open ForEx Loan Limits on Capital Connected EBRD Ranking of(distress) Supervision lAS in Capital Exposures positon limits classificabon equity holdings Adequacy lending Extensiveness andpeaked Institution force Requirement and in non-financial Requirement Effeceveness of
provisioning ent's Legat Rules'
Mom: ta; EU or 8*i S, E-CU 5 mm (EU) lwieng to a NA norecoiiarmd NA 8% irisk. toto l::n toinl tierat swadr4d Wd*OA)fortCtIt insder ruto
26%of to capes 4% fris arcea 2D% ocaptta| n= wsglsdf tita 0*toa EaIa
loans limit (818) Ise~~am N0% attta
ctliat8 for Tier
Bulgaria1996-97 BNB's Deputy 1998 BGL 10 min A 'large loan' Exposure in an Five categones Limit on BIS capital Total amount of Extensiveness: 4
Governor is in (minimum paid- (exceeding individual of exposures lending to adequacy loans to Effectiveness: 4-charge of the up capital) (est. 10% of bank's foreign have been single enacted 3/93. connectedBank byAug'97 own funds) to currency may determined: connected At end'98 CAR parties may notSupervision regulation). one party or not exceed standard, watch, party 50% of at 10%; at exceed 10% ofDepartment group of related 25% of bank's substandard, bank's capital; end'99 CAR at bank's paid-in
parties shall not own funds; net doubfful, and aggregate limit 12%. (all banks capital (est. byexceed 25% of open forex loss (est. by 75% of bank's are now in the Law onbank's own position may Aug'97 capital (as of compliance) Banks, Jul'97).funds.The total not exceed regulation). Dec'98)amount of 60% of own Provisioning'large loans' funds (est. by requirement: 3-shall not Jan'98 5%; 25%; 50%;exceed eight regulation). 75%; 100% oftimes the net valuebank's own according to thefunds (est. by category.Dec'97regulation).
Czech Republic1991-'93; CNB is NA CZK 500 mln Net credit ForEx position Watch claims; Prior approval Jan'96 BIS NA Extensiveness: 31996-'97 responsible (approximately exposure to in every substandard; is required if capital Effectiveness: 3-
for USD15 min) one party or currency is doubtful; loss bank is to requirementsupervising group of related limited to 15% (est. by Jul'94 acquire equity enactment; asbanking parties shall not of capital base regulabon). in excess of of 1999, CARactivities exceed 25% of (est. by Dec'95 10% in a non- 8%; on a risk-(since 1993) bank's own regulation). bank; on adjusted basis
funds.ln aggregateaddition, there equityare limits on participation inlending to non-banksconnected shall notfinancial and exceed 25% ofnon-financial bank's capitalentities. (est. by and reservesOct'95 (est. by theregulation, 1992 Act onamended in Banks,1996). amended
62

Appendix 2
Date crisis Banking Date Minimum Large Credit Open ForEx Loan Limits on Capital Connected EBRD Ranking of
(distress) Supervision lAS in Capital Exposures positon limits classification equity holdings Adequacy lending Extensiveness and
peaked Institution force Requirement and in non-financial Requirement LegalfRules-provisioning ent's
Hungary1992; 1995- State Banking 1996 HUF 3 bin for 25% for single Open ForEx general reserve Participation in Jan'93 BIS shall not exceed Extensiveness: 4
96 and Capital mortgage borrower; position may and general a non-bank capital 15% of bank's Effectiveness: 4
Markets banks, HUF 2 800% not exceed provision enterprise may adequacy own adjusted
Supervision bin for aggregate 30% of requirements not exceed enacted; as of capital (est. by
(BCMS) commeraal 'large loans' adjusted and provision 51% of bank's 1999 CAR 8%; the 1996 Act on
which reports banks, HUF 1 (est. by the capital requirements equity capital on a risk- Credit
to the bin for building 1996 Act on according to and total adjusted basis Institutions).
Govemment societies, HUF Credit laon category participation
and to the 100 min for Institutons). ('to be may not
NBH cooperative monitored exceed 60%
credit separately,' (est. by theinstitutions and 'substandard,' 1996 Act onHUF 20 mln for 'doubtful,' or Creditfinancial 'bad') (est. by Institutions).undertakings the 1993 decree
and the 1996Act on CreditInstitutions).
FYR Macedonia1994-'96 Central Bank 1996 denar 30% of bank's open ForEx NA NA May'93 limits on loans Extensiveness: 3
is the counterpart of guaranteed position in enactment of to insiders Effectiveness: 3-
supervisory DEM 7 mn; for capital limit on various BIS captial (management
authority international exposure to currencies requirement; and
operations single debtor; shall not employees).
requirement is 300% limit on exceed 30% ofDEM 21 mln aggregate bank's
exposure to guaranteedlarge debtors. capital; open
aggregatedenar positionno more than60% of bank'sguaranteedcapital.
Poland1992-94 Committee on 1994 ECU 5 min single 15% of gross level of no limit on a BIS capital loans to insiders Extensiveness: 4
Banking customer capital limit on provisions shall single adequacy shall not exceed Effectiveness: 3
Supervision exposure limit exposure on be determined shareholding adopted in 4% of own
at the of 15% of a any single on case-by-case but total equity 5/93. In 1999, funds
National Bank bank's capital currency; basis but shall holdings may CAR 8%, on a
of Poland base; exposure aggregate net not be lower notexceed risk-adjustedunder any position may than 20% for 25% of own basis for all
single not exceed substandard funds banksagreement may 30%; the loans, 50% for operating prior
be higher with maximum doubtful and to May'93; forNBP's consent, position in all 100% for loss newer bankshowever not to foreign loans (est. by CAR shall be atexceed 50%. currencies may Dec'94 15% in the first
not exceed regulation). year of40%. operations and
12% thereafter
63

Appendix 2
Date crisis Banking Date Minimum Large Credit Open For£x Loan Limits on Capital Connected EBRD Rankng of(distress) Supervision IAS in Capital Exposures positon lirnits classirication equity holdings Adequacy lending Extensiveness andpeaked Institution force Requirement and in non-financial Requirement Effectiveness of
provisioning ent's Legal Rules'
Estonia1992;1994 Bank 1995 minimum share Total exposure varable limits loans which are NA Sep'94 BIS Total credits Extensiveness: 3
Supervision capital to a single for different more than 150 capital granted to a Effectiveness: 3Department requirement customer may currencies (for days overdue requirement in bank's ownat the Bank of EEK 35 min as not exceed the currencies are to be effect; as of subsidiaries, itsEstonia of 1996; from 25% of bank's of non-Westem classified as 1999 CAR 10% holding
Jan'98 own funds. European EU bad and should (since 1997); company andrequirement for Total large countries and be witten off on a risk- the subsidiariesminimum own exposures may the US, adjusted basis of the holdingfunds (capital not exceed Canada, company mayand reserves) 800% of the Australia limit not exceed 20%is ECU 5 mmn; own funds of is 5% of own of its own funds.and the share the institution. funds, except There arecapital must be for Latvia and additional limitsat least ECU 5 Lithuania for on lending tomin by Jan'00. which the limit management
is 10%). and employees.
Latvia1995-96 As of 4199 1992 LVL 1 min 800% limit on Open ForEx 10% provisions From Oct'94 BIS capital 150 aggregate Extensiveness: 3
there were (Apr'96); LVL 2 the aggregate position in any for'watch' credit adequacy insider lending Effectiveness: 3plans to mln (Apr`98); exposure; 25% single currency category; 30% insttutions' requirement limit (sinceintroduce Euro 5 mn by exposure limit may not for participaton in introduced in Jan'96)unified December to a single exceed 10o% as 'substandard'; non-credit Jan'94; 10%supervision of 1999 as customer ora from Jan'96. 60% for instituftons may CAR as of 1999all financial required by the group of Total open 'doubtful'; 100% not exceedinstitutions. Law on Credit connected ForEx position for 'lost.' 15% of its own
Institutions (in customers; may not funds. Total1998, based on total exposures exceed 20%. amount of suchnon-audited to related (since Jan'96) participationfinancial persons may may not exeedstatements, not exceed 60%.nearly half of 15% of ownthe banks did funds.(sincenot sabsfy the Jan'96)requirement)
Lithuania1995-'96 BoL 1997 ECU 3.8 min may not overall open provisions for total sum of BIS capital total amount of Extensiveness: 3-
supervises from Jan'97 exceed 25% of position and standard assets participation in adequacy bank invesment Effectiveness: 2+banks until Jan'98; bank capital to precious 20%; doubfful non-banking requirement in shares ofthrough the requirement single borrower metals may not 40%; bad 100% institutions introduced in anotheroperation of was increased or group of exceed 30% of (as est. by shall not Mar'96; 10% enterprise mayits BSD. in Jan'98 to connected capital and in Apr'97 exceed 10% of CAR (since not exceed 10%
ECU 5 mln as borrowers; no individual regulation). core capital; Jan'97 and as of bank's corerequired by the aggregate limit currencies - banks can not of 1999; on a capital; bankLaw on Credit may not acquire rsk adjusted may not acquireInstitutions (in exceed 20% of controlling basis) controlling1998, based on capital interestin a interestinnon-audited non-banking anotherfinancial institution company (est.statements, by Law onnearly half of Commercialthe banks did Banks, firstnot satisfy the passed Dec'94requirement) and
subsequentlyamended).
64

Appendix 2
Date crisis Banking Date Minimum Large Credit Open ForEx Loan Limits on Capital Connected EBRD Ranking of(distress) Supervision lAS in Capital Exposures positon limits classirication equity holdings Adequacy lending Extensiveness and
peaked Institution force Requirement and in non-financial Requirement Efectiveness ofprovisioning ents Legal Rutes'
Georaia1995-97 propo- for new banks Total exposure no single 2% for NA Basle capital Extensiveness: 2
sad Lari 5 min; for to a single currency limit performing adequacy Effectiveness: 2date licensed banks customer may as of 1998 loans; 5-10% for requirement inDec US$0.25 min not exceed watch loans; 30- effect Sep'96;
'2000 (Dec'97); 1 5% of total 40% for sub- as of 1999 CARUS$0.5 mln capital; total standard loans; =12%; on a(Jun'98); Lari 1 lending to 1 0 50-70% for rsk-adjustedmin (Dec'9). . largest debtors doubfful loans; basis. Lari 5 min not to exceed 100% for loss(Dec'2000) 50% of total loans
loans
Kazakhstan1994-96 Bank 1997 $0.5 min -$3 limit on loans to NA NA NA NA limit on loans to Extensiveness: 2
Supervision () min depending individual single insider Effectiveness: 2Department on ownership borrower at 20% of bank'sat the central 40% of bank's assets;bank assets aggregate
maximum loansto insiders
_, ; ~~~~~~~~00%Kyrgvz Republic
1994-96 by the central 1997 prior to Oct`9B: prior to Oct'98: prior to Oct'98: NA NA 8% BIS capital loans to insiders Extensiveness: 3-bank between 15 25%; since 15% for single adequacy prior to Oct'98: Effectiveness: 2
min soms and Jan'99: 20% currency; 30% enacted in 15%; since30 min; since aggregate; June'95; Jan'99 Jan'99: 10%Jan'99: 25-40 since Jan'99: -12%mln soms 10% for singie
currency; 15%aggregate
Ukraine1995; 1996.Committeeon 1998 ECU 100,000 lending toa 20% of bank's NA 50% of total as of 1999, maximum Extensiveness: 2+'98 Banking (June'96); Ecu single outsider capital for each bank capital CAR 8%; or a allowed Effectiveness: 2
Supervision 500,000 at 25% of total single nsk-adjusted unsecured loan(at the central (Jan'97); EcL capital; currency; 40% basis to a singlebank) was 750,000 aggregate large general open shareholderestablished in (June'97): Ecu credit exposure forex position; (partner) - 50%1996 1,000,000 limit 800% of 10% limit for of histher equity
(Jan'98) total capital precious investment;metals aggregate - 5%
of bank's capital
Sources: Handbook on Central Banks of Central and Eastem Europe, Bank for International Settlements, August 1998 and EBRD 1998 Transition Report
For detailed explanation of the rankings see 1998 EBRD Transition report.
65

Appendix 3
Appendix Table 3:Inflation(Consumer prices annual percent change)
1990 1991 1992 1993 1994 1995 1996 1997 1998
Central and Eastern EuropeBulgaria 23.9 333.5 82.0 72.8 96.0 62.1 123.0 1082.2 22.3Czech Rep 10.8 56.6 11.1 20.8 10.0 9.1 8.8 8.4 10.7Hungary 28.6 34.8 22.8 22.4 18.8 28.3 23.5 18.3 14.2Macedonia 338.7 126.5 16.4 2.5 1.5 0.6Poland 585.8 70.3 43.0 35.3 32.2 27.9 19.9 15.0 11.7
BalticsEstonia 23.1 210.6 1069.0 89.0 47.7 28.9 23.1 11.2 8.2Latvia 10.5 124.4 951.3 109.1 35.8 25.1 17.6 8.4 4.7Lithuania 8.4 224.7 1020.5 410.4 72.1 39.5 24.7 8.8 5.1
CIsGeorgia 3 78.5 887.4 3125.4 15606.5 162.7 39.3 7.1 3.6Kazakhstan 91.0 1515.7 1662.3 1879.9 176.3 39.1 17.4 7.3Kyrgyz Rep. 85 854.6 772.4 228.7 52.5 30.4 25.5 12.0Ukraine 4.2 91.2 1209.9 4735.2 891.2 376.4 80.2 15.9 10.6
Source: World Economic Outlook (1998, 1999), International Monetary Fund; EBRD TransitionReports (1997, 1998).
66

Appendix 4
Appendix Table 4. Bonds for Bank Restructuring andDeposit Compensation - Technical Aspects
Country Date Issuer Currency Interest rate Maturity Purpose
Bulearia 1992 Govemment Local Central Bank basic rate + 15 years, with 4 Bank financial1%. years grace period. restructuring (swap for
bad assets).1993 Govemment Local Fraction of Central Bank 20 years, with 5 Bank financial
basic rate. years grace period. restructuring (swap forbad assets).
1994 Govemment Local Fraction of Central Bank 20 years, with 5 Bank financialbasic rate. years grace period. restructuring (swap for
bad assets).Govemment US Dollar 6-months LIBOR 20 years, with 5 Bank financial
years grace period. restructuring (swap forbad assets).
1995 Govemment Local Central Bank basic rate 3, 4, 5 years. Bank financialrestructuring (swap forbad assets).
1996 Govemment Local Central Bank basic rate 7 years. Deposit insuranceGovemment US Dollar 6-months LIBOR+ 2% 3 years. Deposit insurance
1997 Govemment Local Central Bank basic rate 7 years. Deposit insuranceGovemment US Dollar 6-months LIBOR+ 2% 3 years. Deposit insuranceGovemment US Dollar 18 months. Bank financial
restructuring (swap forbad assets).
1998 Govemment US Dollar 6-months LIBOR+ 2% 3 years. Deposit insurance
Czech Renublic
1991 National LocalProperty Fund
1992 National Local 5 years. Bank financialProperty Fund restructuring (partial
swap for bad assets).
Huneary1992 Government Local Bonds for principal claims 20, 25, 30 years. Bank financial
(A bonds): average yield on restructuring (swap for3 months Treasury Bills. bad assets) (LoanBonds for interest arrears Consolidation Program).(B bonds): 50% of intereston A bonds.
1993-94 Govemment Local Bank financialrestructuring(unrequited) (Bank-ledrestructuring and LoanConsolidation Program).
Macedonia1994 Bank Local Central Bank basic rate. 15 years. Recapitalization (swap
Rehabilitation for bad assets).Agency
67

Appendix 4
Appendix Table 4. Bonds for Bank Restructuring andDeposit Compensation -- Technical Aspects
Country Date Issuer Currency Interest rate Maturity Purpose
Poland1991 Govemment US Dollar 1991-95: 6-months 1-13 years. Cover foreign exchange
LIBOR+ 2%. From 1996: 6- losses accumulated bymonths LIBOR + 0.5%. banks on foreign
exchange deposits afterdevaluation.
1991-93 Govemment US Doliar I year. Transferred to PKO torefinance accrued andcapitalized interest onthe bank bad loans.
1993-94 Govemment Local Central Bank rediscount 15 years. Bank financialrate. restructuring
(unrequited) (Enterpriseand Bank RestructuringProgram).
Estonia1993 Govemment Local 10%(Forcomparison:int. 15years,with5 Bank financial
rate on loans over 5 years: years grace period. restructuring9.6%; int. rate on ovemight (unrequited).loans: 6.3%).
Govemment Local Bank financialrestructuring (swap forbad assets).
Latvia1993-94 Govemment Local 20% for the first year, Up to 7 years. Bank financial
thereafter 1.5%. restructuring (swap forbad assets).
Lithuania1996-98 Govemment Local Average term deposit rate 10 years. Bank financial
+1%. restructuring (swap forbad assets).
1997 Govemment Local Zero coupon bonds Deposit protection.
Kvr2vz Rep.1995-97 Govemment Local 5, 25, 50.64, 55.7 percent 6 months, 1, 5, 10, Bank financial
25 years. restructuring (swap forbad assets).
68

Appendix 5
Appendix Table 5: Ratio of Recapitalization Bonds to Bad Debtin Poland and Hungary
Poland(in bin old PLZ)
Total debt for restructuring (December 1994) 51,662o/w at 9 commercial banks 12,252
at specialized banks (PKO BP; BGZ; Pe Kao SA) 39,407
EBRP" bonds allocated (in old PLZ, bin)o/w at 9 commercial banks 11,000
at specialized banks:PKO BP 5,734BGZ 19,566Pe Kao SA 3,700
Subtotal: at specialized banks 29,000
Total: commercial and specialized banks 40,000
RATIO of bonds/debt at commertial bsaks 0.90
RAT10 of botds/debt at specialized bWaks 0.74
Sources: Authors' cacul uturis. Bac kgroundu nformationfrom Montes-Negret and others elr96j, p. 4)-tb,and Borish and others (1997).
Hungary1. 1991 ConsolidationAgreement (HUF 10.5 bin gurantee)
Government extended an HUF 10.5 bin guarantee that covered HUF 21 bin(HUF 21 bin constituted 2% of bad loans held by banks at year-end 1990)Bonds/Debt 8O.54
2. 1992 Loan Consolidation Scheme (HUF 98.6bln bonds covered HUF 120.5 bad loans held by banks)Bonds/Debt - OM*
3. '13+1 Program' (HUF 57 mln bonds)Swapped HUF 57 min in bonds for 90% of the book value of bank loans to 13 large enterprisesand the state railway companyBe#dw/Delm mcumtd at ", sine" the swap was for 90%/ of book value
4. 1993-1994 Bank Consolidation ProgranmThree infusions: HUF 114.4bin at the end of 1993 and HUF 50bIn in two tranche: in 5/94 and in 12/94.Bonds were allocated to cover capital deficiency which was estimated, based on end-93 data to be: HUF 139 bin *
Front the aboycestiated RATIO bods/debt (largely overstated) - .1f8
5. 'Good bank/Bad bank' approach:This approach was designed to avoid further fiscal costs.State owned bank MHB spun off HUF 82 bin of its bad assets to a newly created subsidiary bad bank, RiskKft, which was to be liquidated within 3 yrs. Risk Kft issued HUF II bin in 3 year bonds to MHB.Boiad&iebt -0.13
Sources: Authors' calculattons. Sources of background informailon: Montes-Negret and others (1996), Borish and others (1997).*Initially the government planned to swap pre-1992 enterprise debt for bonds so that bonds would cover 50% of the facevalue of debt, and loans extended during 1992 would cover 80% of the face value.
**By end-94 portfolio quality deteriorated again, so actual capital deficiency over the whole period is higher than 139 bin.See Borish, 1997, in: Most-Moct, p.56
69

Appendix 6
Appendix Table 6. Cost of Bank Restructuring for the Governmentand Central Bank (Consolidated)
(1991-1998)
1991 1992 1993 1994 1995 1996 1997 1998 TOTAL
BuleariaGovernment 0.0 2.1 10.9 23.1 0.3 3.3 1.9 0.0 29.8Bank restructuring 0.0 2.1 10.9 23.1 0.3 0.0 0.5 0.0 26.5Deposit Compensation 0.0 0.0 0.0 0.0 0.0 3.3 1.3 0.0 3.3Central Bank NA NA NA NA 2.8 6.6 2.2 -0.1 11.8Total 0.0 2.1 10.9 23.1 3.1 9.9 4.1 -0.1 41.6
Czech RepublicGovernment 14.9 1.8 3.6 1.0 0.3 0.1 0.7 1.0 20.6Central Bank 0.0 0.0 0.0 0.0 0.0 0.0 2.1 2.9 4.8Total 14.9 1.8 3.6 1.0 0.3 0.1 2.8 3.9 25.4
HungaryGovernment 0.0 2.8 3.6 2.1 0.2 0.2 0.1 1.7 12.9Central Bank 0.0 0.0 0.0 0.0 0.0 0.0 0.0 0.0 0.0Total 0.0 2.8 3.6 2.1 0.2 0.2 0.1 1.7 12.9
MacedoniaGovernment 0.0 0.0 0.0 3.3 0.0 0.0 0.2 NA 29.6Bank restructuring 0.0 0.0 0.0 3.3 0.0 0.0 0.0 0.0 5.1Deposit Compensation 0.0 0.0 0.0 0.0 0.0 0.0 0.2 0.0 24.5Central Bank 0.0 0.0 0.0 0.0 0.0 0.6 0.0 0.0 0.7Total 0.0 0.0 0.0 3.3 0.0 0.6 0.2 NA 30.3
PolandGovernment 7.1 0.0 1.3 0.8 0.0 0.0 0.0 0.0 8.2Central Bank NA NA NA NA NA NA NA NA 0.5Adjustment (-) 1.6 0.1 0.1 0.1 0.1 0.0 0.0 0.0 1.3Government bonds 1.5 0.0 0.0 0.0 0.0 0.0 0.0 0.0 1.3placed in central bankInterest payments to 0.1 0.1 0.1 0.1 0.1 0.04 0.03 0.02central bankTotal NA NA NA NA NA NA NA NA 7.4
EstoniaGovernment 0.0 0.0 2.0 0.0 0.0 0.4 0.0 0.0 1.4Central Bank 0.0 0.0 0.0 0.7 0.3 0.0 0.2 0.0 0.8Adjustment (-) 0.0 0.0 0.0 0.0 0.0 0.4 0.0 0.0 0.3Total 0.0 0.0 2.0 0.7 0.4 0.0 0.2 0.0 1.9
LatviaGovernment 0.0 0.0 1.6 1.9 0.0 0.00 0.00 0.00 2.54Bank restructuring 0.0 0.0 1.6 1.9 0.00 0.00 0.00 0.00 2.5Deposit compensation 0.0 0.0 0.0 0.0 0.04 0.0 0.0 0.0 0.04Central Bank 0.0 0.0 0.0 0.0 0.1 0.0 0.0 0.0 0.1Total 0.0 0.0 1.6 1.9 0.2 0.0 0.0 0.0 2.7
70

Appendix 6
Appendix Table 6. Cost of Bank Restructuring for the Governmentand Central Bank (Consolidated)
(1991-1998)
1991 1992 1993 1994 1995 1996 1997 1998 TOTAL
LithuaniaGovernment 0.0 0.0 0.0 0.0 0.0 1. 1.4 0.5 3.0Bank restructuring 0.0 0.0 0.0 0.0 0.0 0.7 0.5 0.5 1.7Deposit compensation 0.0 0.0 0.0 0.0 0.0 0.3 0.9 0.0 1.3Central Bank 0.0 0.0 0.0 0.0 0.0 0.1 0.1 0.0 0.2Total 0.0 0.0 0.0 0.0 0.0 1.1 1.5 0.5 3.1
GeorgiaGovernment 0.0 0.0 0.0 0.0 0.0 0.0 0.0 0.1 0.1Central Bank NA NA NA NA NA NA NA NA NATotal 0.0 0.0 0.0 0.0 0.0 0.0 0.0 0.1 0.1
KazakhstanGovernment 0.0 0.0 0.0 0.0 11.0 0.1 0.4 0.0 18.4Central Bank NA NA NA NA NA NA NA NA NATotal 0.0 0.0 0.0 0.0 11.0 0.1 0.4 0.0 18.4
Kyr2vz RepublicGovernment 0.0 0.0 0.0 0.0 0.1 4.3 1.0 0.0 4.9Bank restructuring 0.0 0.0 0.0 0.0 0.1 4.3 0.7 0.0 4.4Deposit compensation 0.0 0.0 0.0 0.0 0.0 0.0 0.3 0.0 0.5Central Bank 0.0 0.0 0.0 Q.0 0.0 4.3 0.0 0.0 8.9Adjustment (-) 0.0 0.0 0.0 0.0 0.0 4.3 0.2 0.1 3.3Government bonds 0.0 0.0 0.0 0.0 0.0 4.3 0.0 0.0 3.3placed in central bankInterest payments to 0.0 0.0 0.0 0.0 0.0 0.0 0.2 0.1central bankTotal 0.0 0.0 0.0 0.0 0.1 4.3 0.8 -0.1 10.6
71

Appendix 7
Appendix Table 7Debt Incurred due to Banking Crises and Central Government Debt
End-1998
Central Government Recapitalization and Bank Crises-Debt Depositor Related
Compensation Bonds Bonds/CentralGovernment
DebtBulgaria 76.0 7.3 10.6%Hungary 60.6 4.0 7.1%Poland 43.1 2.3 5.6%Estonia 7.4 0.5 7.2%Lithuania 22.7 2.1 10.2%Kyrgyz Republic 65.5 3.3 5.3%
72

Appendix 8
Appendix Table 8. Asset Management Companies and Bad Debt Recoveries
Date of Size of bad assets at AMC* Recovery Rate Commentsactivity (Loans
Recovered/TotalFace Value of Bad
________________ Loans)(in LCU) (as % of GDP)
Czech RepublicKonsolidacny Banka 1991 - around 25% around 3-5% after 5-7 Source: KoB publications(KoB) present years of bankruptcy and World Bank.
workCeska Inkasni 1993 - NA
presentCeska Financni 1996 - NA Ceska Financni (CF) only
present manages loans that remainat core banks subject tocontracts with CF.Management expectedrecoveries to be low due totheir nature (many assetswere the results of criminalactivity) (source: 1999Czech Republic WB countrystudy, p. 113)
HungaryMBFB Rt 1991 - 1/3ofHUF 0.01%of1992GDP 16% Source: Johnson, 1999,
present 120.5 bln in "State-owned EnterpriseNPLs = HUF Insolvency: Treatment of
40 bln Financial Distress",September, the World Bank.
Risk Kft (bad bank 1996 - HUF 82 bin 0.0 1% of 1996 GDP NAspun offfrom 1999Magyar Hitel Banka)
MacedoniaBRA 1994 - around 13 bln 0.1% of 1994 GDP no quantitative BRA was not successful in
present denars"* information is restructuring or liquidatingavailable enterprises.
EstoniaSocial Bank's "bad March about EEK 0.002% of 1995 NAbank" 1995 - 80 mln GDP
August1996
LithuaniaTurtobankas 1996 - 1,215 mln Ltl 3.85% of 1996 GDP 5.27% after 4 years If market value of the bad
present of bankruptcy work loans were used, therecovery rate would havebeen 36.5%. (Source:Turtobankas).
73

Appendix 8
Date of Size of bad assets at AMC* Recovery Rate Commentsactivity (Loans
Recovered/TotalFace Value of Bad
Loans)
Kazakhstan
Eximbank 1994 - Tenge 25.4 6% NA Eximbank manages badpresent bln loans on an agency basis
and receives incentives forloan collection.
Agricultural Support 1994 - Tenge 16.9 4% NAFund present blnRehabilitation Bank 1994 - Tenge 4.2 bln 1% NA Return on sale of 14 specific(RB) present assets in 1999 was relatively
low at only 15.6%. RB hasbeen quite successful inulfulling the objective of
restructuring and liquidatingenterprises: out of 44enterprises RB initiatedliquidation proceduresagainst 4 insolvententerprises; implementedsevere reductions in staff (anaverage of 34.4%): pursuedrestructuring of 14enterprises; andrivatization and transfer
under management contractsof26 enterprises (Source:World Bank ICR FSALdocument, 1998).
Total 11%Kyrgyz RepublicDEBRA 1996 - 1.3 bln soms 0.06% of 1996 GDP 10% The ratio of 10% was
present calculatedfrom: "the totalamount of bad debtstransferred to DEBRA was1.3 bln som in 1997, and in1998 DEBRA returned 99.4mln som to creditors. "(Source: OxfordAnalvticaBrief June 30, 1999"Kyrgyzstan: Banking
_______ ....______ .______________ ._______ .________ Regulation').
*For all countries except for Czech Republic this indicates size of assets transferred to AMC. For Czech Republic, onlydata for total assets managed by AMC were available. Since Konsolidacny Banka has a broader mandate than justmanaging bad assets, the total assets may include assets other than nonperforming loans.**Figure refers to bad asset transfer in 1994; no information was available about subsequent bad asset transfers.
74

Appendix 9
Appendix Table 9: Interest Rate Spreads /1(Percent per annum)
1990 1991 1992 1993 1994 1995 1996 1997 1998
Central and Eastern EuropeBulgaria 8.9 11.7 15.7 21.4 23.0 48.8 37.1 10.3Czech Rep. 7.0 6.0 5.8 5.8 5.5 4.7Hungary 4.1 4.7 8.6 9.8 7.1 6.5 5.1 3.2Macedonia 42.3 21.9 8.8 9.8 9.4Poland 462.5 1.1 1.3 1.3 -0.6 6.7 6.1 5.6 6.3
BalticsEstonia 11.6 7.2 7.6 13.6 8.6Latvia 51.6 24.2 19.8 14.1 9.4 9.0Lithuania 3.5 13.9 7.0 7.6 6.5 6.2
CIsGeorgia 27.2 36.9 29.0KazakhstanKyrgyz Rep. 28.3 9.8 37.7Ukraine 35.6 41.7 52.4 46.3 30.9 32.2
OECD 5.2 5.4 5.4 4.7 4.2 4.4 4.3 4.2Countries /2/I Lending minus deposit rate./2 Data for high-income OECD countries except for Austria (all years), Iceland (1993-94) and US (allyears) for which data is not available.Source: International Monetary Fund, "International Financial Statistics."
75

Appendix 10
Appendix Table 10: Central Bank Credit to Banks(Percent of GDP)
1990 1991 1992 1993 1994 1995 1996 1997 1998
Central and Eastern EuropeBulgaria 18.8 10.3 10.7 10.4 5.0 15.0 2.0 1.2Czech Rep. 7.8 6.6 5.4 5.4 6.0 4.1Hungary 16.9 16.7 10.0 10.4 9.3 5.4Macedonia 3.1 1.7 3.1 3.6 2.2 2.0Poland 13.6 9.3 4.2 4.1 3.3 2.7 2.9 2.1
BalticsEstonia 15.0 4.4 2.7 1.6 0.5 0.3 0.1 0.4Latvia 0.9 1.0 0.9 0.7 0.2 1.4Lithuania 2.5 0.9 0.7 0.4 0.2 0.1
CisGeorgia 0.1 0.2 0.1 0.1Kazakhstan 20.7 3.2 1.0 0.6 0.5 0.1Kyrgyz Rep. 7.1 0.6 0.3 1.0Ukraine 37.2 10.0 2.8 1.2 1.1 1.7
OECD 2.1 2.4 2.8 2.8 2.2 2.2 1.9 1.8Countries /1/1 Data for high-income OECD countries except for Austria, Canada, Germany (1990), Ireland (allyears) and US (all years) for which data is not available.Source: International Monetary Fund, "International Financial Statistics."
76

Appendix 11
Appendix Table 11: Currency to Deposit ratio(End of Period, Percent)
1990 1991 1992 1993 1994 1995 1996 1997 1998
Central and Eastern EuropeBulgaria 91.6 92.5 100.1 102.6 133.2 114.8 134.6 160.7Czech Rep. 28.1 26.1 31.9 35.7 39.6 45.9Hungary 68.2 74.1 66.4 69.9 72.9 75.8Macedonia 93.6 92.4 95.3 118.8 99.9 87.2Poland 71.6 108.8 108.9 103.3 80.9 109.1 81.9 79.2 72.9
BallicsEstonia 41.1 57.4 85.7 96.4 87.2 65.5 53.1 55.3Latvia 132.8 154.3 145.3 163.3 141.8 130.3Lithuania 82.8 116.9 120.6 111.0 98.5 101.1
CIsGeorgia 406.8 492.4 619.0 551.5Kazakhstan 38.4 57.6 71.2 82.0 159.7 137.4Kyrgyz Rep. 355.8 505.8 606.4 746.4Ukraine 30.5 59.6 74.3 127.4 177.6 210.1 225.8
OECD 47.5 44.6 41.9 41.4 37.6 35.4 33.3 32.9Countries /1/I Data for high-income OECD countries except for Sweden (all years), UK (all years), andLuxembourg (1993) for which data is not available.Source: International Monetary Fund, "International Financial Statistics."
77

Appendix 12
Appendix Table 12: M1/M2(In Percent)
1990 1991 1992 1993 1994 1995 1996 1997 1998
Central and Eastern EuropeBulgaria 25.4 25.3 21.7 18.5 18.9 19.0 39.8 44.7Czech Rep. 38.6 48.1 39.7 39.1 35.6 33.3Hungary 56.6 51.7 53.6 51.3 49.0 43.8Macedonia 13.0 53.9 59.2 57.7 54.3 52.4Poland 49.5 41.3 36.4 35.1 35.5 35.9 38.3 35.0 32.5
BalticsEstonia 31.4 71.8 86.1 79.9 79.4 76.2 67.8 61.3Latvia 57.7 50.3 64.5 64.6 63.0 62.7Lithuania 65.3 56.8 62.1 66.6 70.3 66.9
CIsGeorgiaKazakhstan 87.2 79.9Kyrgyz Rep. 89.4 90.8 74.0 64.8Ukraine 82.1 71.0 57.8 67.7 67.5 72.2 67.4
OECD 30.4 31.8 32.0 33.3 32.4 32.8 33.8 34.5Countries /1/IData for high-income OECD countries except for Sweden (all years) and UK (all years) for whichdata is not available.Source: International Monetary Fund, "International Financial Statistics."
78

Policy Research Working Paper Series
ContactTitle Author Date for paper
WPS2468 Pricing, Subsidies, and the Poor: Ian Walker November 2000 S. DelgadoDemand for Improved Water Services Fidel Ordohez 37840in Central America Pedro Serrano
Jonathan Halpern
WPS2469 Risk Shifting and Long-Term Mansoor Dailami November 2000 W. NedrowContracts: Evidence from the Robert Hauswald 31585Ras Gas Project
WPS2470 Are Larger Countries Really More Stephen Knack November 2000 P. Sintim-AboagyeCorrupt? Omar Azfar 38526
WPS2471 Validating Operational Food Luc J. Christiaensen November 2000 L. ChristiaensenInsecurity Indicators against a Richard N. Boisvert 81463Dynamic Benchmark: Evidence John Hoddinottfrom Mali
WPS2472 Uzbekistan and Kazakkhstan: Asad Alam November 2000 L. HensonA Tale of Two Transition Paths Arup Banerji 84026
WPS2473 Banking Risks around the World: Luc Laeven November 2000 R. VoThe Implicit Safety Net Subsidy 33722Approach
WPS2474 Exports and Information Spillovers Alessandro Nicita November 2000 L. TabadaMarcelo Olarreaga 36896
WPS2475 Industrial Growth and the Quality of David A. Grigorian November 2000 A. NelsonInstitutions: What Do (Transition) Albert Martinez 37117Economies Have to Gain from theRule of Law?
WPS2476 Measuring Banking Efficiency in the Cevdet Denizer November 2000 M. DingPre- and Post-Liberalization Mustafa Ding 36233Environment: Evidence from the Murat TarimcilarTurkish Banking System
WPS2477 Picking the Poor: Indicators for Norbert R. Schady November 2000 T. GomezGeographic Targeting in Peru 32127
WPS2478 Institutions, Politics, and Contracts: Lorena Alcazar November 2000 P. Sintim-AboagyeThe Attempt to Privatize the Water Lixin Colin Xu 37644and Sanitation Utility of Lima, Peru Ana Maria Zuluaga
WPS2479 Estimating the Effects of Corruption: Aminur Rahman November 2000 S. PowellImplications for Bangladesh Gregory Kisunko 33526
Kapil Kapoor

Policy Research Working Paper Series
ContactTitle Author Date for paper
WPS2480 Productivity Growth and Resource Mubarik Ali November 2000 D. ByerleeDegradation in Pakistan's Punjab: Derek Byerlee 87287A Decomposition Analysis
WPS2481 Foreign Direct Investment in Africa: Jacques Morisset November 2000 N. BusjeetPolicies Also Matter 33997
WPS2482 Can Institutions Resolve Ethnic William Easterly November 2000 K. LabrieConflict? 31001
WPS2483 The Credit Crunch in East Asia: Pierre-Richard Agenor November 2000 M. GosiengfiaoWhat Can Bank Excess Liquid Joshua Aizenman 33363Assets Tell Us? Alexander Hoffmaister