BANK ONE CORPORATION INDEX TO FINANCIAL REVIEW · 51 Operational Risk Management 52 Credit...
79
24 Selected Financial Information 25 Other Financial Data 25 Description of Business 26 Business Segments 26 Business Segment Results and Other Data 43 Consolidated Results 47 Risk Management 47 Liquidity Risk Management 48 Market Risk Management 50 Credit Risk Management 51 Operational Risk Management 52 Credit Portfolio Composition 56 Asset Quality 61 Derivative Financial Instruments 64 Loan Securitizations and Off-Balance Sheet Activities 67 Capital Management 69 Forward-Looking Statements 70 Consolidated Financial Statements 74 Notes to Consolidated Financial Statements 100 Report of Management 100 Report of Independent Public Accountants 101 Selected Statistical Information BANK ONE CORPORATION INDEX TO FINANCIAL REVIEW BANK ONE CORPORATION 23 2001 ANNUAL REPORT
Transcript of BANK ONE CORPORATION INDEX TO FINANCIAL REVIEW · 51 Operational Risk Management 52 Credit...
24 Selected Financial Information
25 Other Financial Data
25 Description of Business
26 Business Segments
26 Business Segment Results and Other Data
43 Consolidated Results
47 Risk Management
47 Liquidity Risk Management
48 Market Risk Management
50 Credit Risk Management
51 Operational Risk Management
52 Credit Portfolio Composition
56 Asset Quality
61 Derivative Financial Instruments
64 Loan Securitizations and Off-Balance Sheet Activities
67 Capital Management
69 Forward-Looking Statements
70 Consolidated Financial Statements
74 Notes to Consolidated Financial Statements
100 Report of Management
100 Report of Independent Public Accountants
101 Selected Statistical Information
BANK ONE CORPORATION
INDEX TO FINANCIAL REVIEW
B A N K O N E C O R P O R A T I O N 23 2 0 0 1 A N N U A L R E P O R T

B A N K O N E C O R P O R A T I O N 24 2 0 0 1 A N N U A L R E P O R T
SELECTED FINANCIAL INFORMATIONBANK ONE CORPORATION and Subsidiaries
(In millions, except ratios and per share data) 2001 2000 1999 1998 1997Income Statement Data:Total revenue, net of interest expense $««15,861 $÷13,926 $÷17,713 $÷17,418 $÷16,155
Net interest income–fully taxable-equivalent (“FTE”) basis 8,769 8,974 9,142 9,469 9,619
Noninterest income 7,223 5,090 8,692 8,071 6,694
Provision for credit losses 2,510 3,398 1,249 1,408 1,988
Noninterest expense 9,551 11,608 11,490 11,545 9,740
Income (loss) before cumulative effect of change in accounting principle 2,682 (511) 3,479 3,108 2,960
Net income (loss) 2,638 (511) 3,479 3,108 2,960
Per Common Share Data:Income (loss) before cumulative effect of change
in accounting principle:Basic $÷÷÷2.28 $÷÷«(0.45) $÷÷÷2.97 $÷÷÷2.65 $÷÷÷2.48
Diluted (1) 2.28 (0.45) 2.95 2.61 2.43
Net income (loss):Basic $÷÷÷2.25 $÷÷«(0.45) $÷÷÷2.97 $÷÷÷2.65 $÷÷÷2.48
Diluted (1) 2.24 (0.45) 2.95 2.61 2.43
Cash dividends declared 0.84 1.26 1.68 1.52 1.38
Book value 17.33 15.90 17.34 17.31 16.03
Balance Sheet Data–Ending Balances:Loans:
Managed $218,102 $236,492 $229,196 $216,391 $196,993
Reported 156,733 174,251 163,877 155,398 159,579
Deposits 167,530 167,077 162,278 161,542 153,726
Long-term debt (2) 43,418 40,911 35,435 22,298 21,546
Total assets:Managed 306,304 309,096 315,064 305,781 278,439
Reported 268,954 269,300 269,425 261,496 239,372
Common stockholders’ equity 20,226 18,445 19,900 20,370 18,724
Total stockholders’ equity 20,226 18,635 20,090 20,560 19,050
Credit Quality Ratios:Net charge-offs to average loans–managed (3) 2.53% 2.03% 2.13% 2.00% 2.07%
Allowance for credit losses to period-end loans 2.89 2.36 1.39 1.46 1.77
Nonperforming assets to related assets 2.35 1.48 1.02 0.83 0.68
Financial Performance Ratios:Return (loss) on average assets 0.98% (0.19)«% 1.36% 1.30% 1.29%
Return (loss) on average common equity 13.4 (2.7) 17.1 15.9 15.8
Net interest margin:Managed 4.89 4.76 5.37 5.56 5.50
Reported 3.69 3.72 4.09 4.52 4.75
Efficiency ratio:Managed 49.2 66.7 54.5 57.6 53.2
Reported 59.7 82.5 64.4 65.8 59.7
Capital Ratios:Risk-based capital:
Tier 1 8.6% 7.3% 7.7% 7.9% 8.2%
Total 12.2 10.8 10.7 11.3 12.3
Tangible common equity/tangible managed assets 5.9 5.5 5.7 5.8 6.2
Common Stock Data:Average shares outstanding:
Basic 1,166 1,154 1,168 1,170 1,176
Diluted (1) 1,174 1,154 1,178 1,189 1,213
Stock price, year-end $««÷39.05 $÷÷36.63 $÷÷32.00 $÷÷51.06 $÷÷49.37
Stock dividends – – – 10% –
Employees (4) 73,519 80,778 87,735 92,800 95,900
(1) Common equivalent shares and related income were excluded from the computation of diluted loss per share for the year-ended December 31, 2000 as the effect was antidilutive.
(2) Includes trust preferred capital securities.
(3) The year ended December 31, 2001 includes $92 million of charge-offs which are not classified as such in the Corporation’s GAAP financial information because theyare part of a portfolio which has been accounted for as loans held at a discount. The inclusion of this amount in charge-offs more accurately reflects the credit per-formance of the portfolio. In the Corporation’s financial statements, this item results in a higher provision in excess of net charge-offs.
(4) Beginning in 2001, employees on long-term disability and employees of unconsolidated subsidiaries are excluded. Prior period data have not been reclassified for this change.
B A N K O N E C O R P O R A T I O N 25 2 0 0 1 A N N U A L R E P O R T
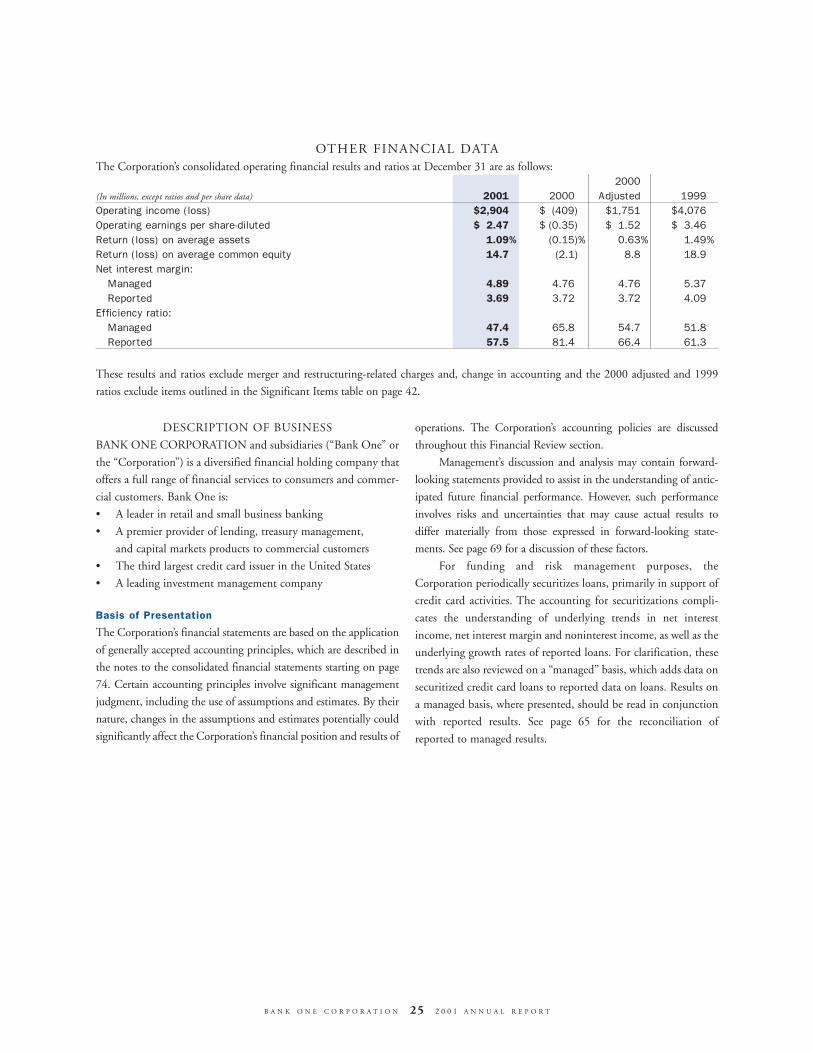
OTHER FINANCIAL DATAThe Corporation’s consolidated operating financial results and ratios at December 31 are as follows:
2000(In millions, except ratios and per share data) 2001 2000 Adjusted 1999Operating income (loss) $2,904 $««(409) $1,751 $4,076
Operating earnings per share-diluted $««2.47 $«(0.35) $««1.52 $««3.46
Return (loss) on average assets 1.09% (0.15)«% 0.63% 1.49%
Return (loss) on average common equity 14.7 (2.1) 8.8 18.9
Net interest margin:Managed 4.89 4.76 4.76 5.37
Reported 3.69 3.72 3.72 4.09
Efficiency ratio:Managed 47.4 65.8 54.7 51.8
Reported 57.5 81.4 66.4 61.3
These results and ratios exclude merger and restructuring-related charges and, change in accounting and the 2000 adjusted and 1999
ratios exclude items outlined in the Significant Items table on page 42.
DESCRIPTION OF BUSINESS
BANK ONE CORPORATION and subsidiaries (“Bank One” or
the “Corporation”) is a diversified financial holding company that
offers a full range of financial services to consumers and commer-
cial customers. Bank One is:
• A leader in retail and small business banking
• A premier provider of lending, treasury management,
and capital markets products to commercial customers
• The third largest credit card issuer in the United States
• A leading investment management company
Basis of Presentation
The Corporation’s financial statements are based on the application
of generally accepted accounting principles, which are described in
the notes to the consolidated financial statements starting on page
74. Certain accounting principles involve significant management
judgment, including the use of assumptions and estimates. By their
nature, changes in the assumptions and estimates potentially could
significantly affect the Corporation’s financial position and results of
operations. The Corporation’s accounting policies are discussed
throughout this Financial Review section.
Management’s discussion and analysis may contain forward-
looking statements provided to assist in the understanding of antic-
ipated future financial performance. However, such performance
involves risks and uncertainties that may cause actual results to
differ materially from those expressed in forward-looking state-
ments. See page 69 for a discussion of these factors.
For funding and risk management purposes, the
Corporation periodically securitizes loans, primarily in support of
credit card activities. The accounting for securitizations compli-
cates the understanding of underlying trends in net interest
income, net interest margin and noninterest income, as well as the
underlying growth rates of reported loans. For clarification, these
trends are also reviewed on a “managed” basis, which adds data on
securitized credit card loans to reported data on loans. Results on
a managed basis, where presented, should be read in conjunction
with reported results. See page 65 for the reconciliation of
reported to managed results.

BUSINESS SEGMENTS
The Corporation is managed on a line of business basis. The business segments’ financial results presented reflect the current organiza-
tion of the Corporation. The following table summarizes certain financial information by line of business for the periods indicated.
B A N K O N E C O R P O R A T I O N 26 2 0 0 1 A N N U A L R E P O R T
Operating/Net Income (Loss) Average Managed Assets(In millions) (In billions)
2001 (1) 2000 (2) 1999 2001 2000 1999Retail $1,272 $÷÷414 $1,041 $««78.9 $««79.0 $««72.5
Commercial Banking 721 (115) 906 104.2 114.5 109.7
First USA 946 3 1,135 68.7 70.0 74.9
Investment Management 374 322 317 8.1 7.6 7.1
Corporate (409) (1,033) 677 47.5 43.9 38.0
Total business segment operating income (loss), net of tax 2,904 (409) 4,076 $307.4 $315.0 $302.2
Accounting change, net of tax (44) – –
Merger and restructuring-related charges, net of tax (222) (102) (351)
Other significant items, net of tax – – (246)
Total Corporation net income (loss) $2,638 $÷«(511) $3,479
(1) During 2001, the tax-oriented portfolio of Corporate Investments was transferred to Commercial Banking, while the principal investments and fixed income portfolios were transferred to Corporate. All results for prior periods conform to the current line of business organization.
(2) Beginning in the second quarter of 2000, the provision for credit losses was fully allocated to the appropriate lines of business. Prior to the second quarter of 2000, the business’ provision was based upon standard credit costs, with any difference between the aggregate provision of the businesses and the Corporation’s total reflected in Corporate.
Description of Methodology
The results of the business segments are intended to reflect each asif it were a stand-alone business. The management reportingprocess that derives these results allocates income and expensesusing market-based methodologies. Funds transfer pricing is usedto allocate interest income and expense to each line of business. Aportion of the Corporation’s interest rate risk position is currentlyincluded in Corporate.
Historically, the costs of certain support units were allocatedto the lines of business based on factors other than usage, such asheadcount and total assets. The methodology was changed in thethird quarter of 2000 to better reflect the actual cost and usage ofservices provided and was consistently applied to all lines of busi-ness. Costs allocated to First USA decreased, while unallocatedcosts that are included in Corporate increased.
The lines of business are assigned capital that reflects the under-lying risk in that business. See the “Capital Management” section onpage 67 for a discussion of the economic capital framework.
For 1999, the effect of certain identified transactions were notattributed to any business segment since they were not considereda part of core business activities.
BUSINESS SEGMENT RESULTS AND OTHER DATAThe information provided in the line of business tables beginningwith the caption entitled “Financial Performance” is includedherein for analytical purposes only and is based on managementinformation systems, assumptions and methodologies that areunder continual review.
The financial information and supplemental data presentedin the tables below for the respective lines of business are reportedon an actual basis. However, to assist with the analysis of underly-ing trends, the discussion of business segment results excludesmerger and restructuring-related charges and the impact of the2000 and 1999 significant items noted in the “Significant Items”section on pages 41–42.

Retail
Retail provides a broad range of financial products and services,including deposits, investments, loans, insurance, and interactivebanking to nearly 7.3 million households and 500,000 small busi-ness customers, over 1 million of whom are registered online users.
Products and services are delivered to customers throughapproximately 33,000 employees, 1,800 branches in 14 states, alarge network of ATM’s, bankone.com, and 24-hour telephone
banking. THE ONE Card, issued by Retail, is one of the country’sleading debit cards for individuals and small businesses, with 4.4million cards issued.
Retail originates consumer credit nationwide through itsbanking centers, relationships with brokers, the Internet, and thetelephone. Retail offers real estate-secured, education, tax refund,consumer installment loans, and auto loans and leases to individuals.Retail is also a leading lender to small businesses.
B A N K O N E C O R P O R A T I O N 27 2 0 0 1 A N N U A L R E P O R T
(Dollars in millions) 2001 2000 1999Net interest income-FTE $÷5,025 $÷4,895 $÷4,379
Banking fees and commissions (1) 458 473 N/ACredit card revenue (2) 164 144 N/AService charges on deposits (3) 795 767 N/AFiduciary and investment management fees (4) – 1 N/AOther income (loss) 25 (767) N/A
Noninterest income 1,442 618 1,541
Total revenue 6,467 5,513 5,920
Provision for credit losses 1,010 870 415
Salaries and employee benefits 1,492 1,552 N/AOther expense 1,985 2,443 N/A
Noninterest expense 3,477 3,995 3,933
Operating pretax income-FTE 1,980 648 1,572
Tax expense and FTE adjustment 708 234 531
Operating income 1,272 414 1,041
Merger and restructuring-related charges, net of tax (66) (25) –
Net income $÷1,206 $÷÷«389 $÷1,041
FINANCIAL PERFORMANCE:Return on equity (5) 21% 7% 23%
Efficiency ratio (5) 54 72 66
Headcount–full-time (6) 33,155 35,759 N/A
ENDING BALANCES (in billions):Small business commercial $÷÷12.3 $««««12.1 N/AHome equity 30.3 31.4 N/AVehicles:
Loans 13.5 14.3 N/ALeases 6.1 8.8 N/A
Other personal 9.8 10.7 N/ATotal loans ÷÷ 72.0 ÷÷77.3 N/A
Assets 76.2 80.0 N/A
Demand deposits 25.8 24.9 N/ASavings 36.1 32.0 N/ATime 25.6 32.2 N/A
Total deposits 87.5 89.1 N/A
Equity 6.3 5.9 N/A

B A N K O N E C O R P O R A T I O N 28 2 0 0 1 A N N U A L R E P O R T
(Dollars in millions) 2001 2000 1999
AVERAGE BALANCES (in billions):Small business commercial $««12.2 $««11.7 $««11.0
Home equity 30.8 27.7 20.1
Vehicles:Loans 13.9 14.3 13.2
Leases 7.3 9.9 10.2
Other personal 10.5 11.0 11.6
Total loans 74.7 74.6 66.1
Assets 78.9 79.0 72.5
Demand deposits 24.2 24.6 N/ASavings 34.1 33.4 N/ATime 29.4 30.4 N/A
Total deposits 87.7 88.4 89.1
Equity 6.2 5.8 4.6
CREDIT QUALITY (in millions):Net charge-offs:
Small business commercial $«««««71 $÷÷«44 N/AHome equity 375 181 N/AVehicles:
Loans (7) 246 138 N/ALeases 99 70 N/A
Other personal 122 109 N/ATotal consumer (7) 842 498 N/A
Total net charge-offs (7) «« «913 ÷«542 N/A
Net charge-off ratios:Small business commercial 0.58% 0.38% N/AHome equity 1.22 0.65 N/AVehicles:
Loans (7) 1.77 0.97 N/ALeases 1.36 0.70 N/A
Other personal 1.16 1.00 N/ATotal consumer (7) 1.35 0.79 N/A
Total net charge-offs (7) 1.22 0.73 N/A
Nonperforming assets:Small business commercial $«««329 $÷«215 N/A Consumer (8) 1,041 697 N/A
Total nonperforming loans 1,370 912 N/A Other, including Other Real Estate Owned (“OREO”) 104 83 N/A
Total nonperforming assets 1,474 ÷«995 N/A
Allowance for credit losses $1,040 $÷«846 N/A Allowance to period-end loans 1.44% 1.09% N/AAllowance to nonperforming loans 76 93 N/ANonperforming assets to related assets 2.04 1.29 N/A
DISTRIBUTION:Banking centers 1,802 1,810 1,854
ATMs 5,141 6,055 6,824
# On-line customers (in thousands) 1,083 918 488
# Households (in thousands) 7,258 7,679 N/A # Business customers (in thousands) 508 519 N/A# Debit cards issued (in thousands) 4,414 4,159 N/A
INVESTMENTS:Investment sales volume (in millions) $4,867 $4,272 4,077
N/M–Not meaningful.
N/A–Not available due to changes in segment composition.
(1) Banking fees and commissions include insurance fees, documentary fees, loanservicing fees, commitment fees, mutual fund commissions, syndicated manage-ment fees, leasing fees, safe deposit fees, official checks fees, ATM interchangeand miscellaneous other fee revenue.
(2) Credit card revenue includes credit card fees, merchant fees and interchange fees.
(3) Service charges on deposits include service charges on deposits, deficient balancefees, non-sufficient funds/overdraft fees and waived fees.
(4) Fiduciary and investment management fees include asset management fees, per-sonal trust fees, other trust fees and advisory fees.
(5) Ratios are based on operating income.
(6) Beginning in 2001, employees on long-term disability and employees of unconsoli-dated subsidiaries are excluded. Prior period data has not been reclassified.
(7) The year ended December 31, 2001 includes $92 million of charge-offs which arenot classified as such in the Corporation’s GAAP financial information because theyare part of a portfolio which has been accounted for as loans held at a discount.The inclusion of this amount in charge-offs more accurately reflects the credit per-formance of the portfolio. In the Corporation’s financial statements, this itemresults in a higher provision in excess of net charge-offs.
(8) Includes consumer balances that are placed on nonaccrual status when the collec-tion of contractual principal or interest becomes 90 days past due.
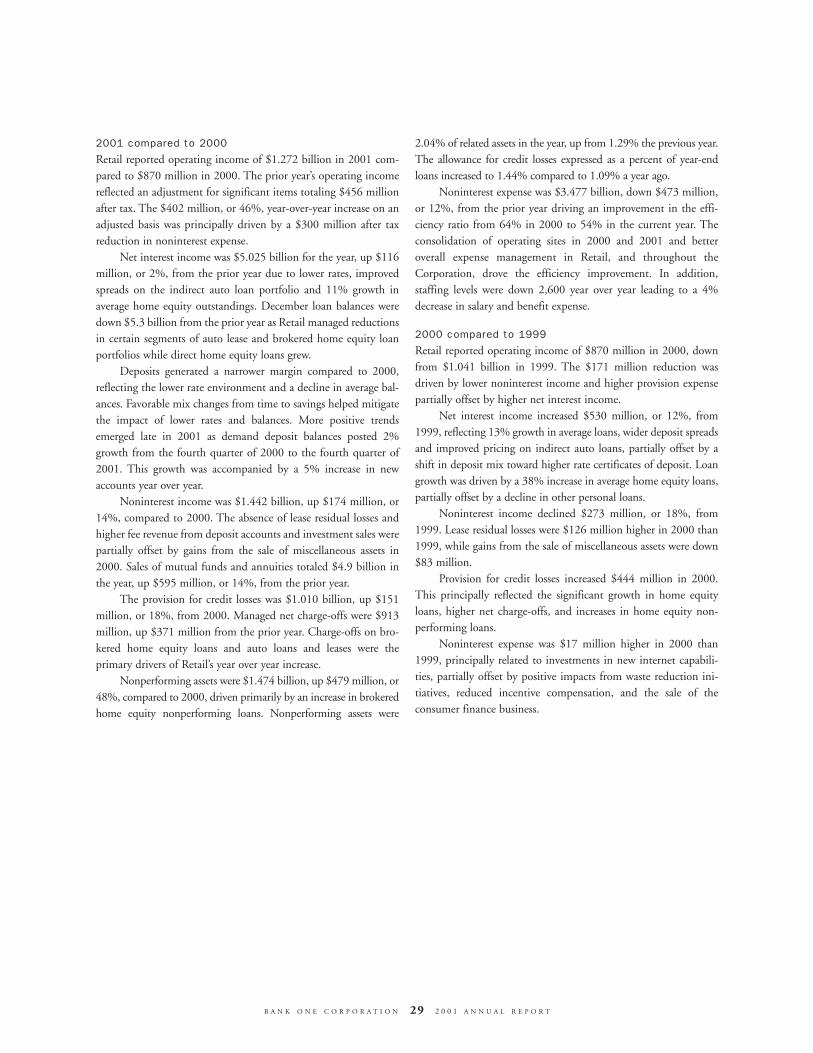
2001 compared to 2000
Retail reported operating income of $1.272 billion in 2001 com-pared to $870 million in 2000. The prior year’s operating incomereflected an adjustment for significant items totaling $456 millionafter tax. The $402 million, or 46%, year-over-year increase on anadjusted basis was principally driven by a $300 million after taxreduction in noninterest expense.
Net interest income was $5.025 billion for the year, up $116million, or 2%, from the prior year due to lower rates, improvedspreads on the indirect auto loan portfolio and 11% growth inaverage home equity outstandings. December loan balances weredown $5.3 billion from the prior year as Retail managed reductionsin certain segments of auto lease and brokered home equity loanportfolios while direct home equity loans grew.
Deposits generated a narrower margin compared to 2000,reflecting the lower rate environment and a decline in average bal-ances. Favorable mix changes from time to savings helped mitigatethe impact of lower rates and balances. More positive trendsemerged late in 2001 as demand deposit balances posted 2%growth from the fourth quarter of 2000 to the fourth quarter of2001. This growth was accompanied by a 5% increase in newaccounts year over year.
Noninterest income was $1.442 billion, up $174 million, or14%, compared to 2000. The absence of lease residual losses andhigher fee revenue from deposit accounts and investment sales werepartially offset by gains from the sale of miscellaneous assets in2000. Sales of mutual funds and annuities totaled $4.9 billion inthe year, up $595 million, or 14%, from the prior year.
The provision for credit losses was $1.010 billion, up $151million, or 18%, from 2000. Managed net charge-offs were $913million, up $371 million from the prior year. Charge-offs on bro-kered home equity loans and auto loans and leases were theprimary drivers of Retail’s year over year increase.
Nonperforming assets were $1.474 billion, up $479 million, or48%, compared to 2000, driven primarily by an increase in brokeredhome equity nonperforming loans. Nonperforming assets were
2.04% of related assets in the year, up from 1.29% the previous year.The allowance for credit losses expressed as a percent of year-endloans increased to 1.44% compared to 1.09% a year ago.
Noninterest expense was $3.477 billion, down $473 million,or 12%, from the prior year driving an improvement in the effi-ciency ratio from 64% in 2000 to 54% in the current year. Theconsolidation of operating sites in 2000 and 2001 and betteroverall expense management in Retail, and throughout theCorporation, drove the efficiency improvement. In addition,staffing levels were down 2,600 year over year leading to a 4%decrease in salary and benefit expense.
2000 compared to 1999
Retail reported operating income of $870 million in 2000, downfrom $1.041 billion in 1999. The $171 million reduction wasdriven by lower noninterest income and higher provision expensepartially offset by higher net interest income.
Net interest income increased $530 million, or 12%, from1999, reflecting 13% growth in average loans, wider deposit spreadsand improved pricing on indirect auto loans, partially offset by ashift in deposit mix toward higher rate certificates of deposit. Loangrowth was driven by a 38% increase in average home equity loans,partially offset by a decline in other personal loans.
Noninterest income declined $273 million, or 18%, from1999. Lease residual losses were $126 million higher in 2000 than1999, while gains from the sale of miscellaneous assets were down$83 million.
Provision for credit losses increased $444 million in 2000.This principally reflected the significant growth in home equityloans, higher net charge-offs, and increases in home equity non-performing loans.
Noninterest expense was $17 million higher in 2000 than1999, principally related to investments in new internet capabili-ties, partially offset by positive impacts from waste reduction ini-tiatives, reduced incentive compensation, and the sale of theconsumer finance business.
B A N K O N E C O R P O R A T I O N 29 2 0 0 1 A N N U A L R E P O R T

Commercial Banking
Commercial Banking offers a broad array of products, includingglobal cash management, capital markets, commercial cards,investment management, and lending to Corporate Banking andMiddle Market customers.
Corporate Banking serves large corporations, financial insti-tutions, municipalities, and not-for-profit entities. In addition tolending, Corporate Banking offers a wide range of financial prod-ucts and develops, markets, and delivers cash management, capitalmarkets, global treasury and trade, e-business and other noncreditproducts and services. Bank One’s Capital Markets business isengaged in the origination, trading, and distribution of asset-backed securities, investment grade and high yield securities, deriv-
atives, tax-exempt securities, and government bonds. CapitalMarkets is also actively engaged in loan syndications, marketresearch, advisory services, and private placements.
Middle Market Banking serves approximately 18,000 cus-tomers with annual revenues from about $10 million up to $500million. These customers use a wide variety of services, with nearlyone third using Bank One exclusively. Since privately held compa-nies comprise the vast majority of the Middle Market customerbase, providing credit is fundamental to the success of this business.The loan portfolio is diversified across a broad range of industriesand geographic locations. In addition to credit, this customersegment actively uses Bank One’s cash management, international,capital markets, and investment management products and services.
B A N K O N E C O R P O R A T I O N 30 2 0 0 1 A N N U A L R E P O R T
(Dollars in millions) 2001 2000 1999Net interest income–FTE $÷2,702 $÷2,825 $÷2,655
Banking fees and commissions 714 605 N/ACredit card revenue 86 75 N/AService charges on deposits 614 519 N/AFiduciary and investment management fees 3 3 N/AInvestment securities losses (12) – N/ATrading 269 183 N/AOther income (loss) (100) (31) N/A
Noninterest income 1,574 1,354 1,248
Total revenue 4,276 4,179 3,903
Provision for credit losses 1,070 2,217 436
Salaries and employee benefits 1,073 1,044 N/AOther expense 1,147 1,228 N/A
Noninterest expense 2,220 2,272 2,208
Operating pretax income (loss)–FTE 986 (310) 1,259
Tax expense (benefit) and FTE adjustment 265 (195) 353
Operating income (loss) 721 (115) 906
Merger and restructuring-related charges, net of tax (46) 1 –
Net income (loss) $«««««675 $÷÷(114) $÷«÷906
Memo: Revenue by activityLending-related revenue 1,965 2,173 N/ATreasury management services (9) 1,132 1,029 N/ACapital markets (10) 681 482 N/AOther 498 495 N/A

(Dollars in millions) 2001 2000 1999
FINANCIAL PERFORMANCE:Return (loss) on equity (5) 10% (2)«% 15%
Efficiency ratio (5) 52 54 57
Headcount–full-time (6)
Corporate Banking (including Capital Markets) 4,341 4,779 N/AMiddle Market 3,911 4,179 N/ATreasury Management Services 4,723 5,016 N/ASupport and Other Administrative (11) 29 279 N/A
Total headcount–full-time 13,004 14,253 N/A
ENDING BALANCES (in billions):Loans $÷÷70.1 $÷÷85.1 N/AAssets 98.1 103.7 N/A
Demand deposits 25.2 21.2 N/ASavings 3.1 N/A N/ATime (+ Savings in 2000) 14.0 8.0 N/AForeign offices 8.6 8.5 N/A
Total deposits 50.9 37.7 N/A
Equity 7.2 7.0 N/A
AVERAGE BALANCES (in billions):Loans $÷÷77.8 $÷÷85.6 $÷77.5
Assets 104.2 114.5 109.7
Demand deposits 21.1 21.1 N/ASavings 2.7 N/A N/ATime (+ Savings in 2000) 8.9 8.5 N/AForeign offices 9.0 9.8 N/A
Total deposits 41.6 39.4 37.7
Equity 7.2 6.8 5.9
CREDIT QUALITY (in millions):Net commercial charge-offs $««1,041 $««÷«562 N/A
Net commercial charge-off ratios 1.34% 0.66% 0.39%
Nonperforming assets:Commercial nonperforming loans $««2,101 $««1,523 $«««871
Other, including OREO 27 13 N/ATotal nonperforming assets 2,128 1,536 N/A
Allowance for credit losses $««3,066 $««3,044 N/AAllowance to period-end loans 4.37% 3.58% N/AAllowance to nonperforming loans 146 200 N/ANonperforming assets to related assets 3.03 1.80 1.10%
CORPORATE BANKING (in billions):Loans–ending balance $««««36.6 $««÷51.7 N/A
–average balance 43.5 53.4 47.8
Deposits–ending balance $««««28.7 $÷««19.6 N/A–average balance 23.0 21.4 19.1
Credit Quality (in millions):Net charge-offs $«««««638 $÷«««435 N/ANet charge-off ratio 1.47% 0.81% 0.53%
Nonperforming loans $««1,154 $««1,065 $«««578
Nonperforming loans to total loans 3.15% 2.06% 1.12%
B A N K O N E C O R P O R A T I O N 31 2 0 0 1 A N N U A L R E P O R T

B A N K O N E C O R P O R A T I O N 32 2 0 0 1 A N N U A L R E P O R T
(Dollars in millions) 2001 2000 1999
SYNDICATIONS:Lead Arranger Deals:
Volume (in billions) $÷53.9 $÷59.3 $47.9
Number of transactions 227 210 190
League table standing–rank 4 4 4
League table standing–market share 7% 6% 7%
MIDDLE MARKET BANKING (in billions):Loans–ending balance $««33.5 $÷33.4 N/A
–average balance 34.3 32.1 29.7
Deposits–ending balance ««22.2 ÷18.1 N/A–average balance 18.6 18.2 18.6
Credit Quality (in millions):Net charge-offs $«««403 $÷«127 N/ANet charge-off ratio 1.17% 0.40% 0.18%
Nonperforming loans $«««947 $«÷458 $«293
Nonperforming loans to total loans 2.83% 1.37% 0.93%
For additional footnote detail see page 28.
(9) Treasury Management Services includes both fees and fee equivalents from compensating balances.
(10) Capital Markets includes trading revenues and underwriting, syndicated lending and advisory fees.
(11) Full-time headcount in 2000 has been reclassified to reflect the movement of Support and Other Administrative personnel into the respective business units reported.
2001 compared to 2000
Commercial Banking reported operating income of $721 million
for 2001, up $836 million from 2000 primarily due to a signifi-
cantly lower credit provision. After adjusting for the negative
impact of $404 million after tax of significant items in 2000, oper-
ating income increased by $432 million, or 149%. The year’s
results reflected strategic efforts to reduce Corporate Banking
credit exposure and improve the cross-sell of Capital Markets and
Treasury Management products.
At December 31, 2001, loans were $70.1 billion, down $15.0
billion, or 18%, from the prior year. Corporate Banking loans were
$36.6 billion at year-end, down $15.1 billion, or 29%, from a year
ago. Middle Market loans were $33.5 billion, essentially flat from
last year.
Revenue totaled $4.276 billion, up $53 million, or 1%, from
2000, with a decline in net interest income more than offset by
growth in noninterest income, particularly in Treasury
Management and Capital Markets.
Net interest income was $2.702 billion, down $116 million,
or 4%, from the prior year reflecting the earnings impact of lower
average loan balances resulting from efforts to reduce credit risk
exposure.
Noninterest income was $1.574 billion, up $169 million, or
12%, from the prior year. Banking fees and commissions increased
$109 million, or 18%, due to growth in the asset-backed and
investment grade underwriting business and higher business sweep
fees. Service charges on deposits increased $90 million, or 17%,
reflecting improvement in Treasury Management volumes and
pricing, as well as a shift in payment for services to fees from net
interest income due to the lower value ascribed to customers’ com-
pensating deposit balances. Trading revenue increased $42 million,
primarily reflecting improvement in fixed income trading activi-
ties. Other income decreased by $72 million mainly due to losses
on the sale of loans.
The provision for credit losses was $1.070 billion, down $519
million, or 33%, from 2000. Net charge-offs were $1.041 billion,
up $479 million, or 85%, from the prior year and represented
1.34% of average loans, up from 0.66% in 2000. Corporate
Banking net charge-offs were $638 million, or 1.47% of average
loans, up from 0.81% in 2000. 2001 charge-offs included $216
million related to nonperforming and other credit related loan
sales. There were no losses on loan sales in 2000. Middle Market
net charge-offs were $403 million, or 1.17% of average loans, up
from 0.40% of average loans in the prior year. For additional detail
on Commercial Banking net charge-offs see the table on page 57.

The allowance for credit losses at December 31, 2001 was
$3.066 billion, up $22 million, or 1%, from the prior year. This
represented 4.37% of year-end loans and 146% of nonperforming
loans compared with 3.58% and 200%, respectively, at December
31, 2000. Nonperforming loans were $2.101 billion, up $578
million, or 38%, from year-end 2000. Corporate Banking nonper-
forming loans at year-end were $1.154 billion, up $89 million, or
8%, from the prior year. Before reflecting the sale of nonperform-
ing loans, Corporate Banking nonperforming loans increased $671
million during the year. Middle Market nonperforming loans were
$947 million at December 31, 2001, up $489 million, or 107%,
from the prior year. For additional detail on Commercial Banking
nonperforming assets and allowance for credit losses see the tables
on page 56 and page 58, respectively.
Noninterest expense was $2.220 billion, down $87 million,
or 4%, from 2000 reflecting the impact of waste-reduction efforts
and lower headcount. The 2001 efficiency ratio improved to 52%
from 55% in 2000.
2000 compared to 1999
Commercial Banking reported operating income of $289 million
for 2000 on an adjusted basis, compared with $906 million in
1999. This $617 million decrease was primarily driven by an
increase in the provision for credit losses of $1.153 billion.
Net interest income increased $163 million, or 6%, from the
prior year, driven by 10% average loan growth partially offset by a
modest decline in spread due to competitive pricing pressures and
higher nonperforming loans.
The provision for credit losses increased $1.153 billion in
2000 from the prior year due to deterioration in the quality of
loans and a higher reserve level established for the commercial loan
portfolio. The deterioration in credit quality reflected the slowing
of the economy as well as weakness in several industries and lever-
aged finance transactions.
Noninterest income of $1.405 billion increased $157 million,
or 13%, from the prior year primarily due to growth in Treasury
Management Service revenue of $71 million, or 12%, lending
related fees of $60 million, or 41%, and Capital Markets revenue
of $25 million, or 6%.
Noninterest expense increased $99 million, or 4%, from the
prior year, principally related to Treasury Management Services
investment spending.
First USA
First USA offers a wide variety of card products, including co-
brand, affinity, rewards, business, general purpose, and smart credit
cards, as well as stored-value cards. All of these cards carry the
respective Visa® or MasterCard® brand names.
With more than 55 million cards in circulation, First USA is
the third largest credit card provider in the United States and the
largest Visa® credit card issuer in the world. First USA has $68 billion
in managed credit card receivables, which includes a portfolio of
approximately $6 billion in card receivables which was acquired from
Wachovia Corporation (“Wachovia”) in 2001. FirstUSA.com is also
a leader in online card marketing and customer service, with more
than 1.9 million registered users of its website.
First USA offers credit cards for consumers and businesses
under the First USA and Bank One names and on behalf of its
1,900 marketing partners. These partners include some of the
leading corporations, universities, and affinity organizations in the
United States.
B A N K O N E C O R P O R A T I O N 33 2 0 0 1 A N N U A L R E P O R T

(Dollars in millions-managed basis) 2001 2000 1999Net interest income–FTE $6,090 $5,835 $6,881
Banking fees and commissions 96 112 N/ACredit card revenue 1,146 854 N/AInvestment securities gains – 11 N/ATrading – (1) N/AOther income (loss) 120 (230) N/A
Noninterest income 1,362 746 1,632
Total revenue 7,452 6,581 8,513
Provision for credit losses 3,823 3,637 3,593
Salaries and employee benefits 501 517 N/AOther expense 1,618 2,422 N/A
Noninterest expense 2,119 2,939 3,204
Operating pretax income–FTE 1,510 5 1,716
Tax expense and FTE adjustment 564 2 581
Operating income 946 3 1,135
Merger and restructuring-related charges, net of tax (39) (4) –
Net income (loss) ÷$«««907 ÷÷÷$««««««(1) $1,135
Memo: Net securitization gains (amortization) ««««(62) ««(116) «««««61
FINANCIAL PERFORMANCE:% of average outstandings:
Net interest income–FTE 9.31% 8.81% 9.97%
Provision for credit losses 5.85 5.49 5.21
Noninterest income 2.08 1.13 2.37
Risk adjusted revenue 5.54 4.45 7.13
Noninterest expense 3.24 4.44 4.64
Pretax income–FTE 2.31 0.01 2.49
Operating income 1.45 – 1.64
Net income 1.39 – 1.64
Return on equity (5) 15 – 19
Efficiency ratio (5) 28 45 38
Headcount–full-time (6) 9,871 10,901 N/A
ENDING BALANCES (in billions):Owned $÷««6.8 $««««4.7 $÷÷4.0
Seller’s interest 24.0 22.4 19.7
Loans on balance sheet 30.8 27.2 23.7
Securitized 37.4 39.8 45.7
Loans 68.2 ÷67.0 ÷69.4
Assets 72.7 70.5 N/AEquity 6.4 6.2 N/A
AVERAGE BALANCES (in billions):Owned $÷÷6.8 $÷÷4.8 N/ASeller’s interest 18.8 18.5 N/ALoans on balance sheet 25.6 23.2 N/ASecuritized 39.8 43.0 N/A
Loans ÷65.4 ÷66.2 ÷69.0
Assets 68.7 70.0 74.9
Equity 6.3 6.1 6.0
B A N K O N E C O R P O R A T I O N 34 2 0 0 1 A N N U A L R E P O R T

(Dollars in millions) 2001 2000 1999
CREDIT QUALITY (in millions):Net charge-offs:
Credit card–managed $÷3,823 $÷3,584 $÷3,790
Net charge-off ratios:Credit card–managed 5.84% 5.42% 5.49%
12-month lagged (12) 5.77 5.19 N/A
Delinquency ratio:–30+ days 4.46 4.51 4.57
–90+ days 1.93 2.02 2.13
Allowance for credit losses $÷÷«396 $÷÷«197 N/AAllowance to period-end owned loans 5.82% 4.19% N/A
OTHER DATA:Charge volume (in billions) $««140.4 $««142.5 $÷142.7
New accounts opened (in thousands) 3,925 3,324 8,108
Cards issued (in thousands) 55,554 51,693 64,191
Number of FirstUSA.com customers (in millions) (13) 1.9 2.1 N/AFor additional footnote detail see page 28.
(12) 2001 ratio includes Wachovia net charge-offs but excludes Wachovia loans.
(13) Approximately 1 million registered users were purged in late 2001 due to inactivity.
B A N K O N E C O R P O R A T I O N 35 2 0 0 1 A N N U A L R E P O R T
2001 compared to 2000
First USA reported operating income of $946 million in 2001, up
from $3 million in the prior year. Adjusted for $522 million after
tax of significant items, 2000 operating income was $525 million.
Increased reported operating income reflected lower expenses, the
addition of the Wachovia portfolio and higher revenue, partially
offset by increased credit costs. The Corporation expects the acqui-
sition of the Wachovia portfolio to add approximately $100
million annually to after tax earnings. The pre-tax return on out-
standings was 2.3% in 2001, up from 1.3% in 2000.
Net interest income totaled $6.090 billion, up $255 million,
or 4%, from the prior year reflecting lower interest rates and the
addition of the Wachovia portfolio, partially offset by lower average
outstandings and loan fee income. Average managed outstandings
were $65.4 billion, down $800 million, or 1%, from the prior year.
End of period managed loans were $68.2 billion, up $1.2 billion
from the prior year. First USA opened 3.9 million new accounts
during the year, an 18% increase from the prior year. At December
31, 2001, 55.6 million cards were issued.
Noninterest income was $1.362 billion, a $149 million, or
12%, increase from the prior year reflecting the addition of the
Wachovia portfolio and increased securitization activity.
The managed provision for credit losses was $3.823 billion, a
$221 million, or 6%, increase from the prior year reflecting the
addition of the Wachovia portfolio and increased net charge-offs.
Noninterest expense totaled $2.119 billion, a $499 million,
or 19%, decrease from the prior year, reflecting lower fraud and
operational losses, processing costs and a decrease in internally allo-
cated costs related to a mid-year 2000 change in methodology.
The decline from last year also reflected the sale of international
operations in the second quarter of 2000. These reductions were
partially offset by the addition of the Wachovia portfolio and
higher marketing expense.
2000 compared to 1999
First USA reported operating income of $525 million for 2000,
down $610 million, or 54%, from 1999. A decline in revenue was
partially offset by lower expenses. The 2000 results represented a
1.3% return on outstandings, down from 2.5% in 1999.
Net interest income was $5.835 billion, down $1.046 billion,
or 15%, from 1999, reflecting narrower spread, lower late fee
revenue, and lower average outstandings. Average managed out-
standings for 2000 were $66.2 billion, down 4% from 1999. End
of period managed loans declined to $67.0 billion, or 3%. First
USA opened 3.3 million accounts in 2000, down 59% from 1999.
Noninterest income was $1.213 billion, down $419 million,
or 26%, from 1999, due to decreased securitization activity and
higher revenue sharing payments to partnership and affinity groups
reflecting the emphasis on these growing customer groups. In addi-
tion, lower revenue from fee-based products contributed to the
decline as well as the prior year’s inclusion of $126 million of non-
recurring items.
The provision for credit losses was $3.602 billion, relatively
flat with 1999. The charge-off rate decreased slightly to 5.42%
from 5.49% in 1999. The 1999 charge-offs included $183 million
from the early adoption of the Federal Financial Institutions
Examination Council’s (FFIEC) revised consumer credit guide-
lines. At year-end, the managed 30-day and 90-day delinquency
rates were 4.51% and 2.02%, respectively, down from 4.57% and
2.13% a year earlier.
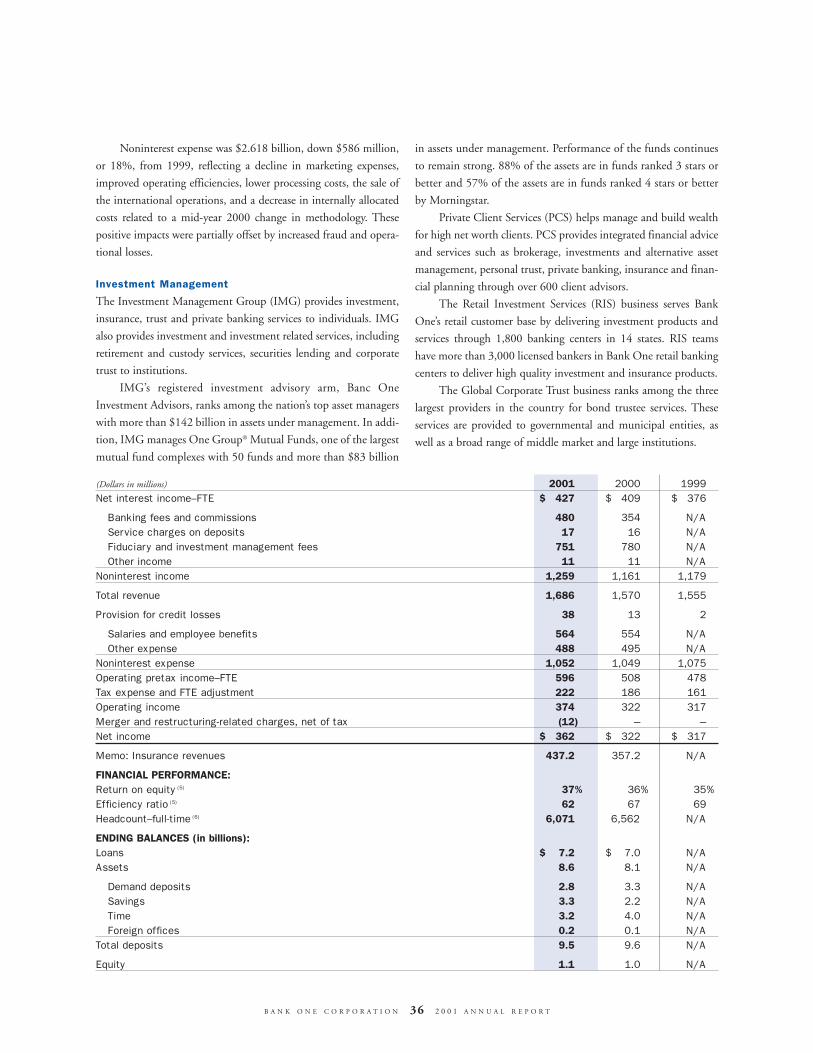
Noninterest expense was $2.618 billion, down $586 million,
or 18%, from 1999, reflecting a decline in marketing expenses,
improved operating efficiencies, lower processing costs, the sale of
the international operations, and a decrease in internally allocated
costs related to a mid-year 2000 change in methodology. These
positive impacts were partially offset by increased fraud and opera-
tional losses.
Investment Management
The Investment Management Group (IMG) provides investment,
insurance, trust and private banking services to individuals. IMG
also provides investment and investment related services, including
retirement and custody services, securities lending and corporate
trust to institutions.
IMG’s registered investment advisory arm, Banc One
Investment Advisors, ranks among the nation’s top asset managers
with more than $142 billion in assets under management. In addi-
tion, IMG manages One Group® Mutual Funds, one of the largest
mutual fund complexes with 50 funds and more than $83 billion
in assets under management. Performance of the funds continues
to remain strong. 88% of the assets are in funds ranked 3 stars or
better and 57% of the assets are in funds ranked 4 stars or better
by Morningstar.
Private Client Services (PCS) helps manage and build wealth
for high net worth clients. PCS provides integrated financial advice
and services such as brokerage, investments and alternative asset
management, personal trust, private banking, insurance and finan-
cial planning through over 600 client advisors.
The Retail Investment Services (RIS) business serves Bank
One’s retail customer base by delivering investment products and
services through 1,800 banking centers in 14 states. RIS teams
have more than 3,000 licensed bankers in Bank One retail banking
centers to deliver high quality investment and insurance products.
The Global Corporate Trust business ranks among the three
largest providers in the country for bond trustee services. These
services are provided to governmental and municipal entities, as
well as a broad range of middle market and large institutions.
(Dollars in millions) 2001 2000 1999Net interest income–FTE $«««427 $«««409 $÷«376
Banking fees and commissions 480 354 N/AService charges on deposits 17 16 N/AFiduciary and investment management fees 751 780 N/AOther income 11 11 N/A
Noninterest income 1,259 1,161 1,179
Total revenue 1,686 1,570 1,555
Provision for credit losses 38 13 2
Salaries and employee benefits 564 554 N/AOther expense 488 495 N/A
Noninterest expense 1,052 1,049 1,075
Operating pretax income–FTE 596 508 478
Tax expense and FTE adjustment 222 186 161
Operating income 374 322 317
Merger and restructuring-related charges, net of tax (12) – –
Net income ÷ «$«««362 «««$«««322 «««$«««317
Memo: Insurance revenues 437.2 357.2 N/A
FINANCIAL PERFORMANCE:Return on equity (5) 37% 36% 35%
Efficiency ratio (5) 62 67 69
Headcount–full-time (6) 6,071 6,562 N/A
ENDING BALANCES (in billions):Loans $÷««7.2 $««««7.0 N/AAssets 8.6 8.1 N/A
Demand deposits 2.8 3.3 N/ASavings 3.3 2.2 N/ATime 3.2 4.0 N/AForeign offices 0.2 0.1 N/A
Total deposits 9.5 9.6 N/A
Equity 1.1 1.0 N/A
B A N K O N E C O R P O R A T I O N 36 2 0 0 1 A N N U A L R E P O R T

(Dollars in millions) 2001 2000 1999
AVERAGE BALANCES (in billions):Loans $««««6.9 $÷÷6.6 $÷÷5.7
Assets 8.1 7.6 7.1
Demand deposits 2.0 2.5 N/ASavings 2.8 1.9 N/ATime 3.3 4.0 N/AForeign offices 0.2 0.2 N/A
Total deposits 8.2 8.5 8.8
Equity 1.0 0.9 0.9
CREDIT QUALITY (in millions): Net charge-offs:
Commercial $÷÷«27 N/A N/AConsumer 7 N/A N/A
Total net charge-offs 34 N/A N/A
Net charge-off ratios:Commercial 0.81% N/A N/AConsumer 0.19 N/A N/A
Total net charge-off ratio 0.49 N/A N/A
Nonperforming assets: Commercial $÷÷«38 $÷÷«36 N/AConsumer 4 4 N/A
Total nonperforming loans 42 40 N/AOther including OREO 1 – N/A
Total nonperforming assets 43 40 N/A
Allowance for credit losses $«««««25 $÷÷«22 N/AAllowance to period-end loans 0.35% 0.31% N/AAllowance to nonperforming loans 60 55 N/ANonperforming assets to related assets 0.60 0.57 N/A
ASSETS UNDER MANAGEMENT ENDING BALANCES (in billions):Mutual funds $««83.5 $÷70.4 $÷64.4
Other 59.1 60.8 64.5
Total 142.6 131.2 128.9
By type:Money market $««58.5 $÷43.1 N/AEquity 47.3 53.5 N/AFixed income 36.8 34.6 N/A
Total 142.6 131.2 128.9
By channel:Private client services $««49.7 $÷58.3 N/ARetail brokerage 9.7 9.1 N/AInstitutional 61.2 47.9 N/ACommercial cash sweep 9.8 8.6 N/AAll other 12.2 7.3 N/A
Total 142.6 131.2 128.9
Morningstar Rankings:Percentage of customer assets in 4 and 5 ranked funds 57% 49% 54%
Percentage of customer assets in 3+ ranked funds 88 99 84
TRUST ASSETS ENDING BALANCES:Trust assets under administration (in billions) $352.5 $319.4 N/A
B A N K O N E C O R P O R A T I O N 37 2 0 0 1 A N N U A L R E P O R T

(Dollars in millions) 2001 2000 1999
CORPORATE TRUST SECURITIES ENDING BALANCES:Corporate trust securities under administration (in billions) $988.6 $751.1 N/A
RETAIL BROKERAGE:Mutual fund sales (in millions) $2,284 $2,613 N/AAnnuity sales 2,583 1,659 N/A
Total sales 4,867 4,272 4,077
Number of accounts–end of period (in thousands) 394 384 349
Market value customer assets–end of period (in billions) $««23.4 $÷23.1 $÷23.4
Number of registered sales representatives 724 700 N/ANumber of licensed retail bankers 3,042 2,689 N/AAnnuity account value (in billions) $««««8.7 $««««6.8 N/A
PRIVATE CLIENT SERVICES:Number of Private Client advisors 641 747 N/ANumber of Private Client offices 105 104 N/A
Client Assets:Assets under management (in billions) $««49.7 $÷58.3 N/A
Ending Balances (in billions):Loans «««« $««««7.0 ÷$÷««6.7 N/ADeposits 7.6 7.2 N/A
Average Balances (in billions):Loans «««« $««««6.9 ÷÷$÷««6.4 $÷÷5.5
Deposits 7.0 7.0 7.2
For additional footnote detail see page 28.
B A N K O N E C O R P O R A T I O N 38 2 0 0 1 A N N U A L R E P O R T
2001 compared to 2000
IMG reported operating income of $374 million, up $52 million
from the prior year.
Net interest income increased $18 million, or 4%, from the
prior year, reflecting a 5% increase in average loans partially offset
by narrower deposit spreads and a 4% decrease in average deposits.
Provision for credit losses increased $25 million, principally
related to higher net charge-offs resulting from a difficult economic
climate and loan growth.
Noninterest income, which is principally fiduciary and invest-
ment fees, increased $96 million, or 8%. Beginning in November
2000, fees associated with the administration of the One Group®
mutual funds were recorded as revenue, with a corresponding
increase in expense. Prior to that, a third-party administrator
incurred such fees and expenses, which totaled $80 million in
2000. Excluding the impact of this change, noninterest income
increased $16 million reflecting growth in retail brokerage sales
offset by lower investment advisory fees on equity assets because of
overall market conditions.
Noninterest expense increased $1 million, principally related
to expenses of $80 million associated with the administration of
the One Group® funds, offset by a decrease in expenses related to
tighter cost control, lower headcount and reduced operating losses.
Excluding the expenses associated with the administration of the
One Group® funds, noninterest expenses declined 8%.
Assets under management totaled $142.6 billion, up 9%
from the end of 2000. One Group® mutual fund assets under man-
agement increased 19% to $83.5 billion. One Group® fund per-
formance continued to remain strong, with 88% of these funds
rated three stars or higher by Morningstar. Average assets under
management increased 3% compared with 2000, driven princi-
pally by a 12% increase in One Group® mutual funds.
2000 compared to 1999
IMG reported operating income of $322 million, up $5 million
from the prior year.
Net interest income increased $33 million, or 9%, from the
prior year, reflecting a 16% increase in average loans partially offset
by narrower spreads related to the 3% decrease in average deposits.
Provision for credit losses increased $11 million, principally
related to higher net charge-offs and loan growth.
Noninterest income, which is principally fiduciary and invest-
ment fees, decreased $16 million, or 1%, due to the sale of a sub-
sidiary in the 1999 second quarter. Excluding the impact of this
sale, noninterest income increased 2%, reflecting growth in retail
brokerage and insurance volumes and moderate growth in assets
under management.
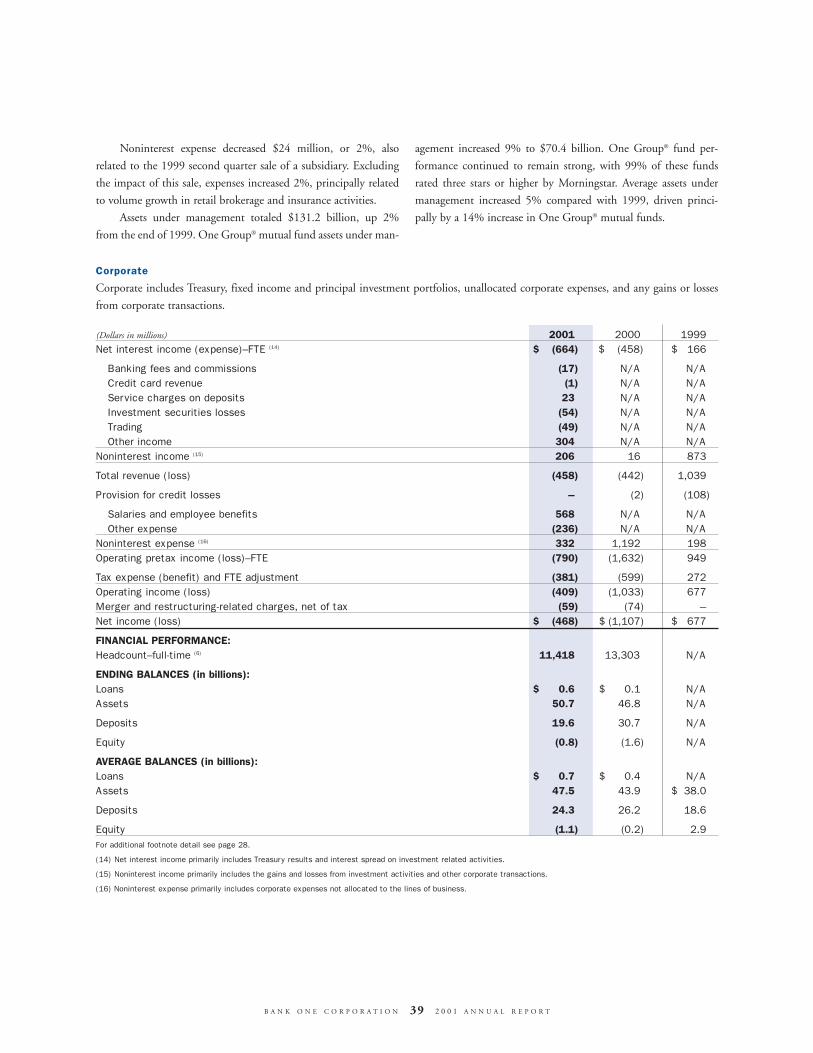
Corporate
Corporate includes Treasury, fixed income and principal investment portfolios, unallocated corporate expenses, and any gains or losses
from corporate transactions.
(Dollars in millions) 2001 2000 1999Net interest income (expense)–FTE (14) $««««(664) $÷÷(458) $÷«166
Banking fees and commissions (17) N/A N/ACredit card revenue (1) N/A N/AService charges on deposits 23 N/A N/AInvestment securities losses (54) N/A N/ATrading (49) N/A N/AOther income 304 N/A N/A
Noninterest income (15) 206 16 873
Total revenue (loss) (458) (442) 1,039
Provision for credit losses – (2) (108)
Salaries and employee benefits 568 N/A N/AOther expense (236) N/A N/A
Noninterest expense (16) 332 1,192 198
Operating pretax income (loss)–FTE (790) (1,632) 949
Tax expense (benefit) and FTE adjustment (381) (599) 272
Operating income (loss) (409) (1,033) 677
Merger and restructuring-related charges, net of tax (59) (74) –
Net income (loss) $««««(468) $«(1,107) $÷«677
FINANCIAL PERFORMANCE:Headcount–full-time (6) 11,418 13,303 N/A
ENDING BALANCES (in billions):Loans $««««««0.6 $÷÷÷0.1 N/AAssets 50.7 46.8 N/A
Deposits 19.6 30.7 N/A
Equity (0.8) (1.6) N/A
AVERAGE BALANCES (in billions):Loans $««««««0.7 $÷÷÷0.4 N/AAssets 47.5 ÷÷43.9 $÷38.0
Deposits 24.3 26.2 18.6
Equity (1.1) (0.2) 2.9
For additional footnote detail see page 28.
(14) Net interest income primarily includes Treasury results and interest spread on investment related activities.
(15) Noninterest income primarily includes the gains and losses from investment activities and other corporate transactions.
(16) Noninterest expense primarily includes corporate expenses not allocated to the lines of business.
B A N K O N E C O R P O R A T I O N 39 2 0 0 1 A N N U A L R E P O R T
Noninterest expense decreased $24 million, or 2%, also
related to the 1999 second quarter sale of a subsidiary. Excluding
the impact of this sale, expenses increased 2%, principally related
to volume growth in retail brokerage and insurance activities.
Assets under management totaled $131.2 billion, up 2%
from the end of 1999. One Group® mutual fund assets under man-
agement increased 9% to $70.4 billion. One Group® fund per-
formance continued to remain strong, with 99% of these funds
rated three stars or higher by Morningstar. Average assets under
management increased 5% compared with 1999, driven princi-
pally by a 14% increase in One Group® mutual funds.

2001 compared to 2000
Corporate reported an operating loss of $409 million for 2001,
compared with an operating loss of $1,033 million in 2000.
Excluding significant items of $778 million after tax, the operating
loss in 2000 was $255 million.
Net interest expense increased to $664 million for 2001 from
$464 million in 2000. These results were principally due to
changes in the Treasury investment portfolio and an increase in
unallocated equity.
Investments, which includes Treasury, fixed income and prin-
cipal investment portfolios, declined $143 million after tax from
2000 due to market conditions. These results are principally
reflected in investment securities gains and losses.
Unallocated corporate expenses were $332 million in 2001
versus $473 million in 2000. The $141 million reduction from
2000 was principally due to increased allocations.
2000 compared to 1999
Corporate reported an operating loss of $255 million in 2000,
compared with operating income of $677 million in 1999.
Treasury results worsened in 2000, driven by declining inter-
est rates and the level of unallocated equity and assets. This change
was principally reflected in net interest expense, which was $464
million in 2000, compared to net interest income of $166 million
for 1999.
Investments results declined $141 million after tax from 1999
principally due to the weakening market for initial public offerings
and financial restructurings, and lower gains in the Treasury port-
folio.
Noninterest expense was $473 million for 2000, compared
with $198 million in 1999. Expenses for 2000 included higher
legal expenses, severance-related expenses and other operational
losses. Additionally, unallocated corporate expenses increased in
2000 due to the change in allocation methodology.
B A N K O N E C O R P O R A T I O N 40 2 0 0 1 A N N U A L R E P O R T

Significant Items
Results in 2000 included the negative impact of $2.160 billion after tax ($3.329 billion pre-tax) of significant items. The following sum-
marizes significant items recorded in 2000 by each business segment and income statement line, excluding merger and
restructuring–related charges:
Business Segments–Table 1Investment
(In millions) Retail Commercial First USA Management Corporate TotalPretax expense (income)Writedown of auto lease residuals $532 $÷«532
Provision for credit losses $628 628
Repositioning of investment securities portfolio $«««415 415
Operational and other (1) 2 (18) $÷56 220 260
Writedown of interest-only strip 354 354
Occupancy and fixed asset related 9 6 11 $(4) 315 337
Writedown of purchased credit card relationship intangibles 275 275
Writedowns primarily related to planned loan sales (2) 167 167
Increase to legal accruals 190 190
Writedown of marketing partnership agreements 121 121
Severance related 10 21 6 4 9 50
Total $720 $637 $823 $«– $1,149 $3,329
After tax $456 $404 $522 $«– $÷«778 $2,160
Income Statement Line–Table 2Investment
(In millions) Retail Commercial First USA Management Corporate TotalNet interest income $÷14 $÷«(7) $÷÷÷(6) $÷÷÷«1
Noninterest income:Banking fees and commissions (1) (1)
Credit card revenue $152 152
Service charges on deposits 5 5
Investment securities (gains) losses (1) 426 425
Trading 44 44
Other income 650 3 315 $÷2 11 981
Total noninterest income 650 51 467 2 436 1,606
Provision for credit losses 11 628 ÷35 674
Noninterest expense:Salaries and employee benefits (1) 12 (42) (4) (19) 145 92
Occupancy expense 9 6 11 72 98
Other intangible amortization 275 9 36 320
Other 24 1 39 8 466 538
Total noninterest expense 45 (35) 321 (2) 719 1,048
Pretax expense $720 $637 $823 $«– $1,149 $3,329
(1) Includes $75 million of incentive accruals reversed in the fourth quarter relating to the full year in which existing plans were adjusted to a pay for performance basis.
(2) At December 31, 2000, Management discontinued its plan to dispose of these loans, and as such, are now considered part of the general portfolio.
B A N K O N E C O R P O R A T I O N 41 2 0 0 1 A N N U A L R E P O R T
During 1999, significant items totaling $880 million pretax ($597
million after-tax) were not allocated to specific business segments.
These items included charges of $722 million for merger and
restructuring costs, $321 million for asset impairments, valuation
adjustments and other charges, and $197 million for provision for
credit losses primarily associated with the implementation of the
FFIEC’s revised consumer credit guidelines. These charges were par-
tially offset by gains of $111 million and $249 million, respectively,
from the sale of Concord and the Indiana divestitures.
B A N K O N E C O R P O R A T I O N 42 2 0 0 1 A N N U A L R E P O R T
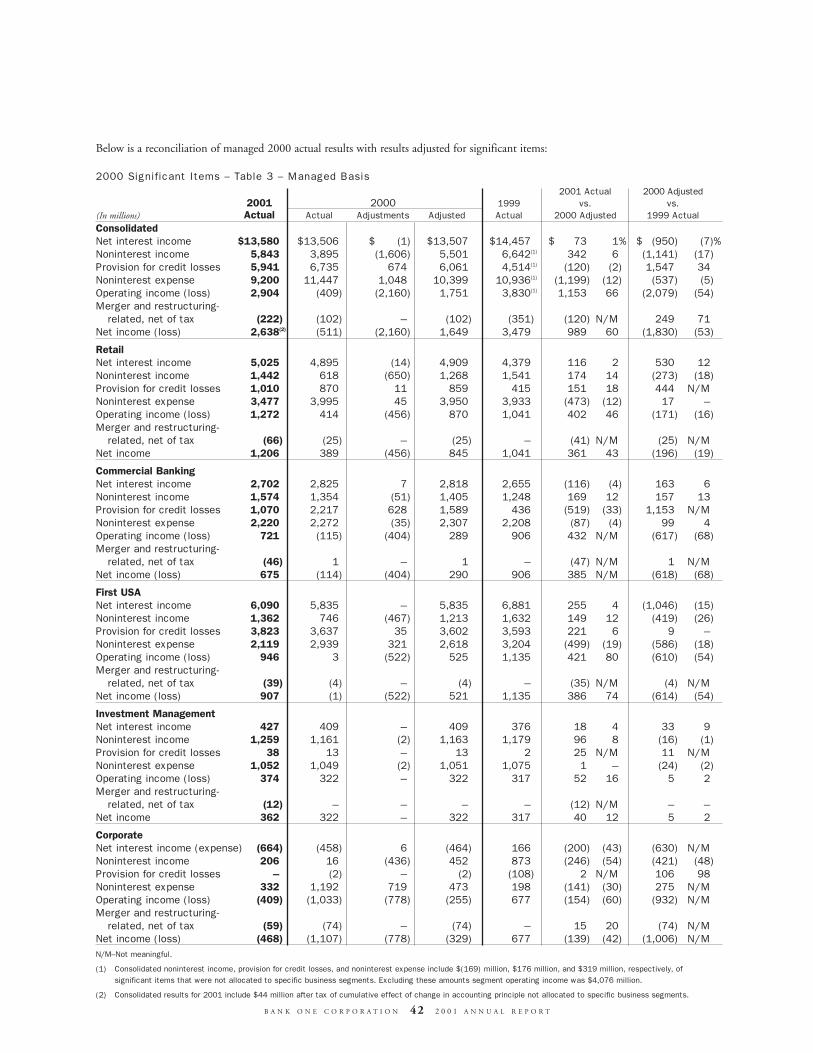
Below is a reconciliation of managed 2000 actual results with results adjusted for significant items:
2000 Significant Items – Table 3 – Managed Basis2001 Actual 2000 Adjusted
2001 2000 1999 vs. vs.(In millions) Actual Actual Adjustments Adjusted Actual 2000 Adjusted 1999 ActualConsolidatedNet interest income $13,580 $13,506 $÷÷÷«(1) $13,507 $14,457 $««««««73 1% $÷«(950) (7)«%
Noninterest income 5,843 3,895 (1,606) 5,501 6,642(1) 342 6 (1,141) (17)
Provision for credit losses 5,941 6,735 674 6,061 4,514(1) (120) (2) 1,547 34
Noninterest expense 9,200 11,447 1,048 10,399 10,936(1) (1,199) (12) (537) (5)
Operating income (loss) 2,904 (409) (2,160) 1,751 3,830(1) 1,153 66 (2,079) (54)
Merger and restructuring-related, net of tax (222) (102) – (102) (351) (120) N/M 249 71
Net income (loss) 2,638(2) (511) (2,160) 1,649 3,479 989 60 (1,830) (53)
RetailNet interest income 5,025 4,895 (14) 4,909 4,379 116 2 530 12
Noninterest income 1,442 618 (650) 1,268 1,541 174 14 (273) (18)
Provision for credit losses 1,010 870 11 859 415 151 18 444 N/MNoninterest expense 3,477 3,995 45 3,950 3,933 (473) (12) 17 –
Operating income (loss) 1,272 414 (456) 870 1,041 402 46 (171) (16)
Merger and restructuring-related, net of tax (66) (25) – (25) – (41) N/M (25) N/M
Net income 1,206 389 (456) 845 1,041 361 43 (196) (19)
Commercial BankingNet interest income 2,702 2,825 7 2,818 2,655 (116) (4) 163 6
Noninterest income 1,574 1,354 (51) 1,405 1,248 169 12 157 13
Provision for credit losses 1,070 2,217 628 1,589 436 (519) (33) 1,153 N/MNoninterest expense 2,220 2,272 (35) 2,307 2,208 (87) (4) 99 4
Operating income (loss) 721 (115) (404) 289 906 432 N/M (617) (68)
Merger and restructuring-related, net of tax (46) 1 – 1 – (47) N/M 1 N/M
Net income (loss) 675 (114) (404) 290 906 385 N/M (618) (68)
First USANet interest income 6,090 5,835 – 5,835 6,881 255 4 (1,046) (15)
Noninterest income 1,362 746 (467) 1,213 1,632 149 12 (419) (26)
Provision for credit losses 3,823 3,637 35 3,602 3,593 221 6 9 –
Noninterest expense 2,119 2,939 321 2,618 3,204 (499) (19) (586) (18)
Operating income (loss) 946 3 (522) 525 1,135 421 80 (610) (54)
Merger and restructuring-related, net of tax (39) (4) – (4) – (35) N/M (4) N/M
Net income (loss) 907 (1) (522) 521 1,135 386 74 (614) (54)
Investment ManagementNet interest income 427 409 – 409 376 18 4 33 9
Noninterest income 1,259 1,161 (2) 1,163 1,179 96 8 (16) (1)
Provision for credit losses 38 13 – 13 2 25 N/M 11 N/MNoninterest expense 1,052 1,049 (2) 1,051 1,075 1 – (24) (2)
Operating income (loss) 374 322 – 322 317 52 16 5 2
Merger and restructuring-related, net of tax (12) – – – – (12) N/M – –
Net income 362 322 – 322 317 40 12 5 2
CorporateNet interest income (expense) (664) (458) 6 (464) 166 (200) (43) (630) N/MNoninterest income 206 16 (436) 452 873 (246) (54) (421) (48)
Provision for credit losses – (2) – (2) (108) 2 N/M 106 98
Noninterest expense 332 1,192 719 473 198 (141) (30) 275 N/MOperating income (loss) (409) (1,033) (778) (255) 677 (154) (60) (932) N/MMerger and restructuring-
related, net of tax (59) (74) – (74) – 15 20 (74) N/MNet income (loss) (468) (1,107) (778) (329) 677 (139) (42) (1,006) N/MN/M–Not meaningful.
(1) Consolidated noninterest income, provision for credit losses, and noninterest expense include $(169) million, $176 million, and $319 million, respectively, of significant items that were not allocated to specific business segments. Excluding these amounts segment operating income was $4,076 million.
(2) Consolidated results for 2001 include $44 million after tax of cumulative effect of change in accounting principle not allocated to specific business segments.

CONSOLIDATED RESULTS
Net Interest Income
Net interest income includes spreads on earning assets as well as
items such as loan fees, cash interest collections on problem loans,
dividend income, interest reversals, and income or expense on
derivatives used to manage interest rate risk.
In order to understand fundamental trends in net interest
income, average earning assets and net interest margins, it is useful
to analyze financial performance on a managed portfolio basis,
which adds data on securitized loans to reported data on loans as
presented below:
YEAR ENDED DECEMBER 31 2001 2000 1999(Dollars in millions)
Managed:Net interest income–
FTE basis $««13,580 $÷13,506 $÷14,457
Average earning assets 277,672 284,035 269,237
Net interest margin 4.89% 4.76% 5.37%
Reported:Net interest income–
FTE basis $««««8,769 $÷÷8,974 $÷««9,142
Average earning assets 237,869 241,058 223,539
Net interest margin 3.69% 3.72% 4.09%
2001 compared to 2000
On a managed basis, net interest income increased modestly in
2001 relative to 2000. The earnings benefit derived from falling
interest rates was partially offset by lower earning assets. The
decline in average earning assets was largely due to efforts to reduce
commercial credit exposure, brokered home equity loan and auto
lease outstandings, and also reflected lower credit card receivables.
As represented by the year-over-year improvement in net interest
margin, overall balance sheet profitability improved. This reflected
the reduction in low margin commercial credits, more disciplined
pricing in the consumer loan sector, and increases in the percent-
age of funding provided by core retail deposits and net free funds.
On a reported basis, net interest income was slightly below
that reported in 2000, largely due to lower earning assets as men-
tioned above.
2000 compared to 1999
Lower average credit card outstandings, lower fee revenues and nar-
rower spread on credit card loans were the most significant causes
of the decline in both the net interest income and related margin
in 2000. Lower average credit card outstandings and fee revenues
reflected customer attrition and reduced new account origination,
while narrower spread reflected higher funding costs in 2000.
Competitive pricing pressures in Corporate Banking and Middle
Market Banking and higher nonperforming loans reduced margins
slightly in the commercial loan portfolio.
During 2000, net interest income declined, reflecting a lower
level of loans and the cost of carrying a higher level of nonper-
forming assets.
On a reported basis, net interest margin was 3.72% in 2000,
compared with 4.09% in 1999. The decrease in net interest margin
in 2000 was related to lower credit card spreads as well as a less
favorable earning asset mix.
B A N K O N E C O R P O R A T I O N 43 2 0 0 1 A N N U A L R E P O R T

Noninterest Income
The components of noninterest income for the periods indicated are:
In order to provide more meaningful trend analysis, credit
card revenue and total noninterest income in the above table are
shown on a managed basis. Credit card fee revenue excludes the net
interest revenue associated with securitized credit card receivables.
Components of noninterest income that are primarily related to a
single business segment are discussed within that business segment
rather than the consolidated section.
2001 compared to 2000
Managed banking fees and commissions increased by $194 million,
or 13%, compared to 2000 levels. This increase was primarily the
result of increased annuity sales and fees associated with the in-
house administration of the One Group® mutual funds, which the
Corporation began recording as revenue in the 2000 fourth quarter.
Additionally, this increase reflects growth in retail brokerage sales.
Managed credit card revenue increased $291 million, or 26%,
in 2001 when compared to 2000. This improvement was due to
the third quarter addition of the Wachovia portfolio and significant
items recorded in 2000 (see table 2 on page 41).
Service charges on deposits increased $139 million, or 11%,
in 2001 when compared to 2000. A lower rate environment pro-
duced a shift to the payment of fees from net interest income due
to the lower value ascribed to customers’ compensating deposit
balances.
Fiduciary and investment management fees declined by $29
million, or 4%, in 2001 compared to levels maintained in 2000.
This reduction was as a result of lower investment advisory fees on
equity assets because of overall market conditions.
Investment securities losses were $66 million for 2001 due to
principal investment losses and lower market valuations, partially
offset by the gains on sale of fixed income securities. This was an
improvement from 2000 when investment securities portfolios
activity produced a loss of $235 million. This loss occurred when
significant items were recorded in the second quarter of 2000 (see
table 2 on page 41).
Trading produced gains of $220 million, an increase of $86
million, or 64%, when compared to 2000. This improvement was
due to significant items recorded in 2000 (see table 2 on page 41)
and market value gains.
Other income in 2001 was $360 million compared to a $738
million loss in 2000. This improvement over last year was pre-
dominately due to significant items recorded in 2000 (see table 2
on page 41).
2000 compared to 1999
Banking fees and commissions increased 2% in 2000, compared
with the 1999 levels, as higher loan syndication fees were partially
offset by lower leasing fees for auto loans.
Managed credit card revenue declined 19% to $1.104 billion
in 2000 as compared to 1999, reflecting a decline in managed
credit card receivables as well as writedowns for certain affinity
partnership agreements included in the 2000 significant items (see
table 2 on page 41).
Service charges on deposit accounts, which include deficient
balance fees, increased 2% reflecting growth in cash management
fees, due in part to the extensive cross selling of product offerings,
which was supported by enhanced product features and function-
ality of the core treasury management services provided to cus-
tomers on a national basis.
Fiduciary and investment management fees decreased slightly
in 2000 as compared to 1999, as fee growth from traditional trust
products and services, investment management activities and
shareholder services was offset by the absence of revenues from
certain unprofitable account relationships exited in 2000.
B A N K O N E C O R P O R A T I O N 44 2 0 0 1 A N N U A L R E P O R T
(Dollars in millions) % Change
YEAR ENDED DECEMBER 31 2001 2000 1999 2001-2000 2000-1999Banking fees and commissions $1,731 $1,537 $1,502 13% 2%
Credit card revenue 1,395 1,104 1,363 26 (19)
Service charges on deposits 1,449 1,310 1,283 11 2
Fiduciary and investment management fees 754 783 793 (4) (1)
Investment securities gains (losses) (66) (235) 509 72 N/MTrading 220 134 147 64 (9)
Other income (loss) 360 (738) 685 N/M N/MGain on Indiana divestitures – – 249 N/M N/MGain on sale of Concord – – 111 N/M N/M
Managed noninterest income $5,843 $3,895 $6,642 50% (41)«%
N/M–Not meaningful.
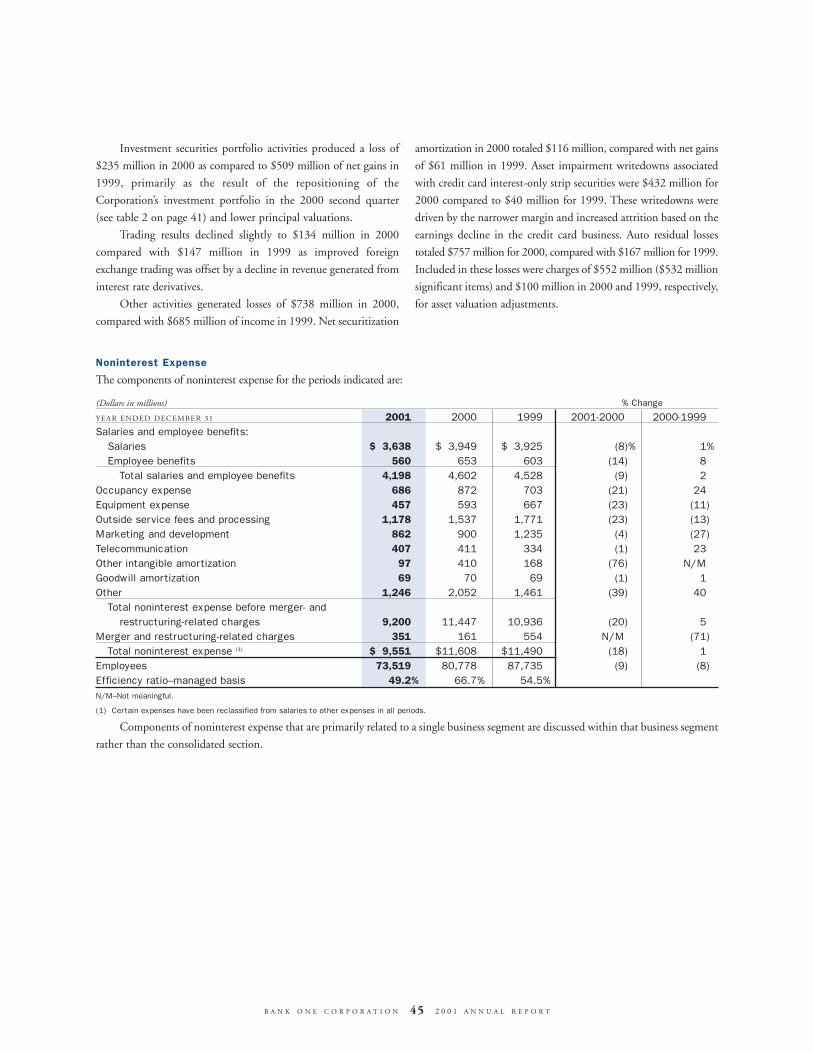
Investment securities portfolio activities produced a loss of
$235 million in 2000 as compared to $509 million of net gains in
1999, primarily as the result of the repositioning of the
Corporation’s investment portfolio in the 2000 second quarter
(see table 2 on page 41) and lower principal valuations.
Trading results declined slightly to $134 million in 2000
compared with $147 million in 1999 as improved foreign
exchange trading was offset by a decline in revenue generated from
interest rate derivatives.
Other activities generated losses of $738 million in 2000,
compared with $685 million of income in 1999. Net securitization
amortization in 2000 totaled $116 million, compared with net gains
of $61 million in 1999. Asset impairment writedowns associated
with credit card interest-only strip securities were $432 million for
2000 compared to $40 million for 1999. These writedowns were
driven by the narrower margin and increased attrition based on the
earnings decline in the credit card business. Auto residual losses
totaled $757 million for 2000, compared with $167 million for 1999.
Included in these losses were charges of $552 million ($532 million
significant items) and $100 million in 2000 and 1999, respectively,
for asset valuation adjustments.
B A N K O N E C O R P O R A T I O N 45 2 0 0 1 A N N U A L R E P O R T
Noninterest Expense
The components of noninterest expense for the periods indicated are:
(Dollars in millions) % Change
YEAR ENDED DECEMBER 31 2001 2000 1999 2001-2000 2000-1999Salaries and employee benefits:
Salaries $««3,638 $÷3,949 $÷3,925 (8)«% 1%
Employee benefits 560 653 603 (14) 8
Total salaries and employee benefits 4,198 4,602 4,528 (9) 2
Occupancy expense 686 872 703 (21) 24
Equipment expense 457 593 667 (23) (11)
Outside service fees and processing 1,178 1,537 1,771 (23) (13)
Marketing and development 862 900 1,235 (4) (27)
Telecommunication 407 411 334 (1) 23
Other intangible amortization 97 410 168 (76) N/MGoodwill amortization 69 70 69 (1) 1
Other 1,246 2,052 1,461 (39) 40
Total noninterest expense before merger- andrestructuring-related charges 9,200 11,447 10,936 (20) 5
Merger and restructuring-related charges 351 161 554 N/M (71)
Total noninterest expense (1) $««9,551 $11,608 $11,490 (18) 1
Employees 73,519 80,778 87,735 (9) (8)
Efficiency ratio–managed basis 49.2% 66.7% 54.5%
N/M–Not meaningful.
(1) Certain expenses have been reclassified from salaries to other expenses in all periods.
Components of noninterest expense that are primarily related to a single business segment are discussed within that business segment
rather than the consolidated section.

2001 compared to 2000
Salary and benefit costs were $4.198 billion in 2001, down 9%
from $4.602 billion in 2000. This decline was attributed to
expense savings from reduced headcount and cost reductions asso-
ciated with the modification of the Corporation’s benefit plans.
Occupancy expense declined in 2001 by $186 million, or
21%, from 2000 levels. The decrease in 2001 was the result of less
occupied space.
Equipment expense in 2001 decreased $136 million com-
pared to the previous year. Reduced furniture and equipment
rental along with lower maintenance and depreciation expense was
primarily the reason for the 23% decline.
Outside service fees and processing expense also declined in
2001 compared to a year ago. The majority of the 23% decline was
attributed to a reduction in consulting expense and the benefits
from contract renegotiations and other waste-reduction initiatives.
For 2001, marketing and development expense decreased
$38 million, or 4%, compared to 2000 as continued expense
reductions in the Retail line of business more than offset increased
expenditures for First USA.
Other intangible amortization expense decreased by
$313 million, or 76%, from a year ago, predominately due to sig-
nificant items recorded in 2000 (see table 2 on page 41).
Other expense was reduced by $806 million, or 39%, when
compared to the year 2000. This decrease was primarily due to sig-
nificant items recorded in 2000 (see table 2 on page 41). This
reduction also reflects the continuation of the Corporation’s waste-
reduction initiatives to lower expenses for such items as travel,
entertainment and other miscellaneous items, which was partially
offset by system conversion costs. The Corporation successfully
converted the Texas/Louisiana deposit system during the 2001 third
quarter and the Arizona/Utah deposit system in the 2001 fourth
quarter and is working to complete the remaining system conver-
sions around year-end 2002.
The Corporation recorded a $354 million pre-tax restructur-
ing-related charge in the 2001 fourth quarter for additional real
estate and severance costs to accomplish more rapid expense reduc-
tions, accelerated systems conversions and other consolidations.
2000 compared to 1999
Salary and benefit costs were $4.602 billion in 2000, up 2% from
$4.528 billion in 1999. The increase was due to higher salary
levels, partially offset by reduced headcount and lower incentive
compensation in 2000.
Occupancy expense in 2000 was up $169 million, or 24%, from
1999 levels. This increase included $98 million of the $337 million
significant item (see table 2 on page 41) related to writedowns con-
cerning vacant space and other occupancy-related matters.
Equipment expense decreased 11% in 2000 from 1999, pri-
marily due to reduced furniture and equipment rental and lower
maintenance and depreciation expense.
Outside service fees and processing expense decreased 13%
compared to 1999. A portion of the decrease in 2000 reflected con-
sulting and implementation costs incurred to support Year 2000
readiness, as well as other development, technology and reengineer-
ing initiatives in various businesses in 1999. The 2000 decrease also
included benefits from the Corporation’s waste-reduction initiatives.
Marketing and development expense decreased 27% in 2000
from 1999. Credit card marketing efforts accounted for much of
the fluctuations in this period.
Other intangible amortization expense included $288 million
and $21 million of additional writedowns in purchased credit card
relationships in 2000 and 1999, respectively. In 2000, $275
million of these writedowns is included in table 1 on page 41.
Other expense increased $591 million in 2000 compared
with 1999, primarily relating to $538 million of significant items
recorded in 2000 (see table 2 on page 41). These charges included
$190 million increase to the legal reserve to cover increased corpo-
rate and business litigation exposure, approximately $85 million of
fixed assets and software write-offs, as well as miscellaneous and
operational errors.
Applicable Income Taxes
The Corporation’s income (loss) before income taxes and cumula-
tive effect of change in accounting principle, as well as applicable
income tax expense (benefit) and effective tax rate for each of the
past three years follows:
(Dollars in millions) 2001 2000 1999Income (loss) before income
taxes and the cumulative effect of change in accounting principle $3,800 $(1,080) $4,974
Applicable income taxes (benefits) 1,118 (569) 1,495
Effective tax rate 29.4% 52.7% 30.1%
Applicable income tax expense (benefit) for all three years
included benefits for tax-exempt income, tax-advantaged invest-
ments and general business tax credits offset by the effect of
nondeductible expenses, including goodwill. In the case of a loss
before income taxes and the cumulative effect of change in
accounting principle, the effect of the net tax benefits described
above is to increase, rather than decrease, the effective rate of tax.
This is the primary reason for the difference in effective tax rates
between 2000 and the other years presented. More detail on
income taxes can be found in Note 20 to the consolidated finan-
cial statements beginning on page 90.
B A N K O N E C O R P O R A T I O N 46 2 0 0 1 A N N U A L R E P O R T

RISK MANAGEMENTRisk is an inherent part of the Corporation’s businesses and activi-
ties. The Corporation’s ability to properly and effectively identify,
assess, monitor and manage risk in its business activities is critical
to its soundness and profitability. The diversity of the
Corporation’s lines of business helps reduce the impact that volatil-
ity in any particular area has on its operating results as a whole.
The risk management process of the Corporation is dynamic
and requires effective communication between lines of business
and corporate-level departments, as well as judgment and knowl-
edge of specialized products and markets. The Corporation’s risk
management activities consider both on- and off-balance sheet
exposure. The Corporation’s Senior Management takes an active
role in the risk management process and has developed policies and
procedures that require specific functions to assist in the identifica-
tion, assessment and control of various risks. In recognition of the
nature of Bank One’s business activities, the Corporation’s risk
management policies, procedures and methodologies are subject to
ongoing review and modification.
Overall risk management policies for the Corporation are
established by the Corporate Risk and Capital Committee, which
reviews the Corporation’s performance relative to these policies.
The Corporate Risk and Capital Committee has responsibility for
various risk committees of the Corporation’s lines of business and
assists the Audit and Risk Management Committee of the Board of
Directors in monitoring Bank One’s policies and guidelines for risk
management. The Audit and Risk Management Committee
reviews risk management policies and procedures, and receives
regular updates regarding the Corporation’s compliance with these
policies and procedures, including credit, market, liquidity, and
operational risks. Individual line of business committees monitor
and review their respective line of business compliance with the
Corporation’s risk management practices. These committees
manage specific risks, sales practices, pricing, allowance adequacy,
legal enforceability, and operational and systems risks.
Corporate Risk Management, Finance, Law, Compliance and
Government Relations also assist Senior Management and the
Corporate Risk and Capital Committee in monitoring and con-
trolling the Corporation’s risk profile. Corporate Risk
Management is responsible for risk policy development and over-
seeing implementation, risk analysis, and risk reporting to Senior
Management. The Corporate Risk and Capital Committee has
responsibility for monitoring aggregate market and credit risk. The
Corporation’s Asset/Liability Committee (“ALCO”) has direct
oversight responsibility for the Corporation’s liquidity position and
periodically updates the Audit and Risk Management Committee.
Corporate Audit periodically examines and evaluates the
Corporation’s operations and control environment. The
Corporation remains committed to employing qualified personnel
with appropriate expertise to implement effectively the
Corporation’s risk management and monitoring systems.
The Corporation’s business activities generate liquidity, market,
credit and operational risks:
• Liquidity risk is the risk that the Corporation is unable to meet
all current and future financial obligations in a timely manner.
• Market risk is the risk that changes in future market rates or
prices will make the Corporation’s positions less valuable.
• Credit risk is the risk of loss from borrowers and counter-
parties’ failure to perform according to the terms of a
transaction.
• Operational risk, among other things, includes the risk of loss
due to errors in product and service delivery, failure of
internal controls over information systems and accounting
records, and internal and external fraud.
LIQUIDITY RISK MANAGEMENT
Liquidity is managed to preserve stable, reliable and cost-effective
sources of cash to meet all current and future financial obligations.
At Bank One, strong liquidity is provided by a variety of sources
including:
• A portfolio of liquid assets, comprised of federal funds sold,
deposit placements and marketable securities.
• A large customer deposit base arising through the
Corporation’s Commercial Banking and Retail business
activities.
• A diversified mix of short- and long-term funding sources
from the wholesale financial markets.
• Significant borrowing capacity at the Federal Reserve
Discount Window.
Bank One is an active participant in the global financial
markets through which it obtains a significant amount of funding.
These markets serve as a cost-effective source of funds and are a
critical component of the Corporation’s liquidity management.
Decisions to access these markets are based upon relative costs,
prospective views of balance sheet growth, and a targeted liquidity
profile. A disruption in the financial markets could limit access to
liquidity for the Corporation.
The Corporation’s ability to maintain regular access to com-
petitively priced wholesale funds is fostered by strong debt ratings
from the major credit rating agencies. Management views the fol-
lowing factors as critical to retaining high credit ratings:
• Strong capital ratios and credit quality
• A stable, diverse earnings stream
• Diversity of liquidity sources
• Strong liquidity monitoring procedures
B A N K O N E C O R P O R A T I O N 47 2 0 0 1 A N N U A L R E P O R T

At December 31, 2001, the Corporation and its principal
banks had the following long- and short-term debt ratings:
Senior Short-Term Debt Long-Term Debt
S & P Moody’s S & P Moody’sThe Corporation
(Parent) A-1 P-1 A Aa3Principal Banks A-1 P-1 A+ Aa2
Treasury is responsible for measuring and managing the liquid-
ity profile with oversight from ALCO. A combination of daily,
weekly and monthly reports provided to Senior Management detail
the following:
• Internal liquidity risk metrics
• Composition and level of the liquid asset portfolio
• Timing differences in short-term cash flow obligations
• Available pricing and market access to the financial markets for
capital, term-debt and securitization transactions
• Exposure to contingent draws on the Corporation’s liquidity
The Corporation monitors and manages liquidity considering
both on- and off-balance sheet exposures. On-balance sheet liquidity
is impacted by balance sheet growth, level and mix of customer
deposits, and access to wholesale funding. In the normal course of
business, the Corporation enters into certain forms of off-balance
sheet transactions, including credit card securitizations, unfunded
loan commitments and letters of credit. These transactions are
managed through the Corporation’s various risk management
processes. Liquidity facilities provided to Bank One administered
and third party administered specialized financing entities might
require funding if the Corporation’s short-term rating were to fall to
A-2 or P-2. Credit card securitizations would be subject to early
amortization if certain performance measures of the issuing trust are
not maintained. Either event would result in additional funding
requirements for the Corporation.
MARKET RISK MANAGEMENT
Overview
Market risk refers to potential losses arising from changes in inter-
est rates, foreign exchange rates, equity prices and commodity
prices. The portfolio effect of diverse trading activities helps reduce
market risk. Through its trading activities, the Corporation strives
to take advantage of profit opportunities available in interest and
exchange rate movements. In asset and liability management activ-
ities, policies are in place to closely manage structural interest rate
and foreign exchange rate risk. Disclosures about the fair value of
financial instruments, which reflect changes in market prices and
rates, can be found in Note 23 to the consolidated financial state-
ments beginning on page 93.
Trading Activities
The Corporation’s trading activities are primarily customer-ori-
ented. Cash instruments are bought and sold to satisfy customers’
investment needs. Derivative contracts are initially entered into to
meet the risk management needs of customers. The Corporation
enters into subsequent transactions to manage the level of risk in
accordance with approved limits. In order to accommodate cus-
tomers, an inventory of capital markets instruments is carried, and
access to market liquidity is maintained by making bid-offer prices
to other market makers. The Corporation may also take proprietary
trading positions in various capital markets cash instruments and
derivatives, and these positions are designed to profit from antici-
pated changes in market factors.
Many trading positions are kept open for brief periods of
time, often less than one day. Other positions may be held for
longer periods. Trading positions are carried at estimated fair value.
Realized and unrealized gains and losses on these positions are
included in noninterest income as trading.
Value-At-Risk
The Corporation has developed policies and procedures to manage
market risk in its trading activities through a value-at-risk meas-
urement and control system, a stress testing process and dollar
trading limits. The objective of this process is to quantify and
manage market risk in order to limit single and aggregate exposures.
Dollar trading limits are subject to varying levels of approval by
senior line of business management, with review by Corporate
Market Risk Management. Corporate Market Risk Management
works with various line of business personnel in refining and moni-
toring market risk policies and procedures, and is the primary over-
sight unit for market risk arising from line of business activities
creating market risk for the Corporation.
For trading portfolios, value-at-risk measures the maximum
fair value the Corporation could lose on a trading position, given a
specified confidence level and time horizon. Value-at-risk limits and
exposures are monitored daily for each significant trading portfolio.
Stress testing is similar to value-at-risk except that the confidence
level is geared to capture more extreme, less frequent market events.
B A N K O N E C O R P O R A T I O N 48 2 0 0 1 A N N U A L R E P O R T

The Corporation’s value-at-risk calculation measures poten-
tial losses in fair value using a 99% confidence level and a one-day
time horizon. This equates to 2.33 standard deviations from the
mean under a normal distribution. This means that, on average,
daily profits and losses are expected to exceed value-at-risk one out
of every 100 overnight trading days. Value-at-risk is calculated
using a statistical model applicable to cash and derivative positions,
including options.
Average, high and low of the value-at-risk measurements for
2001 and 2000, along with value-at-risk amounts at December 31,
2001 and December 31, 2000 are:
2001(In millions) Average High Low Dec. 31Risk type
Interest rate $11 $15 $8 $11
Currency exchange rate 1 4 – –
Equity 1 4 – 1
Aggregate trading portfolio market risk $12
2000(In millions) Average High Low Dec. 31Risk type
Interest rate $11 $15 $7 $7
Currency exchange rate 1 1 – 1
Equity 1 2 1 1
Aggregate trading portfolio market risk $9
Interest rate risk was the predominant type of market risk
incurred during 2001. At December 31, 2001, approximately 90%
of primary market risk exposures were related to interest rate risk.
Currency exchange rate, equity and commodity risks accounted for
3%, 6% and 1%, respectively, of primary market risk exposures.
U.S. Treasury, corporate, asset-backed, municipal, and mort-
gage-backed securities generated 75% of interest rate risk. Interest
rate derivatives accounted for 22% of interest rate risk, while the
remaining 3% was derived primarily from money market and
foreign exchange trading activities.
Foreign exchange spot, forward and option trading generated
100% of the currency exchange rate risk. Of the currency exchange
rate risk arising from these activities, 55% related to major cur-
rency exposures and 45% to minor currencies.
Equity derivatives trading and off-setting cash positions gener-
ated 100% of equity price risk.
At December 31, 2001, aggregate portfolio market risk expo-
sures were 33% higher than at year-end 2000. The majority of this
increase was due to increased market risk in various trading books.
Structural Interest Rate Risk Management
Interest rate risk exposure in the Corporation’s core non-trading
business activities, i.e., asset/liability management (“ALM”) posi-
tion, is a result of reprice, option, and basis risks associated with
on- and off-balance sheet positions. Reprice risk represents timing
mismatches in the Corporation’s ability to alter contractual rates
earned on financial assets or paid on liabilities in response to
changes in market interest rates. Basis risk refers to the potential for
changes in the underlying relationship between market rates or
indices, which subsequently result in a narrowing of the spread
earned on a loan or investment relative to its cost of funds. Option
risk arises from “embedded options” present in many financial
instruments such as interest rate options, loan prepayment options
and deposit early withdrawal options. These provide customers and
investors opportunities to take advantage of directional changes in
rates, which could have an adverse impact on the Corporation’s
margin performance. Embedded options are complex risk posi-
tions that are difficult to predict and offset, and are a large compo-
nent of the interest rate risk exposure to the Corporation.
The Corporation has established risk measures, limits, policy
guidelines and internal control mechanisms (collectively referred
to as the Interest Rate Risk Policy) for managing the overall ALM
position, including both on- and off-balance sheet positions.
Responsibility for the management of interest rate risk resides with
Treasury with oversight by the Corporation’s ALCO. Business unit
management is responsible for understanding their interest rate
risk, while the Corporation controls and monitors this risk centrally.
The ALM position is measured using sophisticated risk man-
agement tools, including earnings simulation modeling and eco-
nomic value of equity sensitivity analysis, to capture near-term
and longer-term interest rate risk exposures. Senior Management
is regularly apprised of the risks associated with the ALM position,
with exposures tested under multiple rate and yield curve scenar-
ios. The Corporation balances the return potential of the ALM
position against the desire to limit volatility in earnings and/or
economic value.
B A N K O N E C O R P O R A T I O N 49 2 0 0 1 A N N U A L R E P O R T
B A N K O N E C O R P O R A T I O N 50 2 0 0 1 A N N U A L R E P O R T
Earnings simulation analysis, or earnings-at-risk, measures the
sensitivity of pretax earnings to various interest rate movements.
The base-case scenario is established using current interest rates.
The comparative scenarios assume an immediate parallel shock in
increments of ± 100 basis point rate movements. Numerous other
scenarios are analyzed, including more gradual rising or declining
rate changes and non-parallel rate shifts. Estimated earnings for
each scenario are calculated over multiple years. The interest rate
scenarios are used for analytical purposes and do not necessarily
represent Management’s view of future market movements.
Rather, these are intended to provide a measure of the degree of
volatility interest rate movements may introduce into the earnings
and economic value of the Corporation.
The Corporation’s 12-month pretax earnings sensitivity
profile as of year-end 2001 and 2000 is as follows:
Immediate Changein Rates
(In millions) -100 bp +100 bpDecember 31, 2001 $174 $(341)
December 31, 2000 $««29 $÷««5
The increase in earnings sensitivity during the year reflects an
increase in the duration of the Corporation’s earning assets, in part
driven by management actions taken in anticipation of declining
short-term interest rates.
Modeling the sensitivity of earnings to interest rate risk is
highly dependent on numerous assumptions embedded in the
model. While the earnings sensitivity analysis incorporates
Management’s best estimate of interest rate and balance sheet
dynamics under various market rate movements, the actual behav-
ior and resulting earnings impact will likely differ from that pro-
jected. For mortgage-related assets, the earnings simulation model
captures the expected prepayment behavior under changing inter-
est rate environments. Additionally, the model measures the impact
of interest rate caps and floors on adjustable-rate loan products.
Assumptions and methodologies regarding the interest rate or
balance behavior of indeterminate maturity products, e.g., credit
card receivables, savings, money market, NOW and demand
deposits reflect Management’s best estimate of expected future
behavior. Sensitivity of service fee income to market interest rate
levels, such as those related to cash management products, is
included as well. The earnings sensitivity profile does not reflect
potential differences in the timing of income recognition on trans-
actions that were designed to have an offsetting economic effect.
For example, the interest-only strip recorded in conjunction with a
credit card securitization may be subsequently subject to the account-
ing recognition of impairment due to adverse changes in market
interest and payment rates while the income or expense on offsetting
asset and liability positions are recorded on an accrual basis.
In addition to the earnings sensitivity analysis described
above, Management uses an economic value of equity sensitivity
technique to capture the risk in both short- and long-term posi-
tions. This analysis involves calculating future cash flows over the
full life of all current assets, liabilities and off-balance sheet posi-
tions under different rate scenarios. The discounted present value
of all cash flows represents the Corporation’s economic value of
equity. The sensitivity of this value to shifts in the yield curve
allows Management to measure longer-term repricing and option
risk in the portfolio. Interest rate risk in trading activities and other
activities, including certain overseas balance sheet positions, is
managed principally as trading risk.
Foreign Exchange Risk Management
Whenever possible, foreign currency-denominated assets are
funded with liability instruments denominated in the same cur-
rency. If a liability denominated in the same currency is not imme-
diately available or desired, a forward foreign exchange or
cross-currency swap contract is used to hedge the risk due to cross-
currency funding.
To minimize the capital impact of translation gains or losses
measured on an after-tax basis, the Corporation uses forward
foreign exchange contracts to hedge the exposure created by non-
U.S. dollar investments in overseas branches and subsidiaries.
CREDIT RISK MANAGEMENT
The Corporation is exposed to the risk that borrowers or counter-
parties may default on their obligations to the Corporation. These
transactions create credit exposure that is reported both on- and
off- balance sheet. On-balance sheet credit exposure includes such
items as loans. Off-balance sheet credit exposure includes
unfunded credit commitments and other credit-related financial
instruments. Credit exposures resulting from derivative financial
instruments are discussed in the “Derivative Financial
Instruments” section beginning on page 61.
The Corporation’s Risk and Capital Committee has developed
policies to manage the level and composition of risk in its credit port-
folio, and reviews the Corporation’s performance relative to those
policies. The objective of this credit risk management process is to
quantify and manage credit risk on an aggregate portfolio basis as well
as to reduce the risk of loss resulting from an individual customer
default. Corporate Risk Management works with lending officers and
line of business personnel involved in credit decision making and is
involved in the implementation, refinement, and monitoring of the
Corporation’s credit policies and procedures. Credit limits are subject
to varying levels of approval by senior line of business management
and Corporate Risk Management.

In order to meet its credit risk management objectives, the
Corporation maintains a risk profile that is diverse in terms of borrower
concentrations, product-type, and industry and geographic concentra-
tions. Additional diversification of the Corporation’s exposure is accom-
plished through syndication of credits, participations, loan sales,
securitizations, credit derivatives and other risk-reduction measures.
Consumer Credit Risk Management (Including Credit
Card and Retail)
The Corporation’s consumer risk management process utilizes
sophisticated risk assessment tools, including credit scoring, across
the life cycle of each type of loan product, including credit cards,
loans secured by real estate, vehicle loans and leases, and other unse-
cured loans. These tools are used to target product and price offerings
to best match the consumer risk profile to identify consumers whose
risk profile has deteriorated for proactive risk mitigation efforts, and
to initiate portfolio-wide risk management strategies to ensure that
the portfolios remain within Management-defined risk tolerance
levels.
Management of consumer lines of business continues to proac-
tively manage the risk/reward relationship of each consumer loan
portfolio segment such that these businesses are positioned to achieve
profitability targets and required rates of return on investment.
Commercial Credit Risk Management
The Corporation’s commercial risk management process utilizes
enterprise policies focused on origination, portfolio management
and managed asset related activities. This risk management frame-
work establishes approval authorities and related processes, risk
rating methodologies, portfolio review parameters and management
of problem loans. Line of business Senior Management and
Corporate Risk Management are actively engaged in these activities
as well as continuously exploring methods to improve commercial
risk management.
Management of the Commercial Banking line of business con-
tinues to proactively manage the risk/reward relationship of each
commercial relationship and portfolio segment such that these busi-
nesses are positioned to achieve profitability targets and required
rates of return.
Within the Commercial Banking portfolio, borrowers/transac-
tions are assigned specific obligor risk ratings (on a scale from 1–20,
and facility rating 1-8 based upon collateral supporting the transaction)
by the originating credit officer based upon an established underwrit-
ing and approval process. Approvals are made based upon the amount
of credit exposure inherent in the credit extension and are reviewed by
senior line of business management and Corporate Risk Management,
as appropriate. Risk ratings are reviewed periodically by senior line of
business personnel and Corporate Risk Management and revised, if
needed, to reflect the borrowers’/transactions’ current risk profile. The
lower categories of credit risk are equivalent to the four bank regulatory
classifications: Special Mention, Substandard, Doubtful and Loss.
The Corporation occasionally enters into credit derivatives as
one method of credit protection against the deterioration of identified
credit risk on loans and loan commitments. At December 31, 2001,
credit derivatives were in place to cover approximately $3.3 billion in
notional commercial credit exposure. Realized and unrealized gains
and lossses on credit derivatures are recorded in noninterest income as
trading.
OPERATIONAL RISK MANAGEMENT
The Corporation is exposed to numerous types of operational risk.
Operational risk generally refers to the risk of loss resulting from the
Corporation’s operations, including, but not limited to, the risk of fraud
by employees or persons outside the Corporation, the execution of unau-
thorized transactions by employees, errors relating to transaction process-
ing and systems, and breaches of the internal control system and
compliance requirements. This risk of loss also includes the potential
legal actions that could arise as a result of the operational deficiency or as
a result of noncompliance with applicable regulatory standards.
The Corporation operates in many different businesses in diverse
markets and places reliance on the ability of its employees and systems
to process a high number of transactions. In the event of a breakdown
in the internal control systems, improper operation of systems or
improper employee actions, the Corporation could suffer financial
loss, face regulatory action and suffer damage to its reputation. In
order to address this risk, Management maintains a system of internal
controls with the objective of providing proper transaction authoriza-
tion and execution, safeguarding of assets from misuse or theft, and
ensuring the reliability of financial and other data.
The Corporation maintains systems of controls that provide
Management with timely and accurate information about the opera-
tions of Bank One. These systems have been designed to manage
operational risk at appropriate levels given the Corporation’s financial
strength, the environment in which it operates, and considering
factors such as competition and regulation. Bank One has also estab-
lished procedures that are designed to ensure that policies relating to
conduct, ethics and business practices are followed on a uniform basis.
In certain cases, the Corporation has experienced losses from opera-
tional risk. Such losses have included the effects of operational errors
that the Corporation has discovered and taken charges in the income
statement. While there can be no assurance the Corporation will not
suffer such losses in the future, Management continually monitors
and improves its internal controls, systems and corporate-wide
processes and procedures. Furthermore, Management believes the
plans to streamline the organization through charter consolidations
and further systems integration and policies enacted to push down
reporting accountabilities further in the organization, have improved
the Corporation’s ability to identify and limit operational risk.
B A N K O N E C O R P O R A T I O N 51 2 0 0 1 A N N U A L R E P O R T
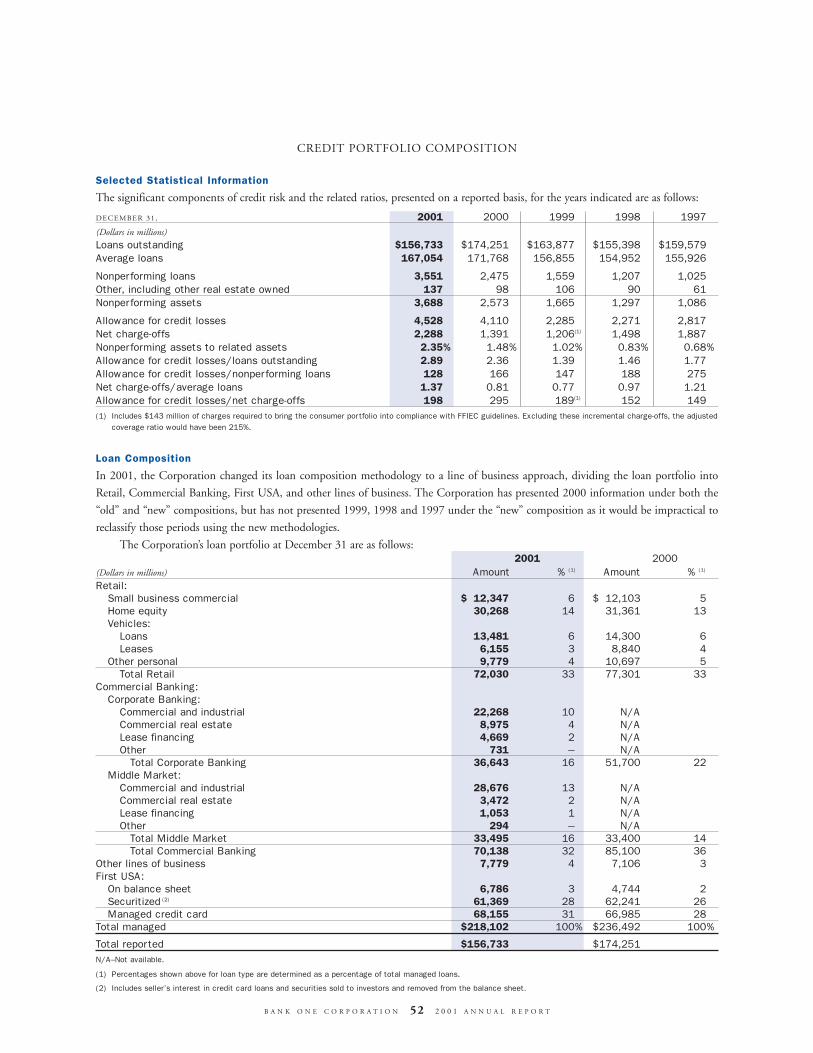
CREDIT PORTFOLIO COMPOSITION
Selected Statistical Information
The significant components of credit risk and the related ratios, presented on a reported basis, for the years indicated are as follows:
DECEMBER 31, 2001 2000 1999 1998 1997(Dollars in millions)
Loans outstanding $156,733 $174,251 $163,877 $155,398 $159,579
Average loans 167,054 171,768 156,855 154,952 155,926
Nonperforming loans 3,551 2,475 1,559 1,207 1,025
Other, including other real estate owned 137 98 106 90 61
Nonperforming assets 3,688 2,573 1,665 1,297 1,086
Allowance for credit losses 4,528 4,110 2,285 2,271 2,817
Net charge-offs 2,288 1,391 1,206(1) 1,498 1,887
Nonperforming assets to related assets 2.35% 1.48% 1.02% 0.83% 0.68%
Allowance for credit losses/loans outstanding 2.89 2.36 1.39 1.46 1.77
Allowance for credit losses/nonperforming loans 128 166 147 188 275
Net charge-offs/average loans 1.37 0.81 0.77 0.97 1.21
Allowance for credit losses/net charge-offs 198 295 189(1) 152 149
(1) Includes $143 million of charges required to bring the consumer portfolio into compliance with FFIEC guidelines. Excluding these incremental charge-offs, the adjustedcoverage ratio would have been 215%.
Loan Composition
In 2001, the Corporation changed its loan composition methodology to a line of business approach, dividing the loan portfolio into
Retail, Commercial Banking, First USA, and other lines of business. The Corporation has presented 2000 information under both the
“old” and “new” compositions, but has not presented 1999, 1998 and 1997 under the “new” composition as it would be impractical to
reclassify those periods using the new methodologies.
The Corporation’s loan portfolio at December 31 are as follows:2001 2000
(Dollars in millions) Amount % (1) Amount % (1)
Retail:Small business commercial $÷12,347 6 $««12,103 5
Home equity 30,268 14 31,361 13
Vehicles:Loans 13,481 6 14,300 6
Leases 6,155 3 8,840 4
Other personal 9,779 4 10,697 5
Total Retail 72,030 33 77,301 33
Commercial Banking:Corporate Banking:
Commercial and industrial 22,268 10 N/ACommercial real estate 8,975 4 N/ALease financing 4,669 2 N/AOther 731 – N/A
Total Corporate Banking 36,643 16 51,700 22
Middle Market:Commercial and industrial 28,676 13 N/ACommercial real estate 3,472 2 N/ALease financing 1,053 1 N/AOther 294 – N/A
Total Middle Market 33,495 16 33,400 14
Total Commercial Banking 70,138 32 85,100 36
Other lines of business 7,779 4 7,106 3
First USA:On balance sheet 6,786 3 4,744 2
Securitized (2) 61,369 28 62,241 26
Managed credit card 68,155 31 66,985 28
Total managed $218,102 100% $236,492 100%
Total reported $156,733 $174,251
N/A–Not available.
(1) Percentages shown above for loan type are determined as a percentage of total managed loans.
(2) Includes seller’s interest in credit card loans and securities sold to investors and removed from the balance sheet.
B A N K O N E C O R P O R A T I O N 52 2 0 0 1 A N N U A L R E P O R T

Prior to 2001, the Corporation’s loan portfolio was divided into commercial, consumer and credit card loan categories as of
December 31:2000 1999 1998 1997
(Dollars in millions) Amount % (1) Amount % (1) Amount % (1) Amount % (1)
Commercial:Domestic:
Commercial $÷65,270 28% $÷59,070 26% $÷53,362 25% $÷48,458 25%
Real estate:Construction 5,757 2 5,836 3 5,108 2 4,639 2
Other 16,778 7 18,817 8 17,787 8 16,545 8
Lease financing 5,818 3 5,562 2 6,236 3 4,537 2
Foreign 6,837 3 7,067 3 5,945 3 5,127 3
Total commercial 100,460 43 96,352 42 88,438 41 79,306 40
Consumer:Residential real estate 40,596 17 32,313 14 25,804 12 28,088 14
Automotive–loans/leases 20,741 9 23,567 11 20,634 10 17,998 9
Other 7,710 3 7,608 3 11,488 5 11,522 6
Total consumer 69,047 29 63,488 28 57,926 27 57,608 29
Credit card: On balance sheet 4,744 2 4,037 2 9,034 4 22,665 12
Securitized (2) 62,241 26 65,319 28 60,993 28 37,414 19
Managed credit card 66,985 28 69,356 30 70,027 32 60,079 31
Total managed $236,492 100% $229,196 100% $216,391 100% $196,993 100%
Total reported $174,251 $163,877 $155,398 $159,579
(1) Percentages shown above for loan type are determined as a percentage of total managed loans.
(2) Includes seller’s interest in credit card loans and securities sold to investors and removed from the balance sheet.
B A N K O N E C O R P O R A T I O N 53 2 0 0 1 A N N U A L R E P O R T
Managed Credit Card Receivables
For analytical purposes, the Corporation reports credit card receiv-
ables on both a reported basis and a managed basis. Reported credit
card receivables include those receivables held in the portfolio and
reported on the balance sheet. Managed credit card receivables
include reported credit card receivables and those sold to investors
through securitization (see page 64 for discussion of Loan
Securitizations).
The following table shows the average managed credit card
receivables and the related charge-off and delinquency rates for the
years ended:
DECEMBER 31, 2001 2000 1999(Dollars in millions)
Average balances:Credit card loans $««6,884 $÷4,754 $««7,233
Securitized credit card receivables 58,563 61,424 61,747
Total average managed credit card receivables 65,447 66,178 68,980
Total net charge-offs (including securitizations) $««3,823 $««3,584 $««3,790
Net charge-offs/average totalreceivables (1) 5.84% 5.42% 5.49%
Credit card delinquency rate at period-end:
30 or more days 4.46% 4.51% 4.57%
90 or more days 1.93% 2.02% 2.13%
(1) Ratios include $143 million of securitized charge-offs taken in the fourth quar-ter of 1999 related to the early adoption of certain of the FFIEC’s consumercharge-off guidelines.
The increase in the managed credit card charge-off rate to
5.84% in 2001 from 5.42% in 2000 reflected the general weakness
in the United States economy during 2001. Consumer credit
markets generally saw increased levels of delinquency and loss
through 2001. Nationally, consumers filed for bankruptcy in 2001
in much higher numbers than in any prior year. Credit management
tools used to manage the level and volatility of losses for credit card
accounts have been continually updated and where appropriate these
tools were adjusted to reduce credit risk in 2001. Management
believes the quality of new credit card accounts opened in 2001 is
superior to the quality of accounts opened in preceding years.
Management of risk in the existing accounts also improved in 2001.
The benefit of these actions is seen in a modest level of volatil-
ity experienced in losses on credit card accounts despite the weak-
ness in the economy. The Corporation currently expects that credit
losses will increase modestly in 2002. Future charge-offs in the
credit card portfolio and credit quality are subject to uncertainties
which may cause actual results to differ widely from that fore-
casted, including the direction and level of loan delinquencies,
changes in consumer behavior, bankruptcy trends, portfolio sea-
soning, interest rate movements, and portfolio mix, among other
things. While current economic and credit data suggests that credit
quality will not significantly deteriorate, material deterioration in
the general economy could materially change these expectations.
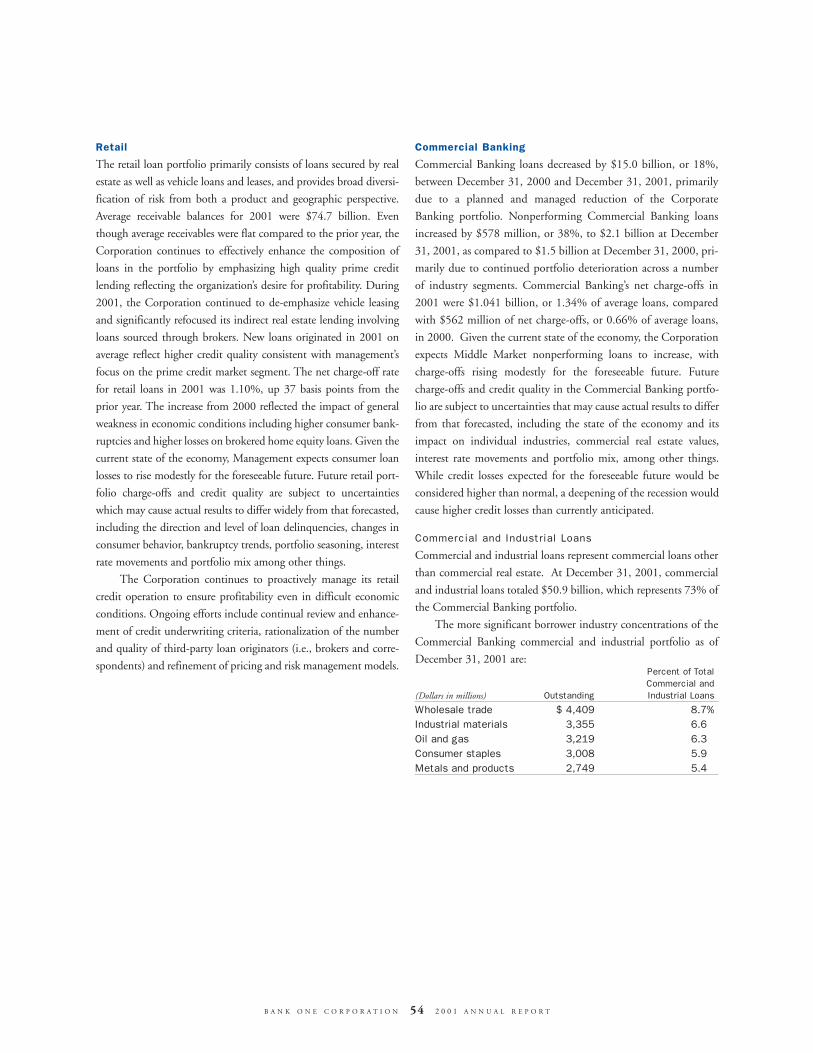
B A N K O N E C O R P O R A T I O N 54 2 0 0 1 A N N U A L R E P O R T
Retail
The retail loan portfolio primarily consists of loans secured by real
estate as well as vehicle loans and leases, and provides broad diversi-
fication of risk from both a product and geographic perspective.
Average receivable balances for 2001 were $74.7 billion. Even
though average receivables were flat compared to the prior year, the
Corporation continues to effectively enhance the composition of
loans in the portfolio by emphasizing high quality prime credit
lending reflecting the organization’s desire for profitability. During
2001, the Corporation continued to de-emphasize vehicle leasing
and significantly refocused its indirect real estate lending involving
loans sourced through brokers. New loans originated in 2001 on
average reflect higher credit quality consistent with management’s
focus on the prime credit market segment. The net charge-off rate
for retail loans in 2001 was 1.10%, up 37 basis points from the
prior year. The increase from 2000 reflected the impact of general
weakness in economic conditions including higher consumer bank-
ruptcies and higher losses on brokered home equity loans. Given the
current state of the economy, Management expects consumer loan
losses to rise modestly for the foreseeable future. Future retail port-
folio charge-offs and credit quality are subject to uncertainties
which may cause actual results to differ widely from that forecasted,
including the direction and level of loan delinquencies, changes in
consumer behavior, bankruptcy trends, portfolio seasoning, interest
rate movements and portfolio mix among other things.
The Corporation continues to proactively manage its retail
credit operation to ensure profitability even in difficult economic
conditions. Ongoing efforts include continual review and enhance-
ment of credit underwriting criteria, rationalization of the number
and quality of third-party loan originators (i.e., brokers and corre-
spondents) and refinement of pricing and risk management models.
Commercial Banking
Commercial Banking loans decreased by $15.0 billion, or 18%,
between December 31, 2000 and December 31, 2001, primarily
due to a planned and managed reduction of the Corporate
Banking portfolio. Nonperforming Commercial Banking loans
increased by $578 million, or 38%, to $2.1 billion at December
31, 2001, as compared to $1.5 billion at December 31, 2000, pri-
marily due to continued portfolio deterioration across a number
of industry segments. Commercial Banking’s net charge-offs in
2001 were $1.041 billion, or 1.34% of average loans, compared
with $562 million of net charge-offs, or 0.66% of average loans,
in 2000. Given the current state of the economy, the Corporation
expects Middle Market nonperforming loans to increase, with
charge-offs rising modestly for the foreseeable future. Future
charge-offs and credit quality in the Commercial Banking portfo-
lio are subject to uncertainties that may cause actual results to differ
from that forecasted, including the state of the economy and its
impact on individual industries, commercial real estate values,
interest rate movements and portfolio mix, among other things.
While credit losses expected for the foreseeable future would be
considered higher than normal, a deepening of the recession would
cause higher credit losses than currently anticipated.
Commercial and Industrial Loans
Commercial and industrial loans represent commercial loans other
than commercial real estate. At December 31, 2001, commercial
and industrial loans totaled $50.9 billion, which represents 73% of
the Commercial Banking portfolio.
The more significant borrower industry concentrations of the
Commercial Banking commercial and industrial portfolio as of
December 31, 2001 are:Percent of TotalCommercial and
(Dollars in millions) Outstanding Industrial Loans
Wholesale trade $ 4,409 8.7%Industrial materials 3,355 6.6
Oil and gas 3,219 6.3Consumer staples 3,008 5.9Metals and products 2,749 5.4

Commercial Real Estate
Commercial real estate loans represent credit extended for real-
estate related purposes to borrowers or counterparties who are pri-
marily in the real estate development or investment business and
for which the ultimate repayment of the loan is dependent on the
sale, lease, rental or refinancing of the property.
Commercial real estate lending is conducted in several lines of
business with the majority of these loans originated by Corporate
Banking primarily through its specialized National Commercial
Real Estate Group. This group’s focus is lending to targeted
regional and national real estate developers, homebuilders and
REITs/REOCs. As of December 31, 2001, National Commercial
Real Estate Group’s loan outstandings totaled $8.8 billion or 70%
of the commercial real estate portfolio.
At December 31, 2001, commercial real estate loans totaled
$12.4 billion, or 18% of Commercial Banking loans. During
2001, net charge-offs in the commercial real estate portfolio
segment were $14 million. Nonperforming commercial real estate
assets, including other real estate owned, totaled $199 million, or
1.6% of related assets, at December 31, 2001.
The commercial real estate loan portfolio by both collateral
location and property type as of December 31, 2001 are as follows:
(Dollars in millions) OutstandingBy Collateral Location: Amount % of PortfolioIllinois $««1,682 14%
Michigan 1,348 11
Texas 1,004 8
California 960 8
Arizona 958 8
Ohio 839 7
Indiana 504 4
Louisiana 487 4
Colorado 356 3
Kentucky 326 3
Other areas 1,806 13
Unsecured 1,670 13
Secured by other than real estate 507 4
Total $12,447 100%
By Property Type:Retail $««1,913 15%
Office 1,804 15
Apartment 1,770 14
REIT/diversified 1,297 10
Single family residential development 1,273 10
Industrial/warehouse 1,230 10
Hotels 625 5
Residential lots 472 4
Miscellaneous commercial income producing 1,864 15
Miscellaneous residential developments 199 2
Total $12,447 100%
B A N K O N E C O R P O R A T I O N 55 2 0 0 1 A N N U A L R E P O R T

ASSET QUALITY
In 2001, the Corporation changed its loan composition methodol-
ogy to a line of business approach, dividing the loan portfolio into
Retail, Commercial Banking, First USA, and other lines of busi-
ness. The Corporation has presented 2000 information under both
the “old” and “new” compositions, but has not presented 1999,
1998 and 1997 under the “new” composition as it would be
impractical to reclassify those periods using the new methodologies.
Nonper forming Assets
The Corporation places loans on nonaccrual status as follows:
• Retail consumer loans are placed on nonaccrual status when the
collection of contractual principal or interest becomes 90 days
past due. Accrued but uncollected interest and fee income are
reversed and charged against interest income when the consumer
loan is placed on nonaccrual status. Subsequent cash collections
are recognized as interest income unless the consumer loan is sub-
sequently charged-off, in which case cash collections are recog-
nized as recoveries.
• Commercial Banking and Retail small business commercial loans
are placed on nonaccrual status when the collection of contrac-
tual principal or interest is deemed doubtful, or it becomes 90
days or more past due and is both not well-secured and in the
process of collection. Accrued but uncollected interest and fee
income are reversed and charged against interest income when
placed on nonaccrual status. Cash interest payments received are
recognized either as interest income or as a reduction of principal
when collection of principal is doubtful. The loan is returned to
accrual status only when all of the principal and interest amounts
contractually due are reasonably assured within a reasonable time
frame and when the borrower has demonstrated payment per-
formance.
• Credit card receivables are charged-off rather than placed on
nonaccrual status.
The Corporation’s nonperforming loans by line of business and
total nonperforming assets for the periods indicated are as follows:
DECEMBER 31, 2001 2000(Dollars in millions)
Nonperforming Loans:Retail $1,370 $«««912
Commercial Banking:Corporate Banking 1,154 1,065
Middle Market Banking 947 458
Other lines of business 80 40
Total (1) 3,551 2,475
Other, primarily other real estate owned 137 98
Total nonperforming assets $3,688 $2,573
Nonperforming assets/related assets 2.35% 1.48%
Loans 90-days or more past due and accruing interest:
Credit Card $«««««96 $÷÷«57
Other 1 5
Total $«««««97 $÷÷«62
(1) The amount of interest on nonperforming loans that was contractually due in 2001 totaled $202 million. Of this amount, $34 million was actually recorded in 2001.
B A N K O N E C O R P O R A T I O N 56 2 0 0 1 A N N U A L R E P O R T
Prior to 2001, the Corporation’s nonperforming assets as of December 31 are:
(Dollars in millions) 2000 1999 1998 1997Nonperforming Loans:
Commercial $1,761 $1,053 $÷«729 $«««609
Consumer 714 506 478 416
Total 2,475 1,559 1,207 1,025
Other, primarily other real estate owned 98 106 90 61
Total nonperforming assets $2,573 $1,665 $1,297 $1,086
Nonperforming assets/related assets 1.48% 1.02% 0.83% 0.68%
Loans 90 days or more past due and accruing interest:Credit Card $÷÷«57 $«««««76 $«««161 $«««438
Other 5 50 78 140
Total $÷÷«62 $«««126 $÷«239 $÷«578
The Corporation has experienced credit quality deterioration
in a number of distinct Commercial Banking market segments.
The Corporation has established processes for identifying potential
problem areas of the portfolio, which currently include exposure to
leveraged lending and acquisition finance activities, healthcare,
automotive parts and manufacturing, business finance and leasing,
professional services, miscellaneous transportation services,
telecommunications and selected utilities. The Corporation will
continue to monitor and manage these potential risks.
Nonperforming loans within Retail, which includes all con-
sumer balances more than 90-days past due, increased by $458
million in 2001 to $1.4 billion reflecting deterioration in credit
performance consistent with general economic conditions. These
increases primarily reflect loans secured by residential real estate

where the Corporation maintains a loss recognition policy includ-
ing the writing down of assets to net realizable value at 120-days
past due. Retail nonperforming assets are likely to continue to
increase modestly for the foreseeable future and will be influenced
in part by the future direction of economic conditions including
residential real estate valuation trends.
Charge-of f Policies
The Corporation records charge-offs as follows:
• Commercial loans are charged-off in the reporting period in which
either an event occurs that confirms the existence of a loss or it is
determined that a loan or a portion of a loan is uncollectible.
• A credit card loan is charged-off in the month it becomes contrac-
tually 180 days past due and remains unpaid at the end of that
month or in the event of bankruptcy notification, specifically, 60
days after receipt of notification. Interest on credit card loans is
accrued until the loan is charged-off. At the time of charge-off,
accrued but uncollected finance charges and fee income are reversed
and charged against interest income and credit card revenue, respec-
tively. Subsequent cash collections are recorded as recoveries.
• Retail loans are generally charged-off following a delinquency period
of 120 days, or within 60 days after receipt of notification in case of
bankruptcy. Closed-end consumer loans, such as auto loans and leases
and home mortgage loans, are typically written down to the extent of
loss after considering the net realizable value of the collateral.
The timing and amount of the charge-off on consumer loans
will depend on the type of loan, giving consideration to available col-
lateral, as well as the circumstances giving rise to the delinquency.
The Corporation adheres to uniform guidelines published by the
FFIEC in charging off consumer loans.
The following table shows the Corporation’s net charge-offs by line of business for the years ended December 31:
2001 2000Net Net Net Net
charge- Average charge-off charge- Average charge-off (Dollars in millions) offs balance rate offs balance rateRetail (1) $«««821 $««74,749 1.10% $««««542 $««74,632 0.73%
Commercial banking:Corporate Banking 638 43,495 1.47 435 53,343 0.81
Middle Market Banking 403 34,310 1.17 127 32,178 0.40
First USA 3,823 65,447 5.84 3,584 66,178 5.42
Other lines of business 34 7,616 40 6,861Total–Managed (1) 5,719 $225,617 2.53% «4,728 $233,192 2.03%
Securitized (3,431) (3,337)
Total–Reported $2,288 $167,054 1.37% $«1,391 $171,768 0.81%
(1) 2001 amounts exclude $92 million of charge-offs relating to part of a portfolio that has been accounted for as loans held at a discount, but viewed for managementpurposes as charge-offs.
Prior to 2001, net charge-offs by portfolio for the years ended December 31 are:
2000 1999Net Net Net Net
charge- Average charge-off charge- Average charge-off(Dollars in millions) offs balance rate offs balance rateCommercial $÷÷597 $100,202 0.60% $÷«306 $÷90,182 0.34%
Consumer (1) 547 66,812 0.82 558 59,440 0.94
Credit card (1) 3,584 66,178 5.42 3,790 68,980 5.49
Total–Managed (1) «4,728 $233,192 2.03% 4,654 $218,602 2.13%
Securitized (3,337) (3,448)
Total–Reported $«1,391 $171,768 0.81% $1,206 $156,855 0.77%
(1) Includes $143 million of consumer charge-offs and $183 million of securitized charge-offs taken in the fourth quarter of 1999 related to the early adoption of certainof the FFIEC’s new consumer charge-off guidelines.
Charge-of fs
Managed net charge-offs increased 21% during 2001 to
$5.719 billion, reflecting higher charge-offs in all lines of business.
The managed net charge-off rate increased to 2.53% in 2001
versus 2.03% in 2000.
Retail net charge-offs for 2001 totaled $821 million, up from
$542 million in 2000. Increases in credit losses across all consumer
portfolios including small business were recorded. Several factors
contributing to these increased losses include: increased consumer
bankruptcies; increased severity per default involving auto loans
and leases tied to weaker market prices for repossessed vehicles; and
overall weakening of consumer economic fundamentals associated
with an economy in recession.
B A N K O N E C O R P O R A T I O N 57 2 0 0 1 A N N U A L R E P O R T
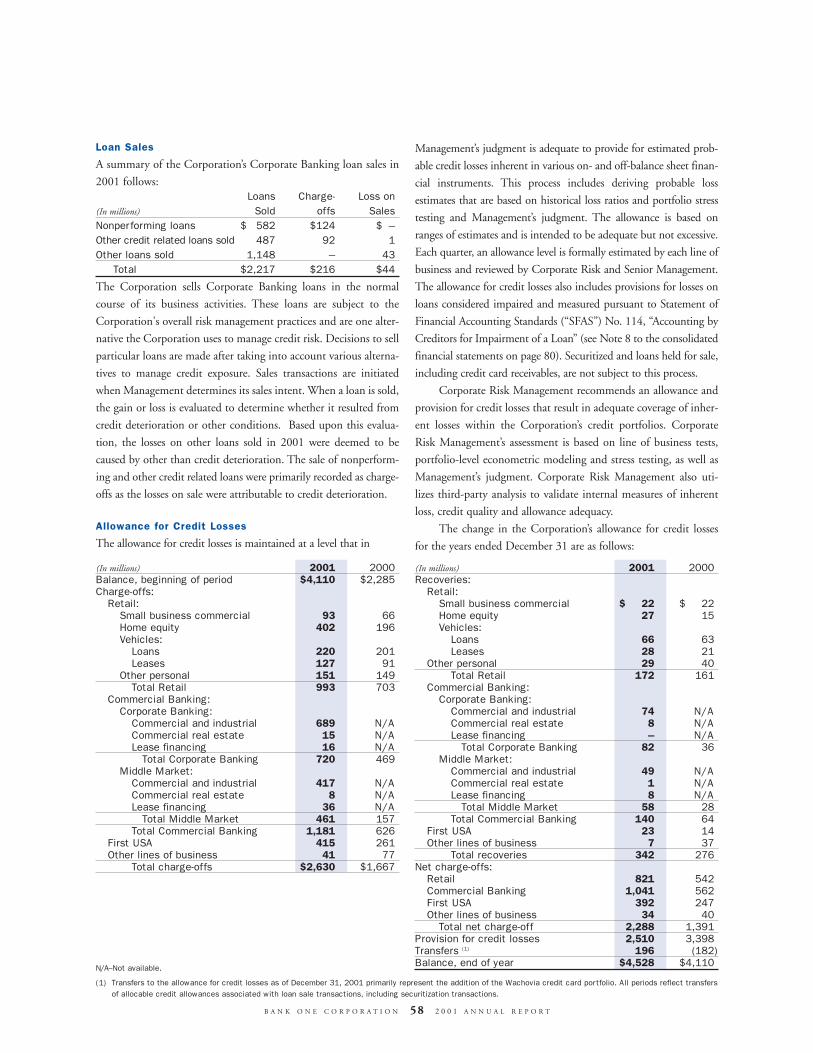
Loan Sales
A summary of the Corporation’s Corporate Banking loan sales in
2001 follows:Loans Charge- Loss on
(In millions) Sold offs SalesNonperforming loans $«««582 $124 $««–
Other credit related loans sold 487 92 1
Other loans sold 1,148 – 43
Total $2,217 $216 $44
The Corporation sells Corporate Banking loans in the normal
course of its business activities. These loans are subject to the
Corporation's overall risk management practices and are one alter-
native the Corporation uses to manage credit risk. Decisions to sell
particular loans are made after taking into account various alterna-
tives to manage credit exposure. Sales transactions are initiated
when Management determines its sales intent. When a loan is sold,
the gain or loss is evaluated to determine whether it resulted from
credit deterioration or other conditions. Based upon this evalua-
tion, the losses on other loans sold in 2001 were deemed to be
caused by other than credit deterioration. The sale of nonperform-
ing and other credit related loans were primarily recorded as charge-
offs as the losses on sale were attributable to credit deterioration.
Allowance for Credit Losses
The allowance for credit losses is maintained at a level that in
Management’s judgment is adequate to provide for estimated prob-
able credit losses inherent in various on- and off-balance sheet finan-
cial instruments. This process includes deriving probable loss
estimates that are based on historical loss ratios and portfolio stress
testing and Management’s judgment. The allowance is based on
ranges of estimates and is intended to be adequate but not excessive.
Each quarter, an allowance level is formally estimated by each line of
business and reviewed by Corporate Risk and Senior Management.
The allowance for credit losses also includes provisions for losses on
loans considered impaired and measured pursuant to Statement of
Financial Accounting Standards (“SFAS”) No. 114, “Accounting by
Creditors for Impairment of a Loan” (see Note 8 to the consolidated
financial statements on page 80). Securitized and loans held for sale,
including credit card receivables, are not subject to this process.
Corporate Risk Management recommends an allowance and
provision for credit losses that result in adequate coverage of inher-
ent losses within the Corporation’s credit portfolios. Corporate
Risk Management’s assessment is based on line of business tests,
portfolio-level econometric modeling and stress testing, as well as
Management’s judgment. Corporate Risk Management also uti-
lizes third-party analysis to validate internal measures of inherent
loss, credit quality and allowance adequacy.
The change in the Corporation’s allowance for credit losses
for the years ended December 31 are as follows:
(In millions) 2001 2000Balance, beginning of period $4,110 $2,285Charge-offs:
Retail:Small business commercial 93 66Home equity 402 196Vehicles:
Loans 220 201Leases 127 91
Other personal 151 149Total Retail 993 703
Commercial Banking:Corporate Banking:
Commercial and industrial 689 N/ACommercial real estate 15 N/ALease financing 16 N/A
Total Corporate Banking 720 469Middle Market:
Commercial and industrial 417 N/ACommercial real estate 8 N/ALease financing 36 N/A
Total Middle Market 461 157Total Commercial Banking 1,181 626
First USA 415 261Other lines of business 41 77
Total charge-offs $2,630 $1,667
(In millions) 2001 2000Recoveries:
Retail:Small business commercial $«««««22 $«««««22Home equity 27 15Vehicles:
Loans 66 63Leases 28 21
Other personal 29 40Total Retail 172 161
Commercial Banking:Corporate Banking:
Commercial and industrial 74 N/ACommercial real estate 8 N/ALease financing – N/A
Total Corporate Banking 82 36Middle Market:
Commercial and industrial 49 N/ACommercial real estate 1 N/ALease financing 8 N/A
Total Middle Market 58 28Total Commercial Banking 140 64
First USA 23 14Other lines of business 7 37
Total recoveries 342 276Net charge-offs:
Retail 821 542Commercial Banking 1,041 562First USA 392 247Other lines of business 34 40
Total net charge-off 2,288 1,391Provision for credit losses 2,510 3,398Transfers (1) 196 (182)Balance, end of year $4,528 $4,110
B A N K O N E C O R P O R A T I O N 58 2 0 0 1 A N N U A L R E P O R T
N/A–Not available.
(1) Transfers to the allowance for credit losses as of December 31, 2001 primarily represent the addition of the Wachovia credit card portfolio. All periods reflect transfers of allocable credit allowances associated with loan sale transactions, including securitization transactions.

For analytical purposes, summarized below are the changes in the allowance for credit loss for the years ended December 31:
(In millions) 2000 1999 1998 1997Balance, beginning of year $2,285 $2,271 $2,817 $2,687
Charge-offs:Commercial:
Domestic:Commercial 618 325 222 200
Real estate:Construction 8 5 3 3
Other 11 27 25 19
Lease financing 7 12 20 12
Foreign 64 41 52 –
Total commercial 708 410 322 234
Consumer:Residential real estate 230 189 74 52
Automotive:Loans 215 256 220 260
Leases 91 87 61 51
Other 162 203 246 256
Total consumer 698 735 601 619
Credit card 261 386 1,022 1,544
Total charge-offs 1,667 1,531 1,945 2,397
Recoveries:Commercial:
Domestic:Commercial 98 70 68 97
Real estate:Construction 1 6 3 6
Other 4 25 23 29
Lease financing 1 2 5 3
Foreign 7 1 1 12
Total commercial 111 104 100 147
Consumer:Residential real estate 17 12 11 14
Automotive:Loans 69 82 92 105
Leases 21 23 21 17
Other 44 60 64 63
Total consumer 151 177 188 199
Credit card 14 44 159 164
Total recoveries 276 325 447 510
Net charge-offs:Commercial 597 306 222 87
Consumer 547 558 413 420
Credit Card 247 342 863 1,380
Total net charge-off 1,391 1,206 1,498 1,887
Provision for credit losses 3,398 1,249 1,408 1,988
Transfers (182) (29) (456) 29
Balance, end of year $4,110 $2,285 $2,271 $2,817
Transfers from the allowance for credit losses primarily represent allocable credit allowances associated with consumer loan sale transac-
tions, including securitization transactions.
B A N K O N E C O R P O R A T I O N 59 2 0 0 1 A N N U A L R E P O R T

Composition of Allowance for Credit Losses
While the allowance for credit losses is available to absorb credit losses in the entire portfolio, presented below is an allocation of the allowance
for credit losses by line of business as of December 31:
2001 2000
(Dollars in millions) Amount % Amount %Retail $1,040 23% $«««846 20%
Commercial BankingCorporate Banking 1,714 38 1,699 41
Middle Market 1,352 30 1,345 33
First USA 396 8 197 5
Other lines of business 26 1 23 1
Total $4,528 100% $4,110 100%
For analytical purposes, an allocation of the allowance for credit losses by loan type as of December 31 follows:
2000 1999 1998 1997
(Dollars in millions) Amount % Amount % Amount % Amount %Commercial (1) $3,199 78% $÷«972 43% $÷«834 37% $«««660 23%
Consumer 714 17 486 21 440 19 484 17
Credit Card 197 5 148 6 199 9 813 29
Unallocated – – 679 30 798 35 860 31
Total $4,110 100% $2,285 100% $2,271 100% $2,817 100%
(1) Includes allowance related to Business and Community Banking loans, which are included in the Retail business segment results.
B A N K O N E C O R P O R A T I O N 60 2 0 0 1 A N N U A L R E P O R T
At December 31, 2001, the allowance for credit losses was
198% of current year net charge-offs (on a reported basis) as com-
pared to a reserve coverage ratio of 295% at December 31, 2000.
This decrease reflects deterioration in certain components of the
Commercial Banking and brokered home equity portfolios. The
allowance for credit losses at December 31, 2001, represented 2.89%
of period-end loans and 128% of nonperforming loans, compared to
2.36% and 166%, respectively, at December 31, 2000. The allowance
for credit losses established for specifically identified off-balance sheet
lending exposures was not material at December 31, 2001.
Reser ve Determination
The Corporation determines allowance levels based upon the
probable loss in the credit portfolios. The allowance is based on
ranges of estimates and is intended to be adequate but not exces-
sive. The estimation process includes deriving probable loss esti-
mates that are based on historical loss rates, portfolio stress testing
of probable loss estimates and Management’s judgment.
During 2000, the Corporation reviewed its practice of main-
taining unallocated reserves in light of continuing refinement in
loss estimation processes, including improvements in portfolio
level stress testing techniques. It was concluded that the use of
unallocated reserves would be discontinued. These reserves were
aligned with their respective portfolios.

Probable Loss Estimation
The Corporation employs several methodologies for estimating
probable losses. Methodologies are determined based on a number
of factors, including type of asset (e.g., consumer installment versus
commercial loan), risk measurement parameters (e.g., delinquency
status and bureau score versus commercial risk rating), and risk
management and collection processes (e.g., retail collection center
versus centrally managed workout units).
For the Retail and Credit Card portfolios, the allowance is
based on a statistical analysis of inherent losses over discrete periods
of time. The analysis reviews historical losses, vintage performance,
delinquencies and other risk characteristics of the various products
to estimate probable losses. Other risk characteristics evaluated
may include: recent loss experience in the portfolios, changes in
origination sources, portfolio seasoning and underlying credit prac-
tices, including charge-off policies. These factors and analysis are
updated on a quarterly basis.
For the Commercial Banking portfolio, the Corporation con-
ducts a two-part test. First, significant credits that have a risk
rating equivalent to the bank regulatory classifications of
Substandard, Doubtful and Loss are formally reviewed periodically
and at least quarterly and asset-specific reserves are established as
appropriate. Second, inherent losses for the remaining
Commercial Banking portfolio are estimated by assigning an
expected loss factor to each risk category of the portfolio based on
a statistical analysis of historical loss experience over a discrete
period of time. During the second quarter of 2001, the
Corporation refined its measurement process for estimating prob-
able losses inherent in the Commercial Banking portfolio. To
refine the process, the Corporation analyzed historical credit loss,
risk-rating migration and loss given default data and assigned prob-
ability of default and loss given default factors to each exposure in
the portfolio.
Por tfolio Stress-Testing
Stress testing is performed on all significant portfolios to simulate
the effect of economic deterioration on credit performance. Stress
testing the portfolios provides Management with a range of loss
estimates that incorporates the Corporation’s historical loss experi-
ence and the reserve impact of events that have occurred, or might
possibly occur, but that have not been reflected in either the his-
torical expected loss factors or the currently assigned risk ratings.
Stress testing of the commercial portfolio is accomplished
using a framework developed to test expected default factors and
loss given default estimates and to test the effect of downgrades to
exposures in identified high-risk industries. This process includes,
establishing a base case scenario using three alternative market
probability sets and an estimated loss given default probability to
measure the impact on reserves; determining the effect of applying
a higher loss given default probability to the base case to take into
consideration the variability of historical loss rates over the business
cycle; and estimating trend-based reserves in high-risk industries
that may not be fully reflected in the historically based loss factors,
using market-based tools and information as well as sanctioned
macroeconomic forecasts.
Stress testing the consumer portfolios, including credit card,
is accomplished by applying the results of econometric modeling to
each of the portfolio segments. The purpose of this analysis is to
quantify the impact of economic deterioration on existing weak-
nesses in the portfolios, whose effects are not yet incorporated into
the historically based reserve rates. The stress test models employ
a regression methodology that incorporates the latest national
trends for each consumer credit product segment. Economic vari-
ables used include consumer debt, unemployment rates, consumer
debt burdens, consumer confidence, bankruptcies, and interest
rates, among other statistics. Additionally, a series of portfolio spe-
cific stress tests are performed to simulate individual economic
events. These include such events as declining residential real
estate prices, weakening used car prices, rising interest rates, spikes
in personal bankruptcies, and economic recession scenarios. The
results of the stress testing are used by Management to support the
adequacy of the allowance established.
DERIVATIVE FINANCIAL INSTRUMENTS
The Corporation uses a variety of derivative financial instruments
in its trading, asset and liability management, as well as to manage
certain currency translation exposures of foreign operations. These
instruments include interest rate, currency, equity and commodity
swaps, forwards, spot, futures, options, caps, floors, forward rate
agreements, and other conditional or exchange contracts, and
include both exchange-traded and over-the-counter contracts.
Accounting for Derivative Financial Instruments
Effective January 1, 2001, the Corporation adopted SFAS No.
133, “Accounting for Derivative Instruments and Hedging
Activities” (“SFAS No. 133”), as amended. The new standard sig-
nificantly changed the accounting treatment for interest rate and
foreign exchange derivatives the Corporation uses in its derivative
activity accounted for as a hedge. The new accounting treatment
for derivatives is described below.
Trading Derivative Instruments
Derivative financial instruments used in trading activities are
carried at fair value. Such instruments include swaps, forwards,
spot, futures, options, caps, floors and forward rate agreements and
other conditional or exchange contracts in the interest rate, foreign
exchange, equity and commodity markets. The estimated fair
B A N K O N E C O R P O R A T I O N 61 2 0 0 1 A N N U A L R E P O R T

values are based on quoted market prices or pricing and valuation
models on a present value basis using current market information.
Realized and unrealized gains and losses, including any interest
income or expense, are recorded in noninterest income as trading.
Where appropriate, compensation for credit risk and ongoing serv-
icing is deferred and recorded as income over the life of the deriv-
ative financial instruments.
Purchased option, cap and floor contracts are reported in
derivative product assets, and written option, cap and floor con-
tracts are reported in derivative product liabilities. For other deriv-
ative financial instruments, unrealized gains are reported in
derivative product assets, and unrealized losses are reported in
derivative product liabilities. However, fair value amounts recog-
nized for derivative financial instruments executed with the same
counterparty under a legally enforceable master netting arrange-
ment are reported on a net basis. Cash flows from derivative finan-
cial instruments are reported net as operating activities.
Credit derivatives are accounted for as derivative instruments
under SFAS No. 133. As a result, the change in fair value of credit
derivative instruments is included in trading results in the
Corporation’s financial statements while any credit assessment
change in the identified commercial credit exposure is reflected as
a change in the allocated credit reserves.
Hedging Derivative Instruments
Derivative financial instruments used in hedging activities are des-
ignated as fair value hedges, cash flow hedges, or hedges of net
investments in foreign operations, and are required to meet specific
criteria. The instruments used in fair value hedges and cash flow
hedges are principally interest rate swaps. Such interest rate swaps
are linked to and adjust effectively the interest rate sensitivity of
specific assets and liabilities. Interest rate swaps not designated and
qualified as a hedge are treated as trading derivative instruments.
Fair Value Hedges (primarily hedges of fixed rate interest-
bearing instruments)–The change in fair value of both the hedging
derivative and hedged item is recorded in current earnings. If a
hedge is dedesignated prior to maturity, previous adjustments to
the carrying value of the hedged item are recognized in earnings to
match the earnings recognition pattern of the hedged item (e.g.,
level yield amortization if hedging an interest-bearing instrument).
Cash Flow Hedges (primarily hedges of variable rate interest-
bearing instruments)–The effective portion of the change in fair
value of the hedging derivative is recorded in Accumulated Other
Adjustments to Stockholders’ Equity (“AOASE”) and the ineffec-
tive portion directly in earnings. Amounts in AOASE are reclassi-
fied into earnings in a manner consistent with the earnings pattern
of the underlying hedged item (generally, reflected in interest
expense). The total amount of such reclassification into earnings is
projected to be charges of $105 million after tax ($163 million pre-
tax) over the next twelve months. The maximum length of time
exposure to the variability of future cash flows for forecasted trans-
actions hedged is 12 months. If a hedge is dedesignated prior to
maturity, previous adjustments to AOASE are recognized in earn-
ings to match the earnings recognition pattern of the hedged item
(e.g., level yield amortization if hedging an interest-bearing instru-
ment). The effect on earnings from the discontinuance of cash flow
hedges due to the determination that a forecasted transaction is no
longer likely to occur was immaterial.
Interest income or expense on most hedging derivatives used
to manage interest rate exposure is recorded on an accrual basis, as
an adjustment to the yield of the linked exposures over the periods
covered by the contracts. This matches the income recognition
treatment of that exposure, generally assets or liabilities carried at
historical cost, with interest recorded on an accrual basis. If all or
part of a linked position is terminated, e.g., a linked asset is sold or
prepaid, or if the amount of an anticipated transaction is likely to
be less than originally expected, then the related pro rata portion of
any unrecognized gain or loss on the derivative is recognized in
earnings at that time, and the related pro rata portion of the deriv-
ative is subsequently accounted for as a trading instrument.
Hedges of non-U.S Dollar Net Investment in Foreign Operations–
In order to minimize the capital impact of translation gains or
losses measured on an after-tax basis, the Corporation uses forward
foreign exchange contracts to hedge the exposure relating to non-
U.S. dollar net investments in foreign operations. The effective
portion of the change in fair value of the hedging derivatives is
recorded in AOASE as part of the cumulative translation adjust-
ment. The amount of after-tax gains included in the cumulative
translation adjustment during the year ended December 31, 2001,
related to hedges of the foreign currency exposures of net invest-
ments in foreign operations, totaled $6 million.
Income Resulting from Derivative Financial Instruments
The Corporation uses interest rate derivative financial instruments
to reduce structural interest rate risk and the volatility of net inter-
est margin. Net interest margin reflects the effective use of these
derivatives. Without their use, net interest income would have
been lower by $68 million in 2001, $52 million in 2000, and
$181 million in 1999.
The amount of hedge ineffectiveness recognized for cash flow
and fair value hedges in the year ended December 31, 2001 was
insignificant. No component of a hedging derivative instrument’s
gain or loss is excluded from the assessment of hedge effectiveness.
B A N K O N E C O R P O R A T I O N 62 2 0 0 1 A N N U A L R E P O R T

Credit Exposure Resulting from Derivative Financial
Instruments
The credit risk associated with exchange-traded derivative financial
instruments is limited to the relevant clearinghouse. Options written
do not expose the Corporation to credit risk, except to the extent of
the underlying risk in a financial instrument that the Corporation
may be obligated to acquire under certain written put options. Caps
and floors written do not expose the Corporation to credit risk.
Credit exposure from derivative financial instruments arises
from the risk of a counterparty default on the derivative contract.
The amount of loss created by the default is the replacement cost
or current positive fair value of the defaulted contract. The
Corporation utilizes master netting agreements whenever possible
to reduce its credit exposure from counterparty defaults. These
agreements allow the netting of contracts with unrealized losses
against contracts with unrealized gains to the same counterparty, in
the event of a counterparty default.
The impact of these master netting agreements for the year
ended December 31 follows:
(In millions) 2001 2000Gross replacement cost $12,262 $«9,769
Less: Adjustment due to master netting agreements (9,037) (7,222)
Current credit exposure 3,225 2,547
Unrecognized net gains due to nontrading activity (1) – (225)
Balance sheet credit exposure $««3,225 $«2,322
(1) At December 31, 2001, exposure amount is zero due to the January 1, 2001 adoption of SFAS No. 133.
B A N K O N E C O R P O R A T I O N 63 2 0 0 1 A N N U A L R E P O R T
Asset and Liability Management Derivatives
Access to the derivatives market is an important element in maintaining the Corporation’s desired interest rate risk position. In general,
the assets and liabilities generated through ordinary business activities do not naturally create offsetting positions with respect to repric-
ing, basis or maturity characteristics. Using derivative instruments, principally plain vanilla interest rate swaps (ALM swaps), interest rate
sensitivity is adjusted to maintain the desired interest rate risk profile.
At December 31, 2001, the notional value of ALM interest rate swaps linked to specific assets or liabilities totaled $12.5 billion as follows:
Receive Fixed Pay FixedPay Floating Receive Floating
Fair Value Fair Value Cash Flow Total(In millions) Hedge Hedge Hedge Swaps
Interest rate swaps associated with:Investment securities $«««««««– $50 $«««««««– $«««««««50
Funds borrowed (including long-term debt) 7,939 ««– 4,522 12,461
Total $7,939 $50 $4,522 $12,511
Interest rate swaps used to adjust the interest rate sensitivity
of securities and funds borrowed will not need to be replaced at
maturity, since the corresponding asset or liability will mature
along with the swap. Interest rate swaps designated as an interest
rate related hedge of an existing fixed rate asset or liability are fair
value type hedges. Conversely, interest rate swaps designated as an
interest rate hedge of an existing variable rate asset or liability are
cash flow type hedges. Management designates interest rate swaps
as hedges of both fixed and variable rate assets and liabilities inter-
changeably. The type of hedge for accounting purposes is not a
strategic consideration. The Corporation has an insignificant
amount of hedges involving forecasted transactions and no non-
derivative instruments are designated as a hedge.

LOAN SECURITIZATIONS AND OFF-BALANCESHEET ACTIVITIES
Loan Securitizations
The Corporation transforms loans into securities, which are sold to
investors–a process referred to as securitization. The Corporation
primarily securitizes credit card receivables but also securitizes
home equity loans and consumer assets to a limited extent. In a
credit card securitization, a designated pool of credit card receiv-
ables is removed from the balance sheet and transferred to a third-
party special purpose entity (“SPE” or “Trust”), that in turn sells
securities to investors entitling them to receive specified cash flows
during the life of the security. The proceeds from the issuance are
then distributed by the SPE to the Corporation as consideration
for the loans transferred. Following a securitization, the
Corporation receives: fees for servicing the receivables and any
excess finance charges, yield-related fees, and interchange revenue
on the receivables over and above the interest paid to the investors,
net credit losses and servicing fees (termed “the excess spread”).
The Corporation’s continuing involvement in the securitized
assets includes the process of managing and servicing the trans-
ferred receivables, as well as maintaining an undivided, pro rata
interest in all credit card receivables that have been securitized,
referred to as seller’s interest, which is generally equal to the pool of
assets included in the securitization less the investor’s portion of
those assets. The Corporation’s seller’s interest ranks pari-passu
with the investors’ interests in the Trusts. As the amount of the
loans in the securitized pool fluctuates due to customer payments,
purchases, cash advances, and credit losses, the carrying amount of
the seller’s interest will vary. However, the seller’s interest is required
to be maintained at a minimum level to ensure receivables are avail-
able for allocation to the investor interest. This minimum level is
generally between 4% and 7% of the SPE’s principal receivables.
Investors in the beneficial interests of the securitized loans
have no recourse against the Corporation if cash flows generated
from the securitized loans are inadequate to service the obligations
of the SPE. To help ensure that adequate funds are available in the
event of a shortfall, the Corporation is required to deposit funds
into cash spread accounts if excess spread falls below certain
minimum levels. Spread accounts are funded from excess spread
that would normally be returned to the Corporation. In addition,
various forms of other credit enhancements are provided to protect
more senior investor interests from loss. Credit enhancements asso-
ciated with credit card securitizations, such as cash collateral or
spread accounts, totaled $165 million and $311 million at
December 31, 2001 and 2000, respectively, and are classified on
the balance sheet as other assets.
The following comprised the Corporation’s managed credit
card loans at December 31:
(In millions) 2001 2000
Owned credit card loans – held in portfolio $««5,040 $««2,835
Owned credit card loans – held for future securitization 1,746 1,909
Seller’s interest in credit card loans (investment securities) 24,019 22,446
Total credit card loans reflected on balance sheet 30,805 27,190
Securities sold to investors and removed from balance sheet 37,350 39,795
Managed credit card loans $68,155 $66,985
B A N K O N E C O R P O R A T I O N 64 2 0 0 1 A N N U A L R E P O R T
Asset and Liability Management Swaps–Maturities and Rates
The notional amounts, maturity, and weighted-average pay and receive rates for the ALM swap position at December 31, 2001 are sum-
marized as follows:
(Dollars in millions) 2002 2003 2004 2005 2006 Thereafter TotalReceive fixed/pay floating swaps:
Notional amount $1,664 $25 $– $2,000 $««««– $4,250 $««7,939
Weighted average:Receive rate 4.31% 7.61% –% 7.12% –% 6.51% 6.21%
Pay rate 2.20 2.35 – 2.26 – 2.38 2.31
Pay fixed/receive floating swaps:Notional amount $2,787 $1,250 $– $««250 $235 $50 $««4,572
Weighted average:Receive rate 2.22% 2.13% –% 2.35% 2.30% 2.46% 2.21%
Pay rate 6.90 7.18 – 7.67 6.74 7.70 7.02
Total notional amount $4,451 $1,275 $– $2,250 $235 $4,300 $12,511
Variable interest rates–which generally are the one-month, three-month and six-month London interbank offered rates (“LIBOR”) in effect
on the date of repricing–are assumed to remain constant. However, interest rates will change and consequently will affect the related
weighted-average information presented.
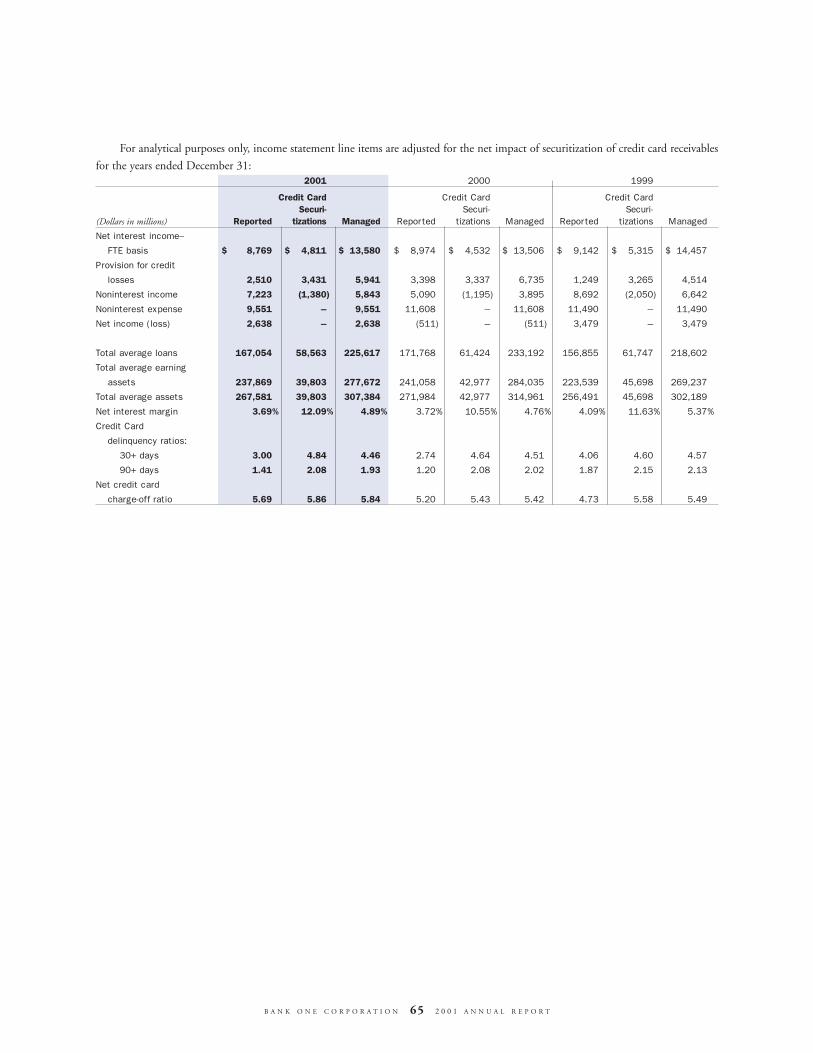
B A N K O N E C O R P O R A T I O N 65 2 0 0 1 A N N U A L R E P O R T
For analytical purposes only, income statement line items are adjusted for the net impact of securitization of credit card receivables
for the years ended December 31:2001 2000 1999
Credit Card Credit Card Credit CardSecuri- Securi- Securi-
(Dollars in millions) Reported tizations Managed Reported tizations Managed Reported tizations Managed
Net interest income–
FTE basis $«««««««8,769 $««««4,811 $««13,580 $÷÷8,974 $««÷4,532 $÷13,506 $««««9,142 $««««5,315 $««14,457
Provision for credit
losses 2,510 3,431 5,941 3,398 3,337 6,735 1,249 3,265 4,514
Noninterest income 7,223 (1,380) 5,843 5,090 (1,195) 3,895 8,692 (2,050) 6,642
Noninterest expense 9,551 – 9,551 11,608 – 11,608 11,490 – 11,490
Net income (loss) 2,638 – 2,638 (511) – (511) 3,479 – 3,479
Total average loans 167,054 58,563 225,617 171,768 61,424 233,192 156,855 61,747 218,602
Total average earning
assets 237,869 39,803 277,672 241,058 42,977 284,035 223,539 45,698 269,237
Total average assets 267,581 39,803 307,384 271,984 42,977 314,961 256,491 45,698 302,189
Net interest margin 3.69% 12.09% 4.89% 3.72% 10.55% 4.76% 4.09% 11.63% 5.37%
Credit Card
delinquency ratios:
30+ days 3.00 4.84 4.46 2.74 4.64 4.51 4.06 4.60 4.57
90+ days 1.41 2.08 1.93 1.20 2.08 2.02 1.87 2.15 2.13
Net credit card
charge-off ratio 5.69 5.86 5.84 5.20 5.43 5.42 4.73 5.58 5.49

Other Off-Balance Sheet Activities
In the normal course of business, the Corporation is a party to a
number of activities that contain credit, market and operational
risk that are not reflected in whole or in part in the Corporation’s
consolidated financial statements. Such activities include: tradi-
tional off-balance sheet credit-related financial instruments; com-
mitments under capital and operating leases and long term debt;
credit enhancement associated with asset-backed securities busi-
ness; and joint venture activities.
The Corporation provides customers with off-balance sheet
credit support through loan commitments, standby letters of credit
and guarantees, as well as commercial letters of credit.
Summarized credit-related financial instruments, including both
commitments to extend credit and letters of credit, at December
31, 2001 are as follows:
B A N K O N E C O R P O R A T I O N 66 2 0 0 1 A N N U A L R E P O R T
Amount of Commitment Expiration Per PeriodLess Than 1 - 3 3 - 5 Over 5
(In billions) Total 1 Year Years Years Years
Unused credit card lines $299.3 $299.3 $««««««– $««««««– $««««««–Unused loan commitments 148.2 109.0 23.7 14.7 0.8
Standby letters of credit and foreign office guarantees 19.4 10.1 6.0 2.7 0.6Commercial letters of credit 0.6 0.6 – – –
Since many of the unused commitments are expected to expire unused or be only partially used, the total amount of unused com-
mitments in the preceding table does not necessarily represent future cash requirements.
In addition to owned banking facilities, the Corporation has entered into a number of long-term leasing arrangements to support
the ongoing activities of the Corporation. The required payments under such commitments and long-term debt at December 31, 2001
are as follows:2007
(In millions) 2002 2003 2004 2005 2006 and After TotalOperating leases $«««264 $«««249 $«««214 $«««169 $«««152 $«««««890 $««1,938
Trust preferred capital securities – – – – – 3,315 3,315
Long-term debt, including capital leases 8,512 7,910 5,575 3,932 6,935 7,239 40,103
Total $8,776 $8,159 $5,789 $4,101 $7,087 $11,444 $45,356
«
The Corporation is an active participant in the asset-backed
securities business where it helps meet customers’ financing needs
by providing access to commercial paper markets in conjunction
with specialized financing entities. Customers benefit from such
structured financing transactions as such transactions provide an
ongoing source of asset liquidity and a potentially favorable financ-
ing alternative.
The Corporation, in its role as administrator of these inde-
pendently rated specialized financing entities, structures financing
transactions for customers such that the receivables financed
through the specialized financing entities are appropriately diversi-
fied and credit enhanced to support the issuance of asset-backed
commercial paper. The Corporation does not service these assets
and does not transfer its own receivables into these specialized
financing entities. Credit enhancement facilities, in the form of
either loan or asset purchase commitments, support each transac-
tion in the specialized financing entities. At December 31, 2001,
credit enhancement facilities for these entities approximated $52.1
billion, of which the Corporation provided $38.3 billion. At
December 31, 2000, credit enhancement facilities for these entities
approximated $42.0 billion, of which the Corporation provided
$29.7 billion. Assets in the trust are principally trade receivables,
auto loans and leases, credit card and a variety of other receivables.
In addition to customer financing transactions, these special-
ized financing entities fund, through the issuance of asset-backed
commercial paper, other selected portfolios of marketable invest-
ment securities that are not reflected on the Corporation’s balance
sheet. Such transactions are structured in a similar fashion to the
customer transactions. Off-balance sheet liquidity lines provided by
the Corporation associated with these transactions were $4.0 billion
at December 31, 2001 and $3.0 billion at December 31, 2000.
The Corporation also provides credit enhancement facilities to
other than Bank One administered specialized financing entities.
These credit enhancements approximated $2.1 billion and $1.5
billion at December 31, 2001 and 2000, respectively.

B A N K O N E C O R P O R A T I O N 67 2 0 0 1 A N N U A L R E P O R T
The Corporation provides program-wide credit enhancement,
in the form of subordinated debt, for certain specialized financing
entities it administers. The Corporation provided $1.1 billion in
subordinated debt at December 31, 2001 and $845 million at
December 31, 2000. In addition, the Corporation provides to cus-
tomers transaction specific credit enhancement in the form of sub-
ordinated interests and off-balance sheet purchase commitments. At
December 31, 2001 and 2000, the Corporation provided credit
enhancements through subordinated interest positions of $59 million
and $72 million, respectively, and off-balance sheet purchase com-
mitments totaling $297 million and $123 million, respectively.
The risk associated with the credit enhancement provided in
these transactions is managed as part of the Corporation’s risk man-
agement practices.
The Corporation is a participant in several operating joint
venture initiatives where the Corporation has a majority equity
interest in the entity; however, based on the terms of the joint
venture arrangement, the ventures are jointly controlled and
managed. As a result, such investments are currently accounted for
under the equity method of accounting rather than being consoli-
dated on a line-by-line basis in the Corporation’s financial state-
ments. In 2002, Management has exerted additional influence over
two of these joint ventures. As a result, the Corporation consoli-
dated these two joint ventures beginning in the first quarter of
2002. Total assets of these two joint ventures are $1.2 billion as of
December 31, 2001 and this consolidation will have no net impact
to the Corporation’s consolidated net income. The Corporation’s
investment in the remaining joint ventures totaled $302 million at
December 31, 2001.
CAPITAL MANAGEMENT
Economic Capital
An important aspect of risk management and performance meas-
urement is the ability to evaluate the risk and return of a business
unit, product or customer consistently across all lines of business.
The Corporation’s economic capital framework facilitates this stan-
dard measure of risk and return. Business units are assigned capital
consistent with the underlying risks of their product set, customer
base and delivery channels.
The following principles are inherent in the capital allocation
methodology employed:
• An equal amount of capital is assigned for each measured unit
of risk.
• Risk is defined in terms of “unexpected” losses over the life of
the exposure, measured at a confidence interval consistent
with that level of capitalization necessary to achieve a targeted
AA debt rating. Unexpected losses are in excess of those normally
incurred and for which reserves are maintained.
• Business units are assessed a uniform charge against allotted
capital, representing a target hurdle rate on equity investments.
Returns on capital in excess of the hurdle rate contribute to
increases in shareholder value.
Four forms of risk are measured–credit, market, operational
and lease residual. Credit risk capital is determined through an
analysis of both historical loss experience and market expectations.
Market risk capital is set consistent with value-at-risk limits estab-
lished by the Corporation’s risk oversight committees. Operational
risk capital incorporates event and technology risks. The opera-
tional risk evaluation process involves an examination of various
risk factors that contribute to a greater likelihood of loss due to
such things as fraud or processing error. Finally, lease residual risk
capital covers the potential for losses arising from the disposition of
assets returned at the end of lease contracts. This price risk is ana-
lyzed based upon historical loss experiences and market factors, as
well as by reviewing event-specific scenarios.
The economic capital process provides a valuable analytical
tool that is critical to the understanding of business segment per-
formance trends. The methodologies employed are subject to
ongoing development and review. Over time, the Corporation’s
view of individual risks and associated capital will likely change
given improvements in the Corporation’s ability to quantify risks
inherent in various business activities.
Selected Capital Ratios
The Corporation aims to maintain regulatory capital ratios,
including those of the principal banking subsidiaries, in excess of
the well-capitalized guidelines under federal banking regulations.
The Corporation maintains a well-capitalized regulatory position.
The tangible common equity to tangible managed assets ratio
is also monitored. This ratio adds securitized credit card loans to
reported total assets and is calculated net of total intangible assets.
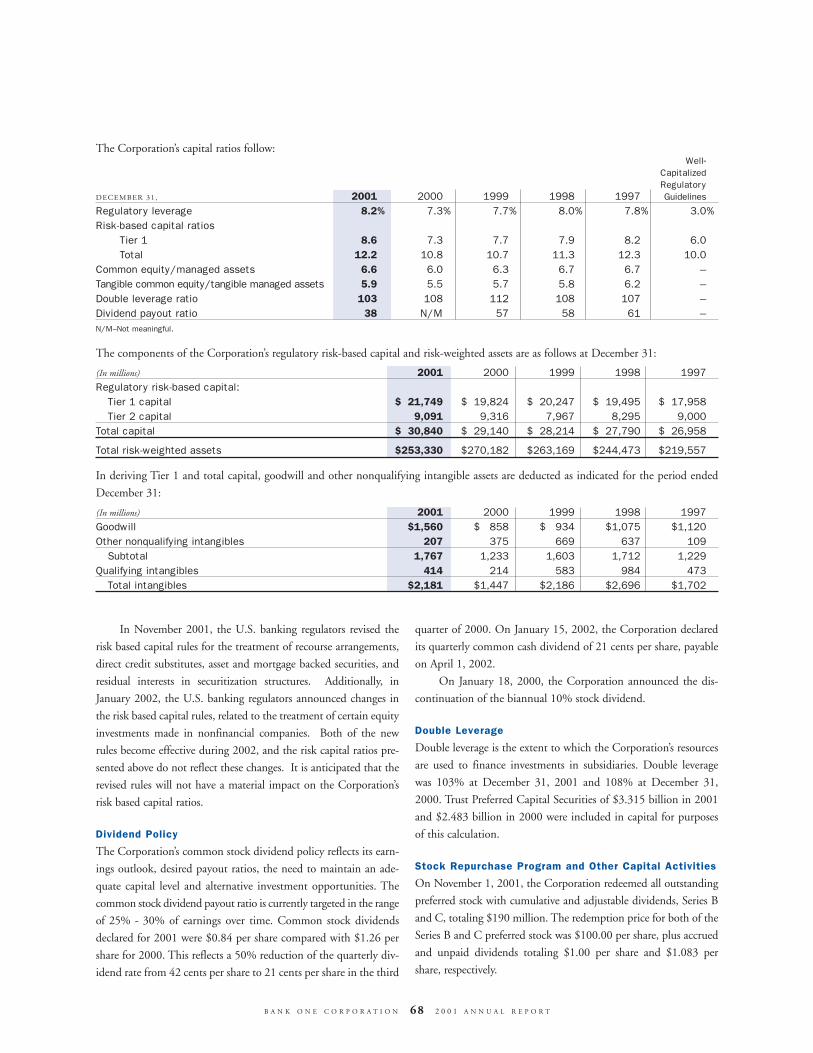
The Corporation’s capital ratios follow:Well-
CapitalizedRegulatory
DECEMBER 31, 2001 2000 1999 1998 1997 Guidelines
Regulatory leverage 8.2% 7.3% 7.7% 8.0% 7.8% 3.0%
Risk-based capital ratiosTier 1 8.6 7.3 7.7 7.9 8.2 6.0
Total 12.2 10.8 10.7 11.3 12.3 10.0
Common equity/managed assets 6.6 6.0 6.3 6.7 6.7 –
Tangible common equity/tangible managed assets 5.9 5.5 5.7 5.8 6.2 –
Double leverage ratio 103 108 112 108 107 –
Dividend payout ratio 38 N/M 57 58 61 –
N/M–Not meaningful.
The components of the Corporation’s regulatory risk-based capital and risk-weighted assets are as follows at December 31:
(In millions) 2001 2000 1999 1998 1997Regulatory risk-based capital:
Tier 1 capital $««21,749 $÷19,824 $÷20,247 $÷19,495 $÷17,958
Tier 2 capital 9,091 9,316 7,967 8,295 9,000
Total capital $««30,840 $««29,140 $÷28,214 $÷27,790 $÷26,958
Total risk-weighted assets $253,330 $270,182 $263,169 $244,473 $219,557
In deriving Tier 1 and total capital, goodwill and other nonqualifying intangible assets are deducted as indicated for the period ended
December 31:
(In millions) 2001 2000 1999 1998 1997Goodwill $1,560 $÷«858 $÷«934 $1,075 $1,120
Other nonqualifying intangibles 207 375 669 637 109
Subtotal 1,767 1,233 1,603 1,712 1,229
Qualifying intangibles 414 214 583 984 473
Total intangibles $2,181 $1,447 $2,186 $2,696 $1,702
B A N K O N E C O R P O R A T I O N 68 2 0 0 1 A N N U A L R E P O R T
In November 2001, the U.S. banking regulators revised the
risk based capital rules for the treatment of recourse arrangements,
direct credit substitutes, asset and mortgage backed securities, and
residual interests in securitization structures. Additionally, in
January 2002, the U.S. banking regulators announced changes in
the risk based capital rules, related to the treatment of certain equity
investments made in nonfinancial companies. Both of the new
rules become effective during 2002, and the risk capital ratios pre-
sented above do not reflect these changes. It is anticipated that the
revised rules will not have a material impact on the Corporation’s
risk based capital ratios.
Dividend Policy
The Corporation’s common stock dividend policy reflects its earn-
ings outlook, desired payout ratios, the need to maintain an ade-
quate capital level and alternative investment opportunities. The
common stock dividend payout ratio is currently targeted in the range
of 25% - 30% of earnings over time. Common stock dividends
declared for 2001 were $0.84 per share compared with $1.26 per
share for 2000. This reflects a 50% reduction of the quarterly div-
idend rate from 42 cents per share to 21 cents per share in the third
quarter of 2000. On January 15, 2002, the Corporation declared
its quarterly common cash dividend of 21 cents per share, payable
on April 1, 2002.
On January 18, 2000, the Corporation announced the dis-
continuation of the biannual 10% stock dividend.
Double Leverage
Double leverage is the extent to which the Corporation’s resources
are used to finance investments in subsidiaries. Double leverage
was 103% at December 31, 2001 and 108% at December 31,
2000. Trust Preferred Capital Securities of $3.315 billion in 2001
and $2.483 billion in 2000 were included in capital for purposes
of this calculation.
Stock Repurchase Program and Other Capital Activities
On November 1, 2001, the Corporation redeemed all outstanding
preferred stock with cumulative and adjustable dividends, Series B
and C, totaling $190 million. The redemption price for both of the
Series B and C preferred stock was $100.00 per share, plus accrued
and unpaid dividends totaling $1.00 per share and $1.083 per
share, respectively.

On September 17, 2001, the Corporation’s Board of
Directors approved the repurchase of up to $500 million of the
Corporation’s common stock. This buyback is part of the remain-
ing 28.4 million share buyback program authorized in May 1999.
The timing of the purchases and the exact number of shares to be
repurchased will depend on market conditions. The share repur-
chase program does not include specific price targets or timetables
and may be suspended at any time. In 2001, the Corporation pur-
chased 2.6 million shares of common stock at an average price of
$29.62 per share, leaving 25.8 million shares available for repur-
chase under the buyback program.
During 2001, the Corporation added to its Tier 1 capital
through the sponsorship of two trusts that issued $825 million in
aggregate principal amount of trust preferred securities. During
2000, the Corporation added to its Tier 1 capital through the spon-
sorship of three trusts that issued $915 million in aggregate principal
amount of trust preferred securities. These preferred securities are
tax-advantaged issues that qualify for Tier 1 capital treatment. See
Note 13 to the consolidated financial statements on page 85 for
more detail.
During 2001 and 2000, the Corporation strengthened
its capital position through the issuance of $750 million and
$1 billion of subordinated debt, respectively.
On December 1, 2000, the Corporation converted all out-
standing 123/4% First Commerce Convertible Debenture Bonds,
Series A and B. The conversion rate was 18.9473. All of the deben-
tures were converted to shares of the Corporation’s common stock.
FORWARD-LOOKING STATEMENTS
This discussion of financial results contains forward-looking state-
ments about the Corporation, including descriptions of plans or
objectives of its management for future operations, products or serv-
ices, and forecasts of its revenues, earnings or other measures of eco-
nomic performance. Forward-looking statements can be identified
by the fact that they do not relate strictly to historical or current facts.
They often include the words “believe,” “expect,” “anticipate,”
“intend,” “plan,” “estimate” or words of similar meaning, or future or
conditional verbs such as “will,” “would,” “should,” “could” or “may.”
Forward-looking statements, by their nature, are subject to
risks and uncertainties. A number of factors—many of which are
beyond the Corporation’s control—could cause actual conditions,
events or results to differ significantly from those described in the
forward-looking statements. Some of these factors include certain
credit, market, operational, liquidity and interest rate risks associ-
ated with the Corporation’s business and operations. Other factors
described in the Corporation’s Form 10-K include changes in busi-
ness and economic conditions, competition, fiscal and monetary
policies and legislation.
Forward-looking statements speak only as of the date they are
made. The Corporation does not undertake to update forward-
looking statements to reflect circumstances or events that occur
after the date the forward-looking statements are made or to reflect
the occurrence of unanticipated events, such as further market
deterioration that adversely affects credit quality, auto lease residu-
als and credit card asset values.
B A N K O N E C O R P O R A T I O N 69 2 0 0 1 A N N U A L R E P O R T

B A N K O N E C O R P O R A T I O N 70 2 0 0 1 A N N U A L R E P O R T
FOR THE YEAR ENDED DECEMBER 31, 2001 2000(Dollars in millions)
AssetsCash and due from banks $÷17,383 $÷17,291
Interest-bearing due from banks 1,030 5,210
Federal funds sold and securities under resale agreements 9,347 4,737
Trading assets 6,167 2,788
Derivative product assets 3,225 2,322
Investment securities 60,883 50,561
Loans 156,733 174,251
Allowance for credit losses (4,528) (4,110)
Loans, net 152,205 170,141
Premises and equipment, net 2,534 2,894
Customers’ acceptance liability 257 402
Other assets 15,923 12,954
Total assets $268,954 $269,300
LiabilitiesDeposits:
Demand $÷32,179 $÷30,738
Savings 80,599 63,414
Time:Under $100,000 20,106 25,302
$100,000 and over 18,071 22,656
Foreign offices 16,575 24,967
Total deposits 167,530 167,077
Federal funds purchased and securities sold under repurchase agreements 13,728 12,120
Other short-term borrowings 10,255 18,003
Long-term debt 40,103 38,428
Guaranteed preferred beneficial interest in the Corporation’s junior subordinated debt 3,315 2,483
Acceptances outstanding 257 402
Derivative product liabilities 2,574 2,212
Other liabilities 10,966 9,940
Total liabilities 248,728 250,665
Stockholders’ EquityPreferred stock – 190
Common stock ($0.01 par value; authorized 4,000,000,000 in 2001 and 2,500,000,000 in 2000; issued 1,181,382,304 in 2001 and 1,181,385,876 in 2000) 12 12
Surplus 10,311 10,487
Retained earnings 10,707 9,060
Accumulated other adjustments to stockholders’ equity (65) (5)
Deferred compensation (121) (121)
Treasury stock, at cost (14,415,873 shares in 2001 and 21,557,073 shares in 2000) (618) (988)
Total stockholders’ equity 20,226 18,635
Total liabilities and stockholders’ equity $268,954 $269,300
The accompanying notes are an integral part of this statement.
CONSOLIDATED BALANCE SHEETSBANK ONE CORPORATION and Subsidiaries

FOR THE YEAR ENDED DECEMBER 31, 2001 2000 1999(In millions, except per share data)
Net Interest Income:Interest income $17,304 $20,078 $17,294
Interest expense 8,666 11,242 8,273
Total net interest income 8,638 8,836 9,021
Noninterest Income: Banking fees and commissions 1,731 1,537 1,502
Credit card revenue 2,775 2,299 3,413
Service charges on deposits 1,449 1,310 1,283
Fiduciary and investment management fees 754 783 793
Investment securities gains (losses) (66) (235) 509
Trading 220 134 147
Other income (losses) 360 (738) 1,045
Total noninterest income 7,223 5,090 8,692
Total revenue, net of interest expense 15,861 13,926 17,713
Provision for credit losses 2,510 3,398 1,249
Noninterest Expense:Salaries and employee benefits 4,198 4,602 4,528
Occupancy expense 686 872 703
Equipment expense 457 593 667
Outside service fees and processing 1,178 1,537 1,771
Marketing and development 862 900 1,235
Telecommunication 407 411 334
Other intangible amortization 97 410 168
Goodwill amortization 69 70 69
Other 1,246 2,052 1,461
Total noninterest expense before merger and restructuring-related charges 9,200 11,447 10,936Merger and restructuring-related charges 351 161 554
Total noninterest expense 9,551 11,608 11,490
Income (loss) before income taxes and cumulative effect of change in accounting principle 3,800 (1,080) 4,974
Applicable income taxes (benefit) 1,118 (569) 1,495
Income (loss) before cumulative effect of change in accounting principle 2,682 (511) 3,479
Cumulative effect of change in accounting principle, net of taxes of $25 (44) – –
Net income (loss) $÷2,638 $÷÷(511) $÷3,479
Net income (loss) attributable to common stockholders’ equity $÷2,628 $÷÷(523) $÷3,467
Earnings (loss) per share before cumulative effect of change in accounting principle:Basic $««««2.28 $÷«(0.45) $÷÷2.97
Diluted $««««2.28 $÷«(0.45) $÷÷2.95
Earnings (loss) per share:Basic $««««2.25 $÷«(0.45) $÷÷2.97
Diluted $««««2.24 $÷«(0.45) $÷÷2.95
The accompanying notes are an integral part of this statement.
B A N K O N E C O R P O R A T I O N 71 2 0 0 1 A N N U A L R E P O R T
CONSOLIDATED INCOME STATEMENTSBANK ONE CORPORATION and Subsidiaries
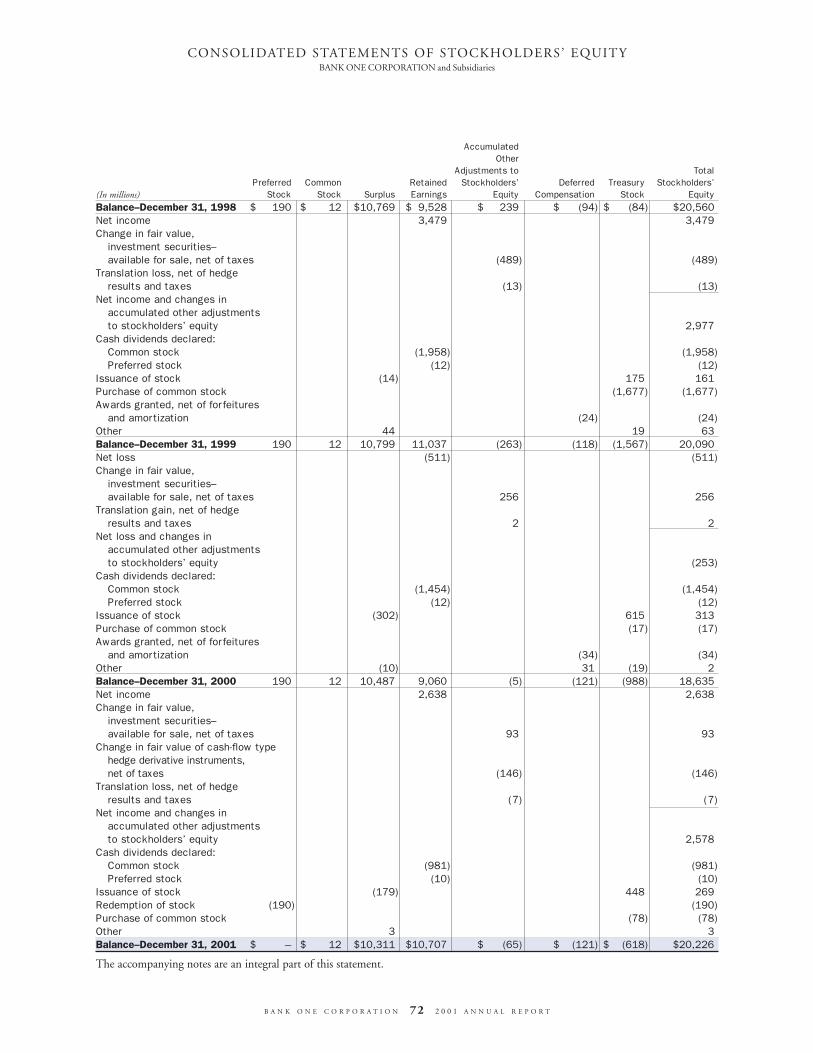
AccumulatedOther
Adjustments to TotalPreferred Common Retained Stockholders’ Deferred Treasury Stockholders’
(In millions) Stock Stock Surplus Earnings Equity Compensation Stock EquityBalance–December 31, 1998 $«÷÷190 $÷«÷÷12 $10,769 $÷9,528 $«÷÷239 $««««««(94) $««««««(84) $20,560
Net income 3,479 3,479
Change in fair value, investment securities–available for sale, net of taxes (489) (489)
Translation loss, net of hedge results and taxes (13) (13)
Net income and changes in accumulated other adjustments to stockholders’ equity 2,977
Cash dividends declared:Common stock (1,958) (1,958)
Preferred stock (12) (12)
Issuance of stock (14) 175 161
Purchase of common stock (1,677) (1,677)
Awards granted, net of forfeitures and amortization (24) (24)
Other 44 19 63
Balance–December 31, 1999 190 12 10,799 11,037 (263) (118) «(1,567) 20,090
Net loss (511) (511)
Change in fair value, investment securities–available for sale, net of taxes 256 256
Translation gain, net of hedge results and taxes 2 2
Net loss and changes in accumulated other adjustments to stockholders’ equity (253)
Cash dividends declared:Common stock (1,454) (1,454)
Preferred stock (12) (12)
Issuance of stock (302) 615 313
Purchase of common stock (17) (17)
Awards granted, net of forfeitures and amortization (34) (34)
Other (10) 31 (19) 2
Balance–December 31, 2000 190 12 10,487 9,060 (5) (121) (988) 18,635
Net income 2,638 2,638
Change in fair value, investment securities–available for sale, net of taxes 93 93
Change in fair value of cash-flow type hedge derivative instruments, net of taxes «(146) (146)
Translation loss, net of hedge results and taxes (7) (7)
Net income and changes in accumulated other adjustments to stockholders’ equity 2,578
Cash dividends declared:Common stock (981) (981)
Preferred stock (10) (10)
Issuance of stock (179) 448 269
Redemption of stock (190) (190)
Purchase of common stock (78) (78)
Other 3 3
Balance–December 31, 2001 $«««÷««««– $÷«÷÷12 $10,311 $10,707 $««««««(65) $«÷«(121) $««««(618) $20,226
The accompanying notes are an integral part of this statement.
B A N K O N E C O R P O R A T I O N 72 2 0 0 1 A N N U A L R E P O R T
CONSOLIDATED STATEMENTS OF STOCKHOLDERS’ EQUITYBANK ONE CORPORATION and Subsidiaries

FOR THE YEAR ENDED DECEMBER 31, 2001 2000 1999(In millions)
Cash Flows from Operating Activities:Net income (loss) $÷«2,638 $÷÷«(511) $÷«3,479
Adjustments to reconcile net income (loss) to net cash provided by operating activities:Depreciation and amortization 571 934 697
Cumulative effect of accounting change 69 – –
Provision for credit losses 2,510 3,398 1,249
Investment securities (gains) losses 66 236 (509)
Net decrease in net derivative product assets (198) (71) (233)
Net (increase) decrease in trading assets (3,456) 11,691 (292)
Net (increase) decrease in other assets 213 (655) 245
Net increase (decrease) in other liabilities 375 1,502 (830)
Gain on sale of banks and branch offices – – (348)
Merger and restructuring-related charges 351 161 276
Other operating adjustments (764) 139 (100)
Net cash provided by operating activities 2,375 16,824 3,634
Cash Flows from Investing Activities:Net (increase) decrease in federal funds sold and securities under resale agreements (4,610) 5,045 80
Securities available for sale:Purchases (56,088) (72,098) (56,564)
Maturities 23,579 17,882 16,150
Sales 23,393 48,960 38,361Credit card receivables securitized 3,845 – 7,279
Net decrease (increase) in loans 13,425 (14,903) (21,377)
Purchase of Wachovia credit card business (5,776) – –
Loan recoveries 342 276 325
Net cash and cash equivalents due to mergers, acquisitions and dispositions – – (1,669)
Additions to premises and equipment (169) (533) (593)
Proceeds from sales of premises and equipment 55 – –
All other investing activities, net 383 (1,194) 41
Net cash used in investing activities (1,621) (16,565) (17,967)
Cash Flows from Financing Activities:Net increase in deposits 373 4,681 3,907
Net increase (decrease) in federal funds purchased and securities under repurchase agreements 1,607 (6,599) (4,444)
Net increase (decrease) in other short-term borrowings (7,757) (3,208) 4,274
Proceeds from issuance of long-term debt 12,466 13,914 28,736
Repayment of long-term debt (11,341) (9,237) (16,245)
Cash dividends paid (991) (1,222) (2,420)
Proceeds from issuance of trust preferred capital securities 825 915 575Proceeds from issuance of common and treasury stock 191 152 61
Redemption of preferred stock (190) – –
Purchase of common stock for treasury (78) (3) (1,647)
All other financing activities, net 19 (19) (238)
Net cash provided by (used in) financing activities (4,876) (626) 12,559
Effect of exchange rate changes on cash and cash equivalents 34 147 (25)
Net Decrease in Cash and Cash Equivalents (4,088) (220) (1,799)
Cash and Cash Equivalents at Beginning of Year 22,501 22,721 24,520
Cash and Cash Equivalents at End of Year $«18,413 $«22,501 $«22,721
Other Cash Flow Disclosures:Interest paid $«««9,221 $«10,777 $÷«8,082
Income taxes paid 506 371 701
The accompanying notes are an integral part of this statement.
B A N K O N E C O R P O R A T I O N 73 2 0 0 1 A N N U A L R E P O R T
CONSOLIDATED STATEMENTS OF CASH FLOWSBANK ONE CORPORATION and Subsidiaries
Note 1–Summary of Significant Accounting Policies
BANK ONE CORPORATION and subsidiaries (“Bank One” or the
“Corporation”) is a financial holding company that offers a full
range of financial services to commercial and business customers
and consumers. The consolidated financial statements have been
prepared in conformity with generally accepted accounting princi-
ples, and certain prior-year financial statement information has
been reclassified to conform to the current year’s presentation. The
preparation of the consolidated financial statements require
Management to make estimates and assumptions that affect the
amounts reported and disclosures of contingent assets and liabili-
ties. Actual results could differ from those estimates.
(a) Principles of Consolidation
The Corporation’s consolidated financial statements include all
accounts of BANK ONE CORPORATION (the “Parent Company”)
and all significant majority-owned subsidiaries. All significant
intercompany accounts and transactions have been eliminated.
Results of operations of acquired entities are included from the
acquisition date, and assets and liabilities are stated at their esti-
mated fair values at the acquisition date.
(b) Resale and Repurchase Agreements
Securities purchased under resale agreements and securities sold
under repurchase agreements are treated as collateralized financing
transactions and carried at the amount at which the securities will
be subsequently resold or repurchased, plus accrued interest.
Where appropriate, resale and repurchase agreements with the
same counterparty are reported on a net basis.
(c) Trading Activities
Trading assets and liabilities are carried at fair value. Trading profits
include realized and unrealized gains and losses from both cash and
derivative financial instruments used in trading activities. Trading
activities involve instruments with interest rate, exchange rate,
equity price, credit and commodity price market risk.
(d) Investment Securities
Debt and equity investment securities designated as available-for-sale
are carried at fair value, with unrealized gains and losses, net of taxes,
included in accumulated other adjustments to stockholders’ equity.
The estimated fair value of a security is determined based on market
quotations when available or, if not available, by using a discounted
cash flow approach. Realized gains and losses, including other than
temporary impairments, are included in noninterest income as
investment securities gains (losses). The specific identification
method is used to calculate realized gains or losses.
Effective April 1, 2001, the Corporation adopted Emerging
Issues Task Force (EITF) Issue No. 99-20, “Recognition of Interest
Income and Impairment on Purchased and Retained Beneficial
Interests in Securitized Financial Assets” (“EITF No. 99-20”).
Under EITF No. 99-20, impairment on certain securitized finan-
cial assets must be recognized when the asset’s fair value is below its
carrying value and there has been an adverse change in estimated
cash flows. Prior to EITF No. 99-20, the Corporation judged
declines as other than temporary based on the underlying facts and
circumstances surrounding the investment, such as the length of
time the market value had been below cost or based on the credit-
worthiness of the issuer. Under EITF No. 99-20, the Corporation
recognizes interest income based on the amount of the excess of
estimated cash flows over the recorded investment in the securi-
tized financial asset. Changes in estimated cash flows are recog-
nized on a prospective basis. The effect of adopting EITF No.
99-20 was a one-time, non-cash charge to earnings of $44 million
after-tax ($69 million pre-tax) or $0.04 per diluted share. This
charge has been presented as a cumulative effect of a change in
accounting principle in the consolidated income statement.
Principal investments are carried at fair value, with unrealized
and realized gains and losses included in noninterest income as
investment securities gains (losses). The fair value of a publicly
traded principal investment is determined using quoted market
prices when the investment is unrestricted; otherwise fair value is
estimated using quoted market prices adjusted for market liquidity
and sale restrictions. The fair value for principal investments that
are not publicly traded is estimated based on the investees’ finan-
cial results, conditions and prospects, values of comparable public
companies, market liquidity and sales restrictions.
(e) Loans, including lease finance receivables
Loans are carried at the principal amount outstanding, net of
unearned income and amounts charged off. Unearned income,
which includes deferred loan origination fees reduced by loan orig-
ination costs, for loans, excluding credit cards, is amortized to
interest income over the life of the related loan using the straight-
line method that approximates the effective interest rate method.
Fees received for providing loan commitments and letters of credit
that result in loans are typically deferred and amortized to interest
income over the life of the related loan, beginning with the initial
borrowing. Fees on commitments and letters of credit that are not
expected to be funded are amortized to noninterest income as
banking fees and commissions over the commitment period.
Other credit-related fees, including syndication management fees,
are recorded to noninterest income as banking fees and commis-
sions when received or over time to match the earnings process.
The carrying amount of credit card loans also includes unpaid
interest and fees. Loan origination fees and costs on credit card
loans are typically deferred and amortized over one year using a
straight-line method to noninterest income as credit card revenue.
B A N K O N E C O R P O R A T I O N 74 2 0 0 1 A N N U A L R E P O R T
NOTES TO CONSOLIDATED FINANCIAL STATEMENTS

The Corporation typically provides lease financing to its cus-
tomers through direct financing leases. Leveraged leases, which
represent direct financing leases involving nonrecourse debt, also
are provided to customers. Unearned income on a direct financing
lease is amortized to income over the lease term so as to yield a con-
stant rate of return on the net investment in the lease. Periodic
recognition of lease income on leveraged leases is based on an analy-
sis of cash flows using the original investment less deferred taxes
arising from the difference between the pretax financial accounting
income and taxable income. Residual values for leased automobiles
are reviewed at least annually with periodic reviews performed as
warranted by the underlying circumstances. Valuations are based
upon various assumptions and estimates including the probability
of the automobile being returned to the Corporation, estimated
costs incurred to reduce the number of returned automobiles from
the customer, estimated collectable fees for mileage and other wear
and tear, reconditioning costs, and estimated used car sales prices.
Declines in estimated residual value that are other than temporary
are recognized in the period such determination is made in other
noninterest income.
(f) Loan Sales
When a commercial loan is sold, the loan’s carrying value is com-
pared to the net sales proceeds. Any shortfall in value that is pre-
sumed to be credit related is recorded as a charge-off reducing the
allowance for credit losses. Any shortfall in value not presumed to
be credit related is recorded as a charge to other noninterest income.
With consumer loan portfolio sales, the allocable portion of
the allowance for credit losses adjusts the carrying value of the loan
portfolio and is treated as a transfer out of the allowance for credit
losses. The difference between the portfolio’s carrying value
adjusted for the allocable credit reserves and the net sales proceeds
is recorded as a component of other noninterest income.
(g) Nonper forming Loans
A loan is considered nonperforming when placed on nonaccrual
status, or when renegotiated at terms that represent an economic
concession to the borrower because of a decline in the borrower’s
financial condition. For a more detailed discussion, see the
“Nonperforming Assets” section beginning on page 56. The
Corporation’s charge-off policies are presented on page 57.
(h) Allowance for Credit Losses
Management maintains the allowance for credit losses at a level it
believes is adequate to provide for estimated probable credit losses
inherent in on- and off-balance sheet credit exposure. For a more
detailed discussion, see the “Allowance for Credit Losses” section
beginning on page 58.
(i) Premises and Equipment
Premises and equipment are carried at cost less accumulated depre-
ciation and amortization. Depreciation and amortization is com-
puted using the straight-line method over the estimated useful life
of the owned asset and, for leasehold improvements, over the lesser
of the remaining term of the leased facility or the estimated eco-
nomic life of the improvement. For owned and capitalized assets,
estimated useful lives range from three to 30 years. Maintenance
and repairs are charged to expense as incurred, while major
improvements are capitalized and amortized to operating expense
over their identified useful life.
(j) Other Real Estate Owned (“OREO”)
OREO includes real estate assets that have been received in satis-
faction of debt. OREO is initially recorded and subsequently
carried at the lower of cost or fair value less estimated selling costs.
Any valuation adjustments required at the date of transfer are
charged to the allowance for credit losses. Subsequently, unrealized
losses and realized gains and losses on sale are included in other
noninterest income. Operating results from OREO are recorded in
other noninterest expense.
(k) Intangible Assets
Intangible assets include goodwill resulting from acquisitions and
identifiable intangible assets, such as customer lists, core deposits
and credit card relationships. Goodwill is equal to an acquired
company’s acquisition cost less the value of net tangible and intan-
gible assets.
Intangible assets are reported in other assets and are amortized
into other noninterest expense on an accelerated or straight-line basis
over the period the Corporation expects to benefit from such assets.
Goodwill is amortized over estimated periods ranging from five to 40
years. Intangible assets are periodically reviewed for other than tem-
porary impairment with any such declines in value included in other
noninterest expense.
(l) Income Taxes
Deferred tax assets and liabilities are determined based on tempo-
rary differences between financial reporting and tax bases of assets
and liabilities and are measured using the enacted tax rates and laws
that are in effect. The effect on deferred tax assets and liabilities of
a change in rates is recognized as income or expense in the period
that includes the enactment date.
B A N K O N E C O R P O R A T I O N 75 2 0 0 1 A N N U A L R E P O R T
NOTES TO CONSOLIDATED FINANCIAL STATEMENTS

(m) Cash Flow Repor ting
Cash and cash equivalents consist of cash and due from banks,
whether interest-bearing or not. Net reporting of cash transactions
has been used when the balance sheet items consist predominantly
of maturities of three months or less, or where otherwise permit-
ted. Other items are reported on a gross basis.
(n) Stock-Based Compensation
The Corporation accounts for stock awards pursuant to the methods
prescribed in Accounting Principles Board (“APB”) Opinion No. 25,
“Accounting for Stock Issued to Employees.” As stock options are
granted at fair value, there are no charges to earnings associated with
stock options granted. Compensation expense related to restricted
stock awards is recorded as earned over the restriction period.
(o) New and Pending Accounting Pronouncements
The Corporation adopted in 2001 the following new accounting
pronouncements and will adopt in 2002 the following pending
accounting pronouncements. In general, the effect of those adopted
in 2001 were not significant to the Corporation’s consolidated
financial statements. Upon adoption of SFAS No. 142. “Goodwill
and Other Intangible Assets” (“SFAS No. 142”), the Corporation
does not currently anticipate significant goodwill impairment based
upon the current analysis of facts and circumstances.
Accounting for Transfers and Servicing of Financial Assets
and Liabilities
Effective April 1, 2001, the Corporation adopted SFAS No. 140,
“Accounting for Transfers and Servicing of Financial Assets and
Liabilities” (“SFAS No. 140”). On July 23, 2001, the Financial
Accounting Standards Board (“FASB”) issued a Technical Bulletin
that delayed the effective date of certain provisions of SFAS No.
140 relating to isolation in bankruptcy for banks subject to FDIC
receivership and for certain other financial institutions. For these
entities, the isolation provisions are effective for transfers of finan-
cial assets occurring after December 31, 2001, except for transfers
involving revolving credits such as credit card securitizations. An
additional transition period was granted for securitizations involv-
ing revolving credits that ends three months after the earliest date
at which sufficient approvals can be obtained to permit the neces-
sary changes to existing master trusts to meet the isolation provi-
sions, but in no event extend later than June 30, 2006. The
Corporation is analyzing the effect of SFAS No. 140 on its current
securitization structures. The new standard also provides revised
guidance for an entity to be considered a qualifying special purpose
entity and requires additional disclosures concerning securitization
activities and collateral.
Accounting for Derivative Instruments and Hedging Activities
Effective January 1, 2001, the Corporation adopted SFAS No. 133,
as amended. The new standard significantly changed the account-
ing treatment for interest rate and foreign exchange derivatives the
Corporation uses in its asset and liability management activities.
The Corporation’s accounting for derivatives used in trading activi-
ties has not changed as the result of SFAS No. 133. Hedging deriv-
atives are now recognized on the balance sheet at fair value as either
assets or liabilities. Hedge ineffectiveness, if any, is calculated and
recorded in current earnings. The accounting for the effective
portion of the change in value of a hedging derivative is based on
the nature of the hedge. See “Derivative Financial Instruments”
beginning on page 61 for detailed information on the Corporation’s
strategy in using derivative instruments in its asset and liability man-
agement and trading activities, as well as the accounting principles
and disclosures for these instruments.
Business Combinations and Goodwill and Other Intangible Assets
In July 2001, the FASB issued SFAS No. 141, “Business
Combinations” (“SFAS No. 141”) and SFAS No. 142. SFAS No.
141 requires that all business combinations initiated after June 30,
2001 be accounted for under the purchase method and establishes
the specific criteria for the recognition of intangible assets sepa-
rately from goodwill. Under SFAS No. 142, goodwill will no
longer be amortized, but will be subject to impairment tests at least
annually. SFAS No. 142 will be effective for the Corporation on
January 1, 2002. However, any acquired goodwill or intangible
assets recorded in transactions closed subsequent to June 30, 2001
were immediately subject to the amortization provisions of SFAS
No. 142. Upon adoption of SFAS No. 142, the Corporation esti-
mates the elimination of goodwill amortization will positively
impact net income by approximately $69 million annually.
B A N K O N E C O R P O R A T I O N 76 2 0 0 1 A N N U A L R E P O R T
NOTES TO CONSOLIDATED FINANCIAL STATEMENTS
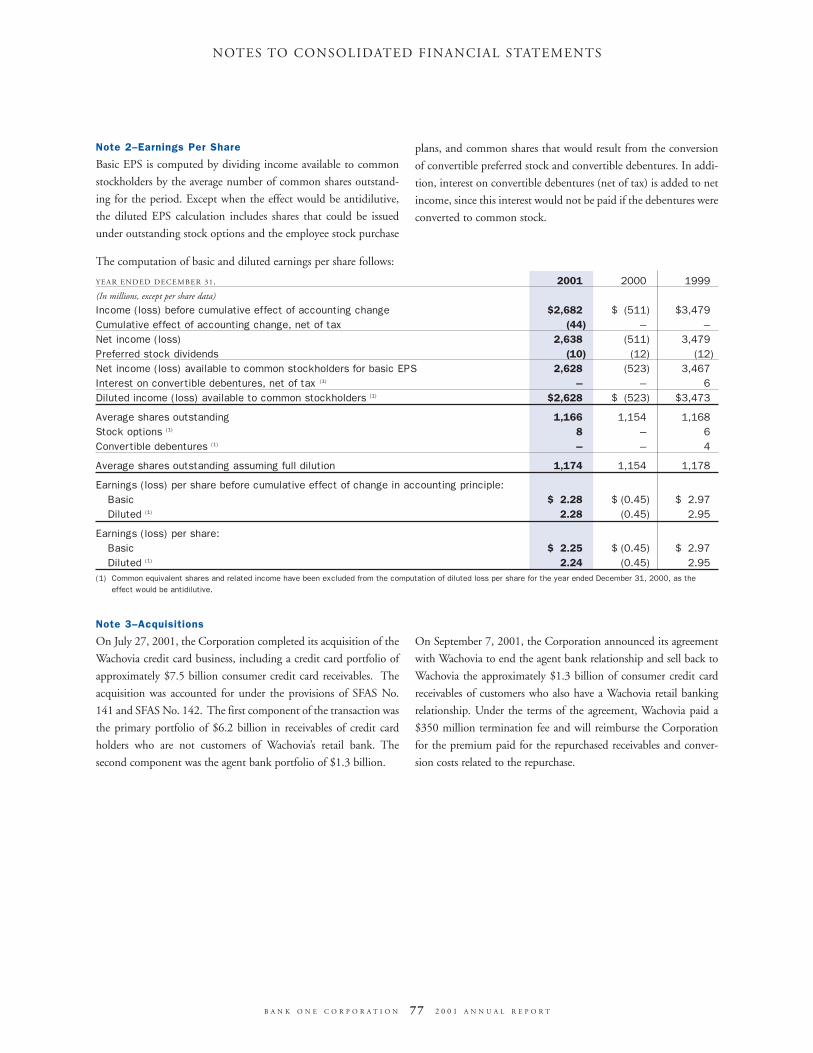
Note 2–Earnings Per Share
Basic EPS is computed by dividing income available to common
stockholders by the average number of common shares outstand-
ing for the period. Except when the effect would be antidilutive,
the diluted EPS calculation includes shares that could be issued
under outstanding stock options and the employee stock purchase
plans, and common shares that would result from the conversion
of convertible preferred stock and convertible debentures. In addi-
tion, interest on convertible debentures (net of tax) is added to net
income, since this interest would not be paid if the debentures were
converted to common stock.
B A N K O N E C O R P O R A T I O N 77 2 0 0 1 A N N U A L R E P O R T
NOTES TO CONSOLIDATED FINANCIAL STATEMENTS
The computation of basic and diluted earnings per share follows:
YEAR ENDED DECEMBER 31, 2001 2000 1999(In millions, except per share data)
Income (loss) before cumulative effect of accounting change $2,682 $««(511) $3,479
Cumulative effect of accounting change, net of tax (44) – –
Net income (loss) 2,638 (511) 3,479
Preferred stock dividends (10) (12) (12)
Net income (loss) available to common stockholders for basic EPS 2,628 ««(523) 3,467
Interest on convertible debentures, net of tax (1) – – 6
Diluted income (loss) available to common stockholders (1) $2,628 $««(523) $3,473
Average shares outstanding 1,166 1,154 1,168
Stock options (1) 8 – 6
Convertible debentures (1) – – 4
Average shares outstanding assuming full dilution 1,174 1,154 1,178
Earnings (loss) per share before cumulative effect of change in accounting principle:Basic $««2.28 $«(0.45) $÷2.97
Diluted (1) ««««2.28 (0.45) ÷2.95
Earnings (loss) per share:Basic $««2.25 $«(0.45) $««2.97
Diluted (1) ««««2.24 (0.45) ÷2.95
(1) Common equivalent shares and related income have been excluded from the computation of diluted loss per share for the year ended December 31, 2000, as theeffect would be antidilutive.
Note 3–Acquisitions
On July 27, 2001, the Corporation completed its acquisition of the
Wachovia credit card business, including a credit card portfolio of
approximately $7.5 billion consumer credit card receivables. The
acquisition was accounted for under the provisions of SFAS No.
141 and SFAS No. 142. The first component of the transaction was
the primary portfolio of $6.2 billion in receivables of credit card
holders who are not customers of Wachovia’s retail bank. The
second component was the agent bank portfolio of $1.3 billion.
On September 7, 2001, the Corporation announced its agreement
with Wachovia to end the agent bank relationship and sell back to
Wachovia the approximately $1.3 billion of consumer credit card
receivables of customers who also have a Wachovia retail banking
relationship. Under the terms of the agreement, Wachovia paid a
$350 million termination fee and will reimburse the Corporation
for the premium paid for the repurchased receivables and conver-
sion costs related to the repurchase.

Note 4–Restructuring-Related Charges
a) Four th Quar ter 2001 Restructuring-Related Charges
The Corporation recorded restructuring-related charges in the
fourth quarter of 2001 for additional real estate and severance costs
to accomplish more rapid expense reductions, accelerated systems
conversions and other consolidations. Summarized below are the
details of these restructuring-related charges:
as of December 31, 2001, and will be paid as required over the
remaining contractual periods.
Note 5–Business Segments
In the third quarter of 2001, certain organizational changes were
made involving Corporate Investments and Commercial Banking
business. The tax-oriented portfolio of Corporate Investments was
transferred to Commercial Banking, while the principal invest-
ments and fixed income portfolios were transferred to Corporate.
Additionally, certain expenses were reclassified from salaries to
other expenses. Results for prior periods have been adjusted to
reflect these and other insignificant changes and to conform to the
current line of business structure.
The information presented on page 26 is consistent with the
content of business segment data provided to the Corporation’s
management which does not use product group revenues to assess
consolidated results. Aside from investment management and
insurance products, product offerings are tailored to specific cus-
tomer segments. As a result, the aggregation of product revenues
and related profit measures across lines of business is not available.
Aside from the United States, no single country or geographic
region generates a significant portion of the Corporation’s revenues
or assets. In addition, there are no single customer concentrations
of revenue or profitability.
See the following “Business Segments” sections for additional
disclosure regarding the Corporation’s operating segments:
• “Business Segments” on page 26.
• Data presented in tables up until the section entitled
“Financial Performance” included in the “Business Segment
Results and Other Data” section beginning with “Retail”
through “Corporate” on pages 27–40.
NOTES TO CONSOLIDATED FINANCIAL STATEMENTS
ContractualObligations
andPersonnel- Asset
DECEMBER 31, 2001 Related Costs Writedowns Total(In millions)
Restructuring-related charges $÷76 $278 $354
Personnel-related items consist primarily of severance costs related
to identified staff reductions in the lines of business totaling approx-
imately 6,900 positions. Contractual obligations included the esti-
mated costs associated with lease and other contract termination
costs incorporated in the business restructuring plans. Asset write-
downs included leasehold write-offs related to leased properties fol-
lowing the decision to abandon such facilities, as well as in the case
of fixed assets and capitalized software for which similar decisions
were made. Actions under this overall restructuring plan are
expected to be completed within a 12-month period. Certain con-
tractual payments associated with these actions, as required, will
extend beyond this 12-month time-frame.
b) Second Quar ter 2000 Restructuring-Related Charges
Actions under this restructuring plan have been completed, with
only payments of identified obligations remaining, which consist
primarily of lease obligations. Unpaid amounts totaled $58 million
Note 6–Interest Income and Interest Expense
Details of interest income and expense are as follows:
FOR THE YEAR ENDED DECEMBER 31, 2001 2000 1999(In millions)
Interest IncomeLoans, including fees $13,213 $15,214 $13,051
Bank balances 145 503 233
Federal funds sold and securities under resale agreements 418 577 445
Trading assets 309 440 330
Investment securities 3,219 3,344 3,235
Total 17,304 20,078 17,294
Interest ExpenseDeposits 4,895 6,137 4,651
Federal funds purchased and securities sold under repurchase agreements 633 1,142 935
Other short-term borrowings 659 1,216 942
Long-term debt 2,479 2,747 1,745
Total 8,666 11,242 8,273
Net Interest Income 8,638 8,836 9,021
Provision for credit losses 2,510 3,398 1,249
Net Interest Income After Provision for Credit Losses $««6,128 $÷5,438 $÷7,772
B A N K O N E C O R P O R A T I O N 78 2 0 0 1 A N N U A L R E P O R T

Note 7–Investment Securities
A summary of the Corporation’s investment portfolio follows:Gross Unrealized Gross Unrealized Fair Value
FOR THE YEAR ENDED DECEMBER 31, 2001 Amortized Cost Gains Losses (Book Value)(In millions)
U.S. Treasury $«««1,424 $««««««««30 $««««««««««4 $«««1,450
U.S. government agencies 25,265 113 132 25,246
States and political subdivisions 1,310 28 8 1,330
Interests in credit card securitized receivables 23,998 107 – 24,105
Other debt securities 4,397 24 18 4,403
Equity securities (1) 2,775 10 15 2,770
Total available for sale securities $«59,169 $««««««312 ««$««««««177 «59,304
Principal and other investments (2) 1,579
Total investment securities $«60,883
FOR THE YEAR ENDED DECEMBER 31, 2000
(In millions)
U.S. Treasury $«÷2,587 $««««««««««2 $÷««««««34 $«÷2,555
U.S. government agencies 14,415 18 47 14,386
States and political subdivisions 1,276 24 8 1,292
Interests in credit card securitized receivables 22,447 116 – 22,563
Other debt securities 5,237 18 57 5,198
Equity securities (1) 2,730 15 40 2,705
Total available for sale securities $«48,692 $««««««193 $««««««186 «48,699
Principal and other investments (2) 1,862
Total investment securities $«50,561
FOR THE YEAR ENDED DECEMBER 31, 1999
(In millions)
U.S. Treasury $«÷2,569 $÷÷««««««1 $««««««101 $«÷2,469
U.S. government agencies 12,919 3 412 12,510
States and political subdivisions 1,599 20 38 1,581
Interests in credit card securitized receivables 20,176 279 – 20,455
Other debt securities 7,611 5 172 7,444
Equity securities (1) 2,002 11 5 2,008
Total available for sale securities $«46,876 $««««««319 $««««««728 46,467
Principal and other investments (2) 1,445
Total investment securities $47,912
(1) The fair values of certain securities for which market quotations were not available were estimated. (2) The fair values of certain securities reflect liquidity and other market-related factors, and includes investments accounted for at fair value consistent with specialized industry practice.
For the year ended December 31, 2001, gross recognized gains and losses on the sale of investment securities were $537 million and $603
million, respectively.
As of December 31, 2001, debt investment securities had the following maturity and yield characteristics:
Due in 1 year Due after 1 year Due after 5 yearsor less through 5 years through 10 years Due after 10 years Total
Amortized Amortized Amortized Amortized AmortizedCost Yield Cost Yield Cost Yield Cost Yield Cost Yield
(Dollars in millions)
U.S. Treasury $÷÷«190 3.36% $÷1,151 4.28% $÷«÷÷59 5.89% $÷÷÷«24 7.06% $÷1,424 4.27%
U.S. government agencies 630 4.89 2,132 4.77 1,010 4.93 21,493 5.86 25,265 5.71
States and politicalsubdivisions 169 5.02 387 5.05 338 5.02 416 5.24 1,310 7.78
Other debt securities 22,223 7.94 4,385 5.74 1,330 4.96 457 8.46 28,395 7.47
Total debt securities–at amortized cost $23,212 7.80% $÷8,055 5.24% $÷2,737 4.97% $22,390 5.91% $56,394 6.61%
Total debt securities––at fair value $23,316 $÷8,132 $÷2,741 $22,345 $56,534
The distribution of mortgage-backed securities and collateralized mortgage obligations is based on average expected maturities. Actual
maturities might differ because issuers may have the right to call or prepay obligations.
B A N K O N E C O R P O R A T I O N 79 2 0 0 1 A N N U A L R E P O R T
NOTES TO CONSOLIDATED FINANCIAL STATEMENTS

Note 8–Loans
Loan composition by line of business is as follows:
FOR THE YEAR ENDED DECEMBER 31, 2001 2000(In millions)
Retail:Small business commercial $÷12,347 $««12,103
Home equity 30,268 31,361
Vehicles:Loans 13,481 14,300
Leases 6,155 8,840
Other personal 9,779 10,697
Total Retail 72,030 77,301
Commercial Banking:Corporate Banking:
Commercial and industrial 22,268 N/ACommercial real estate 8,975 N/ALease financing 4,669 N/AOther 731 N/A
Middle Market:Commercial and industrial 28,676 N/ACommercial real estate 3,472 N/ALease financing 1,053 N/AOther 294 N/A
Total Commercial Banking 70,138 85,100
Other lines of business 7,779 7,106
First USA 6,786 4,744
Total loans 156,733 174,251
Less: Allowance for credit losses 4,528 4,110
Total loans, net $152,205 $170,141
N/A–Not available.
Loans are net of unearned income of $2.749 billion and
$3.467 billion as of December 31, 2001 and 2000, respectively.
Loans held for sale, which are carried at the lower of cost or fair
value, totaled $3.000 billion and $2.964 billion at December 31,
2001 and 2000, respectively.
The Corporation’s primary goal in managing credit risk is to
minimize the impact of default by an individual borrower or group
of borrowers. As a result, the Corporation strives to maintain a loan
portfolio that is diverse in terms of loan type, industry, borrower
and geographic concentrations. As of December 31, 2001 and
2000, there were no significant loan concentrations with any single
borrower, industry or geographic segment (see “Credit Portfolio
Composition” on pages 52–55).
A loan is considered impaired when it is probable that all prin-
cipal and interest amounts due will not be collected in accordance
with the loan’s contractual terms. Certain loans, such as loans
carried at the lower of cost or fair value or small-balance homoge-
neous loans (e.g., credit card, home mortgages and installment
credit) are exempt from impairment determinations for disclosure
purposes. Impaired loans, accordingly, exclude consumer loans clas-
sified as nonaccrual. Such consumer loans totaled $1.064 billion
and $714 million at December 31, 2001 and 2000, respectively.
Impairment is recognized to the extent that the recorded
investment of an impaired loan or pool of loans exceeds its value
either based on the loan’s underlying collateral or the calculated
present value of projected cash flows discounted at the contractual
interest rate. Loans having a significant recorded investment are
measured on an individual basis, while loans not having a signifi-
cant recorded investment are grouped and measured on a pool
basis.
The Corporation’s impaired loan information is as follows:
FOR THE YEAR ENDED DECEMBER 31, 2001 2000(In millions)
Impaired loans with related allowance $2,487 $1,748Impaired loans with no related allowance(1) – 13
Total impaired loans $2,487 $1,761
Allowance on impaired loans (2) $«««731 $÷«407
FOR THE YEAR ENDED DECEMBER 31, 2001 2000 1999(In millions)
Average balance of impaired loans $2,047 $1,335 $«««972
Interest income recognized on impaired loans 46 31 46
(1) Impaired loans for which the discounted cash flows, collateral value or marketprice equals or exceeds the carrying value of the loan do not require anallowance under SFAS No. 114.
(2) The allowance for impaired loans is included in the Corporation’s overallallowance for credit losses.
B A N K O N E C O R P O R A T I O N 80 2 0 0 1 A N N U A L R E P O R T
NOTES TO CONSOLIDATED FINANCIAL STATEMENTS

Maturity Distribution and Interest Rate Sensitivity of Loans
A distribution of the maturity of loans by line of business and, for those loans due after one year, a breakdown between those loans that
have floating interest rates and those that have predetermined interest rates at December 31, 2001 follows:
(In millions) One Year or Less One to Five Years Over Five Years Total
Retail:Small business commercial $««÷3,290 $«÷«6,159 $«÷«2,898 $÷12,347
Home equity 628 1,279 28,361 30,268
Vehicles:Loans 549 9,784 3,148 13,481
Leases 1,655 4,500 – 6,155
Other personal 1,765 807 7,207 9,779Total Retail 7,887 22,529 41,614 72,030
Commercial Banking:Corporate Banking:
Commercial and industrial 5,953 15,009 1,306 22,268Commercial real estate 4,324 4,319 332 8,975Lease financing 80 588 4,001 4,669Other 731 – – 731
Middle Market:Commercial and industrial 12,276 13,554 2,846 28,676Commercial real estate 1,048 1,994 430 3,472Lease financing 72 708 273 1,053Other 294 – – 294
Total Commercial Banking (1) 24,778 36,172 9,188 70,138Total reported (1) $÷32,665 $÷58,701 $÷50,802 $142,168
Loans with floating interest rates $÷27,451 $÷13,186 $÷40,637
Loans with predetermined interest rates ÷31,250 37,616 68,866
Total $÷58,701 $÷50,802 $109,503
(1)Excludes Commercial Banking lease financing receivables, credit card, and other lines of business.
B A N K O N E C O R P O R A T I O N 81 2 0 0 1 A N N U A L R E P O R T
NOTES TO CONSOLIDATED FINANCIAL STATEMENTS
Foreign Outstandings
Foreign outstandings include loans, balances with banks, accept-
ances, securities, equity investments, accrued interest, other mone-
tary assets and current credit exposure on derivative contracts. At
year-end 2001 and 2000, there were no countries for which cross-
border and net local country claims exceeded 1.0% of total assets.
At December 31, 1999, Germany was the only country with cross-
border claims exceeding 1.0% of total assets. The oustandings
amounted to $3.118 billion.
At December 31, 2001 and 1999 there were no countries for
which cross-border claims totaled between 0.75% and 1.0% of
total assets. At December 31, 2000, Germany was the only
country for which cross-border and net local country claims totaled
between 0.75% and 1.0% of total assets. These outstandings
amounted to $2.512 billion.
Note 9–Credit Card Securitizations
The Corporation transforms credit card receivables into securities,
which are sold to investors–a process referred to as securitization.
Gain or loss on the sale of the credit card receivable depends in part
on the previous carrying amount of the financial assets involved in
the transfer, allocated between the assets sold and the retained
interests based on their relative fair value at the date of transfer.
During 2001, the Corporation securitized approximately
$3.8 billion in credit card receivables. Maturities of credit card
securitizations during 2001 totaled $9.2 billion, with an additional
$10.3 billion scheduled for 2002. During 2001 and 2000, the
Corporation recognized $62 million and $116 million, respec-
tively, in net securitization amortization in the consolidated
income statement, including amortization of transaction costs, as
the gain on securitization from new transactions was offset by
amortization as investors in individual series were repaid.
A servicing asset or liability is not generally recognized in a
credit card securitization (and thus not considered in the gain or
loss computation) since the Corporation receives adequate com-
pensation relative to current market servicing prices to service the
receivables sold. Transaction costs in credit card securitizations are
typically deferred and amortized over the life of the security as a
reduction of noninterest income.

B A N K O N E C O R P O R A T I O N 82 2 0 0 1 A N N U A L R E P O R T
NOTES TO CONSOLIDATED FINANCIAL STATEMENTS
At December 31, 2001 and 2000, the estimated fair value of
the interest-only strip associated with credit card securitizations
was $219 million and $221 million, respectively, while the
estimated fair value of the seller’s interest was $23.9 billion and
$22.4 billion, respectively. The interest-only strip and seller’s inter-
est are both recorded as investment securities.
Certain estimates are used in determining the fair value of the
interest-only strip at both the date of securitization and the balance
sheet date, including the excess spread, receivable lives and the dis-
count rate. The components of excess spread, which are estimated,
include finance charge and fee revenue (excluding interchange
income) generated by the securitized loans in excess of interest paid
to investors, related net credit losses and servicing fees. The result-
ing expected cash flows over the lives of the receivables are dis-
counted at a rate commensurate with the risk of the cash flows to
determine the fair value. Such estimates and assumptions are
subject to change, and accordingly, the Corporation may not
recover all of the recorded investment of the interest-only strip (and
thus be measured for impairment). The receivables in each trust
have unique attributes and therefore the interest-only strip related
to each trust is evaluated separately. The seller’s interest resulting
from credit card securitizations is recorded at fair value using a
present value approach, with assumptions that are consistent with
the valuation of the interest-only strip.
The following represents the Corporation’s key weighted-
average assumptions used to estimate the fair value of the retained
interests relating to credit card securitizations at December 31,
2001, and the pretax sensitivity of the fair values to immediate 10
and 20 percent adverse changes in these assumptions are as follows:
Total Interest-Only Sellers Retained
(Dollars in millions) Strip (1) Interest (2) Interests
Receivable Lives: 0.5 years10% Adverse Change $÷23.4 $÷11.6 35.0
20% Adverse Change 47.0 23.1 70.1
Excess Spread: 1.24%
10% Adverse Change 24.0 11.8 35.8
20% Adverse Change 48.0 23.7 71.7
Expected Net Credit Losses (3): 7.11%
10% Adverse Change 120.4 67.4 187.8
20% Adverse Change 204.6 116.4 321.0
Discount Rate: 10.00%
10% Adverse Change 0.7 0.3 1.0
20% Adverse Change 1.5 0.7 2.2
(1) The effect of adverse changes in key assumptions on the fair value of the interest-only strip would be recorded in noninterest income.
(2) The effect of adverse changes in key assumptions on the value of the sellers interest is recorded in accumulated other adjustments to stockholders’ equity, unless the decline in value is deemed to be other than temporary, which would result in a charge to noninterest income upon recognition.
(3) Certain Trust legal documents include finance charge and fee revenue reversals in the definition of net credit losses, resulting in a higher net creditloss rate for Trust purposes.
The sensitivity analysis illustrates the potential magnitude of sig-
nificant adverse changes in key assumptions used in valuing the
retained interests, and thus the potential impact to the
Corporation’s financial position and results of operations.
However, the sensitivities of the fair values of the retained interests
to changes in each key assumption may not be linear. Furthermore,
the sensitivities for each key variable are calculated independently
of changes in the other key variables. Therefore, the sensitivity
analysis does not purport to present the maximum impairment loss
that would result from 10 and 20 percent adverse changes in these
assumptions. Actual experience observed may result in changes in
multiple key assumptions concurrently, the magnitude of which on
the fair value of the retained interests would be dependent on the
relative change and the direction of change. In addition, the sensi-
tivity analysis does not give effect to corrective action that
Management could and would take to mitigate the impact of
adverse changes in key assumptions. The asset values of the
retained interests are periodically reviewed for other-than-tempo-
rary impairment.
The key weighted-average economic assumptions and ranges
of assumptions used to estimate the fair value of retained interests
at the date of securitization (including transfer of new balances
under revolving structures) for credit card securitizations occurring
during 2001 were approximately the same as the assumptions used
to value the retained interests at December 31, 2001.
Cash flows received from (paid to) credit card securitization
master trusts (i.e., SPEs) during the year ended December 31,
2001 and 2000 are as follows:
(In millions) 2001 2000
Proceeds from reinvestment inrevolving securitizations $72,206 $83,469
Proceeds from new securitizations 3,845 –
Servicing fees received 598 649
Cash flows received on retainedinterests (1) 2,577 2,224
Cash released from(used to fund) spread accounts 146 (32)
(1) Includes cash flows from interest-only strips as well as interchange feesreceived from securitized accounts.
For a detailed discussion of the Corporation’s loan securitiza-
tion process for credit card loans, see the “Loan Securitizations”
section beginning on page 64.

Note 10–Allowance for Credit Losses
Changes in the allowance for credit losses for the years ended
December 31 were as follows:
(In millions) 2001 2000 1999Balance, beginning of year $«4,110 $«2,285 $«2,271
Additions (deductions):Charge-offs (2,630) (1,667) (1,531)
Recoveries 342 276 325
Net charge-offs (2,288) (1,391) (1,206)
Provision for credit losses 2,510 3,398 1,249
Transfers (1) 196 (182) (29)
Balance, end of year $«4,528 $«4,110 $«2,285
(1) Transfers to the allowance for credit losses in 2001 primarily represent the addition of the Wachovia credit card portfolio. Transfers from the allowance for credit losses for prior years primarily represent allocable credit allowances associated with consumer loan sale transactions, including securitization transactions.
Note 11–Long-Term Debt
Long-term debt consists of borrowings having an original maturity
of greater than one year. Original issue discount and deferred
issuance costs are amortized into interest expense over the terms of
the related notes. Long-term debt at December 31, 2001 and 2000
was as follows:
Interest(Dollars in millions) Rate Maturities 2001 2000
Parent CompanySenior debt:
Medium-term notes 1.98–7.63% 2002-««2008 $14,387 $14,360
Other – – 8 14
Subordinated debt:Notes 5.90-««10.00 2002-««2027 6,920 6,204
Floating ratenotes Various 2003 150 246
SubsidiariesBank notes 1.76-÷7.93 2002-««2006 12,933 13,375
Subordinated notes 6.00-÷8.25 2002-««2008 1,729 1,695
Capital leases 5.50-÷11.07 2002-««2019 66 71
Other 1.85-÷11.14 2002–2028 3,910 2,463
Total long-term debt $40,103 $38,428
Aggregate annual scheduled repayments of long-term debt at
December 31, 2001 are as follows:
(In millions) Total2002 $««8,512
2003 7,910
2004 5,575
2005 3,932
2006 6,935
Thereafter 7,239
Total $40,103
Note 12–Deposits and Short-Term Borrowings
Deposits
The maturity distribution of domestic time certificates of deposit
of $100,000 and over and deposits in foreign offices, predomi-
nantly in amounts in excess of $100,000, at December 31, 2001
is as follows:
(Dollars in millions) Amount PercentDomestic Time Certificates of
Deposit of $100,000 and Over:Three months or less $««4,934 28%
Over three months to six months 2,040 11
Over six months to twelve months 2,446 14
Over twelve months 8,445 47
Total $17,865 100%
Foreign Offices:Three months or less 16,057 97%
Over three months to six months 278 2
Over six months to twelve months 208 1Over twelve months 32 –
Total «$16,575 100%
The Corporation has an aggregate amount of domestic other time
deposits of $100,000 and over of $206 million at December 31,
2001, which primarily mature within three months.
B A N K O N E C O R P O R A T I O N 83 2 0 0 1 A N N U A L R E P O R T
NOTES TO CONSOLIDATED FINANCIAL STATEMENTS

Shor t-Term Borrowings
Borrowings with original maturities of one year or less are classified as short-term. The following is a summary of short-term borrowings
for each of the three years ended December 31:
B A N K O N E C O R P O R A T I O N 84 2 0 0 1 A N N U A L R E P O R T
NOTES TO CONSOLIDATED FINANCIAL STATEMENTS
At Year-End For the YearHighest
Weighted- Daily Average Weighted- Outstandings(Dollars in millions) Outstandings Average rate Outstandings Average Rate at Month End
2001:
Federal funds purchased $÷3,171 1.62% $÷5,121 4.32% $÷6,353
Securities sold under repurchase agreements 10,557 1.43 11,543 3.57 13,386
Bank notes 4,529 3.07 8,267 5.48 13,047
Commercial paper 828 1.58 1,968 4.75 2,634
Other short-term borrowings 4,898 1.60 3,273 3.43 4,629
Total short-term borrowings $23,983 1.83% $30,172 4.28%
2000:
Federal funds purchased $÷5,253 5.89% $÷6,281 6.14% ÷$÷9,663
Securities sold under repurchase agreements 6,867 6.01 12,680 5.96 17,609
Bank notes 12,426 6.71 12,298 6.50 13,327
Commercial paper 3,048 6.62 3,137 5.94 3,303
Other short-term borrowings 2,529 6.22 3,543 6.50 6,861
Total short-term borrowings $30,123 6.36% $37,939 6.26%
1999:
Federal funds purchased $÷5,483 4.54% $÷7,060 4.96% $÷8,806
Securities sold under repurchase agreements 13,237 4.08 12,651 4.62 16,102
Bank notes 12,707 5.60 11,112 5.57 12,947
Commercial paper 3,184 6.09 3,006 5.23 3,595
Other short-term borrowings 5,320 4.46 3,739 4.98 5,475
Total short-term borrowings $39,931 4.86% $37,568 5.00%
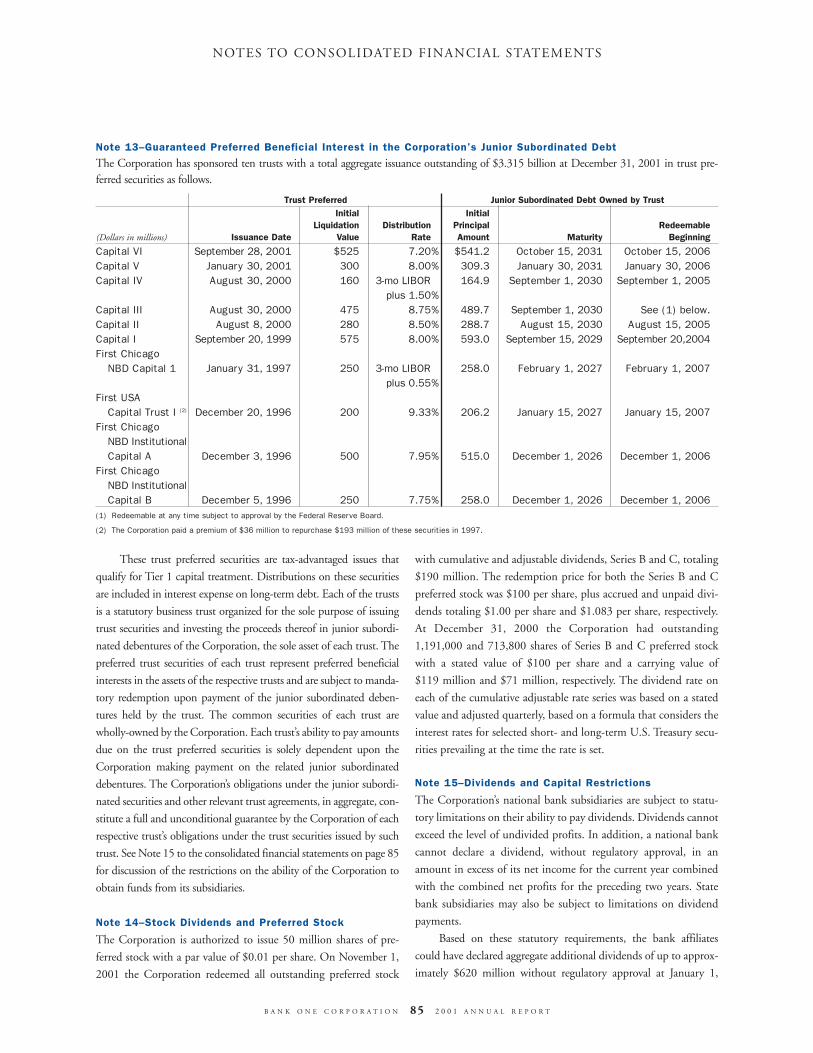
These trust preferred securities are tax-advantaged issues that
qualify for Tier 1 capital treatment. Distributions on these securities
are included in interest expense on long-term debt. Each of the trusts
is a statutory business trust organized for the sole purpose of issuing
trust securities and investing the proceeds thereof in junior subordi-
nated debentures of the Corporation, the sole asset of each trust. The
preferred trust securities of each trust represent preferred beneficial
interests in the assets of the respective trusts and are subject to manda-
tory redemption upon payment of the junior subordinated deben-
tures held by the trust. The common securities of each trust are
wholly-owned by the Corporation. Each trust’s ability to pay amounts
due on the trust preferred securities is solely dependent upon the
Corporation making payment on the related junior subordinated
debentures. The Corporation’s obligations under the junior subordi-
nated securities and other relevant trust agreements, in aggregate, con-
stitute a full and unconditional guarantee by the Corporation of each
respective trust’s obligations under the trust securities issued by such
trust. See Note 15 to the consolidated financial statements on page 85
for discussion of the restrictions on the ability of the Corporation to
obtain funds from its subsidiaries.
Note 14–Stock Dividends and Preferred Stock
The Corporation is authorized to issue 50 million shares of pre-
ferred stock with a par value of $0.01 per share. On November 1,
2001 the Corporation redeemed all outstanding preferred stock
with cumulative and adjustable dividends, Series B and C, totaling
$190 million. The redemption price for both the Series B and C
preferred stock was $100 per share, plus accrued and unpaid divi-
dends totaling $1.00 per share and $1.083 per share, respectively.
At December 31, 2000 the Corporation had outstanding
1,191,000 and 713,800 shares of Series B and C preferred stock
with a stated value of $100 per share and a carrying value of
$119 million and $71 million, respectively. The dividend rate on
each of the cumulative adjustable rate series was based on a stated
value and adjusted quarterly, based on a formula that considers the
interest rates for selected short- and long-term U.S. Treasury secu-
rities prevailing at the time the rate is set.
Note 15–Dividends and Capital Restrictions
The Corporation’s national bank subsidiaries are subject to statu-
tory limitations on their ability to pay dividends. Dividends cannot
exceed the level of undivided profits. In addition, a national bank
cannot declare a dividend, without regulatory approval, in an
amount in excess of its net income for the current year combined
with the combined net profits for the preceding two years. State
bank subsidiaries may also be subject to limitations on dividend
payments.
Based on these statutory requirements, the bank affiliates
could have declared aggregate additional dividends of up to approx-
imately $620 million without regulatory approval at January 1,
B A N K O N E C O R P O R A T I O N 85 2 0 0 1 A N N U A L R E P O R T
NOTES TO CONSOLIDATED FINANCIAL STATEMENTS
Note 13–Guaranteed Preferred Beneficial Interest in the Corporation’s Junior Subordinated Debt
The Corporation has sponsored ten trusts with a total aggregate issuance outstanding of $3.315 billion at December 31, 2001 in trust pre-ferred securities as follows.
Trust Preferred Junior Subordinated Debt Owned by TrustInitial Initial
Liquidation Distribution Principal Redeemable(Dollars in millions) Issuance Date Value Rate Amount Maturity Beginning
Capital VI September 28,«2001 $525 7.20% $541.2 October 15, 2031 October 15, 2006Capital V January 30,«2001 300 8.00% 309.3 January 30, 2031 January 30, 2006Capital IV August 30,«2000 160 3-mo LIBOR 164.9 September 1, 2030 September 1, 2005
plus 1.50%
Capital III August 30,«2000 475 8.75% 489.7 September 1, 2030 See (1) below.Capital II August 8,«2000 280 8.50% 288.7 August 15, 2030 August 15, 2005Capital I September 20,«1999 575 8.00% 593.0 September 15, 2029 September 20,2004First Chicago
NBD Capital 1 January 31,«1997 250 3-mo LIBOR 258.0 February 1, 2027 February 1, 2007plus 0.55%
First USA Capital Trust I (2) December 20,«1996 200 9.33% 206.2 January 15, 2027 January 15, 2007
First ChicagoNBD InstitutionalCapital A December 3,«1996 500 7.95% 515.0 December 1, 2026 December 1, 2006
First ChicagoNBD InstitutionalCapital B December 5,«1996 250 7.75% 258.0 December 1, 2026 December 1, 2006
(1) Redeemable at any time subject to approval by the Federal Reserve Board.
(2) The Corporation paid a premium of $36 million to repurchase $193 million of these securities in 1997.

2002. The payment of dividends by any bank may also be affected
by other factors, such as the maintenance of adequate capital.
The bank affiliates are subject to various regulatory capital
requirements that require them to maintain minimum ratios of total
and Tier 1 capital to risk-weighted assets and of Tier 1 capital to
average assets. Failure to meet minimum capital requirements results
in certain regulatory actions that could have a direct material effect on
the bank affiliates’ financial statements. As of December 31, 2001,
Management believed that each of the bank affiliates met all applica-
ble capital adequacy requirements and are correctly categorized as
“well capitalized” under the regulatory framework for prompt correc-
tive action. There are no conditions or events since that categorization
that Management believes have changed the institution’s category.
The actual and required capital amounts and ratios for the
Corporation and its principal banking subsidiaries are presented
as follows:
B A N K O N E C O R P O R A T I O N 86 2 0 0 1 A N N U A L R E P O R T
NOTES TO CONSOLIDATED FINANCIAL STATEMENTS
To Be CategorizedActual Adequately Capitalized
Capital Capital Capital Capital(Dollars in millions) Amount Ratio Amount Ratio
At December 31, 2001Risk-adjusted capital (to risk-weighted assets):
The Corporation (consolidated) $30,840 12.2% $20,266 8.0%
Bank One, N.A. (Chicago) 16,112 12.6% 10,191 8.0
Bank One, N.A. (Columbus) 4,594 10.9 3,373 8.0
Bank One, Michigan 2,115 11.9 1,420 8.0
First USA Bank, N.A. 2,253 16.5 1,092 8.0
Tier 1 capital (to risk-weighted assets):The Corporation (consolidated) $21,749 8.6% $10,133 4.0%
Bank One, N.A. (Chicago) 10,595 8.3 5,096 4.0
Bank One, N.A. (Columbus) 2,915 6.9 1,687 4.0
Bank One, Michigan 1,576 8.9 710 4.0
First USA Bank, N.A. 2,099 15.4 546 4.0
Tier 1 leverage (to average assets):The Corporation (consolidated) $21,749 8.2% $««7,942 3.0%
Bank One, N.A. (Chicago) 10,595 6.6 6,469 4.0
Bank One, N.A. (Columbus) 2,915 6.4 1,811 4.0
Bank One, Michigan 1,576 7.3 867 4.0
First USA Bank, N.A. 2,099 14.2 589 4.0
At December 31, 2000Risk-adjusted capital (to risk-weighted assets):
The Corporation (consolidated) $29,140 10.8% $21,615 8.0%
Bank One, N.A. (Chicago) (1) 16,007 11.3 11,378 8.0
Bank One, N.A. (Columbus) 4,283 12.0 2,862 8.0
Bank One, Michigan 2,406 10.9 1,759 8.0
First USA Bank, N.A. 2,230 15.8 1,126 8.0
Tier 1 capital (to risk-weighted assets):The Corporation (consolidated) $19,824 7.3% $10,807 4.0%
Bank One, N.A. (Chicago) (1) 9,689 6.8 5,689 4.0
Bank One, N.A. (Columbus) 2,867 8.0 1,431 4.0
Bank One, Michigan 1,582 7.2 879 4.0
First USA Bank, N.A. 2,110 15.0 563 4.0
Tier 1 leverage (to average assets):The Corporation (consolidated) $19,824 7.3% $÷8,167 3.0%
Bank One, N.A. (Chicago) (1) 9,689 6.4 6,078 4.0
Bank One, N.A. (Columbus) 2,867 7.8 1,471 4.0
Bank One, Michigan 1,582 7.2 878 4.0
First USA Bank, N.A. 2,110 11.8 718 4.0
(1) Reclassified to show the effect of the 2001 mergers with Bank One, Texas, N.A., Bank One, Louisiana, N.A., Bank One, Florida, Bank One, Arizona, N.A., and Bank One, Utah, N.A.
Federal banking law restricts each bank subsidiary from extending credit to the Corporation in excess of 10% of the subsidiary’s capital
stock and surplus, as defined. Any such extensions of credit are subject to strict collateral requirements.

Note 16–Supplemental Disclosures for Statements
of Cash Flows
During 2000 and 1999, the Corporation transferred $6.5 billion
and $2.3 billion, respectively, of investment securities available for
sale to trading securities. These transfers were for capital manage-
ment purposes.
Loans transferred to other real estate owned totaled
$162 million, $131 million, and $113 million in 2001, 2000, and
1999, respectively.
During 2000 and 1999, the Corporation recognized several
non-cash charges to earnings for significant items. Several of these
items will not result in future cash outflows while other items rep-
resent future uses of cash. See tables 1 and 2 on page 41 for a
detailed listing of significant items.
Note 17–Supplemental Disclosures for Accumulated
Other Adjustments to Stockholders’ Equity
Accumulated other adjustments to stockholders’ equity are as follows:
(In millions) 2001 2000 1999
Fair value adjustment on investmentsecurities–available for sale:
Balance, beginning of period $««(15) $«(271) $««218
Change in fair value, net of taxesof $86 in 2001, $(6) in 2000 and $(180) in 1999 158 (5) (391)
Reclassification adjustment, net of taxes of $(38) in 2001, $151in 2000 and $(56) in 1999 (65) 261 (98)
Balance, end-of-period 78 (15) (271)
Fair value adjustment on derivative instruments–cash flow type hedges:
Balance, beginning of period – – –
Transition adjustment at January1, 2001, net of taxes of $(56) (1) (98) – –
Net change in fair value associated with current period hedging activities, net of taxes of $(70) in 2001 (139) – –
Net reclassification into earnings,net of taxes of $49 in 2001 (1) 91 – –
Balance, end-of-period (146) – –
Accumulated translation adjustment:Balance, beginning of period 10 8 21
Translation gain (loss), net of hedge results and taxes (7) 2 (13)
Balance, end of period 3 10 8
Total accumulated other adjustmentsto stockholders’ equity $««(65) $«««««(5) $«(263)
(1) During 2001, $89 million after-tax of the transition adjustment recorded at January 1, 2001 was reclassified into earnings.
Note 18–Employee Benefits
(a) Pension Plans
Prior to 2000, the Corporation had various noncontributory
defined benefit pension plans covering substantially all salaried
employees. Effective December 31, 1999, all noncontributory
defined benefit pension plans were combined into one plan.
Effective December 31, 2000, the supplemental executive retire-
ment plan was discontinued.
The Corporation’s qualified plans’ change in benefit obligation,
change in plan assets and funded status are as follows:
(In millions) 2001 2000
Change in benefit obligation:Benefit obligation, January 1 $2,248 $2,250
Service cost 92 103
Interest cost 168 182
EGTRRA adjustment (1) 7 –Actuarial loss 108 128
Benefits paid (326) (415)
Benefit obligation, December 31 $2,297 $2,248
Change in plan assets:Fair value of plan assets, January 1 $3,134 $3,400
Actual return (loss) on plan assets (114) 146
Corporation contribution 53 3
Benefits paid (326) (415)
Fair value of plan assets, December 31 $2,747 $3,134
Funded status $«««450 «««886
Unrecognized net actuarial loss (gain) 156 (357)
Unrecognized prior service cost 24 28
Unrecognized net transition assets – (7)
Prepaid pension costs, December 31 $«««630 $«««550
(1) The Economic Growth and Tax Relief Reconciliation Act of 2001 (EGTRRA) contained various provisions relating to the operations of qualified pension plans. Increases to the benefit limits and the limit on pensionable earnings caused a shift in pension obligation from the non-qualified to the qualified plan.
Plan assets include approximately 1.0 million shares of the
Corporation’s common stock with a fair value of approximately
$40 million and $37 million at December 31, 2001 and 2000,
respectively.
The net periodic pension benefit for 2001, 2000 and 1999
for the Corporation’s qualified and nonqualified pension plans are
as follows:
(In millions) 2001 2000 1999
Service cost–benefits earned during the period $«««96 $«110 $«123
Interest cost on benefit obligation 177 194 175
Expected return on plan assets (287) (300) (293)
Amortization of prior service cost 8 9 (1)
Recognized actuarial (gain) (1) (11) (1)
Amortization of transition assets (7) (13) (13)
Curtailment gain – – (13)
Net periodic pension benefit $÷(14) $÷(11) $÷(23)
B A N K O N E C O R P O R A T I O N 87 2 0 0 1 A N N U A L R E P O R T
NOTES TO CONSOLIDATED FINANCIAL STATEMENTS

B A N K O N E C O R P O R A T I O N 88 2 0 0 1 A N N U A L R E P O R T
NOTES TO CONSOLIDATED FINANCIAL STATEMENTS
The accrued pension cost for the Corporation’s nonqualified
supplemental pension plans was $39 million and $77 million
at December 31, 2001 and 2000, respectively. Such plans are
unfunded.
The assumptions used in determining the Corporation’s
benefit obligation and net periodic pension cost for both qualified
and nonqualified supplemental pension plans are as follows:
FOR THE YEAR ENDED DECEMBER 31, 2002 2001 2000 1999
Actuarial assumptions:Weighted-average discount rate
for benefit obligation 7.00% 7.00% 7.50% 8.00%
Weighted-average rate of compensation increase 4.25% 4.25% 4.25% 5.00%
Expected long-term rate of return on plan assets 8.50% 9.50% 9.50% 9.50%
(1) Rate currently expected at December 31, 2002.
(b) Postretirement Benefits Other Than Pensions
The Corporation sponsors postretirement life insurance plans and
provides health care benefits for certain retirees and grandfathered
employees when they retire. The postretirement life insurance benefit
is noncontributory, while the health care benefits are contributory.
The Corporation’s postretirement benefit plans’ change in
benefit obligation and funded status at December 31, 2001 and
2000 are as follows:
(In millions) 2001 2000
Change in benefit obligation:Benefit obligation, January 1 $«195 $«164
Service cost – –
Interest cost 14 13
Actuarial loss 48 37
Benefits paid (24) (17)
Curtailment – (2)
Benefit obligation, December 31 «233 «195
Change in plan assets:Fair value of plan assets, January 1 – –
Employer contribution ««24 17
Benefits paid (24) ««(17)
Fair value of plan assets, December 31 – –
Funded status (233) (195)
Unrecognized net actuarial loss 67 20Unrecognized prior service cost (25) (38)
Accrued postretirement costs, December 31 $(191) $(213)
Net periodic cost for postretirement health care and life insur-
ance benefits during 2001, 2000 and 1999 includes the following:
(In millions) 2001 2000 1999
Service cost–benefits earned during the period $÷«– $÷«– $÷«1
Interest cost on accumulated postretirement benefit obligation 14 13 13
Amortization of prior service cost (12) (12) (12)
Adjustment for acquisitions – – 2
Curtailment – 1 –
Net periodic postretirement cost $÷«2 $÷«2 $÷«4
The weighted average discount rate used in determining the
accumulated postretirement benefit obligation was 7.00% at
December 31, 2001, and 7.50% at December 31, 2000.
For measurement purposes, an annual rate of increase of
10.00% was assumed for 2001 in the cost of covered health care
benefits; this range was assumed to decrease to 5.00% in the years
2009 and thereafter. These assumptions have a significant effect on
the amounts reported. Accordingly, the effect of a 1.00% change in
the assumed health care cost trend rates is as follows:
(In millions) 1% increase 1% decreaseEffect on 2001 service
and interest cost components $««0.9 $««0.8
Effect on December 31, 2001, accumulated postretirement benefit obligation $14.3 $12.6
(c) 401(k) Plans
The Corporation sponsored various 401(k) plans that together
covered substantially all of its employees. Up until 2000, the
Corporation was required to make contributions to the plans in
varying amounts. The expense related to these plans was
$95 million in 2001, $137 million in 2000 and $81 million in
1999. Effective December 31, 1999, all new contributions are being
made to one Corporation-sponsored 401(k) plan, thereby establish-
ing uniform contribution requirements for the entire Corporation.
Note 19–Stock-Based Compensation
The Corporation utilizes several types of stock-based awards as part
of its overall compensation program. In addition, the Corporation
provides employees the opportunity to purchase its shares through
its Employee Stock Purchase Plan. The Corporation’s stock-based
compensation plans provide for the granting of awards to purchase
or receive common shares and include limits as to the aggregate
number of shares available for grants and the total number of
shares available for grants of stock awards in any one year. The
compensation cost that has been charged against income for the
Corporation’s stock-based compensation plans was $70 million for
(1)

Summarized stock option activity for 2001, 2000 and 1999, respectively, and details of the Corporation’s stock options outstanding at
December 31, 2001 follows:
2001 2000 1999Wtd. Avg. Wtd. Avg. Wtd. Avg.
(Shares in thousands) Shares Exercise Price Shares Exercise Price Shares Exercise Price
Outstanding at January 1 77,315 $34.17 44,630 $40.88 38,247 $34.34
Granted 23,573 37.73 42,659 27.25 15,556 50.35
Exercised (7,262) 25.09 (2,089) 19.66 (6,473) 24.34
Forfeited (3,144) 36.72 (7,885) 38.56 (2,700) 36.56
Outstanding at December 31 90,482 $35.72 77,315 $34.17 44,630 $40.88
Exercisable at December 31 45,525 $36.30 25,503 $36.41 19,847 $32.86
Options Outstanding Options ExercisableNumber Wtd. Avg. Number
(Shares in thousands) Outstanding Wtd. Avg. Remaining Exercisable Wtd. Avg.Range of Exercise Prices Dec. 31, 2001 Exercise Price Contractual Life Dec. 31, 2001 Exercise Price
Less than $20.00 ÷2,084 $16.21 1.8 years 2,084 $16.21
$20.01 - $25.00 ÷3,261 24.47 3.8 years 3,261 24.47
$25.01 - $30.00 ÷31,640 26.61 14.5 years 16,139 26.46
$30.01 - $35.00 ÷5,632 32.70 7.2 years 3,137 32.33
$35.01 - $45.00 ÷27,623 38.04 8.5 years 5,211 38.80
$45.01 - $55.00 ÷16,166 49.53 10.7 years 12,190 49.34
Greater than $55.00 ÷4,076 59.13 6.8 years 3,503 59.09
Total ÷90,482 $35.72 10.5 years 45,525 $36.30
B A N K O N E C O R P O R A T I O N 89 2 0 0 1 A N N U A L R E P O R T
NOTES TO CONSOLIDATED FINANCIAL STATEMENTS
2001, $59 million for 2000 and $38 million for 1999. As a result
of the 1999 fourth-quarter restructuring plan, $4 million was
recorded as a restructuring charge related to the immediate vesting
of restricted shares for certain executives.
(a) Restricted Shares
Restricted shares granted to key officers of the Corporation require
them to continue employment for a stated number of years from
the grant date before restrictions on the shares lapse. The market
value of the restricted shares as of the date of grant is amortized to
compensation expense as earned over the restriction period.
Holders of restricted stock receive dividends and have the right to
vote the shares.
(b) Stock Options
The Corporation’s stock option plans generally provide that the
exercise price of any stock option may not be less than the closing
price of the common stock on the trading day preceding the date
of grant of the common stock.
Options granted under the Corporation’s stock-based com-
pensation program generally vest ratably over a five-year period and
have a term of ten years. Certain option grants include the right to
receive additional option grants (“reload” or “restorative” options)
in an amount equal to the number of common shares used to
satisfy the exercise price and applicable withholding taxes. Upon
grant, reload options assume the same remaining term as the
related original option and vest six months from the date of grant.
(c) Employee Stock Purchase Plan
The Corporation sponsors an Employee Stock Purchase Plan
designed to encourage employee stock ownership. This plan generally
allows eligible employees to purchase shares of the Corporation’s
common stock at a 15% discount from the market price at the begin-
ning of an offering or the market price at the end of such offering,
whichever is lower. During the current 18-month offering period, an
employee is allowed to make deposits of up to 20% of his/her earn-
ings (up to a designated maximum) on an annual basis to an interest-
bearing savings account to purchase the number of shares permissible
under the plan. The maximum number of shares each participant
may purchase cannot exceed the contribution limit divided by the
applicable purchase price on the offering date. Shares purchased by
the participant are subject to a one year holding period and cannot be
sold or transferred for one year after the purchase date. The
Corporation does not recognize any compensation expense with
respect to this plan.
(d) Pro Forma Costs of Stock-Based Compensation
The grant date fair values of stock options granted under the
Corporation’s various stock option plans and the Employee Stock
Purchase Plan were estimated using the Black-Scholes option-
pricing model. This model was developed to estimate the fair
value of traded options, which have different characteristics than
employee stock options. In addition, changes to the subjective
input assumptions can result in materially different fair market
value estimates. Therefore, the Black-Scholes model may not nec-
essarily provide a reliable single measure of the fair value of
employee stock options and purchase rights.

B A N K O N E C O R P O R A T I O N 90 2 0 0 1 A N N U A L R E P O R T
Summarized stock-based compensation grants and their related weighted-average grant-date fair values for the years ended
December 31 follows:
2001 2000 1999Number of Wtd. Avg. Grant Number of Wtd. Avg. Grant Number of Wtd. Avg. Grant
(Shares in thousands) Shares Date Fair Value Shares Date Fair Value Shares Date Fair Value
Stock option plans 23,573 $÷13.34 42,659 $÷÷9.80 15,556 $÷12.28
Restricted shares 2,065 37.68 4,517 27.85 1,728 51.13
Employee Stock Purchase Plan (1) 2,483 9.68 2,122 3.27 2,974 7.28
(1) Estimated number of shares that employees would purchase under the 2001, 2000 and 1999 plans.
NOTES TO CONSOLIDATED FINANCIAL STATEMENTS
The following assumptions were used to determine the Black-
Scholes weighted-average grant date fair value of stock option awards
and conversions in 2001, 2000 and 1999: (1) expected dividend
yields ranged from 2.29% - 4.86%, (2) expected volatility ranged
from 19.11% - 42.29%, (3) risk-free interest rates ranged from
4.85% - 6.43% and (4) expected lives ranged from 2 to 13 years.
The following assumptions were used to determine the Black-
Scholes weighted-average grant-date fair value of employees’ pur-
chase rights under the employee stock purchase plans in 2001,
2000 and 1999, respectively: (1) expected dividend yields of
2.30%, 2.58% and 2.86%, (2) expected volatility of 33.80%,
39.63% and 34.68%, (3) risk-free interest rate of 2.61%, 6.22%
and 5.07% and (4) expected lives of 1.5, 0.5 and 1.0 years.
Had the compensation cost for the Corporation’s stock-based
compensation plans been determined in accordance with the fair-
value-based accounting method provided by SFAS No. 123
“Accounting for Stock-Based Compensation,” the net income and
earnings per share implications for the years ended December 31,
2001, 2000 and 1999 would have been as follows:
2001 2000 1999(In millions, Pro As Pro As Pro Asexcept per share data) Forma(1) Reported Forma(1) Reported Forma(1) Reported
Net income (loss) $2,452 $2,638 $«(646) $«(511) $3,413 $3,479
Net income (loss) per common share, basic 2.09 2.25 (0.57) (0.45) 2.91 2.97
Net income (loss) per common share, diluted 2.08 2.24 (0.57) (0.45) 2.89 2.95
(1) The above pro forma information may not be representative of the pro forma impact in future years.
Note 20–Income Taxes
The components of total applicable income tax expense (benefit)
in the consolidated income statement for the years ended
December 31, 2001, 2000 and 1999 are as follows:
(In millions) 2001 2000 1999Income tax expense:
Current:Federal $««««797 $«÷«571 $÷«735
Foreign 11 32 2
State 115 26 97
Total 923 629 834
Deferred:Federal 194 (1,151) 624
Foreign 5 (7) –
State (4) (40) 37
Total 195 (1,198) 661
Applicable income taxes (benefit) $«1,118 $«««(569) $«1,495
The tax effects of fair value adjustments on securities available
for sale, derivative instruments in cash flow type hedges, foreign
currency translation adjustments and certain tax benefits related to
stock options are recorded directly to stockholders’ equity. The net
tax (benefit) charge recorded directly to stockholders’ equity
amounted to $(47) million in 2001, $107 million in 2000 and
$(259) million in 1999.
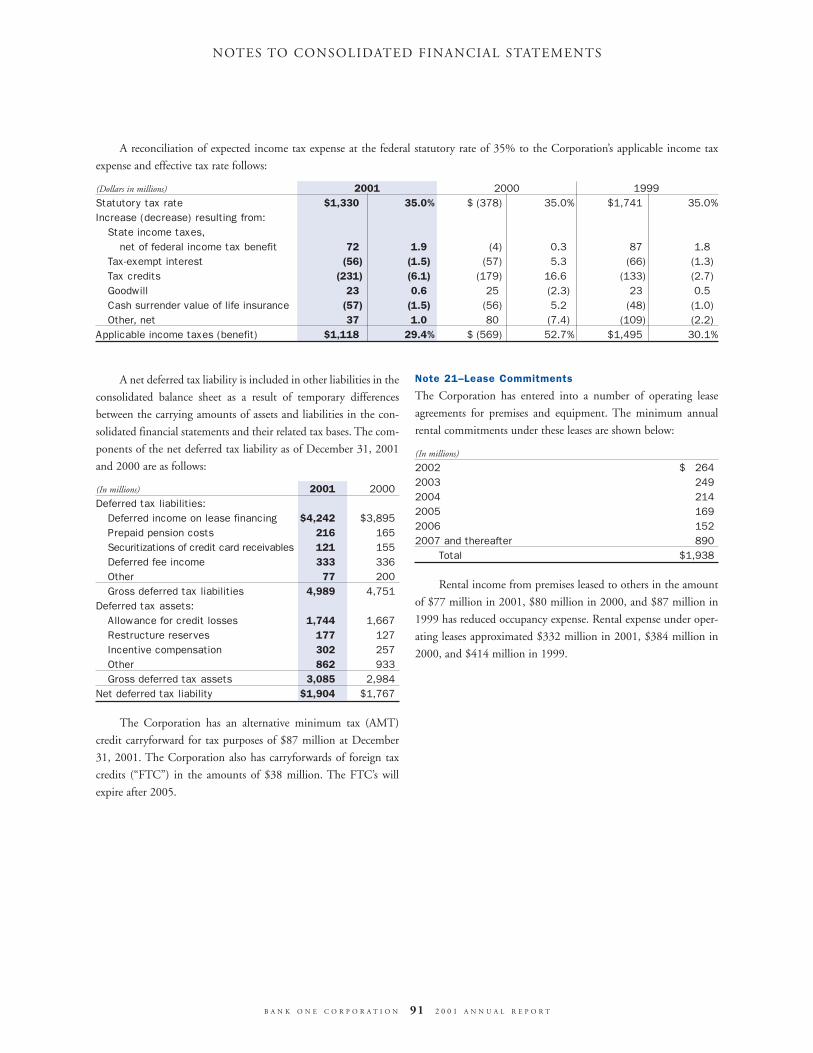
A reconciliation of expected income tax expense at the federal statutory rate of 35% to the Corporation’s applicable income tax
expense and effective tax rate follows:
(Dollars in millions) 2001 2000 1999Statutory tax rate $1,330 35.0% $«(378) 35.0% $1,741 35.0%
Increase (decrease) resulting from:State income taxes,
net of federal income tax benefit 72 1.9 (4) 0.3 87 1.8
Tax-exempt interest (56) (1.5) (57) 5.3 (66) (1.3)
Tax credits (231) (6.1) (179) 16.6 (133) (2.7)
Goodwill 23 0.6 25 (2.3) 23 0.5
Cash surrender value of life insurance (57) (1.5) (56) 5.2 (48) (1.0)
Other, net 37 1.0 80 (7.4) (109) (2.2)
Applicable income taxes (benefit) $1,118 29.4% $«(569) 52.7% $1,495 30.1%
B A N K O N E C O R P O R A T I O N 91 2 0 0 1 A N N U A L R E P O R T
NOTES TO CONSOLIDATED FINANCIAL STATEMENTS
A net deferred tax liability is included in other liabilities in the
consolidated balance sheet as a result of temporary differences
between the carrying amounts of assets and liabilities in the con-
solidated financial statements and their related tax bases. The com-
ponents of the net deferred tax liability as of December 31, 2001
and 2000 are as follows:
(In millions) 2001 2000Deferred tax liabilities:
Deferred income on lease financing $4,242 $3,895Prepaid pension costs 216 165
Securitizations of credit card receivables 121 155
Deferred fee income 333 336
Other 77 200
Gross deferred tax liabilities 4,989 4,751
Deferred tax assets:Allowance for credit losses 1,744 1,667
Restructure reserves 177 127
Incentive compensation 302 257
Other 862 933
Gross deferred tax assets 3,085 2,984
Net deferred tax liability $1,904 $1,767
The Corporation has an alternative minimum tax (AMT)
credit carryforward for tax purposes of $87 million at December
31, 2001. The Corporation also has carryforwards of foreign tax
credits (“FTC”) in the amounts of $38 million. The FTC’s will
expire after 2005.
Note 21–Lease Commitments
The Corporation has entered into a number of operating lease
agreements for premises and equipment. The minimum annual
rental commitments under these leases are shown below:
(In millions)
2002 $«÷264
2003 249
2004 214
2005 169
2006 152
2007 and thereafter 890
Total $1,938
Rental income from premises leased to others in the amount
of $77 million in 2001, $80 million in 2000, and $87 million in
1999 has reduced occupancy expense. Rental expense under oper-
ating leases approximated $332 million in 2001, $384 million in
2000, and $414 million in 1999.

B A N K O N E C O R P O R A T I O N 92 2 0 0 1 A N N U A L R E P O R T
Note 22–Financial Instruments with Off-Balance
Sheet Risk
In the normal course of business, the Corporation is a party to
financial instruments containing credit and/or market risks that are
not required to be reflected in the balance sheet. These financial
instruments are primarily credit-related instruments. The
Corporation has risk management policies to identify, monitor and
limit exposure to credit, liquidity and market risks.
The following disclosures represent the Corporation’s credit
exposure, assuming that every counterparty to financial instru-
ments with off-balance sheet credit risk fails to perform completely
according to the terms of the contracts, and that the collateral and
other security, if any, proves to be of no value to the Corporation.
This note does not address the amount of market losses the
Corporation would incur if future changes in market prices make
financial instruments with off-balance sheet market risk less valu-
able or more onerous. For a more detailed discussion of off-balance
sheet activities see the “Other Off-Balance Sheet Activities” section
beginning on page 66.
(a) Collateral and Other Security Arrangements
The credit risk of both on- and off-balance sheet financial instru-
ments varies based on many factors, including the value of collat-
eral held and other security arrangements. To mitigate credit risk,
the Corporation generally determines the need for specific
covenant, guarantee and collateral requirements on a case-by-case
basis, depending on the nature of the financial instrument and the
customer’s creditworthiness. The Corporation may also receive
comfort letters and oral assurances. The amount and type of col-
lateral held to reduce credit risk varies but may include real estate,
machinery, equipment, inventory and accounts receivable, as well
as cash on deposit, stocks, bonds and other marketable securities
that are generally held in the Corporation’s possession or at another
appropriate custodian or depository. This collateral is valued and
inspected on a regular basis to ensure both its existence and ade-
quacy. Additional collateral is requested when appropriate.
(b) Credit-Related Financial Instruments
Summarized credit-related financial instruments, including both
commitments to extend credit and letters of credit are as follows:
FOR THE YEAR ENDED DECEMBER 31, 2001 2000(In billions)
Unused credit card lines $299.3 $272.7
Unused loan commitments 148.2 162.9
Standby letters of credit and foreign office guarantees 19.4 19.0
Commercial letters of credit 0.6 0.7
Since many of the unused commitments are expected to
expire unused or be only partially used, the total amount of unused
commitments in the preceding table does not necessarily represent
future cash requirements.
Credit card lines allow customers to use a credit card to buy
goods or services and to obtain cash advances. However, the
Corporation has the right to change or terminate any terms or con-
ditions of a customer’s credit card account, upon notification to the
customer. Loan commitments are agreements to make or acquire a
loan or lease as long as the agreed-upon terms (e.g., expiry, covenants
or notice) are met. The Corporation’s commitments to purchase or
extend loans help its customers meet their liquidity needs.
Standby letters of credit and foreign office guarantees are
issued in connection with agreements made by customers to coun-
terparties. If the customer fails to comply with the agreement, the
counterparty may enforce the standby letter of credit or foreign
office guarantee as a remedy. Credit risk arises from the possibility
that the customer may not be able to repay the Corporation for
standby letters of credit or foreign office guarantees. At December
31, 2001 and 2000, standby letters of credit and foreign office
guarantees had been issued for the following purposes:
FOR THE YEAR ENDED DECEMBER 31, 2001 2000
(In millions)
Financial $15,611 $15,705
Performance 3,786 3,305
Total (1) $19,397 $19,010
(1) Includes $3.4 billion at December 31, 2001, and $2.7 billion at December 31,2000, participated to other institutions.
Commercial letters of credit are issued or confirmed to ensure
payment of customers’ payables or receivables in short-term inter-
national trade transactions. Generally, drafts will be drawn when
the underlying transaction is consummated as intended. However,
the short-term nature of this instrument serves to mitigate the risk
associated with these contracts.
NOTES TO CONSOLIDATED FINANCIAL STATEMENTS
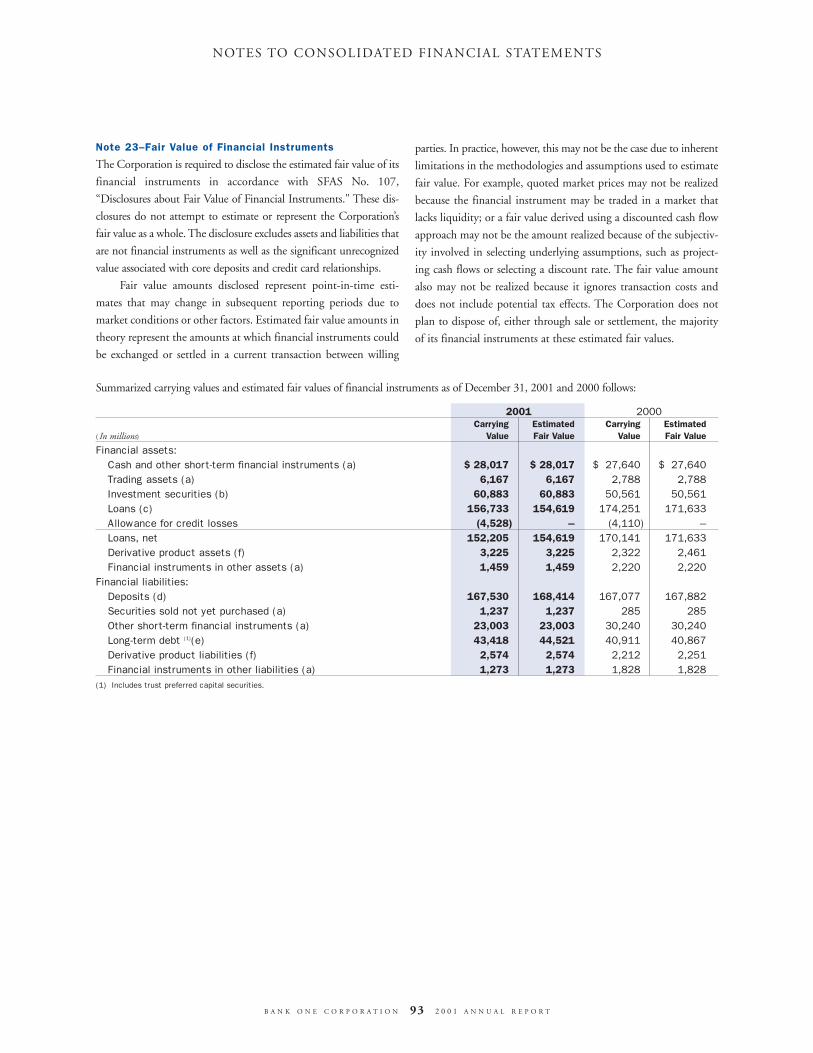
2001 2000Carrying Estimated Carrying Estimated
(In millions) Value Fair Value Value Fair Value
Financial assets:Cash and other short-term financial instruments (a) $«28,017 $«28,017 $÷27,640 $÷27,640
Trading assets (a) 6,167 6,167 2,788 2,788
Investment securities (b) 60,883 60,883 50,561 50,561
Loans (c) 156,733 154,619 174,251 171,633
Allowance for credit losses (4,528) – (4,110) –
Loans, net 152,205 154,619 170,141 171,633
Derivative product assets (f) 3,225 3,225 2,322 2,461
Financial instruments in other assets (a) 1,459 1,459 2,220 2,220
Financial liabilities:Deposits (d) 167,530 168,414 167,077 167,882
Securities sold not yet purchased (a) 1,237 1,237 285 285
Other short-term financial instruments (a) 23,003 23,003 30,240 30,240
Long-term debt (1)(e) 43,418 44,521 40,911 40,867
Derivative product liabilities (f) 2,574 2,574 2,212 2,251
Financial instruments in other liabilities (a) 1,273 1,273 1,828 1,828
(1) Includes trust preferred capital securities.
B A N K O N E C O R P O R A T I O N 93 2 0 0 1 A N N U A L R E P O R T
NOTES TO CONSOLIDATED FINANCIAL STATEMENTS
Note 23–Fair Value of Financial Instruments
The Corporation is required to disclose the estimated fair value of its
financial instruments in accordance with SFAS No. 107,
“Disclosures about Fair Value of Financial Instruments." These dis-
closures do not attempt to estimate or represent the Corporation’s
fair value as a whole. The disclosure excludes assets and liabilities that
are not financial instruments as well as the significant unrecognized
value associated with core deposits and credit card relationships.
Fair value amounts disclosed represent point-in-time esti-
mates that may change in subsequent reporting periods due to
market conditions or other factors. Estimated fair value amounts in
theory represent the amounts at which financial instruments could
be exchanged or settled in a current transaction between willing
parties. In practice, however, this may not be the case due to inherent
limitations in the methodologies and assumptions used to estimate
fair value. For example, quoted market prices may not be realized
because the financial instrument may be traded in a market that
lacks liquidity; or a fair value derived using a discounted cash flow
approach may not be the amount realized because of the subjectiv-
ity involved in selecting underlying assumptions, such as project-
ing cash flows or selecting a discount rate. The fair value amount
also may not be realized because it ignores transaction costs and
does not include potential tax effects. The Corporation does not
plan to dispose of, either through sale or settlement, the majority
of its financial instruments at these estimated fair values.
Summarized carrying values and estimated fair values of financial instruments as of December 31, 2001 and 2000 follows:

B A N K O N E C O R P O R A T I O N 94 2 0 0 1 A N N U A L R E P O R T
Estimated fair values are determined as follows:
(a) Financial Instruments Whose Carr ying Value
Approximates Fair Value
A financial instrument’s carrying value approximates its fair value
when the financial instrument has an immediate or short-term
maturity (generally one year or less), or is carried at fair value.
Quoted market prices or dealer quotes typically are used to
estimate fair values of trading securities and securities sold under
repurchase agreements.
Commitments to extend credit and letters of credit typically
result in loans with a market interest rate when funded. The recorded
book value of deferred fee income approximates the fair value.
(b) Investment Securities
Quoted market prices typically are used to estimate the fair value of
debt investment securities. Quoted market prices for similar securi-
ties are used to estimate fair value when a quoted market price is not
available for a specific debt investment security. See Note 1(d) to the
consolidated financial statements on page 74 for the methodologies
used to determine the fair value of equity investment securities.
(c) Loans
The loan portfolio was segmented based on loan type, credit
quality and repricing characteristics. Carrying values are used to
estimate fair values of certain variable rate loans with no significant
credit concerns and frequent repricing. A discounted cash flow
method was used to estimate the fair value of other loans.
Discounting was based on the contractual cash flows, and discount
rates typically are based on the year-end yield curve plus a spread
that reflects pricing on loans with similar characteristics. If appli-
cable, prepayment assumptions are factored into the fair value
determination based on historical experience and current economic
and lending conditions.
(d) Deposits
The amount payable on demand at the report date is used to esti-
mate fair value of demand and savings deposits with no defined
maturity. A discounted cash flow method is used to estimate the
fair value of fixed-rate time deposits. Discounting was based on the
contractual cash flows and the current rates at which similar
deposits with similar remaining maturities would be issued,
adjusted for servicing costs. Carrying value typically is used to esti-
mate the fair value of floating-rate time deposits.
(e) Long-Term Debt
Quoted market prices or the discounted cash flow method was
used to estimate the fair value of the Corporation’s fixed-rate long-
term debt. Discounting was based on the contractual cash flows
and the current rates at which debt with similar terms could be
issued. Carrying value typically is used to estimate the fair value of
floating-rate long-term debt.
(f) Derivative Product Assets and Liabilities
For December 2001, the carrying value equals the estimated fair
value due to the adoption of SFAS No. 133 during 2001. For the
year 2000, quoted market prices or pricing and valuation models
were used to estimate the fair value of derivative product assets and
liabilities. Assumptions input into models were based on current
market information.
Note 24–Related Party Transactions
Certain executive officers, directors and their related interests are
loan customers of the Corporation. These loans in the aggregate
were less than 5% of stockholders’ equity at December 31, 2001
and 2000.

B A N K O N E C O R P O R A T I O N 95 2 0 0 1 A N N U A L R E P O R T
Note 25–Pledged Assets
Assets having a book value of $70.3 billion as of December 31,
2001, and $44.2 billion as of December 31, 2000, were pledged as
collateral for repurchase agreements, certain derivative instrument
transactions, and governmental and trust department deposits in
accordance with federal and state requirements, and for other pur-
poses required by law. The assets pledged generally were comprised
of commercial mortgage loans and investment securities. Of the
total collateral pledged as of December 31, 2001, $3.1 billion of
collateral, which was comprised of securities posted as collateral for
repurchase agreements, was permitted to be sold or repledged by
the secured party. The Corporation does not issue equity puts.
The Corporation’s bank affiliates are required to maintain
average noninterest-bearing cash balances, in accordance with
Federal Reserve Board regulations. The average required reserve
balances were $2.3 billion in 2001 and $2.5 billion in 2000.
Note 26–Collateral Policy Related to Certain Asset
Transfer Activity
It is the Corporation’s policy to take possession of securities pur-
chased under agreements to resell in order to secure the risk of coun-
terparty nonperformance on the transaction. The Corporation
monitors the fair value of the underlying securities as compared to
the related receivable, including accrued interest, and adjusts the
level of collateral as necessary. With respect to securities lent, the
Corporation receives collateral to secure the risk of counterparty
nonperformance in the form of cash or other collateral, in an
amount generally in excess of the fair value of the lent securities. The
Corporation monitors the fair value of the securities lent on a daily
basis, and additional cash or securities are obtained as necessary.
At December 31, 2001 and 2000, the fair value of collateral
accepted by the Corporation in connection with these activities
was $6.3 billion and $4.1 billion, respectively, of which,
$5.9 billion and $3.8 billion, respectively, had been sold or
repledged as of the balance sheet date.
Note 27–Contingent Liabilities
The Corporation and certain of its subsidiaries have been named as
defendants in various legal proceedings, including certain class
actions, arising out of the normal course of business or operations. In
certain of these proceedings, which are based on alleged violations of
consumer protection, securities, banking, insurance and other laws,
rules or principles, substantial money damages are asserted against the
Corporation and its subsidiaries. Since the Corporation and certain of
its subsidiaries, which are regulated by one or more federal and state
regulatory authorities, are the subject of numerous examinations and
reviews by such authorities, the Corporation also is and will be, from
time to time, normally engaged in various disagreements with regula-
tors, related primarily to its financial services businesses. The
Corporation has also received certain tax deficiency assessments. In
view of the inherent difficulty of predicting the outcome of such
matters, the Corporation cannot state what the eventual outcome of
pending matters will be; however, based on current knowledge and
after consultation with counsel, Management does not believe that
liabilities arising from these matters, if any, will have a material adverse
effect on the consolidated financial position of the Corporation.
NOTES TO CONSOLIDATED FINANCIAL STATEMENTS
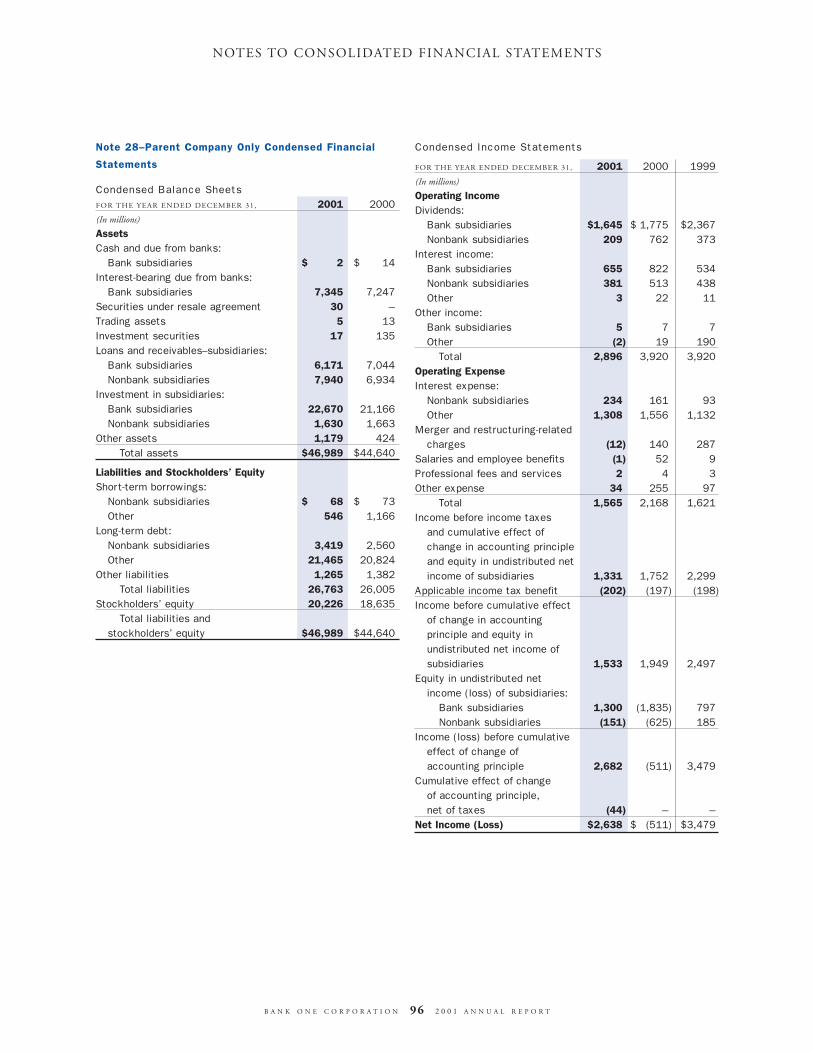
B A N K O N E C O R P O R A T I O N 96 2 0 0 1 A N N U A L R E P O R T
NOTES TO CONSOLIDATED FINANCIAL STATEMENTS
Note 28–Parent Company Only Condensed Financial
Statements
Condensed Balance SheetsFOR THE YEAR ENDED DECEMBER 31, 2001 2000(In millions)
AssetsCash and due from banks:
Bank subsidiaries $«÷÷÷÷2 $÷÷÷«14
Interest-bearing due from banks:Bank subsidiaries 7,345 7,247
Securities under resale agreement 30 –
Trading assets 5 13
Investment securities 17 135
Loans and receivables–subsidiaries:Bank subsidiaries 6,171 7,044
Nonbank subsidiaries 7,940 6,934
Investment in subsidiaries:Bank subsidiaries 22,670 21,166
Nonbank subsidiaries 1,630 1,663
Other assets 1,179 424
Total assets $46,989 $44,640
Liabilities and Stockholders’ EquityShort-term borrowings:
Nonbank subsidiaries $÷÷÷«68 $÷÷÷«73
Other 546 1,166
Long-term debt:Nonbank subsidiaries 3,419 2,560
Other 21,465 20,824
Other liabilities 1,265 1,382
Total liabilities 26,763 26,005
Stockholders’ equity 20,226 18,635
Total liabilities and stockholders’ equity $46,989 $44,640
Condensed Income Statements
FOR THE YEAR ENDED DECEMBER 31, 2001 2000 1999
(In millions)
Operating IncomeDividends:
Bank subsidiaries $1,645 $«1,775 $2,367
Nonbank subsidiaries 209 762 373
Interest income:Bank subsidiaries 655 822 534
Nonbank subsidiaries 381 513 438
Other 3 22 11
Other income:Bank subsidiaries 5 7 7
Other (2) 19 190
Total 2,896 3,920 3,920
Operating ExpenseInterest expense:
Nonbank subsidiaries 234 161 93
Other 1,308 1,556 1,132
Merger and restructuring-relatedcharges (12) 140 287
Salaries and employee benefits (1) 52 9
Professional fees and services 2 4 3
Other expense 34 255 97
Total 1,565 2,168 1,621
Income before income taxes and cumulative effect of change in accounting principle and equity in undistributed net income of subsidiaries 1,331 1,752 2,299
Applicable income tax benefit (202) (197) (198)
Income before cumulative effect of change in accounting principle and equity in undistributed net income of subsidiaries 1,533 1,949 2,497
Equity in undistributed net income (loss) of subsidiaries:
Bank subsidiaries 1,300 (1,835) 797
Nonbank subsidiaries (151) (625) 185
Income (loss) before cumulativeeffect of change ofaccounting principle 2,682 (511) 3,479
Cumulative effect of changeof accounting principle,net of taxes (44) – –
Net Income (Loss) $2,638 $÷«(511) $3,479
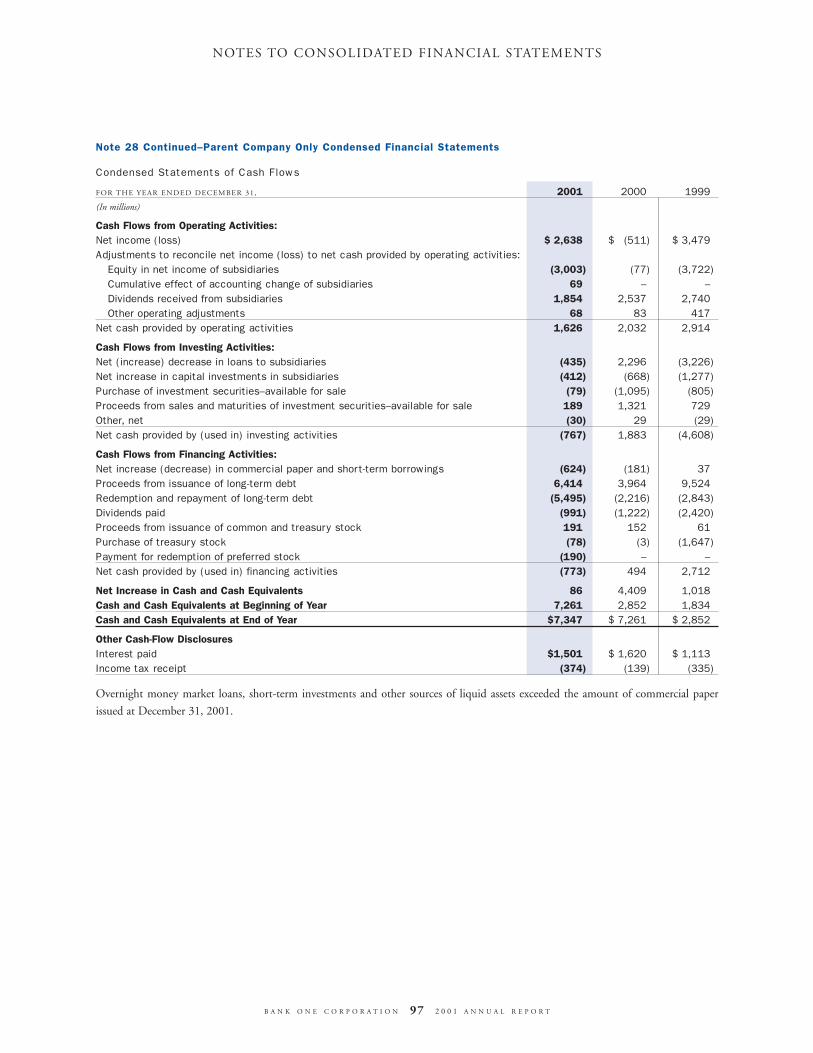
B A N K O N E C O R P O R A T I O N 97 2 0 0 1 A N N U A L R E P O R T
Note 28 Continued–Parent Company Only Condensed Financial Statements
Condensed Statements of Cash Flows
FOR THE YEAR ENDED DECEMBER 31, 2001 2000 1999
(In millions)
Cash Flows from Operating Activities:Net income (loss) $«2,638 $÷«(511) $«3,479
Adjustments to reconcile net income (loss) to net cash provided by operating activities:Equity in net income of subsidiaries (3,003) (77) (3,722)
Cumulative effect of accounting change of subsidiaries 69 – –Dividends received from subsidiaries 1,854 2,537 2,740
Other operating adjustments 68 83 417
Net cash provided by operating activities 1,626 2,032 2,914
Cash Flows from Investing Activities:Net (increase) decrease in loans to subsidiaries (435) 2,296 (3,226)
Net increase in capital investments in subsidiaries (412) (668) (1,277)
Purchase of investment securities–available for sale (79) (1,095) (805)
Proceeds from sales and maturities of investment securities–available for sale 189 1,321 729
Other, net (30) 29 (29)
Net cash provided by (used in) investing activities (767) 1,883 (4,608)
Cash Flows from Financing Activities:Net increase (decrease) in commercial paper and short-term borrowings (624) (181) 37Proceeds from issuance of long-term debt 6,414 3,964 9,524
Redemption and repayment of long-term debt (5,495) (2,216) (2,843)
Dividends paid (991) (1,222) (2,420)
Proceeds from issuance of common and treasury stock 191 152 61
Purchase of treasury stock (78) (3) (1,647)
Payment for redemption of preferred stock (190) – –Net cash provided by (used in) financing activities (773) 494 2,712
Net Increase in Cash and Cash Equivalents 86 4,409 1,018
Cash and Cash Equivalents at Beginning of Year «7,261 2,852 1,834
Cash and Cash Equivalents at End of Year $7,347 $«7,261 $«2,852
Other Cash-Flow DisclosuresInterest paid $1,501 $«1,620 $«1,113
Income tax receipt (374) (139) (335)
Overnight money market loans, short-term investments and other sources of liquid assets exceeded the amount of commercial paper
issued at December 31, 2001.
NOTES TO CONSOLIDATED FINANCIAL STATEMENTS
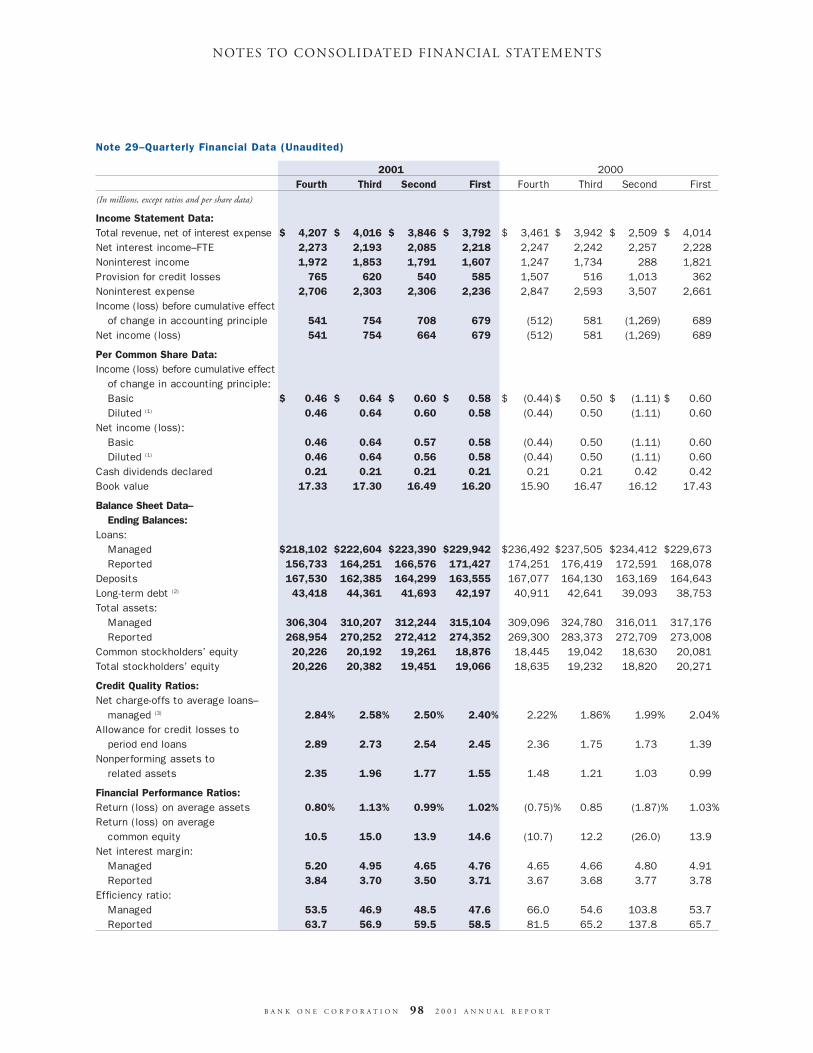
B A N K O N E C O R P O R A T I O N 98 2 0 0 1 A N N U A L R E P O R T
NOTES TO CONSOLIDATED FINANCIAL STATEMENTS
Note 29–Quarterly Financial Data (Unaudited)
2001 2000
Fourth Third Second First Fourth Third Second First(In millions, except ratios and per share data)
Income Statement Data:Total revenue, net of interest expense $÷÷4,207 $÷÷4,016 $÷÷3,846 $÷÷3,792 $÷÷3,461 $÷÷3,942 $÷÷2,509 $÷÷4,014
Net interest income–FTE 2,273 2,193 2,085 2,218 2,247 2,242 2,257 2,228
Noninterest income 1,972 1,853 1,791 1,607 1,247 1,734 288 1,821
Provision for credit losses 765 620 540 585 1,507 516 1,013 362
Noninterest expense 2,706 2,303 2,306 2,236 2,847 2,593 3,507 2,661
Income (loss) before cumulative effectof change in accounting principle 541 754 708 679 (512) 581 (1,269) 689
Net income (loss) 541 754 664 679 (512) 581 (1,269) 689
Per Common Share Data:Income (loss) before cumulative effect
of change in accounting principle:Basic $÷÷÷0.46 $÷÷÷0.64 $÷÷÷0.60 $÷÷÷0.58 $÷÷«(0.44) $÷÷÷0.50 $÷÷«(1.11) $÷÷÷0.60
Diluted (1) 0.46 0.64 0.60 0.58 (0.44) 0.50 (1.11) 0.60
Net income (loss):Basic 0.46 0.64 0.57 ÷÷÷0.58 ÷÷«(0.44) ÷÷÷0.50 ÷÷«(1.11) ÷÷÷0.60
Diluted (1) 0.46 0.64 0.56 0.58 (0.44) 0.50 (1.11) 0.60
Cash dividends declared 0.21 0.21 0.21 0.21 0.21 0.21 0.42 0.42
Book value 17.33 17.30 16.49 16.20 15.90 16.47 16.12 17.43
Balance Sheet Data–Ending Balances:
Loans:Managed $218,102 $222,604 $223,390 $229,942 $236,492 $237,505 $234,412 $229,673
Reported 156,733 164,251 166,576 171,427 174,251 176,419 172,591 168,078
Deposits 167,530 162,385 164,299 163,555 167,077 164,130 163,169 164,643
Long-term debt (2) 43,418 44,361 41,693 42,197 40,911 42,641 39,093 38,753
Total assets:Managed 306,304 310,207 312,244 315,104 309,096 324,780 316,011 317,176
Reported 268,954 270,252 272,412 274,352 269,300 283,373 272,709 273,008
Common stockholders’ equity 20,226 20,192 19,261 18,876 18,445 19,042 18,630 20,081
Total stockholders’ equity 20,226 20,382 19,451 19,066 18,635 19,232 18,820 20,271
Credit Quality Ratios:Net charge-offs to average loans–
managed (3) 2.84% 2.58% 2.50% 2.40% 2.22% 1.86% 1.99% 2.04%
Allowance for credit losses to period end loans 2.89 2.73 2.54 2.45 2.36 1.75 1.73 1.39
Nonperforming assets to related assets 2.35 1.96 1.77 1.55 1.48 1.21 1.03 0.99
Financial Performance Ratios:Return (loss) on average assets 0.80% 1.13% 0.99% 1.02% (0.75)«% 0.85 (1.87)«% 1.03%
Return (loss) on average common equity 10.5 15.0 13.9 14.6 (10.7) 12.2 (26.0) 13.9
Net interest margin:Managed 5.20 4.95 4.65 4.76 4.65 4.66 4.80 4.91
Reported 3.84 3.70 3.50 3.71 3.67 3.68 3.77 3.78
Efficiency ratio:Managed 53.5 46.9 48.5 47.6 66.0 54.6 103.8 53.7
Reported 63.7 56.9 59.5 58.5 81.5 65.2 137.8 65.7

B A N K O N E C O R P O R A T I O N 99 2 0 0 1 A N N U A L R E P O R T
Note 29–Quarterly Financial Data (Unaudited)—continued
2001 2000Fourth Third Second First Fourth Third Second First
(In millions, except ratios and per share data)
Capital Ratios:Risk-based capital:
Tier 1 8.6% 8.4% 8.2% 7.8% 7.3% 7.5% 7.2% 7.7%
Total 12.2 11.7 11.6 11.2 10.8 10.9 10.3 10.6
Tangible common equity/tangible managed assets 5.9 5.8 5.8 5.6 5.5 5.4 5.4 5.7
Common Stock Data:Average shares outstanding:
Basic 1,166 1,168 1,166 1,163 1,158 1,156 1,153 1,149
Diluted (1) 1,174 1,176 1,176 1,173 1,158 1,167 1,153 1,155
Stock price:High $39.85 $38.95 $39.60 $39.85 $÷37.69 $÷38.81 $÷36.88 $34.75
Low 28.00 28.00 33.61 33.49 31.88 28.44 26.56 24.25
Close 39.05 31.47 35.80 36.18 36.63 38.06 26.56 34.38
Employees (4) 73,519 75,801 78,491 79,157 80,778 81,291 82,443 N/AN/A–Not available.
(1) Common equivalent shares and related income were excluded from the computation of diluted loss per share for the three months ended December 31, 2000 and June 30, 2000 as the effect would be antidilutive.
(2) Includes trust preferred capital securities.
(3) Fourth quarter, third quarter, second quarter and first quarter 2001 amounts include $14 million, $14 million, $24 million and $40 million, respectively, of charge-offswhich are not classified as such in the Corporation’s GAAP financial information because they are part of a portfolio which has been accounted for as loans held at adiscount. The inclusion of these amounts in charge-offs more accurately reflects the credit performance of the portfolio. In the Corporation’s financial statements,these items result in a higher provision in excess of net charge-offs.
(4) Beginning in the first quarter of 2001, employees on long-term disability and employees of unconsolidated subsidiaries are excluded. Prior period data have not beenrestated for this change.
NOTES TO CONSOLIDATED FINANCIAL STATEMENTS

B A N K O N E C O R P O R A T I O N 100 2 0 0 1 A N N U A L R E P O R T
REPORT OF MANAGEMENT
We have audited the accompanying consolidated balance sheet ofBANK ONE CORPORATION and subsidiaries as of December 31,2001 and the related consolidated statements of income, stockholders’equity, and cash flows for the year then ended. These consolidatedfinancial statements are the responsibility of the Corporation’sManagement. Our responsibility is to express an opinion on these con-solidated financial statements based on our audit. The accompanyingconsolidated balance sheet of BANK ONE CORPORATION andsubsidiaries as of December 31, 2000 and the related consolidatedstatements of income, stockholders’ equity, and cash flows for each ofthe years in the two-year period ended December 31, 2000 wereaudited by other auditors whose report thereon dated January 17,2001, expressed an unqualified opinion on those statements.
We conducted our audit in accordance with auditing standardsgenerally accepted in the United States of America. Those standardsrequire that we plan and perform the audit to obtain reasonable assuranceabout whether the financial statements are free of material misstatement.An audit includes examining, on a test basis, evidence supporting the
amounts and disclosures in the financial statements. An audit alsoincludes assessing the accounting principles used and significant esti-mates made by Management, as well as evaluating the overall financialstatement presentation. We believe that our audit provides a reasonablebasis for our opinion.
In our opinion, the consolidated financial statements referred toabove present fairly, in all material respects, the financial position ofBANK ONE CORPORATION and subsidiaries as of December 31,2001 and the results of their operations and their cash flows for theyear then ended, in conformity with accounting principles generallyaccepted in the United States of America.
Chicago, IllinoisJanuary 15, 2002
REPORT OF INDEPENDENT PUBLIC ACCOUNTANTS
The Board of Directors and StockholdersBANK ONE CORPORATION
Management of BANK ONE CORPORATION and its subsidiaries(the “Corporation”) is responsible for the preparation, integrity andfair presentation of its published financial reports. These reportsinclude consolidated financial statements that have been prepared inaccordance with generally accepted accounting principles, usingManagement’s best judgment and all information available.
The consolidated financial statements of the Corporation havebeen audited by KPMG LLP, independent public accountants. Theiraccompanying report is based upon an audit conducted in accordancewith generally accepted auditing standards, including the relatedreview of internal accounting controls and financial reporting matters.The Audit and Risk Management Committee of the Board ofDirectors, which consists solely of outside directors, meets at leastquarterly with the independent auditors, Corporate Audit and repre-sentatives of Management to discuss, among other things, accountingand financial reporting matters.
Management of the Corporation is responsible for establishingand maintaining an effective internal control structure over financialreporting, including the safeguarding of assets against unauthorizedacquisition, use or disposition. The Corporation maintains systems ofcontrols that it believes are reasonably designed to provideManagement with timely and accurate information about the opera-tions of the Corporation. This process is supported by an internalaudit function along with the ongoing appraisal of internal controlsby the Audit and Risk Management Committee. Both theCorporation’s independent auditors and the internal audit functiondirectly provide reports on significant matters to the Audit and RiskManagement Committee. The Corporation’s independent auditors,
the internal audit function and the Audit and Risk ManagementCommittee have free access to each other. Internal controls, systemsand corporate-wide processes and procedures are continually enhanced.
The Corporation is dedicated to maintaining a culture thatreflects the highest standards of integrity and ethical conduct whenengaging in its business activities. Management of the Corporation isresponsible for compliance with various federal and state laws and reg-ulations, and the Corporation has established procedures that aredesigned to ensure that Management’s policies relating to conduct,ethics and business practices are followed on a uniform basis.
BANK ONE CORPORATION
James Dimon Chairman and Chief Executive Officer
Charles W. ScharfExecutive Vice President and Chief Financial Officer
Chicago, IllinoisJanuary 15, 2002

Common Stock and Stockholder Data: (1)(2) 2001 2000 1999 1998 1997Market price:
High for the year $39.85 $38.81 $63.13 $64.78 $54.37
Low for the year 28.00 24.25 29.98 37.58 35.57
At year-end 39.05 36.63 32.00 51.06 49.37
Book value (at year-end) 17.33 15.90 17.34 17.31 16.03
Dividend payout ratio 38% N/M 57% 58% 61%
Financial Ratios:Net income (loss) as a percentage of: (3)
Average stockholders’ equity 13.5% (2.6)«% 17.0% 15.8% 15.6%
Average common stockholders’ equity 13.4 (2.6) 17.2 15.9 16.0
Average total assets 1.0 (0.2) 1.4 1.3 1.3
Average earning assets 1.1 (0.2) 1.6 1.5 1.5
Stockholders’ equity at year-end as a percentage of:Total assets at year-end 7.5 6.9 7.5 7.9 8.0
Total loans at year-end 12.9 10.7 12.3 13.2 11.9
Total deposits at year-end 12.1 11.2 12.4 12.7 12.4
Average stockholders’ equity as a percentage of:Average total assets 7.4 7.2 8.0 8.2 8.2
Average loans 11.8 11.4 13.0 12.7 12.2
Average deposits 12.2 12.0 13.2 13.1 12.9
Income to fixed charges: (4)
Excluding interest on deposits 2.0x 0.8x 2.3x 2.3x 2.4xIncluding interest on deposits 1.4x 0.9x 1.6x 1.5x 1.5x
N/M–Not meaningful.
(1) There were 108,242 common stockholders of record as of December 31, 2001.
(2) The principal market for the Corporation’s common stock is the New York Stock Exchange. The Corporation’s common stock also is listed on the Chicago Stock Exchange.
(3) Does not include deduction for preferred dividends.
(4) Results for the year ended December 31, 2000, were insufficient to cover fixed charges. The coverage deficiency was approximately $1.2 billion.
B A N K O N E C O R P O R A T I O N 101 2 0 0 1 A N N U A L R E P O R T
SELECTED STATISTICAL INFORMATIONBANK ONE CORPORATION and Subsidiaries