BANK OF GUYANA
126
BANK OF GUYANA Annual Report and Statement of Accounts 2001
Transcript of BANK OF GUYANA

BANK OF GUYANA
Annual Report and Statement of Accounts
2001
CONTENTSPage
STATEMENT OF PURPOSE AND CORPORATE PHILOSOPHY 3
LETTER OF TRANSMITTAL 4
ORGANIZATION CHART AND BOARD OF DIRECTORS 5
INTRODUCTION 6
I. THE GUYANA ECONOMY 7
1. Summary 72. Production, Aggregate Expenditure, Employment and Inflation 93. International Trade and Balance of Payments 134. Foreign Exchange Market Developments 175. Public Finance 196. Public Debt 237. Financial Sector Developments 26
II. INTERNATIONAL ECONOMIC AND MONETARY DEVELOPMENTS 34
III. FUNCTIONS, POLICY IMPLEMENTATION AND BANK ACTIVITIES 37
1. Functions 372. Policy Implementation 373. Bank Activities 40
IV. BALANCE SHEET, PROFIT AND LOSS ACCOUNT AND REPORT OF THE EXTERNAL AUDITORS 45
STATISTICAL ANNEXE
APPENDIX I: List of Commercial Banks
APPENDIX II: List of Licensed Foreign Currency Dealers
3
BANK OF GUYANA
STATEMENT OF PURPOSE
The role of the Bank of Guyana is to act as the Central Bank for Guyana. Its primary purpose is to formulate and
implement monetary policy so as to achieve and maintain price stability. The other major purpose is to foster a sound,
progressive and an efficient financial system. In the discharge of its functions, the Bank strives to:
! promote a sustained and non-inflationary growth of the economy;
! maintain the integrity and value of the Guyana dollar; and
! secure the credibility of the financial system, including payments arrangement, through supervision and
oversight.
CORPORATE PHILOSOPHY
The Bank’s corporate philosophy in relation to its customers, staff and people of Guyana is to adopt a consultative
and a constructive approach, seek market-based solutions, generate greater awareness and understanding of issues
directly related to the Bank’s functions, maintain transparency and public accountability and provide highest quality
output possible.

4
LETTER OF TRANSMITTAL
March 30, 2002
Hon. Saisnarine Kowlessar, M.P.Minister within the Office of the President responsible for FinanceMinistry of FinanceMain StreetGEORGETOWN
Dear Minister,
As required under Section 58 of the Bank of Guyana Act 1998, No.19 of 1998, I have the honourto submit to you the Bank's Report on its operations in 2001, together with the Balance Sheet and Profitand Loss Account as certified by the external auditors appointed in accordance with Section 60 of theAct. A review of economic developments in Guyana in 2001 is incorporated in the report.
The original of the auditors' report and certificate is also attached.
Yours sincerely,
SignedD.S. Singh
Governor (Ag.)

Ms. D. S. Singh (Chairman)
Mr. P. Bhim
Mr. V. Persaud
Mr. N. Rekha (Ex Officio Member)
Mr. R. Ali Real Sector
RESEARCH (Division Chief) Balance of Payments
Dr. G. Ganga
(Director)
Mr. L. Forte Financial Sector
(Division Chief) Public Sector
Maintenance
MAINTENANCE & SECURITY
Mr. N. Denny
(Director)
Mr. B. Mangar Security
(Superintendent)
Ms. S. Gibbs Administrative Services
(Snr. Supervisor)
HUMAN RESOURCES & OTHER
ADMINISTRATIVE SERVICES Ms. I. Prescott Mr. H. Rahaman Training
(Asst. Director) (Training Officer)
Communications
INFORMATION SERVICES
Mr. L. Hercules Information Services
(Director)
Mr. F. Tucker Money Market
(Asst. Director)
OPERATIONS
Mr. L. Glen Ms. P. Forde-Rodney Currency
(Director) (Snr. Supervisor)
Mr. J. Lall Banking
(Asst. Director)
Mrs. R. Horatio Budgeting
(Snr. Supervisor)
ACCOUNTS & BUDGETING
Ms. D. Singh Mr. L. Williams Mr. L. Morrison Accounts
(Governor (Ag.)) (Banking Manager) (Chief Accountant)
International - Analysis
INTERNATIONAL
Mr. J. Padmore International - Operations
(Asst. Director)
Examination & Follow-up
BANK SUPERVISION
Mr. R. Lal
(Director)
Mrs. M. Benn Ms. I. Williams Analysis & Surveillance
(Asst. Director) (Snr. Examiner)
INTERNAL AUDIT
Mr. D. Kirton Internal Audit
(Director)
BOARD OF DIRECTORS
ORGANISATION OF THE BANKas at December 31, 2001
1

6
INTRODUCTION
The thirty-seventh Annual Report of the Bank is presented in accordance with Section 58of the Bank of Guyana Act. Developments in the domestic economy are described in PartI, which is complemented by annexed statistical tables. The international economicenvironment is overviewed in Part II. The functions, policies and activities of the Bankthat were undertaken against the economic background outlined in Parts I and II aresummarised in Part III. The Bank’s financial statements are presented in Part IV.

The Guyana Economy - Summary 7
ITHE GUYANA ECONOMY
1. SUMMARY
Real GDP growth recovered to 1.9 per cent following the decline of 1.4 per cent recorded last year. The growth
largely reflected the performances of the agriculture, forestry and mining sectors. Growth in private sector
consumption contributed to higher domestic demand which had a salutary effect on GDP. The increase in
growth resulted in proportional increases in sectoral savings. Prudent fiscal and monetary policies, as well as lower
food prices contained inflation at 2.6 per cent for all urban areas and 1.6 per cent in Georgetown during the review
period.
On the external front, the overall balance of payments weakened through a deterioration of both the current and capital
accounts. The current account weakened mainly as a result of adverse terms of trade and lower volumes traded while
the capital account was characterized by outflows of short term capital and a fall in foreign direct investment. Debt
relief under the Original and Enhanced Interim HIPC initiatives financed the overall deficit and contributed to the
increase in net foreign assets of the Bank of Guyana.
The cambio market turnover was higher by 5.3 per cent as total foreign exchange transactions increased during the
review period. The Guyana dollar vis-à-vis the US dollar depreciated by 2.6 per cent. The depreciation occurred
largely during the third and fourth quarters of the year, reflecting seasonal demand pressures. The relative stability
of the exchange rate during the first and second quarters was attributed to slow growth in imports and the monetary
authority’s efforts at dampening speculation in the foreign exchange market.
The financial performance of the public sector, on a cash basis, deteriorated in 2001 despite an improved outturn by
the non-financial public enterprises which was offset by the weakened financial operations of the central government.
The outturn of the enterprises was due to higher current receipts and restraint in spending. The central government’s
performance was due to higher non-interest current expenditures and a decline in capital revenues.
The stock of outstanding public and publicly guaranteed external debt continued to decline on account of debt relief
under the Original and Enhanced Interim HIPC initiatives. In contrast, the stock of government’s domestic bonded
debt increased due to the issue of treasury bills to sterilize excess liquidity in the banking system for the maintenance
of price and exchange rate stability. External debt service was lower due to the new payment schedule on multilateral
and bilateral debt under the HIPC initiatives. Domestic debt service payments also decreased as a result of lower
interest rates. External debt as a per cent of GDP fell to 166.1 per cent from 169.6 per cent last year while domestic
debt as a per cent of GDP increased to 39 per cent from 37 per cent at end-2000.
The thrust of monetary policy was determined primarily by domestic considerations regarding credit growth, the
exchange rate and domestic price stability. Broad money growth was lower at 8.9 per cent partly due to the cautious
commercial bank lending policy which resulted in a sharp decline in credit to the private sector. Quasi money
continued its expansion by 12.6 per cent following the 9.4 per cent growth last year. The average discount rate on
91-day treasury bills declined from 9.2 per cent to 6.25 per cent, however, the spread between the weighted average

The Guyana Economy - Summary8
lending and savings deposit rates widened. The nonbank financial institutions (NBFIs) continued to mobilize
financial resources by offering competitive rates of return and financial services.
In the year 2002, real GDP is estimated to grow by 2 per cent while inflation is targeted at 5 per cent. The priority
will be to continue with stabilization of the macroeconomic fundamentals. The Bank’s main focus will therefore be
to create the monetary conditions necessary to promote credit growth and a competitive exchange rate regime. • •

The Guyana Economy - Production, Aggregate Expenditure, Employment and Inflation 9
2. PRODUCTION, AGGREGATE EXPENDITURE, EMPLOYMENT AND
INFLATION
Real Gross Domestic Product (GDP) growth recovered to 1.9 per cent from the decline of 1.4 per cent recorded
during year 2000. This outturn resulted from higher output from the major sectors - sugar, rice, forestry and
gold - which benefitted from improved weather conditions. Inflation was subdued at 2.6 per cent in all urban
areas and 1.6 per cent in Georgetown on account of lower growth in food prices and supportive monetary and fiscal
policies.
PRODUCTION
Agriculture and Forestry
Gross output was higher for the main agricultural
products of sugar and rice on account of the improved
weather conditions. The forestry sector also recorded
higher output. Consequently, value added of the
agriculture sector including forestry rose by 3.6 per
cent in comparison with a decline of 7.2 per cent
during 2000.
Sugar
Sugar output (see Table I) amounted to 284,477
tonnes, 3.9 per cent higher than the corresponding
2000 level and 99 per cent of the year’s target. This
performance was due partly to the favorable climatic
conditions which permitted an extension of the
harvesting period for the second crop. There was also
contribution from improved field and factory
recoveries with a 9.4 per cent increase in cane yield
per hectare and a 13.8 per cent rise in sugar yield per
tonne of cane to 0.091 tonnes.
Of total production, exports of sugar amounted to
252,330 tonnes, 9.1 per cent lower than the previous
year’s level. Local sales increased to 24,436 tonnes in
comparison with 24,000 tonnes due to a recovery in
demand from the domestic beverage manufacturers.
Closing inventory stood at 21,910 tonnes, 54.3 per
cent higher than the corresponding 2000 level.
Rice
Total rice production amounted to 322,310 tonnes,
10.4 per cent above last year’s level and 3.9 per cent
above the target for the year. This performance was
partly due to a 7.5 per cent increase in acreage
cultivated and improved weather conditions during
harvesting. In addition, there was an improvement in
paddy yield per hectare from 3.88 tonnes to 3.98
tonnes.
Export sales amounted to 209,041 tonnes which
represent 64.9 per cent of total output while domestic
sales accounted for approximately 15 per cent or
47,940 tonnes.
Table I
Selected Production Indicators
Agriculture & Forestry
Commodity 1999 2000 2001
Sugar (tonnes) 321,438 273,703 284,477
Rice (tonnes) 365,469 291,841 322,310
Poultry (tonnes) 12,433 11,769 12,486
Eggs (‘000) 25,728 30,119 25,692
Forestry (cu. metre) 498,400 418,948 438,410
Livestock and Fishing
Livestock output grew marginally due to higher
poultry output. Poultry output increased by 6.1 per
cent to 12,486 tonnes while output of eggs declined by
14.7 per cent or 4,427 thousand units to 25,692
thousand units.
Value added of the fishing sub-sector increased by 0.6
per cent mainly on account of the performances of
shrimp and prawns output. Prawns and small shrimps
catch rose by 17.8 and 89.9 per cent to reach 2,051
tonnes and 26,944 tonnes respectively. In contrast,
fish output fell by 43.7 per cent to 27,135 tonnes.

The Guyana Economy - Production, Aggregate Expenditure, Employment and Inflation10
-20.0
-10.0
0.0
10.0
20.0
Per
cent
1999 2000 2001
Sectoral Growth of GDP at 1988 Prices
Agri. Mining Mfg. Construction
Figure 1
Forestry
Forestry output increased by 4.7 per cent to reach
438,409.7 cubic metres, reflecting increases in both
logs and other forestry products output. Greenheart
logs production amounted to 101,448.2 cubic metres,
an increase of 23.1 per cent compared with the decline
of 13.6 per cent in 2000. Other log species fell by 0.8
per cent to 200,774.9 cubic metres. Output by
BARAMA contributed significantly to the favorable
performance of the sector with a 3.3 per cent increase
in output compared with a 20.6 per cent decline for the
same period last year.
Mining
The mining sector registered a 1 per cent rise in value
added compared with the 5.9 per cent recorded one
year earlier. Lower bauxite production mainly
explained the reduction in value added of this sector.
Gold and diamond production were higher during the
review period.
Bauxite
Gross output of the bauxite industry (see Table II) was
2,011,901 tonnes, 25.2 per cent below the previous
year and 74.6 per cent of the annual target. There was
lower production from the major types, except for
Chemical Grade (CGB). Production of Metallurgical
Grade bauxite (MAZ), Refractory Grade (RASC) and
tailings decreased by 31.2 per cent, 13.5 per cent and
53 per cent respectively. In contrast, CGB increased
by 115.5 per cent to 220,364 tonnes. The depressed
performance of MAZ reflected the reduced output
from AROAIMA during the third quarter pending its
closure, while lower RASC output was due to lower
power availability at LINMINE. The higher CGB
output was due partly to a temporary recovery in
demand. During the year, exports accounted for 92
per cent of output.
Table II
Selected Production Indicators
Mining
1999 2000 2001
Bauxite (Tonnes) 2,359,272 2,689,451 2,011,901
RASC 107,776 105,716 91,428
AAC - - -
CGB 86,405 102,247 220,364
MAZ 2,128,876 2,443,404 1,682,221
ACGB - - -
OTHER 1 36,215 38,084 17,888
Gold (oz) 414,905 434,890 455,918
Diamond (m. carats) 46,668 83,912 184,3091 Includes Road Grade Bauxite and Tailings
Gold and Diamond
Gold and diamond production increased during the
review period. Gold declaration rose by 4.8 per cent
to reach 455,918 ounces. This was attributed to a 7.4
per cent increase in production by OMAI which
reached 354,069 ounces, reflecting the discovery of
better quality ore and improved mine productivity.
The declaration by local producers, however,
decreased by 3.3 per cent to 101,849 ounces compared
with a 4.9 per cent decline for the same period last
year. This outturn was explained by the weak
international price and volatile fuel costs.
Diamond production amounted to 184,309 metric
carats, 119.7 per cent above last year’s level. The
higher output continued to reflect the impact of newer
technology introduced during year 2000 as well as an
increase in the number of mining concessions.

The Guyana Economy - Production, Aggregate Expenditure, Employment and Inflation 11
Manufacturing
Real output growth in the manufacturing sector
remained unchanged compared with an 11.7 per cent
slide in 2000. Increases were recorded in the garment,
electricity and alcoholic beverages industries which
offset the decline in the paints, non-alcoholic
beverages and pharmaceutical industries.
Table III
Selected Production Indicators
Manufacturing
1999 2000 2001
Consumer Durables
Alcoholic Beverages (‘000 litres) 26,708 16,214 23,606
Malta (‘000 litres) 1,625 1,524 1,252
Non-Alcoholic Beverages (‘000
cases)3,973 3,625 3,609
Liquid Pharmaceutical (‘000
litres)198 350 258
Consumer Semi-Durables
Garments (‘000 dozens) 246 186 270
Intermediate
Electricity (MWH) 443 477 505
Paints (‘000 litres) 1,846 1,856 1,818
Engineering and Construction
Real value added in the engineering and construction
sector rose by 2 per cent following the 6.6 per cent
recorded during the year 2000. The performance
reflected, in part, subdued government capital
spending and private construction during the review
period.
Services
The services sectors expanded moderately, recording
an overall growth of 0.9 per cent compared with an
expansion of 5.1 per cent in 2000. This outturn
reflected containment of factor payments to the public
service and the stability of growth in the information
services industry. Government services remained flat
while distribution services registered a marginal
growth of 0.5 per cent in response to restrained factor
payments and distribution margins respectively.
Transport & communication, other services and rental
of dwellings recorded increases of 5.4 per cent, 3 per
cent and 2.2 per cent respectively.
AGGREGATE EXPENDITURE
Overall Expenditure
Aggregate expenditure grew by 3.5 per cent compared
with a 14.4 per cent growth recorded in 2000. This
outturn reflected the increase in consumption
expenditure due to higher cost of imports, including
fuel. Its share of total expenditure increased
moderately from 66.8 per cent to 67 per cent.
Conversely, investment expenditure decreased from
33.2 per cent to 32.9 per cent over the same period.
Higher domestic expenditure coupled with the
recovery in value added resulted in a wider resource
gap, (i.e., the difference between aggregate
expenditure and domestic production valued at current
market prices) (see Table IV).
Table IV
Aggregate Expenditure
G$ Billion
1999 2000 2001
GDP 123.7 130.0 133.4
Expenditure 131.7 150.7 155.9
Investment 47.6 50.1 51.4
Private 31.4 30.4 33.2
Public 16.2 19.7 18.2
Consumption 84.1 100.6 104.5
Private 54.1 64.8 74.0
Public 29.9 35.8 30.5
Resource Gap -8.0 -20.6 -28.3
Consumption Expenditure
Total consumption expenditure grew by 4 per cent to
G$104.5 billion or 78.4 per cent of GDP, reflecting a
23.4 per cent increase in private consumption
expenditure. Private consumption amounted to G$74
billion and accounted for 47.5 per cent of aggregate
expenditure, 4.5 percentage points higher when
compared with year 2000. In contrast, public sector
consumption decreased by 14.8 per cent due to the
reduction of temporary employment associated with
the national elections.

The Guyana Economy - Production, Aggregate Expenditure, Employment and Inflation12
Investment Expenditure
Investment expenditure rose by 2.6 per cent to G$51.4
billion, reflecting a 9.2 per cent increase in private
sector investment. In contrast, public sector
investment fell by 7.6 per cent to G$18.2 billion,
representing 35.4 per cent in capital formation.
EMPLOYMENT AND INFLATION
Employment
Labor market relations were relatively stable during
the year. The public sector recorded 13.4 per cent
fewer strikes while there were 232 work stoppages.
Employment growth remained subdued during the
review period. Available data for the public sector
showed a 2.9 per cent decline in employment
compared with an 8.1 per cent drop in 2000. Central
government continued to account for the larger share
of the reduction.
Table V
Work Stoppages
1999 2000 2001
Number of Work stoppages 244 268 232
Duration of Strikes (days) ... 392 ...
Man-days lost 287,405 56,176 ...
Value of wages lost ($Mn) 115 79 ...
Source: Ministry of Health and Labor
Earnings
Government increased the minimum wage during the
fourth quarter by 5.5 per cent to G$20,045 per month.
Other sectors also received salary increases during this
period. Workers in the sugar industry received
bonuses based on performance during the year. The
rice, timber and gold industries obtained lower
incomes as profits due to a decline in international
prices. Pensioners in the public sector and the
National Insurance Scheme also benefitted from some
increases.
The rise in personal incomes was also reflected in the
increase in financial assets held by the private sector.
Deposits by the household component of the private
sector increased by 10.5 per cent during the year.
Inflation
The urban consumer price index (CPI) for Georgetown
was contained at 1.6 per cent compared with 5.8 per
cent for the same period last year. Lower inflation
reflected slower growth in the subgroup prices for
food, housing, education & entertainment cost and
furniture. Higher growth was recorded in footwear
and repairs. The subdued outturn resulted from the
sluggish growth in domestic demand during the first
six months of the year which was supported by
prudent monetary and fiscal policies.
The monthly average rate of inflation fell sharply from
0.5 per cent to 0.2 per cent during 2001. This monthly
average was exceeded during April, August, and
November while January, February, March, May,
June, July, September, October and December
recorded monthly changes below the benchmark. The
observed fluctuations reflected mainly market
conditions for vegetable and vegetable products.
Table VI
Consumer Price Indices
January 1994 = 100
1999 2000 2001
All Items 154.0 163.0 165.6
Food 157.0 163.7 167.8
Clothing 73.8 72.7 73.2
Footwear 68.1 62.0 62.6
Housing 158.7 179.4 182.2
Furniture 127.1 128.4 128.6
Transport & Communication 190.0 188.5 186.8
Medical & Personal Care 188.8 187.5 186.4
• •

The Guyana Economy - International Trade and Balance of Payments 13
0
5
10
15
20
25
30
Per
cent
1999 2000 2001
Shares in Total Exports
Sugar Rice Bauxite Gold Timber Other
Figure 2
3. INTERNATIONAL TRADE AND BALANCE OF PAYMENTS
The overall balance of payments moved from a surplus of US$42.5 million to a deficit of US$8.4 million during
the review period. This was largely attributed to a decline in the merchandise exports on the current account
and lower foreign direct investment and short term capital outflow on the capital account. Exceptional
financing in the form of debt relief filled the overall deficit gap and contributed to an increase in the net foreign assets
of the Bank of Guyana.
Current Account
The current account recorded a deficit of US$128.6
million compared with a deficit of US$109.2 million
for the same period last year. This was mainly due to
a deterioration in the merchandise trade account which
could not be offset by the improvement on the services
sector.
Merchandise Trade
The merchandise trade deficit widened to US$93.6
million from US$80.2 million at end-2000. This was
attributed to a US$14.9 million decline in export
earnings. Imports declined marginally by US$1.5
million.
Table VII
Balance of Payments
US$ Million
1999 2000 2001
Current Account -75.2 -109.2 -128.6
Merchandise Trade -25.2 -80.2 -93.6
Service (net) -89.0 -76.0 -79.0
Transfers 39.0 47.0 44.0
Capital Account 69.6 137.8 115.3
Capital Transfers 15.5 16.3 30.8
Non-Fin. Public Sector 23.9 42.4 39.4
Private Capital 46.0 67.1 56.0
Other - 10.0 -
Short-term Capital -25.8 2.0 -10.9
Errors & Omissions 1.2 13.9 4.9
Overall Balance -4.4 42.5 -8.4
Exports
Total exports amounted to US$490.3 million, 3 per
cent lower than the value recorded for the
corresponding period in 2000. Except for gold and the
“other exports” category, all the major export
industries of sugar, rice, bauxite and timber recorded
decreased earnings due partly to lower volume and/or
export price.
Sugar
Sugar export earnings amounted to US$109.2 million,
8.1 per cent lower than the value for the same period
in 2000. Export volume declined from 277,446 tonnes
to 252,330 tonnes while the average export price
increased by 1.1 per cent to US$432.8 per tonne. The
latter was on account of higher prices in the
CARICOM market.
Sugar exported under the Sugar Protocol of the Lomé
Convention to the EEC was 12.8 per cent of total sugar
exports compared with 11.8 per cent in 2000. Exports
to CARICOM, the USA and under the Special
Preferential Agreement (SPA) amounted to 17.8 per
cent, 4.8 per cent and 64.6 per cent respectively. For
the same period last year, exports to CARICOM, the
USA and the SPA were 15.7 per cent, 9 per cent and
63.5 per cent respectively.

The Guyana Economy - International Trade and Balance of Payments14
Rice
The value of rice exports amounted to US$50.2
million, 3.1 per cent lower than the previous year’s
total, reflecting lower prices as export volume
increased. Rice export volume increased to 209,041
tonnes from 207,638 tonnes while the average export
price decreased to US$240 per tonne from US$249.5
per tonne as prices in major markets trended
downwards. Exports to CARICOM and the European
markets amounted to 36.4 per cent and 51.2 per cent
respectively. For the previous year, export to these
markets amounted to 37 per cent and 51 per cent
respectively.
Table VIII
Exports of Major Commodities
Product Unit 1999 2000 2001
Sugar Tonnes 275,267 277,446 252,330
US$Mn. 136.2 118.8 109.2
Rice Tonnes 251,509 207,638 209,041
US$Mn. 71.1 51.8 50.2
Bauxite Tonnes 2,389,003 2,532,924 1,836,388
US$Mn. 77.2 76.3 61.0
Gold Ounces 391,691 428,009 449,345
US$Mn. 108.7 123.3 127.0
Timber Cu. m 169,407 182,209 187,197
US$Mn. 37.3 35.2 33.0
Bauxite
Bauxite exports amounted to US$61 million compared
with US$76.3 million for the same period during 2000,
reflecting mainly a decline in export volume. Export
volumes decreased to 1,836,388.2 tonnes compared
with 2,532,923.5 tonnes while average export price
increased by 10.3 per cent to US$33.2 per tonne. The
main types of bauxite exported were dried and metal
grades which amounted to 313,629 tonnes and
1,466,896 tonnes respectively compared with 496,125
tonnes and 2,000,798 tonnes respectively for the same
period in 2000.
Gold
Gold export earnings amounted to US$127 million, 3
per cent higher than the value recorded for the same
period in 2000, reflecting mainly increased volume.
Export volume increased by 5 per cent to 449,345
ounces while the average export price per ounce
declined to US$282.6 per ounce from US$288.1 per
ounce in 2000 as excess supply continued to depress
world market prices. OMAI Gold Mines Limited’s
(OGML) share of total gold export increased to 79.9
per cent compared with 74.7 per cent for the same
period last year.
Timber
Timber exports were lower at US$33 million
compared with US$35.2 million for the year 2000.
Plywood exports from BARAMA Company Limited
amounted to US$16.9 million, representing a 32 per
cent decrease while other timber export earnings were
higher at US$16.1 million compared with US$10.4
million in 2000.
Table IX
Other Exports
US$ Million
Commodities 1999 2000 2001
Fish & Shrimp 29.2 47.1 49.3
Fruits & Vegetables 1.2 0.5 0.7
Pharmaceuticals 1.4 2.1 2.1
Garments & Clothing 15.3 14.3 15.5
Wood Products 0.8 3.6 3.7
Prepared Foods 5.8 5.7 5.3
Rum & Other Spirits 7.5 7.2 7.9
Diamonds 2.5 4.7 13.3
Molasses 2.3 1.4 1.6
Nabbi Furniture ... 3.4 0.3
Re-exports 20.3 2.5 3.2
Others* 8.3 7.3 7.0
Total 94.6 99.8 109.9
* This category includes exports of wild life, personal effects,
cookers, handicrafts and copra.
Other Exports
The value of all “other exports” including re-exports
was US$109.9 million compared with US$99.8
million for the same period last year. This outturn
resulted mainly from significant increases in the export

The Guyana Economy - International Trade and Balance of Payments 15
-100
0
100
200
300
400
500
600
US
$ M
illio
n
1999 2000 2001
Trade Balance
Exports Imports Balance
Figure 3
earnings for fish and shrimp, diamonds, as well as
garments and clothing as shown in Table IX.
Table X
Imports
US$ Million
Items 1999 2000 2001
Consumption Goods
Food - Final Consumption 64.3 55.2 58.8
Beverage & Tobacco 9.2 9.9 13.7
Other Non-durables 27.8 34.1 31.0
Clothing & Footwear 13.8 14.9 13.1
Other Semi-durables 8.8 12.8 8.0
Motor Cars 16.0 11.5 12.3
Other Durables 35.0 26.0 28.3
Sub-Total 174.9 164.4 165.1
Intermediate Goods
Fuel & Lubricants 88.5 121.0 131.5
Food - Intermediate use 14.8 18.3 17.1
Chemicals 29.2 28.7 31.2
Textiles & Clothing 6.4 7.9 9.3
Parts & Accessories 30.5 44.1 44.0
Other Intermediate Goods 70.1 69.2 67.7
Sub-Total 239.4 289.2 300.6
Capital Goods
Agriculture Machinery 28.4 28.9 24.3
Industrial Machinery 11.0 8.9 9.2
Transport Machinery 22.9 23.6 14.4
Mining Machinery 10.4 5.4 2.1
Building Materials 28.8 31.1 30.7
Other Goods 34.0 33.7 34.5
Sub-Total 135.5 131.6 115.3
Miscellaneous 0.3 0.2 2.9
Total Imports 550.1 585.4 583.9
Imports
Merchandise imports amounted to US$583.9 million,
0.3 per cent lower than last year’s total. This outturn
was mainly due to lower capital goods imported as
shown in Table X. Consumption goods imports
increased marginally to US$165.1 million from
US$164.4 million in 2000 due to higher imports in the
subcategories of beverages and tobacco, food for final
consumption, motor cars and other durables. The
intermediate goods category registered an increase of
3.9 per cent to US$300.6 million. This resulted from
higher imports of fuel and lubricants, textiles and
fabrics, as well as chemicals. Capital goods imports
decreased by 12.4 per cent to US$115.3 million,
reflecting a decline in all types of capital goods
imports except for industrial machinery and the other
goods sub-category.
Services and Unrequited Transfers
Guyana was a net importer of services to the value of
US$79 million compared with US$76 million for the
same period in 2000. Net factor payments increased to
US$58.6 million from US$52.1 million in 2000,
reflecting higher outflows of income on equity. Public
and private sector interest payments on debt amounted
to US$42.9 million and US$13.6 million respectively
compared with US$42.8 million and US$17 million
respectively while employees’ compensation increased
to US$5.2 million from US$4 million for the same
period in 2000. Net non-factor service payments
decreased to US$20.4 million from US$23.9 million
on account of higher royalties and licensing fees.
Net current transfers amounted to US$44 million, 6.4
per cent lower than the year 2000 level. Remittances
to bank accounts, “other unrequited transfers” and
workers’ remittances represented the main forms of net
current inflows. These amounted to US$32.3 million,
The Guyana Economy - International Trade and Balance of Payments16
US$37.1 million and US$22.3 million respectively
compared with US$26 million, US$43.1 million and
US$27.3 million respectively for the same period in
2000.
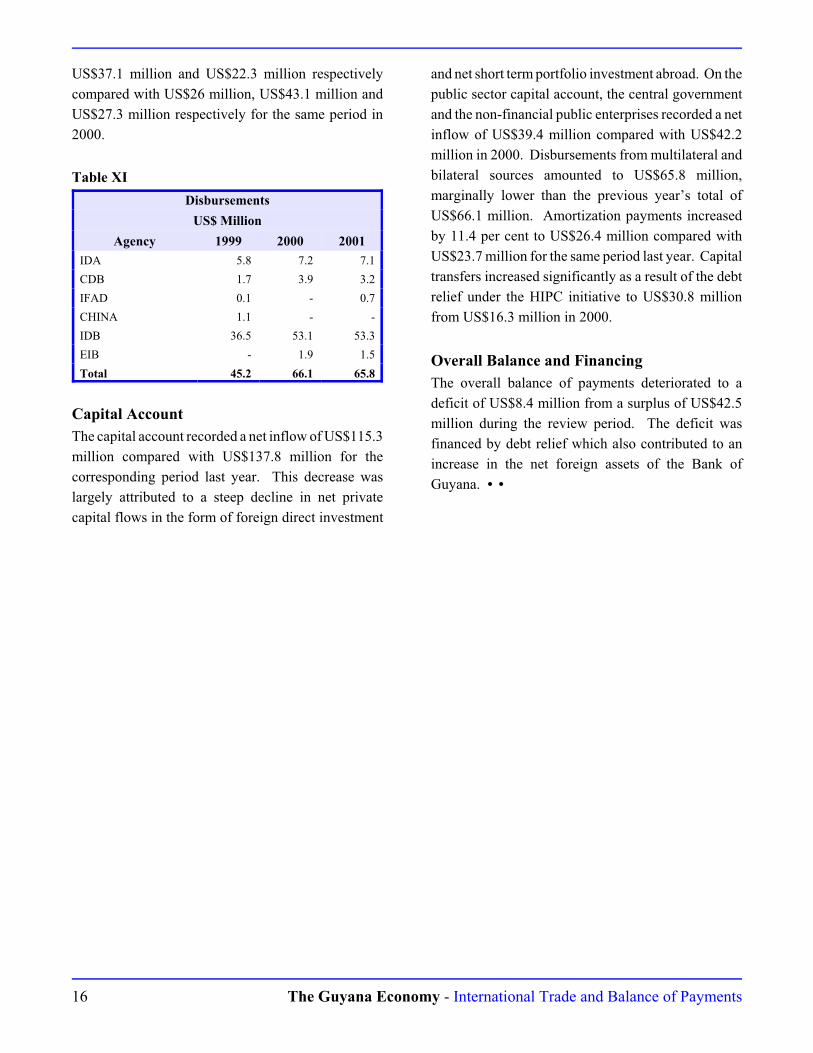
Table XI
Disbursements
US$ Million
Agency 1999 2000 2001
IDA 5.8 7.2 7.1
CDB 1.7 3.9 3.2
IFAD 0.1 - 0.7
CHINA 1.1 - -
IDB 36.5 53.1 53.3
EIB - 1.9 1.5
Total 45.2 66.1 65.8
Capital Account
The capital account recorded a net inflow of US$115.3
million compared with US$137.8 million for the
corresponding period last year. This decrease was
largely attributed to a steep decline in net private
capital flows in the form of foreign direct investment
and net short term portfolio investment abroad. On the
public sector capital account, the central government
and the non-financial public enterprises recorded a net
inflow of US$39.4 million compared with US$42.2
million in 2000. Disbursements from multilateral and
bilateral sources amounted to US$65.8 million,
marginally lower than the previous year’s total of
US$66.1 million. Amortization payments increased
by 11.4 per cent to US$26.4 million compared with
US$23.7 million for the same period last year. Capital
transfers increased significantly as a result of the debt
relief under the HIPC initiative to US$30.8 million
from US$16.3 million in 2000.
Overall Balance and Financing
The overall balance of payments deteriorated to a
deficit of US$8.4 million from a surplus of US$42.5
million during the review period. The deficit was
financed by debt relief which also contributed to an
increase in the net foreign assets of the Bank of
Guyana. • •
The Guyana Economy - Foreign Exchange Market Developments 17
US$ Exchange Rates
Dealers' Weighted Mid-rates
180.00
182.00
184.00
186.00
188.00
190.00
192.00
J F M A M J J A S O N D
2001
G$ p
er
US
$
Banks N-Banks Total
Figure 4
US$ Exchange Rate Spread
Sales - Purchases
0.00
1.00
2.00
3.00
4.00
5.00
J F M A M J J A S O N D
2001
G$
Banks N-Banks
Figure 5
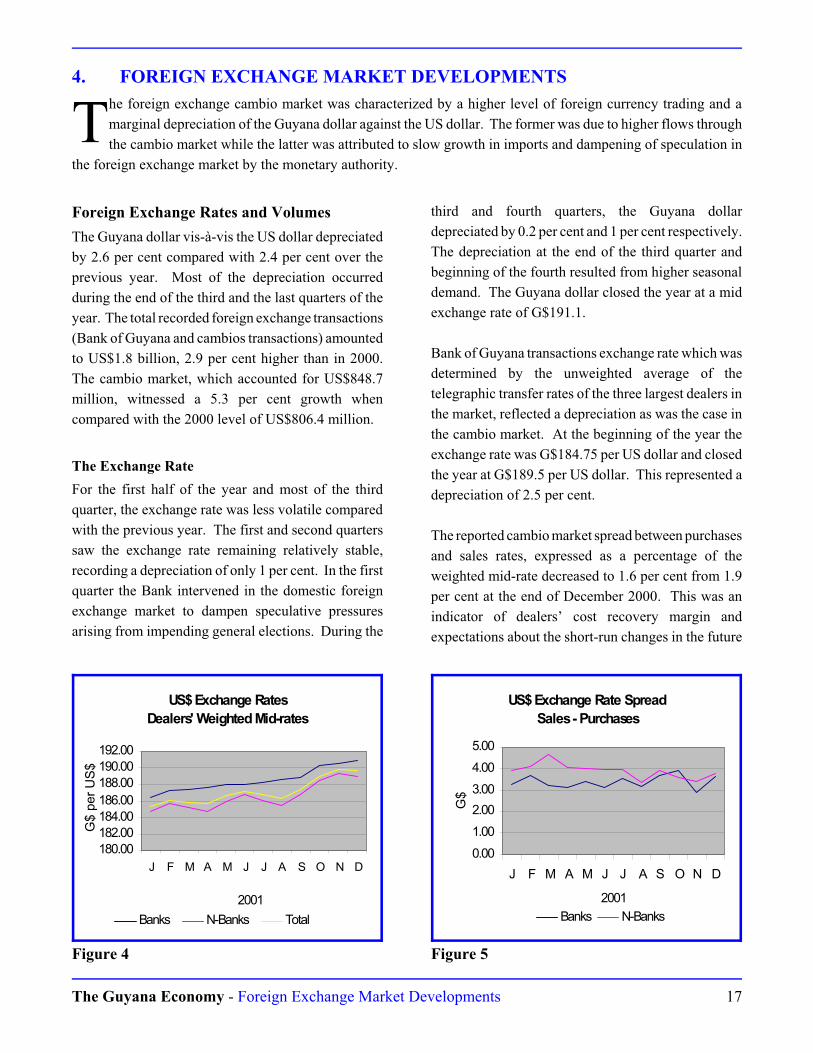
4. FOREIGN EXCHANGE MARKET DEVELOPMENTS
The foreign exchange cambio market was characterized by a higher level of foreign currency trading and a
marginal depreciation of the Guyana dollar against the US dollar. The former was due to higher flows through
the cambio market while the latter was attributed to slow growth in imports and dampening of speculation in
the foreign exchange market by the monetary authority.
Foreign Exchange Rates and Volumes
The Guyana dollar vis-à-vis the US dollar depreciated
by 2.6 per cent compared with 2.4 per cent over the
previous year. Most of the depreciation occurred
during the end of the third and the last quarters of the
year. The total recorded foreign exchange transactions
(Bank of Guyana and cambios transactions) amounted
to US$1.8 billion, 2.9 per cent higher than in 2000.
The cambio market, which accounted for US$848.7
million, witnessed a 5.3 per cent growth when
compared with the 2000 level of US$806.4 million.
The Exchange Rate
For the first half of the year and most of the third
quarter, the exchange rate was less volatile compared
with the previous year. The first and second quarters
saw the exchange rate remaining relatively stable,
recording a depreciation of only 1 per cent. In the first
quarter the Bank intervened in the domestic foreign
exchange market to dampen speculative pressures
arising from impending general elections. During the
third and fourth quarters, the Guyana dollar
depreciated by 0.2 per cent and 1 per cent respectively.
The depreciation at the end of the third quarter and
beginning of the fourth resulted from higher seasonal
demand. The Guyana dollar closed the year at a mid
exchange rate of G$191.1.
Bank of Guyana transactions exchange rate which was
determined by the unweighted average of the
telegraphic transfer rates of the three largest dealers in
the market, reflected a depreciation as was the case in
the cambio market. At the beginning of the year the
exchange rate was G$184.75 per US dollar and closed
the year at G$189.5 per US dollar. This represented a
depreciation of 2.5 per cent.
The reported cambio market spread between purchases
and sales rates, expressed as a percentage of the
weighted mid-rate decreased to 1.6 per cent from 1.9
per cent at the end of December 2000. This was an
indicator of dealers’ cost recovery margin and
expectations about the short-run changes in the future

The Guyana Economy - Foreign Exchange Market Developments18
exchange rate. During the year, the spread hovered
around 1.7 per cent.
The average spread between the purchases and sales
exchange rates of bank cambios remained relatively
stable throughout the year at the level of G$3.3 as
compared with the previous year. The spread between
purchases and sales for the licensed nonbank cambios
was higher at G$2.3 compared with G$1 for 2000.
The difference in spread between the bank and
nonbank cambios was a reflection of the degree of
competition in the foreign exchange market.
Overall Market Volumes
The volume of all foreign currency transactions totaled
US$1.8 billion, 2.9 per cent higher than the level in
2000. The total cambio transactions grew by 5.3 per
cent to reach US$848.7 million or 47.2 per cent of the
total foreign currency transactions compared with 46.1
per cent in the previous year. Transactions conducted
by the Bank of Guyana accounted for US$285.7
million or 15.9 per cent of the total foreign currency
transactions compared with 20.1 per cent in 2000.
Commercial banks’ transactions continued to dominate
the cambio market, accounting for 96.3 per cent as
compared with 98.2 per cent in 2000. Aggregate
purchases of US$425 million were higher by 0.1 per
cent when compared with aggregate sales of US$424.1
million. Consequently, net purchases were US$0.9
million compared with US$0.5 million in the previous
year.
The US dollar continued to dominate the cambio
market transactions, accounting for 94.2 per cent of
the turnover, increasing slightly from the 93 per cent
last year. The Pound Sterling accounted for 3.5 per
cent of the turnover, declining from 4.4 per cent for
the same period last year. The Canadian dollar share
declined marginally to 2.3 per cent from the 2.5 per
cent for the same period last year. CARICOM
currencies’ share was lower at 1 per cent compared
with 2.3 per cent in 2000.
The total number of approved foreign currency
accounts (including exporters’ retention accounts) was
six hundred and forty-seven (647), 5 per cent higher
than for the corresponding period in the previous year.
Thirty-one (31) new accounts were opened during the
review period. These accounts were associated with
forestry, services, consultancy and sports. The value
of debits and credits through these accounts were
US$322.8 million and US$326.4 million respectively,
11.2 per cent and 14.5 per cent higher than in the
previous year. The balances outstanding on these
accounts totaled US$20.6 million at end-2001.
CARICOM Currencies
The value of CARICOM currencies traded on the
cambio market, equivalent to US$14.9 million was
much lower when compared with US$16.1 million in
2000. Transactions in CARICOM currencies
continued to be dominated by the Barbados and
Eastern Caribbean currencies that together accounted
for 98.5 per cent of the total transactions.
The exchange rates for the fixed regime countries of
Barbados, Belize and the Eastern Caribbean remained
unchanged during the year. The floating exchange
regime countries of Jamaica and Trinidad & Tobago
maintained relatively stable exchange rates while
Suriname experienced a significant depreciation of its
Guilder. • •

The Guyana Economy - Public Finance 19
0
10
20
30
40
50
G$ B
illio
n
1999 2000 2001
Current Account
Revenue Expenditure Def/sur.
Figure 6
5. PUBLIC FINANCE
The overall operation of the non-financial public sector, computed on a cash basis, weakened in 2001 on account
of a wider central government deficit. This was due to higher non-interest current expenditure and slow growth
in revenues. The non-financial public enterprises (NFPEs), however, recorded a larger surplus on account of
higher current receipts from the major corporations.
CENTRAL GOVERNMENT
Central government recorded a larger overall deficit of
G$12,858.6 million compared with G$9,643.3 million
during the corresponding period in 2000. This
performance resulted mainly from higher non-interest
current expenditure and a decline in capital receipts.
Current Account
The current account balance turnaround from a surplus
of G$688.3 million in 2000 to a deficit of G$2,064.5
million in 2001, reflected a 43.9 per cent decline in the
current primary balance from G$10,780.8 million in
2000 to G$6,052.3 million in 2001. This was largely
due to a 15.8 per cent increase in non-interest
expenditure in 2001.
Revenue
Total current revenue (excluding the reimbursable rice
levy) amounted to G$41,427 million, 0.2 per cent
above last year’s level and 5.9 per cent below the
budgeted amount for the year. This outturn reflected
a larger intake by the Inland Revenue Department
which was offset by lower collections from the
Customs and Trade Administration.
The Internal Revenue Department’s collection
amounted to G$19,668.3 million, 3.8 per cent higher
than the previous year and 0.4 per cent above the
budgeted amount for the year. Corporation and
personal income taxes continued to be the main
contributors to this source of revenue. Together, they
generated 81.3 per cent of the Internal Revenue
Department’s collection which was similar to the 81.4
per cent in the previous year.
Table XII
Central Government Finances
G$ Million
1999 2000 2001
CURRENT ACCOUNT
Revenue 36,839.9 41,334.6 41,427.0
Expenditure (non-interest) 24,441.7 30,553.8 35,374.8
Current Primary balance 12,397.6 10,780.8 6,052.3
Interest 7,397.8 10,092.5 8,116.8
Current Balance 4,999.8 688.3 -2,064.5
CAPITAL ACCOUNT
Receipts 4,914.7 6,801.2 5,716.4
Expenditure 12,345.2 17,132.8 16,510.4
OVERALL BALANCE -2,430.7 -9,643.3 -12,858.6
FINANCING 2,430.7 9,643.3 12,858.6
External Borrowing (net) 4,262.0 7,803.6 7,882.8
Domestic Borrowing (net) -7,701.2 1,287.4 8,054.1
Non-Project BOP Grants -581.7 -296.4 -
Other Financing 6,451.6 848.7 -3,078.3
Revenue from the Customs and Trade Administration
declined by 5.3 per cent to G$18,101.4 million and
accounted for 90.8 per cent of the budgeted amount for
the year. The outturn reflected, in part, the reduction
The Guyana Economy - Public Finance20
-15
-10
-5
0
5
10
15
G$ B
illio
n
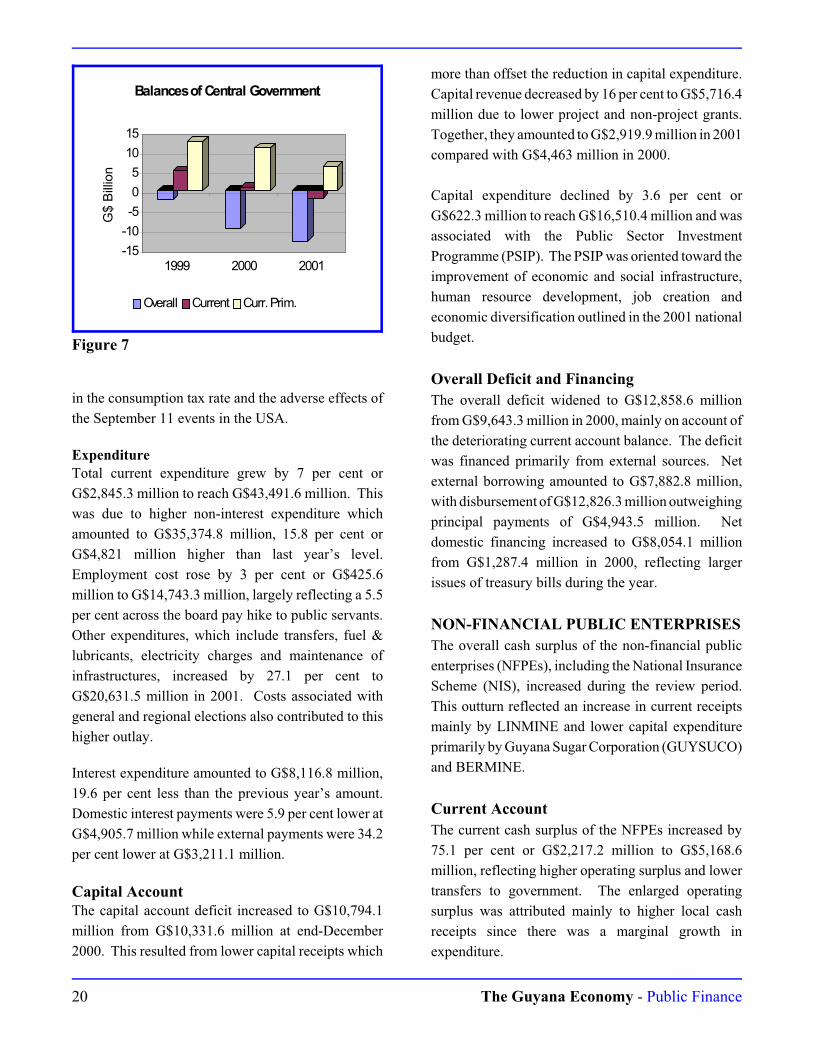
1999 2000 2001
Balances of Central Government
Overall Current Curr. Prim.
Figure 7
in the consumption tax rate and the adverse effects of
the September 11 events in the USA.
Expenditure
Total current expenditure grew by 7 per cent or
G$2,845.3 million to reach G$43,491.6 million. This
was due to higher non-interest expenditure which
amounted to G$35,374.8 million, 15.8 per cent or
G$4,821 million higher than last year’s level.
Employment cost rose by 3 per cent or G$425.6
million to G$14,743.3 million, largely reflecting a 5.5
per cent across the board pay hike to public servants.
Other expenditures, which include transfers, fuel &
lubricants, electricity charges and maintenance of
infrastructures, increased by 27.1 per cent to
G$20,631.5 million in 2001. Costs associated with
general and regional elections also contributed to this
higher outlay.
Interest expenditure amounted to G$8,116.8 million,
19.6 per cent less than the previous year’s amount.
Domestic interest payments were 5.9 per cent lower at
G$4,905.7 million while external payments were 34.2
per cent lower at G$3,211.1 million.
Capital Account
The capital account deficit increased to G$10,794.1
million from G$10,331.6 million at end-December
2000. This resulted from lower capital receipts which
more than offset the reduction in capital expenditure.
Capital revenue decreased by 16 per cent to G$5,716.4
million due to lower project and non-project grants.
Together, they amounted to G$2,919.9 million in 2001
compared with G$4,463 million in 2000.
Capital expenditure declined by 3.6 per cent or
G$622.3 million to reach G$16,510.4 million and was
associated with the Public Sector Investment
Programme (PSIP). The PSIP was oriented toward the
improvement of economic and social infrastructure,
human resource development, job creation and
economic diversification outlined in the 2001 national
budget.
Overall Deficit and Financing
The overall deficit widened to G$12,858.6 million
from G$9,643.3 million in 2000, mainly on account of
the deteriorating current account balance. The deficit
was financed primarily from external sources. Net
external borrowing amounted to G$7,882.8 million,
with disbursement of G$12,826.3 million outweighing
principal payments of G$4,943.5 million. Net
domestic financing increased to G$8,054.1 million
from G$1,287.4 million in 2000, reflecting larger
issues of treasury bills during the year.
NON-FINANCIAL PUBLIC ENTERPRISES
The overall cash surplus of the non-financial public
enterprises (NFPEs), including the National Insurance
Scheme (NIS), increased during the review period.
This outturn reflected an increase in current receipts
mainly by LINMINE and lower capital expenditure
primarily by Guyana Sugar Corporation (GUYSUCO)
and BERMINE.
Current Account
The current cash surplus of the NFPEs increased by
75.1 per cent or G$2,217.2 million to G$5,168.6
million, reflecting higher operating surplus and lower
transfers to government. The enlarged operating
surplus was attributed mainly to higher local cash
receipts since there was a marginal growth in
expenditure.

The Guyana Economy - Public Finance 21
0
10
20
30
40
50
G$ B
illio
n
1999 2000 2001
Finances of Public Enterprises
Current Revenue & Expenditure
Cur. Rev. Cur. Exp. Opr. Bal.
Figure 8
Table XIII
Summary of Public Enterprises Finances
G$ Million
19991) 20001) 2001
CURRENT ACCOUNT
Revenue 44,454.3 43,603.6 45,462.2
Expenditure 37,048.3 39,554.1 39,812.1
Oper. Sur.(+)/(Def.(-) 7,406.0 4,049.5 5,650.3
Transfers to Cent. Gov’t 2,278.5 1,098.2 481.4
Cash Sur.(+)/Def.(-) 5,127.5 2,951.4 5,168.6
CAPITAL ACCOUNT
Expenditure 3,750.5 2,113.0 1,712.5
Overall Cash Sur.(+)/Def.(-) 1,376.9 838.4 3,456.1
Financing -1,376.9 -838.4 -3,456.1
External Borrowing (net) -25.2 -24.3 -394.7
Domestic Finance (net) -1,351.7 -814.0 -3,061.41) Adjusted figures exclude GSL, SANATA and GPC.
Receipts
The total cash receipts of the NFPEs amounted to
G$45,462.4 million, 4.3 per cent or G$1,858.8 million
higher than last year’s level. Local cash receipts rose
by G$1,519 million or 16.3 per cent to G$10,860.6
million, reflecting largely increased receipts by
GUYSUCO and GUYOIL of G$980.1 million and
G$309.8 million respectively. Other cash receipts
increased by G$923.7 million to G$4,495.8 million on
account of a G$1,997 million transfer to LINMINE by
the government.
Export cash earnings declined by G$120.8 million or
0.5 per cent to G$23,297.3 million, reflecting lower
export sales mainly by GUYSUCO which fell by
G$250.7 million to G$20,338 million. Cash receipts
from debtors decreased by G$463.1 million to
G$6,808.6 million.
Total cash receipts by the NIS were G$6,810.4
million, G$75.1 million above last year’s level,
reflecting higher contributions. Contributions rose by
G$230.8 million to G$5,099.4 million on account of
increased remuneration to public servants and higher
payments of outstanding contributions owed by private
businesses.
Expenditure
Total current expenditure of the NFPEs amounted to
G$39,812.1 million, G$258.1 million or 0.7 per cent
over the last year’s level on account of higher cane
purchases by GUYSUCO, benefit payments by NIS
and freight payments by LINMINE. Expenditure on
employment increased marginally by 1.2 per cent or
G$179.2 million to G$15,247.2 million. Repairs and
maintenance were also higher at G$309.3 million from
G$116.4 million a year ago while interest payments
rose by G$40.3 million or 67.1 per cent to G$100.3
million during the review period. In contrast, lower
spending was recorded on materials & supplies and
payments to creditors which decreased by G$1,223.1
million and G$43.9 million to G$11,441.8 million and
G$4,702.2 million respectively.
Capital Account
Capital expenditure of the NFPEs amounted to
G$1,712.5 million, G$400.5 million or 19 per cent less
than last year’s level, reflecting lower investments by
GUYSUCO, BERMINE and GNSC. In contrast,
capital outlays by LINMINE, GPOC and GNPL
expanded during the review period.
Overall Balance and Financing
The overall cash surplus of the NFPEs increased by
312.2 per cent to G$3,456.1 million on account of
higher current receipts, lower transfers to government
The Guyana Economy - Public Finance22
and reduced capital expenditure. The surplus
contributed to increased holdings of government
securities by G$2,751.1 million and higher domestic
savings at the banking system. • •

The Guyana Economy - Public Debt 23
0
10
20
30
40
50
G$
Bill
ion
1999 2000 2001
Distribution of Domestic Public Debt
T/Bills Debentures Defense Bonds
Figure 9
6. PUBLIC DEBT
The stock of government’s domestic bonded debt grew by 8.3 per cent while its external debt declined by 0.1
per cent during year 2001. The former increased mainly as a result of the issuance of higher volumes of
treasury bills to sterilize excess liquidity in the financial sector while the latter contracted as a result of the debt
relief obtained under the HIPC Initiatives. Debt service on both the domestic and external debt stock contracted as
a result of lower interest costs on the volume of treasury bills redeemed and debt relief under the HIPC Initiatives
respectively.
Domestic Public Debt
The outstanding stock of government domestic bonded
debt increased by 8.3 per cent or G$3,973 million to
G$52,008 million at end-December 2001 (see Table
XIV). This increase was attributed primarily to
monetary sterilization of a higher level of excess
liquidity through larger issues of treasury bills which
represented 92.5 per cent of total domestic debt.
The maturity structure of the outstanding stock of
treasury bills continued to shift toward the long term
as evidenced by the holdings of 364-day treasury bills
which expanded by 20.4 per cent to G$36,850 million.
The stock of 91-day and 182-day bills contracted by
26.4 per cent and 10.1 per cent to G$3,640 million and
G$7,600 million respectively. Consequently, the share
of 364-day bills accounted for 76.6 per cent of the
outstanding stock compared with 69.6 per cent at end-
December 2000. The shares of 91-day and 182-day
treasury bills slipped to 7.6 per cent and 15.8 per cent
from 11.2 per cent and 19.2 per cent respectively last
year. The share of debentures and defense bonds
declined from 8.4 per cent of total domestic bonded
debt to 7.5 per cent, a 2.6 per cent decline from
G$4,022 million to G$3,918 million.
Table XIV
Central Government Bonded Debt
G$ Million
1999 2000 2001
Total Bonded Debt 41,630 48,035 52,008
Treasury Bills 35,207 44,014 48,090
91-day 4,303 4,947 3,640
182-day 4,952 8,453 7,600
364-day 25,952 30,613 36,850
Debentures 6,418 4,017 3,914
Defense Bonds 5 5 4
The holders of treasury bills shifted during the year
with claims of the financial sector decreasing and
those of the non-financial sectors increasing. The
banking system held G$23,013 million or 47.9 per
cent of the outstanding stock of treasury bills in
comparison with G$23,921 million or 54.4 per cent at
end-December 2000. This was attributed to a
diversification of their portfolios. The other financial
institutions recorded growth of 49.2 per cent or
G$3,207 million to reach G$9,723 million or 20.2 per
cent of the outstanding stock compared with the 14.8
per cent held at end-2000. The public sector’s share,
of which the National Insurance Scheme was the only
stakeholder, was higher at 31.5 per cent compared with
28 per cent in year 2000. In contrast, the private sector
recorded a decline of 82.7 per cent to G$215 million
with a share of 0.5 per cent down from 2.8 per cent at
end-2000.

The Guyana Economy - Public Debt24
The Government of Guyana issued treasury bills
totaling G$69,119 million, 6.9 per cent more than the
level issued last year. Issues of the 91-day bills,
inclusive of those to satisfy the Bank’s capital reserve
requirement, contracted by 8.1 per cent to G$15,915
million. Similarly, issues of the 182-day bills
contracted by 2.4 per cent to G$16,355 million while
issues of the 364-day bills rose by 20.4 per cent or
G$6,237 million to G$36,850 million. There were no
issues of debentures or sale of defense bonds during
the year.
Redemptions during the year increased sharply by 16.4
per cent to reach G$65,043 million. Redemptions of
all maturities increased, with the 182-day and 364-day
maturities expanding by 29.8 per cent and 18 per cent
to G$17,208 million and G$30,613 million
respectively while those of the 91-day issues were
higher by 3.3 per cent for a total of G$17,222 million.
Principal repayments on outstanding debentures
amounted to G$103 million compared with G$2,401
million in 2000.
Table XV
Domestic Debt Interest Payments
G$ Million
1999 2000 2001
Total Bonded Debt 3,673 5,215 4,906
Treasury Bills 2,787 4,513 4,568
91-day 450 432 373
182-day 632 789 882
364-day 1,705 3,404 3,313
Debentures 886 589 338
Interest Payments on Domestic Debt
Interest payments on the domestic bonded debt
contracted by 5.9 per cent or G$309 million to
G$4,906 million in 2001. This was due primarily to
lower interest charges on the stock of treasury bills and
debentures. Interest paid on the 91-day and 364-day
treasury bills declined by 13.8 per cent and 2.7 per
cent or G$60 million and G$91 million to G$373
million and G$3,313 million respectively. In contrast,
debt service on the 182-day maturity increased by 11.8
per cent or G$93 million to G$882 million. Interest
paid on debentures also fell by 42.6 per cent or G$251
million to G$338 million, reflecting the reduced stock
of this instrument and the decline of the treasury bill
benchmark rate.
Stock of External Debt
The stock of outstanding public and publicly
guaranteed external debt amounted to US$1,193.3
million, US$1.5 million or 0.1 per cent below the end-
December 2000 balance due mainly to debt relief.
Decreases were registered in all categories. The
multilaterals, which accounted for 66.6 per cent of
outstanding debt, grew by 0.8 per cent or US$6.3
million to US$794.6 million. Indebtedness to the
International Bank for Reconstruction & Development
and the International Monetary Fund declined by
US$3.1 million and US$19.8 million to US$5.2
million and US$97.6 million respectively. Similarly,
indebtedness to the CARICOM Multilateral Clearing
Facility decreased by 11.8 per cent or US$8 million to
US$59.9 million. In contrast, obligations to the Inter-
American Development Bank increased by 12.2 per
cent or US$37 million to US$341.2 million from one
year earlier.
Table XVI
Structure of External Public Debt
US$ Million
1999 2000 2001
Multilateral 792.3 788.3 794.6
Bilateral 360.9 355.2 350.3
Suppliers’ Credit 15.2 14.7 13.0
Fin. Mkts/Bonds/Nat. 42.6 36.6 35.4
Total 1,210.9 1,194.8 1,193.3
Total bilateral obligations which represented 29.4 per
cent of total external debt, amounted to US$350.3
million, 1.4 per cent lower than the end-December
2000 level. Obligations to Trinidad & Tobago,
Guyana’s largest bilateral creditor, were unchanged at
US$176.9 million. This represented 50.5 per cent of
bilateral debt and 14.8 per cent of total external debt.

The Guyana Economy - Public Debt 25
External Debt Servicing
Debt service payments amounted to US$52.8 million,
40.5 per cent or US$35.9 million less than the
US$88.8 million remitted in the comparable period.
This was mainly due to debt relief in the form of
creditor payments which amounted to US$22.5
million, inclusive of interim E-HIPC assistance. The
debt service ratio improved to 10.8 per cent compared
with 16 per cent at end-2000.
Principal and interest payments amounted to US$29.5
million and US$23.3 million respectively. Central
government debt service totaled US$34.9 million, a
32.4 per cent or US$16.7 million decline while
payments by the Bank of Guyana amounted to
US$17.9 million, 51.7 per cent or US$19.1 million
less than that paid in year 2000. Payments to
multilateral creditors totaled US$40.3 million or 76.7
per cent of total debt service while bilateral creditors
received US$10.8 million. Debt service to the
International Monetary Fund amounted to US$6.6
million while the Inter-American Development Bank
(IDB) received US$14.8 million. The IDA and OPEC
received US$1.2 million and US$0.6 million
respectively while payments to Trinidad & Tobago
under the 1999 Lyons rescheduling agreement totaled
US$5.7 million.
Debt Relief
Of the US$43.8 million in debt relief received during
the year, US$28.7 million or 65.6 per cent was
provided under O-HIPC terms while the balance of
US$15.1 million or 34.4 per cent was received as
interim assistance under the E-HIPC initiative.
Assistance from the multilateral creditors amounted to
US$29.1 million or 66.4 per cent while the bilateral
Paris Club creditors contributed the remaining
US$14.7 million or 33.6 per cent.
Table XVII
External Debt Service
US$ Million
1999 2000 2001
Total External Debt Service 70.2 88.8 52.8
Bilateral 14.9 20.5 10.8
Multilateral 54.5 65.4 40.3
Nationalization 0.3 - -
Suppliers’ Credit - 0.1 -
Bonds 0.2 2.8 1.7
Commercial Banks 0.3 - -
Relief from the International Monetary Fund
amounted to US$10.3 million or 23.5 per cent of the
total while the IDB contributed US$4.7 million or 10.9
per cent. The IDA and OPEC provided US$3.7
million and US$2.6 per cent respectively while
assistance from the CDB and EEC/EDF amounted to
US$2.7 million and US$0.5 million respectively.
Relief from the IFAD totaled US$0.1 million. • •

The Guyana Economy - Financial Sector Developments26
Money Supply
Year on Year Growth
-10
0
10
20
30
40
J M M J S N J M M J S N
Jan. 00 - Dec. 01
Per
cent
M1 M2
Figure 10
7. FINANCIAL SECTOR DEVELOPMENTS
The main focus of monetary policy continued to be the management of liquidity to promote private sector credit
growth, stable price and competitive exchange rate conditions. Broad money grew by 8.9 per cent while private
sector credit expanded marginally on account of cautious commercial bank lending. Interest rates on deposits
trended downward to be consistent with the monetary policy stance as reflected in the decline of the benchmark 91-
day treasury bill rate but lending rates remained relatively unchanged. Consequently, interest rate spreads widened.
The non-bank financial institutions continued to play an active role in the financial sector through the mobilization
of higher levels of financial resources.
MONETARY DEVELOPMENTS
Reserve Money
Reserve money, comprising currency in circulation
and Bank of Guyana’s liabilities to the commercial
banks, amounted to G$33,036 million, 10.9 per cent
higher than the year 2000 level. This outturn resulted
from a 17 per cent growth in liabilities to commercial
banks and a 4.4 per cent growth in currency. The
growth in liabilities reflected the effect of higher
private sector deposits on bankers’ reserves while the
currency increase was seasonal, occurring mainly
during the end of the year.
The higher level of reserve money was reflected in an
increase in the net foreign assets of Bank of Guyana
on account of a sharp decline in foreign liabilities that
was tempered by a fall in gross reserves and net
domestic assets.
The Bank’s foreign liabilities declined by 12.5 per cent
or G$4,339.4 million (US$27.6 million) to G$30,476.5
million (US$160.8 million), partly reflecting debt
relief under both the original and enhanced HIPC
arrangements. Gross international reserves of the
Bank of Guyana which stood at G$54,018.9 million
(US$285.1 million) declined by G$632.1 million
(US$10.7 million), reflecting lower capital inflows.
Net domestic assets of the Bank decreased by 4.6 per
cent or G$457 million to G$9,494 million due mainly
to lower net deposits by the central government.
Table XVIII
Reserve Money
G$ Million
1999 2000 2001
Net Foreign Assets 8,361 19,835 23,542
Net Domestic Assets 17,755 9,951 9,494
Credit to Public Sector -33,541 -37,437 -38,188
Reserve Money 26,116 29,786 33,036
Liabilities to:
Commercial Banks 12,694 15,291 17,898
Currencies 2,199 1,720 1,670
Deposits 10,418 13,495 16,166
EPDS 77 76 62
Currency in circulation 13,422 14,495 15,138
Monthly Average
Reserve Money 23,103 26,332 29,010
Broad Money (M2) 70,099 79,356 87,749
Money Multiplier 3.04 3.02 3.03
Money Supply
Broad money (M2), comprising currency in circulation
and private sector deposits, grew by 8.9 per cent to

The Guyana Economy - Financial Sector Developments 27
G$93,035 million, lower than the 11 per cent
registered for the same period in 2000 (see Table
XIX). This outturn reflected a 12.6 per cent increase
in quasi money due to a 10.3 per cent and a 13.7 per
cent growth in private sector time and savings deposits
respectively. Narrow money decreased marginally by
0.1 per cent with currency in circulation increasing by
4.4 per cent and demand deposits plus cashiers
cheques and acceptances declining by 6.4 per cent.
Money Multiplier and Income Velocity
The yearly average for the M2 multiplier (defined as
M2/Reserve money) was relatively stable at 3.03 from
3.02 in 2000, reflecting the conservative lending of
commercial banks and their higher liquidity.
The income velocity of money circulation, defined as
the ratio of GDP to M2, which measures the speed at
which broad money (M2) circulates to support a given
volume of transactions, declined to 1.4 compared with
1.6 in 2000, reflecting the deceleration in inflation.
Commercial Banks Deposits
During the review period, both total deposits and loans
of commercial banks recorded slower growth. The
former resulted from lower levels of public and
nonbank deposits while the latter reflected the cautious
lending policy of the banks. The ratio of banks’ loans
to residents’ deposits fell to 0.56 from 0.62 in 2000.
Deposits
Total commercial bank deposits of residents
comprising the private and public sectors and the
nonbank financial institutions grew at a slower rate of
5.5 per cent compared with the 16.4 per cent recorded
during year 2000. This outturn resulted from lower
levels of deposits from the public and nonbank sectors.
Private sector deposits which accounted for 83 per
cent of total deposits by residents grew by 9.7 per cent
to reach G$76,682.3 million. Within this sector, the
business component increased by 6.2 per cent while
the household component continued to be the major
source of funds with a 10.5 per cent growth. As a per
cent of total private sector deposits, private business
enterprises’ share declined from 18.8 per cent to 18.2
per cent while the household share increased from 81.2
per cent to 81.8 per cent.
Table XIX
Monetary Survey
G$ Million
1999 2000 2001
Narrow Money 21,576 24,826 24,807
Quasi-Money 55,432 60,619 68,228
Money Supply (M2) 77,008 85,445 93,035
Net Domestic Credit 23,860 25,072 27,530
Public Sector (net) -26,735 -25,848 -24,213
Private Sector Credit 55,823 58,715 59,288
Agriculture 8,094 8,684 8,173
Manufacturing 15,914 16,408 15,486
Distribution 10,323 10,689 10,334
Personal 10,037 9,327 8,383
Mining 1,037 803 737
Other Services 6,762 7,242 7,028
Real Estate Mortgages 2,280 3,092 3,912
Other 1,376 2,470 5,235
Nonbank Fin. Inst. -5,228 -7,795 -7,545
Net Foreign Assets 11,592 22,808 28,658
Other Items (net) 41,556 37,565 36,847
Total deposits of the public sector amounted to
G$7,643.9 million, 16.4 per cent lower than the year
2000 and accounted for 8 per cent of total deposits.
The outturn reflected a 21.6 per cent decline in central
government deposits which resulted from a reduction
in revenues and an increase in expenditures. There
was a 30.7 per cent decline in deposits by NIS. The
latter was due to the switching of portfolios from
deposits to treasury bills.
Total deposits of the nonbank financial institutions
(NBFIs) decreased by 5.3 per cent or G$446 million to
G$8,008.5 million. This was attributed to the switch
of investment portfolios from deposits to treasury bills.
The Guyana Economy - Financial Sector Developments28
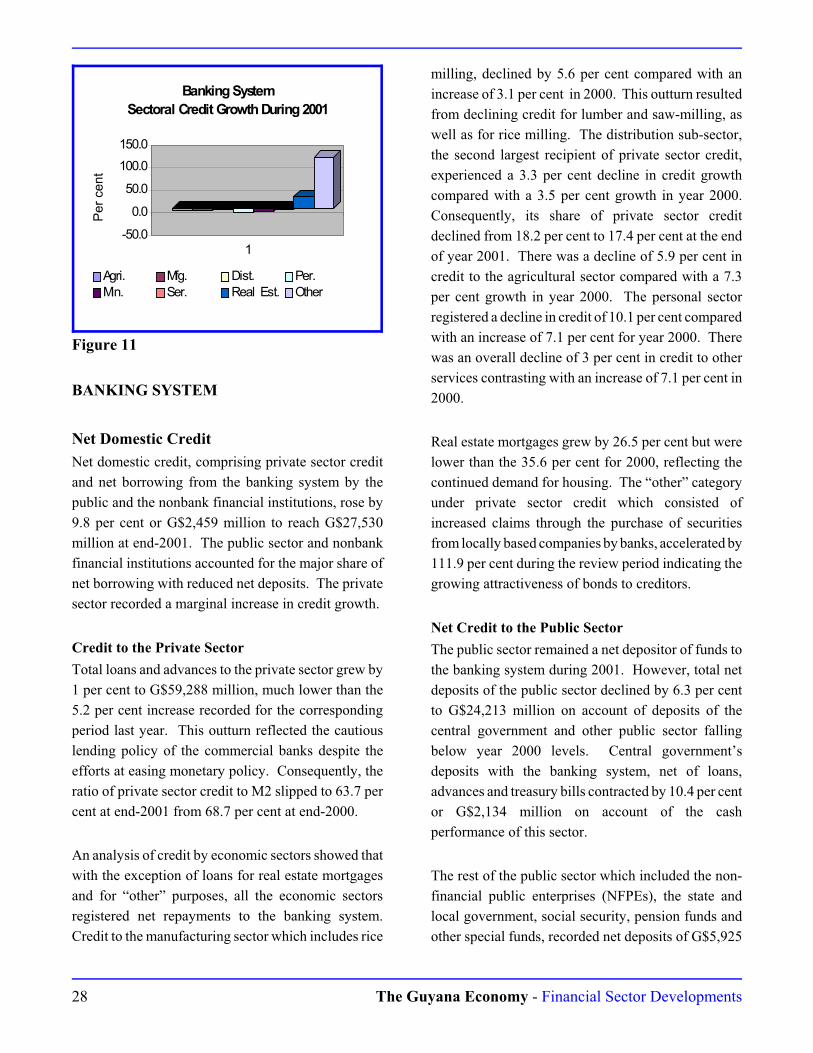
-50.0
0.0
50.0
100.0
150.0
Per
cent
1
Banking System
Sectoral Credit Growth During 2001
Agri. Mfg. Dist. Per.
Min. Ser. Real Est. Other
Figure 11
BANKING SYSTEM
Net Domestic Credit
Net domestic credit, comprising private sector credit
and net borrowing from the banking system by the
public and the nonbank financial institutions, rose by
9.8 per cent or G$2,459 million to reach G$27,530
million at end-2001. The public sector and nonbank
financial institutions accounted for the major share of
net borrowing with reduced net deposits. The private
sector recorded a marginal increase in credit growth.
Credit to the Private Sector
Total loans and advances to the private sector grew by
1 per cent to G$59,288 million, much lower than the
5.2 per cent increase recorded for the corresponding
period last year. This outturn reflected the cautious
lending policy of the commercial banks despite the
efforts at easing monetary policy. Consequently, the
ratio of private sector credit to M2 slipped to 63.7 per
cent at end-2001 from 68.7 per cent at end-2000.
An analysis of credit by economic sectors showed that
with the exception of loans for real estate mortgages
and for “other” purposes, all the economic sectors
registered net repayments to the banking system.
Credit to the manufacturing sector which includes rice
milling, declined by 5.6 per cent compared with an
increase of 3.1 per cent in 2000. This outturn resulted
from declining credit for lumber and saw-milling, as
well as for rice milling. The distribution sub-sector,
the second largest recipient of private sector credit,
experienced a 3.3 per cent decline in credit growth
compared with a 3.5 per cent growth in year 2000.
Consequently, its share of private sector credit
declined from 18.2 per cent to 17.4 per cent at the end
of year 2001. There was a decline of 5.9 per cent in
credit to the agricultural sector compared with a 7.3
per cent growth in year 2000. The personal sector
registered a decline in credit of 10.1 per cent compared
with an increase of 7.1 per cent for year 2000. There
was an overall decline of 3 per cent in credit to other
services contrasting with an increase of 7.1 per cent in
2000.
Real estate mortgages grew by 26.5 per cent but were
lower than the 35.6 per cent for 2000, reflecting the
continued demand for housing. The “other” category
under private sector credit which consisted of
increased claims through the purchase of securities
from locally based companies by banks, accelerated by
111.9 per cent during the review period indicating the
growing attractiveness of bonds to creditors.
Net Credit to the Public Sector
The public sector remained a net depositor of funds to
the banking system during 2001. However, total net
deposits of the public sector declined by 6.3 per cent
to G$24,213 million on account of deposits of the
central government and other public sector falling
below year 2000 levels. Central government’s
deposits with the banking system, net of loans,
advances and treasury bills contracted by 10.4 per cent
or G$2,134 million on account of the cash
performance of this sector.
The rest of the public sector which included the non-
financial public enterprises (NFPEs), the state and
local government, social security, pension funds and
other special funds, recorded net deposits of G$5,925

The Guyana Economy - Financial Sector Developments 29
Outstanding Private Sector Credit by
Sector
Agri.
14% Other
9%
Dist.
17%
Manu.
26%
Personal
14%
Services
12%
Mining
1%Real Estate
7%
Figure 12
million, 9.2 per cent above the end-2000 level. The
deposit growth resulted mainly from increases in
special funds.
Net Credit to the Non-Bank Financial Institutions
The nonbank financial institutions continued to be net
depositors of funds with the banking system, although
deposits of G$7,545 million were 3.2 per cent below
the end-2000 level. This outturn resulted primarily
from lower deposits by the public nonbank financial
institutions on account of the declining interest rates
on these assets.
Net Foreign Assets
The net foreign assets of the banking system expanded
by G$5,850.5 million (US$27.7 million) to G$28,658
million (US$151.2 million) on account of increases by
both the Bank of Guyana and the commercial banks.
Net foreign assets of the Bank of Guyana rose to
US$124.2 million, 15.6 per cent higher than the level
at the end-December 2000 and was attributed to a 14.6
per cent or US$27.6 million decline in the Bank’s
foreign liabilities. In contrast, the gross foreign assets
declined by 3.6 per cent or US$10.7 million to
US$285.1 million on account of the deterioration in
the balance of payments. The net foreign assets of the
commercial banks were US$27 million at end-2001
due to an accumulation in gross foreign assets of
US$7.8 million. The foreign liabilities, in contrast,
decreased by US$3.2 million to US$17.5 million at
end-December 2001.
Table XX
Commercial Banks
Selected Interest Rates and Spreads
All interest rates are in per cent per annum
1999 2000 2001
1. Small Savings Rate 7.97 7.28 6.70
2. Weighted Avg. Time Deposit
Rate
9.45 7.51 7.04
3. Weighted Avg. Lending Rate 17.87 17.68 17.60
4. Prime Lending Rate 17.25 17.21 16.79
5. End of period 91-day
Treasury Bill Discount Rate11.07 9.20 6.25
Spreads
A (3-1) 9.90 10.40 10.90
B (4-1) 9.28 9.93 10.09
C (5-1) 3.10 1.92 -0.45
D (3-2) 8.42 10.17 10.56
E (4-2) 7.80 9.70 9.75
Interest Rates
Interest rates continued to trend downwards during the
review period to be consistent with the monetary
policy stance. The 91-day treasury bill rate (see Table
XX), which is the benchmark for other interest rates,
declined by 295 basis points to 6.25 per cent at end-
2001, reflecting the level of excess liquidity in the
system and hence the intensity of competitive bidding
for treasury bills. Consistent with the decline in the
91-day treasury bill rate, interest rates on savings
deposits fell by 58 basis points to 6.7 per cent per
annum while the weighted average lending rate
declined by 8 basis points to 17.6 per cent. The
intermediation spread between the savings rate and the
weighted average lending rate widened to 10.9
percentage points from 10.4 percentage points at end-
2000 which was consistent with the falling savings
rates and the relatively stable lending rates. The
spread between the prime lending rate and the small
savings rate also increased by 16 basis points while the
spread between the weighted average lending rate and

The Guyana Economy - Financial Sector Developments30
the weighted average time deposit rate also rose by 39
basis points. In contrast to these movements, the
spread between the average 91-day treasury bill rate
and the small savings rate declined by 237 basis
points, reflecting the rising level of liquidity in the
banking system.
Liquidity
The liquidity of the banking system as reflected in the
liquid assets and deposits with the central Bank,
increased during 2001 as credit growth was very
sluggish. Total liquid assets of the commercial banks
amounted to G$32,874 million, 6.2 per cent above the
end of 2000 level. The banks’ excess liquid assets
amounted to G$12,720.5 million or 63.1 per cent
above the prescribed amount at end-2000. Although
there was no change in the lending environment,
commercial banks preferred to hold high levels of
excess reserves and treasury bills. Treasury bills
which accounted for 63.2 per cent of total liquid assets
at end-December 2001 were G$501.9 million, 2.5 per
cent above end-2000 levels.
The required reserves of the banks, which amounted to
G$11,611.9 million, was 5.2 per cent higher than end-
2000, reflecting growth in deposit liabilities over the
review period. Reserves in excess of the minimum
requirement averaged G$4,500 million, 154 per cent
higher than the December 2000 average, reflecting the
cautious lending policies of the commercial banks.
NON-BANK FINANCIAL INSTITUTIONS
The Non-Bank Financial Institutions (NBFIs), which
accounted for the activities of depository and non-
depository licensed and unlicensed financial
institutions, continued to support growth in financial
resource mobilization. The NBFIs, recorded a 13.6
per cent or G$6,565 million increase in financial
resources to reach G$54,998 million (see Table XXI).
Consequently, their share of total assets in the
financial sector grew to 30.7 per cent from 29.2 per
cent at end-2000. The increased resources of the
NBFIs were derived mainly from a 23.9 per cent or
G$3,796 million expansion in private sector deposits,
a 21.4 per cent or G$1,058 million growth in foreign
liabilities, an 8.1 per cent or G$761 million rise in
pension contributions and 5.8 per cent or G$883
million increase in other liabilities.
Table XXI
NON-BANK FINANCIAL INSTITUTIONS
Selected Sources & Uses of Funds
G$ Million
Balances
1999 2000 2001
Sources of Funds: 42,692 48,433 54,998
Deposits 13,423 15,913 19,709
Share Deposits 9,918 12,239 15,671
Other Deposits 3,504 3,674 4,038
Foreign Liabilities 4,295 4,954 6,012
Premium 2,673 2,999 3,067
Pension Funds 8,409 9,437 10,198
Other Liabilities 13,892 15,129 16,012
Uses of Funds: 42,692 48,433 54,998
Claims on:
Public Sector 6,685 6,306 8,605
Private Sector 19,805 21,496 24,359
Banking System1 4,515 6,738 6,971
Non-Residents 5,822 7,573 9,227
Other Assets 5,865 6,320 5,8361 The coverage of non-bank financial institutions differs from that
reported in the monetary section
The resources mobilized by the NBFIs were
transformed mainly into higher claims on both the
private and public sectors. Claims on the private
sector grew by 13.3 per cent to G$24,359 million and
accounted for 44.3 per cent of total assets of the
NBFIs. Local shares and bonds, which grew by 21.4
per cent or G$1,427 million to reach G$8,079 million
and mortgages which increased by 5.8 per cent or
G$683 million to G$12,420 million accounted for
most of the claims on the private sector. Claims on the
public sector were in the form of treasury bills which
stood at G$8,605 million, 36.5 per cent or G$2,299
million more than the level recorded at end-2000.
Claims on the domestic banking system rose by 3.5
per cent or G$233 million to G$6,971 million with

The Guyana Economy - Financial Sector Developments 31
those on commercial banks and the Bank of Guyana
amounting to G$6,576 million and G$395 million
respectively.
Claims on the foreign sector increased by 21.8 per cent
or G$1,654 million to G$9,227 million reflecting the
significant growth in the non-resident operations of the
insurance companies which accounted for 74 per cent
of their total operations.
The New Building Society
The New Building Society (NBS) continued to
mobilize private sector savings during the review
period. Total resources of NBS increased by 25.6 per
cent or G$3,725 million to reach G$18,274 million.
This performance was due mainly to a 28 per cent or
G$3,432 million increase in the share deposits which
attracted relatively higher rates of return than
commercial banks’ deposits. Consequently, the share
of NBS in the total assets of NBFIs increased from 30
per cent last year to 33.2 per cent at end-2001.
Deposits mobilized by NBS were used to extend
mortgage loans to the private sector and to invest in
government securities. Total loans extended to the
private sector rose by 14.1 per cent or G$1,024 million
to G$8,306 million due, in part, to the wider definition
of acceptable collateral for mortgages instituted in Act
No. 6 of 2000, Income Tax (Amendment) Act and
relatively lower mortgage rates. However, claims on
the public sector which was mainly in the form of
government treasury bills increased by 34.3 per cent or
G$1,793 million to G$7,020 million and accounted for
38.4 per cent of NBS’ total assets at the end of
December 2001.
Trust Companies
The resources of the trust companies comprising
GNCB Trust Corporation Incorporated, Trust
Company Guyana Limited and Globe Trust &
Investment Limited rose by 7.2 per cent or G$428
million to reach G$6,348 million. The increase was
due to deposit growth of 9.5 per cent or G$315
million, as well as other liabilities that included
retained earnings and capital & reserves, rose by 3.6
per cent or G$101 million. In spite of the favorable
outturn, the share of the trust companies in the total
resources mobilized by the NBFIs was lower at 11.5
per cent compared with 12.2 per cent at end-2000 as
savers moved resources to higher yielding and lower
risk areas.
Claims on the private sector increased by 9.7 per cent
or G$469 million to reach G$5,306 million.
Mortgages accounted for 64 per cent of private
investment and 53.6 per cent of total assets. The
companies’ holdings of other loans and advances
consisting of agricultural and personal loans,
accounted for 28 per cent of total loans and advances.
The banking system resources declined by 1.5 per cent
or G$7 million to G$455.7 million to reverse the 209
per cent or G$313 million expansion for the same
period last year. This outturn was attributed to the
closure of Globe Trust & Investment Limited to
certain banking activities during the second half of the
year.
Finance Companies
The Finance companies, consisting of one stock broker
(Beharry Stock Brokers Limited); one finance
company (Laparkan Financial Services Limited) and
one investment company (Secure International Finance
Company Incorporated) recorded a 15.7 per cent or
G$776 million increase in financial resources to reach
G$5,713 million and expanded their share of NBFIs’
total resources to 10.4 per cent. The outturn reflected
higher profitability as retained earnings grew by 10.5
per cent or G$253 million. Resources in the form of
loans from companies’ affiliates rose by 11.1 per cent
or G$178 million to reach G$1,786 million.
There were moderate shifts in the relative distribution
of resources within the group’s asset portfolio during
2001. Claims on the private sector represented 85.2
per cent or G$4,869 million of total holdings
compared with 87 per cent or G$4,295 million at end-
December 2000. Claims on banking system resources

The Guyana Economy - Financial Sector Developments32
increased to G$102 million or 1.8 per cent of total
assets, higher than the G$84 million or 1.7 per cent of
total assets held at end-December 2000. Other assets
comprising other real estate loans, prepayments and
stocks grew by 152.8 per cent or G$174 million to
reach G$288 million and accounting for 5 per cent of
total assets.
Pension Schemes
The consolidated resources of the pension schemes
expanded by 7.4 per cent to reach G$11,026 million
on account of higher wages and salaries in both the
private and public sectors. This increase was mainly
due to the 8.1 per cent or G$760.2 million growth in
pension contributions. The share of the reported
pension schemes in the total resources mobilized by
the NBFIs declined to 20 per cent from 21.2 per cent
at end-December 2000.
There were noticeable shifts in the asset portfolio of
the pension schemes during the review period. Claims
on the public sector increased by 58.4 per cent or
G$553 million while deposits with the banking system
declined by 14.3 per cent or G$623 million to G$3,730
million. Claims on the foreign sector amounted to
G$1,346 million, 102 per cent or G$679 million above
the end-December 2000 level. Investments in the
private sector increased by 10.1 per cent or G$322
million to G$3,495 million.
Domestic Insurance Companies
The insurance industry remained the second largest
contributor to the consolidated assets of the NBFIs’
with a share of 24.8 per cent. The resources of the
domestic insurance companies, comprising life and
non-life companies, rose by 6.8 per cent or G$874
million to reach G$13,636 million at end-December
2001. This was largely due to a 7.2 per cent or G$681
million increase in resources of the life insurance
companies. The consolidated position of the non-life
companies, comprising mainly motor, fire and general
insurance grew by 5.9 per cent or G$193 million to
close the year at G$3,437 million.
The growth of the life segment, inclusive of the
foreign component of some life companies, caused its
share of the industry’s resources to reach 74.8 per cent
at end-2001. The main source of funds for the life
insurance companies continued to be insurance premia
which grew by 6.5 per cent or G$438 million to
G$7,201 million, with the non-resident component of
G$4,135 million representing 57.4 per cent and 88.5
per cent of the life insurance fund and foreign
liabilities respectively. The local life premium
component increased by 2.3 per cent or G$67.7
million to close the year at G$3,067 million compared
with the 12.2 per cent or G$326.3 million growth
achieved in 2000, reflecting, in part, the sluggish
growth in banking system credit.
The increased resources of the domestic insurance
companies were used mainly to build claims on the
foreign sector. Claims on non-residents expanded by
15 per cent or G$884.6 million to reach G$6,839
million, representing 50.1 per cent of the insurance
sector’s investments. The companies’ holdings of
foreign assets comprised mainly of deposits and
foreign securities, representing 44.5 per cent and 22.6
per cent of the sector’s foreign assets respectively.
Additionally, loans and advances to non-residents
accounted for 21 per cent of total foreign assets and
10.4 per cent of total assets. Total private sector
investments rose by 24.8 per cent or G$473.9 million
to G$2,382 million and accounted for 17 per cent of
total assets. Claims on the banking system rose by 7.3
per cent or G$69.3 million to G$1,022.4 million at
end-December 2001. Claims on the public sector
declined by 35.9 per cent or G$47.3 million to G$84.5
million. The sector’s holdings of fixed and other
assets also declined by 13.3 per cent or G$506.5
million during the year.
Interest Rates
The interest rates of the NBFIs continued to be
competitive and less volatile than the commercial
banking system during 2001. The NBFIs, except for
one of the deposit-taking trusts and the New Building

The Guyana Economy - Financial Sector Developments 33
Society, reduced interest rates offered on all deposit
accounts during the second half of the review period.
At end-2001, the average mortgage rate of the NBS
remained at 9 per cent for loans not exceeding G$1.5
million and 11 per cent for loans up to G$8 million.
The interest rates offered by GNCB Trust on domestic
and commercial mortgages stood at 16 per cent and 20
per cent respectively. The prime lending rate offered
by the commercial banks was 16.79 per cent. • •

The International Environment34
IIINTERNATIONAL ECONOMIC AND MONETARY
DEVELOPMENTS
The World Economy
World output growth was estimated at 2.4 per cent, 2.3 percentage points below the 2000 level, reflecting the
downturn in global economic activity which commenced in year 2000 and exacerbated by the spillover effects of the
September 11 events in the United States. The industrial countries, including the USA, the Euro area, Canada, UK
and Japan experienced slow economic growth and high unemployment. World trade remained subdued with the
countries dependent on tourism more adversely affected. Industrial countries continued to ease monetary policy to
stimulate investment and growth. The US dollar remained strong against the major currencies while commodity prices
and inflation continued to trend downward.
Industrial Countries
Growth in industrial countries declined to 1.1 per cent
during 2001 from 3.9 per cent in 2000. This was
mainly due to the exacerbation of the downturn in
global economic activity by the events of September
11 in the United States as evident by the weakening of
economic indicators during the last quarter of 2001.
In the United States, real economic growth decreased
to 1 per cent confirming that the economy was in a
recession. In Canada, real GDP growth slowed
substantially to 1.4 per cent, reflecting the slowdown
in economic activity in the USA, their major trading
partner. The Japanese economy which was in
recession in 2000, worsened in 2001 with real
economic growth at -0.4 per cent. This reflected lower
exports and the decline in business and consumer
confidence following banking reforms. Economic
growth in the Euro area also deteriorated to 1.5 per
cent due to reduced consumer and business
confidence. In the United Kingdom, real growth fell
marginally to 2.3 per cent due to sluggish growth in
the domestic demand.
The slowdown in economic activities had caused
higher unemployment in some of the major industrial
countries. USA and Japan recorded unemployment
rates of 4.9 per cent and 5 per cent respectively during
the review period. In Britain and the Euro area,
however, unemployment declined marginally to 5.2
per cent and 8.3 per cent respectively.
Monetary policy was used to stimulate economic
activity in the larger industrial economies. The
Federal Reserve commenced 2001 by lowering the
interest rate by 50 basis points to 5 per cent in the
wake of concerns over the general slowdown of the
US economy. This continued with ten additional
interest rate cuts, resulting in the lowest Federal Fund
rate at 2 per cent. The European Central Bank (ECB)
responded with interest rates reduction five times
during the year to reach 3.75 per cent at end-2001.
The Bank of England also cut interest rates seven
times from 6 per cent at the start of 2001 to 4 per cent
at the end of the year.
Developing Countries
The gloomy global outlook had adversely affected
developing countries through weaker external demand
and falling commodity prices. Consequently, growth
in developing countries slowed to 4 per cent in 2001
from 5.8 per cent recorded in year 2000. The Asian
region recorded growth of 5.6 per cent in 2001 largely
on account of China and India with 7.3 per cent and
4.4 per cent growth respectively. Singapore continued
to record negative growth of 7 per cent due to lower
industrial production. In the Western hemisphere,
Venezuela and Chile recorded moderate growth of 2.7

The International Environment 35
per cent and 3.3 per cent respectively while Argentina
and Mexico contracted. The Middle Eastern countries
were able to sustain growth although some of the
major oil exporters were adversely affected by
declining oil prices.
Inflation for the developing countries grew marginally
in 2001 but remained at low single digit levels.
Venezuela, Brazil and Indonesia recorded relatively
higher inflation rates due to currency depreciation.
Table XXII
Major Industrial Countries
2000 2001 2002 1
Real GDP
- US 4.1 1.0 0.7
- Canada 4.4 1.4 0.8
- UK 2.9 2.3 1.8
- Germany 3.0 0.5 0.7
- France 3.5 2.1 1.3
- Japan 2.2 -0.4 -0.1
Consumer Prices
- US 3.4 2.9 1.6
- Canada 2.7 2.8 1.6
- UK 2.1 2.3 2.4
- Germany 2.1 2.4 1.0
- France 1.8 1.8 1.1
- Japan -0.8 -0.7 -0.1
Unemployment Rates
- US 4.0 4.9 6.0
- Canada 6.8 7.3 8.0
- UK 5.6 5.2 5.4
- Germany 7.5 7.5 7.8
- France 9.5 8.6 8.9
- Japan 4.7 5.0 5.71 Projected figures for 2002
Countries in Transition
Growth in countries in transition was estimated at 4.9
per cent, 1.4 per cent below the 2000 level. The
Russian economy continued to recover in 2001 with
growth of 5.8 per cent on account of foreign
investment inflows and strong consumer spending.
The Russian economy contributed to growth prospects
for non-oil producing countries in the Commonwealth
Independent States (CIS) through its trade with these
States. Positive growth was recorded in the Czech
Republic, Hungary and Poland. Inflation was subdued
in all countries with Russia recording the highest on
account of the depreciation of its currency.
Caribbean Countries
The Caribbean economy, which were already seriously
affected by the global economic downturn, saw a
worsening of economic activity in the region with the
events of September 11. Economies that depended on
tourism were particularly affected. Barbados, OECS
and Jamaica experienced a contraction in economic
growth in 2001 and expectations for both growth and
employment in 2002 are not positive.
Commodity Prices
The slowdown in global economic growth and the
events of September 11 caused oil prices to decline
significantly from US$27.72 at end-June to US$18.59
at end-2001. Prices of most non-fuel commodities
also declined with coffee prices dropping to less than
50 per cent of the end-2000 levels. Gold prices
recovered marginally in 2001 to US$276.8 per ounce
compared with US$273.15 per ounce at end-2000.
The European import price for sugar declined
marginally to US$0.202 per pound compared with
US$0.252 per pound in 2000. The average price of
rice per metric ton moved from US$249.5 in 2000 to
US$240 in 2001. The trend of price declines that was
evident in the bauxite market at end-2000 was reversed
in 2001. However, the decline in non-oil commodity
prices continued to constrain growth and development
in Guyana as a consequence of reduced export
earnings.
International Exchange Rates
The United States dollar strengthened against all major
currencies during the review period. The Japanese
Yen and Euro depreciated 9 per cent while the Pound
Sterling lost 6 per cent on account of speculation
related to the UK’s entry into the Euro area. The

The International Environment36
Canadian dollar depreciated 2 per cent during the year
after appreciating earlier in the year by as much as 5
per cent. • •

Functions, Policy Implementation and Bank Activities - 2001 37
IIIFUNCTIONS, POLICY IMPLEMENTATION AND BANK
ACTIVITIES
1. FUNCTIONS
The Bank’s principal objective as specified by the
Bank of Guyana Act No. 19 of 1998 was that of
fostering domestic price stability through the
promotion of stable credit and foreign exchange
conditions which are conducive to the growth of the
economy. In view of this overall mandate, the Bank of
Guyana was entrusted with the following
responsibilities:• Advising Government on any issue affecting
its main objective of price stability;• Acting as fiscal agent, trustee and banker to
the Government;• Issuing the country’s notes and coins and
determining legal tender;• Advising the Minister of Finance on, and
administering, the foreign exchange system;• Monitoring the country’s balance of payments
position and managing its foreign exchange
reserves;• Acting as a banker to commercial banks and
other licensed financial institutions;• Supervising and regulating licensed financial
institutions; and• Overseeing the country’s payment system.
2. POLICY IMPLEMENTATIONThe primary objectives of monetary policy in year
2001 were the attainment of price and exchange rate
stabilization. In this regard, the focus was on effective
management of excess liquidity in the financial
system. Measures consistent with the pursuit of broad
macroeconomic targets of real GDP growth, inflation
rate, as well as improvement in the gross international
reserves and fiscal prudence were also implemented
during the year.
The main intermediate target of monetary policy was
to contain broad money expansion consistent with the
projections for output and inflation.
Monetary PolicyMonetary policy prescriptions were determined within
the framework of monetary programming. The Bank’s
principal instrument of monetary control continued to
be the auction of treasury bills in the primary market.
The monetary policy stance was signaled through the
volume of treasury bills issued with implications for
the general level of interest rates.
Monetary ProgrammingIn principle, monetary programming allowed the Bank
of Guyana to set a targeted path for the growth of
broad money consistent with output growth and
inflation. Its foundation rested on the observation that
the Bank controls the demand and supply of reserve or
base money in the financial system. The ‘reserve
money programme’ was supported by a liquidity
framework which involved forecasting the changes in
the main items that influenced the banking system’s
liquidity on a weekly basis. The underlying
assumption for the effective operation of the reserve
money programme was the long-run stable relationship
between reserve money and the total money supply or
the money multiplier. On the basis of the constancy of
the money multiplier, the Bank determined the growth
in reserve money required to attain the targeted
expansion in the money stock.
During the year 2001, weekly forecasts of the Bank’s
balance sheet were produced based on estimated liquid
reserve positions of the commercial banks and the
public, collectively referred to as reserve money.
These forecasts were compared with the weekly
targeted monetary growth which was consistent with
the set nominal output objective. The deviations
established by this comparison indicated the level of
the open market operation necessary to bring the
forecast money supply in line with its targeted annual
growth rate.

Functions, Policy Implementation and Bank Activities - 200138
Treasury BillsThe auction of treasury bills with various maturities
(91-day, 182-day and 364-day) at the primary market
level continued to be the Bank’s principal instrument
of monetary control. The objective was to influence
the liquidity conditions of the commercial banks
consistent with the targeted growth for broad money.
The liquidity forecast framework and the reserve
money programme provided the technical basis for
decision making on the volumes and maturities of
weekly treasury bill issues. The Open Market
Operation Committee (OMOC), which is the decision
making body on the issuance of treasury bills, adopted
a consultative approach during the year by liaising
closely with agencies which impacted directly on
liquidity in the financial sector. Additionally, other
information such as the state of the foreign exchange
market, the interbank market, the structure of interest
rates and the liquidity position of the nonbank
financial institutions facilitated more informed
decisions by the OMOC.
The weighted average discount rate determined by the
competitive auctions for 91-day treasury bills,
remained the reference short-term rate in the market.
The interest rates applied by the Bank and commercial
banks were either directly or indirectly linked to this
rate.
Reserve Requirements
The statutory reserve requirement remained an
important instrument for monetary control and
financial prudence in Guyana. The legislation on
reserve requirements which was implemented in 1999
remained in force in 2001 and continued to make the
operating framework consistent with the thrust toward
monetary control.
The revised Reserve Requirements Circular - No.
33/98, issued three years ago and made effective June
29, 1998, sets out the specifications for: (i) the
institutions subject to reserve requirements; (ii) the
prescription of the reserve base, (iii) reserve
maintenance periods; and (iv) the penalty charge for
deficiencies in reserve requirements. With effect from
the reserve base period which commenced February 1,
1999, the statutory reserve requirement ratio
applicable to all liabilities (i.e., demand, time and
savings liabilities, whether domestic or foreign) of
deposit taking financial institutions was lowered to 12
per cent from the sum of 14 per cent of time liabilities
and 16 per cent of demand liabilities held by banks.
This requirement remained unchanged in 2001 for
commercial banks. However, effective January 1,
2000, some variations of the requirement were
implemented for licensed nonbank depository financial
institutions (GNCB Trust Company Incorporated and
Globe Trust and Investment Company) to create a
level playing field and hence greater financial
intermediation. These institutions were required to
have a minimum deposit balance of 4 per cent of their
total liabilities in their reserve account at the Bank of
Guyana. This was to be incrementally increased every
six months by 2 percentage points until the
convergence with the ratio of 12 per cent applicable to
commercial banks was achieved. Accordingly, the
deposit taking licensed NBFIs’ required reserve ratio
stood at 10 per cent at end-2001. Non-compliance
with the reserve requirement carried a penalty which
took the form of an interest charge on the deficiency
(actual reserves less required reserves). This was
calculated at a rate equal to twice the rate of interest on
the 91-day treasury bills which prevailed at the
beginning of the reserve maintenance period over
which the deficiency occurred.
Liquid Assets
Circular No. 52/98 on Liquid Assets Requirements
which became effective from October 26, 1998,
remained in force throughout year 2001. This circular
provided for: (i) the extension of the liquid assets
requirement to nonbank licensed depository financial
institutions; (ii) ensuring consistency in the prescribed
liabilities, liquid assets base period and maintenance
period with the revised prescribed liabilities, base and
maintenance periods for reserve requirements; and (iii)
Functions, Policy Implementation and Bank Activities - 2001 39
introducing a penalty for a deficiency in liquid assets
requirements.
The statutory liquid assets ratios (LAR) which
determined the minimum level of liquid asset holdings
that commercial banks were required to maintain in
relation to their deposit liabilities, remained at 25 per
cent of demand liabilities and 20 per cent of time and
savings liabilities. The banks were more liquid in year
2001 compared with the previous year, as indicated by
the higher ratio of monthly average excess liquid
assets to average total assets. This ratio rose by 3.5
percentage points from 32.6 per cent at the end of
December 2000 to 36.1 per cent at the end of
December 2001. Actual liquid assets held by
commercial banks continued to reflect large holdings
of government bills with less than 91 days remaining
to maturity. In excess of 60 per cent of banks’ liquid
assets was in the form of treasury bills during the year.
Interest Rates
The Bank of Guyana used the treasury bill discount
rates to signal its monetary policy stance to the rest of
the economy. The Bank rate was seldom used since
commercial banks were not permitted to borrow from
the Bank of Guyana given the liquidity overhang. The
Bank rate peaked in March at 12 per cent and fell
continuously throughout the year to 8.75 per cent at
end-December. Generally, changes to the Bank rate
responded to changes in the discount rate on 91-day
treasury bills. However, the Bank continued to keep
its re-discounting policy and terms under review
during year 2001. The objectives were to ensure that
the re-discount window was consistent with the
development of the interbank money and treasury bill
markets, as well as to promote competition and a
secondary market for the issues of Government
securities. The margins above and below the average
re-discount rate on treasury bills purchased and sold
by the Bank of Guyana, which were amended by
Circular 13 of 1999 and made effective in March
1999, remained in force during year 2001. The level
of the re-discount depended on the remaining days to
maturity of the re-discounted treasury bills.
Exchange Rate Policy
The exchange rate policy, supported by appropriate
fiscal and monetary measures was aimed at
strengthening the macroeconomic conditions that
facilitate price and foreign exchange rate stability.
Within this framework and vis-à-vis the gross
international reserve target, the Bank’s intervention in
the foreign exchange market amounted to US$15.5
million in year 2001 compared with US$5 million in
year 2000.
Institutional Developments
There were a number of institutional developments
that occurred during the year. These developments
included the formal launching and operation of the
first Merchant bank -The Guyana Americas Merchant
Bank Incorporated, initiatives to privatize GNCB and
the enactment of the Money Laundering (Prevention)
Act No. 1 of 2000. In addition, the Bank continued its
efforts to develop the institutional capacity of the
financial sector.
The Guyana Americas Merchant Bank Inc.
On March 16, 2001, Bank of Guyana in accordance
with section 6(2) of the Financial Institution Act No.
1 of 1995 approved the establishment of the Guyana
Americas Merchant Bank Incorporated. On June 27,
2001, the bank was launched with the major
shareholders being Secure International, the Guyana
Bank for Trade & Industry and the International
Finance Corporation. The objectives of this non-
deposit taking institution are to facilitate investment
for companies seeking financing, aid in project
development, underwrite stocks or bonds and advise
on corporate finance in areas such as mergers and
acquisitions.
Privatization of GNCB
On October 2, 2001, Guyana National Cooperative
Bank (GNCB), the third largest commercial bank with

Functions, Policy Implementation and Bank Activities - 200140
eight (8) branches, was formally placed on the market
for divestment. On November 23, 2001, the point of
sale for GNCB was reached with one perspective
investor registered to purchase the bank. However, the
deadline for registration was extended to February
2002 in an attempt to attract more investors.
Money Laundering Prevention Act
The Money Laundering (Prevention) Bill No. 10 of
1998 was formally enacted in March 2000 as the
Money Laundering (Prevention) Act No. 1 of 2000.
This was followed by the appointment of the Bank as
the supervisory authority, responsible for overseeing
the proper implementation of the Act. A Financial
Intelligence Unit was formed at the Bank and has been
working closely with the Caribbean Financial Action
Task Force in carrying out its mandate.
Globe Trust & Investment Company
On December 31, 2000, the Bank conducted an
examination at the Globe Trust & Investment
Company Limited (GTICL) and established that a
situation of unsafe and unsound practices existed
causing serious prejudice to the interest of depositors
and fundamental loss to GTICL. The Bank then
proceeded to manage the situation as set out in the
Financial Institutions Act (FIA) No. 1 of 1995.
On November 27, 2001, in accordance with Section 49
of the FIA (1995), the Bank applied to the courts for
compulsory liquidation of the Institution.
Call Exchange
The call exchange continued to function during the
year. Simultaneously, the Securities Industries Act
No. 21 of 1998 was being brought into operation in
phases. The first phase was carried out through the
establishment of the Securities Council and
appointment of its members as stipulated under
Section 4 of the Act. The second phase involved the
development and approval by the Council of various
regulations aimed at implementing the Act. Under
Section 5(c), the Guyana Association of Securities
Companies and Intermediaries (GASCI) was formed
to facilitate companies to float their shares. The
Security Council is housed at the Bank of Guyana
Building.
3. BANK ACTIVITIES
Currency Operations
The availability of a safe and convenient medium of
exchange in an economy is important for an efficient
payments system. This obligation was discharged
through the Currency Division of the Operations
Department. This department ensured that there was
not only an adequate supply of high quality notes and
coins in circulation but also withdrew from circulation
soiled and damaged currency for destruction and
replaced them with new notes and coins.
Table XXIII
Supply & Disposal of Bank of Guyana Currency
Notes
Thousands of Notes
1999 2000 2001
Opening Stock 17,017 28,710 13,832
Purchased 37,000 11,000 24,500
Withdrawn from circulation 49,257 82,995 103,318
TOTAL SUPPLY 103,274 122,705 141,650
Issued 53,851 85,238 103,509
Destroyed 20,713 23,636 19,876
TOTAL DISPOSAL 74,564 108,874 123,385
End-year Stock 28,710 13,832 18,264
New Notes 22,561 7,048 12,355
Re-Issuable Notes 3,218 493 2,088
Other Notes 1 2,931 6,291 3,8211 Notes awaiting sorting, cancellation and destruction.
Notes
The total value of currency notes in circulation
(including notes held in the vaults of commercial
banks) at the end of 2001 mounted to G$16,526.1
million, a marginal increase of 3.5 per cent compared
with a circulation of G$15,969 million in 2000. The
share of G$1,000 notes in the total value of notes in
circulation rose to 89.2 per cent compared with 80 per
cent in the previous year while the share of G$500
notes fell from 15.1 per cent in 2000 to 5.7 per cent in
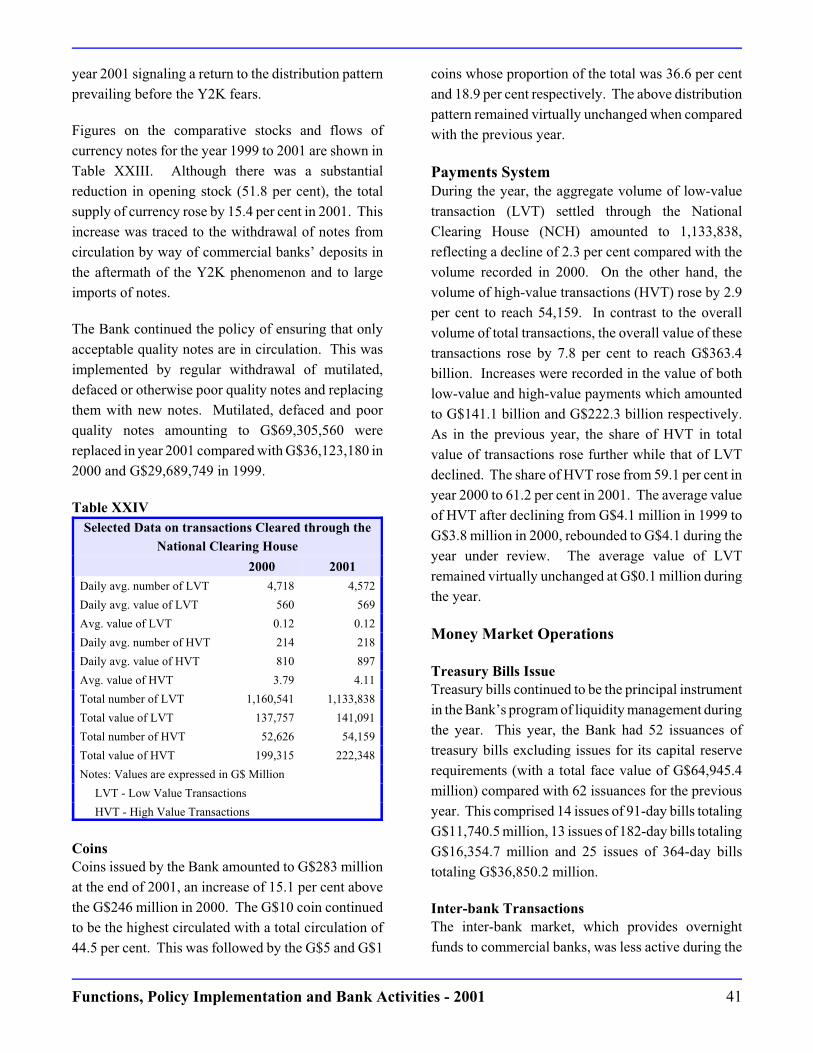
Functions, Policy Implementation and Bank Activities - 2001 41
year 2001 signaling a return to the distribution pattern
prevailing before the Y2K fears.
Figures on the comparative stocks and flows of
currency notes for the year 1999 to 2001 are shown in
Table XXIII. Although there was a substantial
reduction in opening stock (51.8 per cent), the total
supply of currency rose by 15.4 per cent in 2001. This
increase was traced to the withdrawal of notes from
circulation by way of commercial banks’ deposits in
the aftermath of the Y2K phenomenon and to large
imports of notes.
The Bank continued the policy of ensuring that only
acceptable quality notes are in circulation. This was
implemented by regular withdrawal of mutilated,
defaced or otherwise poor quality notes and replacing
them with new notes. Mutilated, defaced and poor
quality notes amounting to G$69,305,560 were
replaced in year 2001 compared with G$36,123,180 in
2000 and G$29,689,749 in 1999.
Table XXIV
Selected Data on transactions Cleared through the
National Clearing House
2000 2001
Daily avg. number of LVT 4,718 4,572
Daily avg. value of LVT 560 569
Avg. value of LVT 0.12 0.12
Daily avg. number of HVT 214 218
Daily avg. value of HVT 810 897
Avg. value of HVT 3.79 4.11
Total number of LVT 1,160,541 1,133,838
Total value of LVT 137,757 141,091
Total number of HVT 52,626 54,159
Total value of HVT 199,315 222,348
Notes: Values are expressed in G$ Million
LVT - Low Value Transactions
HVT - High Value Transactions
Coins
Coins issued by the Bank amounted to G$283 million
at the end of 2001, an increase of 15.1 per cent above
the G$246 million in 2000. The G$10 coin continued
to be the highest circulated with a total circulation of
44.5 per cent. This was followed by the G$5 and G$1
coins whose proportion of the total was 36.6 per cent
and 18.9 per cent respectively. The above distribution
pattern remained virtually unchanged when compared
with the previous year.
Payments System
During the year, the aggregate volume of low-value
transaction (LVT) settled through the National
Clearing House (NCH) amounted to 1,133,838,
reflecting a decline of 2.3 per cent compared with the
volume recorded in 2000. On the other hand, the
volume of high-value transactions (HVT) rose by 2.9
per cent to reach 54,159. In contrast to the overall
volume of total transactions, the overall value of these
transactions rose by 7.8 per cent to reach G$363.4
billion. Increases were recorded in the value of both
low-value and high-value payments which amounted
to G$141.1 billion and G$222.3 billion respectively.
As in the previous year, the share of HVT in total
value of transactions rose further while that of LVT
declined. The share of HVT rose from 59.1 per cent in
year 2000 to 61.2 per cent in 2001. The average value
of HVT after declining from G$4.1 million in 1999 to
G$3.8 million in 2000, rebounded to G$4.1 during the
year under review. The average value of LVT
remained virtually unchanged at G$0.1 million during
the year.
Money Market Operations
Treasury Bills Issue
Treasury bills continued to be the principal instrument
in the Bank’s program of liquidity management during
the year. This year, the Bank had 52 issuances of
treasury bills excluding issues for its capital reserve
requirements (with a total face value of G$64,945.4
million) compared with 62 issuances for the previous
year. This comprised 14 issues of 91-day bills totaling
G$11,740.5 million, 13 issues of 182-day bills totaling
G$16,354.7 million and 25 issues of 364-day bills
totaling G$36,850.2 million.
Inter-bank Transactions
The inter-bank market, which provides overnight
funds to commercial banks, was less active during the

Functions, Policy Implementation and Bank Activities - 200142
year as compared with 2000. During the year, there
were 74 processed transactions compared with 126
processed transactions for the previous year. The
value of funds traded on the market amounted to G$17
billion in 2001 compared with G$33 billion in 2000, a
decrease of 48.5 per cent.
The inter-bank rate, which was influenced by the 91-
day treasury bill rate, averaged 8.6 per cent compared
with 11.19 per cent during 2000. The inter-bank
average rate recorded in January was 10.48 per cent,
remaining relatively stable before declining to 8 per
cent at end-August and September. In October, the
inter-bank rate declined further to 7 per cent at which
it ended the year.
Foreign Exchange Operations
The gross international reserves of the Bank of
Guyana amounted to US$285.1 million which was
equivalent to 4.3 months of imports. This was 3.6 per
cent lower than the US$295.8 million realized at end
of year 2000 and was largely due to a decline in capital
inflows. The gross international reserves comprising
US$258.2 million in ‘hard currency’ reserves,
included gold and soft currencies such as Eastern
Caribbean and Barbados dollars. The aggregate hard
currency outflows (i.e., namely US and Canadian
dollars and Pound Sterling) for the year amounted to
US$191.8 million. This was made up of US$56.2
million in debt servicing (down from US$80.9 million
for year 2000), US$120.1 million in imports of oil,
wheat and other goods and services, including those of
the Ministry of Foreign Affairs. The Bank also sold
US$15.5 million to the local foreign exchange market
during the year.
Relations with Commercial Banks
During the year, the National Clearing House (NCH)
continued to play an essential role in the payments
system by providing the central cheque clearing
facility and inter-bank settlement services. Since the
establishment of the NCH, a large number of cheques
were cleared under this system (see section on
Payments System).
The foreign currency requirements of commercial
banks were mostly fostered through the direct
purchase of foreign currency from customers under the
Dealers in Foreign Currency (Licensing) Act 1989.
The balances held by the Bank in respect of amounts
deposited by the commercial banks under the External
Payment Deposits Schemes (EPDS) continued to fall
with a reduction of G$13.4 million (17.7 per cent) to
end the year at G$62.2 million.
Relations with Government
A total of 269 active Government accounts were held
with the Bank at end-December 2001. The Bank rate
(i.e., the rate of interest charged on Government
overdrafts) decreased by 3 percentage points from the
end-2000 level to reach 8.75 per cent at end-December
2001. This was due to the movements in the 91-day
treasury bill rate to which it is linked.
At the end of the year, Government’s deposit, net of
treasury bills held by the Bank, fell to G$35,575.5
million. The Bank’s holdings of treasury bills
declined to G$1,022.4 million from G$2,178.2 million
at end-2000. Holdings of Government non-interest
bearing debentures declined to G$47,992.7 million.
Relations with International Organizations
The Bank continued to act as fiscal agent for the
Government in its relations with the Multilateral
Financial Institutions of which Guyana is a member.
Repayments made through the Bank to Multilateral
Financial Institutions in year 2001 amounted to
US$40.3 million compared with US$65.4 million in
the previous year. Of this, total debt service to the
IMF and IDB were US$6.6 million and US$14.8
million respectively.
Additionally, an agreement was signed in the last
quarter of 2001 with the IDB and the Government of
Guyana naming the Bank as the executing agency for
the “Strengthening Banking Supervision Project”
(SBSP). The SBSP is aimed at promoting a stable
financial environment through sound prudential

Functions, Policy Implementation and Bank Activities - 2001 43
policies and guidelines. Specific components of the
project included the establishment of a financial
stability committee, providing training in financial
issues to the public and private sectors, developing and
enhancing supervisory processes, improving
regulatory reporting and information technology and
the enhancing of anti-money laundering procedures.
Relations with Regional Central Banks
Clearing arrangements with CARICOM Central Banks
remained on a bilateral basis. The Bank continued to
honour obligations to the CARICOM Multilateral
Clearing Facility (CMCF). During the year, an
equivalent of US$11.3 million was paid to the CMCF
from bilateral balances which had accumulated on the
accounts with the Eastern Caribbean Central Bank and
the Central Bank of Barbados.
The Bank of Guyana continued to participate in
regional meetings of central bank governors.
Bank Supervision Department
The Bank Supervision Department (BSD)
accomplished most of the work planned for the year.
It continued with its on-site inspections and off-site
surveillance of licensed financial institutions (LFIs)
with the objective of ensuring compliance with the
FIA, its regulations and guidelines. During the year,
the department conducted two full scope examinations
on a bank and nonbank. A special inspection was also
completed on GTICL where it was found that unsafe
and unsound practices were conducted. The on-site
surveillance unit of BSD exerted greater effort in its
follow through to ensure compliance with the
recommendations emanating from its findings.
The off-site surveillance unit revealed problems of
asset quality in the banking sector emanating from
non-performing loans. Consequently, the unit
continued to monitor with the aim of ensuring LFIs
complied with the required levels of provisioning for
loan losses.
The department completed its self assessment of the
Basle twenty-five Core Principles during the year
which was reviewed by the International Monetary
Fund (IMF). These principles are upheld by the
international financial community as providing
supervisory/regulatory authorities with an international
benchmark against which the effectiveness of bank
supervisory regimes can be assessed.
Staff and Technical Assistance
Two hundred and fifty-nine (259) persons were
employed at the Bank of Guyana at the end of 2001.
The total number of persons recruited during the year
under review was twenty-six (26), while there were
twenty-eight (28) resignations, one (1) retirement and
one (1) termination of service.
During the year under review, the Bank benefitted
from a series of short term technical assistance from
the International Monetary Fund (IMF), with the visits
of three (3) Consultants who were attached to the Bank
Supervision Department over the period April to
August 2001.
Training
During 2001, the Bank’s training policy continued to
rely on in-house, local and overseas training. Training
included selected courses sponsored by reputable
organizations and/or training agencies, as well as
attendance at short overseas courses sponsored by the
International Monetary Fund (IMF), the Centre for
Latin American Studies (CEMLA) and the Caribbean
Centre for Monetary Studies (CCMS).
In-house Training
Early in the first quarter, a workshop was held for
cleaners where emphasis was placed on inter-personal
relationships among this group of staff, the building of
self-confidence and the importance of cleanliness in
the business environment. During the same period the
Security Division held a seminar for Sergeants and
Guards in addition to a series of lectures that were
presented to junior ranks.
All of the Bank’s drivers attended a workshop during
April. Emphasis was placed on defensive driving,

Functions, Policy Implementation and Bank Activities - 200144
protocol matters, maintenance and care of vehicles, as
well as familiarity with traffic rules and regulations.
The Personal Computer Support Unit continued its
computer-based training in Microsoft Word and Excel.
An additional training module was subsequently added
(Introduction to PCs and Application Software). The
response to this course was successful with the
majority of the participants attaining credit. In sum,
thirty-seven (37) persons were registered for the
Computer Based Training (CBT) courses.
Further, the Bank is in its final phase of training for
the full implementation of the Bankmaster System
Software which was managed by the Accounts
Management Systems (AMS). This project is being
carried out with expertise provided by Kindle Banking
Systems. This software is a fully integrated
accounting, transaction handling, customer service and
management reporting system. It was designed to
provide users with comprehensive, accurate, on-line,
realtime information. It was also designed as a
modular system with each module capable of handling
specific areas of banking.
Bank Supervision Department benefitted from a
number of short term technical assistance from the
Monetary and Exchange Division (MAE) of the IMF.
Technical assistance was provided in the areas of
problem bank resolution. Other areas of technical
assistance included a draft proposal of a bank rating
system (Capital, Asset quality, management, Earnings,
Liquidity and Internal Control - CAMELI), as well as
the preparation of the proposed chart of accounts for
LFIs.
Other Local Training
During the year, a number of employees attended local
training programmes. These programmes included the
Microsoft Network + Course which was attended by
three employees of the Information Services
Department, a workshop sponsored by the Caribbean
Management Development Association and a course
on Human Resources Management sponsored jointly
by the IDB and the Consultative Association of
Guyanese Industry Limited. Participants were drawn
from a number of departments including the Human
Resources Department. Two (2) members of the
Library staff also attended a seminar on evaluating
web sites.
During the year, seven (7) employees graduated from
the University of Guyana - four (4) with degrees and
three (3) with diplomas. Specialized areas included
Business Management, Accountancy and Banking &
Finance.
Overseas Training
During the year, three (3) members of staff pursued
post graduate studies at overseas universities. One (1)
employee from the Information Services Department
pursued Computer Science at the University of Wales
while another from the Research Department studied
International Business at the University of Lancaster.
The third employee from the International Department
pursued Project Analysis, Finance and Investment at
the University of York. Two (2) of those employees
were granted British Chevening Scholarships while the
other benefitted from the Japan/World Bank Graduate
Scholarship. • •
45
IV
BALANCE SHEET,
PROFIT AND LOSS ACCOUNT AND REPORT
OF THE EXTERNAL AUDITORS

AG:66/2002 30 March 2002REPORT OF THE AUDITOR GENERAL
TO THE MEMBERS OF THE BOARD OFDIRECTORS ON THE FINANCIAL
STATEMENTS OF THE BANK OF GUYANAFOR THE YEAR ENDED 31 DECEMBER 2001
I have audited the attached financial statements of the Bank of Guyana for the yearended 31 December 2001, as set out on pages 1 to 7. These statements have beenprepared under the historical cost convention, modified by the revaluation of fixedassets, and in accordance with the accounting policies as set out on Page 3.
Respective Responsibilities of Management and Auditors
The preparation of the financial statements, including assertions relating to theircompleteness, accuracy and validity, and compliance with applicable laws,regulations and contractual obligations, is the responsibility of the Management ofthe Bank of Guyana. My responsibility is to express an independent opinion on thestatements based on these assertions and to report my opinion to you.
Basis of Opinion
I conducted my audit in accordance with generally accepted auditing standards.Those standards require that I plan and perform the audit to obtain reasonableassurance about whether the financial statements are free of material misstatement.An audit includes examining, on a test basis, evidence supporting the amounts anddisclosures in the financial statements. An audit also includes assessing theaccounting principles used and significant estimates made by Management as wellas evaluating the overall financial statement presentation. I believe that my auditprovides a reasonable basis for my opinion.
1

47
Opinion
In my opinion, the financial statements referred to above present fairly, in allmaterial respects, the financial position of the Bank of Guyana as at 31 December2001, and the results of its operations for the year then ended in conformity withgenerally accepted accounting principles and the Bank of Guyana Act 1998.
OFFICE OF THE AUDITOR GENERAL63, HIGH STREETKINGSTONGEORGETOWNGUYANA

BANK OF GUYANA
BALANCE SHEET
AT 31ST DECEMBER, 2001
Notes 2000 Notes 2000
G$ G$ G$ G$
Assets Liabilities
Foreign Assets Currency in circulation
Balances with Foreign Banks 30,133,347,113 28,581,729,587 Notes 16,526,054,540 15,968,991,740
Foreign Assets in the process of Coins 282,586,741 246,191,419
redemption 538,712,115 676,763,032
Holdings of special drawing rights 463,099,175 1,687,830,134 16,808,641,281 16,215,183,159
Gold 2 233,448,741 39,081,437
Money market securities 3(a) 22,646,182,990 23,667,425,112
Deposits
54,014,790,134 54,652,829,302
Commercial Banks 15,727,723,630 13,071,829,944
Government of Guyana 36,537,400,769 38,282,637,282
Local Assets International Financial Institutions
and Central Banks 8 31,617,711,104 36,059,553,943
Special issue of Government of Private Investment Fund 6,500,330 6,500,330
Guyana securities 4 47,992,672,341 68,268,504,921 Others 9 3,609,296,107 10,431,792,360
Government of Guyana Treasury Bills 3(b) 1,022,456,147 2,178,151,281 87,498,631,940 97,852,313,859
49,015,128,488 70,446,656,202
Claim on International Monetary Fund 5 1,967,720,504 1,967,720,504 Allocation of Special Drawing Rights 10 3,430,098,465 3,493,384,688
Gov't of Guyana Portion of net profit payable 479,478,733 823,011,058
Other liabilities 11 320,697,566 435,229,818
Capital and reserves
Fixed Assets 6 1,309,923,937 1,256,790,037
Authorised Share capital 1,000,000,000 1,000,000,000
Paid-up Capital 12 1,000,000,000 1,000,000,000General Reserve Fund 802,962,883 749,687,468
Revaluation Reserves 1,025,158,030 1,025,158,030
Other reserves
Other Assets 7 7,427,788,846 2,616,353,292 Contingency reserve 13 2,369,683,011 9,346,381,257
113,735,351,909 130,940,349,337 113,735,351,909 130,940,349,337
D.S. SINGH (Director)
P. BHIM (Director)
48
1

492
BANK OF GUYANA
PROFIT AND LOSS APPROPRIATION ACCOUNT
FOR THE PERIOD ENDED 31ST DECEMBER, 2001
2000
Notes G$ G$
INCOME
Discount Received 1,042,308,055 1,785,114,789
Interest on Gov’t of Guyana Securities 324,597,707 420,044,999
Interest on Deposits 1,204,140,822 1,034,765,271
Interest on Loans 1,936,061 2,060,997
Profit on Realisation of Investments 9,458,725 21,871,724
Other Income 179,022,224 342,658,771
2,761,463,594 3,606,516,551
EXPENSES
Administrative Expenses 725,292,863 718,887,839
Interest and Charges 1,083,921,880 1,421,283,120
Portion of Cost of Printing Notes & Minting Coins 344,037,622 499,277,871
Depreciation charge on fixed assets 75,457,081 52,610,990
2,228,709,446 2,692,059,820
Net Profit 14
Appropriation: 532,754,148 914,456,731
Transfer to General Reserve 53,275,415 91,445,673
Balance payable to Gov’t of Guyana under Section 7(1) of
the Bank of Guyana Act 479,478,733 823,011,058
532,754,148 914,456,731

50 3
BANK OF GUYANA
NOTES ON THE ACCOUNTS
1. SIGNIFICANT ACCOUNTING POLICIES
(a) Accounting convention
The accounts have been prepared under the historical cost convention.
(b) Depreciation
Depreciation on fixed assets is on the straight line method calculated on cost to write-off the assets over the
term on their estimated useful lives at the rate specified below:
Office Furniture - 10%
Sundry equipment - 9 to 20%
Motor vehicles - 25%
Building - 2%
Depreciation is not provided on freehold land.
(c) Foreign currency transactions
Foreign currency transactions are translated to the Guyana dollar equivalent at the rates of exchange ruling
on the dates of such transactions. Assets and liabilities held with foreign financial institutions are valued at
the applicable year-end rates. Gains/losses are transferred to a reserve account and any deficiency is covered
by the Government of Guyana through special issue of debentures.
2. GOLD
2001 - G$233,448,741 2000 - G$39,081,437
This amount represents 4,455.405 troy ounces of gold as at 31st December 2001.
3. MONEY MARKET SECURITIES/TREASURY BILLS
(a) Money Market Securities - US Treasury Bills
Face Value Cost
US$ G$ US$ G$
As at January 1, 2001 130,094,000 24,034,866,500 128,105,142.69 23,667,425,112
Net Decrease in 2001 (9,997,000) (1,276,485,000) (8,600,219.26) (1,021,242,122)
As at December 31, 2001 120,097,000 22,758,381,500 119,504,923.43 22,646,182,990

514
(b) Treasury Bills - Government of Guyana Treasury Bills
Face Value Cost
G$ G$
As at January 1, 2001 2,222,900,000 2,178,151,281
Net Decrease in 2001 (1,183,050,000) (1,155,695,134)
As at December 31, 2001 1,039,850,000 1,022,456,147
4. SPECIAL ISSUE OF GOVERNMENT OF GUYANA SECURITIES
This amount represents the accumulated losses mainly on the Bank’s foreign exchange operations including
revaluation of its external assets and liabilities. These losses are covered by issues/redemption of interest and
non-interest bearing debentures in accordance with Section 7(3), Section 49(2) and Section 49(3) of the Bank
of Guyana Act 1998, No. 19 of 1998.
TOTAL
G$
Total at the beginning of the year:
(less)
68,268,504,921
Debenture redeemed as per Section 49(3) of Bank of Guyana Act 1998 (20,275,832,580)
Total at the end of the year 47,992,672,341
5. CLAIM ON THE INTERNATIONAL MONETARY FUND
2001 - G$1,967,720,504 2000 - G$1,967,720,504
This claim arises from and reflects that part of the drawing covered by Guyana's subscription in SDRs to the
International Monetary Fund not yet repurchased.

52 5
6. FIXED ASSETS
Building Furniture & Equipment Total
G$ G$ G$
Cost:
As at January 1, 2001 1,078,366,550 417,416,275 1,495,782,825
Net additions during year 4,284,506 123,722,903 128,007,409
As at December 31, 2001 1,082,651,056 541,139,178 1,623,790,234
Accumulated depreciation:
As at January 1, 2001 14,751,839 224,240,949 238,992,788
Net charges for 2001 20,979,586 53,893,923 74,873,509
As at December 31, 2001 35,731,425 278,134,872 313,866,297
Net book values:
As at December 31, 2000 1,063,614,711 193,175,326 1,256,790,037
As at December 31, 2001 1,046,919,631 263,004,306 1,309,923,937
7. OTHER ASSETS
2001 - G$7,427,788,846 2000 - G$2,616,353,292
This amount includes income accrued on investments, cost of Bank of Guyana notes and coins not yet written
off, balance owed by GEA for fuel shipments and sundry other assets.
8. INTERNATIONAL FINANCIAL INSTITUTIONS AND CENTRAL BANKS
2001 - G$31,617,711,104 2000 - G$36,059,553,943
Included in this amount are Guyana's drawing from the International Monetary Fund, deposits of the accounts
of International Bank for Reconstruction and Development, the Inter-American Development Bank, the
Caribbean Development Bank and Foreign Central Banks.

536
9. OTHER DEPOSITS
2001 - G$3,609,296,107 2000 - G$10,431,792,360
Included in this amount are deposits of the National Insurance Scheme, the Bank of Guyana Pension Scheme,
deposits held under the External Payments Arrears Schemes and sundry other deposits.
10. ALLOCATION OF SPECIAL DRAWING RIGHTS
2001 - G$3,430,098,465 2000 - G$3,493,384,688
This amount represents the liability in respect of special drawing rights allocated to Guyana as at 31
December 2001, valued at the equivalent Guyana dollar rate for the SDR computed through the
SDR/US dollar rate at 31 December, 2001.
11. OTHER LIABILITIES
2001 2000
G$ G$
Included are:
Accruals 231,597,514 240,200,564
Uncleared Cheques 87,220,541 164,231,099
Others 1,879,511 30,798,155
12. SHARE CAPITAL
2001 2000
G$ G$
Authorised 1,000,000,000 1,000,000,000
Issued and fully paid 1,000,000,000 1,000,000,000
As provided for under Section 6 of the Bank of Guyana Act 1998, No. 19 of 1998, the Bank’s authorised
capital has been increased to one thousand million Guyana dollars. Government has paid the entire amount
of the authorised capital.
13. CONTINGENCY RESERVE
2001 - G$2,369,683,011 2000 - G$9,346,381,257
This amount represents a provision made to meet adverse exchange rates/movements in the regime
of floating rates.

54 7
14. NET PROFIT / (LOSS) FOR THE YEAR
2001 - G$532,754,148 2000 - G$914,456,731
In accordance with Bank of Guyana Act 1998, No. 19 of 1998, Section 7(1), 10% of the net profit
for the year has been transferred to the General Reserve Fund. The remainder will be paid to the
Accountant General for credit to the Consolidated Fund of Guyana.

55
STATISTICAL ANNEXE
1. MONETARY AUTHORITY
1-I Bank of Guyana: Assets
1-II Bank of Guyana: Liabilities
1-III Bank of Guyana: Currency Notes Issue
1-IV Bank of Guyana: Coins Issue
2. COMMERCIAL BANKS
2-I(a) Commercial Banks: Assets
2-I(b) Commercial Banks: Liabilities, Capital and Reserves
2-II Commercial Banks: Total Deposits
2-III Commercial Banks: Demand Deposits
2-IV Commercial Banks: Time Deposits
2-V Commercial Banks: Savings Deposits
2-VI Commercial Banks: Time Deposits by Maturity
2-VII Commercial Banks: Debits and Credits on Savings Accounts
2-VIII Commercial Banks: Debits on Chequing Accounts
2-IX Commercial Banks: Clearing Balances
2-X Commercial Banks: Total Loans and Advances
2-XI Commercial Banks: Demand Loans and Advances
2-XII Commercial Banks: Term Loans and Advances
2-XIII(a) Commercial Banks: Loans and Advances to Residents by Sector
2-XIII(b) Commercial Banks: Loans and Advances to Residents by Sector
2-XIII(c) Commercial Banks: Loans and Advances to Residents by Sector
2-XIII(d) Commercial Banks: Loans and Advances to Residents by Sector
2-XIII(e) Commercial Banks: Loans and Advances to Residents by Sector
2-XIV Commercial Banks: Liquid Assets
2-XV Commercial Banks: Minimum Reserve Requirements
3. BANKING SYSTEM
3-I Monetary Survey
4. MONEY AND CAPITAL MARKET RATES
4-I Guyana: Selected Interest Rates
4-II Commercial Banks: Selected Interest Rates
4-III Comparative Treasury Bill Rates and Bank Rates

5. NON-BANK FINANCIAL INSTITUTIONS
5-I The New Building Society: Assets and Liabilities
5-II(a) Trust Companies: Assets
5-II(b) Trust Companies: Liabilities
5-II(c) Finance Companies: Assets
5-II(d) Finance Companies: Liabilities
5-III(a) Domestic Life Insurance Companies: Assets and Liabilities
5-III(b) Domestic Non Life Insurance Companies: Assets and Liabilities
5-III(c) Domestic Consolidated Insurance Companies: Assets and Liabilities
5-IV Pension Schemes: Assets and Liabilities
5-V Guyana Co-operative Agricultural and Industrial Development Bank: Assets and
Liabilities
5-VI Guyana Co-operative Mortgage Finance Bank: Assets and Liabilities
6. PUBLIC FINANCE
6-I Central Government: Finances (Summary)
6-II Central Government: Current Revenue
6-III Central Government: Current Expenditure
6-IV Summary of Public Corporations Finances
7. PUBLIC DEBT
7-I Domestic Public Debt
7-II Government of Guyana: Domestic Debt by Holders and Instruments
7-III Government of Guyana: Domestic Debt by Holders and Instruments
7-IV Government of Guyana: Debentures By Maturity and Terms
7-V External Public Debt
8. INTERNATIONAL TRADE AND PAYMENTS
8-I Balance of Payments
8-II International Reserves and Foreign Assets
8-III Imports by End-Use (Summary)
8-IV(a) Domestic Exports (G$)
8-IV(b) Domestic Exports (US$)
8-V Visible Trade
9. FOREIGN EXCHANGE RATES AND COMMODITY PRICES
9-I Changes in Bank of Guyana Transaction Exchange Rate
9-II Exchange Rate (G$/US$)

9-III(a) Foreign Exchange Market (CAMBIO) Purchases by Currency and by Dealers
9-III(b) Foreign Exchange Market (CAMBIO) Sales by Currency and by Dealers
9-IV Commodity Prices
10. DOMESTIC PRODUCT INCOME AND EXPENDITURE
10-I Gross Domestic Product, Income and Expenditure (At Current Prices)
10-II Gross Domestic Product (At 1988 Prices)
11. OTHER GENERAL ECONOMIC INDICATORS
11-I Indices of Output of Selected Commodities
11-II Electricity Production
11-III New Registration of Motor Vehicles
11-IV Guyana: Urban Consumer Price Index
11-V Georgetown: Urban Consumer Price Index
11-VI Population and Labor Force

1990 40861.6 1296.8 - 1232.2 64.6 - 6270.2 458.5 1662.4 4149.3 34.5 25034.1 8226.0
1991 83979.8 15269.4 - 3599.2 165.1 11505.1 3046.4 221.2 5.5 2819.7 - 64825.1 838.9
1992 133925.3 24102.1 - 7129.0 41.5 16931.6 243.0 174.8 68.2 - - 107704.9 1875.3
1993 142827.3 31507.9 22.8 5852.4 0.1 25632.7 863.1 174.8 688.3 - - 107704.9 2751.4
1994 159505.7 35638.3 224.4 5208.9 10.1 30194.9 2538.1 174.8 2363.3 - - 115904.7 5424.6
1995 176847.6 37871.0 180.0 9311.0 21.1 28358.9 514.6 174.8 339.8 - - 134848.9 3613.1
1996 145157.7 46879.5 602.3 9275.6 15.1 36986.5 795.1 - 795.1 - - 94848.7 2634.4
1997 122797.7 44978.2 3537.3 14370.5 28.1 27042.3 238.4 - 238.4 - - 75043.8 2537.3
1998 118159.0 45162.7 3441.0 13072.8 33.6 28615.3 1020.3 - 1020.3 - - 67960.7 4015.4
1999 126515.8 48305.1 - 19551.9 220.9 28532.3 1567.0 - 1567.0 - - 68723.3 7920.4
2000 130940.3 54654.7 39.1 29260.4 1687.8 23667.4 2178.2 - 2178.2 - - 68268.5 5839.0
2001 113735.4 54014.8 233.4 30672.1 463.1 22646.2 1022.5 - 1022.5 - - 47992.7 10705.4
1998
Mar 122006.5 44449.6 3330.4 14759.0 49.4 26310.9 437.8 - 437.8 - - 75043.8 2075.4
Jun 118837.1 40456.7 3501.2 9861.9 780.0 26313.6 993.2 - 993.2 - - 75043.8 2343.4
Sep 120780.6 42573.0 3405.7 18517.2 17.7 20632.4 1000.0 - 1000.0 - - 75043.8 2163.8
Dec 118159.0 45162.7 3441.0 13072.8 33.6 28615.3 1020.3 - 1020.3 - - 67960.7 4015.4
1999
Mar 116264.2 40212.3 308.4 16985.5 43.8 22874.7 2730.7 - 2730.7 - - 68955.4 4365.8
Jun 119159.1 43533.3 464.2 19761.4 434.2 22873.5 1322.8 - 1322.8 - - 68955.4 5347.6
Sep 119837.5 43930.1 0.0 21051.3 20.9 22857.9 1032.8 - 1032.8 - - 68955.4 5919.2
Dec 126515.8 48305.1 0.0 19551.9 220.9 28532.3 1567.0 - 1567.0 - - 68723.3 7920.4
2000
Jan 124901.5 49227.9 81.6 19251.9 490.4 29404.0 1315.0 - 1315.0 - - 68723.3 5635.3
Feb 125925.2 50552.9 34.3 20835.5 289.6 29393.6 1023.7 - 1023.7 - - 68723.3 5625.3
Mar 126499.6 50512.7 98.6 19855.4 289.6 30269.2 1518.4 - 1518.4 - - 68723.3 5745.3
Apr 128693.8 51992.3 140.0 20991.9 599.3 30261.1 2687.8 - 2687.8 - - 68723.3 5290.4
May 126115.2 50602.6 196.9 15619.0 228.2 34558.5 1300.3 - 1300.3 - - 68723.3 5489.0
Jun 126614.1 50712.6 0.0 17613.6 170.1 32928.9 1139.1 - 1139.1 - - 68723.3 6039.2
Jul 125495.7 50891.5 73.2 18617.4 174.0 32026.9 1066.5 - 1066.5 - - 68723.3 4814.4
Aug 126276.6 51785.4 124.0 21311.0 140.7 30209.8 1066.5 - 1066.5 - - 68723.3 4701.4
Sep 126285.3 52199.9 216.2 21315.6 140.7 30527.6 1025.7 - 1025.7 - - 68723.3 4336.4
Oct 125631.9 51912.9 299.7 25079.2 281.7 26252.3 1022.7 - 1022.7 - - 68723.3 3973.0
Nov 124140.6 50722.9 357.8 20406.2 1746.4 28212.5 1022.7 - 1022.7 - - 68723.3 3671.7
Dec 130940.3 54654.7 39.1 29260.4 1687.8 23667.4 2178.2 - 2178.2 - - 68268.5 5839.0
2001
Jan 128241.8 54226.5 129.4 28545.3 1687.8 23864.0 1510.9 - 1510.9 - - 68268.5 4235.9
Feb 125870.8 52687.6 203.3 26886.2 1689.5 23908.5 1173.3 - 1173.3 - - 68268.5 3741.5
Mar 126693.3 53137.6 283.2 27262.0 1662.6 23929.7 1023.9 - 1023.9 - - 68268.5 4263.4
Apr 126382.0 52628.5 345.0 26657.2 1645.4 23980.9 1023.6 - 1023.6 - - 68268.5 4461.4
May 128158.7 52391.9 106.9 26709.2 1559.1 24016.8 2643.7 - 2643.7 - - 68268.5 4854.7
Jun 124948.8 50804.7 71.7 25431.6 1272.9 24028.5 1316.7 - 1316.7 - - 68268.5 4558.9
Jul 123758.1 49997.3 91.3 27281.2 1272.9 21351.9 1024.6 - 1024.6 - - 68268.5 4467.8
Aug 124410.9 50513.5 151.3 34462.5 1117.5 14782.1 1041.8 - 1041.8 - - 68268.5 4587.1
Sep 124847.3 51084.6 38.8 34865.3 1186.3 14994.2 1488.9 - 1488.9 - - 68268.5 4005.3
Oct 126305.2 52951.4 107.6 28246.8 1049.6 23547.4 1068.6 - 1068.6 - - 68268.5 4016.8
Nov 127573.6 53970.6 164.7 30187.6 981.6 22636.7 1031.3 - 1031.3 - - 68268.5 4303.2
Dec 113735.4 54014.8 233.4 30672.1 463.1 22646.2 1022.5 - 1022.5 - - 47992.7 10705.4
Source: Bank of Guyana
Note: Figures for Dec. 2001 were revised to reflect audited accounts of Bank of Guyana.
TABLE 1-IBANK OF GUYANA: ASSETS
(G$ Million)
Total Gold
Total
Assets
Foreign Assets
T/Bills Other
Other
Non -
Interest
Debenture
Money
Market
Securities
Advance
to BanksTotal
Claims on Central Government
Back to Annexe
End of
Period Advances
Balances
with
Banks
SecuritiesSDR
Holdings

EPDS Other
1990 40861.6 2406.6 2391.2 15.4 27486.6 0.0 25774.8 916.0 686.4 109.4 4.3 7905.1 630.1 2428.9
1991 83979.8 4007.4 3991.0 16.4 87478.5 0.0 80342.7 745.9 5513.8 876.1 4.3 12285.4 2551.3 -22347.1
1992 133925.3 5468.2 5451.0 17.2 98905.3 1308.8 85693.4 516.8 9612.2 1774.1 4.3 18820.5 2467.9 8259.1
1993 142827.3 6940.7 6922.9 17.8 112499.9 15374.2 89021.9 367.7 4497.5 3238.7 4.3 19706.6 2605.9 1069.9
1994 159505.7 8757.7 8739.6 18.1 123459.1 22259.5 93382.2 334.2 6973.3 509.9 4.3 19367.9 2808.8 5108.0
1995 176847.6 9606.6 9588.3 18.3 133028.1 20113.7 102022.5 330.8 9407.5 1153.5 4.3 18234.0 3274.1 12700.6
1996 145157.7 11285.0 11209.2 75.8 103909.9 29416.5 65791.5 329.7 9121.2 -749.0 4.3 18212.3 2955.0 8791.2
1997 122797.7 12469.8 12331.8 138.0 80917.9 26935.3 44266.7 317.6 11502.3 -2104.0 4.3 18141.2 2822.4 8442.2
1998 118159.0 12517.0 12347.1 169.9 75507.7 21461.5 40663.1 310.2 14344.6 -1271.8 1000.0 18258.1 2838.2 8038.0
1999 126515.8 15620.3 15413.7 206.6 84906.9 33448.9 40368.5 77.0 10418.5 594.1 1000.0 18126.3 3480.0 3382.3
2000 130940.3 16215.2 15969.0 246.2 88090.4 38037.4 36059.6 75.6 13495.4 422.4 1000.0 19241.1 3493.4 2900.3
2001 113735.4 16808.6 16526.1 282.6 85856.5 36292.1 31617.7 62.2 15727.7 2156.7 1000.0 4197.8 3430.1 2442.3
1998
Mar 122006.5 10771.0 10626.3 144.7 81832.4 28888.2 42743.9 317.1 11991.8 -2108.6 4.3 18335.9 2822.4 8240.5
Jun 118837.1 10449.9 10300.4 149.5 78819.8 25300.5 42300.7 312.8 11832.6 -926.9 4.3 18455.1 2838.2 8269.7
Sep 120780.6 10676.1 10516.9 159.2 80776.7 25596.5 42843.0 312.4 13141.1 -1116.3 4.3 18921.5 2838.2 7563.8
Dec 118159.0 12517.0 12347.1 169.9 75507.7 21461.5 40663.1 310.2 14344.6 -1271.8 1000.0 18258.1 2838.2 8038.0
1999
Mar 116264.2 11545.4 11370.5 174.9 75693.7 24023.0 40952.2 309.8 9347.2 1061.6 1000.0 18659.9 2866.6 6498.7
Jun 119159.1 11401.5 11218.8 182.8 83391.9 22753.8 46503.5 148.2 13313.4 673.0 1000.0 18409.0 2866.6 2090.1
Sep 119837.5 11403.6 11208.2 195.4 83463.9 29111.6 40766.9 89.1 12943.1 553.2 1000.0 18903.0 2866.6 2200.4
Dec 126515.8 15620.3 15413.7 206.6 84906.9 33448.9 40368.5 77.0 10418.5 594.1 1000.0 18126.3 3480.0 3382.3
2000
Jan 124901.5 12176.7 11968.0 208.7 86538.3 34932.5 39432.5 77.0 12169.2 -73.0 1000.0 18228.9 3480.0 3477.6
Feb 125925.2 11792.1 11582.7 209.4 88750.3 36083.6 39181.7 77.0 12288.1 1120.0 1000.0 18272.1 3480.0 2630.7
Mar 126499.6 12111.8 11899.5 212.3 89187.9 37509.3 39011.3 76.3 11527.7 1063.3 1000.0 18399.5 3480.0 2320.5
Apr 128693.8 13191.1 12976.3 214.8 89266.0 36948.3 38118.0 76.3 13120.5 1002.9 1000.0 18110.2 3480.0 3646.5
May 126115.2 12485.3 12266.6 218.7 88947.7 37148.7 37751.9 76.3 12506.2 1464.6 1000.0 18211.6 3493.4 1977.2
Jun 126614.1 12552.2 12330.0 222.2 88675.1 37077.5 37355.9 76.3 12551.4 1614.0 1000.0 18677.7 3493.4 2215.7
Jul 125495.7 12547.3 12321.9 225.4 87696.2 35639.0 36444.8 76.3 13995.7 1540.4 1000.0 18894.6 3493.4 1864.3
Aug 126276.6 12725.5 12496.1 229.4 87545.7 34710.5 36421.5 76.3 14996.4 1341.1 1000.0 19057.1 3493.4 2455.0
Sep 126285.3 12680.2 12446.8 233.4 87601.3 35634.1 36385.6 76.3 14022.4 1483.0 1000.0 19394.7 3493.4 2115.7
Oct 125631.9 13621.8 13385.6 236.2 86364.2 35509.8 35172.7 76.1 15334.0 271.5 1000.0 19181.7 3493.4 1970.9
Nov 124140.6 13597.8 13357.3 240.5 84894.3 34844.3 36717.3 75.6 13357.3 -100.2 1000.0 19333.3 3493.4 1821.8
Dec 130940.3 16215.2 15969.0 246.2 88090.4 38037.4 36059.6 75.6 13495.4 422.4 1000.0 19241.1 3493.4 2900.3
2001
Jan 128241.8 13665.2 13417.5 247.7 88148.6 36519.2 36173.3 75.6 14961.0 419.5 1000.0 19312.2 3493.4 2622.5
Feb 125870.8 13524.7 13276.9 247.8 85868.4 35489.9 35961.7 75.6 14729.4 -388.2 1000.0 19430.5 3493.4 2553.8
Mar 126693.3 14016.2 13766.2 250.0 85558.3 36966.8 35944.7 75.5 12763.0 -191.8 1000.0 19679.3 3493.4 2946.2
Apr 126382.0 14623.1 14370.4 252.7 85012.6 36020.0 34791.3 75.5 14069.9 55.9 1000.0 19583.0 3493.4 2670.0
May 128158.7 13631.4 13375.3 256.1 87414.6 38391.4 34615.9 75.5 13863.7 468.1 1000.0 19711.4 3493.4 2908.0
Jun 124948.8 13317.8 13060.0 257.9 85579.5 37036.0 33621.3 75.5 14610.1 236.6 1000.0 19820.5 3493.4 1737.6
Jul 123758.1 13507.3 13246.1 261.2 84202.5 36015.9 33695.0 62.3 14542.5 -113.1 1000.0 19983.6 3493.4 1571.4
Aug 124410.9 13435.6 13170.8 264.8 84533.2 35409.8 33318.7 62.3 15841.1 -98.8 1000.0 20063.6 3493.4 1885.1
Sep 124847.3 13613.9 13344.8 269.1 84822.4 36125.9 33685.8 62.3 14999.9 -51.4 1000.0 20234.5 3493.4 1683.1
Oct 126305.2 14171.8 13898.9 272.9 85976.1 38158.0 32484.0 62.3 15064.2 207.6 1000.0 19927.8 3493.4 1736.2
Nov 127573.6 14955.3 14678.5 276.8 86342.4 37678.7 32207.9 62.3 16415.2 -21.7 1000.0 19992.2 3493.4 1790.3
Dec 113735.4 16808.6 16526.1 282.6 85856.5 36292.1 31617.7 62.2 15727.7 2156.7 1000.0 4197.8 3430.1 2442.3
Source: Bank of Guyana
Note: Figures for Dec. 2001 were revised to reflect audited accounts of Bank of Guyana.
Other
Other
Liabilities
Allocation
of SDRsAuthorised
Share
Capital
Other
Reserves
BanksEnd of
Period
Total
Liabilities Total Notes Coins Total Gov'tInt'l
Orgs.
TABLE 1-II
BANK OF GUYANA: LIABILITIES
(G$ Million)
Currency Deposits
Back to Annexe
Capital & Reserves

1990 2391.2 - - - - 1446.7 60.5 900.4 37.7 15.1 0.6 14.0 0.6 15.0 0.6
1991 3991.0 - - - - 3008.1 75.4 929.0 23.3 18.7 0.5 17.8 0.4 17.4 0.4
1992 5451.0 - - 3581.4 65.7 1636.8 30.0 169.3 3.1 23.3 0.4 21.0 0.4 19.2 0.4
1993 6922.9 - - 5919.7 85.5 774.8 11.2 150.5 2.2 31.1 0.4 24.9 0.4 21.9 0.3
1994 8739.6 - - 7956.5 91.0 539.8 6.2 155.7 1.8 36.9 0.4 27.2 0.3 23.5 0.3
1995 9588.3 - - 8856.5 92.4 475.6 5.0 160.3 1.7 40.1 0.4 30.2 0.3 25.6 0.3
1996 11209.2 915.7 8.2 9425.5 84.1 657.6 5.9 156.4 1.4 19.3 0.2 16.1 0.1 18.6 0.2
1997 12331.8 8679.4 70.4 3027.2 24.5 456.1 3.7 169.1 1.4 - - - - - -
1998
Mar 10526.1 7881.8 75.1 2036.2 19.2 443.9 4.2 164.2 1.5 - - - - - -
Jun 10300.5 7953.3 77.2 1761.3 17.1 422.1 4.1 163.8 1.6 - - - - - -
Sep 10516.9 8256.9 78.5 1654.4 15.7 436.9 4.2 168.7 1.6 - - - - - -
Dec 12347.0 10099.2 81.8 1587.5 12.9 480.4 3.9 179.8 1.5 - - - - - -
1999
Mar 11370.5 9404.2 82.7 1336.2 11.8 450.7 4.0 179.4 1.6 - - - - - -
Jun 11218.8 9340.5 83.3 1240.4 11.1 458.7 4.1 179.1 1.6 - - - - - -
Sep 11208.0 9465.8 84.5 1077.6 9.6 479.6 4.3 184.9 1.7 - - - - - -
Dec 15413.7 13506.4 87.6 1140.8 7.4 561.2 3.6 205.3 1.3 - - - - - -
2000
Jan 11968.0 10295.2 86.0 967.9 8.1 510.8 4.3 194.1 1.6 - - - - - -
Feb 11582.7 9957.5 86.0 941.4 8.1 494.5 4.3 189.3 1.6 - - - - - -
Mar 11899.5 10277.9 86.4 933.2 7.8 497.6 4.2 190.7 1.6 - - - - - -
Apr 12976.3 11318.3 87.2 943.6 7.3 519.5 4.0 194.9 1.5 - - - - - -
May 12266.6 10664.5 86.9 907.4 7.4 502.3 4.1 192.3 1.6 - - - - - -
Jun 12330.0 10714.1 86.9 914.0 7.4 508.5 4.1 193.3 1.6 - - - - - -
Jul 12321.9 10721.9 87.0 896.8 7.3 509.0 4.1 194.3 1.6 - - - - - -
Aug 12505.4 10880.5 87.0 908.3 7.3 518.6 4.1 198.1 1.6 - - - - - -
Sep 12446.8 10761.7 86.5 969.5 7.8 518.2 4.2 197.4 1.6 - - - - - -
Oct 13385.6 11232.3 83.9 1436.6 10.7 518.0 3.9 198.7 1.5 - - - - - -
Nov 13357.3 10977.0 82.2 1662.1 12.4 518.5 3.9 199.7 1.5 - - - - - -
Dec 15969.0 12777.5 80.0 2411.3 15.1 567.6 3.6 212.6 1.3 - - - - - -
2001
Jan 13417.5 11026.1 82.2 1674.1 12.5 514.3 3.8 202.9 1.5 - - - - - -
Feb 13276.9 11160.4 84.1 1389.2 10.5 522.1 3.9 205.1 1.5 - - - - - -
Mar 13766.2 11762.9 85.4 1279.7 9.3 518.5 3.8 205.1 1.5 - - - - - -
Apr 14370.4 12119.6 84.3 1529.2 10.6 516.6 3.6 204.9 1.4 - - - - - -
May 13375.3 11386.1 85.1 1261.1 9.4 521.6 3.9 206.5 1.5 - - - - - -
Jun 13060.0 11217.5 85.9 1123.0 8.6 515.1 3.9 204.4 1.6 - - - - - -
Jul 13246.1 11473.9 86.6 1044.0 7.9 522.0 3.9 206.3 1.6 - - - - - -
Aug 13170.8 11452.8 87.0 970.8 7.4 536.1 4.1 211.1 1.6 - - - - - -
Sep 13344.8 11655.0 87.3 940.3 7.0 538.6 4.0 210.9 1.6 - - - - - -
Oct 13898.9 12226.2 88.0 915.7 6.6 545.9 3.9 211.1 1.5 - - - - - -
Nov 14678.5 12989.1 88.5 909.4 6.2 563.7 3.8 216.3 1.5 - - - - - -
Dec 16526.1 14748.8 89.2 940.5 5.7 609.3 3.7 227.5 1.4 - - - - - -
Source: Bank of Guyana
G$Mn.
Back to Annexe
% of
Total
Issue
% of
Total
Issue
% of
Total
Issue
% of
Total
Issue
% of
Total
Issue
% of
Total
Issue
Denominations
Total
Issue
G$Mn.
TABLE 1-IIIBANK OF GUYANA: CURRENCY NOTES ISSUE
Period
$1$5$10$20
G$Mn.G$Mn.G$Mn.
$100$500$1000
G$Mn.G$Mn.
% of
Total
Issue
G$Mn.

$10 * $5 * $1 * 50c 1
25c 1
10c 1
5c 1
1c 1
1990 15354 4 2 344 199 7947 3475 1758 1625
1991 16391 4 2 389 199 8598 3682 1869 1648
1992 17246 4 2 429 198 9131 3873 1942 1667
1993 17803 4 2 460 198 9503 3982 1972 1682
1994 18127 4 2 488 198 9717 4041 1987 1690
1995 18280 4 2 489 198 9829 4067 1996 1695
1996 92570 40450 25443 9875 193 9151 3867 1914 1678
1997 137965 70226 46658 21081 - - - - -
1998
Mar 144723 71035 48765 24923 - - - - -
Jun 149518 73167 51673 24678 - - - - -
Sep 159151 76991 55624 26536 - - - - -
Dec 169945 81041 59810 29094 - - - - -
1999
Mar 174878 82145 62278 30456 - - - - -
Jun 182756 85107 65097 32552 - - - - -
Sep 195391 91070 69452 34869 - - - - -
Dec 206597 95769 73722 37106 - - - - -
2000
Jan 208660 96384 74519 37757 - - - - -
Feb 209390 96539 74988 37863 - - - - -
Mar 212321 97435 75811 39075 - - - - -
Apr 214811 98158 77000 39653 - - - - -
May 218704 100175 78376 40154 - - - - -
Jun 222160 101537 79521 41102 - - - - -
Jul 225351 102757 80995 41600 - - - - -
Aug 229369 104316 82557 42496 - - - - -
Sep 233413 106125 84196 43091 - - - - -
Oct 236156 107124 85315 43717 - - - - -
Nov 240458 109234 86787 44438 - - - - -
Dec 246192 111768 89033 45392 - - - - -
2001
Jan 247705 111986 89924 45796 - - - - -
Feb 247787 111321 90099 46367 - - - - -
Mar 249978 112414 90843 46721 - - - - -
Apr 252667 113190 91929 47548 - - - - -
May 256098 114631 93008 48459 - - - - -
Jun 257849 115128 93886 48834 - - - - -
Jul 261184 116650 95112 49421 - - - - -
Aug 264848 118398 96288 50162 - - - - -
Sep 269057 120234 98099 50724 - - - - -
Oct 272899 121932 99375 51592 - - - - -
Nov 276808 123440 101033 52335 - - - - -
Dec 282587 125847 103447 53293 - - - - -
Source: Bank of Guyana
* Includes new coins in circulation effective from May 19961 Coins which cease to be legal tender from May 26,1996
D e n o m i n a t i o n sPeriod
Total
Issue
TABLE 1-IVBANK OF GUYANA: COINS ISSUE
(G$ Thousand)Back to Annexe

Foreign Sector Public Sector Bank of Guyana
Balances Loans Central Government External
due from to Payment
banks Non- Deposits
abroad Residents
1990 14,302,750 2,545,069 2,118,296 12,962 413,811 4,878,244 4,111,272 4,075,721 35,551 754,907 12,065 1,314 4,111,196 1,802,424 691,206 915,174 196,044 964,503
1991 24,910,878 2,408,519 2,318,333 5,603 84,583 7,598,155 7,225,214 7,184,092 41,122 358,905 14,036 62,147 6,620,195 6,628,783 5,586,242 745,829 296,712 1,593,079
1992 38,827,729 3,759,056 3,265,135 308,281 185,640 13,161,583 12,281,958 12,241,762 40,196 834,995 44,630 4,836 8,680,234 10,548,072 9,656,822 516,832 374,418 2,673,948
1993 43,505,689 3,189,834 2,537,766 497,884 154,184 20,587,635 20,063,953 20,026,689 37,264 470,573 53,109 28,147 10,206,420 5,503,447 4,674,672 367,768 461,007 3,990,206
1994 46,935,090 3,546,024 2,382,025 1,042,916 121,083 15,875,284 15,649,875 15,617,362 32,513 187,971 37,438 13,205 13,799,057 8,170,799 7,245,260 334,197 591,342 5,530,721
1995 57,578,255 3,798,211 2,559,528 981,153 257,530 15,540,327 14,847,473 14,814,142 33,331 409,676 283,178 73,145 20,656,770 10,326,443 9,355,904 330,499 640,040 7,183,359
1996 77,768,567 3,750,319 2,452,469 830,484 467,366 17,645,014 17,250,375 17,221,840 28,535 254,461 140,178 183,283 35,864,027 10,729,376 9,056,502 329,659 1,343,215 9,596,548
1997 89,290,729 3,497,458 2,152,522 1,280,260 64,676 19,644,894 18,025,420 18,024,933 487 216,218 1,403,256 118,154 42,920,893 13,315,475 11,720,910 317,585 1,276,980 9,793,855
1998
Mar 90,958,114 3,719,837 2,189,680 775,989 754,168 20,507,767 19,026,476 19,025,787 689 248,437 1,232,854 91,894 43,682,888 13,501,203 12,183,948 317,300 999,955 9,454,525
Jun 90,126,037 3,613,907 2,173,357 586,432 854,118 19,006,167 17,410,928 17,408,688 2,240 378,584 1,216,655 412,153 45,102,924 13,193,822 11,953,299 312,833 927,690 8,797,064
Sep 94,084,695 3,105,331 1,952,434 424,884 728,013 19,645,830 17,892,916 17,890,634 2,282 425,452 1,327,462 135,092 47,470,062 14,811,213 13,436,430 312,434 1,062,349 8,917,167
Dec 100,494,733 3,969,361 2,693,500 570,119 705,742 18,151,096 15,850,882 15,850,241 641 410,206 1,890,008 195,051 48,872,172 16,069,725 14,576,155 310,233 1,183,337 13,237,328
1999
Mar 99,990,802 6,352,060 4,611,023 694,532 1,046,505 18,894,866 16,675,029 16,674,388 641 339,829 1,880,008 34,344 50,660,031 10,842,235 9,531,786 309,822 1,000,627 13,207,266
Jun 102,530,024 5,515,812 4,396,422 433,415 685,975 17,877,901 16,134,557 16,134,193 364 319,463 1,423,881 36,986 50,916,675 14,756,152 13,539,256 148,177 1,068,719 13,426,498
Sep 103,130,793 5,550,001 3,563,836 644,937 1,341,228 17,604,263 15,673,807 15,673,805 2 482,586 1,447,870 525,007 51,111,230 14,509,493 13,307,793 89,144 1,112,556 13,830,799
Dec 104,127,717 7,893,742 4,959,704 419,616 2,514,422 15,454,043 13,345,716 13,345,478 238 682,976 1,425,351 568,594 52,165,992 12,418,927 10,143,167 76,972 2,198,788 15,626,419
2000
Jan 103,194,012 6,459,354 4,633,915 379,766 1,445,673 15,721,056 13,960,930 13,960,860 70 386,139 1,373,987 552,799 51,763,548 13,722,359 12,491,619 76,972 1,153,768 14,974,896
Feb 104,898,647 6,810,649 5,005,212 357,653 1,447,784 17,660,426 15,857,714 15,857,174 540 429,006 1,373,706 533,560 51,570,667 13,661,169 12,415,067 76,972 1,169,130 14,662,176
Mar 106,667,900 7,406,401 5,583,013 278,246 1,545,142 18,092,616 15,444,370 15,440,810 3,560 519,917 2,128,329 571,845 51,724,819 12,511,066 11,461,151 76,272 973,643 16,361,153
Apr 106,808,702 8,421,614 6,587,022 175,905 1,658,687 16,129,738 13,801,384 13,801,209 175 400,726 1,927,628 574,961 51,243,205 14,604,092 13,399,424 76,272 1,128,396 15,835,092
May 106,762,388 8,078,231 6,095,958 193,706 1,788,567 16,644,897 14,369,036 14,368,828 208 448,013 1,827,848 545,932 51,527,461 13,835,474 12,584,377 76,272 1,174,825 16,130,393
Jun 2
107,520,493 8,553,507 6,541,277 236,338 1,775,892 16,566,886 14,322,151 14,321,155 996 417,002 1,827,733 604,433 51,140,977 13,687,864 12,636,138 76,272 975,454 16,966,826
Jul 109,516,446 9,663,321 6,651,753 399,782 2,611,786 16,425,602 14,098,729 14,098,643 86 449,140 1,877,733 521,964 51,294,266 15,919,253 14,693,776 76,272 1,149,205 15,692,040
Aug 111,206,376 9,541,520 6,431,362 405,658 2,704,500 17,787,068 14,957,863 14,957,684 179 447,953 2,381,252 508,604 51,005,716 16,790,308 15,408,728 76,272 1,305,308 15,573,160
Sep 111,461,396 7,849,019 4,885,507 422,073 2,541,439 19,471,717 16,625,433 16,625,302 131 464,877 2,381,407 510,353 52,194,629 15,120,750 14,196,164 76,268 848,318 16,314,928
Oct 115,353,729 7,214,694 4,422,146 364,714 2,427,834 21,790,235 18,975,663 18,947,012 28,651 430,107 2,384,465 491,334 52,368,461 16,856,070 15,342,504 76,132 1,437,434 16,632,935
Nov 117,652,344 8,114,862 4,843,141 413,359 2,858,362 24,861,931 21,818,157 21,817,634 523 589,277 2,454,497 500,246 53,020,669 14,676,518 13,375,768 75,608 1,225,142 16,478,118
Dec 117,615,917 7,849,767 4,553,178 389,440 2,907,149 23,193,719 20,264,178 20,264,138 40 419,617 2,509,924 659,748 53,152,297 15,509,505 13,713,790 75,608 1,720,107 17,250,881
2001
Jan 119,350,532 8,034,326 4,162,217 957,945 2,914,164 24,835,401 21,577,179 21,577,176 3 462,712 2,795,510 527,863 52,631,433 16,191,764 14,770,991 75,608 1,345,165 17,129,745
Feb 118,444,944 8,855,780 4,834,048 1,132,979 2,888,753 23,467,333 19,618,638 19,618,610 28 718,320 3,130,375 511,044 52,673,463 16,053,601 14,551,417 75,608 1,426,576 16,883,723
Mar 118,307,791 8,422,518 4,561,797 986,478 2,874,243 25,456,664 21,703,080 21,700,125 2,955 630,851 3,122,733 676,573 52,186,795 13,954,816 12,724,171 75,524 1,155,121 17,610,425
Apr 119,227,029 8,445,940 4,587,571 965,529 2,892,840 24,678,009 20,851,289 20,851,252 37 703,987 3,122,733 601,787 52,271,141 15,527,567 14,069,093 75,524 1,382,950 17,702,585
May 118,194,983 8,521,324 4,536,885 925,292 3,059,147 24,767,839 20,969,022 20,968,818 204 547,354 3,251,463 600,188 51,920,213 15,173,440 13,776,838 75,524 1,321,078 17,211,979
Jun 118,978,236 9,208,151 5,184,779 942,241 3,081,131 24,074,562 19,563,086 19,562,945 141 656,754 3,854,722 681,002 51,697,505 15,692,006 14,577,426 75,524 1,039,056 17,625,010
Jul 118,880,199 8,790,493 4,805,576 812,369 3,172,548 23,749,762 19,457,436 19,457,089 347 437,227 3,855,099 504,666 52,171,461 15,900,187 14,549,759 62,293 1,288,135 17,763,630
Aug 120,638,868 8,055,914 3,942,252 867,480 3,246,182 24,034,782 19,116,628 19,116,516 112 562,673 4,355,481 486,571 52,380,828 17,390,032 16,304,928 62,293 1,022,811 18,290,741
Sep 120,530,657 9,166,486 5,056,227 842,816 3,267,443 25,586,853 20,029,168 20,029,168 - 703,203 4,854,482 518,182 50,737,642 16,277,840 15,167,737 62,293 1,047,810 18,243,654
Oct 120,800,710 9,234,754 5,025,144 849,762 3,359,848 25,758,996 20,055,033 20,054,885 148 849,041 4,854,922 460,651 50,885,453 16,553,671 15,011,408 62,293 1,479,970 17,907,185
Nov 122,676,327 9,377,334 5,012,346 777,892 3,587,096 25,376,088 19,944,874 19,944,833 41 604,731 4,826,483 458,090 50,858,497 17,727,110 16,437,205 62,293 1,227,612 18,879,208
Dec 124,325,837 9,305,756 4,693,479 956,811 3,655,466 26,835,512 20,766,067 20,766,067 - 851,603 5,217,842 463,662 50,159,569 18,340,127 16,607,502 62,239 1,670,386 19,221,211
Source: Commercial Banks1 Effective February 1996, the accounts of the commercial banks reflect the merged operations of GNCB with GAIBANK2 Central Government Securities for Jun 2000 ammended to reflect corrected balance.
Public
EnterprisesOther
Non-Bank
Fin. Instits.
Loans
Other
Private Sector
Loans &
Advances Total Deposits CurrencyTotalTotal Securities Loans
End of
Period
Total
Assets Total Other
Back to Annexe
(G$ Thousands)
TABLE 2-I(a)
COMMERCIAL BANKS: ASSETS 1

Foreign Sector Public Sector
Balances
due from
banks
abroad
1990 14,302,750 862,399 545,294 315,343 1,762 1,971,186 361,092 1,438,549 171,545 1,436,619 7,042,765 916,159 34,461 1,242,350 796,811
1991 24,910,878 917,297 499,296 418,001 - 3,640,352 868,018 2,546,255 226,079 2,840,363 12,160,468 745,829 - 2,555,966 2,050,603
1992 38,827,729 1,844,704 723,568 1,121,136 - 5,996,176 1,290,524 4,366,309 339,343 3,200,418 20,433,774 507,836 - 2,800,064 4,044,757
1993 43,505,689 2,080,916 273,681 1,807,235 - 6,443,172 2,668,913 3,233,900 540,359 2,895,143 26,456,983 359,395 - 1,609,841 3,660,239
1994 46,935,090 2,931,250 405,497 2,525,753 - 6,003,136 3,042,199 2,697,972 262,965 1,355,615 30,365,508 334,197 - 1,976,916 3,968,468
1995 57,578,255 2,883,269 278,596 2,604,673 - 4,695,213 1,996,039 2,495,427 203,747 1,827,478 39,634,076 330,499 - 2,815,855 5,391,865
1996 77,768,567 3,567,033 492,402 3,074,631 - 7,571,411 2,623,150 4,542,299 405,962 2,756,848 46,674,437 329,659 - 3,151,050 13,718,129
1997 89,290,729 4,963,726 782,677 4,181,049 - 9,631,037 2,302,744 3,834,771 3,493,522 3,777,663 52,116,931 317,585 - 3,429,724 15,054,063
1998
Mar 90,958,114 4,113,063 654,346 3,458,717 0 9,257,979 1,882,890 3,887,464 3,487,625 5,245,917 53,948,191 317,300 - 3,063,658 15,012,006
Jun 90,126,037 3,983,387 653,859 3,329,528 0 8,763,399 1,998,376 2,772,845 3,992,178 6,503,822 53,074,043 312,833 - 2,056,726 15,431,827
Sep 94,084,695 3,922,410 491,818 3,430,592 0 8,986,867 1,772,439 3,405,059 3,809,369 6,439,127 55,530,189 312,434 - 2,203,934 16,689,734
Dec 100,494,733 5,283,883 1,090,731 4,193,152 0 10,040,516 1,680,181 4,010,707 4,349,628 5,898,442 56,422,262 310,233 - 3,154,589 19,384,808
1999
Mar 99,990,802 6,063,881 1,518,397 4,545,484 0 9,635,509 2,287,910 3,719,169 3,628,430 4,808,112 56,439,010 309,822 - 2,503,412 20,231,056
Jun 102,530,024 6,074,400 1,139,799 4,934,601 0 10,269,999 2,571,875 5,603,879 2,094,245 5,402,534 58,345,705 148,177 - 1,880,789 20,408,420
Sep 103,130,793 6,001,710 839,667 5,162,043 0 9,836,495 3,359,992 4,200,617 2,275,886 6,338,373 58,231,155 89,144 - 1,700,045 20,933,871
Dec 104,127,717 4,662,897 767,983 3,894,914 0 7,270,542 3,789,090 3,301,907 179,545 5,796,269 62,152,230 76,972 - 2,692,217 21,476,590
2000
Jan 103,194,012 4,611,403 769,195 3,842,208 0 6,376,590 4,143,867 1,693,366 539,357 5,891,515 62,949,127 76,972 - 1,410,124 21,878,281
Feb 104,898,647 4,972,911 1,036,530 3,936,381 0 6,656,488 3,694,956 1,687,964 1,273,568 6,715,769 63,187,239 76,972 - 1,333,341 21,955,927
Mar 106,667,900 5,089,966 1,047,615 4,042,351 0 6,525,869 3,766,717 1,445,353 1,313,799 6,444,696 64,440,517 76,272 - 2,423,573 21,667,007
Apr 106,808,702 5,290,197 1,276,774 4,013,423 0 5,891,365 3,746,158 1,460,493 684,714 6,435,896 65,548,796 76,272 - 1,684,471 21,881,705
May 106,762,388 5,216,582 1,212,977 4,003,605 0 5,815,007 4,122,264 1,469,764 222,979 6,698,136 65,448,838 76,272 - 1,690,959 21,816,594
Jun 107,520,493 5,538,180 1,569,288 3,968,892 0 6,118,433 4,344,892 1,545,954 227,587 6,838,707 66,037,769 76,272 - 1,360,134 21,550,998
Jul 109,516,446 5,480,070 1,411,571 4,068,499 0 6,311,074 4,407,697 1,700,324 203,053 6,583,647 67,773,455 76,272 - 2,001,211 21,290,717
Aug 111,206,376 5,803,828 1,719,866 4,083,962 0 6,773,062 4,388,126 1,682,993 701,943 6,584,150 68,725,656 76,272 - 1,835,322 21,408,086
Sep 111,461,396 5,066,746 1,453,566 3,613,180 0 6,453,427 3,977,322 1,672,642 803,463 6,551,343 69,522,158 76,268 - 2,719,438 21,072,016
Oct 115,353,729 5,296,562 1,303,184 3,993,378 0 8,494,387 4,411,370 1,390,000 2,693,017 7,276,431 69,935,470 76,132 - 2,977,172 21,297,575
Nov 117,652,344 5,149,453 1,467,981 3,681,472 0 8,734,243 4,222,065 1,839,283 2,672,896 7,814,826 71,025,329 75,608 - 3,318,383 21,534,501
Dec 117,615,917 4,875,522 1,435,647 3,439,875 0 9,147,959 4,825,956 1,753,201 2,568,802 8,454,689 69,923,346 75,608 - 2,861,978 22,276,815
2001
Jan 119,350,532 5,066,498 1,472,748 3,593,750 - 8,979,641 6,037,486 1,387,498 1,554,657 7,840,454 72,381,943 75,608 - 2,738,923 22,267,465
Feb 118,444,944 4,618,018 1,224,868 3,393,150 - 7,512,537 3,849,827 1,976,757 1,685,953 8,068,597 73,131,220 75,608 - 2,671,737 22,367,227
Mar 118,307,791 4,635,168 1,416,855 3,218,313 - 6,969,099 3,862,328 1,499,353 1,607,418 8,168,691 73,073,622 75,524 - 3,011,314 22,374,373
Apr 119,227,029 4,477,381 1,256,159 3,221,222 - 6,451,206 3,576,934 1,341,524 1,532,748 8,030,936 74,253,019 75,524 - 3,338,225 22,600,738
May 118,194,983 4,177,018 1,113,290 3,063,728 - 5,680,321 3,520,668 1,407,339 752,314 8,972,982 73,789,187 75,524 - 2,770,715 22,729,236
Jun 118,978,236 4,636,415 1,433,092 3,203,323 - 5,413,518 3,389,937 1,311,033 712,548 9,293,830 74,300,948 75,524 - 2,509,193 22,748,808
Jul 118,880,199 4,947,950 1,169,265 3,778,685 - 4,964,424 3,344,345 1,301,026 319,053 9,094,233 73,588,237 62,293 - 2,760,634 23,462,428
Aug 120,638,868 4,844,645 1,141,665 3,702,980 - 5,727,517 3,337,849 1,519,837 869,831 8,555,732 74,751,571 62,293 - 3,629,650 23,067,460
Sep 120,530,657 5,008,641 1,751,483 3,257,158 - 6,789,847 3,262,892 1,446,410 2,080,545 8,020,544 74,946,312 62,293 - 3,213,740 22,489,280
Oct 120,800,710 4,513,682 1,502,272 3,011,410 - 6,968,024 3,507,719 1,601,866 1,858,439 8,054,738 75,453,877 62,293 - 3,263,551 22,484,545
Nov 122,676,327 4,195,971 1,212,176 2,983,795 - 7,578,214 3,969,640 1,535,712 2,072,862 7,271,401 76,723,234 62,293 - 4,086,094 22,759,120
Dec 124,325,837 4,190,114 1,268,314 2,921,800 - 7,643,860 3,783,884 1,892,619 1,967,357 8,008,540 76,682,347 62,239 - 5,016,241 22,722,496
Source: Commercial Banks1 Effective February 1996, the accounts of the commercial banks reflect the merged operations of GNCB with GAIBANK
Back to Annexe
Public Enter.
Deposits
Bank
Of
Guyana
Other
Liabilities
Capital
and
ReservesOther
Deposits
Non-Bank
Financial
Institutions
Deposits
Private
Sector
Deposits
External
Payment
Deposits
TABLE 2-I(b)
COMMERCIAL BANKS : LIABILITIES, CAPITAL AND RESERVES 1
(G$ Thousand)
End of
Period
Total
Liabilities Total
Non-
Residents
Deposits
Other TotalCentral Gov't
Deposits
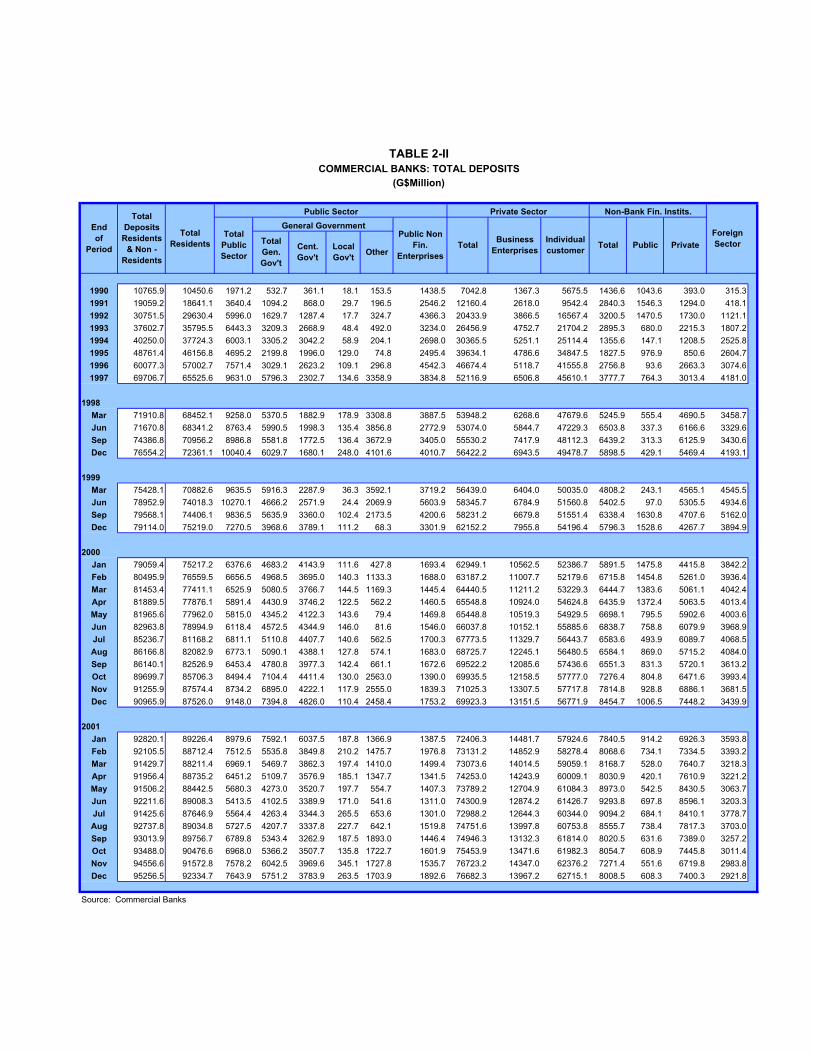
Public Sector Private Sector Non-Bank Fin. Instits.
General Government
1990 10765.9 10450.6 1971.2 532.7 361.1 18.1 153.5 1438.5 7042.8 1367.3 5675.5 1436.6 1043.6 393.0 315.3
1991 19059.2 18641.1 3640.4 1094.2 868.0 29.7 196.5 2546.2 12160.4 2618.0 9542.4 2840.3 1546.3 1294.0 418.1
1992 30751.5 29630.4 5996.0 1629.7 1287.4 17.7 324.7 4366.3 20433.9 3866.5 16567.4 3200.5 1470.5 1730.0 1121.1
1993 37602.7 35795.5 6443.3 3209.3 2668.9 48.4 492.0 3234.0 26456.9 4752.7 21704.2 2895.3 680.0 2215.3 1807.2
1994 40250.0 37724.3 6003.1 3305.2 3042.2 58.9 204.1 2698.0 30365.5 5251.1 25114.4 1355.6 147.1 1208.5 2525.8
1995 48761.4 46156.8 4695.2 2199.8 1996.0 129.0 74.8 2495.4 39634.1 4786.6 34847.5 1827.5 976.9 850.6 2604.7
1996 60077.3 57002.7 7571.4 3029.1 2623.2 109.1 296.8 4542.3 46674.4 5118.7 41555.8 2756.8 93.6 2663.3 3074.6
1997 69706.7 65525.6 9631.0 5796.3 2302.7 134.6 3358.9 3834.8 52116.9 6506.8 45610.1 3777.7 764.3 3013.4 4181.0
1998
Mar 71910.8 68452.1 9258.0 5370.5 1882.9 178.9 3308.8 3887.5 53948.2 6268.6 47679.6 5245.9 555.4 4690.5 3458.7
Jun 71670.8 68341.2 8763.4 5990.5 1998.3 135.4 3856.8 2772.9 53074.0 5844.7 47229.3 6503.8 337.3 6166.6 3329.6
Sep 74386.8 70956.2 8986.8 5581.8 1772.5 136.4 3672.9 3405.0 55530.2 7417.9 48112.3 6439.2 313.3 6125.9 3430.6
Dec 76554.2 72361.1 10040.4 6029.7 1680.1 248.0 4101.6 4010.7 56422.2 6943.5 49478.7 5898.5 429.1 5469.4 4193.1
1999
Mar 75428.1 70882.6 9635.5 5916.3 2287.9 36.3 3592.1 3719.2 56439.0 6404.0 50035.0 4808.2 243.1 4565.1 4545.5
Jun 78952.9 74018.3 10270.1 4666.2 2571.9 24.4 2069.9 5603.9 58345.7 6784.9 51560.8 5402.5 97.0 5305.5 4934.6
Sep 79568.1 74406.1 9836.5 5635.9 3360.0 102.4 2173.5 4200.6 58231.2 6679.8 51551.4 6338.4 1630.8 4707.6 5162.0
Dec 79114.0 75219.0 7270.5 3968.6 3789.1 111.2 68.3 3301.9 62152.2 7955.8 54196.4 5796.3 1528.6 4267.7 3894.9
2000
Jan 79059.4 75217.2 6376.6 4683.2 4143.9 111.6 427.8 1693.4 62949.1 10562.5 52386.7 5891.5 1475.8 4415.8 3842.2
Feb 80495.9 76559.5 6656.5 4968.5 3695.0 140.3 1133.3 1688.0 63187.2 11007.7 52179.6 6715.8 1454.8 5261.0 3936.4
Mar 81453.4 77411.1 6525.9 5080.5 3766.7 144.5 1169.3 1445.4 64440.5 11211.2 53229.3 6444.7 1383.6 5061.1 4042.4
Apr 81889.5 77876.1 5891.4 4430.9 3746.2 122.5 562.2 1460.5 65548.8 10924.0 54624.8 6435.9 1372.4 5063.5 4013.4
May 81965.6 77962.0 5815.0 4345.2 4122.3 143.6 79.4 1469.8 65448.8 10519.3 54929.5 6698.1 795.5 5902.6 4003.6
Jun 82963.8 78994.9 6118.4 4572.5 4344.9 146.0 81.6 1546.0 66037.8 10152.1 55885.6 6838.7 758.8 6079.9 3968.9
Jul 85236.7 81168.2 6811.1 5110.8 4407.7 140.6 562.5 1700.3 67773.5 11329.7 56443.7 6583.6 493.9 6089.7 4068.5
Aug 86166.8 82082.9 6773.1 5090.1 4388.1 127.8 574.1 1683.0 68725.7 12245.1 56480.5 6584.1 869.0 5715.2 4084.0
Sep 86140.1 82526.9 6453.4 4780.8 3977.3 142.4 661.1 1672.6 69522.2 12085.6 57436.6 6551.3 831.3 5720.1 3613.2
Oct 89699.7 85706.3 8494.4 7104.4 4411.4 130.0 2563.0 1390.0 69935.5 12158.5 57777.0 7276.4 804.8 6471.6 3993.4
Nov 91255.9 87574.4 8734.2 6895.0 4222.1 117.9 2555.0 1839.3 71025.3 13307.5 57717.8 7814.8 928.8 6886.1 3681.5
Dec 90965.9 87526.0 9148.0 7394.8 4826.0 110.4 2458.4 1753.2 69923.3 13151.5 56771.9 8454.7 1006.5 7448.2 3439.9
2001
Jan 92820.1 89226.4 8979.6 7592.1 6037.5 187.8 1366.9 1387.5 72406.3 14481.7 57924.6 7840.5 914.2 6926.3 3593.8
Feb 92105.5 88712.4 7512.5 5535.8 3849.8 210.2 1475.7 1976.8 73131.2 14852.9 58278.4 8068.6 734.1 7334.5 3393.2
Mar 91429.7 88211.4 6969.1 5469.7 3862.3 197.4 1410.0 1499.4 73073.6 14014.5 59059.1 8168.7 528.0 7640.7 3218.3
Apr 91956.4 88735.2 6451.2 5109.7 3576.9 185.1 1347.7 1341.5 74253.0 14243.9 60009.1 8030.9 420.1 7610.9 3221.2
May 91506.2 88442.5 5680.3 4273.0 3520.7 197.7 554.7 1407.3 73789.2 12704.9 61084.3 8973.0 542.5 8430.5 3063.7
Jun 92211.6 89008.3 5413.5 4102.5 3389.9 171.0 541.6 1311.0 74300.9 12874.2 61426.7 9293.8 697.8 8596.1 3203.3
Jul 91425.6 87646.9 5564.4 4263.4 3344.3 265.5 653.6 1301.0 72988.2 12644.3 60344.0 9094.2 684.1 8410.1 3778.7
Aug 92737.8 89034.8 5727.5 4207.7 3337.8 227.7 642.1 1519.8 74751.6 13997.8 60753.8 8555.7 738.4 7817.3 3703.0
Sep 93013.9 89756.7 6789.8 5343.4 3262.9 187.5 1893.0 1446.4 74946.3 13132.3 61814.0 8020.5 631.6 7389.0 3257.2
Oct 93488.0 90476.6 6968.0 5366.2 3507.7 135.8 1722.7 1601.9 75453.9 13471.6 61982.3 8054.7 608.9 7445.8 3011.4
Nov 94556.6 91572.8 7578.2 6042.5 3969.6 345.1 1727.8 1535.7 76723.2 14347.0 62376.2 7271.4 551.6 6719.8 2983.8
Dec 95256.5 92334.7 7643.9 5751.2 3783.9 263.5 1703.9 1892.6 76682.3 13967.2 62715.1 8008.5 608.3 7400.3 2921.8
Source: Commercial Banks
TABLE 2-II
COMMERCIAL BANKS: TOTAL DEPOSITS
(G$Million)
End
of
Period
Total
Deposits
Residents
& Non -
Residents
Total
ResidentsTotal
Public
Sector
Total
Gen.
Gov't
Cent.
Gov't
Local
Gov't
Back to Annexe
Individual
customer
Foreign
SectorTotal Public PrivateOther
Public Non
Fin.
Enterprises
TotalBusiness
Enterprises
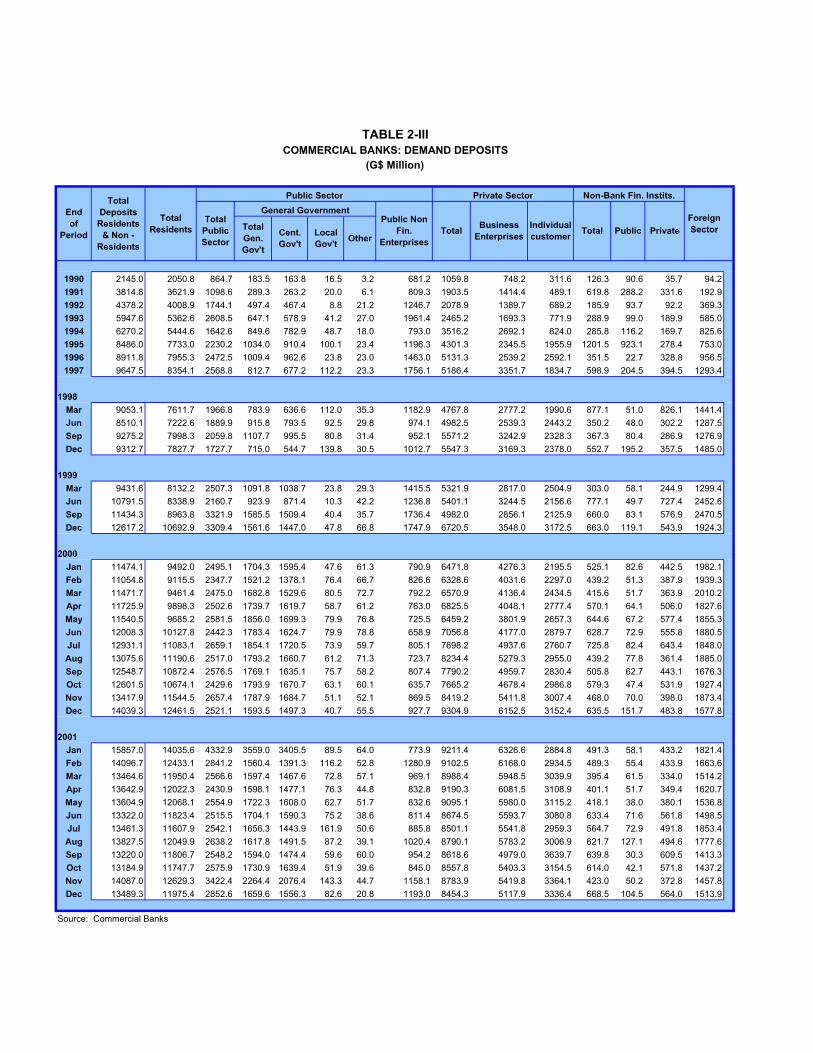
Public Sector Private Sector Non-Bank Fin. Instits.
General Government
1990 2145.0 2050.8 864.7 183.5 163.8 16.5 3.2 681.2 1059.8 748.2 311.6 126.3 90.6 35.7 94.2
1991 3814.8 3621.9 1098.6 289.3 263.2 20.0 6.1 809.3 1903.5 1414.4 489.1 619.8 288.2 331.6 192.9
1992 4378.2 4008.9 1744.1 497.4 467.4 8.8 21.2 1246.7 2078.9 1389.7 689.2 185.9 93.7 92.2 369.3
1993 5947.6 5362.6 2608.5 647.1 578.9 41.2 27.0 1961.4 2465.2 1693.3 771.9 288.9 99.0 189.9 585.0
1994 6270.2 5444.6 1642.6 849.6 782.9 48.7 18.0 793.0 3516.2 2692.1 824.0 285.8 116.2 169.7 825.6
1995 8486.0 7733.0 2230.2 1034.0 910.4 100.1 23.4 1196.3 4301.3 2345.5 1955.9 1201.5 923.1 278.4 753.0
1996 8911.8 7955.3 2472.5 1009.4 962.6 23.8 23.0 1463.0 5131.3 2539.2 2592.1 351.5 22.7 328.8 956.5
1997 9647.5 8354.1 2568.8 812.7 677.2 112.2 23.3 1756.1 5186.4 3351.7 1834.7 598.9 204.5 394.5 1293.4
1998
Mar 9053.1 7611.7 1966.8 783.9 636.6 112.0 35.3 1182.9 4767.8 2777.2 1990.6 877.1 51.0 826.1 1441.4
Jun 8510.1 7222.6 1889.9 915.8 793.5 92.5 29.8 974.1 4982.5 2539.3 2443.2 350.2 48.0 302.2 1287.5
Sep 9275.2 7998.3 2059.8 1107.7 995.5 80.8 31.4 952.1 5571.2 3242.9 2328.3 367.3 80.4 286.9 1276.9
Dec 9312.7 7827.7 1727.7 715.0 544.7 139.8 30.5 1012.7 5547.3 3169.3 2378.0 552.7 195.2 357.5 1485.0
1999
Mar 9431.6 8132.2 2507.3 1091.8 1038.7 23.8 29.3 1415.5 5321.9 2817.0 2504.9 303.0 58.1 244.9 1299.4
Jun 10791.5 8338.9 2160.7 923.9 871.4 10.3 42.2 1236.8 5401.1 3244.5 2156.6 777.1 49.7 727.4 2452.6
Sep 11434.3 8963.8 3321.9 1585.5 1509.4 40.4 35.7 1736.4 4982.0 2856.1 2125.9 660.0 83.1 576.9 2470.5
Dec 12617.2 10692.9 3309.4 1561.6 1447.0 47.8 66.8 1747.9 6720.5 3548.0 3172.5 663.0 119.1 543.9 1924.3
2000
Jan 11474.1 9492.0 2495.1 1704.3 1595.4 47.6 61.3 790.9 6471.8 4276.3 2195.5 525.1 82.6 442.5 1982.1
Feb 11054.8 9115.5 2347.7 1521.2 1378.1 76.4 66.7 826.6 6328.6 4031.6 2297.0 439.2 51.3 387.9 1939.3
Mar 11471.7 9461.4 2475.0 1682.8 1529.6 80.5 72.7 792.2 6570.9 4136.4 2434.5 415.6 51.7 363.9 2010.2
Apr 11725.9 9898.3 2502.6 1739.7 1619.7 58.7 61.2 763.0 6825.5 4048.1 2777.4 570.1 64.1 506.0 1827.6
May 11540.5 9685.2 2581.5 1856.0 1699.3 79.9 76.8 725.5 6459.2 3801.9 2657.3 644.6 67.2 577.4 1855.3
Jun 12008.3 10127.8 2442.3 1783.4 1624.7 79.9 78.8 658.9 7056.8 4177.0 2879.7 628.7 72.9 555.8 1880.5
Jul 12931.1 11083.1 2659.1 1854.1 1720.5 73.9 59.7 805.1 7698.2 4937.6 2760.7 725.8 82.4 643.4 1848.0
Aug 13075.6 11190.6 2517.0 1793.2 1660.7 61.2 71.3 723.7 8234.4 5279.3 2955.0 439.2 77.8 361.4 1885.0
Sep 12548.7 10872.4 2576.5 1769.1 1635.1 75.7 58.2 807.4 7790.2 4959.7 2830.4 505.8 62.7 443.1 1676.3
Oct 12601.5 10674.1 2429.6 1793.9 1670.7 63.1 60.1 635.7 7665.2 4678.4 2986.8 579.3 47.4 531.9 1927.4
Nov 13417.9 11544.5 2657.4 1787.9 1684.7 51.1 52.1 869.5 8419.2 5411.8 3007.4 468.0 70.0 398.0 1873.4
Dec 14039.3 12461.5 2521.1 1593.5 1497.3 40.7 55.5 927.7 9304.9 6152.5 3152.4 635.5 151.7 483.8 1577.8
2001
Jan 15857.0 14035.6 4332.9 3559.0 3405.5 89.5 64.0 773.9 9211.4 6326.6 2884.8 491.3 58.1 433.2 1821.4
Feb 14096.7 12433.1 2841.2 1560.4 1391.3 116.2 52.8 1280.9 9102.5 6168.0 2934.5 489.3 55.4 433.9 1663.6
Mar 13464.6 11950.4 2566.6 1597.4 1467.6 72.8 57.1 969.1 8988.4 5948.5 3039.9 395.4 61.5 334.0 1514.2
Apr 13642.9 12022.3 2430.9 1598.1 1477.1 76.3 44.8 832.8 9190.3 6081.5 3108.9 401.1 51.7 349.4 1620.7
May 13604.9 12068.1 2554.9 1722.3 1608.0 62.7 51.7 832.6 9095.1 5980.0 3115.2 418.1 38.0 380.1 1536.8
Jun 13322.0 11823.4 2515.5 1704.1 1590.3 75.2 38.6 811.4 8674.5 5593.7 3080.8 633.4 71.6 561.8 1498.5
Jul 13461.3 11607.9 2542.1 1656.3 1443.9 161.9 50.6 885.8 8501.1 5541.8 2959.3 564.7 72.9 491.8 1853.4
Aug 13827.5 12049.9 2638.2 1617.8 1491.5 87.2 39.1 1020.4 8790.1 5783.2 3006.9 621.7 127.1 494.6 1777.6
Sep 13220.0 11806.7 2548.2 1594.0 1474.4 59.6 60.0 954.2 8618.6 4979.0 3639.7 639.8 30.3 609.5 1413.3
Oct 13184.9 11747.7 2575.9 1730.9 1639.4 51.9 39.6 845.0 8557.8 5403.3 3154.5 614.0 42.1 571.8 1437.2
Nov 14087.0 12629.3 3422.4 2264.4 2076.4 143.3 44.7 1158.1 8783.9 5419.8 3364.1 423.0 50.2 372.8 1457.8
Dec 13489.3 11975.4 2852.6 1659.6 1556.3 82.6 20.8 1193.0 8454.3 5117.9 3336.4 668.5 104.5 564.0 1513.9
Source: Commercial Banks
End
of
Period
Total
Deposits
Residents
& Non -
Residents
Total
Residents
Foreign
SectorTotal
Public
Sector
Public Non
Fin.
Enterprises
TotalBusiness
Enterprises
Individual
customerTotal Public PrivateTotal
Gen.
Gov't
Cent.
Gov't
Local
Gov'tOther
Back to Annexe
TABLE 2-IIICOMMERCIAL BANKS: DEMAND DEPOSITS
(G$ Million)

Public Sector Private Sector Non-Bank Fin. Instits.
General Government
1990 3226.9 3217.4 453.3 269.7 119.2 0.2 150.3 183.6 1482.5 323.9 1158.6 1281.6 953.0 328.6 9.5
1991 5349.0 5313.4 1087.7 691.3 494.3 6.7 190.3 396.4 2838.7 495.8 2342.9 1387.0 921.1 465.9 35.6
1992 8643.8 8508.3 1375.9 945.9 640.0 2.5 303.4 430.0 5787.3 1054.3 4733.0 1345.1 817.3 527.8 135.5
1993 12252.4 11908.2 1302.3 890.7 508.7 2.8 379.2 411.6 8595.8 1478.1 7117.7 2010.1 559.2 1450.9 344.2
1994 11103.1 10594.7 1406.4 896.7 713.7 3.1 179.9 509.7 8780.4 1140.6 7639.8 407.9 29.3 378.6 508.4
1995 14696.8 14236.5 1170.2 772.1 703.5 23.2 45.4 398.1 12756.2 1319.9 11436.3 310.1 25.8 284.3 460.3
1996 19493.5 19016.8 1674.5 1004.3 760.3 77.6 166.4 670.1 15443.3 1393.8 14049.5 1899.1 15.2 1883.9 476.7
1997 23090.5 22657.0 3003.4 2202.1 748.1 13.5 1440.5 801.3 16833.0 1636.6 15196.4 2820.6 506.2 2314.4 433.4
1998
Mar 25068.9 24621.8 3696.4 3010.6 795.2 57.5 2157.9 685.8 17083.0 1520.8 15562.2 3842.4 458.4 3384.0 447.1
Jun 24872.5 24488.7 3185.1 2710.1 678.2 33.9 1998.0 475.0 16232.8 1513.5 14719.3 5070.8 243.2 4827.6 383.8
Sep 25571.9 25166.1 3141.5 2471.9 402.2 46.4 2023.3 669.6 17243.5 1929.8 15313.7 4781.1 186.8 4594.3 405.8
Dec 25848.7 25006.3 3288.6 2555.8 592.0 95.2 1868.6 732.8 17047.5 1771.4 15276.1 4670.2 187.8 4482.4 842.5
1999
Mar 26353.6 25670.2 4281.5 2717.1 821.1 4.2 1891.8 1564.4 17248.3 1795.4 15452.9 4140.4 139.6 4000.8 683.4
Jun 28121.0 27351.8 5429.2 2938.3 1021.9 4.3 1912.1 2490.9 17684.2 1856.4 15827.8 4238.4 2.0 4236.4 769.2
Sep 28578.9 27757.1 4263.4 3135.7 993.3 16.2 2126.2 1127.7 18110.4 1938.2 16172.2 5383.3 1537.0 3846.3 821.8
Dec 25579.1 24818.3 1163.1 899.3 881.5 16.3 1.5 263.8 18885.4 2287.2 16598.2 4769.8 1403.5 3366.3 760.8
2000
Jan 26978.3 26233.6 1816.4 1515.6 1132.7 16.3 366.5 300.8 19428.7 2815.7 16613.0 4988.4 1386.0 3602.5 744.7
Feb 28851.3 28139.6 2588.3 2218.4 1135.5 16.4 1066.5 369.9 19892.2 3006.1 16886.0 5659.1 1398.5 4260.7 711.7
Mar 29229.8 28517.6 2687.1 2316.3 1203.2 16.4 1096.7 370.8 20103.3 2947.6 17155.7 5727.3 1328.3 4398.9 712.2
Apr 28564.1 27806.8 2037.5 1664.5 1147.1 16.4 501.0 373.1 20176.1 2948.1 17228.0 5593.2 1308.3 4284.9 757.3
May 28940.6 28190.0 1694.9 1318.2 1300.8 16.5 1.0 376.7 20719.0 3275.9 17443.1 5776.1 728.3 5047.8 750.6
Jun 29393.9 28639.5 1984.6 1619.4 1600.0 16.5 2.8 365.3 20865.3 3218.7 17646.6 5789.5 685.2 5104.3 754.5
Jul 30381.5 29532.0 2487.5 2125.4 1606.0 16.6 502.8 362.1 21475.0 3286.1 18188.9 5569.5 410.9 5158.7 849.4
Aug 30498.9 29692.5 2485.2 2135.7 1616.3 16.6 502.8 349.6 21721.9 3537.6 18184.3 5485.4 475.9 5009.4 806.4
Sep 30602.7 29902.6 2180.9 1831.8 1212.3 16.6 602.9 349.1 22369.0 3574.9 18794.1 5352.8 591.0 4761.8 700.1
Oct 33353.4 32723.2 4403.4 4044.0 1524.5 16.7 2502.9 359.4 22045.3 3779.7 18265.6 6274.5 745.4 5529.2 630.2
Nov 34050.2 33413.8 4328.5 3965.0 1445.5 16.7 2502.9 363.5 22133.0 4006.4 18126.5 6952.3 844.7 6107.6 636.4
Dec 33249.1 32615.6 4128.5 3848.7 1429.0 16.7 2402.9 279.9 21013.7 3545.2 17468.5 7473.4 854.6 6618.8 633.5
2001
Jan 32666.1 32061.7 2979.7 2699.6 1379.9 16.8 1302.9 280.2 22216.5 3783.7 18432.7 6865.5 855.9 6009.6 604.5
Feb 32915.0 32551.1 2919.7 2636.0 1316.3 16.8 1302.9 283.7 22809.1 4243.8 18565.4 6822.3 678.4 6143.9 363.8
Mar 32687.4 32180.3 2644.9 2532.1 1212.3 16.8 1302.9 112.8 22512.7 3860.5 18652.2 7022.7 418.7 6604.0 507.0
Apr 32763.8 32247.4 2595.9 2482.0 1162.2 16.9 1302.9 113.9 22486.1 3781.2 18704.9 7165.5 368.1 6797.4 516.4
May 31645.3 31134.1 1663.9 1550.8 1030.9 16.9 503.0 113.2 22601.7 3613.6 18988.1 6868.5 504.2 6364.2 511.1
Jun 31475.7 30949.3 1667.5 1553.4 1033.4 16.9 503.0 114.1 22471.3 3491.3 18980.0 6810.6 625.9 6184.6 526.4
Jul 31481.7 30959.4 1795.1 1680.7 1060.7 17.0 603.0 114.4 22251.4 3578.6 18672.9 6912.9 610.9 6301.9 522.4
Aug 32348.4 31817.6 1783.5 1669.1 1049.1 17.0 603.0 114.4 22767.2 3810.8 18956.3 7267.0 611.1 6655.9 530.8
Sep 33374.9 32846.7 2792.4 2677.1 977.0 17.0 1683.0 115.3 23133.8 3824.0 19309.8 6920.5 601.1 6319.5 528.1
Oct 33216.5 32824.9 2801.5 2744.9 1044.8 17.1 1683.0 56.7 23837.6 3996.8 19840.8 6185.9 566.5 5619.4 391.6
Nov 33016.5 32640.9 2805.1 2748.4 982.7 82.7 1683.1 56.7 23591.4 4167.7 19423.7 6244.3 501.1 5743.2 375.6
Dec 33133.8 32754.2 3062.0 3005.5 1239.7 82.7 1683.1 56.6 23188.3 3844.9 19343.4 6503.9 503.3 6000.7 379.5
Source: Commercial Banks
Back to Annexe
PrivateTotal
Gen.
Gov't
Cent.
Gov't
Local
Gov'tOther
Business
Enterprises
Individual
customerTotal Public
TABLE 2-IVCOMMERCIAL BANKS: TIME DEPOSITS
(G$ Million)
End
of
Period
Total
Deposits
Residents
& Non -
Residents
Total
Residents
Foreign
SectorTotal
Public
Sector
Public Non
Fin.
Enterprises
Total
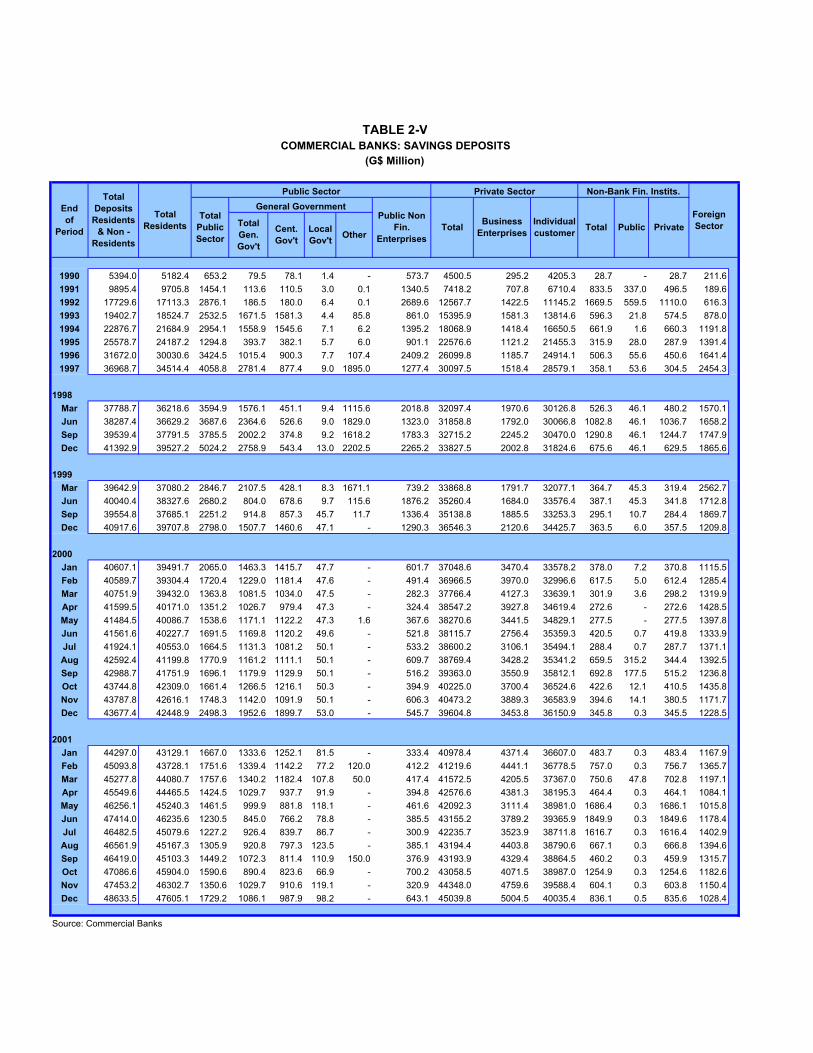
Public Sector Private Sector Non-Bank Fin. Instits.
General Government
1990 5394.0 5182.4 653.2 79.5 78.1 1.4 - 573.7 4500.5 295.2 4205.3 28.7 - 28.7 211.6
1991 9895.4 9705.8 1454.1 113.6 110.5 3.0 0.1 1340.5 7418.2 707.8 6710.4 833.5 337.0 496.5 189.6
1992 17729.6 17113.3 2876.1 186.5 180.0 6.4 0.1 2689.6 12567.7 1422.5 11145.2 1669.5 559.5 1110.0 616.3
1993 19402.7 18524.7 2532.5 1671.5 1581.3 4.4 85.8 861.0 15395.9 1581.3 13814.6 596.3 21.8 574.5 878.0
1994 22876.7 21684.9 2954.1 1558.9 1545.6 7.1 6.2 1395.2 18068.9 1418.4 16650.5 661.9 1.6 660.3 1191.8
1995 25578.7 24187.2 1294.8 393.7 382.1 5.7 6.0 901.1 22576.6 1121.2 21455.3 315.9 28.0 287.9 1391.4
1996 31672.0 30030.6 3424.5 1015.4 900.3 7.7 107.4 2409.2 26099.8 1185.7 24914.1 506.3 55.6 450.6 1641.4
1997 36968.7 34514.4 4058.8 2781.4 877.4 9.0 1895.0 1277.4 30097.5 1518.4 28579.1 358.1 53.6 304.5 2454.3
1998
Mar 37788.7 36218.6 3594.9 1576.1 451.1 9.4 1115.6 2018.8 32097.4 1970.6 30126.8 526.3 46.1 480.2 1570.1
Jun 38287.4 36629.2 3687.6 2364.6 526.6 9.0 1829.0 1323.0 31858.8 1792.0 30066.8 1082.8 46.1 1036.7 1658.2
Sep 39539.4 37791.5 3785.5 2002.2 374.8 9.2 1618.2 1783.3 32715.2 2245.2 30470.0 1290.8 46.1 1244.7 1747.9
Dec 41392.9 39527.2 5024.2 2758.9 543.4 13.0 2202.5 2265.2 33827.5 2002.8 31824.6 675.6 46.1 629.5 1865.6
1999
Mar 39642.9 37080.2 2846.7 2107.5 428.1 8.3 1671.1 739.2 33868.8 1791.7 32077.1 364.7 45.3 319.4 2562.7
Jun 40040.4 38327.6 2680.2 804.0 678.6 9.7 115.6 1876.2 35260.4 1684.0 33576.4 387.1 45.3 341.8 1712.8
Sep 39554.8 37685.1 2251.2 914.8 857.3 45.7 11.7 1336.4 35138.8 1885.5 33253.3 295.1 10.7 284.4 1869.7
Dec 40917.6 39707.8 2798.0 1507.7 1460.6 47.1 - 1290.3 36546.3 2120.6 34425.7 363.5 6.0 357.5 1209.8
2000
Jan 40607.1 39491.7 2065.0 1463.3 1415.7 47.7 - 601.7 37048.6 3470.4 33578.2 378.0 7.2 370.8 1115.5
Feb 40589.7 39304.4 1720.4 1229.0 1181.4 47.6 - 491.4 36966.5 3970.0 32996.6 617.5 5.0 612.4 1285.4
Mar 40751.9 39432.0 1363.8 1081.5 1034.0 47.5 - 282.3 37766.4 4127.3 33639.1 301.9 3.6 298.2 1319.9
Apr 41599.5 40171.0 1351.2 1026.7 979.4 47.3 - 324.4 38547.2 3927.8 34619.4 272.6 - 272.6 1428.5
May 41484.5 40086.7 1538.6 1171.1 1122.2 47.3 1.6 367.6 38270.6 3441.5 34829.1 277.5 - 277.5 1397.8
Jun 41561.6 40227.7 1691.5 1169.8 1120.2 49.6 - 521.8 38115.7 2756.4 35359.3 420.5 0.7 419.8 1333.9
Jul 41924.1 40553.0 1664.5 1131.3 1081.2 50.1 - 533.2 38600.2 3106.1 35494.1 288.4 0.7 287.7 1371.1
Aug 42592.4 41199.8 1770.9 1161.2 1111.1 50.1 - 609.7 38769.4 3428.2 35341.2 659.5 315.2 344.4 1392.5
Sep 42988.7 41751.9 1696.1 1179.9 1129.9 50.1 - 516.2 39363.0 3550.9 35812.1 692.8 177.5 515.2 1236.8
Oct 43744.8 42309.0 1661.4 1266.5 1216.1 50.3 - 394.9 40225.0 3700.4 36524.6 422.6 12.1 410.5 1435.8
Nov 43787.8 42616.1 1748.3 1142.0 1091.9 50.1 - 606.3 40473.2 3889.3 36583.9 394.6 14.1 380.5 1171.7
Dec 43677.4 42448.9 2498.3 1952.6 1899.7 53.0 - 545.7 39604.8 3453.8 36150.9 345.8 0.3 345.5 1228.5
2001
Jan 44297.0 43129.1 1667.0 1333.6 1252.1 81.5 - 333.4 40978.4 4371.4 36607.0 483.7 0.3 483.4 1167.9
Feb 45093.8 43728.1 1751.6 1339.4 1142.2 77.2 120.0 412.2 41219.6 4441.1 36778.5 757.0 0.3 756.7 1365.7
Mar 45277.8 44080.7 1757.6 1340.2 1182.4 107.8 50.0 417.4 41572.5 4205.5 37367.0 750.6 47.8 702.8 1197.1
Apr 45549.6 44465.5 1424.5 1029.7 937.7 91.9 - 394.8 42576.6 4381.3 38195.3 464.4 0.3 464.1 1084.1
May 46256.1 45240.3 1461.5 999.9 881.8 118.1 - 461.6 42092.3 3111.4 38981.0 1686.4 0.3 1686.1 1015.8
Jun 47414.0 46235.6 1230.5 845.0 766.2 78.8 - 385.5 43155.2 3789.2 39365.9 1849.9 0.3 1849.6 1178.4
Jul 46482.5 45079.6 1227.2 926.4 839.7 86.7 - 300.9 42235.7 3523.9 38711.8 1616.7 0.3 1616.4 1402.9
Aug 46561.9 45167.3 1305.9 920.8 797.3 123.5 - 385.1 43194.4 4403.8 38790.6 667.1 0.3 666.8 1394.6
Sep 46419.0 45103.3 1449.2 1072.3 811.4 110.9 150.0 376.9 43193.9 4329.4 38864.5 460.2 0.3 459.9 1315.7
Oct 47086.6 45904.0 1590.6 890.4 823.6 66.9 - 700.2 43058.5 4071.5 38987.0 1254.9 0.3 1254.6 1182.6
Nov 47453.2 46302.7 1350.6 1029.7 910.6 119.1 - 320.9 44348.0 4759.6 39588.4 604.1 0.3 603.8 1150.4
Dec 48633.5 47605.1 1729.2 1086.1 987.9 98.2 - 643.1 45039.8 5004.5 40035.4 836.1 0.5 835.6 1028.4
Source: Commercial Banks
Back to Annexe
TABLE 2-VCOMMERCIAL BANKS: SAVINGS DEPOSITS
(G$ Million)
End
of
Period
Total
Deposits
Residents
& Non -
Residents
Total
Residents
Foreign
SectorTotal
Public
Sector
Public Non
Fin.
Enterprises
Total PrivateTotal
Gen.
Gov't
Cent.
Gov't
Total PublicLocal
Gov'tOther
Business
Enterprises
Individual
customer

Exceeding Exceeding
3 & Up To 6 & Up To
6 Months 9 Months
1990 2122.3 73.3 - 821.1 210.2 3226.9
1991 4195.5 132.0 - 791.7 229.8 5349.0
1992 8123.2 - - 346.5 174.2 8643.9
1993 10433.2 1001.9 135.2 565.8 116.3 12252.4
1994 9013.9 927.6 144.0 935.8 81.9 11103.1
1995 9532.4 3713.9 78.7 1312.4 59.4 14696.8
1996 16908.9 1907.6 0.2 253.5 423.4 19493.5
1997 17513.0 3701.5 5.9 1853.4 16.8 23090.5
1998
Mar 19311.6 3894.8 70.5 1771.9 20.1 25068.9
Jun 18028.9 5139.7 70.9 1614.0 19.8 24873.3
Sep 17599.9 5913.6 0.9 2039.1 18.4 25571.9
Dec 17020.6 5151.1 2.8 3655.0 19.2 25848.7
1999
Mar 17829.6 4321.9 4.4 4170.9 26.8 26353.6
Jun 18810.2 4052.9 264.9 4958.5 34.4 28120.9
Sep 16490.1 4543.0 1000.6 5743.3 801.9 28578.9
Dec 14820.6 3906.5 1475.3 4715.0 661.7 25579.1
2000
Jan 15826.2 3935.0 1688.4 4745.4 783.3 26978.3
Feb 17031.0 3941.2 18.6 7006.1 854.5 28851.3
Mar 17342.5 3780.6 22.2 7155.2 929.2 29229.8
Apr 16426.5 3844.7 15.6 7237.1 1040.2 28564.1
May 16199.1 4458.1 30.7 7295.3 957.3 28940.6
Jun 16725.3 4609.5 57.0 7127.8 874.3 29393.9
Jul 17109.4 4212.3 64.8 8077.6 917.3 30381.5
Aug 17014.3 4543.4 67.4 7906.9 966.8 30498.9
Sep 17199.7 4578.1 62.1 7745.6 1017.2 30602.7
Oct 17943.2 5752.6 59.0 8551.8 1046.7 33353.4
Nov 18199.6 5499.3 42.0 9256.6 1052.7 34050.2
Dec 16979.5 5389.5 14.0 9844.4 1021.6 33249.1
2001
Jan 17073.9 5335.9 6.3 9204.5 1045.5 32666.1
Feb 17121.7 5335.6 7.9 9372.9 1076.9 32915.0
Mar 16023.7 5784.5 841.3 8836.4 1201.6 32687.4
Apr 15776.4 5917.8 157.7 9771.9 1140.1 32763.8
May 15831.7 4699.3 188.8 9743.4 1182.1 31645.3
Jun 15763.1 4627.1 191.7 9685.7 1208.1 31475.7
Jul 15356.2 4840.7 190.0 9880.4 1214.4 31481.7
Aug 15530.6 4744.7 255.7 10543.2 1274.2 32348.4
Sep 15365.2 4685.9 145.7 11080.1 2097.9 33374.9
Oct 15747.2 4546.9 109.2 10681.5 2131.7 33216.5
Nov 16024.1 4668.1 84.6 10095.7 2144.1 33016.5
Dec 16307.9 4547.0 79.7 10022.0 2177.2 33133.8
Source: Commercial Banks
TABLE 2-VICOMMERCIAL BANKS: TIME DEPOSITS BY MATURITY
(G$ Million)
Total
End
Of
Period
Up To 3
Months
Up To 12
Months
Exceeding
12 Months
Back to Annexe

Credits Debits
1990 5410.2 1870.1 2119.1 -249.0 232.8 5394.0
1991 9282.3 5296.5 5100.9 195.6 417.5 9895.4
1992 16787.3 8217.5 7764.1 453.4 488.8 17729.5
1993 20354.2 5499.3 6793.2 -1293.9 342.4 19402.7
1994 23048.4 6978.8 7547.4 -568.6 396.9 22876.7
1995 26692.3 6637.4 8134.7 -1497.3 383.6 25578.7
1996 32079.9 11089.7 11803.6 -713.9 306.0 31672.0
1997 35928.4 12691.1 11998.7 692.4 347.9 36968.7
1998
Mar 36749.4 9615.2 8960.9 654.3 385.1 37788.8
Jun 37100.5 10458.7 9360.1 1098.6 88.3 38287.4
Sep 37677.5 8310.8 6874.0 1436.8 425.1 39539.4
Dec 40108.9 11735.7 10703.1 1032.6 251.4 41392.9
1999
Mar 41091.4 6775.6 8656.1 -1880.5 432.0 39642.9
Jun 39380.1 9061.6 8587.6 474.0 186.4 40040.5
Sep 38962.0 11000.8 10809.1 191.7 401.2 39554.9
Dec 39322.6 16112.8 14675.7 1437.1 157.9 40917.6
2000
Jan 40917.6 7943.9 8492.6 -548.7 238.2 40607.1
Feb 40607.1 8521.2 8567.0 -45.9 28.5 40589.7
Mar 40589.7 10343.6 10517.9 -174.3 336.4 40751.9
Apr 40751.9 9325.2 8730.9 594.4 253.3 41599.5
May 41599.5 10562.1 10726.5 -164.4 49.4 41484.5
Jun 41484.5 10063.9 10214.4 -150.5 227.6 41561.6
Jul 41561.6 8659.3 8346.2 313.1 49.4 41924.1
Aug 41924.1 8757.2 8141.2 616.0 52.3 42592.4
Sep 42592.4 8690.4 8652.8 37.6 358.7 42988.7
Oct 42721.7 9205.4 8458.8 746.6 276.5 43744.8
Nov 43744.8 9018.0 8987.4 30.6 12.4 43787.8
Dec 43787.8 10022.0 10330.3 -308.3 197.9 43677.4
2001
Jan 43677.4 12287.3 11683.9 603.4 16.1 44297.0
Feb 44297.0 11619.2 10836.7 782.5 14.3 45093.8
Mar 45093.8 11874.9 11990.1 -115.2 299.1 45277.8
Apr 45277.8 11827.0 11772.6 54.4 217.5 45549.6
May 45549.6 13560.1 12868.4 691.7 14.8 46256.1
Jun 46256.1 14301.4 13499.9 801.5 356.4 47414.0
Jul 47414.0 13287.4 14293.3 -1005.9 74.4 46482.5
Aug 46482.5 13906.7 13954.5 -47.8 127.2 46561.9
Sep 46561.9 11076.3 11537.6 -461.3 318.5 46419.0
Oct 46419.0 13899.5 13541.4 358.1 309.5 47086.6
Nov 47086.6 14082.9 13735.5 347.4 19.1 47453.2
Dec 47453.2 14021.6 13014.9 1006.7 173.7 48633.5
Source: Commercial Banks
TABLE 2-VIICOMMERCIAL BANKS: DEBITS AND CREDITS ON SAVINGS ACCOUNTS
(G$ Million)
Interest
Credited To
Acc. During
Period
Savings
Deposits at
end of
Period
Period
Savings
Deposits at
Beginning
of Period
On Savings Acc. During
The Period
Net Credits (+)
Or Debits (-)
Back to Annexe

DEBITS ON CHEQUING ACCOUNTS CLEARING BALANCES 1
Period Debits 2
Period Clearings 1
1991 123910.0 1991 14786.8
1992 192385.5 1992 20008.9
1993 337713.7 1993 29613.7
1994 520234.1 1994 35980.8
1995 661848.9 1995 46806.3
1996 1043587.3 1996 59582.3
1997 541088.4 1997 65170.8
1998 881452.8 1998 70058.7
1999 1186599.3 1999 91752.2
2000 1393130.6 2000 107599.0
2001 1317397.1 2001 106865.2
1998 1998
Mar 77366.0 Mar 6273.9
Jun 81413.8 Jun 5565.9
Sep 88156.4 Sep 6971.4
Dec 97084.6 Dec 8352.0
1999 1999
Mar 89389.0 Mar 7530.0
Jun 89446.0 Jun 6659.0
Sep 100514.0 Sep 8170.0
Dec 139229.0 Dec 9778.0
2000 2000
Jan 112751.0 Jan 8287.0
Feb 97958.6 Feb 8043.0
Mar 116175.4 Mar 9913.8
Apr 98082.0 Apr 8253.5
May 102720.0 May 9548.0
Jun 105327.4 Jun 7883.7
Jul 131588.8 Jul 8905.5
Aug 130301.7 Aug 9587.3
Sep 135650.8 Sep 8257.5
Oct 111676.3 Oct 9422.2
Nov 125087.6 Nov 9442.3
Dec 125810.9 Dec 10055.2
2001 2001
Jan 117029.6 Jan 8448.5
Feb 111502.6 Feb 7743.9
Mar 112838.8 Mar 8312.3
Apr 108556.1 Apr 8666.6
May 114100.3 May 9725.1
Jun 107550.9 Jun 7997.8
Jul 112023.8 Jul 10062.7
Aug 116299.7 Aug 9116.2
Sep 106260.4 Sep 8410.8
Oct 105662.6 Oct 10283.8
Nov 98478.4 Nov 7831.6
Dec 107094.0 Dec 10266.0
1 Data reflect balances cleared at the Bank of Guyana2 Data from 1991 to 2000 whole year have been revised to reflect figures in Statistical Bulletin
Sources : Bank of Guyana and Commercial Banks
Back to Annexe
TABLE 2-[VIII&IX]
Table 2-VIII Table 2-IX
COMMERCIAL BANKS : DEBITS AND CLEARING BALANCES
(G$ Million)
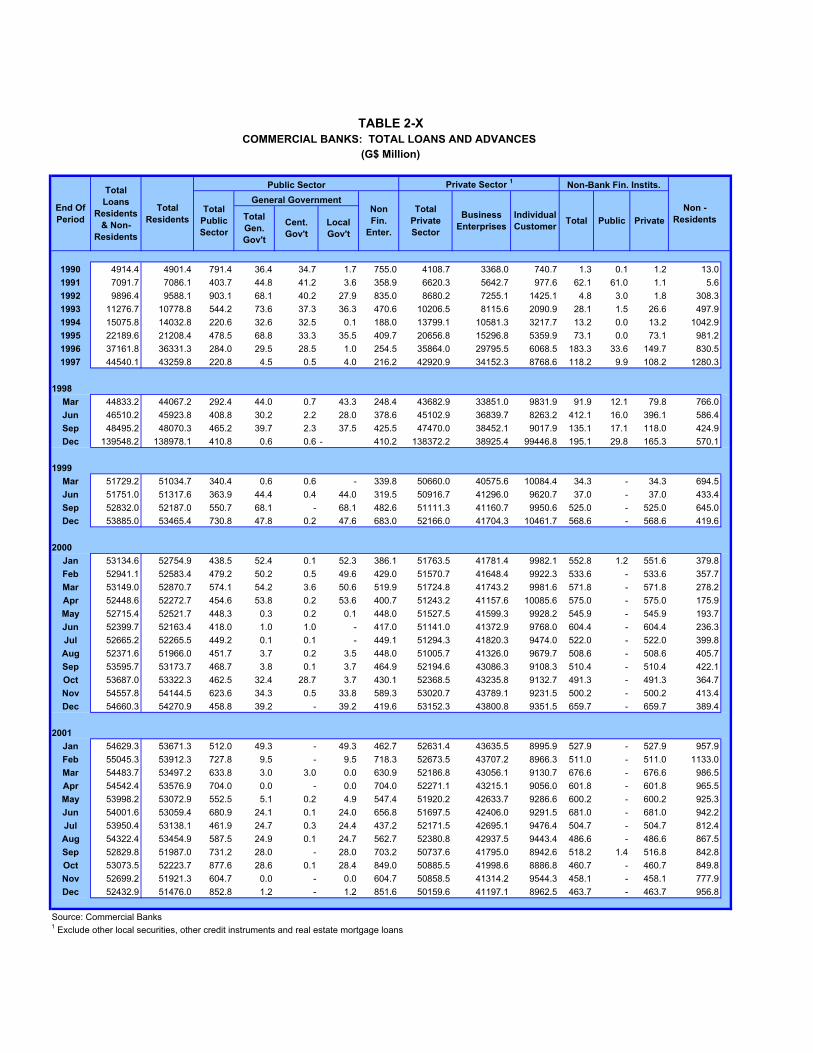
Public Sector Private Sector 1 Non-Bank Fin. Instits.
General Government
1990 4914.4 4901.4 791.4 36.4 34.7 1.7 755.0 4108.7 3368.0 740.7 1.3 0.1 1.2 13.0
1991 7091.7 7086.1 403.7 44.8 41.2 3.6 358.9 6620.3 5642.7 977.6 62.1 61.0 1.1 5.6
1992 9896.4 9588.1 903.1 68.1 40.2 27.9 835.0 8680.2 7255.1 1425.1 4.8 3.0 1.8 308.3
1993 11276.7 10778.8 544.2 73.6 37.3 36.3 470.6 10206.5 8115.6 2090.9 28.1 1.5 26.6 497.9
1994 15075.8 14032.8 220.6 32.6 32.5 0.1 188.0 13799.1 10581.3 3217.7 13.2 0.0 13.2 1042.9
1995 22189.6 21208.4 478.5 68.8 33.3 35.5 409.7 20656.8 15296.8 5359.9 73.1 0.0 73.1 981.2
1996 37161.8 36331.3 284.0 29.5 28.5 1.0 254.5 35864.0 29795.5 6068.5 183.3 33.6 149.7 830.5
1997 44540.1 43259.8 220.8 4.5 0.5 4.0 216.2 42920.9 34152.3 8768.6 118.2 9.9 108.2 1280.3
1998
Mar 44833.2 44067.2 292.4 44.0 0.7 43.3 248.4 43682.9 33851.0 9831.9 91.9 12.1 79.8 766.0
Jun 46510.2 45923.8 408.8 30.2 2.2 28.0 378.6 45102.9 36839.7 8263.2 412.1 16.0 396.1 586.4
Sep 48495.2 48070.3 465.2 39.7 2.3 37.5 425.5 47470.0 38452.1 9017.9 135.1 17.1 118.0 424.9
Dec 139548.2 138978.1 410.8 0.6 0.6 - 410.2 138372.2 38925.4 99446.8 195.1 29.8 165.3 570.1
1999
Mar 51729.2 51034.7 340.4 0.6 0.6 - 339.8 50660.0 40575.6 10084.4 34.3 - 34.3 694.5
Jun 51751.0 51317.6 363.9 44.4 0.4 44.0 319.5 50916.7 41296.0 9620.7 37.0 - 37.0 433.4
Sep 52832.0 52187.0 550.7 68.1 - 68.1 482.6 51111.3 41160.7 9950.6 525.0 - 525.0 645.0
Dec 53885.0 53465.4 730.8 47.8 0.2 47.6 683.0 52166.0 41704.3 10461.7 568.6 - 568.6 419.6
2000
Jan 53134.6 52754.9 438.5 52.4 0.1 52.3 386.1 51763.5 41781.4 9982.1 552.8 1.2 551.6 379.8
Feb 52941.1 52583.4 479.2 50.2 0.5 49.6 429.0 51570.7 41648.4 9922.3 533.6 - 533.6 357.7
Mar 53149.0 52870.7 574.1 54.2 3.6 50.6 519.9 51724.8 41743.2 9981.6 571.8 - 571.8 278.2
Apr 52448.6 52272.7 454.6 53.8 0.2 53.6 400.7 51243.2 41157.6 10085.6 575.0 - 575.0 175.9
May 52715.4 52521.7 448.3 0.3 0.2 0.1 448.0 51527.5 41599.3 9928.2 545.9 - 545.9 193.7
Jun 52399.7 52163.4 418.0 1.0 1.0 - 417.0 51141.0 41372.9 9768.0 604.4 - 604.4 236.3
Jul 52665.2 52265.5 449.2 0.1 0.1 - 449.1 51294.3 41820.3 9474.0 522.0 - 522.0 399.8
Aug 52371.6 51966.0 451.7 3.7 0.2 3.5 448.0 51005.7 41326.0 9679.7 508.6 - 508.6 405.7
Sep 53595.7 53173.7 468.7 3.8 0.1 3.7 464.9 52194.6 43086.3 9108.3 510.4 - 510.4 422.1
Oct 53687.0 53322.3 462.5 32.4 28.7 3.7 430.1 52368.5 43235.8 9132.7 491.3 - 491.3 364.7
Nov 54557.8 54144.5 623.6 34.3 0.5 33.8 589.3 53020.7 43789.1 9231.5 500.2 - 500.2 413.4
Dec 54660.3 54270.9 458.8 39.2 - 39.2 419.6 53152.3 43800.8 9351.5 659.7 - 659.7 389.4
2001
Jan 54629.3 53671.3 512.0 49.3 - 49.3 462.7 52631.4 43635.5 8995.9 527.9 - 527.9 957.9
Feb 55045.3 53912.3 727.8 9.5 - 9.5 718.3 52673.5 43707.2 8966.3 511.0 - 511.0 1133.0
Mar 54483.7 53497.2 633.8 3.0 3.0 0.0 630.9 52186.8 43056.1 9130.7 676.6 - 676.6 986.5
Apr 54542.4 53576.9 704.0 0.0 - 0.0 704.0 52271.1 43215.1 9056.0 601.8 - 601.8 965.5
May 53998.2 53072.9 552.5 5.1 0.2 4.9 547.4 51920.2 42633.7 9286.6 600.2 - 600.2 925.3
Jun 54001.6 53059.4 680.9 24.1 0.1 24.0 656.8 51697.5 42406.0 9291.5 681.0 - 681.0 942.2
Jul 53950.4 53138.1 461.9 24.7 0.3 24.4 437.2 52171.5 42695.1 9476.4 504.7 - 504.7 812.4
Aug 54322.4 53454.9 587.5 24.9 0.1 24.7 562.7 52380.8 42937.5 9443.4 486.6 - 486.6 867.5
Sep 52829.8 51987.0 731.2 28.0 - 28.0 703.2 50737.6 41795.0 8942.6 518.2 1.4 516.8 842.8
Oct 53073.5 52223.7 877.6 28.6 0.1 28.4 849.0 50885.5 41998.6 8886.8 460.7 - 460.7 849.8
Nov 52699.2 51921.3 604.7 0.0 - 0.0 604.7 50858.5 41314.2 9544.3 458.1 - 458.1 777.9
Dec 52432.9 51476.0 852.8 1.2 - 1.2 851.6 50159.6 41197.1 8962.5 463.7 - 463.7 956.8
Source: Commercial Banks1 Exclude other local securities, other credit instruments and real estate mortgage loans
Back to Annexe
TABLE 2-XCOMMERCIAL BANKS: TOTAL LOANS AND ADVANCES
(G$ Million)
Cent.
Gov't
Local
Gov't
Non
Fin.
Enter.
Non -
ResidentsTotal Public Private
Total
Private
Sector
Business
Enterprises
Individual
CustomerTotal
Gen.
Gov't
Total
Public
Sector
End Of
Period
Total
Loans
Residents
& Non-
Residents
Total
Residents

Public Sector Private Sector 1 Non-Bank Fin. Instits.
General Government
1990 3158.1 3145.1 591.2 36.4 34.7 1.7 554.8 2552.7 2092.9 459.8 1.2 0.1 1.1 13.0
1991 4559.8 4554.2 334.7 24.2 20.6 3.6 310.5 4157.5 3477.9 679.6 62.0 61.0 1.0 5.6
1992 6848.1 6541.8 903.1 68.1 40.2 27.9 835.0 5634.0 4728.1 905.9 4.6 3.0 1.6 306.4
1993 8669.2 8174.8 544.2 73.6 37.3 36.3 470.6 7602.5 6238.1 1364.4 28.1 1.5 26.6 494.4
1994 11628.0 10586.4 220.6 32.6 32.5 0.1 188.0 10352.6 8108.3 2244.3 13.2 - 13.2 1041.7
1995 16221.1 15245.9 478.5 68.8 33.3 35.5 409.7 14694.2 10932.9 3761.3 73.1 - 73.1 975.2
1996 23878.1 23061.8 284.0 29.5 28.5 1.0 254.5 22618.5 18580.2 4038.3 159.4 33.6 125.8 816.3
1997 28700.7 28325.1 219.9 4.1 - 4.1 215.8 28043.3 23135.5 4907.8 61.9 9.9 52.0 375.6
1998
Mar 29359.0 28852.1 291.6 43.5 0.2 43.3 248.1 28493.7 23344.4 5149.3 66.8 12.1 54.7 506.9
Jun 30666.5 30394.8 408.1 29.8 1.8 28.0 378.3 29611.1 24256.8 5354.3 375.6 16.0 359.6 271.7
Sep 30864.3 30571.3 463.7 39.3 1.8 37.5 424.4 30015.7 25168.2 4847.5 91.9 17.1 74.8 293.0
Dec 32419.5 32132.8 358.0 0.2 0.2 - 357.8 31586.8 26406.6 5180.2 188.0 29.8 158.2 286.7
1999
Mar 34441.1 34057.0 290.8 0.2 0.2 - 290.6 33738.2 28309.3 5428.9 28.0 - 28.0 384.1
Jun 33186.1 32858.3 263.3 44.3 0.4 43.9 219.0 32563.4 27099.4 5464.0 31.6 - 31.6 327.8
Sep 33828.0 33261.4 450.7 68.1 - 68.1 382.6 32741.8 26846.7 5895.1 68.9 - 68.9 566.6
Dec 34959.2 34591.5 640.8 47.8 0.2 47.6 593.0 33929.5 27367.8 6561.7 21.2 - 21.2 367.7
2000
Jan 34541.5 34306.3 338.5 52.4 0.1 52.3 286.1 33573.4 27125.4 6448.0 394.4 1.2 393.1 235.2
Feb 33920.6 33765.0 379.2 50.2 0.5 49.6 329.0 33369.5 26935.6 6433.9 16.3 - 16.3 155.6
Mar 33821.1 33634.8 474.1 54.2 3.6 50.6 419.9 33103.1 26695.6 6407.5 57.6 - 57.6 186.3
Apr 33175.8 33051.9 354.6 53.8 0.2 53.6 300.7 32638.8 26093.9 6544.9 58.6 - 58.6 123.9
May 33861.6 33725.6 348.3 0.3 0.2 0.1 348.0 33334.7 26668.2 6666.5 42.6 - 42.6 135.9
Jun 33443.2 33279.2 328.0 1.0 1.0 - 327.0 32844.8 26211.1 6633.6 106.4 - 106.4 164.0
Jul 33516.9 33195.3 359.2 0.1 0.1 - 359.1 32803.8 26470.6 6333.2 32.3 - 32.3 321.6
Aug. 33440.8 33218.6 361.7 3.7 0.2 3.5 358.0 32831.8 26321.8 6509.9 25.2 - 25.2 222.2
Sep 32757.4 32461.0 377.8 3.8 0.1 3.7 374.0 32054.6 26068.7 5985.9 28.7 - 28.7 296.4
Oct 32758.9 32522.6 371.6 32.4 28.7 3.7 339.2 32134.7 26182.4 5952.3 16.2 - 16.2 236.4
Nov 33197.0 32932.3 532.7 34.3 0.5 33.8 498.4 32374.2 26374.3 5999.9 25.3 - 25.3 264.7
Dec 33058.3 32820.6 368.0 39.2 - 39.2 328.8 32262.0 26269.8 5992.3 190.6 - 190.6 237.8
2001
Jan 32930.2 32123.4 421.3 49.3 - 49.3 371.9 31636.8 26419.5 5217.4 65.3 - 65.3 806.8
Feb 33255.2 32259.2 637.1 9.5 - 9.5 627.6 31249.1 26171.5 5077.6 372.9 - 372.9 996.1
Mar 32375.0 32059.2 543.1 3.0 3.0 - 540.2 31294.6 26083.8 5210.8 221.5 - 221.5 315.8
Apr 32475.9 32163.2 613.3 0.0 - - 613.3 31399.4 26087.6 5311.8 150.5 - 150.5 312.7
May 31847.4 31549.5 461.9 5.1 0.2 4.9 456.8 30936.6 25494.9 5441.7 151.1 - 151.1 297.8
Jun 32210.2 31479.8 585.3 24.1 0.1 24.0 561.2 30658.7 25309.4 5349.3 235.7 - 235.7 730.4
Jul 32331.9 31725.5 376.5 24.7 0.3 24.4 351.8 31268.1 25860.7 5407.5 80.8 - 80.8 606.4
Aug. 32722.2 32215.3 502.4 24.9 0.1 24.7 477.5 31636.0 26318.5 5317.4 77.0 - 77.0 506.8
Sep 31080.4 30581.2 646.1 28.0 - 28.0 618.1 29843.7 24881.9 4961.7 91.4 1.4 90.0 499.2
Oct 31186.3 30668.4 713.7 28.6 0.1 28.4 685.1 29924.0 25030.9 4893.1 30.8 - 30.8 517.9
Nov 30818.4 30312.2 440.9 0.0 - - 440.9 29839.2 24850.3 4988.9 32.1 - 32.1 506.2
Dec 30014.5 29734.2 699.2 1.2 - 1.2 698.0 28993.4 24285.3 4708.1 41.6 - 41.6 280.3
Source: Commercial Banks1 Exclude other local securities, other credit instruments and real estate mortgage loans
Back to Annexe
TABLE 2-XI
Private
Non -
ResidentsCent.
Gov't
Individual
Cust.Total PublicLocal
Gov't
COMMERCIAL BANKS: DEMAND LOANS AND ADVANCES
(G$ Million)
Total
Public
Sector
Non
Fin.
Enter.
Total
Private
Sector
Business
Enterprises
End Of
Period
Total
Loans
Residents
& Non-
Residents
Total
Residents Total
Gen.
Gov't

Public Sector Private Sector 1 Non-Bank Fin. Instits.
General Government
1990 1756.3 1756.3 200.2 - - - 200.2 1556.0 1275.1 280.9 0.1 - 0.1 -
1991 2531.9 2531.9 69.0 20.6 20.6 - 48.4 2462.8 2164.8 298.0 0.1 - 0.1 -
1992 3048.3 3046.4 - - - - - 3046.2 2527.0 519.2 0.2 - 0.2 1.9
1993 2607.5 2604.0 - - - - - 2604.0 1877.5 726.5 - - - 3.5
1994 3447.7 3446.4 - - - - - 3446.4 2473.0 973.4 - - - 1.3
1995 5968.5 5962.6 - - - - - 5962.6 4363.9 1598.6 - - - 5.9
1996 13283.6 13269.4 - - - - - 13245.5 11215.3 2030.2 23.9 - 23.9 14.2
1997 15839.4 14934.7 0.9 0.5 0.5 - 0.4 14877.6 11016.8 3860.8 56.2 - 56.2 904.7
1998
Mar 15484.0 15215.0 0.8 0.5 0.5 - 0.3 15189.1 10506.5 4682.6 25.1 - 25.1 269.0
Jun 15843.9 15529.1 0.7 0.4 0.4 - 0.3 15491.8 12582.9 2908.9 36.6 - 36.6 314.8
Sep 17630.8 17498.9 1.4 0.4 0.4 - 1.0 17454.4 13283.9 4170.5 43.1 - 43.1 131.9
Dec 17628.7 17345.3 52.9 0.4 0.4 - 52.5 17285.3 12518.7 4766.6 7.1 - 7.1 283.4
1999
Mar 17288.2 16977.8 49.6 0.4 0.4 - 49.2 16921.8 12266.3 4655.5 6.3 - 6.3 310.4
Jun 18564.9 18459.3 100.6 0.1 - 0.1 100.5 18353.3 14196.6 4156.7 5.4 - 5.4 105.6
Sep 19004.0 18925.6 100.0 - - - 100.0 18369.5 14314.0 4055.5 456.1 - 456.1 78.4
Dec 18925.9 18874.0 90.0 - - - 90.0 18236.5 14336.5 3900.0 547.4 - 547.4 51.9
2000
Jan 18593.1 18448.6 100.0 - - - 100.0 18190.2 14656.1 3534.1 158.4 - 158.4 144.5
Feb 19020.5 18818.4 100.0 - - - 100.0 18201.2 14712.8 3488.4 517.3 - 517.3 202.1
Mar 19327.9 19236.0 100.0 - - - 100.0 18621.7 15047.6 3574.1 514.3 - 514.3 91.9
Apr 19272.8 19220.8 100.0 - - - 100.0 18604.4 15063.7 3540.7 516.4 - 516.4 52.1
May 18853.9 18796.1 100.0 - - - 100.0 18192.7 14931.1 3261.7 503.4 - 503.4 57.8
Jun 18956.5 18884.2 90.0 - - - 90.0 18296.2 15161.8 3134.4 498.0 - 498.0 72.3
Jul 19148.3 19070.2 90.0 - - - 90.0 18490.5 15349.6 3140.8 489.7 - 489.7 78.1
Aug. 18930.9 18747.4 90.0 - - - 90.0 18174.0 15004.2 3169.7 483.5 - 483.5 183.4
Sep 20838.3 20712.7 90.9 - - - 90.9 20140.1 17017.6 3122.5 481.7 - 481.7 125.7
Oct 20928.1 20799.7 90.9 - - - 90.9 20233.7 17053.4 3180.4 475.1 - 475.1 128.4
Nov 21360.8 21212.2 90.8 - - - 90.8 20646.4 17414.9 3231.6 474.9 - 474.9 148.6
Dec 21601.9 21450.3 90.8 - - - 90.8 20890.3 17531.1 3359.2 469.2 - 469.2 151.7
2001
Jan 21699.1 21548.0 90.8 - - - 90.8 20994.6 17216.1 3778.5 462.6 - 462.6 151.1
Feb 21790.1 21653.2 90.7 - - - 90.7 21424.3 17535.6 3888.7 138.1 - 138.1 136.9
Mar 22108.7 21438.0 90.7 - - - 90.7 20892.2 16972.3 3919.9 455.1 - 455.1 670.7
Apr 22066.6 21413.7 90.6 - - - 90.6 20871.8 17127.5 3744.2 451.3 - 451.3 652.9
May 22150.8 21523.3 90.6 - - - 90.6 20983.6 17138.7 3844.9 449.1 - 449.1 627.5
Jun 21791.4 21579.6 95.6 - - - 95.6 21038.8 17096.5 3942.2 445.3 - 445.3 211.8
Jul 21618.6 21412.6 85.4 - - - 85.4 20903.3 16834.4 4068.9 423.8 - 423.8 206.0
Aug. 21600.3 21239.6 85.2 - - - 85.2 20744.9 16618.9 4125.9 409.6 - 409.6 360.6
Sep 21749.5 21405.9 85.1 - - - 85.1 20894.0 16913.1 3980.9 426.8 - 426.8 343.6
Oct 21887.1 21555.3 164.0 - - - 164.0 20961.5 16967.7 3993.8 429.9 - 429.9 331.9
Nov 21880.8 21609.1 163.8 - - - 163.8 21019.3 16463.9 4555.4 426.0 - 426.0 271.7
Dec 22418.3 21741.8 153.6 - - - 153.6 21166.2 16911.8 4254.4 422.0 - 422.0 676.5
S'ource: Commercial Banks1 Exclude other local securities, other credit instruments and real estate mortgage loans
Back to Annexe
Non -
ResidentsTotal
Public
Sector
Non
Fin.
Enter.
Total
Private
Sector
Business
Enterprises
Individual
Cust.Total Public PrivateTotal
Gen.
Gov't
Local
Gov't
(G$ Million)
TABLE 2-XIICOMMERCIAL BANKS: TERM LOANS AND ADVANCES
End Of
Period
Total
Loans
Residents
& Non-
Residents
Total
Residents Cent.
Gov't

COMMERCIAL BANKS: LOANS & ADVANCES TO RESIDENTS BY SECTOR
Back to Annexe
1994 1995
Pub. Priv. Pub. Priv. Pub. Priv. Pub. Priv. Pub. Priv.
GENERAL GOVERNMENT 33.3 - 68.8 - 29.5 - 7.1 - 0.6 -
FINANCIAL INSTITUTIONS - 13.2 - 73.1 33.6 149.7 9.9 108.2 29.8 165.3
Pub. Finan. Instits. - - - - 33.6 - 9.9 - 29.8 -
Co-op Finan. Instits. - 0.3 - 10.4 - 0.2 - 5.4 - -
Insurance Companies - 1.9 - 46.7 - 103.9 - 25.1 - 77.8
Building Societies - 1.4 - - - - - 42.8 - -
Credit Unions - - - - - - - - - -
Brokers and Money Lenders - 1.1 - 5.0 - 23.9 - 21.3 - 6.0
Trust & Investment Companies - 8.5 - 11.1 - 21.7 - 13.7 - 81.4
Pension Funds - - - - - - - - - -
BUSINESS ENTERPRISES 188.0 10650.8 409.7 15372.4 254.5 29754.6 216.2 34152.3 410.2 38925.7
Agriculture - 1765.0 121.3 3324.4 0.3 7949.7 63.3 7265.5 62.6 8978.2
Sugarcane - 65.6 120.9 26.1 - 32.8 - 185.9 - 181.2
Paddy - 963.2 - 2263.3 - 6704.6 58.0 4310.9 51.5 6140.3
Other Farming - 157.9 - 173.9 - 165.2 1.0 267.1 10.5 396.5
Livestock - 211.0 0.5 401.4 0.3 596.6 - 938.2 0.4 787.8
Forestry - 158.0 - 168.8 - 111.8 - 793.3 - 794.5
Shrimp & Other Fishing - 209.3 - 291.0 - 338.7 4.3 770.2 0.1 677.8
Mining & Quarrying 110.0 641.7 227.8 839.3 148.4 1016.2 48.9 918.2 176.8 1041.7
Bauxite 110.0 21.1 227.8 0.9 148.4 8.2 48.9 6.2 176.8 28.8
Other - 620.6 - 838.4 - 1008.0 - 912.0 - 1012.9
Manufacturing 75.3 2402.2 60.5 3194.9 23.0 8313.8 102.4 12642.2 131.7 13749.2
Timber and Sawmilling - 605.6 - 570.0 - 938.1 - 1833.6 - 1967.3
Other Construction and Engin. - 438.9 0.1 554.1 - 1162.9 0.1 1769.2 - 2198.4
Sugar Molasses - - - 26.3 - 19.0 - 17.6 - 16.3
Rice Milling - 497.2 - 497.5 - 3944.8 72.8 5097.1 78.9 5109.9
Beverages, Food & Tobacco - 98.6 - 705.9 - 997.0 - 910.5 - 905.0
Textiles & Clothing 46.5 119.9 33.7 145.2 22.7 178.9 29.5 398.7 52.8 384.8
Electricity - 3.4 - 0.7 - 2.3 - 163.0 - 160.0
Other Manufacturing 28.7 638.5 26.7 695.3 0.2 1070.9 - 2452.5 - 3007.5
Services 2.7 5841.9 - 8013.8 82.8 12474.9 1.6 13326.4 39.1 15156.6
Drainage & Irrigation - 2.3 - 45.3 - 82.5 - 393.9 0.3 489.0
Transportation - 362.1 - 634.1 82.8 676.2 - 879.2 38.6 842.7
Telecommunications - 2.2 - 5.2 - 12.6 - 70.5 - 100.7
Entertaining & Catering - 325.9 - 678.3 - 683.8 - 962.0 - 1103.6
Distribution 2.7 3246.6 - 4712.6 - 7025.9 1.6 7636.7 0.3 8715.0
Education - 108.4 - 30.6 - 82.0 - 95.0 - 113.2
Health - 23.5 - 24.5 - 88.7 - 297.3 - 255.2
Professional Services - 321.3 - 482.3 - 399.9 - 592.6 - 559.7
Other Services - 1449.7 - 1400.9 - 3423.2 - 2399.1 - 2977.6
HOUSEHOLDS - 3125.1 - 5284.3 - 6109.4 - 8768.6 - 9946.8
Housing - 717.9 - 1376.8 - 2125.2 - 2469.3 - 2943.2
Motor Cars - 329.2 - 415.0 - 601.2 - 877.6 - 722.8
Other Durable Goods - 167.0 - 129.8 - 198.3 - 150.0 - 598.7
Education - 6.6 - 33.4 - 144.8 - 58.3 - 456.3
Travel - 6.4 - 9.4 - 166.5 - 70.3 - 452.1
Other Purpose - 1898.0 - 3319.9 - 2873.5 - 5143.1 - 4773.7
TOTAL 221.2 13789.2 478.5 20729.9 317.6 36013.7 233.2 43029.1 440.6 49037.8
Source: Commercial Banks.
1998
Dec
TABLE 2-XIII(a)
(G$ Million)
Item Dec Dec
1996 1997
Dec Dec

Back to Annexe
1999
Item Dec.
Pub. Priv. Pub. Priv. Pub. Priv. Pub. Priv.
GENERAL GOVERNMENT 0.6 44.4 68.1 47.9
FINANCIAL INSTITUTIONS - 34.3 - 37.0 - 525.0 - 568.6
Pub. Finan. Instits. - - - - - - - -
Co-op Finan. Instits. - 0.1 - 0.1 - 0.1 - -
Insurance Companies - 28.8 - 27.9 - 453.1 - 485.8
Building Societies - - - - - - - 1.3
Credit Unions - - - - - - - -
Brokers and Money Lenders - 5.4 - 9.0 - 56.6 - 6.2
Trust & Investment Companies - - - - - 15.3 - 75.3
Pension Funds - - - - - - - -
BUSINESS ENTERPRISES 339.6 40866.7 319.3 41686.3 482.6 41619.0 683.0 42129.2
Agriculture 64.4 8698.3 10.4 8234.4 13.6 8249.5 81.6 8093.6
Sugarcane - 82.2 - 68.1 - 76.5 70.3 62.7
Paddy 48.5 6131.7 - 5559.6 - 5636.5 10.3 5443.4
Other Farming 10.9 321.4 10.1 336.0 10.6 276.5 - 333.6
Livestock 0.4 888.2 - 846.3 - 857.4 - 884.8
Forestry - 727.4 - 714.9 - 720.2 0.9 711.3
Shrimp & Other Fishing 4.6 547.4 0.3 709.5 3.0 682.5 - 658.0
Mining & Quarrying 85.7 1079.6 73.0 1001.9 223.0 1030.0 208.7 1037.3
Bauxite 85.7 43.5 73.0 49.9 223.0 9.0 208.7 2.5
Other - 1036.1 - 952.0 - 1021.0 - 1034.8
Manufacturing 127.6 14506.5 186.3 15925.2 198.1 15305.5 199.2 15914.0
Timber and Sawmilling - 2051.2 - 2215.1 - 2333.1 - 2299.9
Other Constr. and Engin. - 2524.1 - 2535.8 - 2555.3 - 2764.3
Sugar Molasses - 16.3 - - - - - 140.9
Rice Milling 77.1 4971.9 138.1 5864.9 152.5 5694.5 156.5 6098.1
Beverages, Food & Tobacco - 1078.7 - 992.5 - 1004.2 - 1241.8
Textiles & Clothing 50.5 281.6 48.2 295.4 45.6 331.8 42.6 127.1
Electricity - 104.9 - 256.3 - 221.4 - 2.1
Other Manufacturing - 3477.8 - 3765.1 - 3165.3 - 3239.8
Services 61.9 16582.3 49.6 16524.8 47.9 17034.1 193.5 17084.3
Drainage & Irrigation 0.1 428.0 - 462.8 - 514.4 - 173.6
Transportation 53.1 1008.4 46.8 1216.2 47.9 1015.4 52.9 963.1
Telecommunications - 36.2 - 36.2 - 59.0 - 1.7
Entertaining & Catering - 1324.2 - 1253.8 - 1299.7 - 1433.3
Distribution 8.7 9224.2 2.8 9035.9 - 9271.9 140.6 10322.7
Education - 109.8 - 82.1 - 82.5 - 81.4
Health - 135.4 - 151.5 - 555.1 - 135.8
Professional Services - 725.4 - 863.9 - 1265.0 - 780.6
Other Services - 3590.7 - 3422.3 - 2971.3 - 3192.1
HOUSEHOLDS - 10084.3 - 9620.8 - 9950.6 - 10461.7
Housing - 3563.6 - 3205.9 - 3424.4 - 3335.1
Motor Cars - 1452.5 - 983.5 - 1055.1 - 961.6
Other Durable Goods - 724.5 - 671.1 - 550.0 - 320.1
Education - 153.6 - 176.1 - 254.9 - 86.4
Travel - 92.7 - 215.0 - 269.9 - 42.6
Other Purposes - 4097.4 - 4369.2 - 4396.2 - 5715.9
TOTAL 340.2 50985.3 363.7 51344.1 550.7 52094.6 730.8 53159.5
Source: Commercial Banks.
Mar Jun Sep
TABLE 2-XIII(b)COMMERCIAL BANKS: LOANS & ADVANCES TO RESIDENTS BY SECTOR
(G$ Million)
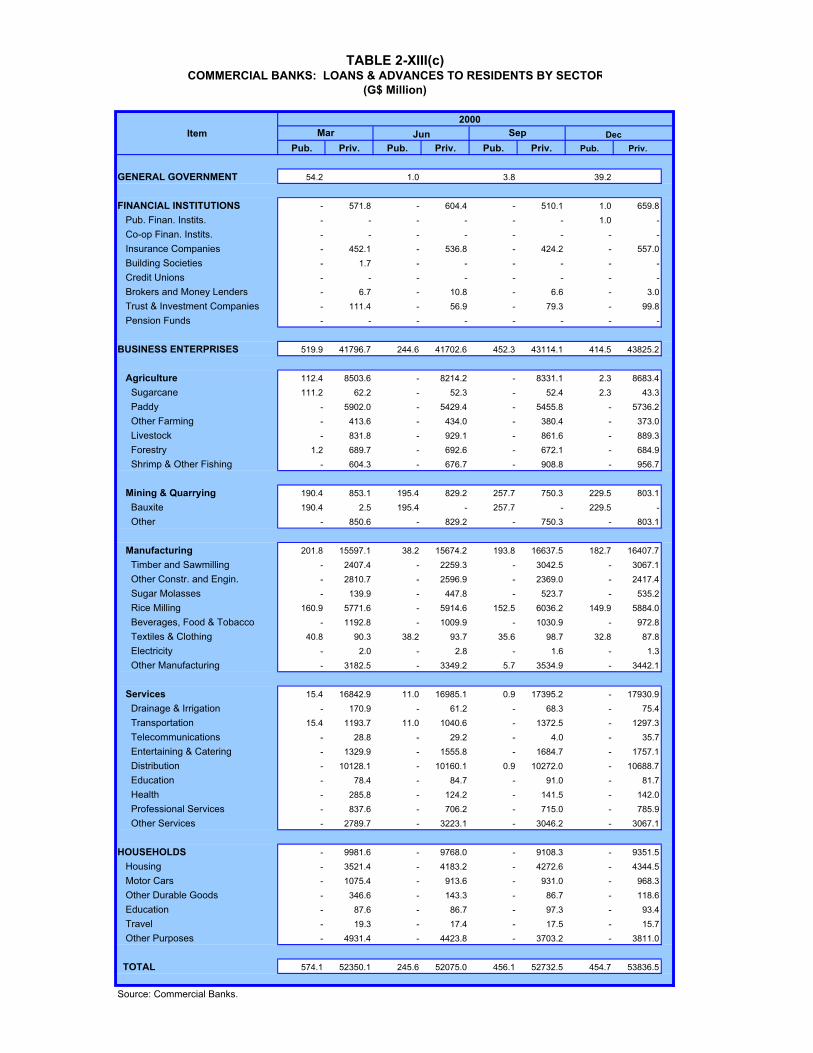
Back to Annexe
2000
Pub. Priv. Pub. Priv. Pub. Priv. Pub. Priv.
GENERAL GOVERNMENT 54.2 1.0 3.8 39.2
FINANCIAL INSTITUTIONS - 571.8 - 604.4 - 510.1 1.0 659.8
Pub. Finan. Instits. - - - - - - 1.0 -
Co-op Finan. Instits. - - - - - - - -
Insurance Companies - 452.1 - 536.8 - 424.2 - 557.0
Building Societies - 1.7 - - - - - -
Credit Unions - - - - - - - -
Brokers and Money Lenders - 6.7 - 10.8 - 6.6 - 3.0
Trust & Investment Companies - 111.4 - 56.9 - 79.3 - 99.8
Pension Funds - - - - - - - -
BUSINESS ENTERPRISES 519.9 41796.7 244.6 41702.6 452.3 43114.1 414.5 43825.2
Agriculture 112.4 8503.6 - 8214.2 - 8331.1 2.3 8683.4
Sugarcane 111.2 62.2 - 52.3 - 52.4 2.3 43.3
Paddy - 5902.0 - 5429.4 - 5455.8 - 5736.2
Other Farming - 413.6 - 434.0 - 380.4 - 373.0
Livestock - 831.8 - 929.1 - 861.6 - 889.3
Forestry 1.2 689.7 - 692.6 - 672.1 - 684.9
Shrimp & Other Fishing - 604.3 - 676.7 - 908.8 - 956.7
Mining & Quarrying 190.4 853.1 195.4 829.2 257.7 750.3 229.5 803.1
Bauxite 190.4 2.5 195.4 - 257.7 - 229.5 -
Other - 850.6 - 829.2 - 750.3 - 803.1
Manufacturing 201.8 15597.1 38.2 15674.2 193.8 16637.5 182.7 16407.7
Timber and Sawmilling - 2407.4 - 2259.3 - 3042.5 - 3067.1
Other Constr. and Engin. - 2810.7 - 2596.9 - 2369.0 - 2417.4
Sugar Molasses - 139.9 - 447.8 - 523.7 - 535.2
Rice Milling 160.9 5771.6 - 5914.6 152.5 6036.2 149.9 5884.0
Beverages, Food & Tobacco - 1192.8 - 1009.9 - 1030.9 - 972.8
Textiles & Clothing 40.8 90.3 38.2 93.7 35.6 98.7 32.8 87.8
Electricity - 2.0 - 2.8 - 1.6 - 1.3
Other Manufacturing - 3182.5 - 3349.2 5.7 3534.9 - 3442.1
Services 15.4 16842.9 11.0 16985.1 0.9 17395.2 - 17930.9
Drainage & Irrigation - 170.9 - 61.2 - 68.3 - 75.4
Transportation 15.4 1193.7 11.0 1040.6 - 1372.5 - 1297.3
Telecommunications - 28.8 - 29.2 - 4.0 - 35.7
Entertaining & Catering - 1329.9 - 1555.8 - 1684.7 - 1757.1
Distribution - 10128.1 - 10160.1 0.9 10272.0 - 10688.7
Education - 78.4 - 84.7 - 91.0 - 81.7
Health - 285.8 - 124.2 - 141.5 - 142.0
Professional Services - 837.6 - 706.2 - 715.0 - 785.9
Other Services - 2789.7 - 3223.1 - 3046.2 - 3067.1
HOUSEHOLDS - 9981.6 - 9768.0 - 9108.3 - 9351.5
Housing - 3521.4 - 4183.2 - 4272.6 - 4344.5
Motor Cars - 1075.4 - 913.6 - 931.0 - 968.3
Other Durable Goods - 346.6 - 143.3 - 86.7 - 118.6
Education - 87.6 - 86.7 - 97.3 - 93.4
Travel - 19.3 - 17.4 - 17.5 - 15.7
Other Purposes - 4931.4 - 4423.8 - 3703.2 - 3811.0
TOTAL 574.1 52350.1 245.6 52075.0 456.1 52732.5 454.7 53836.5
Source: Commercial Banks.
Sep Dec
TABLE 2-XIII(c)COMMERCIAL BANKS: LOANS & ADVANCES TO RESIDENTS BY SECTOR
(G$ Million)
Item Mar Jun

Back to Annexe
Pub. Priv. Pub. Priv. Pub. Priv. Pub. Priv. Pub. Priv. Pub. Priv.
GENERAL GOVERNMENT 49.3 9.5 3.0 - 5.1 24.1
FINANCIAL INSTITUTIONS - 527.9 - 511.0 - 676.6 - 601.8 - 600.2 - 681.0
Pub. Finan. Instits. - - - - - - - - - - - -
Co-op Finan. Instits. - - - - - - - - - - - -
Insurance Companies - 434.3 - 418.4 - 588.7 - 497.1 - 514.9 - 603.6
Building Societies - - - - - - - - - - - -
Credit Unions - - - - - - - - - - - -
Brokers and Money Lenders - 7.0 - 5.5 - 11.2 - 14.1 - 10.2 - 16.2
Trust & Investment Companies - 86.5 - 87.2 - 76.7 - 90.6 - 75.1 - 61.2
Pension Funds - - - - - - - - - - - -
BUSINESS ENTERPRISES 455.7 44336.3 712.1 44545.6 633.9 43129.8 704.0 43368.1 547.4 42734.9 656.8 42701.5
Agriculture 21.6 9052.7 - 9014.5 - 8978.9 6.7 8900.3 19.6 8680.5 25.0 8559.2
Sugarcane 21.6 117.0 - 118.2 - 121.0 - 120.9 - 123.2 - 126.9
Paddy - 5719.2 - 5776.0 - 5767.5 6.7 5631.2 7.0 5651.4 6.5 5554.0
Other Farming - 388.6 - 379.5 - 374.9 - 379.3 - 389.4 - 362.5
Livestock - 851.6 - 835.1 - 775.1 - 779.4 - 796.5 - 783.3
Forestry - 760.7 - 759.0 - 858.9 - 879.5 12.6 850.3 18.6 881.8
Shrimp & Other Fishing - 1215.6 - 1146.8 - 1081.3 - 1110.0 - 869.6 - 850.7
Mining & Quarrying 253.0 799.6 548.3 783.2 461.7 794.0 530.7 776.6 360.2 748.0 458.3 740.0
Bauxite 205.6 - 548.3 - 461.7 - 530.7 - 360.2 - 458.3 -
Other 47.4 799.6 - 783.2 - 794.0 - 776.6 - 748.0 - 740.0
Manufacturing 181.1 16602.2 163.8 17070.1 164.5 15853.1 166.0 16081.5 166.9 16093.9 167.9 15907.3
Timber and Sawmilling - 2973.3 - 2964.3 - 2550.3 - 2513.8 - 2419.9 - 2450.6
Other Constr. and Engin. - 2520.6 - 2486.4 - 2368.1 - 2500.3 - 2456.8 - 2468.0
Sugar Molasses - 542.2 - 547.1 - 535.6 - 567.9 - 555.7 - 569.5
Rice Milling 149.3 5850.2 147.2 5939.3 148.0 5608.4 149.4 5709.2 150.4 5920.4 151.4 5854.7
Beverages, Food & Tobacco - 1143.6 - 951.2 - 852.0 - 1245.8 - 752.3 - 686.2
Textiles & Clothing 31.8 92.0 16.5 105.0 16.5 101.2 16.5 96.5 16.5 93.2 16.5 92.0
Electricity - 1.2 - 1.2 - 0.5 - 0.9 - 0.4 - 0.4
Other Manufacturing - 3479.1 - 4075.7 - 3836.9 - 3447.1 - 3895.2 - 3785.9
Services - 17881.8 - 17677.8 7.7 17503.9 0.6 17609.7 0.6 17212.5 5.6 17495.0
Drainage & Irrigation - 60.6 - 59.6 - 60.4 - 53.6 - 68.1 - 68.3
Transportation - 1255.2 - 1211.2 - 1179.8 - 1180.7 - 1198.0 - 1132.7
Telecommunications - 37.3 - 42.6 - 47.4 - 41.3 - 16.5 - 45.4
Entertaining & Catering - 1712.0 - 1685.8 - 1688.7 - 1757.4 - 1821.1 - 1804.5
Distribution - 10665.8 - 10648.4 - 10675.1 - 10600.1 - 10206.2 - 10497.5
Education - 102.6 - 108.4 - 93.8 - 95.1 - 101.9 - 101.0
Health - 155.0 - 139.8 - 129.2 - 122.6 - 127.9 - 169.7
Professional Services - 829.9 - 750.9 - 837.2 - 885.4 - 886.3 - 875.9
Other Services - 3063.5 - 3031.0 7.7 2792.4 0.6 2873.6 0.6 2786.4 5.6 2800.0
HOUSEHOLDS - 8995.9 - 8966.3 - 9201.9 - 9056.0 - 9337.9 - 9291.5
Housing - 4463.4 - 4400.1 - 4098.3 - 4356.3 - 4432.2 - 4429.4
Motor Cars - 1022.3 - 1036.7 - 1284.7 - 1037.0 - 1053.9 - 1059.4
Other Durable Goods - 118.8 - 117.9 - 504.8 - 113.9 - 111.7 - 111.5
Education - 95.8 - 94.8 - 104.0 - 92.6 - 93.7 - 95.9
Travel - 15.3 - 14.4 - 13.0 - 12.6 - 11.7 - 13.1
Other Purposes - 3280.4 - 3302.4 - 3197.1 - 3443.5 - 3634.6 - 3582.1
TOTAL 505.0 53860.0 721.5 54023.0 636.8 53008.3 704.0 53026.0 552.5 52673.0 680.9 52674.0
Source: Commercial Banks.
2001
Item Jan.
TABLE 2-XIII(d)COMMERCIAL BANKS: LOANS & ADVANCES TO RESIDENTS BY SECTOR
(G$ Million)
Feb. Apr. May. Jun.Mar.

Back to Annexe
Pub. Priv. Pub. Priv. Pub. Priv. Pub. Priv. Pub. Priv. Pub. Priv.
GENERAL GOVERNMENT 24.7 - 24.9 - 28.0 - 28.6 - - - 1.2 -
FINANCIAL INSTITUTIONS - 504.7 - 486.6 1.4 516.8 - 460.7 - 458.1 - 463.7
Pub. Finan. Instits. - - - - 1.4 - - - - - - -
Co-op Finan. Instits. - - - - - - - - - - - -
Insurance Companies - 434.7 - 413.2 - 400.2 - 380.9 - 379.2 - 385.6
Building Societies - - - - - - - - - - - -
Credit Unions - - - - - - - - - - - -
Brokers and Money Lenders - 11.4 - 14.1 - 12.3 - 4.7 - 5.2 - 8.6
Trust & Investment Companies - 58.5 - 59.3 - 104.3 - 75.0 - 73.7 - 69.5
Pension Funds - - - - - - - - - - - -
BUSINESS ENTERPRISES 437.2 42879.3 562.7 43174.0 703.2 41743.8 849.0 42212.0 604.7 42009.0 851.6 41758.9
Agriculture 4.8 8394.1 6.6 8411.6 6.5 8057.7 7.0 8053.1 6.8 7930.3 7.3 8172.9
Sugarcane - 124.4 - 124.6 - 125.5 - 123.9 - 123.0 - 122.2
Paddy 4.8 5477.7 6.6 5478.7 6.2 5288.7 6.8 5255.2 6.8 5070.4 6.3 5399.5
Other Farming - 250.8 - 242.5 - 188.4 - 187.3 - 235.5 - 180.6
Livestock - 784.1 - 771.0 - 709.2 - 747.4 - 748.2 - 579.0
Forestry - 916.3 - 964.5 0.3 896.0 0.1 906.4 - 863.7 1.0 935.3
Shrimp & Other Fishing - 840.9 - 830.3 - 849.9 - 832.9 - 889.4 - 956.2
Mining & Quarrying 252.8 758.4 367.4 749.7 516.1 738.3 661.6 730.1 417.6 715.2 660.4 737.3
Bauxite 252.8 - 367.4 - 516.1 - 661.6 - 417.6 - 660.4 -
Other - 758.4 - 749.7 - 738.3 - 730.1 - 715.2 - 737.3
Manufacturing 174.2 16194.7 175.5 16155.0 174.2 15846.1 175.5 15893.8 175.5 15862.3 179.2 15486.4
Timber and Sawmilling - 2442.7 - 2475.5 - 2499.1 - 2427.2 - 2431.8 - 2437.1
Other Constr. and Engin. - 2455.3 - 2496.5 - 2473.8 - 2441.3 - 2456.9 - 2441.7
Sugar Molasses - 585.7 - 595.0 - 614.8 - 936.8 - 979.7 - 997.8
Rice Milling 157.7 6008.8 159.0 5910.2 157.7 5918.4 159.0 5689.6 159.0 5675.3 162.7 5146.2
Beverages, Food & Tobacco - 843.2 - 770.0 - 625.9 - 726.6 - 650.3 - 698.4
Textiles & Clothing 16.5 79.7 16.5 77.5 16.5 73.5 16.5 83.3 16.5 75.0 16.5 79.9
Electricity - 0.4 - 0.1 - 7.7 - 0.2 - 0.1 - 0.1
Other Manufacturing - 3778.9 - 3830.2 - 3632.9 - 3588.9 - 3593.2 - 3685.3
Services 5.4 17532.1 13.2 17857.7 6.3 17101.7 5.0 17534.9 4.8 17501.3 4.6 17362.4
Drainage & Irrigation - 90.2 - 70.9 - 63.7 - 68.3 - 65.8 - 61.3
Transportation - 1178.5 - 1452.2 - 1390.2 - 1398.7 - 1487.4 - 1385.8
Telecommunications - 44.8 - 15.9 - 40.3 - 104.4 - 15.9 - 16.1
Entertaining & Catering - 1848.6 - 1840.0 - 1866.9 - 1945.3 - 1956.4 - 1779.4
Distribution - 10353.8 - 10528.7 - 10114.6 - 10284.0 - 10267.4 - 10334.4
Education - 148.0 - 144.3 - 101.9 - 154.7 - 103.1 - 102.2
Health - 174.7 - 123.6 - 127.6 - 109.6 - 135.4 - 156.9
Professional Services - 809.2 - 806.8 - 727.7 - 743.0 - 776.3 - 795.5
Other Services 5.4 2884.2 13.2 2875.3 6.3 2668.8 5.0 2726.9 4.8 2693.5 4.6 2730.8
HOUSEHOLDS - 9476.4 - 9443.4 - 9142.6 - 8886.8 - 9544.3 - 8962.5
Housing - 3955.1 - 3993.1 - 5556.2 - 5255.4 - 3677.1 - 3447.1
Motor Cars - 1311.9 - 1311.5 - 682.0 - 681.9 - 1373.1 - 1389.2
Other Durable Goods - 475.2 - 493.4 - 101.9 - 102.7 - 473.7 - 479.7
Education - 50.9 - 54.8 - 96.8 - 53.5 - 90.8 - 96.9
Travel - 13.9 - 13.4 - 12.1 - 127.9 - 11.2 - 10.6
Other Purposes - 3669.4 - 3577.2 - 2693.6 - 2665.3 - 3918.3 - 3539.0
TOTAL 461.9 52860.4 587.6 53104.0 732.6 51403.2 877.6 51559.4 604.8 52011.4 852.8 51185.1
Source: Commercial Banks.
Sep.
TABLE 2-XIII(e)COMMERCIAL BANKS: LOANS & ADVANCES TO RESIDENTS BY SECTOR
(G$ Million)
Item Oct. Nov.
2001
Dec.Jul. Aug.
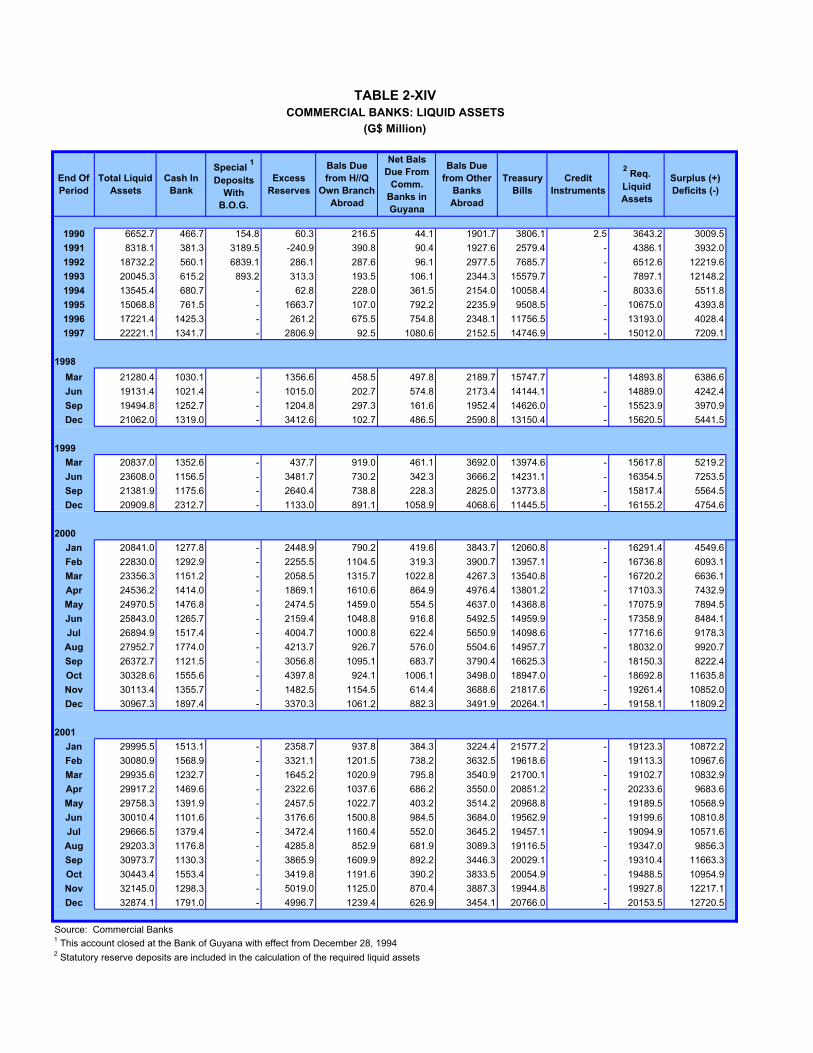
1990 6652.7 466.7 154.8 60.3 216.5 44.1 1901.7 3806.1 2.5 3643.2 3009.5
1991 8318.1 381.3 3189.5 -240.9 390.8 90.4 1927.6 2579.4 - 4386.1 3932.0
1992 18732.2 560.1 6839.1 286.1 287.6 96.1 2977.5 7685.7 - 6512.6 12219.6
1993 20045.3 615.2 893.2 313.3 193.5 106.1 2344.3 15579.7 - 7897.1 12148.2
1994 13545.4 680.7 - 62.8 228.0 361.5 2154.0 10058.4 - 8033.6 5511.8
1995 15068.8 761.5 - 1663.7 107.0 792.2 2235.9 9508.5 - 10675.0 4393.8
1996 17221.4 1425.3 - 261.2 675.5 754.8 2348.1 11756.5 - 13193.0 4028.4
1997 22221.1 1341.7 - 2806.9 92.5 1080.6 2152.5 14746.9 - 15012.0 7209.1
1998
Mar 21280.4 1030.1 - 1356.6 458.5 497.8 2189.7 15747.7 - 14893.8 6386.6
Jun 19131.4 1021.4 - 1015.0 202.7 574.8 2173.4 14144.1 - 14889.0 4242.4
Sep 19494.8 1252.7 - 1204.8 297.3 161.6 1952.4 14626.0 - 15523.9 3970.9
Dec 21062.0 1319.0 - 3412.6 102.7 486.5 2590.8 13150.4 - 15620.5 5441.5
1999
Mar 20837.0 1352.6 - 437.7 919.0 461.1 3692.0 13974.6 - 15617.8 5219.2
Jun 23608.0 1156.5 - 3481.7 730.2 342.3 3666.2 14231.1 - 16354.5 7253.5
Sep 21381.9 1175.6 - 2640.4 738.8 228.3 2825.0 13773.8 - 15817.4 5564.5
Dec 20909.8 2312.7 - 1133.0 891.1 1058.9 4068.6 11445.5 - 16155.2 4754.6
2000
Jan 20841.0 1277.8 - 2448.9 790.2 419.6 3843.7 12060.8 - 16291.4 4549.6
Feb 22830.0 1292.9 - 2255.5 1104.5 319.3 3900.7 13957.1 - 16736.8 6093.1
Mar 23356.3 1151.2 - 2058.5 1315.7 1022.8 4267.3 13540.8 - 16720.2 6636.1
Apr 24536.2 1414.0 - 1869.1 1610.6 864.9 4976.4 13801.2 - 17103.3 7432.9
May 24970.5 1476.8 - 2474.5 1459.0 554.5 4637.0 14368.8 - 17075.9 7894.5
Jun 25843.0 1265.7 - 2159.4 1048.8 916.8 5492.5 14959.9 - 17358.9 8484.1
Jul 26894.9 1517.4 - 4004.7 1000.8 622.4 5650.9 14098.6 - 17716.6 9178.3
Aug 27952.7 1774.0 - 4213.7 926.7 576.0 5504.6 14957.7 - 18032.0 9920.7
Sep 26372.7 1121.5 - 3056.8 1095.1 683.7 3790.4 16625.3 - 18150.3 8222.4
Oct 30328.6 1555.6 - 4397.8 924.1 1006.1 3498.0 18947.0 - 18692.8 11635.8
Nov 30113.4 1355.7 - 1482.5 1154.5 614.4 3688.6 21817.6 - 19261.4 10852.0
Dec 30967.3 1897.4 - 3370.3 1061.2 882.3 3491.9 20264.1 - 19158.1 11809.2
2001
Jan 29995.5 1513.1 - 2358.7 937.8 384.3 3224.4 21577.2 - 19123.3 10872.2
Feb 30080.9 1568.9 - 3321.1 1201.5 738.2 3632.5 19618.6 - 19113.3 10967.6
Mar 29935.6 1232.7 - 1645.2 1020.9 795.8 3540.9 21700.1 - 19102.7 10832.9
Apr 29917.2 1469.6 - 2322.6 1037.6 686.2 3550.0 20851.2 - 20233.6 9683.6
May 29758.3 1391.9 - 2457.5 1022.7 403.2 3514.2 20968.8 - 19189.5 10568.9
Jun 30010.4 1101.6 - 3176.6 1500.8 984.5 3684.0 19562.9 - 19199.6 10810.8
Jul 29666.5 1379.4 - 3472.4 1160.4 552.0 3645.2 19457.1 - 19094.9 10571.6
Aug 29203.3 1176.8 - 4285.8 852.9 681.9 3089.3 19116.5 - 19347.0 9856.3
Sep 30973.7 1130.3 - 3865.9 1609.9 892.2 3446.3 20029.1 - 19310.4 11663.3
Oct 30443.4 1553.4 - 3419.8 1191.6 390.2 3833.5 20054.9 - 19488.5 10954.9
Nov 32145.0 1298.3 - 5019.0 1125.0 870.4 3887.3 19944.8 - 19927.8 12217.1
Dec 32874.1 1791.0 - 4996.7 1239.4 626.9 3454.1 20766.0 - 20153.5 12720.5
Source: Commercial Banks1 This account closed at the Bank of Guyana with effect from December 28, 1994
2 Statutory reserve deposits are included in the calculation of the required liquid assets
Back to Annexe
Bals Due
from Other
Banks
Abroad
End Of
Period
Total Liquid
Assets
Cash In
Bank
Special 1
Deposits
With
B.O.G.
TABLE 2-XIVCOMMERCIAL BANKS: LIQUID ASSETS
(G$ Million)
Treasury
Bills
Credit
Instruments
2 Req.
Liquid
Assets
Surplus (+)
Deficits (-)
Excess
Reserves
Bals Due
from H//Q
Own Branch
Abroad
Net Bals
Due From
Comm.
Banks in
Guyana

1990 476.7 536.4 59.7 Dec 1st 11110.5 12716.9 1606.4
1991 1840.7 1599.8 -240.9 8th 11044.3 12323.6 1279.3
1992 2871.5 3157.6 286.1 15th 11052.7 11596.7 544.0
1993 3582.5 3895.8 313.3 22nd 10972.1 13024.8 2052.7
1994 5835.9 5898.7 62.8 29th 11040.8 14411.1 3370.3
1995 7208.5 8872.2 1663.7
1996 8822.3 9083.5 261.2 2001
1997 10286.0 13092.9 2806.9 Jan 5th 11069.2 14992.0 3922.8
1998 10922.4 14335.0 3412.6 12th 11097.7 14348.1 3250.4
1999 9316.4 10449.4 1133.0 19th 11099.1 13211.6 2112.5
26th 11032.8 13391.5 2358.7
2000
Jan 7th 9291.5 11816.2 2524.7 Feb 2nd 11096.6 12027.5 930.9
14th 9307.0 12151.2 2844.2 9th 11041.7 12353.4 1311.7
21st 9313.6 12131.1 2817.5 16th 11033.4 13101.4 2068.1
28th 9415.9 11864.8 2448.9 23rd 11039.4 14360.5 3321.1
Feb 4th 9442.5 12661.6 3219.1 Mar 2nd 11148.5 13957.5 2809.0
11th 9607.1 13038.5 3431.4 9th 11128.0 12605.5 1477.5
18th 9704.9 12172.1 2467.2 16th 11086.9 12199.7 1112.8
25th 9684.9 11940.4 2255.5 23rd 11027.6 12219.9 1192.3
30th 11019.0 12664.2 1645.2
Mar 3rd 9603.7 12279.4 2675.7
10th 9607.8 11812.1 2204.3 Apr 6th 11132.2 12784.6 1652.4
17th 9639.6 10976.5 1336.9 13th 11127.5 13599.8 2472.2
24th 9564.8 11699.2 2134.4 20th 11216.3 13801.5 2585.2
31st 9666.4 11724.8 2058.4 27th 11259.3 13581.9 2322.6
May 4th 11188.1 13935.1 2747.0
Apr 7th 9821.2 11467.4 1646.2 11th 11084.9 14119.6 3034.7
14th 9853.7 11013.8 1160.1 18th 11086.0 12930.6 1844.5
21st 9802.7 11981.2 2178.5 25th 11081.4 13538.9 2457.5
28th 9869.3 11738.3 1869.0
Jun 1st 11076.0 14667.6 3591.6
May 5th 9824.3 12103.2 2278.9 8th 11112.0 14978.2 3866.2
12th 9841.8 12972.3 3130.5 15th 11111.1 13915.7 2804.6
19th 9903.1 12359.9 2456.8 22nd 11001.8 13921.9 2920.1
26th 9884.1 12358.6 2474.5 29th 11103.3 14279.9 3176.6
Jun 2nd 9924.5 12820.0 2895.5 Jul 6th 11133.8 14031.2 2897.4
9th 10010.2 12438.0 2427.8 13th 11083.7 13628.3 2544.6
16th 10070.3 11283.0 1212.7 20th 11007.8 13972.8 2965.0
23rd 9986.5 11863.8 1877.3 27th 11046.4 14518.8 3472.4
30th 10026.2 12185.6 2159.4
Aug 3rd 11097.1 15416.6 4319.5
10th 11141.3 15516.7 4375.4
Jul 7th 10026.3 12875.5 2849.2 17th 11162.9 15822.7 4659.8
14th 10066.8 13298.7 3231.9 24th 11116.9 16641.8 5524.9
21st 9747.2 13074.5 3327.3 31st 11184.7 15470.1 4285.4
28th 10235.0 14239.7 4004.7
Sep 7th 11169.5 14752.1 3582.5
Aug 4th 10341.3 14568.2 4226.9 14th 11085.3 13693.9 2608.5
11th 10360.7 14682.6 4321.9 21st 11060.5 15037.5 3977.0
18th 10356.9 14572.5 4215.6 28th 11182.6 15048.5 3865.9
25th 10407.6 14621.3 4213.7
Oct 5th 11261.1 14860.6 3599.5
Sep 1st 10441.0 14987.7 4546.7 12th 11226.3 13998.0 2771.6
8th 10511.3 14789.9 4278.6 19th 11299.0 14146.8 2847.8
15th 10561.5 13289.9 2728.4 26th 11276.2 14696.0 3419.8
22nd 10412.9 13469.6 3056.7
Nov 2nd 11310.8 15157.5 3846.7
Oct 6th 10658.2 14193.5 3535.3 9th 11329.7 15006.9 3677.2
13th 10643.9 14136.3 3492.4 16th 11363.2 14826.5 3463.3
20th 10682.7 14371.7 3689.0 23rd 11405.4 15618.8 4213.4
27th 10816.3 15214.1 4397.8 30th 11524.1 16543.1 5019.0
Nov 3rd 10970.8 15014.7 4043.9 Dec 7th 11486.9 17192.0 5705.1
10th 10989.4 14704.1 3714.7 14th 11587.4 14995.4 3408.0
17th 11044.6 12875.0 1830.4 21st 11477.0 15366.5 3889.524th 11131.2 12613.8 1482.6 28th 11611.9 16608.6 4996.7
Source: Commercial Banks.
TABLE 2-XVCOMMERCIAL BANKS: MINIMUM RESERVE REQUIREMENTS
(G$ Million)
End of
Period
Day Of Res.
Per. (Week)
Required
Reserves
Actual
Reserves
Actual
Reserves
Surplus (+)
Deficits (-)
Surplus (+)
Deficits (-)
End of
Period
Day Of Res.
Per. (Week)
Required
Reserves
Back to Annexe

Foreign Assets (Net) Domestic Credit Money and Quasi-Money
Public Sector Money
1990 -68885.9 -70398.3 1512.4 11758.5 9034.2 10020.4 -683.6 -302.6 -1435.3 4159.6 9414.3 3431.4 2211.4 1220.0 5982.9 -66541.7
1991 -76004.0 -77495.2 1491.2 9630.2 5736.0 9403.6 -2187.4 -1480.2 -2778.2 6672.4 16265.5 6008.6 3711.5 2297.1 10256.9 -82639.3
1992 -73074.0 -74988.4 1914.4 9763.7 4224.6 9928.8 -3531.3 -2172.9 -3195.6 8734.7 26091.5 7736.5 5094.6 2641.9 18355.0 -89401.8
1993 -71490.2 -72599.1 1108.9 2680.2 -4706.7 2883.8 -2763.3 -4827.2 -2867.0 10253.9 33371.2 9379.4 6480.4 2899.0 23991.8 -102181.2
1994 -76002.7 -76617.5 614.8 1229.7 -11328.2 -6912.0 -2510.0 -1906.2 -1342.4 13900.3 39115.9 12266.6 8167.1 4099.5 26849.3 -113888.9
1995 -74966.5 -75881.4 914.9 8282.6 -11070.2 -6747.1 -2085.8 -2237.3 -1754.3 21107.1 49339.6 14006.9 8967.4 5039.5 35332.7 -116023.5
1996 1
-26173.0 -26356.3 183.3 14487.7 -19247.6 -13994.2 -4287.8 -965.5 -2573.6 36308.9 57580.3 16037.2 9959.3 6077.9 41543.1 -69265.4
1997 2 -6300.9 -4834.6 -1466.3 23926.8 -17277.0 -10974.2 -3618.6 -2684.3 -3659.5 44863.3 64319.2 17388.7 11192.7 6196.0 46930.5 -46693.3
1998
Mar -4835.1 -4441.9 -393.2 22898.7 -17582.3 -11306.9 -3639.0 -2636.4 -5154.0 45635.0 64365.0 15184.6 9769.1 5415.5 49180.4 -46301.4
Jun -7838.0 -7468.5 -369.5 25366.0 -15627.8 -8894.7 -2394.3 -4338.8 -6091.7 47085.5 63073.8 14982.3 9522.4 5459.9 48091.5 -45545.8
Sep -6646.6 -5829.5 -817.1 27542.8 -15412.8 -8476.1 -2979.6 -3957.1 -6304.0 49259.6 65616.0 15657.3 9614.3 6043.0 49958.7 -44719.8
Dec 3 -71.2 1229.8 -1301.0 31947.0 -14187.9 -6340.9 -3600.5 -4246.5 -5703.4 51838.3 68695.6 17820.7 11334.2 6486.4 50874.9 -36819.9
1999
Mar -3067.4 -3261.3 193.9 34206.0 -14762.1 -6905.2 -3379.3 -4477.6 -4773.8 53741.9 67384.9 16267.8 10545.4 5722.4 51117.1 -36246.3
Jun -1315.5 -756.9 -558.6 32937.7 -16139.3 -7868.4 -5284.4 -2986.5 -5365.5 54442.5 69414.0 16469.4 10332.8 6136.6 52944.5 -37791.8
Sep 4431.0 4882.7 -451.7 26216.6 -22491.8 -15765.0 -3718.0 -3008.8 -5813.4 54521.8 68972.3 15723.1 10291.0 5432.1 53249.2 -38324.7
Dec 11591.9 8361.0 3230.8 23860.3 -26735.3 -22080.0 -2618.9 -2036.4 -5227.7 55823.3 77007.7 21576.0 13422.2 8153.9 55431.7 -41555.5
2000
Jan 11886.8 10038.8 1848.0 23272.5 -26862.2 -23800.5 -1307.2 -1754.5 -5338.7 55473.4 74489.8 18012.5 11022.9 6989.6 56477.3 -39330.6
Feb 13181.5 11343.8 1837.7 22493.4 -26658.7 -22897.1 -1259.0 -2502.6 -6182.2 55334.2 74160.9 17302.3 10623.6 6678.7 56858.7 -38486.1
Mar 14357.2 12040.8 2316.4 22681.7 -27623.3 -24313.3 -925.4 -2384.5 -5872.9 56177.9 76027.3 18157.7 11138.1 7019.5 57869.6 -38988.3
Apr 17218.7 14087.3 3131.4 22638.8 -27057.1 -24205.3 -1059.8 -1792.0 -5860.9 55556.7 78289.5 19566.2 12062.7 7503.6 58723.3 -38432.0
May 16288.8 13427.2 2861.6 21715.1 -28521.7 -25601.6 -1021.8 -1898.3 -6152.2 56389.0 77091.0 18101.3 11310.5 6790.9 58989.6 -39087.0
Jun 17706.8 14052.8 3654.1 20656.4 -29142.5 -25961.2 -1129.0 -2052.4 -6234.3 56033.2 77963.4 18982.4 11576.7 7405.6 58981.0 -39600.2
Jul 19210.0 15026.7 4183.3 20697.4 -29518.1 -24881.5 -1251.2 -3385.4 -6061.7 56277.2 79589.6 19514.4 11398.1 8116.3 60075.2 -39682.2
Aug 19503.4 15765.7 3737.7 23121.9 -27485.4 -23074.3 -1235.0 -3176.1 -6075.5 56682.8 80994.1 20502.8 11420.2 9082.6 60491.3 -38368.8
Sep 18890.0 16107.8 2782.3 25116.4 -26586.7 -21960.3 -1207.8 -3418.7 -6041.0 57744.1 81786.0 20054.0 11832.0 8222.0 61732.0 -37779.5
Oct 18287.7 16369.8 1917.9 26187.0 -24978.9 -19922.8 -959.9 -4096.2 -6785.1 57950.9 82678.5 20408.2 12184.4 8223.8 62270.3 -38203.8
Nov 16372.9 13409.3 2963.6 30022.6 -21149.3 -16225.6 -1250.0 -3673.7 -7314.6 58486.4 83761.4 21155.2 12372.6 8782.6 62606.2 -37365.9
Dec 22807.5 19835.1 2972.4 25071.7 -25848.3 -20421.0 -1319.7 -4107.6 -7794.9 58715.0 85445.1 24826.6 14495.1 10331.6 60618.5 -37565.9
2001
Jan 22175.8 19209.8 2966.0 27980.6 -23473.2 -19468.6 -924.8 -3079.9 -7312.6 58766.4 85169.3 21974.4 12320.0 9654.4 63194.9 -35013.0
Feb 22234.0 17997.2 4236.7 29214.5 -22249.5 -18547.8 -1258.4 -2443.3 -7557.6 59021.6 85801.2 21772.5 12098.1 9674.4 64028.7 -34352.8
Mar 22767.1 18980.8 3786.3 29616.7 -21540.1 -18102.1 -868.5 -2569.4 -7492.1 58648.9 86386.3 22301.1 12861.1 9440.0 64085.2 -34002.4
Apr 23330.5 19362.9 3967.5 30242.2 -21101.4 -17722.1 -637.5 -2741.8 -7429.1 58772.7 88408.8 23346.1 13240.1 10105.9 65062.7 -34836.2
May 23796.0 19452.8 4343.2 28551.3 -21527.5 -18299.3 -860.0 -2368.2 -8372.8 58451.6 86438.2 21744.2 12248.4 9495.8 64694.1 -34090.9
Jun 23229.7 18658.0 4571.7 27950.0 -22276.3 -19546.1 -654.3 -2075.9 -8612.8 58839.1 87098.5 21472.0 12278.8 9193.3 65626.4 -35918.8
Jul 21499.5 17656.9 3842.5 28905.2 -21673.8 -18878.2 -863.8 -1931.9 -8589.6 59168.6 85684.0 21196.8 12219.2 8977.6 64487.2 -35279.3
Aug 21248.1 18036.8 3211.3 30407.9 -21442.7 -18589.3 -957.2 -1896.2 -8069.2 59919.7 87518.0 21556.5 12412.8 9143.7 65961.5 -35862.1
Sep 22270.4 18112.6 4157.8 29600.9 -21764.6 -17870.7 -743.2 -3150.7 -7502.4 58867.8 88015.1 21687.5 12566.1 9121.4 66327.7 -36143.8
Oct 26001.8 21280.7 4721.1 27071.1 -24479.8 -20542.1 -752.8 -3184.9 -7594.1 59144.9 88800.7 21904.6 12691.9 9212.8 66896.1 -35727.8
Nov 27872.4 22691.1 5181.4 27553.1 -24801.0 -20672.2 -931.0 -3197.8 -6813.3 59167.4 91078.1 23138.7 13727.7 9411.0 67939.4 -35652.6
Dec 28658.0 23542.4 5115.6 27530.9 -24212.6 -18287.5 -1041.0 -4884.1 -7544.9 59288.3 93035.5 24807.4 15138.3 9669.1 68228.1 -36846.5
Source: Bank of Guyana and Commercial Banks1 Net foreign assets reflect Naples terms debt stock reduction in December 1996.
2 The improvement in the net foreign assets of the Bank of Guyana in June 1997 reflects the transfer of the debt obligation of Trinidad and Tobago to the Ministry of Finance.
3 The improvement in the net foreign assets of the Bank of Guyana in November 1998 reflects the transfer of the debt obligation of Kuwait, Libya and Argentina to the Ministry of Finance.
TotalGov't.
(Net)
Non-Bank
Fin. Instits.
(Net)
Private
SectorPublic
Enter.
(Net)
Other Pub.
Sect. (Net)
TABLE 3-I
MONETARY SURVEY
(G$ Million)
End Of
Period TotalBank of
Guyana
Comm
BanksTotal
Back to Annexe
Total
Other
(Net)Total Curr.
Demand
Deposits
Quasi-
Money
Savings &
Time Dep.

1992 1993 1994 1995 1996 1997 1998 1999 2000 2001
Dec Dec Dec Dec Dec Dec Dec Dec Dec Jan Feb Mar Apr May Jun Jul Aug Sep Oct Nov Dec
BANK OF GUYANA
Bank Rate 24.25 17.00 20.25 17.25 12.00 11.00 11.25 13.25 11.75 11.50 11.50 12.00 12.00 11.50 11.00 10.25 9.25 9.00 8.75 9.00 8.75
Treasury Bill Discount Rate
91 Days 22.99 15.44 18.64 15.49 9.94 8.16 8.84 11.07 9.20 8.91 8.86 9.40 9.14 8.90 8.45 7.65 6.73 6.43 6.17 6.44 6.25
182 Days 0.00 15.45 18.38 15.69 11.00 8.98 8.69 12.66 10.66 10.73 10.31 10.31 10.15 9.69 9.69 8.88 7.25 7.25 7.05 7.57 7.31
364 Days 0.00 14.78 17.85 15.28 11.16 9.17 9.25 12.79 11.09 10.81 10.97 10.88 10.44 10.02 10.02 8.79 8.22 8.55 8.24 8.17 8.17
Interest Rate on EPD 23.25 16.00 19.25 16.25 11.00 9.75 10.25 12.25 10.75 10.50 10.50 11.00 11.00 10.50 10.00 9.25 8.25 8.00 7.75 8.00 7.75
Special Deposits with BOG 221.75 13.50 17.00 - - - - - - - - - - - - - - - - - -
COMMERCIAL BANKS
Small Savings Rate 16.58 9.46 11.20 10.47 7.73 7.39 7.06 7.97 7.28 7.31 7.20 7.20 7.15 7.15 7.04 7.26 7.26 7.30 6.76 6.70 6.70
Prime Lending Rate (weighted average) 3... ... 18.80 19.00 17.00 17.00 17.00 17.13 17.16 17.16 17.17 17.18 17.17 17.19 17.15 17.18 17.21 17.21 17.22 17.22 17.26
Prime Lending Rate 425.90 17.45 19.89 19.07 17.21 16.93 16.64 17.25 17.21 17.21 17.29 17.29 17.29 17.29 17.14 16.86 16.64 16.71 16.79 16.79 16.79
Comm. Banks' Lending Rate (weighted average) 29.76 18.24 20.80 20.39 18.46 18.32 18.29 17.87 17.68 17.41 17.52 17.56 17.44 17.29 17.80 17.91 17.91 17.89 17.74 17.76 17.60
GNCB TRUST COMPANY
Domestic Mortgages 32.00 18.00 18.00 18.00 17.00 17.00 16.00 16.00 16.00 16.00 16.00 16.00 16.00 16.00 16.00 16.00 16.00 16.00 16.00 16.00 16.00
Commercial Mortgages 36.00 21.00 21.00 21.00 20.00 20.00 19.00 19.00 20.00 20.00 20.00 20.00 20.00 20.00 20.00 20.00 20.00 20.00 20.00 20.00 20.00
Average Deposit Rates 5 19.38 14.00 14.00 14.00 11.00 9.50 8.95 11.00 9.18 9.18 9.18 9.18 9.18 9.18 9.18 8.89 8.89 7.85 7.85 7.55 7.55
NEW BUILDING SOCIETY
Deposits 6 15.00 9.00 9.00 10.00 7.00 7.00 7.00 7.00 7.50 7.50 7.50 7.50 7.50 7.50 7.50 6.50 6.50 7.50 6.50 6.50 6.50
Mortgage Rates 18.00 16.00 14.00 14.00 14.00 12.00 11.00 11.00 11.00 11.00 11.00 11.00 11.00 11.00 11.00 11.00 11.00 11.00 11.00 11.00 11.00
Five dollar shares 18.00 12.00 12.00 14.00 9.00 8.00 8.00 8.50 9.00 9.00 9.00 9.00 9.00 9.00 9.00 8.00 8.00 8.00 8.00 8.00 8.00
Save and prosper shares … … ... ... ... ... 9.50 10.00 10.50 10.50 10.50 10.50 10.50 10.50 10.50 9.00 9.00 9.00 9.00 9.00 9.00
Source: Bank of Guyana, Commercial Banks and other Financial Institutions1 End of period rates2 Special deposit accounts at the Bank of Guyana have been closed with effect from December 19943 The prime lending rate reported by the banks has been weighted by the amount of loans issued at the corresponding rate4 The average prime lending rate actually used by commecial banks, applicable to loans and advances5 Average deposits rates at GNCB Trust Company have been revised effective December 2000.6 Small savings rate
... Information not availiable.
Item
TABLE 4-I
GUYANA: SELECTED INTEREST RATES 1
(Percent Per Annum)Back to Annexe

Commercial Banks
1990 31.0 27.5 28.1 28.5 - 29.5 28.0
1991 33.5 26.2 29.2 31.0 - 31.5 30.5
1992 25.9 16.6 18.2 - - - -
1993 17.5 9.5 10.9 11.8 12.0 12.3 -
1994 19.9 11.2 12.8 14.4 14.3 14.3 -
1995 19.1 10.5 12.8 13.8 14.2 14.4 -
1996 17.2 7.7 9.0 9.9 12.8 9.5 -
1997 16.9 7.4 8.4 9.4 - 9.3 -
1998
Mar 16.9 7.2 8.1 9.1 - 9.3 -
Jun 16.9 7.1 8.0 9.1 - 9.3 -
Sep 16.6 7.1 8.0 8.8 9.0 9.7 -
Dec 16.6 7.1 8.0 8.3 9.0 9.7 -
1999
Mar 16.7 7.2 8.7 9.3 10.9 9.9 -
Jun 17.1 8.0 9.3 10.0 10.2 10.4 -
Sep 17.4 8.0 9.4 10.0 10.2 10.4 -
Dec 17.3 8.0 9.3 9.9 10.2 10.3 -
2000
Jan 17.3 7.9 9.3 9.9 9.9 10.5 -
Feb 17.3 7.9 9.2 9.7 9.8 10.5 -
Mar 17.3 7.9 9.2 9.8 9.5 10.6 -
Apr 17.3 7.8 8.9 9.6 9.4 10.3 -
May 17.3 7.8 9.0 9.5 9.2 10.3 -
Jun 17.3 7.8 9.0 9.5 9.4 10.3 -
Jul 17.3 7.7 8.9 9.4 9.4 10.2 -
Aug 17.3 7.7 7.5 9.4 9.4 10.2 -
Sep 17.3 7.5 8.8 9.4 9.2 10.0 -
Oct 17.3 7.4 8.6 9.2 9.4 9.8 -
Nov 17.2 7.3 8.7 9.0 8.9 9.6 -
Dec 17.2 7.3 7.4 8.9 9.0 9.4 -
2001
Jan 17.2 7.3 7.1 8.5 8.4 9.1 -
Feb 17.3 7.2 8.3 8.6 8.4 9.2 -
Mar 17.3 7.2 8.3 8.6 8.4 9.1 -
Apr 17.3 7.2 8.2 8.4 8.7 9.0 -
May 17.3 7.1 8.0 8.1 8.3 8.8 -
Jun 17.1 7.0 7.9 8.1 8.3 8.6 -
Jul 16.9 7.3 7.7 7.9 8.6 8.3 -
Aug 16.6 7.3 7.6 7.7 8.6 8.1 -
Sep 16.7 7.3 7.9 7.7 8.6 8.7 -
Oct 16.8 6.8 7.4 7.4 8.1 8.3 -
Nov 16.8 6.7 7.3 7.3 7.9 8.2 -
Dec 16.8 6.7 7.2 7.0 7.1 8.1 -
Source: Commercial Banks1 Arithmetic average of the Prime Lending Rate reported by the Commercial Banks
90 Day
Call
Deps.
Back to Annexe
TABLE 4-IICOMMERCIAL BANKS: SELECTED INTEREST RATES
(Per Cent Per Annum)
End Of
PeriodPrime
1
Lending
Rate
Small
Savings
Deps.
3 Mths.
Time Deps.
6 Mths.
Time Deps.
9 Mths.
Time Deps.
12 Mths.
Time Deps.

TABLE 4-IIICOMPARATIVE TREASURY BILL RATES AND BANK RATES
Guyana Jamaica Trin. & Tob. Barbados U.S.A. U.K.
1990 28.75 30.00 27.37 21.00 7.50 9.50 7.66 13.50 7.02 6.79 13.08 14.00
1991 30.89 32.50 31.14 ... 8.18 11.50 10.71 18.00 4.58 3.50 10.10 10.50
1992 22.99 24.25 23.22 ... 9.25 13.00 6.60 12.00 3.25 3.00 6.38 7.44
1993 15.44 17.00 41.47 ... 9.89 13.00 5.93 8.00 3.08 3.00 4.89 5.25
1994 18.64 20.25 29.47 ... 0.00 0.00 7.77 9.50 5.64 4.75 5.92 6.25
1995 15.49 17.25 42.50 ... ... ... ... ... ... ... ... ...
1996 9.94 12.00 28.83 ... 11.58 13.00 5.61 12.50 5.00 5.00 6.08 6.00
1997 8.16 11.00 28.08 ... 10.81 13.00 4.91 9.00 5.16 5.00 7.04 7.17
1998
Mar 8.09 10.50 27.99 ... 11.89 13.00 5.61 9.00 5.03 5.00 6.95 7.09
Jun 8.16 10.25 26.28 ... 11.93 13.00 5.65 9.00 4.99 5.00 7.29 7.52
Sep 8.50 10.75 22.64 ... 11.97 13.00 5.57 9.00 4.74 5.00 6.94 7.06
Dec 8.84 11.25 23.52 ... 11.88 13.00 5.70 9.00 4.42 4.50 5.72 7.06
1999
Mar 13.04 15.75 21.87 ... 10.66 13.00 5.67 9.00 4.48 4.50 4.92 ...
Jun 11.85 14.50 20.42 ... 10.07 13.00 5.90 10.00 4.59 4.50 4.75 ...
Sep 11.15 14.00 19.21 ... 10.17 13.00 5.87 10.00 4.73 4.75 5.07 ...
Dec 11.07 13.25 20.61 ... 10.09 13.00 6.05 10.00 5.23 5.00 5.49 ...
2000
Jan 10.73 13.50 20.54 ... 10.14 13.00 6.21 10.00 5.34 5.00 5.72 ...
Feb 10.70 13.25 20.05 ... 10.09 13.00 6.20 10.00 5.57 5.25 5.83 ...
Mar 10.64 13.50 17.96 ... 10.24 13.00 6.10 10.00 5.72 5.50 5.86 ...
Apr 10.46 13.00 17.58 ... 10.14 13.00 5.98 10.00 5.67 5.50 5.90 ...
May 10.34 13.00 17.64 ... 10.61 13.00 5.76 10.00 5.92 6.00 5.95 ...
Jun 10.23 13.00 17.47 ... 10.87 13.00 5.68 10.00 5.74 6.00 5.85 ...
Jul 9.82 12.50 17.32 ... 10.71 13.00 5.58 10.00 5.93 6.00 5.83 ...
Aug 9.65 12.25 17.04 ... 10.61 13.00 5.39 10.00 6.11 6.00 5.80 ...
Sep 9.06 12.25 17.13 ... 10.74 13.00 4.46 10.00 5.99 6.00 5.80 ...
Oct 8.83 11.50 ... ... 10.94 13.00 4.24 10.00 6.10 6.00 5.75 ...
Nov 8.94 11.25 17.28 ... 10.82 13.00 4.03 10.00 6.18 6.00 5.69 ...
Dec 9.20 11.75 20.16 ... 10.79 13.00 3.85 10.00 5.83 6.00 5.63 ...
2001
Jan 8.91 11.50 19.14 ... 10.60 13.00 3.72 10.00 5.27 5.00 5.49 ...
Feb 8.86 11.50 18.27 ... 10.26 13.00 3.69 10.00 4.93 5.00 5.46 ...
Mar 9.40 12.00 16.88 ... 10.46 13.00 3.65 9.50 4.50 4.50 5.23 ...
Apr 9.14 12.00 16.50 ... 10.27 13.00 3.63 9.50 3.91 4.00 5.12 ...
May 8.90 11.50 15.46 ... 9.47 13.00 3.64 9.50 3.66 3.50 4.98 ...
Jun 8.45 11.00 16.20 ... 9.53 13.00 3.64 9.50 3.48 3.25 4.98 ...
Jul 7.65 10.25 16.65 ... 9.22 13.00 ... ... 3.54 3.25 5.01 ...
Aug 6.73 9.25 16.04 ... 7.38 13.00 ... ... 3.39 3.00 4.72 ...
Sep 6.43 9.00 15.10 ... 6.41 13.00 ... ... 2.87 2.50 4.43 ...
Oct 6.17 8.75 15.11 ... ... ... ... ... 2.22 2.00 4.16 ...
Nov 6.44 9.00 17.82 ... ... ... ... ... 1.93 1.50 ... ...
Dec 6.25 8.75 17.03 ... ... ... ... ... 1.72 1.25 ... ...
Source: Statistical Reports from Central Banks & International Financial Statistics (IMF)1 This rate has been discontinued with effect from March 1991
Bank
Rate
Treasury
Bills
Bank
Rate
Treasury
Bills
Bank
Rate
Treasury
Bills
Back to Annexe
Period Treasury
Bills
Bank
Rate
Treasury
Bills
Bank
Rate
Treasury
Bills
Bank
Rate 1

Assets Liabilities
Public Sector Private Sector Deposits
Loans
1990 5.6 91.0 742.1 628.2 104.6 9.3 96.0 95.5 0.5 108.6 1043.3 973.7 903.7 70.0 69.6
1991 26.3 124.2 1232.4 1131.2 92.0 9.2 115.6 115.4 0.2 159.0 1657.5 1490.5 1387.6 102.9 167.0
1992 71.4 66.6 2155.2 2086.3 59.7 9.2 236.3 236.3 - 137.7 2667.2 2381.9 2220.5 161.4 285.3
1993 113.4 36.7 2514.0 2477.5 27.3 9.2 744.8 744.5 0.3 157.7 3566.6 3191.7 3003.8 187.9 374.9
1994 148.0 82.4 3131.7 3101.4 21.2 9.1 1097.1 1096.4 0.7 236.5 4695.7 4043.2 3812.6 230.6 652.5
1995 168.1 352.6 3234.1 3211.2 13.8 9.1 1862.7 1861.4 1.3 265.8 5883.3 5006.2 4766.5 239.7 877.1
1996 184.8 153.3 4338.5 4333.4 4.9 0.2 2658.1 2653.8 4.3 404.5 7739.2 6700.0 6439.7 260.3 1039.2
1997 209.4 114.7 5054.7 5054.7 - - 3604.3 3602.6 1.7 435.9 9418.9 8156.7 7871.2 285.5 1262.3
1998
Mar 209.4 96.5 5109.1 5109.1 - - 3884.5 3882.8 1.7 416.8 9716.3 8432.7 8144.2 288.5 1283.7
Jun 209.4 219.2 5143.8 5143.8 - - 4226.5 4222.0 4.5 408.6 10207.5 8859.3 8561.7 297.6 1348.1
Sep 209.4 156.1 5145.3 5145.3 - - 4630.1 4629.4 0.7 427.6 10568.5 9196.8 8873.9 322.9 1371.8
Dec 277.9 66.7 5226.1 5226.1 - - 4921.6 4921.3 0.3 430.2 10922.5 9468.9 9129.6 339.3 1453.5
1999
Mar 290.7 42.7 5289.1 5289.1 - - 5200.1 5199.6 0.5 435.8 11258.4 9775.8 9471.7 304.1 1482.7
Jun 299.3 33.3 5243.9 5243.9 - - 5381.1 5379.8 1.3 472.4 11430.0 9835.3 9533.0 302.3 1594.7
Sep 299.3 33.5 4959.5 4959.5 - - 5695.3 5694.1 1.2 652.5 11640.1 9995.3 9696.3 299.0 1644.7
Dec 310.3 123.9 4705.2 4705.2 - - 6090.5 6088.8 1.7 738.7 11968.6 10236.0 9918.4 317.6 1732.5
2000
Jan 313.7 233.3 4705.2 4705.2 - - 6175.5 6173.8 1.7 801.5 12229.2 10528.5 10207.2 321.3 1700.8
Feb 319.9 416.1 4692.3 4692.3 - - 6289.2 6285.4 3.8 676.7 12394.2 10669.9 10345.1 324.8 1724.4
Mar 319.9 140.5 5058.5 5058.5 - - 6386.0 6382.1 3.9 653.6 12558.5 10797.8 10466.4 331.4 1760.7
Apr 319.6 125.7 5230.9 5230.9 - - 6493.3 6489.4 3.9 626.9 12796.4 11034.4 10689.1 345.3 1761.8
May 319.6 232.4 5339.9 5339.9 - - 6584.2 6580.5 3.7 586.0 13062.1 11277.6 10932.7 344.9 1784.5
Jun 329.1 288.6 5339.9 5339.9 - - 6692.4 6688.2 4.2 629.5 13279.5 11425.3 11057.4 367.9 1854.1
Jul 329.1 241.1 5339.9 5339.9 - - 6801.4 6797.3 4.1 690.0 13401.5 11582.6 11217.6 365.0 1818.9
Aug 337.2 144.5 5456.4 5456.4 - - 6899.8 6898.2 1.6 748.7 13586.6 11748.9 11397.2 351.7 1837.7
Sep 337.2 397.7 5436.0 5436.0 - - 6980.0 6978.4 1.6 786.9 13937.8 12062.4 11714.0 348.4 1875.4
Oct 337.2 986.3 5037.2 5037.2 - - 7073.5 7072.4 1.1 735.5 14169.7 12297.9 11946.6 351.3 1871.9
Nov 337.2 920.3 5227.1 5227.1 - - 7188.9 7187.8 1.1 753.7 14427.2 12535.7 12184.8 350.9 1891.4
Dec 355.7 885.1 5227.1 5227.1 - - 7281.8 7281.8 - 798.9 14548.6 12593.2 12239.2 354.0 1955.3
2001
Jan 355.7 1010.4 5435.0 5435.0 - - 7317.2 7317.2 - 869.4 14987.7 13111.9 12747.5 364.4 1875.6
Feb 355.7 1467.5 5221.4 5221.4 - - 7426.3 7426.3 - 779.8 15250.7 13370.5 12998.4 372.1 1880.2
Mar 418.7 1436.5 5721.6 5721.6 - - 7497.4 7497.4 - 729.2 15803.4 13825.2 13450.0 375.2 1978.0
Apr 418.7 1189.4 6191.3 6191.3 - - 7592.1 7592.1 - 748.4 16139.9 14170.3 13786.4 383.9 1969.5
May 417.0 2357.5 5469.4 5469.4 - - 7681.1 7681.1 - 704.7 16629.7 14654.5 14266.3 388.2 1975.1
Jun 425.1 2488.6 5469.4 5469.4 - - 7753.8 7753.8 - 760.3 16897.2 14834.6 14428.1 406.5 2062.5
Jul 423.4 2397.5 5604.1 5604.1 - - 7815.3 7815.3 - 817.8 17058.1 15050.1 14645.3 404.8 2008.0
Aug 423.4 2005.4 6052.8 6052.8 - - 7914.2 7914.2 - 857.9 17253.7 15204.7 14814.9 389.8 2048.9
Sep 423.4 1683.2 6408.8 6408.8 - - 8035.3 8035.3 - 831.0 17381.7 15287.4 14902.1 385.3 2094.3
Oct 423.4 1583.1 6796.8 6796.8 - - 8136.6 8136.6 - 766.2 17706.1 15609.2 15214.1 395.1 2096.9
Nov 423.4 1502.2 7019.9 7019.9 - - 8249.0 8249.0 - 786.7 17981.2 15856.9 15465.0 391.9 2124.3
Dec 450.4 1660.7 7019.9 7019.9 - - 8305.7 8305.7 - 837.0 18273.7 16073.7 15670.8 402.9 2200.0
Source: New Building Society
Back to Annexe
Period
EndedForeign
Sector
Banking
System
Cash &
DepositsTotal
Total
Assets/
LiabilitiesGov't.
T/Bills
Gov't.
Debentures
Local
Gov't.
Sector Total
TABLE 5-ITHE NEW BUILDING SOCIETY: ASSETS AND LIABILITIES
(G$ Million)
OtherTotal
Deposits
Shares
Deposits
Other
DepositsMortgage
Loans
Other
Loans
Other

Banking System Public Sector
1990 498774 - 85838 3515 82323 14236 9805 4431 380985 305062 75923 - 17715
1991 899706 - 120373 2683 117690 179457 102519 76938 436151 377028 59123 - 163725
1992 1548944 - 396290 6133 390157 212120 - 212120 851294 615032 236262 - 89240
1993 2169326 - 627206 117076 510130 336617 105922 230695 1118830 740324 378506 - 86673
1994 3165036 - 89820 9037 80783 321535 321495 40 2662139 908623 436358 1317158 91542
1995 4431353 - 235378 19668 215710 184647 184607 40 3899021 1150691 587921 2160409 112307
1996 5221388 - 356675 48460 308215 40 - 40 4789871 1727492 831059 2231320 74802
1997 6772366 - 173475 27103 146372 1992 1952 40 5870294 2298479 847949 2723866 726605
1998
Mar 7356863 - 276997 31776 245221 - - - 6274387 2465196 859629 2949562 805479
Jun 8002112 - 211297 34246 177051 3285 3285 - 6962454 2621319 877893 3463242 825076
Sep 7983297 - 241053 61956 179097 2003 2003 - 6945019 2666051 881747 3397221 795222
Dec 4495139 124767 170438 48231 122207 12538 12538 - 3795151 2677095 953481 164575 392245
1999
Mar 4753170 227140 169453 34218 135235 205 205 - 3943821 2816144 1023724 103953 412551
Jun 4933073 276463 295205 81354 213851 - - - 3938894 2803227 1031714 103953 422511
Sep 5280622 197847 101241 31069 70172 19982 19982 - 4541882 2899701 1216398 425783 419670
Dec 5359969 152128 149686 23829 125857 19982 19982 - 4628936 2907144 1354823 366969 409237
2000
Mar 5707269 141219 290797 56722 234075 21156 21156 - 4847411 2939022 1465425 442964 406686
Jun 5685611 168324 244965 25507 219458 55406 55406 - 4814701 2942720 1551397 320584 402215
Sep 5776150 159589 381490 40190 341300 29380 29380 - 4761262 3061810 1487247 212205 444429
Dec 5920496 151602 462616 32337 430279 - - - 4837202 3110897 1452947 273358 469076
2001
Mar 6202767 151147 390506 34814 355692 - - - 5181701 2983581 1830494 367626 479413
Jun 6203836 150540 413616 26735 386881 - - - 5160927 3258992 1528671 373264 478753
Sep 6232362 144943 597395 160033 437362 - - - 5145231 3372492 1408827 363912 344793
Dec 6348191 137353 455695 40909 414786 - - - 5306157 3309725 1305553 690879 448986
Source: Trust Companies
* Includes finance companies prior to December 1998.1 Other includes claims on non- residents prior to December 1998.
TABLE 5-II(a)
TRUST COMPANIES*: ASSETS
(G$ Thousand)
Shares Other 1
Private Sector
Local
Gov't.
Sector
TotalMortgage
Loans
Other
Loans &
Adv.
Back to Annexe
Period
Ended
Total
Assets
Foreign
Sector Total Cash Deposits TotalGov't.
T/Bills

1990 498774 - 379270 379270 6951 63137 309182 - 51675 16850 4362 30463 67829
1991 899706 - 664764 664764 34875 85906 543983 - 130050 16850 63756 49444 104892
1992 1548944 - 1039656 1039656 59724 276727 703205 - 273853 31380 158278 84195 235435
1993 2169326 - 1309692 1309692 16795 1130902 161995 - 445549 48279 205748 191522 414085
1994 3165036 - 1536293 1536293 9471 1200958 325864 - 1416386 51743 1203108 161535 212357
995 4431353 - 1913303 1913303 13782 1339844 559677 - 2030284 68547 1773712 188025 487766
1996 5221388 - 1963144 1963144 22850 1727214 213080 - 2888841 795722 1825866 267253 369403
1997 6772366 - 2391978 2391978 11677 2308457 71844 - 4000446 1177228 1863918 959300 379942
1998
Mar 7356823 - 2581737 2581737 30201 2476822 74714 - 4593282 989810 2201003 1402469 181804
Jun 8002112 - 2558701 2558701 19551 2470329 68821 - 4916303 912110 2589367 1414826 527108
Sep 7983297 - 2652270 2652270 20635 2564570 67065 - 5056255 1414354 2183372 1458529 274772
Dec 4495139 82172 2692562 2692562 23404 2572787 96371 - 1658417 1131281 350080 177056 61988
1999
Mar 4753170 81789 2839021 2839021 22926 2714379 101716 - 1748312 1222597 390871 134844 84048
Jun 4933073 87373 2904255 2904255 22782 2771173 110300 - 1792470 1285615 340424 166431 148975
Sep 5280622 84395 3164616 3164616 23306 3053245 88065 - 1940383 1301366 469111 169906 91228
Dec 5359969 83047 3186545 3186545 12487 3103865 70193 - 1985325 1316653 501851 166821 105052
2000
Mar 5707269 81375 3322272 3122272 16101 3033381 72790 200000 2137782 1362880 616726 158176 165840
Jun 5685611 82992 3299198 3099198 17208 2995973 86017 200000 2185906 1389672 601754 194480 117515
Sep 5776150 92018 3252069 3052069 29199 2942706 80164 200000 2234964 1399139 617046 218779 197099
Dec 5920496 91354 3320388 3120388 20917 3027117 72354 200000 2284746 1430448 633360 220938 224008
2001
Mar 6202767 99173 3459116 3259116 9104 3163217 86795 200000 2411212 1451604 770606 189002 233266
Jun 6203836 99326 3526149 3326149 11802 3252034 62313 200000 2451124 1476526 795659 178939 127237
Sep 6232362 100186 3425330 3425330 11438 3347729 66163 - 2376291 1480964 710390 184937 330555
Dec 6348191 102391 3635752 3635752 9333 3565093 61326 - 2302976 1473947 630912 198117 307072
Source: Trust Companies
* Includes finance companies prior to December 1998.
** Retained Earnings have now replaced Trust Fund as in previous reports.1 Other includes claims on non- residents prior to December 1998.
Other Private Sector
TABLE 5-II(b)TRUST COMPANIES*: LIABILITIES
(G$ Thousand)
Foreign
Sector
Private SectorPublic
SectorOther
1TotalCapital
Stock
Loans
Rec.
**
Retained
Earnings
Deposits
Total
Deposits TotalBusiness
Firms
Indiv.
Cust.
Other
Cust.
Period
Ended
Total
Liabilities
Back to Annexe

(G$ Thousand)
Banking System Public Sector
1991 899706 - 120373 2683 117690 179457 102519 76938 436151 377028 59123 - 163725
1992 1548944 - 396290 6133 390157 212120 - 212120 851294 615032 236262 - 89240
1993 2169326 - 627206 117076 510130 336617 105922 230695 1118830 740324 378506 - 86673
1994 3165036 - 89820 9037 80783 321535 321495 40 2662139 908623 436358 1317158 91542
1995 4431353 - 235378 19668 215710 184647 184607 40 3899021 1150691 587921 2160409 112307
1996 5221388 - 356675 48460 308215 40 - 40 4789871 1727492 831059 2231320 74802
1997 6772366 - 173475 27103 146372 1992 1952 40 5870294 2298479 847949 2723866 726605
1998
Mar 7356863 - 276997 31776 245221 - - - 6274387 2465196 859629 2949562 805479
Jun 8002112 - 211297 34246 177051 3285 3285 - 6962454 2621319 877893 3463242 825076
Sep 7983297 - 241053 61956 179097 2003 2003 - 6945019 2666051 881747 3397221 795222
Dec 3245634 73 31581 - 31581 - - - 3162052 - 1275 3160777 51928
1999
Mar 3961911 39157 50318 5552 44766 - - - 3807676 - 382268 3425408 64760
Jun 4161610 31490 69934 14965 54969 - - - 3991608 1304 353604 3636700 68578
Sep 4205221 15690 141550 2613 138937 - - - 3968144 1586 320267 3646291 79837
Dec 4320177 17749 93705 11471 82234 - - - 4109684 1279 484190 3624215 99039
2000
Mar 4255110 28680 63729 9258 54471 - - - 4085472 1491 459766 3624215 77229
Jun 4458251 414164 55474 1916 53558 - - - 3817964 1392 407992 3408580 170649
Sep 4563953 428572 78758 27236 51522 - - - 3847620 1606 368387 3477627 209003
Dec 4937274 444225 84443 5918 78525 - - - 4294749 1510 501747 3791492 113857
2001
Mar 5564839 438802 67233 21650 45583 - - - 4760260 1492 437112 4321656 298544
Jun 5583621 450431 92740 21420 71320 - - - 4834663 1659 388850 4444154 205787
Sep 5625184 457693 71026 7954 63072 - - - 4812737 3150 365433 4444154 283728
Dec 5713287 454027 102052 22513 79539 - - - 4869357 3085 422118 4444154 287851
Source: Trust and Finance Companies
* Includes Trust Companies prior to December 1998.
TABLE 5-II(c)
FINANCE COMPANIES*: ASSETS
Mortgage
Loans
Other
Loans &
Adv.
Shares Other
Local
Gov't.
Sect.
Total
Private Sector
Back to Annexe
Period
Ended
Total
Assets
Foreign
Sector Total Cash Deposits TotalGov't.
T/Bills

1991 899706 - 664764 664764 34875 85906 543983 - 130050 16850 63756 49444 1048921992 1548944 - 1039656 1039656 59724 276727 703205 - 273853 31380 158278 84195 2354351993 2169326 - 1309692 1309692 16795 1130902 161995 - 445549 48279 205748 191522 4140851994 3165036 - 1536293 1536293 9471 1200958 325864 - 1416386 51743 1203108 161535 2123571995 4431353 - 1913303 1913303 13782 1339844 559677 - 2030284 68547 1773712 188025 4877661996 5221388 - 1963144 1963144 22850 1727214 213080 - 2888841 795722 1825866 267253 369403
1997 6772366 - 2391978 2391978 11677 2308457 71844 - 4000446 1177228 1863918 959300 379942
1998Mar 7356823 - 2581737 2581737 30201 2476822 74714 - 4593282 989810 2201003 1402469 181804Jun 8002112 - 2558701 2558701 19551 2470329 68821 - 4916303 912110 2589367 1414826 527108Sep 7983297 - 2652270 2652270 20635 2564570 67065 - 5056255 1414354 2183372 1458529 274772
Dec 3245634 28982 - - - - - - 3213666 578046 1346437 1289183 2986
1999Mar 3961911 261984 - - - - - - 3672421 90609 1722003 1859809 27506Jun 4161610 261984 - - - - - - 3879879 118295 1688430 2073154 19747Sep 4205221 261984 - - - - - - 3922227 208076 1634330 2079821 21010
Dec 4320177 261921 - - - - - - 4031740 310963 1643511 2077266 26516
2000Mar 4255110 261921 - - - - - - 3955701 123303 1575203 2257195 37488Jun 4458251 261921 - - - - - - 4164543 178642 1580434 2405467 31787Sep 4563953 261921 - - - - - - 4247259 251338 1590114 2405807 54773
Dec 4937274 540984 - - - - - - 4338259 331424 1607493 2399342 58031
2001
Mar 5564839 917534 - - - - - - 4615698 181335 1904396 2529967 31607
Jun 5583621 917471 - - - - - - 4610623 217611 1740547 2652465 55527
Sep 5625184 917471 - - - - - - 4674896 258728 1763703 2652465 32817
Dec 5713287 917471 - - - - - - 4751447 313544 1785613 2652290 44369
Source: Trust and Finance Companies
* Includes Trust Companies prior to December 1998.
** Retained Earnings have now replaced Trust Fund as in previous reports.
Back to Annexe
Period
Ended
Total
Liabilities
Foreign
Sector
Private SectorPublic
Sector
Deposits
Total
Deposits TotalBusiness
Firms
Individual
Customer
Other
Cust.
Other Private Sector
OtherTotalCapital
Stock
Loans
Rec.
**
Retained
Earnings
(G$ Thousand)
TABLE 5-II(d)FINANCE COMPANIES*: LIABILITIES

Assets Liabilities
Foreign Sector Banking System Public Sector Private Sector Unclassified
1990 2315.7 750.8 354.8 913.3 296.8 53.6 36.1 17.5 96.9 50.6 36.9 9.4 70.2 13.7 42.0 14.5 378.2 282.3 95.9 2914.6 871.2 76.8 1920.5 46.1
1991 3726.7 1446.4 775.5 1075.3 429.5 108.5 79.9 28.6 51.8 7.8 40.6 3.4 72.7 10.5 45.8 16.4 977.9 291.3 686.6 4937.6 2299.5 16.7 2588.9 32.5
1992 3453.4 1001.4 1516.7 660.8 274.5 36.0 10.7 25.3 72.1 16.5 37.1 18.5 91.9 26.9 42.2 22.8 1641.9 229.1 1412.8 5295.4 1849.9 28.8 2595.6 821.1
1993 3981.8 1136.6 1417.7 1150.0 277.5 115.5 10.0 105.5 109.6 58.3 51.0 0.3 142.8 51.3 66.5 25.0 367.7 237.8 129.9 4717.4 2024.7 45.4 2541.8 105.5
1994 3594.7 1304.5 615.2 1262.2 412.8 87.1 51.3 35.8 156.6 130.1 26.0 0.5 278.6 135.8 71.9 70.9 501.8 413.7 88.1 4618.8 1439.7 90.4 2889.8 198.9
1995 3626.7 1324.6 626.9 1244.1 431.1 316.1 49.0 267.1 134.8 111.3 23.2 0.3 358.9 221.2 84.7 53.0 1007.8 738.2 269.6 5444.3 1659.6 349.0 2868.9 566.8
1996 3845.7 1676.3 544.3 1254.5 370.6 341.4 58.3 283.1 33.4 13.0 20.1 0.3 528.3 357.0 75.1 96.2 1238.9 996.2 242.7 5987.7 1890.6 400.8 3151.8 544.5
1997 4178.4 1792.0 758.8 1218.8 408.8 354.1 33.3 320.8 93.6 83.1 10.2 0.3 539.4 430.4 45.6 63.4 1532.8 1155.6 377.2 6698.3 1962.0 546.8 3320.9 868.6
1998
Mar 4207.9 1793.6 767.4 1257.1 389.8 526.0 71.1 454.9 106.8 97.2 9.3 0.3 676.2 533.5 69.9 72.8 1518.3 1181.1 337.2 7035.2 1968.9 525.7 3045.8 1494.8
Jun 4375.0 1864.3 790.1 1177.4 543.2 509.4 60.9 448.5 100.8 95.5 5.0 0.3 636.3 493.2 69.4 73.7 1647.2 1259.7 387.5 7268.7 1999.6 681.7 3046.0 1541.5
Sep 4313.6 1843.3 836.3 1135.6 498.4 484.6 34.4 450.2 100.3 92.9 7.1 0.3 685.6 512.3 99.9 73.4 1655.3 1224.8 430.5 7239.4 1986.7 691.7 3001.8 1559.2
Dec 4250.5 2005.0 884.2 663.1 698.2 538.1 26.7 511.4 84.6 80.0 4.3 0.3 1167.0 479.0 124.7 563.3 1689.0 1309.8 379.2 7729.2 2305.9 571.6 3336.7 1514.9
1999
Mar 4452.3 2175.7 909.7 716.2 650.7 606.4 38.4 568.0 94.5 91.1 3.1 0.3 1162.9 498.6 122.5 541.8 2138.4 1561.8 576.6 8454.5 2539.7 617.9 3679.6 1617.4
Jun 4376.9 2155.1 981.6 802.9 437.3 510.9 73.8 437.1 124.8 121.4 3.1 0.3 1252.4 530.8 121.1 600.5 2315.3 1562.9 752.4 8580.3 2576.1 624.1 3493.0 1887.1
Sep 4119.4 2112.2 1076.1 580.2 350.9 486.9 51.9 435.0 207.4 204.0 3.1 0.3 1500.1 545.8 115.5 838.8 2304.6 1698.3 606.3 8618.4 2677.1 637.4 3521.0 1783.1
Dec 4346.8 2043.5 1118.2 843.9 341.2 523.5 79.9 443.6 211.1 207.4 3.4 0.3 1269.7 538.0 112.8 618.9 2572.0 1840.2 731.8 8923.1 2673.0 676.4 4113.8 1459.8
2000
Mar 4555.3 2068.6 1178.2 856.4 452.1 505.0 99.8 405.2 120.1 116.7 3.4 - 1345.0 658.3 102.5 584.2 2867.9 1897.7 970.2 9393.3 2915.5 613.2 4493.4 1371.2
Jun 4795.4 1990.6 1240.2 1234.0 330.6 641.1 112.6 528.5 95.1 95.1 - - 1103.2 649.9 143.7 309.6 2612.7 1788.7 824.0 9247.5 2935.8 761.9 4250.7 1299.0
Sep 4814.3 2048.8 1248.0 1181.3 336.2 585.7 84.0 501.7 119.3 119.3 - - 1155.6 664.8 146.8 344.0 2545.0 1781.4 763.6 9219.9 3011.1 776.1 4182.8 1249.9
Dec 5044.8 2105.3 1222.4 1242.0 475.1 731.8 226.9 504.9 106.8 106.5 0.3 - 1298.8 749.9 148.1 400.8 2335.8 1811.3 524.5 9518.0 2999.2 818.7 4266.0 1434.1
2001
Mar 5046.7 2150.1 746.9 1430.4 719.3 707.8 152.9 554.9 133.7 133.4 0.3 - 1722.5 1272.2 153.9 296.4 2265.5 1361.4 904.1 9876.2 2477.0 1375.9 4596.7 1426.5
Jun 5454.5 2178.8 781.2 1401.8 1092.7 756.0 207.3 548.7 124.2 124.2 - - 2266.1 1756.7 180.1 329.3 1900.0 1370.2 529.8 10500.8 2872.8 1465.6 4636.3 1526.1
Sep 5506.5 2248.8 1285.1 1377.3 595.3 748.4 119.6 628.8 72.8 72.8 - - 2158.9 1653.6 180.1 325.2 1989.3 1167.8 821.5 10475.9 2985.1 1471.4 4553.8 1465.6
Dec 5555.8 2284.6 1300.1 1379.7 591.5 797.9 120.5 677.4 84.5 84.5 - - 1752.2 1230.7 186.2 335.3 2008.9 1219.7 789.2 10199.4 3066.9 967.6 4673.1 1491.9
Source: Life Insurance Companies1 Foreign liabilities include insurance fund from non-residents
(G$ Million)
TABLE 5-III(a)
LIFE
DOMESTIC INSURANCE COMPANIES: ASSETS AND LIABILITIES
Foreign
Liab. 1Other
Total
Comm.
Banks
Deposits
Securities
Loans
and
Adv.
Other Total Cash Deposits
Cap.
and
Res.TotalGov't.
T/Bills
Gov't.
Debentures
Local
Gov't
Sect.
Total
Sect.
In
Firms
Other
Assets
Mortgage
Loans
Other
Loans
Back to Annexe
Period
Ended
Total
Assets/
LiabilitiesIns.
FundTotalFixed
Assets

Assets Liabilities
Foreign Sector Banking System Public Sector Private Sector Unclassified
1990 135.2 59.2 29.8 - 46.2 11.7 0.1 11.6 146.7 58.8 21.8 66.1 29.4 5.4 13.9 10.1 187.4 103.4 84.0 510.4 - 202.2 15.2 293.0
1991 211.4 97.8 83.7 - 29.9 135.4 1.5 133.9 56.6 - 19.5 37.1 40.5 7.2 23.0 10.3 259.5 126.4 133.1 703.4 - 293.3 53.2 356.9
1992 260.9 131.2 88.2 - 41.5 80.9 42.6 38.3 19.0 - 14.7 4.3 58.2 10.4 37.7 10.1 424.3 145.2 279.1 843.4 - 360.2 30.7 452.5
1993 314.9 137.2 155.9 - 21.8 67.6 0.9 66.7 26.2 9.0 16.4 0.8 56.8 17.3 36.7 2.8 472.9 217.3 255.6 938.4 - 501.5 51.1 385.8
1994 424.0 178.2 191.2 - 54.6 68.9 2.6 66.3 56.8 44.4 11.6 0.8 190.3 136.4 41.6 12.3 753.4 666.0 87.4 1493.4 - 1161.5 83.5 248.4
1995 645.2 216.2 284.5 - 144.5 213.5 4.3 209.2 93.2 82.6 9.9 0.7 235.0 154.4 66.1 14.5 1032.5 753.9 278.6 2219.4 - 1602.5 30.3 586.6
1996 500.9 294.9 167.8 - 38.2 405.8 7.6 398.2 5.2 - 5.2 - 406.1 287.0 79.1 40.0 1367.9 917.3 450.6 2685.9 - 1890.4 148.0 647.5
1997 535.7 370.5 144.0 - 21.2 472.9 5.6 467.3 2.3 1.4 0.9 - 490.9 315.0 97.1 78.8 1411.1 899.2 511.9 2912.9 - 2121.1 58.6 733.2
1998
Mar 600.4 393.4 141.5 - 65.5 531.2 16.8 514.4 1.9 - 1.9 - 501.3 314.6 100.4 86.3 1338.7 940.8 397.9 2973.5 - 2122.2 193.0 658.3
Jun 732.5 434.3 158.1 - 140.1 582.1 4.0 578.1 1.5 - 1.5 - 493.4 318.1 86.0 89.3 1348.5 929.3 419.2 3158.0 - 2283.3 187.9 687.0
Sep 727.6 450.9 159.6 - 117.1 576.7 0.8 575.9 1.5 - 1.5 - 502.1 329.6 82.3 90.2 1419.4 925.5 493.9 3227.3 - 2210.7 172.3 844.3
Dec 619.6 456.3 146.2 - 17.1 415.8 0.2 415.6 - - - - 442.4 323.3 86.8 32.3 1478.0 831.0 647.0 2955.8 - 2166.4 164.6 624.6
1999
Mar 625.1 446.4 175.2 - 3.5 492.3 1.8 490.5 - - - - 434.9 318.1 86.0 30.8 1497.0 865.0 632.0 3049.3 - 2234.5 182.4 632.6
Jun 823.1 598.1 221.3 - 3.7 268.2 5.4 262.8 2.3 2.3 - - 443.4 220.5 85.6 137.3 1397.4 879.0 518.4 2934.4 - 2383.5 13.9 536.9
Sep 795.2 595.2 197.4 - 2.6 229.5 3.2 226.3 51.8 51.8 - - 471.3 242.7 96.4 132.2 1473.7 864.9 608.8 3021.5 - 2375.8 6.1 639.5
Dec 836.7 620.3 197.8 - 18.6 155.3 9.9 145.4 37.6 37.6 - - 380.3 242.2 112.9 25.2 1557.1 924.2 632.9 2967.0 - 2336.1 32.9 598.0
2000
Mar 869.5 669.7 195.6 - 4.2 257.4 5.8 251.6 36.1 36.1 - - 596.7 457.2 62.9 76.6 1313.2 944.6 368.6 3072.9 - 2443.9 38.2 590.8
Jun 945.3 637.8 224.2 - 83.3 281.6 13.6 268.0 61.2 61.2 - - 743.6 457.5 63.3 222.8 1399.4 1085.2 314.2 3431.1 - 2445.2 41.7 944.1
Sep 893.7 511.0 224.3 - 158.4 255.2 8.2 247.0 33.7 33.7 - - 650.9 460.2 117.7 73.0 1306.6 1059.0 247.6 3140.1 - 2479.5 62.4 596.8
Dec 909.8 545.5 323.7 32.3 8.3 221.3 19.0 202.3 25.0 25.0 - - 609.6 460.2 124.5 24.9 1478.5 1131.5 347.0 3244.2 - 2501.2 55.7 687.4
2001
Mar 1108.2 812.3 259.4 32.6 3.9 238.1 11.6 226.5 22.2 22.2 - - 620.0 467.7 94.1 58.2 1485.6 1154.8 330.8 3474.1 - 2655.1 72.5 746.3
Jun 1509.6 874.2 220.9 43.6 370.9 268.1 6.3 261.8 22.2 22.2 - - 637.7 461.0 138.8 37.9 1240.8 1123.3 117.5 3678.4 - 2328.6 209.7 1139.9
Sep 1467.2 792.0 255.6 43.8 375.8 139.1 5.3 133.8 - - - - 641.3 463.3 136.2 41.8 1302.0 1104.8 197.2 3549.6 - 2417.6 461.7 670.3
Dec 1283.3 757.4 244.7 44.4 236.9 224.6 9.1 215.4 - - - - 629.3 463.3 121.8 44.2 1299.7 1098.4 201.3 3436.9 - 2540.3 318.7 577.9
Source: Non-Life Insurance Companies
Back to Annexe
Other
Assets
Mortgage
Loans
Other
LoansTotal
Fixed
Assets
Period
EndedForeign
Liab.Other
Total
Comm.
Banks
Deposits
Securities
Loans
and
Adv.
Other Total Cash Deposits
Total
Assets/
LiabilitiesIns.
Fund
Cap.
and
Res.TotalGov't.
T/Bills
Gov't.
Debentures
Local
Gov't
Sect.
TotalSect. In
Firms
TABLE 5-III(b)NON-LIFE
DOMESTIC INSURANCE COMPANIES: ASSETS AND LIABILITIES
(G$ Million)

Assets Liabilities
Foreign Sector Banking System Public Sector Private Sector Unclassified
1990 2450.9 810.0 384.6 913.3 343.0 65.3 36.2 29.1 243.6 109.4 58.7 75.5 99.6 19.1 55.9 24.6 565.6 385.7 179.9 3425.0 871.2 279.0 1935.7 339.1
1991 3938.1 1544.2 859.2 1075.3 459.4 243.9 81.4 162.5 108.4 7.8 60.1 40.5 113.2 17.7 68.8 26.7 1237.4 417.7 819.7 5641.0 2299.5 310.0 2642.1 389.4
1992 4714.1 2162.5 902.8 1218.8 430.0 827.0 38.9 788.1 95.9 84.5 11.1 0.3 1030.3 745.4 142.7 142.2 2943.9 2054.8 889.1 9611.2 1962.0 2667.9 3379.5 1601.8
1993 3895.6 1351.6 763.2 944.6 836.2 166.5 51.5 115.0 94.4 25.8 58.6 10.0 129.4 19.1 58.6 51.8 675.5 403.0 272.5 4961.3 1123.4 202.4 2900.7 308.5
1994 3701.0 1407.8 862.6 1014.4 416.2 157.1 49.4 107.7 85.3 19.7 62.9 2.7 82.5 16.8 41.7 24.0 1111.8 381.2 730.6 5137.8 2122.3 173.8 2509.8 331.9
1995 3806.1 1525.2 853.2 1018.5 409.2 114.2 27.5 86.7 88.1 10.0 52.3 25.8 100.3 22.9 46.7 30.7 1154.2 383.2 771.0 5262.9 2133.2 222.1 2587.5 320.1
1996 3938.1 1544.2 859.2 1075.3 459.4 243.9 81.4 162.5 108.4 7.8 60.1 40.5 113.2 17.7 68.8 26.7 1237.4 417.7 819.7 5641.0 2299.5 310.0 2642.1 389.4
1997 4714.1 2162.5 902.8 1218.8 430.0 827.0 38.9 788.1 95.9 84.5 11.1 0.3 1030.3 745.4 142.7 142.2 2943.9 2054.8 889.1 9611.2 1962.0 2667.9 3379.5 1601.8
1998
Mar 4808.3 2187.0 908.9 1257.1 455.3 1057.2 87.9 969.3 108.7 97.2 11.2 0.3 1177.5 848.1 170.3 159.1 2857.0 2121.9 735.1 10008.7 1968.9 2647.9 3238.8 2153.1
Jun 5107.5 2298.6 948.2 1177.4 683.3 1091.5 64.9 1026.6 102.3 95.5 6.5 0.3 1129.7 811.3 155.4 163.0 2995.7 2189.0 806.7 10426.7 1999.6 2965.0 3233.9 2228.5
Sep 5041.2 2294.2 995.9 1135.6 615.5 1061.3 35.2 1026.1 101.8 92.9 8.6 0.3 1187.7 841.9 182.2 163.6 3074.7 2150.3 924.4 10466.7 1986.7 2902.4 3174.1 2403.5
Dec 4870.1 2461.3 1030.4 663.1 715.3 953.9 26.9 927.0 84.6 80.0 4.3 0.3 1609.4 802.3 211.5 595.6 3167.0 2140.8 1026.2 10685.0 2305.9 2738.0 3501.3 2139.5
1999
Mar 5077.4 2622.1 1084.9 716.2 654.2 1098.7 40.2 1058.5 94.5 91.1 3.1 0.3 1597.8 816.7 208.5 572.6 3635.4 2426.8 1208.6 11503.8 2539.7 2852.4 3862.0 2250.0
Jun 5200.0 2753.2 1202.9 802.9 441.0 779.1 79.2 699.9 127.1 123.7 3.1 0.3 1695.8 751.3 206.7 737.8 3712.7 2441.9 1270.8 11514.7 2576.1 3007.6 3506.9 2424.0
Sep 4914.6 2707.4 1273.5 580.2 353.5 716.4 55.1 661.3 259.2 255.8 3.1 0.3 1971.4 788.5 211.9 971.0 3778.3 2563.2 1215.1 11639.9 2677.1 3013.2 3527.1 2422.6
Dec 5183.5 2663.8 1316.0 843.9 359.8 678.8 89.8 589.0 248.7 245.0 3.4 0.3 1650.0 780.2 225.7 644.1 4129.1 2764.4 1364.7 11890.1 2673.0 3012.5 4146.7 2057.8
2000
Mar 5424.8 2738.3 1373.8 856.4 456.3 762.4 105.6 656.8 156.2 152.8 3.4 - 1941.7 1115.5 165.4 660.8 4181.1 2842.3 1338.8 12466.2 2915.5 3057.1 4531.6 1962.0
Jun 5740.7 2628.4 1464.4 1234.0 413.9 922.7 126.2 796.5 156.3 156.3 - - 1846.8 1107.4 207.0 532.4 4012.1 2873.9 1138.2 12678.6 2935.8 3207.1 4292.4 2243.1
Sep 5708.0 2559.8 1472.3 1181.3 494.6 840.9 92.2 748.7 153.0 153.0 - - 1806.5 1125.0 264.5 417.0 3851.6 2840.4 1011.2 12360.0 3011.1 3255.6 4245.2 1846.7
Dec 5954.6 2650.8 1546.1 1274.3 483.4 953.1 245.9 707.2 131.8 131.5 0.3 - 1908.4 1210.1 272.6 425.7 3814.3 2942.8 871.5 12762.2 2999.2 3319.9 4321.7 2121.5
2001
Mar 6154.9 2962.4 1006.3 1463.0 723.2 945.9 164.5 781.4 155.9 155.6 0.3 - 2342.5 1739.9 248.0 354.6 3751.1 2516.2 1234.9 13350.3 2477.0 4031.0 4669.2 2172.8
Jun 6964.1 3053.0 1002.1 1445.4 1463.6 1024.1 213.6 810.5 146.4 146.4 - - 2903.8 2217.7 318.9 367.2 3140.8 2493.5 647.3 14179.2 2872.8 3794.2 4846.0 2666.0
Sep 6973.7 3040.8 1540.7 1421.1 971.1 887.5 124.9 762.6 72.8 72.8 - - 2800.2 2116.9 316.3 367.0 3291.3 2272.6 1018.7 14025.5 2985.1 3889.0 5015.5 2135.9
Dec 6839.2 3042.0 1544.7 1424.0 828.4 1022.4 129.6 892.8 84.5 84.5 - - 2381.5 1693.9 308.1 379.6 3308.6 2318.1 990.5 13636.3 3066.9 3507.9 4991.8 2069.8
Source: Insurance Companies
Back to Annexe
Cap.
and
Res.
Foreign
Liab.OtherFixed
Assets
Other
Assets
Total
Assets/
LiabilitiesIns. FundLocal
Gov't
Sect.
Total TotalSect. In
Firms
Mortgage
Loans
Other
LoansDeposits Total
Gov't.
T/Bills
Gov't.
Debentures
Loans
and
Adv.
Other Total Cash
Period
EndedTotal
Comm.
Banks
Deposits
Securities
TABLE 5-III(c)CONSOLIDATED
DOMESTIC INSURANCE COMPANIES: ASSETS AND LIABILITIES
(G$ Million)

Banking System Public Sector Private Sector
1990 39.0 137.8 0.9 136.9 187.1 98.7 87.3 1.1 335.8 8.8 - 327.0 699.7 672.3 7.0 20.4
1991 56.6 206.2 0.4 205.8 814.2 252.0 561.0 1.2 427.2 14.9 - 412.3 1504.2 1480.8 5.3 18.1
1992 57.3 702.8 1.9 700.9 717.7 162.3 524.7 30.7 826.9 1.8 - 825.1 2304.7 2099.3 114.4 91.0
1993 63.5 1496.4 2.4 1494.0 1079.9 575.6 503.6 0.7 209.0 42.0 - 167.0 2848.8 2658.7 109.2 80.9
1994 77.4 751.9 106.8 645.1 2557.9 2085.6 471.8 0.5 432.0 92.3 - 339.7 3819.2 3549.8 216.5 52.9
1995 85.1 882.9 38.8 844.1 3237.4 2814.2 423.2 - 612.8 227.7 - 385.1 4818.2 4523.7 239.8 54.7
1996 91.2 2703.4 21.7 2681.7 2218.6 1865.5 353.1 - 714.9 306.5 - 408.4 5728.1 5381.6 277.5 69.0
1997 80.8 4616.4 243.8 4372.6 985.0 547.8 437.2 - 1047.6 755.9 - 291.7 6729.8 6371.4 317.1 41.4
1998
Mar 113.8 4870.9 212.4 4658.5 910.6 474.0 436.6 - 1073.3 764.7 - 308.6 6968.6 6614.9 318.9 34.8
Jun 116.9 5281.9 78.9 5203.0 774.9 365.9 409.0 - 1253.5 773.4 - 480.1 7427.2 7049.3 318.9 59.0
Sep 124.0 5372.1 57.1 5315.0 821.8 450.5 371.3 - 1382.7 879.4 - 503.3 7700.6 7284.8 318.9 96.9
Dec 139.0 4008.1 13.1 3995.0 680.0 310.4 369.6 - 2993.3 1065.1 - 1928.2 7820.4 7486.7 142.0 191.7
1999
Mar 144.7 3666.2 42.0 3624.1 1398.1 1062.5 335.6 - 2993.4 1090.8 - 1902.6 8202.5 7797.5 236.2 168.8
Jun 137.2 3719.5 16.1 3703.4 1506.3 1170.7 335.6 - 3072.4 1100.8 - 1971.6 8435.4 8049.3 334.6 51.5
Sep 157.4 3854.5 24.4 3830.1 1500.9 1203.9 296.9 - 3444.3 1105.6 - 2338.7 8957.1 8496.5 340.8 119.8
Dec 157.5 3469.6 31.2 3438.4 1710.9 1414.0 296.9 - 3815.4 1509.1 - 2306.3 9153.4 8408.9 697.8 46.8
2000
Mar 210.6 3791.8 7.3 3784.5 1541.5 1287.1 254.4 - 4266.0 3138.5 - 1127.5 9809.9 8975.0 699.7 135.2
Jun 214.2 3879.4 31.9 3847.5 1434.1 1215.4 218.7 - 4015.6 2917.5 - 1098.1 9543.3 8745.3 701.9 96.0
Sep 778.3 4466.1 40.5 4425.6 933.8 882.4 51.4 - 3858.7 2809.5 - 1049.2 10036.9 9256.9 703.2 76.8
Dec 666.9 4352.5 99.2 4253.3 947.5 888.9 58.6 - 4298.0 3173.7 - 1124.3 10264.9 9437.5 708.4 119.1
2001
Mar 701.6 4713.8 130.0 4583.8 1110.9 1052.3 58.6 - 4155.6 3212.3 - 943.3 10681.9 9871.3 711.1 99.5
Jun 1146.2 4119.9 6.6 4113.3 1189.0 1137.6 51.4 - 4022.2 3161.0 - 861.2 10477.3 9673.8 711.5 92.1
Sep 1199.3 3820.4 57.5 3762.9 1552.4 1552.4 - - 4197.4 3264.8 - 932.6 10769.5 9673.8 711.9 98.5
Dec 1345.9 3729.8 2.8 3727.0 1500.9 1500.9 - - 4449.6 3485.3 10.0 954.3 11026.2 10197.7 712.9 115.6
Source: Pension Schemes
Back to Annexe
Gov't.
T/Bills
Gov't.
Debentures
Total
Assets/
Liabilities
LiabilitiesAssets
Total Cash Deposits Total
Local
Gov't
Sec.
Total
Shares
& Other
Sect.
TABLE 5-IVPENSION SCHEMES: ASSETS AND LIABILITIES
(G$ Million)
Period
Ended
Foreign
SectorPension
FundReservesMortgage
LoansOther
Other

1990
Mar 30.3 690.3 601.3 89.0 152.9 436.4 95.1 65.4 29.7 1405.0 892.2 136.7 755.5 354.7 158.1 -321.1 479.2
Jun 62.6 868.1 779.1 89.0 216.1 553.4 97.5 67.6 29.9 1797.7 1201.4 139.1 1062.3 354.7 241.6 -396.0 637.6
Sep 67.1 887.0 798.0 89.0 220.0 518.1 114.9 83.6 31.3 1807.1 1238.9 138.1 1100.8 354.7 213.5 -339.4 552.9
Dec 60.1 1018.4 929.4 89.0 249.1 550.1 153.8 122.4 31.4 2031.5 1370.1 112.0 1258.1 266.2 395.2 -233.2 628.4
1991
Mar 56.8 851.4 782.4 69.0 592.9 550.9 179.3 146.3 33.0 2231.3 1291.1 112.0 1179.1 258.9 681.3 211.5 469.8
Jun 507.6 1359.1 1190.1 169.0 695.9 966.2 226.6 193.1 33.5 3755.4 2655.5 41.8 2613.7 232.1 867.8 -397.6 1265.4
Sep 281.4 1585.9 1416.9 169.0 752.3 1441.1 536.5 491.0 45.5 4597.2 2916.8 63.0 2853.8 301.4 1379.0 32.4 1346.6
Dec 357.3 1618.1 1449.1 169.0 764.9 1422.8 438.8 391.6 47.2 4601.9 3309.5 134.3 3175.2 383.0 909.4 23.5 885.9
1992
Mar 482.0 1427.1 1258.1 169.0 781.2 1567.0 519.8 483.4 36.4 4777.1 3389.8 198.2 3191.6 383.0 1004.3 116.3 888.0
Jun 458.4 1597.4 1528.4 69.0 711.6 2099.7 1108.3 816.5 291.8 5975.4 3756.5 238.6 3517.9 356.5 1862.4 571.7 1290.7
Sep 733.3 885.2 816.2 69.0 792.6 2401.7 912.0 661.4 250.6 5724.8 3460.5 337.1 3123.4 444.2 1820.1 1154.2 665.9
Dec 935.6 703.2 703.2 - 866.8 2499.2 928.3 834.5 93.8 5933.1 3547.0 389.0 3158.0 362.4 2023.7 1279.8 743.9
1993
Mar 913.0 989.7 989.7 - 973.8 2265.5 951.0 885.8 65.2 6093.0 3291.0 161.4 3129.6 362.5 2439.5 1430.7 1008.8
Jun 883.5 902.8 902.8 - 973.8 2635.9 609.0 526.8 82.2 6005.0 3511.9 237.1 3274.8 371.4 2121.7 1098.4 1023.3
Sep 852.4 646.6 228.6 418.0 905.9 2997.4 658.6 304.8 353.8 6060.9 3469.5 269.8 3199.7 364.9 2226.5 1144.4 1082.1
Dec 189.6 735.1 239.1 496.0 779.4 3341.3 511.7 450.7 61.0 5557.1 2482.6 121.6 2361.0 364.9 2709.6 1394.9 1314.7
1994
Jan 150.3 610.5 317.6 292.9 782.0 3419.7 541.7 482.0 59.7 5504.2 2369.6 79.2 2290.4 364.9 2769.7 1295.0 1474.7
Feb 171.2 602.3 309.4 292.9 782.0 3447.5 561.3 501.4 59.9 5564.3 2378.3 88.5 2289.8 364.9 2821.1 1344.6 1476.5
Mar 218.9 632.2 489.3 142.9 791.5 3381.6 498.6 420.0 78.6 5522.8 2526.8 37.8 2489.0 364.9 2631.1 1242.2 1388.9
Apr 230.7 603.1 510.2 92.9 803.2 3494.9 444.8 444.3 0.5 5576.7 2516.0 41.7 2474.3 364.9 2695.8 1306.3 1389.5
May 230.7 594.9 552.0 42.9 838.1 3450.8 539.0 482.8 56.2 5653.5 2524.5 50.9 2473.6 364.9 2764.1 1371.5 1392.6
Jun 255.1 697.9 697.9 - 639.9 3607.3 540.7 466.7 74.0 5740.9 2533.4 60.2 2473.2 364.9 2842.6 1447.7 1394.9
Jul 255.1 624.9 624.9 - 633.3 3699.5 605.7 512.1 93.6 5818.5 2530.7 69.5 2461.2 364.9 2922.9 1489.1 1433.8
Aug 271.5 527.9 527.9 - 638.8 3651.9 558.1 423.4 134.7 5648.2 2516.4 71.5 2444.9 364.9 2766.9 1314.4 1452.5
Sep 279.7 427.4 427.4 - 638.5 3941.9 556.5 424.4 132.1 5844.0 2525.1 80.8 2444.3 364.9 2954.0 1610.8 1343.2
Oct 206.3 703.1 703.1 - 425.2 3941.8 546.1 413.5 132.6 5822.5 2463.7 66.6 2397.1 364.9 2993.9 1642.2 1351.7
Nov 192.7 648.4 648.4 - 424.9 4021.3 597.6 456.6 141.0 5884.9 2472.4 75.8 2396.6 364.9 3047.6 1699.2 1348.4
Dec 193.6 538.9 538.9 - 426.0 4150.0 656.9 515.5 141.4 5965.4 2480.9 85.1 2395.8 364.9 3119.6 1769.2 1350.4
1995
Jan 203.4 493.7 493.7 - 425.0 4253.7 634.7 487.5 147.2 6010.5 2487.4 93.7 2393.7 364.9 3158.2 1807.0 1351.2
Feb 246.7 464.0 464.0 - 425.0 4295.1 669.2 522.9 146.3 6100.0 2495.3 102.5 2392.8 364.9 3239.8 1867.3 1372.5
Mar 171.8 373.8 373.8 - 425.2 4370.9 743.4 589.3 154.1 6085.1 2405.5 90.0 2315.5 364.9 3314.7 1945.7 1369.0
Apr 173.2 381.3 381.3 - 429.6 4385.7 793.7 640.6 153.1 6163.5 2414.2 98.9 2315.3 364.9 3384.4 2015.6 1368.8
May 173.2 316.2 316.2 - 429.6 4469.1 853.9 701.4 152.5 6242.0 2422.7 108.0 2314.7 364.9 3454.4 2073.9 1380.5
Jun ... ... ... ... ... ... ... ... ... ... ... ... ... ... ... ... ...
Jul ... ... ... ... ... ... ... ... ... ... ... ... ... ... ... ... ...
Aug ... ... ... ... ... ... ... ... ... ... ... ... ... ... ... ... ...
Sep ... ... ... ... ... ... ... ... ... ... ... ... ... ... ... ... ...
Oct ... ... ... ... ... ... ... ... ... ... ... ... ... ... ... ... ...
Nov ... ... ... ... ... ... ... ... ... ... ... ... ... ... ... ... ...
Dec ... ... ... ... ... ... ... ... ... ... ... ... ... ... ... ... ...
Source: Guyana Co-operative Agricultural and Industrial Development Bank
TABLE 5-VGUYANA CO-OPERATIVE AGRICULTURAL AND INDUSTRIAL DEVELOPMENT BANK: ASSETS AND LIABILITIES
(G$ Million)
Assets Liabilities
Back to Annexe
Period
Ended
Total
Banking SystemPublic
Sector
Loans &
Advances
Foreign
Sector
Cash &
Deposits
Bank of
Guyana
Deposits
Comm.
Banks
Deposits
Accum.
Def.(-)
Loans &
Advances
Private
SectorUnclassified
Total
Int. Rec.
from Sub-
Borr.
Other Other
Total
Assets/
Liabilities
Foreign Sector Unclassified Public
Sector
TotalInterest
Payable
Inter. Fin.
Inst.
Gov't.
ContributionTotal

Liabilities
1990 11119 - 46050 40020 6030 57169 723 30000 26446 13617 12829
1991 11570 - 46692 37071 9621 58262 588 30000 27675 13573 14102
1992 11730 - 55529 45208 10321 67259 433 30000 36826 13572 23254
1993 9706 - 52634 44028 8606 62340 324 30000 32016 13481 18535
1994 10137 - 48862 40955 7907 58999 145 30000 28854 12414 16440
1995 928 - 44428 35343 9085 45356 - 15787 29569 13415 16154
1995
Mar 5796 - 48275 38792 9483 54071 108 30000 23963 13221 10742
Jun 2764 - 51307 37275 14032 54071 72 30000 21294 13414 7880
Sep 1278 - 45397 36296 9101 46675 36 17053 29586 13414 16172
Dec 928 - 44428 35343 9085 45356 - 15787 29569 13415 16154
1996
Mar 357 - 42815 34118 8697 43172 - 14377 28795 13414 15381
Jun 1207 - 41223 33074 8149 42430 - 13581 28849 13414 15435
Sep 2827 - 39677 31520 8157 42504 - 13481 29023 13414 15609
Dec 3230 - 41296 33050 8246 44526 - 14754 29772 13414 16358
1997
Mar 4570 - 39531 31316 8215 44101 - 14137 29964 13414 16550
Jun -7209 - 51719 28969 22750 44510 - 19588 24922 13414 11508
Sep 4442 - 30469 26710 3759 34911 - 5169 29742 13414 16328
Dec 6075 - 32618 24391 8227 38693 - 9819 28874 13414 15460
1998
Mar 1676 - 44618 36215 8403 46294 - 19264 27030 13414 13616
Jun 4384 - 44825 36434 8391 49209 - 18721 30488 13414 17074
Sep 7020 - 44642 36201 8441 51662 - 22351 29311 13412 15899
Dec 1
7035 - 44493 36052 8441 51528 - 22351 29177 13412 15765
Source: Guyana Co0operative Mortgage Finance Bank
Balance includes cash in hand and deposits at Bank 1 Figures are estimated
Back to Annexe
Other
Private SectorBanking
SystemPublic
SectorTotal
Assets/
LiabilitiesOtherDebenturesTotal
Gov't.
Contrib.
Carib.
Dev.
Bank
Foreign
Sector
Public
Sector
TABLE 5-VIGUYANA CO-OPERATIVE MORTGAGE FINANCE BANK: ASSETS AND LIABILITIES
(G$ Thousand)
Assets
Period
Ended
DepositsGov't.
T/BillsTotal
Mortgage
Loans
Unclassified

Back to Annexe
Item 1990 1991 1992 1993 1994 1995 1996 1997 1998 1999 2000 2001
Revenue 5343.1 11823.6 17769.5 21778.0 23653.8 29496.1 35117.3 34082.9 33121.1 36838.9 41334.6 41427.0
Expenditure 7623.9 18383.0 23070.7 20678.8 23538.3 23774.7 23943.7 28081.2 30194.7 31839.5 40646.3 43491.6
Balance -2280.8 -6559.4 -5301.2 1099.2 115.5 5721.4 11173.6 6001.7 2926.4 4999.4 688.3 -2064.6
Receipts 2193.1 1721.2 1694.0 2122.8 5479.5 2932.0 2944.7 2747.8 2842.5 4914.7 6801.2 5716.4
Revenue 298.5 1568.8 1143.5 1412.9 4484.1 1326.9 457.4 85.0 65.0 40.0 56.0 49.4
External Grants 1894.6 152.4 550.5 709.9 995.4 1605.1 2487.3 2662.8 2777.5 4874.7 6745.2 5667.0
Expenditure 3310.7 4327.6 4386.6 7223.2 10687.4 11539.5 15705.5 16379.0 13086.1 12345.2 17132.8 16510.4
OVERALL DEFICIT/SURPLUS -3398.4 -9165.8 -7993.8 -4001.2 -5092.4 -2886.1 -1587.2 -7629.5 -7317.2 -2431.1 -9643.3 -12858.6
FINANCING 3398.4 9165.8 7993.8 4001.2 5092.4 2886.1 1587.2 7629.5 7317.2 2431.1 9643.3 12858.6
External 2730.7 6123.9 3532.0 1174.8 3675.2 1198.9 7023.5 8877.8 2735.0 4262.0 7803.6 7882.8
Domestic 667.7 3041.9 4461.8 2826.4 1417.2 1687.2 -5436.3 -1248.3 4582.2 -1830.9 1839.7 4975.8
Banking System 172.9 -616.8 525.2 -7045.0 -9795.8 383.3 -7291.9 3020.0 3955.7 -15243.3 2519.9 1308.0
Non-Bank Borrowing 564.5 849.7 658.2 472.0 5401.7 1243.7 -6.6 -1237.0 -677.7 7542.1 -1232.5 6746.1
Other Financing1- 1826.9 1504.1 3005.0 3606.2 1339.6 1689.0 225.8 359.5 -581.7 -296.4 -
Changes in below the line -69.7 982.1 1774.3 6394.4 2205.1 -1279.4 173.2 -3257.1 944.7 6452.0 848.7 -3078.3
Figures from 1996 to 2000 has been revised.
1 Non- project balance of payments grants
CAPITAL ACCOUNT
TABLE 6-ICENTRAL GOVERNMENT: FINANCES (SUMMARY)
(G$ Million)
Sources: Ministry of Finance and Bank of Guyana
CURRENT ACCOUNT

Back to Annexe
Item 1990 1991 1992 1993 1994 1995 1996 1997 1998 1999 2000 2001
TAX REVENUE 5040.9 11122.5 17051.0 20742.5 22492.1 28144.2 32558.7 31352.8 30889.2 33226.4 37881.5 37518.0
INCOME TAX 1751.6 3503.4 5867.3 7066.4 8125.1 10948.7 13023.2 12382.7 12027.4 13766.5 16179.3 16861.4
Companies 1375.4 2901.0 4347.3 4539.3 4503.2 6131.2 7518.5 7050.2 6541.5 7468.4 8266.4 8176.3
Personal 305.6 490.0 1378.5 2183.4 3192.8 4240.2 4641.3 4575.8 4759.5 5648.9 7156.9 7818.4
Self-Employed 27.2 48.5 79.1 131.8 293.3 394.3 593.4 560.5 553.5 511.3 576.9 725.8
Surtax 2.0 2.5 1.5 1.4 0.8 4.2 0.3 2.3 0.1 0.2 0.2 0.2
Other 41.4 61.4 60.9 210.5 135.0 178.7 269.7 193.9 172.8 137.7 179.0 140.8
TAXES ON PROPERTY 52.6 64.7 109.9 257.9 365.8 427.8 507.6 488.4 459.5 489.4 700.5 706.3
Property Tax 39.7 48.0 97.8 242.0 348.5 410.6 487.0 467.9 430.0 471.0 680.8 686.5
Estate 12.9 16.7 12.1 15.9 17.3 17.2 20.6 20.5 29.5 18.4 19.7 19.7
TAXES ON PRODUCTION & CONS. 1398.8 3405.8 4615.6 5682.0 5795.6 10531.0 11319.3 11235.2 11012.1 11707.1 14,860.8 13,932.2
Excise Duty 83.8 92.7 146.0 168.4 48.9 - - 9.6 10.8 8.3 4.4 790.5
Consumption Tax 1315.0 3313.1 4469.6 5513.6 5746.7 10531.0 11319.3 11225.6 11001.3 11698.8 14,856.4 13,141.7
TAXES ON INTERNATIONAL TRADE 718.2 1544.7 2057.3 3266.3 3467.6 3225.6 4638.5 4384.5 4480.0 4589.3 5033.8 4773.9
Import Duty 544.3 1125.9 1620.1 2689.3 2857.5 2521.1 3831.2 3700.6 3724.2 3703.8 3943.0 3665.4
Export Duty 94.2 179.4 152.8 152.2 180.9 129.6 194.3 10.2 4.5 7.8 7.3 12.4
Travel Tax 79.7 239.4 284.4 424.8 429.2 574.9 613.0 673.7 751.3 877.7 1083.5 1096.1
OTHER TAX REVENUE 1119.7 2603.9 4400.9 4469.9 4738.0 3011.1 3070.1 2862.0 2910.2 2674.1 1107.1 1244.3
Entertainment Tax 12.3 22.9 33.8 38.4 32.0 39.9 46.1 34.4 28.6 27.6 26.7 16.8
Purchase Tax - M. Cars 32.4 95.2 165.4 254.5 293.8 335.0 470.5 442.3 433.0 392.2 474.5 477.7
Other Taxes & Duties 1036.8 2443.5 4148.5 4072.2 4297.2 2435.2 2276.2 2091.7 2057.3 1874.6 204.1 90.7
Licences - Vehicles 26.6 29.1 33.5 76.3 87.1 94.5 167.6 128.5 216.6 191.7 238.7 238.7
Licences - Other 11.6 13.2 19.7 28.5 27.9 24.0 33.5 32.3 34.9 55.3 28.9 66.8
Enviromental tax - - - - - 82.2 76.2 132.8 139.8 132.7 134.2 353.5
OTHER CURRENT REVENUE 302.2 701.1 718.5 1035.5 1161.7 1351.9 2558.6 2730.1 2231.9 3612.5 3453.1 3909.0
Rents, Royalties, etc. 3.9 6.7 12.0 424.0 619.3 511.6 1123.3 978.0 708.3 882.0 903.0 888.9
Interest 2.9 0.1 0.1 2.9 0.3 1.6 2.3 - - - - -
Divs. From Fin. Ent. 68.1 463.2 129.5 213.7 154.0 82.5 253.3 84.9 144.8 314.5 343.8 568.5
Bank of Guyana Surplus - - 28.1 5.2 - - - - 148.6 - 386.3 823.0
Other Dept. Receipts 29.7 85.7 - 18.0 41.8 159.4 271.5 220.2 151.9 776.4 255.5 135.2
Fees, Fines, etc. 59.3 84.1 103.2 213.9 192.2 368.2 373.1 258.2 384.8 459.8 600.0 582.1
Land Dev. Schemes 1.7 1.1 153.5 2.6 1.3 2.1 2.6 - - - - -
Harbour Surplus - - 1.0 - - - - - - - - -
Miscellaneous 136.6 60.2 291.1 155.2 152.8 226.5 532.5 1188.8 693.5 1179.8 964.5 911.3
TOTAL 5343.1 11823.6 17769.5 21778.0 23653.8 29496.1 35117.3 34082.9 33121.1 36838.9 41334.6 41427.0
Sources: Ministry of Finance
TABLE 6-IICENTRAL GOVERNMENT: CURRENT REVENUE
(G$ Million)

1990 1991 1992 1993 1994 1995 1996 1997 1998 1999 2000 2001
Employment Cost 1071.3 2248.3 3287.8 3583.9 4623.1 5740.5 6763.6 8931.0 9159.3 12020.4 14317.7 14743.3
Debt Charges 4191.5 9917.6 11397.3 9825.9 12195.8 8633.0 8642.9 10257.5 10497.8 7397.8 10092.5 8116.8
Other current expenditure 2361.1 6217.1 8385.6 7269.0 6719.4 9401.2 8537.2 8892.7 10537.6 12421.3 16236.1 20631.5
Expenses specific to the Agencies 4.6 6.4 8.0 7.4 13.4 3.1 18.7 37.9 - - - -
Material, Equipment & Supplies 138.8 287.4 391.8 607.3 809.6 1042.1 907.4 1128.0 1355.4 1438.1 1837.7 1715.0
Fuels & Lubricants 69.4 160.5 180.9 176.1 217.7 236.2 269.6 299.5 270.6 298.2 361.2 395.1
Rental & Maintenance of Building 163.5 430.8 368.3 410.6 520.6 592.2 670.6 717.0 777.6 1011.9 1146.1 1039.5
Maintenance of Infrastructure 42.5 138.6 279.7 442.3 473.1 443.6 413.7 476.5 402.7 322.3 519.8 523.9
Other Services Purchased 65.8 189.9 398.5 322.1 442.7 519.7 626.6 670.2 - - - 65.7
Electricity Charges 31.6 73.4 98.0 159.5 459.8 206.4 224.7 235.5 233.8 1000.9 313.0 720.0
Transport, Travel & Postage 164.3 371.4 523.9 342.2 442.7 514.2 603.3 720.4 746.5 773.8 811.6 823.2
Telephone Charges 34.8 54.0 89.2 53.3 61.5 57.3 65.3 68.9 161.7 162.7 174.0 182.6
Education Subvents, Grants & Scholarship 170.4 323.8 475.4 521.9 527.9 351.8 463.0 651.4 715.3 773.8 887.7 1086.6
Rates & Taxes & Subvents to L.A. 14.2 57.4 56.5 43.9 144.9 164.9 93.2 97.1 143.2 184.5 201.5 367.6
Subsidies & Contribution to Local & Int. Orgns. 1064.1 3270.9 4382.3 3587.4 995.9 3511.1 1879.5 2187.6 2069.0 2407.4 4267.8 4121.4
Refunds of Revenue 6.5 23.5 58.1 129.7 162.7 99.8 154.6 150.0 123.0 172.1 34.2 45.1
Miscellaneous 319.5 769.4 992.8 330.8 1269.2 1658.8 370.2 635.2 2416.7 1955.3 3092.5 6723.7
Unallocated Stores 31.4 - - - - - - - - - - -
Pensions 39.3 59.7 82.0 134.5 177.4 - 1776.8 817.5 1122.1 1920.3 2589.0 2822.1
Payments to Dependants' Pension Funds - - 0.2 - 0.3 - - - - - - -
Appropriation in Aid 0.4 - - - - - - - - - - -
TOTAL 7623.9 18383.0 23070.7 20678.8 23538.3 23774.7 23943.7 28081.2 30194.7 31839.5 40646.3 43491.6
Source: Ministry of Finance
TABLE 6-IIICENTRAL GOVERNMENT: CURRENT EXPENDITURE
(G$ Million)
Item
Back to Annexe

(G$ Million)
Back to Annexe
Item 1993 1994 1995 1996 1997 1998 d
1999 e
2000 f
2001
Current Revenue 39200.0 40242.3 47491.3 51544.3 53170.5 49711.2 44454.3 43603.6 45462.2
Sales-Export 26823.0 24792.2 28247.5 30406.3 30643.2 27769.3 28777.8 23418.1 23297.3
Sales-Local 11310.0 14440.0 18735.6 19010.0 18874.1 13694.3 7865.2 9341.6 10860.6
Other 1067.0 1010.1 508.2 2128.0 3653.1 8247.6 7811.2 10843.9 11304.4
Current Expenditure 33145.9 34500.0 39586.2 40454.9 43578.2 41091.2 37048.3 39554.1 39812.1
Materials & Supplies 14425.6 13715.8 14971.5 11483.6 14088.7 13112.9 10772.6 15067.9 11441.8
Employment 8574.1 10165.1 10804.4 14161.6 14054.9 13196.1 14928.8 12664.9 15247.2
Depreciation - - - - - - - - -
Interest 78.0 125.0 36.8 49.4 77.8 121.0 60.8 60.0 100.3
Other a
10068.2 10494.1 13773.5 14760.3 15356.8 14661.2 11286.2 11761.2 13022.9
Operating Surplus(+)/Def(-) 6054.1 5742.3 7905.1 11089.4 9592.3 8620.0 7406.0 4049.5 5650.1
Depreciation - - - - - - - - -
Other - - - - - - - - -
Gross Cash Surplus(+)/Def(-) 6054.1 5742.3 7905.1 11089.4 9592.3 8620.0 7406.0 4049.5 5650.1
Transfers to Central Govt. 4554.0 3599.3 5743.9 4591.1 3177.0 3156.2 2278.5 1098.1 481.4
Taxes b
4374.0 3455.7 3740.4 2217.1 1808.1 3009.0 1457.0 973.7 481.4
Dividends 180.0 143.6 2003.5 2374.0 1368.8 147.2 821.5 124.4 -
Cash Surplus (+)/Deficit(-) 1500.1 2143.0 2161.2 6498.3 6415.4 5463.8 5127.5 2951.4 5168.6
Capital Expenditure 5777.5 2467.0 2156.2 3674.7 3691.3 3434.6 3750.5 2113.0 1712.5
Overall Cash Surplus (+)/Deficit(-) -4277.4 -324.0 5.0 2823.6 2724.0 2029.2 1376.9 838.4 3456.1
Financing 4277.4 324.0 -5.0 -2823.6 -2724.0 -2029.2 -1376.9 -838.4 -3456.1
External Borrowing (Net) 1121.0 -888.9 -1204.9 -1299.5 -531.1 -493.4 -25.2 -24.3 -394.7
Domestic Financing (Net) 3156.4 1212.9 1199.9 -1524.1 -2192.5 -1535.4 -1351.7 -814.1 -3061.4
Banking System (Net) 601.0 480.6 844.3 -2534.1 -2057.9 -695.4 3200.1 -2087.3 1082.2
Non-bank Fin. Inst.(Net) -87.4 -353.0 ... ... ... ... ... 1330.9 65.5
Holdings of Cent. Govt Sec. -401.3 -1206.2 -1475.8 -1834.8 2081.5 -2623.2 -6682.1 -520.3 2751.1
Transfers from Cent.Govt 2722.0 591.8 102.9 1057.9 1310.0 1269.1 311.4 0.0 50.1
Other c
322.1 1699.5 -797.9 1786.9 -3526.1 514.0 1819.0 462.6 -7010.2
Source:State Planning Secretariat, Public Enterprises, National Insurance Scheme and Bank of Guyana
a Includes current outlays on freight, repairs and maintenance, payments to creditors and contribution to community
b Includes special transfers
c Includes changes in working capital and changes in external payments deposit
d 1998 figures exclude NEOCOL and Stockfeeds which were privatised
e 1999 figures exclude GAC, GEC, GSL, SANATA and GPL.
f 2000 figures excludes Sanata, GSL and GPC.
1 The data represents the consolidation of all the Non-Financial Public Enterprises during the respective years. The figures may not correspond to the table in the text
since no adjustment is made for comparison.
TABLE 6-IVSUMMARY OF PUBLIC CORPORATIONS FINANCES
1

1990 10441.7 15.0 2200.5 8226.2
1991 12669.9 24.6 6043.7 6601.6
1992 18794.8 24.6 5770.2 13000.0
1993 28434.4 25.3 5609.1 22800.0
1994 31909.6 27.5 7943.3 23938.8
1995 33252.4 27.6 10436.5 22788.3
1996 37678.1 16.6 10126.8 27534.7
1997 34010.8 8.8 8323.7 25678.3
1998
Mar 36412.7 7.8 8243.0 28161.9
Jun 35475.7 7.3 8197.7 27270.7
Sep 35166.6 6.4 8169.6 26990.6
Dec 35851.8 5.9 8123.0 27722.9
1999
Mar 39738.5 5.6 8052.0 31681.0
Jun 40783.9 5.3 6495.6 34283.0
Sep 40692.1 5.0 6439.5 34247.6
Dec 41629.6 4.6 6418.0 35207.0
2000
Jan 42133.9 4.6 6375.5 35753.8
Feb 42325.9 4.6 6375.5 35945.8
Mar 43398.8 4.6 6363.5 37030.7
Apr 42502.8 4.6 4124.3 38373.9
May 42890.7 4.6 4124.3 38761.8
Jun 42643.4 4.6 4101.3 38537.5
Jul 42257.6 4.6 4054.5 38198.5
Aug 42968.9 4.6 4054.5 38909.8
Sep 43955.2 4.6 4041.7 39909.0
Oct 44145.2 4.6 4041.7 40099.0
Nov 47044.0 4.6 4041.7 42997.8
Dec 48035.1 4.6 4017.0 44013.6
2001
Jan 50108.3 4.6 3965.6 46138.1
Feb 47918.2 4.6 3965.6 43948.0
Mar 50047.3 4.6 3957.4 46085.4
Apr 49984.6 4.6 3957.4 46022.7
May 52782.1 4.6 3957.4 48820.2
Jun 49743.6 4.0 3938.1 45801.6
Jul 49705.7 4.0 3938.1 45763.7
Aug 50336.2 4.0 3938.1 46394.2
Sep 50767.0 4.0 3929.3 46833.6
Oct 50871.2 4.0 3929.3 46937.8
Nov 51169.5 4.0 3929.3 47236.2
Dec 52008.4 4.0 3914.2 48090.1
Source: Bank of Guyana.1 Excludes non-interest bearing debentures.
Total Debentures
TABLE 7-IDOMESTIC PUBLIC BONDED DEBT
1
(G$ Million)
Period
EndedDefence Bonds Treasury Bills
Back to Annexe

Commercial
Banks
1990 7624.5 15.0 8226.2 5849.4 1767.1 4082.3 818.7 651.1 5.4 29.0 616.7 901.0 6.0
1991 5939.1 24.6 6601.6 2832.8 34.4 2798.4 1446.4 707.1 - 20.0 687.1 1601.8 13.5
1992 12296.9 24.5 13000.0 8129.5 70.9 8058.6 2318.3 727.6 - - 727.6 1810.4 14.2
1993 22198.4 25.3 22800.0 17156.4 699.1 16457.3 2916.6 1138.2 - 511.3 626.9 1575.3 13.5
1994 23556.6 27.5 23938.8 13274.0 2491.3 10782.7 5422.7 2232.3 175.0 1647.6 409.7 2996.9 12.9
1995 22572.7 27.6 22788.4 10457.6 350.5 10107.1 6058.1 3764.3 56.0 3465.0 243.3 2492.6 15.8
1996 27541.1 16.6 27534.7 13693.2 810.3 12882.9 5964.9 5240.0 - 5229.8 10.2 2621.9 14.7
1997 25687.1 8.8 25678.3 15291.9 241.3 15050.6 6599.3 3004.4 - 3004.4 - 767.0 15.7
1998
Mar 28169.7 7.8 28161.9 17310.0 447.6 16862.4 6113.7 4384.9 - 4384.9 - 337.3 16.0
Jun 27278.0 7.3 27270.7 16477.0 1014.9 15462.1 6352.1 4343.0 - 4343.0 - 79.1 19.5
Sep 26997.1 6.4 26990.7 15695.7 2.4 15693.3 6291.0 4918.0 - 4918.0 - 71.3 14.7
Dec 27728.8 5.9 27722.9 15497.8 1043.5 14454.3 6392.7 5754.0 - 5754.0 - 63.7 14.7
1999
Mar 31686.5 5.6 31681.0 18092.8 2741.1 15351.7 6512.7 6174.2 - 6174.2 - 885.9 15.5
Jun 34288.3 5.3 34283.0 17034.9 1365.1 15669.8 6810.1 8729.5 - 8729.5 - 1693.0 15.5
Sep 34252.6 5.0 34247.6 16797.7 1064.1 15733.6 6553.8 9575.2 114.9 9460.3 - 1304.4 16.6
Dec 35211.6 4.6 35207.0 14030.9 1613.0 12417.9 6185.4 12939.3 274.9 12664.4 - 2038.3 13.3
2000
Jan 35758.4 4.6 35753.8 14454.6 1363.0 13091.6 6372.9 12916.7 349.9 12566.9 - 1996.4 13.3
Feb 35950.4 4.6 35945.8 16136.1 1053.3 15082.8 6250.6 12005.3 349.9 11655.4 - 1540.5 13.3
Mar 37035.3 4.6 37030.7 16236.0 1562.5 14673.5 6754.1 12383.1 349.9 12033.2 - 1626.7 30.7
Apr 38378.5 4.6 38373.9 16821.4 1912.5 14908.9 6953.4 12914.0 349.9 12564.1 - 1641.6 43.6
May 38766.4 4.6 38761.8 16825.5 1151.9 15673.6 6991.9 13463.7 114.9 13348.8 - 1437.1 43.6
Jun 38542.1 4.6 38537.5 16627.8 1171.5 15456.4 7038.6 13406.8 - 13406.8 - 1420.8 43.6
Jul 38203.0 4.6 38198.5 16235.6 1096.4 15139.2 6998.4 13606.8 - 13606.8 - 1314.2 43.6
Aug 38914.4 4.6 38909.8 17156.3 1096.4 16059.9 6883.7 13606.8 - 13606.8 - 1219.5 43.6
Sep 39913.5 4.6 39909.0 18814.3 1051.2 17763.1 6754.1 13160.6 - 13160.6 - 1153.8 26.3
Oct 40103.5 4.6 40099.0 21220.0 1048.2 20171.9 6284.7 11492.4 - 11492.4 - 1073.0 29.0
Nov 43002.3 4.6 42997.8 24374.0 1048.2 23325.9 6501.1 11317.8 - 11317.8 - 776.0 29.0
Dec 44018.1 4.6 44013.6 23920.9 2222.9 21698.0 6516.3 12336.7 - 12336.7 - 1210.8 29.0
2001
Jan 46142.7 4.6 46138.1 24585.5 1549.3 23036.2 6611.8 13606.5 - 13606.5 - 1288.6 45.8
Feb 43952.6 4.6 43948.0 22270.7 1199.3 21071.4 6528.3 13606.5 - 13606.5 - 1496.8 45.8
Mar 46089.9 4.6 46085.4 24225.3 1048.7 23176.6 7063.8 13711.7 - 13711.7 - 1039.0 45.8
Apr 46027.2 4.6 46022.7 23284.4 1048.4 22236.0 8311.5 14064.2 - 14064.2 - 328.2 34.5
May 48824.7 4.6 48820.2 25087.6 2699.3 22388.4 7958.7 15405.5 - 15405.5 - 334.0 34.5
Jun 45805.5 4.0 45801.6 22210.5 1351.3 20859.2 7852.4 15485.3 - 15485.3 - 218.9 34.5
Jul 45767.6 4.0 45763.7 21749.4 1048.4 20701.0 7829.6 16002.1 - 16002.1 - 182.7 0.0
Aug 46398.1 4.0 46394.2 21912.5 1063.0 20849.6 8322.7 16002.1 - 16002.1 - 138.6 18.3
Sep 46837.6 4.0 46833.6 22926.5 1509.5 21417.0 8946.8 14802.1 - 14802.1 - 139.9 18.3
Oct 46941.8 4.0 46937.8 22406.0 1088.4 21317.6 9557.1 14802.1 - 14802.1 - 154.4 18.3
Nov 47240.2 4.0 47236.2 22380.0 1049.3 21330.7 9804.9 14802.1 - 14802.1 - 200.5 48.7
Dec 48094.1 4.0 48090.1 23012.9 1039.9 21973.0 9723.2 15139.2 - 15139.2 - 166.2 48.7
Source: Bank of Guyana.1 Excludes Sinking Fund.2 As of Dec 1998 includes an amount to satisfy the Bank's reserve requirement of G$1,000 Million.
Back to Annexe
Defence
Premium
Bonds
Period
EndedTotal
Treasury
Bills Total
Total
Amount 1 Private
Sector
Non-Bank
Financial
InstitutionsBank Of
Guyana
Banking System
Total
Non
Residents
TABLE 7-IIGOVERNMENT OF GUYANA: TREASURY BILLS
BY HOLDERS AND DEFENCE BONDS
(G$ Million)
Public Sector
Treasury Bills
Public
Enterprise
Special
Funds 2
Sinking
Funds

Commercial
Banks
1990 2200.5 - 2200.5 457.9 268.7 285.9 - 1003.0 49.0 136.0
1991 6043.7 - 6043.7 221.2 4515.5 233.7 - 927.5 25.0 120.8
1992 5770.2 - 5770.2 157.5 4466.9 204.1 - 824.0 14.5 103.2
1993 5609.1 - 5609.1 174.8 4466.7 192.7 - 686.0 14.5 74.4
1994 7943.3 - 7943.3 174.8 5559.0 90.0 4.3 604.6 9.5 1501.1
1995 10436.3 - 10436.3 3009.9 5505.3 61.6 4.3 382.0 3.7 1469.5
1996 10126.8 - 10126.8 3762.6 5453.7 21.9 4.3 541.0 - 343.3
1997 8323.6 - 8323.6 3898.5 3278.0 11.4 - 685.4 - 450.3
1998
Mar 8242.9 - 8242.9 3898.5 3278.0 11.4 - 633.7 - 421.3
Jun 8197.7 - 8197.7 3898.5 3264.6 7.7 - 609.8 - 417.0
Sep 8169.6 - 8169.6 3898.5 3264.6 7.7 - 581.7 - 417.0
Dec 8123.0 - 8123.0 3898.5 3249.8 3.4 - 558.9 - 412.3
1999
Mar 8052.0 - 8052.0 3898.5 3249.8 3.4 - 523.0 - 377.2
Jun 6495.6 - 6495.6 3898.5 1950.0 3.4 - 298.4 - 345.3
Sep 6439.5 - 6439.5 3898.5 1950.0 3.4 - 281.1 - 306.5
Dec 6418.0 - 6418.0 3898.5 1950.0 3.4 - 259.6 - 306.5
2000
Jan 6375.5 - 6375.5 3898.5 1950.0 3.4 - 259.6 - 264.0
Feb 6375.5 - 6375.5 3898.5 1950.0 3.4 - 259.6 - 264.0
Mar 6363.5 - 6363.5 3898.5 1950.0 3.4 - 247.6 - 264.0
Apr 4124.3 - 4124.3 3898.5 - - - 127.6 - 98.2
May 4124.3 - 4124.3 3898.5 - - - 127.6 - 98.2
Jun 4101.3 - 4101.3 3898.5 - - - 104.6 - 98.2
Jul 4054.5 - 4054.5 3898.5 - - - 104.6 - 51.4
Aug 4054.5 - 4054.5 3898.5 - - - 104.6 - 51.4
Sep 4041.7 - 4041.7 3898.5 - - - 91.7 - 51.4
Oct 4041.7 - 4041.7 3898.5 - - - 91.7 - 51.4
Nov 4041.7 - 4041.7 3898.5 - - - 91.7 - 51.4
Dec 4017.0 - 4017.0 3898.5 - - - 67.1 - 51.4
2001
Jan 3965.6 - 3965.6 3898.5 - - - 67.1 - -
Feb 3965.6 - 3965.6 3898.5 - - - 67.1 - -
Mar 3957.4 - 3957.4 3898.5 - - - 58.9 - -
Apr 3957.4 - 3957.4 3898.5 - - - 58.9 - -
May 3957.4 - 3957.4 3898.5 - - - 58.9 - -
Jun 3938.0 - 3938.0 3898.5 - - - 39.5 - -
Jul 3938.0 - 3938.0 3898.5 - - - 39.5 - -
Aug 3938.1 - 3938.1 3898.5 - - - 39.5 - -
Sep 3929.3 - 3929.3 3898.5 - - - 30.8 - -
Oct 3929.3 - 3929.3 3898.5 - - - 30.8 - -
Nov 3929.3 - 3929.3 3898.5 - - - 30.8 - -
Dec 3914.2 - 3914.2 3898.5 - - - 15.7 - -
Source: Bank of Guyana. 1 Excludes Non-Interest Bearing Debentures issued to the Bank of Guyana.2 Excludes Sinking Funds
Back to Annexe
National
Insurance
Sinking
Funds
Debentures 1
Public SectorBanking System
Bank Of
Guyana
Non-Banks
Financial
InstitutionsPublic
Enterprise
Private
Sector
Total Amount
Outstanding 2
Period
Ended
Defence
BondsTotal
Debentures
TABLE 7-IIIGOVERNMENT OF GUYANA: DEBENTURES
BY HOLDERS AND DEFENCE BONDS
(G$ Million)

Nominal
Rate of
Interest
(Percent)
SPECIAL ISSUES
NON-INTEREST BEARING SPECIAL
ISSUE TO BOG
1ST SERIES 1993 3,079,280,675 3,079,280,675 - 1993-12-31 UNFIXED
1ST SERIES 1994 3,782,533,508 3,782,533,508 - 1994-12-31 UNFIXED
2ND SERIES 1994 4,447,052,933 4,447,052,933 - 1994-12-31 UNFIXED
2ND SERIES 1995 7,879,467,909 7,879,467,909 - 1995-12-29 UNFIXED
1ST SERIES 1997 2,264,300,339 2,264,300,339 - 1997-06-30 UNFIXED
1ST SERIES 1998 39,477,523 39,477,523 - 1998-01-31 UNFIXED
2ND SERIES 1998 2,857,509,263 2,857,509,263 - 1998-12-31 UNFIXED
1ST SERIES 2000 4,892,538,923 4,892,538,923 - 2000-12-31 UNFIXED
1ST SERIES 2001 14,851,974,507 14,851,974,507 - 2001-12-31 UNFIXED
SPECIAL ISSUE TO BOG
1ST SERIES 1995 2,835,121,749 2,835,121,749 VARIABLE 1995-12-29 UNFIXED
1ST SERIES 1996 927,448,757 927,448,757 VARIABLE 1996-12-31 UNFIXED
3RD SERIES 1997 135,966,255 135,966,255 VARIABLE 1997-12-31 UNFIXED
D.E.A SPECIAL ISSUE TO NIS AMOUNT ISSUED &
DEFERRED INTEREST
1ST SERIES 1992 49,178,784 6,543,881 14.0 1992-03-31 2002-03-31
2ND SERIES 1992 68,850,298 9,161,433 14.0 1992-06-30 2002-06-30
Source: Bank of Guyana.
Back to Annexe
(G$)
TABLE 7-IV
ItemAmount
Issued
Amount
Outstanding
Issue
Date
Maturity
Date
GOVERNMENT OF GUYANA: DEBENTURES BY MATURITYAND TERMS AS AT DECEMBER 31, 2001

1990 1,820,100 973,300 716,800 69,100 22,700 28,700 9,500
1991 1,855,400 922,200 814,700 69,100 14,400 25,500 9,500
1992 1,967,200 943,200 863,400 - 97,400 34,700 28,500
1993 1,953,500 912,600 907,300 - 75,800 28,100 29,700
1994 1,999,500 928,700 939,700 - 71,600 27,900 31,600
1995 2,058,300 947,000 986,600 - 68,900 22,600 33,200
1996 2
1,537,025 441,700 980,130 2,871 64,610 14,959 32,755
1997 1,513,020 449,790 953,050 2,780 58,990 14,940 33,470
1998
1st Qtr 1,479,710 436,390 943,120 - 58,660 - 41,540
2nd Qtr 1,450,740 437,110 915,870 - 56,520 - 41,240
3rd Qtr 1,492,160 438,890 955,560 1,120 56,490 7,090 33,010
4th Qtr 1,507,490 450,940 966,440 1,020 54,360 6,640 28,090
1999
1st Qtr 1,525,040 465,855 953,229 2,111 54,810 21,225 27,809
2nd Qtr 1,386,415 429,951 883,160 2,071 22,296 21,234 27,703
3rd Qtr 1,314,156 430,087 813,911 2,140 18,100 22,213 27,705
4th Qtr 3
1,210,924 360,917 792,250 526 15,190 7,508 34,533
2000
1st Qtr 1,201,302 354,527 796,075 189 15,153 7,828 27,530
2nd Qtr 1,193,137 352,627 790,481 178 14,984 7,511 27,356
3rd Qtr 1,177,838 350,719 777,350 173 14,956 7,584 27,056
4th Qtr 1,194,839 355,162 788,281 526 14,745 7,794 28,331
2001
1st Qtr 1,178,950 352,036 777,401 167 14,728 7,557 27,061
2nd Qtr 1,167,600 349,468 768,657 165 14,730 7,659 26,921
3rd Qtr 1,186,917 352,855 785,894 173 13,019 7,771 27,205
4th Qtr 1,193,287 350,300 794,591 170 12,973 7,708 27,545
Sources:Office of Budget and Debt Management Division, Ministry of Finance.1 Includes External Payment Deposit Schemes (EPDS) from 1992.2 Figures represent the outstanding stock after the Naples Terms Debt Stock Reduction.3 Stock of outstanding debt after HIPC debt relief.
Financial
Medium & Long Term
Supp. Cr. 1 Compensation Bonds
(Nationalisation)
Loan
Bonds
Back to Annexe
TABLE 7-V
EXTERNAL PUBLIC DEBT
(US$ Thousand)
Period
Ended
Total
Outstanding
DebtBilateral Multilateral

Back to Annexe
Item 1992 1993 1994 1995 1996 1997 1998 1999 2000 2001
CURRENT ACCOUNT BALANCE -146.7 -137.9 -100.8 -94.9 -53.8 -105.1 -98.5 -75.2 -109.2 -128.6
Merchandise TradeExports f.o.b. 381.7 414.0 463.4 495.7 574.8 593.4 547.0 525.0 505.2 490.3
Imports c.i.f. -442.7 -483.8 -504.0 -536.5 -595.0 -641.6 -601.2 -550.2 -585.4 -583.9
Trade Balance -61.0 -69.8 -40.6 -40.8 -20.2 -48.2 -54.2 -25.2 -80.2 -93.6
Net Services and unrequited Transfers -85.7 -68.1 -60.2 -54.1 -33.6 -56.9 -44.3 -50.0 -29.0 -35.0Non Factor Services (net) -5.3 -3.3 -9.2 -7.1 -22.3 -23.2 -32.1 -31.1 -23.9 -20.4
Factor Services (net) -110.4 -93.8 -83.0 -86.0 -52.3 -73.7 -56.2 -57.9 -52.1 -58.6
Transfers 30.0 29.0 32.0 39.0 41.0 40.0 44.0 39.0 47.0 44.0
CAPITAL ACCOUNT BALANCE 123.6 78.1 22.9 28.0 59.5 125.7 79.8 69.6 137.8 115.3
1. Capital Transfer * - - - - 618.0 23.7 13.1 15.5 16.3 30.8
2. Medium and Long Term Capital (net) 126.6 71.7 26.7 26.2 -552.9 90.0 67.9 79.9 119.5 95.4
1. Public Sector -11.3 8.4 -20.1 -27.2 -611.9 38.0 23.9 33.9 52.4 39.4
A. Central Gov't and Non-Financial Public Sector (net) -21.3 4.0 -30.3 -32.7 6.1 38.0 13.9 23.9 42.4 39.4
Disbursements 26.0 54.0 28.0 30.5 40.2 67.0 59.7 47.4 66.1 65.8Amortization -47.3 -50.0 -58.3 -63.2 -34.1 -29.0 -45.8 -23.5 -23.7 -26.4
B. Other 1 * 10.0 4.4 10.2 5.5 -618.0 - 10.0 10.0 10.0 -
2. Private Sector (net) 137.9 63.3 46.8 53.4 59.0 52.0 44.0 46.0 67.1 56.0
Short Term Capital (net) 2 -3.0 6.4 -3.8 1.8 -5.6 12.0 -1.2 -25.8 2.0 -10.9
ERRORS AND OMISSIONS -16.2 10.1 14.0 -2.0 -7.1 -16.6 -4.0 1.2 13.9 4.9
OVERALL BALANCE -39.3 -49.7 -63.9 -68.9 -1.4 4.0 -22.7 -4.4 42.5 -8.4
FINANCING 39.3 49.7 63.9 68.9 1.4 -4.0 22.7 4.4 -42.5 8.4
Change in Net Foreign Assets of Bank of Guyana (-increase) 3 ** a b -35.1 -39.7 -27.8 2.3 -14.0 3.0 22.7 -10.3 -61.1 -16.6Change in Non-Financial Public Sector arrears 4 -102.0 - - - - -25.0 - - - -Change in Private Sector Commercial arrears - - - - - - - 14.7 - -Exceptional Financing 176.4 89.4 91.7 66.6 15.4 18.0 - - 18.6 25.0
Debt Relief 154.4 44.6 66.1 57.4 - - - - 21.3 25.0Debt Stock Restructuring - - - - - 18.0 - - -2.7 -Balance of Payments Support 22.0 44.8 25.6 9.2 15.4 - - - - -Debt Forgiveness - - - - - - - - - -
Source : Bank of Guyana, Bureau of Statistics and Ministry of Finance.1 Includes sales of assets
2 Includes changes in Net Foreign Assets of Commercial Banks
3 Includes valuation changes
4 Includes arrears on non-financial public sector medium and long term debt
* Jan-Dec 1996 figures includes the total debt write-off of US$618 million due to Paris Club Arrangements
Budget 1998 figures includes the total debt write-off of US$253 million due to HIPC Agreements
** Excludes the transfer of US$146 million foreign liability from Bank of Guyana to the Ministry of Finance in June 1997.a After additional valuation adjustment of US$10.3 million in 1997
b Excludes the transfer of US$63.7 million foreign liability from the Bank of Guyana to the Ministry of Finance in November 1998
TABLE 8-IBALANCE OF PAYMENTS
(US$ Million)

Bank Of Guyana Commercial Banks Banking System
Net Assets Liabilities Net Assets Liabilities Net Assets Liabilities Net Assets Liabilities
1990 -102.6 26.6 129.2 -670.4 26.6 697.0 33.6 53.4 19.8 -636.8 80.0 716.8
1991 -27.9 123.0 150.9 -630.0 123.0 753.0 12.1 19.6 7.5 -617.9 142.6 760.5
1992 15.2 191.1 175.9 -595.2 191.1 786.3 15.2 29.8 14.6 -580.0 220.9 800.9
1993 56.4 246.3 189.9 -555.3 246.3 801.6 8.5 24.4 15.9 -546.8 270.7 817.5
1994 89.4 269.2 179.8 -527.6 269.2 796.8 4.7 27.1 22.4 -522.9 296.3 819.2
1995 86.4 268.8 182.4 -540.0 268.8 808.8 6.5 27.0 20.5 -533.5 295.8 829.3
1996 1
153.9 331.6 177.7 -186.6 331.6 518.2 1.3 26.6 25.3 -185.3 358.2 543.5
1997 149.9 315.3 165.4 -33.6 315.3 348.9 -10.2 24.3 34.5 -43.8 339.6 383.4
1998
Mar 148.0 307.5 159.5 -30.9 307.5 338.4 -2.8 25.8 28.6 -33.6 333.4 367.0
Jun 126.1 280.0 153.9 -51.9 280.0 331.9 -2.6 25.1 27.7 -54.4 305.1 359.5
Sep 134.0 294.8 160.8 -40.5 294.8 335.3 -5.6 21.6 27.2 -46.1 316.4 362.5
Dec 122.2 276.4 154.2 7.4 276.4 268.9 -7.9 23.5 31.4 -0.4 299.9 300.3
1999
Mar 94.1 243.0 148.9 -19.8 243.0 262.8 1.2 32.3 31.1 -18.6 275.3 293.9
Jun 109.4 264.7 155.3 -4.6 264.7 269.3 -3.4 29.1 32.5 -8.0 293.8 301.8
Sep 114.2 264.3 150.1 29.5 264.3 234.8 -2.8 29.7 32.5 26.8 294.0 267.2
Dec 126.8 267.0 140.2 46.3 267.0 220.7 17.9 40.1 22.2 64.2 307.2 243.0
2000
Jan 136.2 271.3 135.1 55.6 271.3 215.6 10.2 31.8 21.6 65.9 303.1 237.3
Feb 143.4 277.3 133.9 62.8 277.3 214.4 9.6 32.5 22.9 72.5 309.8 237.3
Mar 146.4 280.3 133.9 66.7 280.3 213.6 12.8 35.7 22.9 79.5 316.0 236.5
Apr 153.8 286.4 132.7 78.0 286.4 208.4 17.3 40.1 22.7 95.4 326.5 231.1
May 150.2 280.4 130.2 74.4 280.4 206.0 15.9 38.5 22.6 90.2 318.9 228.6
Jun 153.7 281.5 127.8 77.9 281.5 203.6 20.2 45.1 24.9 98.1 326.6 228.5
Jul 159.1 281.8 122.7 83.3 281.8 198.5 23.2 48.0 24.8 106.4 329.8 223.3
Aug 162.4 283.9 121.4 86.6 283.9 197.3 20.0 46.1 26.1 106.6 330.0 223.4
Sep 165.1 286.6 121.4 89.2 286.6 197.3 15.4 37.4 22.0 104.7 324.0 219.4
Oct 161.0 283.1 122.1 90.0 283.1 193.1 10.6 34.9 24.2 100.6 317.9 217.3
Nov 144.7 275.4 130.6 73.7 275.4 201.7 16.4 38.7 22.3 90.1 314.1 223.9
Dec 178.4 295.8 117.4 107.4 295.8 188.4 16.1 36.7 20.7 123.5 332.6 209.1
2001
Jan 174.1 291.1 117.0 103.1 291.1 187.9 15.9 38.1 22.2 119.1 329.2 210.1
Feb 167.6 283.0 115.3 96.6 283.0 186.3 22.7 41.5 18.7 119.4 324.4 205.0
Mar 172.9 285.4 112.5 101.9 285.4 183.5 20.3 39.7 19.4 122.2 325.2 202.9
Apr 170.9 281.6 110.7 103.8 281.6 177.8 21.3 39.7 18.4 125.1 321.3 196.2
May 171.2 279.8 108.6 104.1 279.8 175.7 23.3 40.4 17.2 127.4 320.2 192.9
Jun 167.0 271.5 104.5 99.9 271.5 171.6 24.5 41.9 17.5 124.4 313.5 189.1
Jul 161.7 267.3 105.6 94.5 267.3 172.8 20.6 41.5 21.0 115.1 308.8 193.7
Aug 163.8 270.7 106.9 96.6 270.7 174.1 17.2 38.6 21.4 113.8 309.3 195.5
Sep 162.9 269.9 107.0 95.7 269.9 174.1 22.0 41.4 19.4 117.7 311.2 193.5
Oct 175.3 279.1 103.8 112.2 279.1 167.0 24.9 42.5 17.7 137.0 321.7 184.6
Nov 182.9 284.6 101.7 119.7 284.6 164.9 27.3 45.0 17.6 147.1 329.6 182.5
Dec 187.4 285.1 97.6 124.2 285.1 160.8 27.0 44.5 17.5 151.2 329.6 178.4
TABLE 8-ll
Net Foreign Assets
Back to Annexe
INTERNATIONAL RESERVES AND FOREIGN ASSETS
(US$ Million)
1 Net Foreign Assets reflect Naples terms debt stock reduction in December 1996
Source: Bank of Guyana and Commercial Banks
Net Foreign AssetsEnd Of
Period International Reserves Net Foreign Assets

1990 12290.0 1467.0 2788.0 2335.0 5520.0 180.0
1991 34274.9 6588.5 7507.0 4625.6 13928.8 1625.0
1992 55319.8 10634.1 9859.3 9721.9 22492.8 2611.7
1993 61376.0 13059.7 10232.6 16430.5 21456.1 197.1
1994 70000.6 15260.5 11382.6 18790.5 17194.9 7372.1
1995 74911.5 16331.1 12181.1 20108.8 18401.2 7889.3
1996 2
83894.8 23814.7 12675.9 22715.1 24548.1 141.0
1997 91062.3 25760.3 14193.0 24766.8 26228.7 113.5
1998 90890.3 29344.9 10897.5 25932.5 24641.5 73.8
1999 97497.0 30982.1 15701.7 26723.5 24010.3 79.4
2000 106113.3 29798.6 21917.4 30459.7 23829.2 108.4
2001 109251.0 30907.6 24579.9 31660.8 21555.9 546.8
Source: Bureau of Statistics and Customs and Excise Department1 Imports have been converted from c.i.f. to f.o.b. from 2001.
Consumer
Goods
TABLE 8-III
IMPORTS BY END-USE (SUMMARY) (f.o.b)1
(G$ Million)
Other Inter-
mediate
Capital
Goods
Misc.
Imports
Back to Annexe
PeriodTotal
Imports
Fuel &
Lubricants

Period Total Bauxite Sugar Rice Shrimp1
Timber2
Molasses Rum3
Gold Other
1990 10207.9 3172.1 3219.6 513.2 906.1 181.4 1.9 393.7 993.5 826.3
1991 28549.9 8952.9 10474.2 2102.7 2026.3 456.7 - 308.7 2308.2 1920.2
1992 45423.0 12083.0 16598.7 4307.9 1628.1 468.2 - 861.5 3092.8 6382.8
1993 52159.7 11548.7 14800.7 4144.5 1446.2 568.1 180.1 1183.2 12739.6 5548.6
1994 61702.6 11038.5 16227.7 7331.9 1801.9 1042.8 63.4 1547.9 17502.5 5146.0
1995 67674.9 11986.7 17573.0 10242.4 388.1 1035.7 46.5 559.3 13425.5 12417.7
1996 78554.4 11019.9 20097.8 13154.4 1769.4 1419.1 56.4 1615.8 14541.7 14879.9
1997 81608.0 12676.2 18943.5 12112.1 2894.4 6298.1 99.4 1217.4 19798.9 7568.0
1998 79443.3 11848.1 19647.3 11123.7 2791.4 4692.7 184.7 936.9 18759.2 9459.3
1999 89506.2 13682.2 24186.1 12598.9 5174.7 6613.0 407.6 1335.4 19235.8 6272.5
2000 91069.0 13824.6 21536.8 9384.5 8522.4 6363.5 436.3 1308.1 22330.7 7362.2
2001 91231.2 11420.6 20494.6 9404.2 9209.9 6180.6 301.3 1479.3 23769.6 8971.1
1998
1st Qtr 17258.6 3234.2 2915.1 2465.5 638.1 855.7 29.0 232.0 4597.5 2291.5
2nd Qtr 17868.1 2960.9 3576.6 2682.4 688.9 1172.6 29.3 219.9 3957.7 2579.8
3rd Qtr 18170.5 1761.6 5758.8 1795.0 628.2 1136.8 29.9 179.5 3948.9 2931.8
4th Qtr 26146.1 3891.4 7396.8 4180.8 836.2 1527.6 96.5 305.5 6255.1 1656.2
1999
1st Qtr 19871.0 2930.9 4675.5 2773.9 1465.5 1325.9 104.7 157.0 5164.0 1273.6
2nd Qtr 19751.5 3265.4 6301.4 3177.2 388.3 1606.2 88.3 194.2 4112.7 617.8
3rd Qtr 21404.5 3561.5 3650.1 3065.4 1718.7 1718.7 88.6 372.1 5386.6 1842.8
4th Qtr 28479.2 3924.4 9559.1 3582.4 1602.2 1962.2 126.0 612.1 4572.5 2538.3
2000
1st Qtr 23205.8 3756.3 5688.6 2094.8 1733.7 2004.5 54.2 90.3 5815.0 1968.4
2nd Qtr 21453.8 3452.1 3741.3 2819.5 3000.3 1861.6 72.3 379.6 5205.3 921.8
3rd Qtr 20525.0 2579.1 4599.2 1839.7 2290.6 1839.7 54.1 162.3 5464.9 1695.4
4th Qtr 25884.3 4037.0 7507.7 2630.4 1497.9 657.6 255.7 675.9 5845.4 2776.6
2001
1st Qtr 18889.8 2618.9 2767.5 1541.6 2618.9 1671.7 18.6 297.2 5739.4 1615.9
2nd Qtr 20996.5 2629.2 3636.2 2983.5 3244.6 1957.9 55.9 466.2 4568.5 1454.5
3rd Qtr 24190.6 2914.1 5604.0 1942.7 2353.7 990.0 37.4 280.2 7229.2 2839.4
4th Qtr 27154.3 3258.4 8486.9 2936.3 992.7 1561.0 189.4 435.7 6232.6 3061.4
Source: Bank of Guyana and Bureau of Statistics1 From 1987 figures include exports from non-residents
2 From the first quarter of 1997 figures include Barama's export
3 Includes Neutral Spirit
TABLE 8-IV(a)DOMESTIC EXPORTS (f.o.b)
(G$ Million)Back to Annexe

Period Total Bauxite Sugar Rice Shrimp Timber1
Molasses Rum2
Gold Other
1990 250.1 80.4 79.9 13.7 23.5 4.5 - 10.6 17.7 19.8
1991 254.4 82.3 89.8 18.0 18.6 4.0 - 2.6 21.4 17.7
1992 363.4 97.1 134.1 35.0 13.0 3.7 - 7.0 24.6 48.9
1993 404.0 91.1 116.3 33.0 11.4 4.5 1.4 9.3 99.8 37.2
1994 447.4 76.4 116.4 55.6 13.1 7.9 0.6 11.5 128.0 37.9
1995 478.9 82.9 125.5 76.5 3.1 8.3 0.4 3.0 94.7 84.5
1996 552.8 69.8 150.7 93.8 12.6 8.9 0.4 11.5 103.5 101.6
1997 573.4 89.4 133.4 84.7 20.2 44.6 0.7 8.6 139.8 52.0
1998 525.0 78.5 129.0 73.3 18.5 31.0 1.2 6.2 124.0 63.3
1999 504.8 77.2 136.2 71.1 29.2 37.3 2.3 7.5 108.7 35.3
2000 502.7 76.3 118.8 51.8 47.1 35.2 2.4 7.2 123.3 40.6
2001 487.1 61.0 109.2 50.2 49.3 33.0 1.6 7.9 127.0 47.9
1998
1st Qtr 119.0 22.3 20.1 17.0 4.4 5.9 0.2 1.6 31.7 15.8
2nd Qtr 121.9 20.2 24.4 18.3 4.7 8.0 0.2 1.5 27.0 17.6
3rd Qtr 121.5 11.8 38.5 12.0 4.2 7.6 0.2 1.2 26.4 19.6
4th Qtr 162.6 24.2 46.0 26.0 5.2 9.5 0.6 1.9 38.9 10.3
1999
1st Qtr 113.9 16.8 26.8 15.9 8.4 7.6 0.6 0.9 29.6 7.3
2nd Qtr 111.9 18.5 35.7 18.0 2.2 9.1 0.5 1.1 23.3 3.5
3rd Qtr 120.8 20.1 20.6 17.3 9.7 9.7 0.5 2.1 30.4 10.4
4th Qtr 158.2 21.8 53.1 19.9 8.9 10.9 0.7 3.4 25.4 14.1
2000
1st Qtr 128.5 20.8 31.5 11.6 9.6 11.1 0.3 0.5 32.2 10.9
2nd Qtr 118.7 19.1 20.7 15.6 16.6 10.3 0.4 2.1 28.8 5.1
3rd Qtr 113.8 14.3 25.5 10.2 12.7 10.2 0.3 0.9 30.3 9.4
4th Qtr 141.7 22.1 41.1 14.4 8.2 3.6 1.4 3.7 32.0 15.2
2001
1st Qtr 101.7 14.1 14.9 8.3 14.1 9.0 0.1 1.6 30.9 8.7
2nd Qtr 112.6 14.1 19.5 16.0 17.4 10.5 0.3 2.5 24.5 7.8
3rd Qtr 129.5 15.6 30.0 10.4 12.6 5.3 0.2 1.5 38.7 15.2
4th Qtr 143.3 17.2 44.8 15.5 5.2 8.2 1.0 2.3 32.9 16.2
Source: Bank of Guyana and Bureau of Statistics1 From the first quarter of 1997 figures include Barama's export
2 Includes Neutral Spirit
TABLE 8-IV(b)DOMESTIC EXPORTS(f.o.b.)
(US$ Million)Back to Annexe
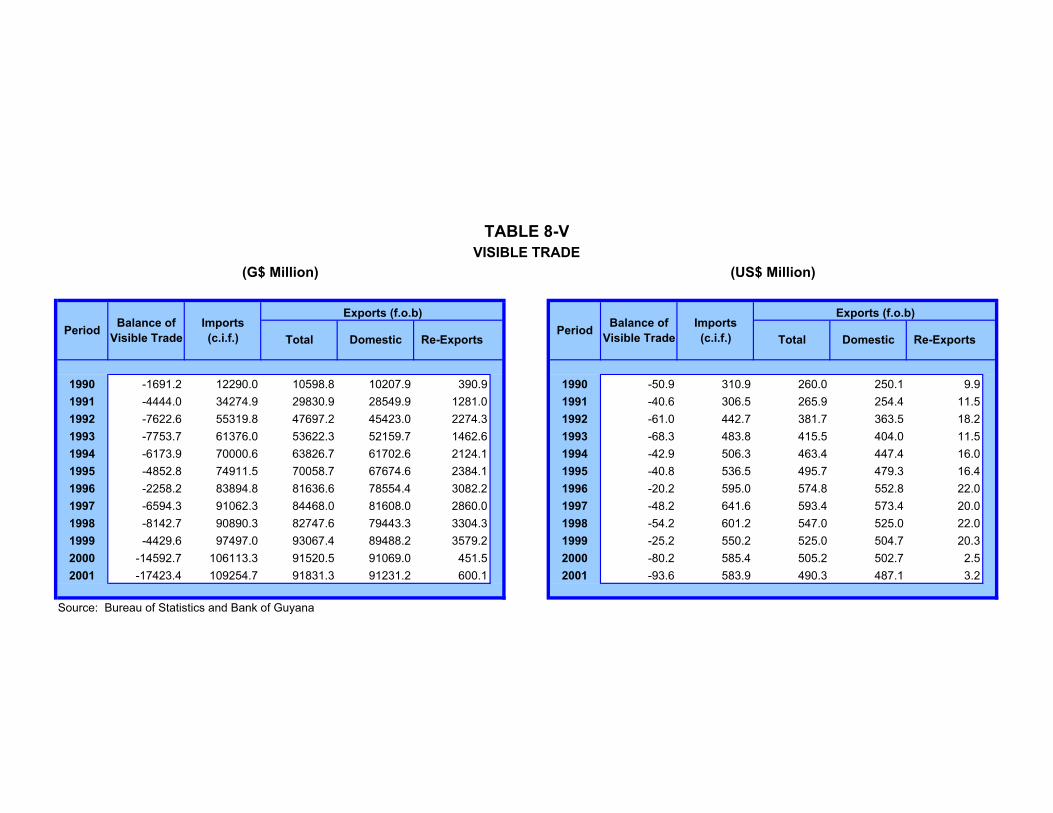
1990 -1691.2 12290.0 10598.8 10207.9 390.9 1990 -50.9 310.9 260.0 250.1 9.9
1991 -4444.0 34274.9 29830.9 28549.9 1281.0 1991 -40.6 306.5 265.9 254.4 11.5
1992 -7622.6 55319.8 47697.2 45423.0 2274.3 1992 -61.0 442.7 381.7 363.5 18.2
1993 -7753.7 61376.0 53622.3 52159.7 1462.6 1993 -68.3 483.8 415.5 404.0 11.5
1994 -6173.9 70000.6 63826.7 61702.6 2124.1 1994 -42.9 506.3 463.4 447.4 16.0
1995 -4852.8 74911.5 70058.7 67674.6 2384.1 1995 -40.8 536.5 495.7 479.3 16.4
1996 -2258.2 83894.8 81636.6 78554.4 3082.2 1996 -20.2 595.0 574.8 552.8 22.0
1997 -6594.3 91062.3 84468.0 81608.0 2860.0 1997 -48.2 641.6 593.4 573.4 20.0
1998 -8142.7 90890.3 82747.6 79443.3 3304.3 1998 -54.2 601.2 547.0 525.0 22.0
1999 -4429.6 97497.0 93067.4 89488.2 3579.2 1999 -25.2 550.2 525.0 504.7 20.3
2000 -14592.7 106113.3 91520.5 91069.0 451.5 2000 -80.2 585.4 505.2 502.7 2.5
2001 -17423.4 109254.7 91831.3 91231.2 600.1 2001 -93.6 583.9 490.3 487.1 3.2
Source: Bureau of Statistics and Bank of Guyana
TABLE 8-V
(US$ Million)(G$ Million)
VISIBLE TRADE
PeriodBalance of
Visible Trade
Imports
(c.i.f.)
Exports (f.o.b)
Total Domestic Re-Exports
Exports (f.o.b)
Total Domestic Re-Exports
Back to Annexe
PeriodBalance of
Visible Trade
Imports
(c.i.f.)

Date Rate Date Rate
15 May 00 - 19 May 00 181.75 19 Feb. 01 - 186.50
22 May 00 - 25 May 00 181.75 20 Feb. 01 - 23 Feb. 01 186.25
26 May 00 - 31 May 00 182.00 26 Feb. 01 - 28 Feb. 01 186.25
01 Jun. 00 - 02 Jun. 00 182.00 01 Mar. 01 - 02 Mar. 01 186.25
05 Jun. 00 - 09 Jun. 00 182.00 05 Mar. 01 - 09 Mar. 01 186.50
12 Jun. 00 - 16 Jun. 00 182.00 12 Mar. 01 - 16 Mar. 01 186.25
19 Jun. 00 - 23 Jun. 00 182.25 19 Mar. 01 - 23 Mar. 01 186.25
26 Jun. 00 - 30 Jun. 00 182.25 26 Mar. 01 - 30 Mar. 01 186.25
03 Jul. 00 - 182.25 02 Apr. 01 - 186.25
04 Jul. 00 - 07 Jul. 00 182.00 03 Apr. 01 - 06 Apr. 01 186.75
10 Jul. 00 - 14 Jul. 00 182.00 09 Apr. 01 - 13 Apr. 01 186.75
17 Jul. 00 - 21 Jul. 00 182.00 17 Apr. 01 - 20 Apr. 01 186.75
24 Jul. 00 - 25 Jul. 00 182.00 23 Apr. 01 - 27 Apr. 01 186.75
26 Jul. 00 - 28 Jul. 00 182.25 30 Apr. 01 - 186.50
31 Jul. 00 - 182.25 04 May 01 - 07 May 01 186.50
01 Aug. 00 - 182.25 11 May 01 - 13 May 01 186.50
03 Aug. 00 - 182.75 14 May 01 - 186.75
07 Aug. 00 - 11 Aug. 00 182.75 18 May 01 - 21 May 01 186.75
14 Aug. 00 - 18 Aug. 00 182.75 25 May 01 - 28 May 01 186.75
21 Aug. 00 - 182.75 01 Jun. 01 - 186.75
22 Aug. 00 - 181.75 04 Jun. 01 - 08 Jun. 01 186.75
23 Aug. 00 - 25 Aug. 00 182.00 11 Jun. 01 - 15 Jun. 01 186.75
04 Sep. 00 - 08 Sep 00 182.00 18 Jun. 01 - 22 Jun. 01 186.75
11 Sep. 00 - 15 Sep 00 182.00 25 Jun. 01 - 29 Jun. 01 186.75
18 Sep. 00 - 182.00 02 Jul. 01 - 06 Jul. 01 186.75
19 Sep. 00 - 22 Sep 00 182.25 09 Jul. 01 - 13 Jul. 01 186.75
25 Sep. 00 - 29 Sep 00 182.25 16 Jul. 01 - 20 Jul. 01 186.75
02 Oct 00 - 182.25 23 Jul. 01 - 27 Jul. 01 186.75
05 Oct. 00 - 06 Oct. 00 183.00 30 Jul. 01 - 31 Jul. 01 186.75
09 Oct. 00 - 183.00 02 Aug. 01 - 03 Aug. 01 186.75
10 Oct. 00 - 13 Oct. 00 183.50 06 Aug. 01 - 10 Aug. 01 186.75
16 Oct. 00 - 20 Oct. 00 183.50 13 Aug. 01 - 17 Aug. 01 186.75
23 Oct. 00 - 183.50 20 Aug. 01 - 24 Aug. 01 186.75
25 Oct. 00 - 27 Oct. 00 183.75 27 Aug. 01 - 31 Aug. 01 186.75
01 Nov. 00 - 03 Nov. 00 183.75 03 Sep. 01 - 07 Sep. 01 187.00
06 Nov. 00 - 10 Nov. 00 183.75 10 Sep. 01 - 14 Sep. 01 187.00
13 Nov. 00 - 17 Nov. 00 183.75 17 Sep. 01 - 21 Sep. 01 187.00
20 Nov. 00 - 183.75 24 Sep. 01 - 27 Sep. 01 188.75
21 Nov. 00 - 24 Nov. 00 184.75 28 Sep. 01 - 189.25
27 Nov. 00 - 30 Nov. 00 184.75 01 Oct. 01 - 05 Oct. 01 189.25
04 Dec. 00 - 08 Dec. 00 184.75 08 Oct. 01 - 12 Oct. 01 189.25
11 Dec. 00 - 15 Dec. 00 184.75 15 Oct. 01 - 19 Oct. 01 189.75
18 Dec. 00 - 22 Dec. 00 184.75 22 Oct. 01 - 26 Oct. 01 189.75
27 Dec. 00 - 29 Dec. 00 184.75 29 Oct. 01 - 189.25
02 Jan. 01 - 05 Jan. 01 184.75 01 Nov. 01 - 189.00
08 Jan. 01 - 09 Jan. 01 185.00 05 Nov. 01 - 09 Nov. 01 189.50
10 Jan. 01 - 12 Jan. 01 185.75 12 Nov. 01 - 16 Nov. 01 189.50
15 Jan. 01 - 19 Jan. 01 185.75 19 Nov. 01 - 23 Nov. 01 189.50
22 Jan. 01 - 26 Jan. 01 186.25 26 Nov. 01 - 30 Nov. 01 189.50
29 Jan. 01 - 31 Jan. 01 186.25 03 Dec. 01 - 07 Dec. 01 189.50
01 Feb. 01 - 02 Feb. 01 186.25 10 Dec. 01 - 14 Dec. 01 189.50
05 Feb. 01 - 09 Feb. 01 186.25 17 Dec. 01 - 21 Dec. 01 189.50
12 Feb. 01 - 186.25 24 Dec. 01 - 28 Dec. 01 189.50
15 Feb. 01 - 16 Feb. 01 186.50 31 Dec. 01 - 189.50
Source: Bank of Guyana.
Effective from October 1, 1991 the official exchange rate fluctuates either daily or periodically.
It is the average of the Telegraphic Transfer Rates of the three (3) largest Commercial Banks.
TABLE 9-ICHANGES IN BANK OF GUYANA TRANSACTION EXCHANGE RATE
(G$\US$)Back to Annexe

1990 45.00 39.53
1991 122.75 111.80
1992 126.00 125.00
1993 130.75 126.82
1994 142.50 142.50
1995 140.50 141.89
1996 141.25 140.45
1997 144.00 143.65
1998 165.25 163.74
1999 180.50 180.43
2000 184.75 182.44
2001 189.50 187.34
1998
Mar 152.25 147.74
Jun 147.25 147.02
Sep 152.75 151.53
Dec 165.25 163.74
1999
Mar 179.00 178.42
Jun 177.25 176.90
Sep 179.75 179.03
Dec 180.50 180.43
2000
Jan 181.50 181.08
Feb 181.25 181.64
Mar 181.75 181.64
Apr 182.25 182.03
May 182.00 181.92
Jun 182.25 182.12
Jul 182.25 182.05
Aug 182.00 182.47
Sep 182.25 182.11
Oct 183.75 183.33
Nov 184.75 184.10
Dec 184.75 184.75
2001
Jan 186.25 185.64
Feb 186.25 186.28
Mar 186.25 186.30
Apr 186.50 186.71
May 186.75 186.66
Jun 186.75 186.75
Jul 186.75 186.75
Aug 186.75 186.75
Sep 189.25 187.46
Oct 189.75 189.75
Nov 189.50 189.50
Dec 189.50 189.50
Source: Bank of Guyana
Back to Annexe
TABLE 9-IIEXCHANGE RATE
(G$/US$)
YearsEnd of
Period
Period
Average

Commercial Banks Non-Banks TotalTotal US £ CN Total US £ CN Total US £ CN
1990 63,527,857 55,439,334 6,327,839 1,760,684 17,752,393 16,131,973 1,232,840 387,580 81,280,250 71,571,307 7,560,679 2,148,2641991 124,970,293 109,782,679 11,977,097 3,210,517 39,859,272 36,633,967 2,364,185 861,120 164,829,565 146,416,646 14,341,282 4,071,6371992 181,091,965 162,593,432 13,688,236 4,810,297 46,866,290 41,992,345 2,925,475 1,948,470 227,958,255 204,585,777 16,613,711 6,758,7671993 216,907,148 200,550,589 10,589,142 5,767,418 61,452,750 54,756,672 2,799,200 3,896,878 278,359,898 255,307,261 13,388,342 9,664,2961994 272,847,906 243,905,383 21,646,928 7,295,595 47,442,461 42,116,798 2,062,722 3,262,941 320,290,367 286,022,181 23,709,649 10,558,5361995 381,637,217 337,664,560 35,636,094 8,336,562 59,428,996 53,489,248 2,606,310 3,333,438 441,066,213 391,153,809 38,242,404 11,670,0001996 417,091,056 360,065,941 46,164,045 10,861,070 66,809,151 61,181,980 2,387,068 3,240,103 483,900,207 421,247,921 48,551,113 14,101,1731997 403,419,896 364,179,942 30,030,310 9,209,644 67,857,296 61,292,654 2,932,541 3,632,100 471,277,191 425,472,597 32,962,851 12,841,7441998 332,624,413 314,447,326 11,127,785 7,049,302 56,446,029 47,661,241 4,544,546 4,240,242 389,070,442 362,108,567 15,672,331 11,289,544
1999Mar 105,395,001 100,321,051 3,136,093 1,937,857 12,504,157 10,006,666 1,260,247 1,237,244 117,899,158 110,327,717 4,396,340 3,175,101Jun 186,914,591 177,005,706 6,060,488 3,848,398 23,112,577 19,102,170 1,978,577 2,031,830 210,027,169 196,107,876 8,039,065 5,880,228Sep 267,320,159 252,285,897 9,435,885 5,598,377 34,087,362 28,438,031 2,845,829 2,803,502 301,407,521 280,723,928 12,281,714 8,401,879Dec 375,784,607 355,329,066 13,023,776 7,431,765 47,845,642 39,704,515 4,255,142 3,885,985 423,630,249 395,033,581 17,278,918 11,317,750
2000Mar 81,180,258 75,560,761 3,659,048 1,960,448 10,265,049 8,387,224 1,186,143 691,682 91,445,307 83,947,985 4,845,192 2,652,130Jun 173,884,900 162,385,265 7,387,409 4,112,226 20,688,598 17,532,175 2,055,894 1,100,529 194,573,498 179,917,440 9,443,303 5,212,755Sep 261,868,346 245,846,927 10,153,157 5,868,262 33,030,734 28,169,306 2,875,131 1,986,297 294,899,080 274,016,234 13,028,288 7,854,559Dec 358,505,676 338,003,379 13,018,823 7,483,474 44,914,033 38,414,769 3,943,921 2,555,343 403,419,709 376,418,147 16,962,744 10,038,818
2001Jan 31,142,891 29,557,602 910,899 674,390 4,297,461 3,549,490 423,227 324,744 35,440,352 33,107,092 1,334,126 999,134Feb 38,081,979 36,580,941 867,018 634,019 3,317,285 2,972,182 184,521 160,582 41,399,263 39,553,123 1,051,539 794,601Mar 23,246,126 21,605,959 877,792 762,376 2,643,930 2,359,073 181,671 103,185 25,890,056 23,965,032 1,059,463 865,561Apr 27,234,181 25,628,702 856,220 749,259 2,690,640 2,430,063 153,097 107,480 29,924,820 28,058,765 1,009,316 856,739May 35,430,085 34,005,938 827,903 596,243 4,530,979 4,063,502 338,165 129,312 39,961,064 38,069,441 1,166,068 725,556Jun 25,574,497 24,158,449 725,717 690,331 3,224,709 2,965,880 145,307 113,523 28,799,206 27,124,328 871,023 803,854Jul 28,357,125 26,934,530 867,432 555,163 3,578,650 3,173,951 284,926 119,773 31,935,775 30,108,482 1,152,358 674,935Aug 31,342,637 29,022,623 1,692,072 627,941 5,674,900 5,165,812 345,988 163,101 37,017,537 34,188,435 2,038,060 791,042Sep 30,080,226 28,468,125 1,106,577 505,524 3,915,076 3,496,670 306,876 111,530 33,995,302 31,964,795 1,413,453 617,054Oct 44,330,285 42,156,845 1,371,528 801,913 4,776,109 4,285,692 360,454 129,963 49,106,394 46,442,537 1,731,981 931,876Nov 31,096,032 29,603,934 974,022 518,076 4,285,308 3,874,161 264,315 146,833 35,381,340 33,478,095 1,238,336 664,909Dec 31,977,500 30,462,987 783,273 731,239 4,133,498 3,627,418 321,367 184,713 36,110,998 34,090,405 1,104,640 915,953
Total 377,893,564 358,186,635 11,860,453 7,846,474 47,068,545 41,963,894 3,309,914 1,794,739 424,962,107 400,150,530 15,170,363 9,641,214
Source: Commercial Banks and Non-Bank Dealers
Period
TABLE 9-III(a)FOREIGN EXCHANGE MARKET (CAMBIO)
PURCHASES BY CURRENCY AND BY DEALERS(Valued in US Dollars)
Back to Annexe

Commercial Banks Non-Banks TotalTotal US £ CN TOTAL US £ CN TOTAL US £ CN
1990 59,742,584 52,193,917 5,868,483 1,680,184 17,365,018 15,878,434 1,127,183 359,401 77,107,602 68,072,351 6,995,666 2,039,5851991 124,467,847 109,529,467 12,134,613 2,803,767 39,902,905 36,635,310 2,413,991 853,604 164,370,752 146,164,777 14,548,604 3,657,3711992 180,826,878 162,344,222 13,994,591 4,488,065 46,221,964 41,985,862 2,362,539 1,873,563 227,048,842 204,330,084 16,357,130 6,361,6281993 219,242,374 202,301,036 10,625,335 6,316,003 61,359,391 54,674,164 2,799,169 3,886,058 280,601,765 256,975,200 13,424,504 10,202,0611994 270,561,758 242,379,110 20,986,264 7,196,384 47,911,859 42,466,606 2,092,824 3,352,429 318,473,617 284,845,716 23,079,088 10,548,8131995 372,974,776 328,779,371 35,761,468 8,433,937 59,149,644 53,228,560 2,602,370 3,318,714 432,124,420 382,007,932 38,363,838 11,752,6501996 423,502,651 366,685,302 46,148,180 10,669,169 66,989,877 61,341,768 2,400,033 3,248,076 490,492,528 428,027,070 48,548,213 13,917,2451997 407,571,908 367,684,220 30,557,916 9,329,772 67,676,250 61,072,732 2,926,942 3,676,576 475,248,158 428,756,952 33,484,858 13,006,3481998 332,068,371 314,034,517 11,013,349 7,020,505 56,784,360 47,781,932 4,644,394 4,358,034 388,852,731 361,816,449 15,657,743 11,378,539
1999Mar 97,648,812 92,415,641 3,255,235 1,977,936 12,301,721 9,845,139 1,247,708 1,208,874 109,950,533 102,260,780 4,502,943 3,186,810Jun 183,337,808 173,455,479 5,880,204 4,002,125 22,811,588 18,792,261 1,974,101 2,045,226 206,149,395 192,247,740 7,854,305 6,047,351Sep 264,344,631 249,035,856 9,561,023 5,747,752 34,236,004 28,587,142 2,827,395 2,821,467 298,580,635 277,622,998 12,388,418 8,569,219Dec 366,651,465 346,427,292 12,715,413 7,508,760 47,919,116 39,756,490 4,252,579 3,910,047 414,570,581 386,183,782 16,967,992 11,418,807
2000Mar 81,778,181 76,212,899 3,681,278 1,884,004 10,258,748 8,396,198 1,172,235 690,315 92,036,929 84,609,097 4,853,513 2,574,319Jun 168,452,620 157,713,501 6,673,582 4,065,537 20,620,420 17,579,098 1,959,508 1,081,814 189,073,040 175,292,599 8,633,090 5,147,351Sep 258,348,766 242,490,762 10,104,235 5,753,769 32,926,783 28,122,919 2,825,500 1,978,364 291,275,548 270,613,681 12,929,735 7,732,133Dec 357,960,754 337,295,353 13,264,762 7,400,639 44,941,451 38,471,627 3,920,404 2,549,420 402,902,205 375,766,980 17,185,166 9,950,058
2001Jan 32,252,111 30,809,187 773,575 669,349 4,284,469 3,541,261 419,527 323,681 36,536,581 34,350,449 1,193,102 993,030Feb 34,320,284 32,618,630 968,267 733,387 3,204,786 2,871,370 180,272 153,144 37,525,069 35,489,999 1,148,539 886,531Mar 24,421,979 22,865,662 797,650 758,667 2,658,909 2,369,614 181,871 107,424 27,080,888 25,235,276 979,521 866,091Apr 28,039,593 26,449,599 849,430 740,564 2,652,087 2,412,377 137,625 102,085 30,691,681 28,861,976 987,056 842,649May 34,456,711 33,012,180 824,478 620,053 4,609,722 4,203,941 292,345 113,436 39,066,433 37,216,121 1,116,823 733,489Jun 26,082,586 24,941,608 622,260 518,718 3,279,268 2,910,418 227,996 140,854 29,361,855 27,852,026 850,257 659,572Jul 30,997,634 29,496,002 998,144 503,488 3,548,492 3,170,195 259,599 118,698 34,546,126 32,666,197 1,257,743 622,186Aug 32,246,569 29,875,225 1,578,424 792,920 5,418,731 4,940,670 320,099 157,962 37,665,300 34,815,895 1,898,523 950,882Sep 27,964,024 26,096,277 1,319,637 548,110 4,060,854 3,624,203 331,214 105,437 32,024,878 29,720,480 1,650,851 653,547Oct 42,540,320 40,555,316 1,373,502 611,502 4,885,968 4,375,925 381,380 128,663 47,426,286 44,931,241 1,754,881 740,164Nov 33,961,105 32,729,671 728,217 503,217 4,229,022 3,835,418 258,948 134,656 38,190,127 36,565,089 987,165 637,873Dec 30,061,020 28,540,454 747,056 773,510 3,925,066 3,524,892 225,977 174,197 33,986,086 32,065,346 973,034 947,706
Total 377,343,936 357,989,811 11,580,640 7,773,485 46,757,374 41,780,284 3,216,853 1,760,237 424,101,310 399,770,095 14,797,495 9,533,720
Source: Commercial Banks and Non-bank Dealers
Period
Back to Annexe
TABLE 9-III(b)FOREIGN EXCHANGE MARKET (CAMBIO)SALES BY CURRENCY AND BY DEALERS
(Valued in US Dollars)

Back to Annexe
GOLD (US$/fine ounce)
United Kingdom (London) 383.51 362.18 343.42 359.73 384.22 384.16 387.82 331.10 294.20 278.78 279.00 271.09
ALUMINIUM (US cents/pound)
All origins (London) 74.37 59.15 56.98 51.71 66.93 81.86 68.34 72.54 61.58 61.69 70.39 65.63
Sugar (US cents/pound)
EEC Import Price 26.45 27.77 28.48 28.10 28.20 31.21 31.15 28.38 27.13 26.84 25.16 23.88
US import price 23.25 21.55 21.30 21.61 22.03 23.06 22.36 21.93 22.06 21.14 19.40 21.34
Brazil price 15.94 11.87 11.12 11.61 13.14 13.75 13.10 12.34 10.37 6.74 7.95 …
OIL (US$/brl.)
U.K. Brent 23.71 19.98 19.41 17.00 15.83 17.06 20.45 19.12 12.72 17.70 28.31 24.41
Rice (US$/metric ton)
Thailand (Bangkok) 270.67 293.67 267.67 237.25 269.46 320.80 338.06 302.47 305.47 248.97 203.69 172.68
Timber (US$/cubic metre)
Hardwood logs (Malaysia, Sarawak) 160.28 179.63 196.69 388.98 316.32 257.68 253.74 238.21 162.86 187.02 190.06 160.19
Coconut oil (US cents/pound)
Philippines (New York) 15.32 19.64 26.22 20.47 27.51 30.37 34.10 29.79 29.95 33.45 20.42 14.48
Source: International Financial Statistics.
20011995 1996 1997 1998
TABLE 9-IV
1990 1999 20001991 1992 1993 1994Commodity (Units)
COMMODITY PRICES
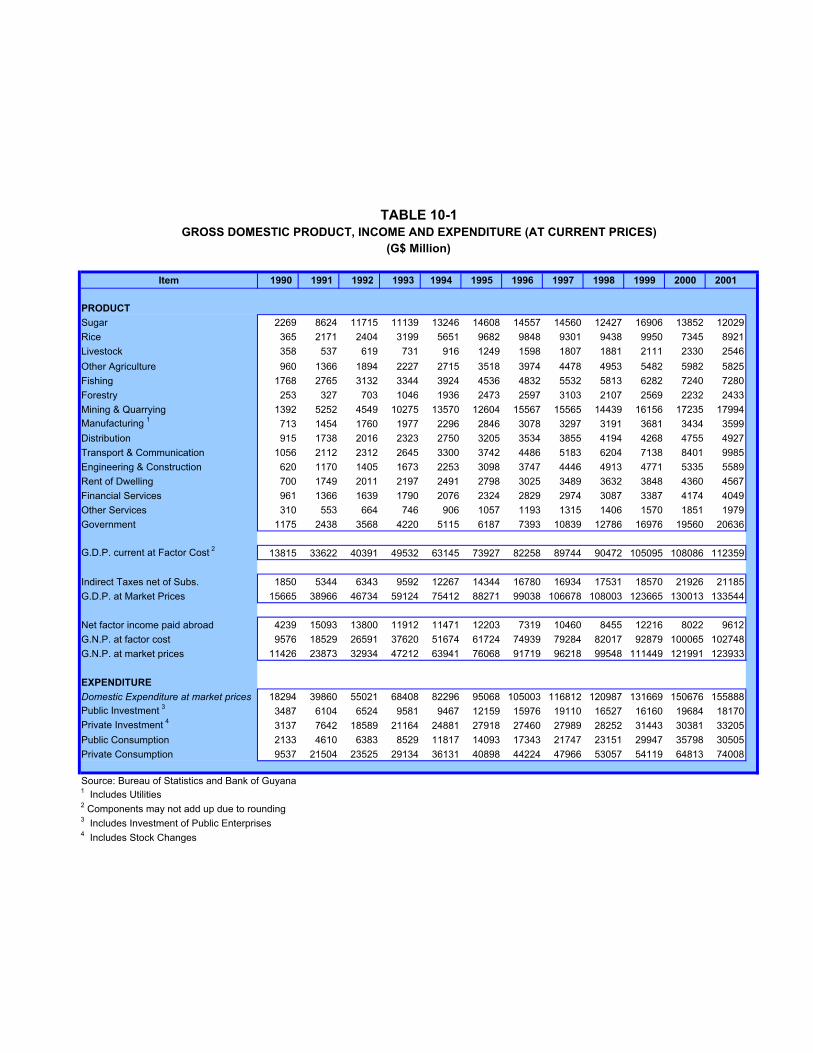
Back to Annexe
Item 1990 1991 1992 1993 1994 1995 1996 1997 1998 1999 2000 2001
PRODUCT
Sugar 2269 8624 11715 11139 13246 14608 14557 14560 12427 16906 13852 12029
Rice 365 2171 2404 3199 5651 9682 9848 9301 9438 9950 7345 8921
Livestock 358 537 619 731 916 1249 1598 1807 1881 2111 2330 2546
Other Agriculture 960 1366 1894 2227 2715 3518 3974 4478 4953 5482 5982 5825
Fishing 1768 2765 3132 3344 3924 4536 4832 5532 5813 6282 7240 7280
Forestry 253 327 703 1046 1936 2473 2597 3103 2107 2569 2232 2433
Mining & Quarrying 1392 5252 4549 10275 13570 12604 15567 15565 14439 16156 17235 17994
Manufacturing 1
713 1454 1760 1977 2296 2846 3078 3297 3191 3681 3434 3599
Distribution 915 1738 2016 2323 2750 3205 3534 3855 4194 4268 4755 4927
Transport & Communication 1056 2112 2312 2645 3300 3742 4486 5183 6204 7138 8401 9985
Engineering & Construction 620 1170 1405 1673 2253 3098 3747 4446 4913 4771 5335 5589
Rent of Dwelling 700 1749 2011 2197 2491 2798 3025 3489 3632 3848 4360 4567
Financial Services 961 1366 1639 1790 2076 2324 2829 2974 3087 3387 4174 4049
Other Services 310 553 664 746 906 1057 1193 1315 1406 1570 1851 1979
Government 1175 2438 3568 4220 5115 6187 7393 10839 12786 16976 19560 20636
G.D.P. current at Factor Cost 2
13815 33622 40391 49532 63145 73927 82258 89744 90472 105095 108086 112359
Indirect Taxes net of Subs. 1850 5344 6343 9592 12267 14344 16780 16934 17531 18570 21926 21185
G.D.P. at Market Prices 15665 38966 46734 59124 75412 88271 99038 106678 108003 123665 130013 133544
Net factor income paid abroad 4239 15093 13800 11912 11471 12203 7319 10460 8455 12216 8022 9612
G.N.P. at factor cost 9576 18529 26591 37620 51674 61724 74939 79284 82017 92879 100065 102748
G.N.P. at market prices 11426 23873 32934 47212 63941 76068 91719 96218 99548 111449 121991 123933
EXPENDITURE
Domestic Expenditure at market prices 18294 39860 55021 68408 82296 95068 105003 116812 120987 131669 150676 155888
Public Investment 3
3487 6104 6524 9581 9467 12159 15976 19110 16527 16160 19684 18170
Private Investment 4
3137 7642 18589 21164 24881 27918 27460 27989 28252 31443 30381 33205
Public Consumption 2133 4610 6383 8529 11817 14093 17343 21747 23151 29947 35798 30505
Private Consumption 9537 21504 23525 29134 36131 40898 44224 47966 53057 54119 64813 74008
Source: Bureau of Statistics and Bank of Guyana1 Includes Utilities
2 Components may not add up due to rounding
3 Includes Investment of Public Enterprises
4 Includes Stock Changes
TABLE 10-1GROSS DOMESTIC PRODUCT, INCOME AND EXPENDITURE (AT CURRENT PRICES)
(G$ Million)
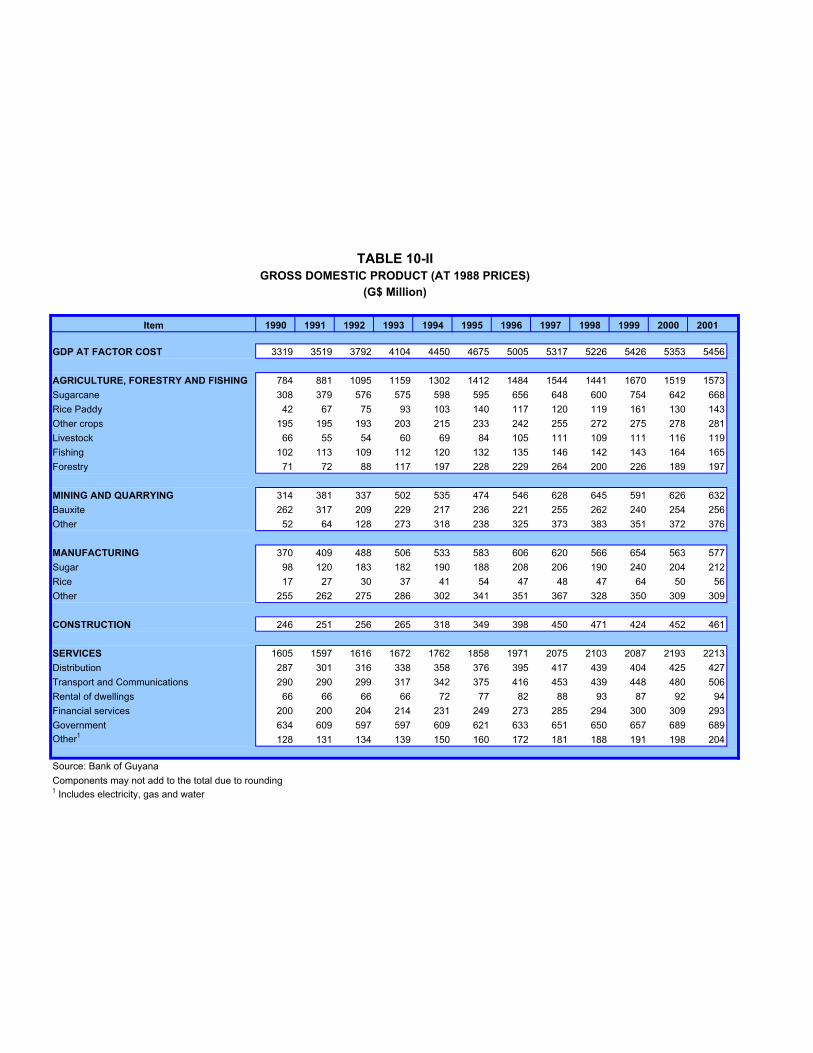
Back to Annexe
Item 1990 1991 1992 1993 1994 1995 1996 1997 1998 1999 2000 2001
GDP AT FACTOR COST 3319 3519 3792 4104 4450 4675 5005 5317 5226 5426 5353 5456
AGRICULTURE, FORESTRY AND FISHING 784 881 1095 1159 1302 1412 1484 1544 1441 1670 1519 1573
Sugarcane 308 379 576 575 598 595 656 648 600 754 642 668
Rice Paddy 42 67 75 93 103 140 117 120 119 161 130 143
Other crops 195 195 193 203 215 233 242 255 272 275 278 281
Livestock 66 55 54 60 69 84 105 111 109 111 116 119
Fishing 102 113 109 112 120 132 135 146 142 143 164 165
Forestry 71 72 88 117 197 228 229 264 200 226 189 197
MINING AND QUARRYING 314 381 337 502 535 474 546 628 645 591 626 632
Bauxite 262 317 209 229 217 236 221 255 262 240 254 256
Other 52 64 128 273 318 238 325 373 383 351 372 376
MANUFACTURING 370 409 488 506 533 583 606 620 566 654 563 577
Sugar 98 120 183 182 190 188 208 206 190 240 204 212
Rice 17 27 30 37 41 54 47 48 47 64 50 56
Other 255 262 275 286 302 341 351 367 328 350 309 309
CONSTRUCTION 246 251 256 265 318 349 398 450 471 424 452 461
SERVICES 1605 1597 1616 1672 1762 1858 1971 2075 2103 2087 2193 2213
Distribution 287 301 316 338 358 376 395 417 439 404 425 427
Transport and Communications 290 290 299 317 342 375 416 453 439 448 480 506
Rental of dwellings 66 66 66 66 72 77 82 88 93 87 92 94
Financial services 200 200 204 214 231 249 273 285 294 300 309 293
Government 634 609 597 597 609 621 633 651 650 657 689 689
Other1128 131 134 139 150 160 172 181 188 191 198 204
Source: Bank of Guyana
Components may not add to the total due to rounding1 Includes electricity, gas and water
TABLE 10-IIGROSS DOMESTIC PRODUCT (AT 1988 PRICES)
(G$ Million)

Back to Annexe
1991 1992 1993 1994 1995 1996 1997 1998 1999 2000 2001
AGRICULTURE
Sugar Tonnes 321 46.7 41.1 50.6 76.9 76.8 79.9 79.1 87.2 86.1 79.6 100.1 85.0 88.6
Rice Tonnes 96 11.6 97.8 157.9 176.2 220.1 244.4 331.4 350.3 356.8 355.7 380.7 303.1 335.7
Coconuts* Nuts 28,500 2.4 171.1 191.6 197.5 221.1 252.6 321.1 461.4 493.0 249.0 315.9 346.8 …
Ground Provisions* Kg. 20,248 4.1 52.9 67.7 65.7 66.7 66.2 63.7 63.7 79.1 162.7 92.7 134.8 …
Plantains* " 12,621 3.4 103.1 103.1 103.1 104.7 153.8 168.1 139.5 107.8 65.2 23.2 83.8 …
Bananas* " 4,812 0.8 267.5 266.2 257.5 283.4 334.7 347.2 297.3 228.5 232.5 85.9 175.9 …
Citrus* " 10,442 0.8 61.7 61.4 67.8 73.0 73.0 63.0 27.0 27.0 41.3 28.2 63.0 …
Pineapples* " 2,043 0.2 370.4 318.4 342.2 463.7 494.7 509.4 352.6 807.2 58.1 55.6 70.7 …
Corn* " 2,815 0.2 108.3 111.9 113.7 124.0 118.5 135.1 110.2 282.3 111.6 51.6 61.8 …
Coffee* " 688 0.7 104.8 117.9 … 155.1 170.0 117.2 41.5 … 19.8 19.4 … …
Pulses* 1 " 196 0.1 128.6 128.8 … … … 1,632.6 510.2 806.1 358.1 132.4 177.6 …
Tomatoes* " 1,589 1.4 81.7 101.3 94.3 119.0 128.0 208.0 157.0 191.0 78.0 47.1 133.8 …
Cabbages* " 749 0.3 203.3 162.1 175.0 231.3 246.3 347.3 240.4 163.0 121.9 44.9 19.6 …
Meat " 12,983 13.4 16.2 13.2 23.8 31.3 48.1 55.7 82.7 92.3 86.9 95.8 90.7 96.2
Milk* Ltr. 16,366 2.0 230.6 236.1 205.6 240.0 235.3 211.1 166.7 … … … … …
Eggs No. 26,400 1.3 51.1 20.1 27.7 32.2 68.2 115.1 145.8 114.9 91.1 97.5 114.1 97.3
FISHERIES
Shrimp Kg. 5,448 1.7 28.6 35.4 27.8 60.6 157.9 171.6 352.1 421.8 465.0 264.1 292.4 402.1a
Other " 12,258 6.0 269.3 293.9 302.8 303.7 317.3 310.6 276.2 291.1 296.2 336.5 393.3 175.4a
FORESTS
Timber Cu.Mt 170 1.6 53.3 55.2 69.2 86.9 172.0 197.2 172.3 206.8 259.6 293.2 229.4 257.9
All Agriculture 100.0 71.0 85.0 100.0 116.0 124.0 146.0 149.0 150.0 124.3 130.3 114.7
MINING & QUARRYING
Bauxite :Dried Tonnes 1,676 23.2 67.4 60.1 41.2 38.1 110.6 110.8 141.2 134.0 119.6 127.0 145.8 113.5
Calcined " 704 52.7 45.1 51.3 31.1 38.8 25.1 29.8 22.4 25.3 21.0 15.3 15.0 13.0
Gold Ozs. 4 0.2 967.8 1,481.4 1,989.6 7,744.3 9,390.5 7,237.9 7,757.2 10,792.6 11,738.9 10,372.6 9,016.6 11,398.0
Diamonds Met.cts. 47 1.6 32.6 62.3 97.9 108.3 78.3 111.3 99.4 77.8 71.4 111.9 178.5 392.0
All Mining 77.7 42.0 45.0 32.0 47.0 59.0 58.0 79.4 86.6 81.6 77.3 80.6 80.1
MANUFACTURING
Garments Dozs. 364 7.3 14.2 15.2 33.0 74.5 103.3 97.3 73.0 80.9 76.7 67.5 51.1 79.6
Edible Oil Ltr. 4,864 1.1 0.04 a55.5 ... 29.5 39.2 49.1 34.1 24.1 36.7 44.6 26.7 23.0
b
Margarine Kg. 1,415 1.9 38.4 43.3 58.1 85.0 95.3 89.6 114.2 128.0 125.7 139.2 133.5 111.0a
Flour Tonnes 33 13.8 97.7 103.9 102.2 105.3 104.6 111.8 107.7 102.9 96.4 107.0 108.8 82.8a
Biscuits Kg. 2,241 1.3 48.3 39.7 52.8 84.5 81.5 86.4 78.8 62.4 65.5 69.0 65.0 55.8b
Areated Bev. Ltr. 153,239 0.9 9.3 9.3 13.3 17.5 21.4 24.7 26.4 26.3 26.1 54.4 49.6 23.4
Rum Ltr. 19,111 48.5 92.6 82.4 110.6 127.8 130.7 114.5 121.4 118.3 108.5 72.1 48.2 56.9b
Beer & Stout Ltr. 7,528 4.7 142.0 160.9 185.3 188.0 125.0 125.3 145.4 167.1 169.9 171.7 156.7 141.2
Cigarettes Kg. 438 7.4 54.0 67.2 69.6 66.1 68.7 69.6 87.5 50.4 0.0 0.0 0.0 0.0
Matches Gross Boxes 178 0.8 70.8 23.7 23.7 17.9 18.2 16.8 0.0 0.0 0.0 0.0 0.0 0.0
Stockfeeds Kg. 27,590 7.8 36.7 23.4 23.3 36.9 53.0 50.2 79.2 81.7 79.2 96.3 93.9 89.4b
Soap Kg. 2,055 1.7 23.8 36.7 30.0 22.9 11.6 12.4 27.3 12.8 9.7 14.2 6.5 4.2a
All Manufacturing 97 75.0 72.0 88.0 102.0 104.0 97.0 102.0 99.0 89.9 77.3 62.9 63.7
Source: *Ministry of Agriculture and Bureau of Statistics1 Pulses includes minica, blackeye and other legumes
a Index represents total as at September
b Index represents total as at October
TABLE 11-IINDICES OF OUTPUT OF SELECTED COMMODITIES
Commodities Unit (000)Output
in '72Weights
(1972 = 100)
1990

1990 213.1 76.2 70.2 4.0
1991 215.0 87.2 70.0 3.8
1992 238.6 84.9 75.7 2.9
1993 253.2 87.2 79.7 4.7
1994 290.8 108.0 97.8 4.4
1995 333.7 98.5 115.9 2.8
1996 348.2 143.6 108.3 3.1
1997 390.6 … … …
1998 431.3 … … …
1999 443.2 … … …
2000 519.0 … … …
2001 576.8 ... ... ...
1998
1st Qtr 100.6 ... ... ...
2nd Qtr 106.0 ... ... ...
3rd Qtr 111.5 ... ... ...
4th Qtr 113.2 ... ... ...
1999
1st Qtr 106.6 ... ... ...
2nd Qtr 108.6 ... ... ...
3rd Qtr 110.6 ... ... ...
4th Qtr 117.4 ... ... ...
2000
1st Qtr 124.9 ... ... ...
2nd Qtr 134.5 ... ... ...
3rd Qtr 134.0 ... ... ...
4th Qtr 125.6 ... ... ...
2001
1st Qtr 137.6 ... ... ...
2nd Qtr 141.8 ... ... ...
3rd Qtr 145.7 ... ... ...
4th Qtr 151.7 ... ... ...
Source: Guyana Electricity Corporation, Guyana Power & Light.
TABLE 11-II
ELECTRICITY PRODUCTION
(mwh)
Consumption
Back to Annexe
Residential OtherPeriod Industrial &
Commercial
Total Amount
Generated

1990 2,830 0 776 0 141 127 103 784 899
1991 2,823 17 778 0 176 129 299 687 737
1992 4,123 58 944 0 458 106 304 811 1,442
1993 6,735 157 1,379 1,985 573 163 426 1,255 797
1994 6,898 236 1,821 849 676 153 699 1,801 663
1995 6,983 330 1,548 282 796 155 950 1,852 1,070
1996 7,634 289 1,934 599 617 190 839 2,040 1,126
1997 7,097 341 1,902 715 430 190 500 1,839 1,180
1998 6,611 344 2,004 732 722 269 315 1,409 816
1999 5,066 330 1,408 676 410 42 284 1,177 739
2000 5,336 342 1,517 677 388 48 346 1,285 733
2001 1,214 68 296 148 125 12 75 349 141
1998
1st Qtr 1,798 92 523 189 238 198 55 267 236
2nd Qtr 1,636 78 468 155 209 11 89 439 187
3rd Qtr 1,718 89 564 186 164 27 86 382 220
4th Qtr 1,459 85 449 202 111 33 85 321 173
1999 3
1st Qtr 1,322 84 358 172 136 11 94 311 156
2nd Qtr 789 35 170 109 49 3 57 203 163
3rd Qtr 1,470 71 442 221 118 15 73 284 246
4th Qtr 1,485 140 438 174 107 13 60 379 174
2000 3
1st Qtr 1,515 186 342 150 125 8 186 319 199
2nd Qtr 1,148 37 310 197 78 20 67 264 175
3rd Qtr 1,266 51 427 156 78 7 33 323 191
4th Qtr 1,407 68 438 174 107 13 60 379 168
2001
1st Qtr 1,161 108 343 134 96 18 91 250 121
2nd Qtr 1,014 65 297 126 76 8 38 243 161
3rd Qtr 986 50 296 128 41 10 71 253 137
4th Qtr 1,214 68 296 148 125 12 75 349 141
Source: Licence Revenue Department and the Bureau of Statistics1 Includes Land Cruisers , Land Rovers and Jeep
3 Figures for 1999 and 2000 was obtained from Bureau of Statistics.
2 Includes Omni Buses, Construction Vehicles, Hearses, Ambulances, Fire Appliances, Tank Wagons, Pick Up/ Vans,
TABLE 11-III NEW REGISTRATION OF MOTOR VEHICLES
(Number)
Period Total HireMini
BusesLorries Tractors
Back to Annexe
Other 2Station
1
Wagons
Cars
PrivateCycles

Food 1
Clothing Housing 2
Miscellaneous
1975 144.5 168.9 153.4 113.2 135.2
1976 157.5 192.2 162.5 133.4 147.6
1977 170.5 208.7 185.9 115.3 164.5
1978 196.5 244.7 240.7 116.6 195.4
1979 231.4 291.0 313.2 125.3 228.6
1980 264.0 326.2 365.6 140.7 273.5
1981 322.7 416.3 497.5 151.2 308.5
1982 390.2 527.7 570.5 158.5 346.0
1983 448.5 650.8 619.0 168.3 354.1
1984 561.5 867.4 678.8 178.0 402.1
1985 645.9 1043.2 740.0 192.8 430.9
1986 696.7 1134.0 792.3 200.6 462.3
1987 896.9 1424.5 1200.0 230.3 574.9
1988 1255.1 2167.2 1679.9 242.8 738.7
1989 2415.6 ... ... ... ...
1990 5055.4 ... ... ... ...
1991 9587.0 ... ... ... ...
1992 12105.0 ... ... ... ...
1993 13238.3 ... ... ... ...
1992
Jan 11220.2 ... ... ... ...
Feb 11519.1 ... ... ... ...
Mar 11681.2 ... ... ... ...
Apr 11899.0 ... ... ... ...
May 11985.1 ... ... ... ...
Jun 12020.6 ... ... ... ...
Jul 12192.8 ... ... ... ...
Aug 12167.5 ... ... ... ...
Sep 12466.3 ... ... ... ...
Oct 12562.6 ... ... ... ...
Nov 12739.9 ... ... ... ...
Dec 12805.7 ... ... ... ...
1993
Jan 12816.1 ... ... ... ...
Feb 12795.8 ... ... ... ...
Mar 12740.1 ... ... ... ...
Apr 12963.0 ... ... ... ...
May 13079.5 ... ... ... ...
Jun 13074.4 ... ... ... ...
Jul 13353.1 ... ... ... ...
Aug 13398.6 ... ... ... ...
Sep 13631.8 ... ... ... ...
Oct 13515.3 ... ... ... ...
Nov 13697.7 ... ... ... ...
Dec 13793.9 ... ... ... ...
Source: Bureau of Statistics1 Includes Beverages & Tobacco2 Includes Rent, Fuel & Light
TABLE 11-IVGuyana: Urban Consumer Price Index
(1970=100)
Sub-Group IndicesPeriod
Average
All Items
Index
Back to Annexe

Food 1
Clothing Housing 2
Miscellaneous
1994 115.0 120.1 100.3 113.9 113.5
1995 124.3 130.7 88.7 131.3 116.7
1996 129.9 137.6 89.0 137.0 121.0
1997 135.2 142.9 80.6 144.5 124.3
1998 141.7 146.9 76.1 144.0 133.4
1999 154.0 157.0 73.8 158.7 138.1
2000 163.0 163.7 72.7 179.4 155.7
2001 165.5 167.8 73.2 182.2 155.4
1998
Mar 138.0 140.1 81.0 144.5 126.3
Jun 139.8 142.7 78.8 145.4 129.4
Sep 139.8 142.9 78.1 145.2 131.1
Dec 141.7 146.9 76.1 144.0 133.4
1999
Mar 144.7 148.7 72.9 147.2 135.4
Jun 149.9 156.5 73.3 150.8 137.1
Sep 153.4 160.0 73.0 155.2 136.7
Dec 154.0 157.0 73.8 158.7 138.1
2000
Jan 155.7 159.6 73.9 161.6 141.3
Feb 158.1 163.5 73.9 163.2 141.4
Mar 156.3 159.4 72.5 163.1 145.1
Apr 155.3 156.8 73.2 164.2 145.2
May 155.2 156.6 73.2 164.2 145.1
Jun 156.8 159.4 73.1 164.7 145.8
Jul 159.3 163.9 73.2 166.8 145.0
Aug 161.2 164.5 73.5 174.1 145.1
Sep 161.5 164.0 73.5 175.4 153.6
Oct 161.0 162.4 72.7 176.2 154.5
Nov 161.2 160.5 72.7 178.1 155.8
Dec 163.0 163.7 72.7 179.4 155.7
2001
Jan 161.7 160.7 72.9 180.2 152.2
Feb 160.8 158.0 73.3 179.7 153.4
Mar 161.2 158.6 73.3 180.0 153.6
Apr 162.1 160.3 73.3 179.5 154.1
May 162.2 161.1 73.5 178.3 153.5
Jun 162.3 161.0 73.5 178.4 154.1
Jul 162.6 160.8 73.4 181.3 154.4
Aug 163.5 162.6 73.1 182.1 154.5
Sep 163.9 163.0 73.1 183.8 154.3
Oct 164.4 164.7 73.1 183.0 154.6
Nov 165.2 166.5 73.9 182.5 155.3
Dec 165.5 167.8 73.2 182.2 155.4
Source: Bureau of Statistics1 Includes Beverages & Tobacco2 Includes Rent, Fuel & Light
TABLE 11-VGeorgetown: Urban Consumer Price Index
(1994=100)
Sub-Group IndicesEnd of
Period
All Items
Index
Back to Annexe

1946 376,000 215,000 147,000
1960 560,000 282,000 175,000
1965 635,000 318,000 190,000
1970 714,000 350,000 210,000
1980 759,000 417,530 231,547
1986 756,100 447,255 275390
1992 738,965 438,831 278,078
1993 746,949 ... ...
1994 763,687 ... ...
1995 773,410 ... ...
1996 777,648 ... ...
1997 778,795 ... ...
1998 777,125 ... ...
1999 781,164 ... ...
2000 772,214 ... ...
2001 … … …
Sources:
1960 Report on Census of Population
1965 Report on a Survey of Manpower requirements
1986 - 1997 Bureau of Statistics
Figures for 1991 - 94 were adjusted by the Bureau of Statistics.
TABLE 11-VIPopulation and Labour Force
(Number)
Year Population Labour ForcePopulation Aged
15-65 years
Back to Annexe

APPENDIX ILIST OF COMMERCIAL BANKS AND THEIR BRANCHES
1. GUYANA NATIONAL COOPERATIVE BANK:- 1 Lombard & Cornhill Sts., Georgetown
BRANCHES
(a) G. P. O. - North Rd. & Savage St., Georgetown
(b) Linden - 20 Republic Ave., Linden
(c) Rose Hall - Rose Hall, Corentyne, Berbice
(d) Anna Regina - Lot 8, Public Rd., Anna Regina, Essequibo Coast
(e) Corriverton - Lot 74, Corriverton, Corentyne, Berbice
(f) New Amsterdam - Lot 16-17, Water & New Sts., New Amsterdam, Berbice
(g) Vreed-en-Hoop - Lot 35, New Rd., Vreed-en-Hoop, West Coast Demerara
(h) Kwakwani - Kwakwani Park, Berbice River
2. NATIONAL BANK OF INDUSTRY & COMMERCE LTD.:- 155-156 New Market & Waterloo Sts.,Georgetown
BRANCHES
(a) Water Street - 38-40 Water St., Georgetown
(b) Camp Street - 110 Regent & Camp Sts., Georgetown
(c) Rose Hall - 29A Public Rd., Rose Hall, Berbice
(d) Linden - 101-102 Republic Ave., Mc Kenzie, Linden
(e) Corriverton - Lot 5, No. 78 Village, Corriverton, Berbice
(f) Anna Regina - Lot 6 Public Rd., Anna Regina, Essequibo Coast
(g) Rosignol - Lot 31-32 Rosignol, West Bank Berbice
3. GUYANA BANK FOR TRADE & INDUSTRY LTD.:- 47-48 Water St., Georgetown
BRANCHES
(a) Regent Street - 138 Regent St., Georgetown
(b) Corriverton - Lot 211, No. 78 Village Corriverton, Berbice
(c) Anna Regina - Lot 2, Anna Regina, Essequibo Coast
(d) Parika - Lot 300, Parika, East Bank Essequibo
(e) D’Edward Village - Lot 16A, D’Edward Village, West Bank Berbice
(f) Vreed-en-Hoop - Lot ‘N’ Plantation Walk, Vreed-en-Hoop, West Bank Demerara
4. BANK OF NOVA SCOTIA:- 104 Carmichael St., Georgetown
BRANCHES
(a) Scotia Enterprise - 40 Pike St., Kitty
(b) Scotiabank - 63 Robb St. & Avenue of the Republic, Lacytown, Georgetown
(c) New Amsterdam - Lot 12, Strand, New Amsterdam, Berbice
(d) Parika - Lot 299, Parika Highway, Parika, East Bank Essequibo
(e) Bartica - Lot 42 Second Ave., Bartica, Essequibo
5. BANK OF BARODA:- 10 Ave. of the Republic & Regent St., Georgetown
6. DEMERARA BANK LTD.:- 230 Camp St. & South Rd., Georgetown
7. CITIZENS BANK GUYANA INC.:- 201 Charlotte & Camp Sts., GeorgetownBRANCHES
(a) Parika - Lot 298, Parika, East Bank Essequibo
(b) Bartica - Lot 16 First Ave., Bartica, Essequibo
(c) Thirst Park - Banks DIH Complex, Thirst Park

APPENDIX IILICENSED FOREIGN CURRENCY DEALERS DURING 2001
No. Name Address of Licensed Premises
1 A & N Sarjoo 15-16 America St., Stabroek, Georgetown
2 Bank of Baroda 10 Ave. of the Republic, Robbstown, Georgetown
3 Bank of Nova Scotia 104 Carmichael St., Georgetown
4 Blue Flame Cambio 9 Longden St., Georgetown
5 Cambio Royale 48 Robb St., Lacytown, Georgetown
6 Citizens Bank (Guy) Ltd. 201 Charlotte & Camp Sts., Georgetown
7 Commerce House Cambio 93 Regent St., Lacytown, Georgetown
8 Confidential Cambio 29 Lombard St., Werk-en-Rust, Georgetown
9 Demerara Bank Ltd. 230 Camp St. & South Rd., Georgetown
10 D. Singh & Sons Cambio 9 America St., Georgetown
11 F & F Foreign Exchange Enterprise 25 ‘A’ Water St., Georgetown
12 Guyana Pegasus Hotel Cambio Sea Wall Rd., Kingston, Georgetown
13 Guyana Bank for Trade & Industry 47-48 Water St., Robbstown, Georgetown
14 Globe Trust & Investment Co. Ltd. 92 Middle St., North Cummingsburg, Georgetown
15 Guyana National Cooperative Bank 1 Lombard & Cornhill Sts., Werk-en-Rust, Georgetown
16 G. N. C. B. Trust Corp. 62-63 Middle St., North Cummingsburg, Georgetown
17 Gobind Variety Store & Cambio 96 Regent St., Lacytown, Georgetown
18 Kayman Sankar & Co. Ltd. Cambio 216-217 Lamaha St., North Cummingsburg, Georgetown
19 Laparkan Financial Services Ltd. William Fogarty’s Building, 34-37 Water St., G/Town
20 Martina’s Cambio 19 Hinck St., Robbstown, Georgetown
21 N. M. Services Ltd. Cambio Lot 5 Ruimveldt, Greater Georgetown
22 National Bank of Industry & Commerce 38-40 Water St., Robbstown, Georgetown
23 R. Sookraj Cambio 77 Robb St., Lacytown, Georgetown
24 S & J Cambio 141 Dageraad Ave., Linden

BANK OF GUYANA
P. O. Box 1003Georgetown
Guyana
Cable Address: CENTRALBANK, Georgetown
Telephone: 226-3256/9Telex: GY 2267Telefax: 592-227-2965Website: www.bankofguyana.org.gyE-mail [email protected]