Bank Accounts For The Unbanked: Evidence from ... Accounts For The Unbanked: Evidence from...
61
Bank Accounts For The Unbanked: Evidence from a Big Bang Experiment Yakshup Chopra, Nagpurnanand Prabhala, and Prasanna Tantri ⇤ March 11, 2017 ⇤ Chopra is at Indian School of Business, Prabhala is at University of Maryland, College Park, and Tantri is at Indian School of Business. Chopra can be reached at yakshup [email protected], Prab- hala at [email protected], and Tantri at prasanna [email protected]. We thank Viral Acharya, Sumit Agarwal, Smita Aggarwal, Tarun Bajaj, Pawan Bakshi, Pulak Ghosh, Manuela Kristin Guenther, Deepali Pant Joshi, Leora Klapper, Surya Kolluri, Manju Puri, and Raghuram Rajan for sugges- tions and comments. We also gratefully acknowledge the many courtesies extended to us by bank officials running the PMJDY program. Mohan Ramanath provided excellent assistance. We retain responsibility for any errors that remain.
Transcript of Bank Accounts For The Unbanked: Evidence from ... Accounts For The Unbanked: Evidence from...
Bank Accounts For The Unbanked: Evidence from
a Big Bang Experiment
Yakshup Chopra, Nagpurnanand Prabhala, and Prasanna Tantri⇤
March 11, 2017
⇤Chopra is at Indian School of Business, Prabhala is at University of Maryland, College Park, andTantri is at Indian School of Business. Chopra can be reached at yakshup [email protected], Prab-hala at [email protected], and Tantri at prasanna [email protected]. We thank Viral Acharya, SumitAgarwal, Smita Aggarwal, Tarun Bajaj, Pawan Bakshi, Pulak Ghosh, Manuela Kristin Guenther,Deepali Pant Joshi, Leora Klapper, Surya Kolluri, Manju Puri, and Raghuram Rajan for sugges-tions and comments. We also gratefully acknowledge the many courtesies extended to us by banko�cials running the PMJDY program. Mohan Ramanath provided excellent assistance. We retainresponsibility for any errors that remain.

Bank Accounts For The Unbanked: Evidence from
a Big Bang Experiment
Abstract
Over 2 billion individuals around the world are unbanked. How they can be
brought into the formal financial system is a question of policy and academic
interest. We provide evidence on this question from India’s PMJDY program,
a“big bang” shock that supplied bank accounts to virtually all of its 260 mil-
lion unbanked. We analyze the uptake and the extent and nature of activity in
the new PMJDY accounts using transactional data from bank account state-
ments. While the newly included individuals are typically poor, unfamiliar with
banking, and do not undergo literacy or other training, transaction levels nev-
ertheless increase as accounts age and converge or exceed levels in non-PMJDY
accounts of similar vintage. Usage is led by active transactions and is aided
but not entirely explained by benefit transfer programs. The results suggest
that the unbanked have unmet (possibly latent) demand for banking, or that
the supply of banking perhaps stimulates its own demand.
“If you build it, he will come.” – Field Of Dreams, 1989 film.
1 Introduction
We present evidence from “PMJDY,” a program in India in which every unbanked
adult is supplied a no-frills bank accounts at no cost. PMJDY is a financial inclusion
program of extensive scope. Between August 2014 and December 2016, over 260
million new bank accounts were opened under the scheme. We obtain a sample of
the newly opened accounts. We study the extent and the nature of the usage of the
new accounts from opening until about 7 quarters, ending two weeks before India’s
currency demonetization shock in November 2016. We find that there is significant
uptake, activity, and savings accumulation in the newly opened accounts.
Our analysis is relevant to research and policy issues related to financial inclusion.
World Bank data (Demirguc-Kunt, Klapper, Singer, and Van Oudheusden (2015))
indicate that there are over 2 billion unbanked around the world, many of whom are
poor individuals. Whether these individuals can be brought into the formal financial
system and if so, how, are questions of economic interest. What approach to use
depends on the drivers of financial exclusion. It is possible that exclusion reflects
the lack of demand for formal financial services by the unbanked. Alternatively,
the unbanked may have demand, perhaps latent demand because they do not have
su�cient knowledge about how they could use and benefit from bank accounts. If
so, supply side interventions trigger inclusion either by meeting known demand or by
stimulating latent demand through experiential learning from account usage.
Our analysis informs the inclusion issue. It has two focal points of interest, the
nature of the inclusion program itself and our measurement of its impact. From an
experimental viewpoint, the PMJDY program is an enormous shock in the supply of
banking to the unbanked. The activity in the new accounts helps trace out demand
for banking services. If the unbanked have significant demand for banking, the new
1
accounts should see transactional activity. If demand is not significant, we should see
little account activity. What e↵ect dominates is the empirical question we address.
Our use of actual bank transactions is a feature is of interest in inclusion research.
Much of the evidence in this area comes from carefully designed field experiments
(e.g., Cole, Sampson, and Zia (2011), Dupas and Robinson (2013)). These studies
rely on surveys of account holders to infer usage. We complement this evidence by
showing actual usage in bank accounts. This empirical strategy lets us analyze both
the extensive and intensive margins. The extensive margin is whether an account
is used in the first place while the intensive margin is the extent of activity once
accounts transition out of dormancy. While dormancy is widely followed and is the
main metric reported by the government, relatively less is known about the activity
levels in accounts that are not dormant. Our study provides evidence on the latter
margin. Understanding activity is also important from an economic viewpoint if the
ultimate goal of inclusion is active use of accounts rather than just account ownership.
It also matters as the majority (70% or more) of PMJDY accounts are active.
We analyze audited data on transactions in a random sample of PMJDY accounts
and conduct a similar analysis for non-PMJDY accounts opened around the same
period. We find that the transactional activity in the PMJDY accounts increases
over time. Within 2 years, the activity levels in PMJDY accounts appear to converge
to those in the non-PMJDY accounts owned by people of substantially greater means.
The results are not driven by government direct benefit transfers. Because our models
use accountholder fixed e↵ects, unobservables such as demographics of the newly
included do not explain the increasing usage. Rather, a significant number of the
unbanked have latent demand for financial services from the formal sector.
Prior Literature. To better place our study, we briefly review the relevant re-
search and policy issues. Economists and policy makers recognize the importance of
financial inclusion. Bringing individuals to the financial mainstream lets them access
a wide menu of financial products for transactions, savings, credit, and insurance,
2
which helps mitigate poverty and fosters economic development. Inclusion helps indi-
viduals by making available finance, encouraging investment, and providing access to
better household risk management. Not surprisingly, inclusion is an important policy
priority for many countries.1
The first step towards financial inclusion is usually to open a bank account. The
World Bank’s 2014 Global Financial Development Report notes that many adults
do not own a bank account, especially in developing countries. For instance, bank
account ownership is nearly universal at 94% in high-income economies, but the
Report notes that 66% of individuals in Sub-Saharan Africa, 54% in South Asia, and
86% in the Middle East do not have bank accounts. More than 2 billion of these
individuals are excluded from the formal financial system. The account ownership
gap is pronounced among the poorest people.2
Why are so many individuals financially excluded? Prior research attempts to pin
down the drivers of financial exclusion. The state of the art work typically employs
carefully designed randomized controlled trials to provide insights on drivers of in-
clusion. For instance, given the (surprisingly) widespread lack of financial literacy,
studies ask whether literacy interventions can mitigate inclusion gaps. These have
met with limited success. It is not clear what part of literacy is relevant, what is teach-
able, to whom, through which platform, at what teachable moments, and whether
the e↵ects last.3 If illiteracy or mistrust of banks drive exclusion, opening accounts
is unlikely to lead to sustained banking activity. On the other hand, if there is latent
demand for banking, supply side interventions should result in uptake and sustained
1The inclusion literature is vast. Channels through which inclusion helps include overcomingtime-inconsistent preferences (Ashraf, Karlan, and Yin (2006), Duflo, Kremer, and Robinson (2011)),access to formal credit (Bruhn and Love (2014), Burgess and Pande (2005)), avoiding expensive debtfrom the informal sector (Aleem (1990), Carrell and Zinman (2014), Melzer (2011)), or accumulationof capital for healthcare and investment (Dupas and Robinson (2013), Dupas and Robinson (2014),Morduch (1995)). Banerjee and Duflo (2007) discuss the economic lives of the poor.
2See http://goo.gl/obfXaR.3See Duflo and Saez (2004), Ashraf, Karlan, and Yin (2006), Cole, Sampson, and Zia (2011),
Carpena, Cole, Shapiro, and Zia (2011), Cole, Gine, Tobacman, Topalova, Townsend, and Vickery(2013), Karlan, McConnell, Mullainathan, and Zinman (2016)). Lusardi (2008) and Lusardi andMitchell (2009) present evidence on financial literacy.
3
activity in accounts. What transpires is an empirical question that we address in the
context of the PMJDY scheme.
The Intervention: PMJDY – “Pradhan Mantri Jan Dhan Yojana,” or Prime Min-
ister’s People Wealth Scheme – was announced on August 15, 2014. Under the
scheme, all unbanked people were granted no-frills bank accounts. The scheme for-
mally opened on August 28, 2014. The program initially sought to cover 80 million
unbanked individuals within 5 months before India’s republic day on January 26,
2015. This target was easily met. The scheme then continued to expand coverage.
The PMJDY website now lists coverage at 100% with over 260 million new accounts
opened by December 2016. This is a significant economic intervention in a setting
where it matters, as India is a country with many unbanked people.
Research Questions, Methods, and Results We ask the following questions. First,
does the supply shock results in significant take up? This question is of interest
because many government programs witness low take up (Cole, Sampson, and Zia
(2011)). Second, do the new accounts remain active and how does the activity level
change with age? Third, what kind of transactions do newly included savings bank
account holders engage in? The bank accounts could be used directly to make pay-
ments, or account holders could withdraw cash and use it for transactional purposes.
We shed light on usage. Fourth, how does the extent and nature of usage in PMJDY
accounts compare with non-PMJDY savings bank accounts opened in the normal
course? Do we see convergence between the two? Finally, we analyze savings ac-
cumulation in the PMJDY accounts to assess whether entry into the formal sector
through one route, transactional usage, leads to migration to other services.
Our sample comes from 4 branches of a large public sector bank in India. We focus
on accounts opened in the initial phase of the PMJDY program and track activity for
roughly 7 quarters until October 24, 2016. Our end point comes well before India’s
demonetization experiment in November 8, 2016 that declared all high denomination
currency illegal for tender. We thus avoid the confounding e↵ects of this second shock.
4
We have 50,427 transactions executed by 3,418 PMJDY account holders in this time
period. The sample size is reasonable for drawing inferences and is comparable to
prior samples in inclusion research.
We also obtain a sample of non-PMJDY accounts opened before and around the
introduction of the PMJDY scheme in the same branches. This sample has 47,055
transactions executed by 2,611 account holders. In this sample, individuals are likely
to open accounts due to an underlying banking need and are likely to have greater
financial resources. Thus, our prior is that the non-PMJDY accounts set a high
watermark for account activity. We examine whether the gap between PMJDY and
non-PMJDY accounts shrinks over time.
Our data are drawn from bank records and thus subject to multiple checks and
balances by internal and external auditors. The transaction statements we analyze
are those seen by account holders if they request access. We do not access account
holder identity information due to confidentiality. We observe the transaction date,
the balance before and after a transaction, and a brief textual description of the
transaction. We note that the transaction coverage is 100% because banks must
maintain details pertaining to all transactions. We thus sidestep the hurdles such
as missing data, unresponsiveness, or selectivity in responses that are typical when
using follow-up surveys to track usage.
As a first step, we trace the proportion of inactive accounts in the sample. The
Government of India considers a zero account balance as an indicator of inactivity.
Close to 30% of the accounts in our sample have zero balance at the end of the sam-
ple period. This is close to the national average of 26% for October 2016 reported
in o�cial government statistics at http://pmjdy.gov.in. Textual transaction de-
scriptions indicate that accounts have two types of transactions. Active transactions
such as withdrawals from ATMs, cash or check deposits, and cash withdrawal require
active involvement of the account holder. Such transactions account for 41% of the
PMJDY accounts compared to 46% for non-PMJDY accounts. Passive transactions
5
that do not involve active participation of the account holders are typically interest,
bank charges, or subsidy payments to the poor.
We next turn to active transactions. The dependent variable in our tests is the
number of active transactions in a time period, which is typically one quarter. The
key independent variable is account age specified in quarters. In the baseline specifi-
cation, the sample comprises all transactions until a quarter n and the right hand side
variable is a dummy variable for the quarter n. The estimated coe�cient thus cap-
tures the increase in activity in nth quarter relative to prior quarters. We repeat the
regressions for n = 1, 2, · · · , 7 to shed light on the account seasoning process. Across
multiple specifications, we find that number of active transactions per PMJDY ac-
count increases with age. While government benefit transfers are not included in the
dependent variable definition, we control for them because they could stimulate sub-
sequent withdrawals. To account for unobservable attributes of accountholders that
could drive usage, we include accountholder fixed e↵ects.
We examine di↵erent types of active transactions and the modes in which these
transactions are conducted. Withdrawals using ATMs account for about 17% of total
transactions and 42% of active transactions. These transactions increase significantly
with age. Because ATMs are often not equipped to receive deposits and account
holders prefer to use tellers to deposit cash, cash deposits tend to be both time and
transportation cost intensive. These transactions tend to decrease with age and show
a mild increase in amount per deposit. Cash withdrawals at branches do not have
significant trends.
We next analyze account balances. PMJDY accounts are primarily intended for
transactional purposes and not savings accumulation. Work on mental accounting
(Thaler (1999)) suggests that accounts used for one purpose may not transition into
other uses due to narrow framing. Additionally, individuals are more likely to use
accounts for savings because of unfamiliarity with banks and the inability to trust
banks to provide access to cash when needed. Finally, work on self-control sug-
6

gests that commitment features such as penalties for early withdrawals drive savings
(Ashraf, Karlan, and Yin (2006), Gneezy, Meier, and Rey-Biel (2011)). The oppo-
site predictions are suggested by Dupas and Robinson (2013), who show that even
commitment-free accounts can induce savings. Moreover, increasing transactional de-
mands can create its own demand for precautionary savings (Keynes (1936)). Finally,
changes in account balances may be one signal of improvement in economic condition.
being economically better o↵. We find evidence of balance accumulation in PMJDY
accounts. The mean balance per PMJDY account increases from INR 1,795 at the
end of quarter 1 to INR 4,127 at the end of quarter 7.
We benchmark the activity in PMJDY accounts relative to non-PMJDY accounts.
We find evidence of a narrowing gap in usage. For instance, in quarter 2, the 3,418
PMJDY accounts see 2,427 transactions, which translates into 0.61 transactions per
account versus 1.73 transactions per account for non-PMJDY accounts. In quarter
7, there are 1.12 transactions per PMJDY account compared to 1.72 transactions
for non-PMJDY accounts. The transactions gap narrows by 43% from 1.12 to 0.60
transactions per quarter. Of course, these results do not account for other di↵erences
such as variation in dormancy across the two types of accounts. Regression models
that account for these di↵erences show a further narrowing or even greater activity
in PMJDY accounts.
We remark on how our results add to academic research on financial inclusion.
Much of the evidence in this literature (see footnote 1) is based on carefully designed
randomized controlled trials (RCTs). We view our study as complementing this
evidence. One di↵erence is, of course, the experiment we study. The PMJDY is a large
scale intervention, an experiment that targets the entire population. This feature can
trigger greater awareness, uptake, and adoption by making financial accounts more
salient relative to RCTs aimed at focal samples of a few hundred. RCTs can vary
product features such as withdrawal commitments while the PMJDY program is a
cookie-cutter product. RCTs rely on follow up surveys to assess ex-post usage while
7

we measure outcomes using actual transactions. In balance, our view is that the
evidence presented here is complementary to the RCT evidence on why there are
inclusion gaps and how to mitigate them.
The rest of the paper is organized as follows. Section 2 reviews the background
on Indian banking and financial inclusion. Section 3 reviews the PMJDY program.
Section 4 discusses our sample. Section 5 discusses the specification. Section 6 reports
the results. Section 7 concludes and suggests directions for future work.
2 Institutional Background
2.1 Indian Banking System
Since India’s independence in 1947, its banking sector has seen three phases. Private
sector banks are dominant from 1947 to 1969. The second phase of state owned
banking starts in 1969 when most of the banking sector was nationalized. The third
phase begins in the mid-1990s when banking is reopened to new private banks. This
is the current regime. Private banks coexist with state-owned banks that collectively
have about 70% of the banking market (Cole (2009), Demetriades and Luintel (1996)).
Many state-owned banks are partially privatized and have minority non-government
shareholders who hold stakes of between 20% and 45%. Other banks with low market
shares include co-operative banks (Iyer and Puri (2012)) and regional rural banks.
2.2 Financial Inclusion
The Indian state has long been concerned with issues related to inclusion. The per-
ceived lack of inclusion is a central driver of India’s banking policies including perhaps
its most significant, the 1969 and 1980 nationalizations of virtually the entire banking
8

sector.4 Post-nationalization policies continue to focus on inclusion, largely through
rules concerning branching and lending (Banerjee and Duflo (2014), Burgess and
Pande (2005), Cole (2009)).
According to the Findex database maintained by the World Bank (Demirguc-
Kunt, Klapper, Singer, and Van Oudheusden (2015)), most Indian adults do not
even have a savings bank account, while the number for China is significantly lower
at 36%. The survey reports that 43% of accounts remain dormant. In OECD coun-
tries, the dormancy ratio is less than 5%. Demirguc-Kunt, Klapper, Singer, and
Van Oudheusden (2015) conduct a survey to assess why there are such low levels of
financial inclusion in developing countries. Nearly 60% of the respondents said that
they do not have enough money to open an account. Other reasons include religious
beliefs, lack of trust, expenses involved in opening an account, financial institutions
located far away, lack of necessary documents required to open an account, lack of
need and family member already having an account. Gunther (2016) presents more
recent evidence for India based on surveys conducted in India between 2014 and 2016.
2.3 Inclusion E↵orts
Successive governments in India and India’s central bank, the Reserve Bank of India
(RBI) periodically launch measures to increase inclusion (Garg and Agarwal (2014)).
Early measures focused on rural branching (Burgess and Pande (2005)). More re-
cent measures include product innovations such as designing no-frills simple savings
technology, regulatory changes such as simplifying “know your customer” documen-
tation, compulsory financial literacy programs, and government initiatives such as
opening branches of state owned banks. The programs have motivated and in turn
been informed by research experiments including ones within India (Cole, Sampson,
4See the book by Ghosh (2015) for an extensive account of the bank nationalization processand the inclusion motivations underlying it. A 2013 speech by RBI Executive Director Dr. Joshi athttp://www.bis.org/review/r131030f.pdf compactly summarizes inclusion e↵orts in the decadessince nationalization.
9
and Zia (2011)). Financial exclusion nevertheless remains widespread so e↵orts to
expand access to banking continue.
3 The PMJDY Program
The PMJDY program followed a national election in 2014 that led to a switch in
political power. Universal financial inclusion was a priority of the BJP, the party
that came into power in May 2014. The new Prime Minister of India, Mr. Modi,
announced the Pradhan Mantri Jan Dhan Yojana (PMJDY) on August 15, 2014.
PMJDY’s objective was to give a basic bank account to all Indian citizens. A
secondary aim was to use the accounts for transferring government benefits and cut
leakages in the delivery of these benefits. While complete coverage of the hundreds of
millions of unbanked seemed ambitious, three factors suggested that it was probably
not entirely unrealistic. One, Indian banks had extensive branching networks of over
100,000 branches developed over several decades.5 Secondly, banks migrated to a
digital infrastructure through core banking systems and infrastructure for conducting
banking transactions such as payments.6 Finally, state-owned banks have a significant
70% share of the banking sector. This vast footprint allowed the government to
commandeer the relevant technical, managerial, and clerical resources of the state-
owned banks towards achieving coverage targets.
PMJDY accounts were available to those who did not have a bank account as
on August 15, 2014. The minimum required account balance was fixed at zero and
there were no fees for maintaining the account. The progress of PMJDY was closely
monitored directly by the Prime Minister’s o�ce. A dedicated website compiled and
posted statistics and awareness was raised through a media campaign.
PMJDY account holders do not receive direct financial incentives to open bank
5See http://dbie.rbi.org.in/DBIE/dbie.rbi?site=statistics6See, e.g., a recent address by RBI Deputy Governor Mr. R. Gandhi, available at https:
//rbi.org.in/scripts/BS\_ViewBulletin.aspx?Id=16614.
10
accounts. Beneficiaries are eligible for a life insurance cover of INR 30,000 (about
US$ 450).7 The account also provides a debit card that came with a free accident
insurance cover of INR 100,000 (US$ 1,500), provided the card is used at least once in
the 90 days prior to filing claims. The process of opening PMJDY accounts is simple
(Demirguc-Kunt, Klapper, Ansar, and Jagati (2017)). Accounts could be opened
through branch visits or through agents of banks known as Bank Mitras. Banks
could not refuse bank accounts for those producing the required identity documents
or those who submit attested documents that they do not have other bank accounts
and a letter issued by government “Gazetted O�cers.”
3.1 Aggregate PMJDY Data
We report in Table 1 the country wide aggregate data on the PMJDY scheme ex-
tracted from the program website http://www.pmjdy.in. Panel A reports data on
the accounts opened in the initial phase from August 15, 2014 to January 31, 2015,
during which 125.5 million accounts were opened. Of these, the share of public sec-
tor banks is 78.5%, while regional rural banks and private sector banks account for
17.4% and 4.2%, respectively. The high market share of public sector banks is not
surprising given their larger networks especially in the geographic areas where the
unbanked reside. When we classify accounts by the value of deposits outstanding
rather than the number of accounts, public sector, regional rural, and private sector
banks have shares of 77.9%, 15.2%, and 6.9%, respectively. The slightly greater mar-
ket share in value for private banks is consistent with these banks having locations
where wealthier customers reside.
The Indian Prime Minister’s o�ce tracks zero balance accounts. A relatively
high 67.3% of the accounts have zero balance as of January 31, 2015. This number
rapidly decreases, as we discuss below. In the initial phase, public sector banks and
7The life insurance cover was available to accounts opened in the first wave that ended in January2015.
11
regional rural banks have greater proportions of zero balance accounts, 66.6% and
73.1%, respectively, compared to private sector banks, whose zero balance accounts
are 57.2% of all accounts opened.
Panel B of Table 1 reports cumulative statistics for both the first and second
wave of PMJDY account openings until December 14, 2016. The number of accounts
doubles to 259.8 million and the aggregate account balance increases more than 700-
fold from about INR 1 billion in January 2015 to INR 741 billion as of December
14, 2016. Thus, wave 2 not only expands the number of accounts but more than
proportionately increases account balances. The Panel B data show that the fraction
of zero balance accounts decreases from 67% to 23.2% between 2015 and 2016. The
decrease in zero balance accounts is particularly pronounced for public sector and
regional rural banks, whose zero balance account shares drop from 66.6% and 73.1%
to 23.4% and 20%, respectively. While the zero balance accounts in private sector
banks also decrease, the change from 57.2% to 34.7% is less pronounced.
In 2016, the U.S. Bank Wells Fargo opened about 1.5 million accounts for cus-
tomers without their consent, likely due to pressure to meet targets for account open-
ing.8 The PMJDY program exerted similar pressures on banks. The PMJDY was a
signature initiative of India’s prime minister and the government owned a large part
of the banking sector. To what extent are PMJDY fictitious accounts such as those
uncovered in the Wells Fargo scandal? The aggregate data provide two (admittedly
rough) pointers that fake accounts do not dominate.
One indicator is the fraction of accounts that are seeded with Aadhaar, India’s new
unique identity card with robust biometrics backing it. Banks could open accounts
with Aadhaar or less reliable forms of identification that are more vulnerable to
manipulation. Table 1 shows that 55% of the accounts are Aadhaar-seeded. For
state-owned banks subject to manipulation pressures, Aadhaar-seeded accounts have
8See, e.g., “Consumer Financial Protection Bureau Fines Wells Fargo $100 Million forWidespread Illegal Practice of Secretly Opening Unauthorized Accounts” at http://goo.gl/kZHzBz
12

a higher market share, 56.8%, versus 43% for private banks and 49.2% for regional
rural banks. The more di�cult to manipulate biometrics backed accounts are more
prevalent at state owned banks. A second indicator is the positive correlation between
bank account opening and account use data. If banks boost account totals, entities
with more accounts should see greater inactivity. The data in Tables 2 and 3 and
Figure 1 suggest the opposite. Banks opening more accounts see more activity.9
4 The Bank Account Dataset
4.1 Overview
Our data are from a large bank in India. The bank provides us data from a ran-
domly sampled set of PMJDY accounts from four randomly selected branches in four
di↵erent administrative districts. We also sought a random sample of non-PMJDY
accounts opened within one year prior to August 2014 in the same district. Confiden-
tiality restrictions prevent us from disclosing the identity of the bank and the location
of the branches. The data provided to us consist of the transaction amount, a coded
description of the transaction, and the balance after each transaction. A detailed
description of the variables in an account statement is provided in Table 4. The data
come from the audited statements used for bank reconciliation and reporting. Entries
must tally with other controls such as cash balances on an hourly basis. Thus, our
data are accurate and not subject to errors or missing observations.
Table 5 describes our sample. Panel A shows that the 6,029 account holders in
our sample conduct 97,482 transactions between September 16, 2013 and Novem-
ber 2, 2016. The sample observations prior to August 2014 pertain to our control
sample of non-PMJDY accounts. For the full sample, the mean (median) number
of transactions equal 16.17 (10) in the first 7 quarters since opening. The average
9A cross-sectional regression, not reported here, gives similar results.
13
(median) transaction value is INR 6,620. In our sample, 1,347 accounts, or 22.34%
of all accounts, remain inactive in the sample period.
Panel B summarizes data for PMJDY accounts. The PMJDY scheme was for-
mally launched on August 28, 2014, which is the first date in the PMJDY sample.
Our sample has 3,418 PMJDY accounts and 50,427 transactions. For non-PMJDY
accounts reported in Panel C, the sample begins on September 16, 2013. There are
47,055 transactions executed by 2,611 unique savings account holders in this sample.
The mean transaction amount in PMJDY accounts equals INR 1,557, which is
lower than the average of INR 12,142 for non-PMJDY accounts reported in Panel
C.10 These data suggest that PMJDY account holders are poorer. This is a form
of time-invariant unobserved heterogeneity that can be controlled through accoun-
tholder fixed e↵ects. Because non-PMJDY accounts are likely driven by a trans-
actional need, these accounts are more likely to have higher transactional activity
initially. The data support such a view. The average PMJDY account holder in our
sample executes 14.75 transactions in the first 7 quarters of account opening versus
18.02 transactions for the non-PMJDY accounts. 29.78% of the PMJDY accounts are
inactive throughout the sample period compared to 12.6% for non-PMJDY accounts.
4.2 Transaction Description
A transaction is a field in one line in a bank account statement. Substrings in this field
indicate the type of transaction involved. For instance, ATM cash withdrawals contain
the sequence ATM WDL. Similar mnemonics characterize other transaction types,
which we parse to identify the transaction type. Table 6 gives data on transaction
types in our sample. ATM withdrawals account for 17.37% for PMJDY accounts
and 21.42% of transactions for non-PMJDY accounts. Cash deposits or withdrawals
are the next most frequent transactions, representing 17.76% (14.75%) for PMJDY
10At the exchange rate of USD 1 = INR 68, the mean balances for PMJDY and non-PMJDYaccounts equal about $23 and $178, respectively.
14
(non-PMJDY) accounts. Conversations with the bank managers reveal that account
holders are unfamiliar with and somewhat wary of banks and prefer to wait in line
and deposit cash instead of using ATMs, even if ATMs are programmed to accept
deposits, which they are often not.
Table 6 also shows that active transactions other than ATM withdrawals and cash
transactions, deposits and withdrawals are infrequent. Transactions using checks are
more likely in non-PMJDY accounts but are relatively rare for PMJDY accounts,
perhaps reflecting the di↵erences in financial sophistication in the two populations.
There is very little usage of accounts for mobile payments or for POS (point of sale)
charges both for PMJDY and non-PMJDY accounts. These statistics suggest that
during our sample period, there are not economically meaningful shifts to a cashless
economy. Instead, accounts are used to store and withdraw cash for onward use in
economic transactions.
We define the dummy variable ACTIVE for transactions that require active ac-
count holder participation. Other transactions are passive. An important category of
passive transactions includes direct benefit transfers from government program aimed
at the poor. These are welfare and subsidy schemes such as that for LPG (liquefied
petroleum gas used for cooking), old age pensions, student scholarships, and assis-
tance for building a house. Funds released through these welfare schemes have often
been subject to leakage.11 One objective of opening PMJDY accounts was to reduce
these leakages. Benefit transfers account for 21.60% (15.16%) of all transactions in
PMJDY (non-PMJDY) schemes, reflecting that PMJDY account holders are poorer.
The other passive transactions are interest payments and bank charges and “bulk
credit” transactions. These include interest payments and charges such as mobile
banking charges or ATM maintenance fees. Such transactions account for 34.70%
(32.95%) for the PMJDY (non-PMJDY) transactions.
11A former prime minister of India, Rajiv Gandhi, once remarked that “...If [the] Centralgovernment releases one rupee for poor, only 10 paisa (i.e., 10%) reaches them.” See, e.g.,http://zeenews.india.com/home/is-corruption-in-our-dna_725837.html.
15

5 Account Seasoning Specification
A key question in this paper concerns the uptake of banking services in the PMJDY
accounts. We estimate specifications in which the samples include all transactions up
to and including quarter q, 8q � 2. We regress a transactional activity measure yikq
on a dummy variable �k,q that takes the value 1 if the transaction is in the quarter q
and zero otherwise. The specification is thus
yikq = ↵ + �i + �k,q�k,q + "ikq 8 q n, (1)
where k is PMJDY or non-PMJDY. The coe�cient �k,q denotes the intensity of us-
age of accounts in quarter q relative to prior quarters. �i is a fixed e↵ect that controls
for unobservable heterogeneity across accountholders i. We estimate models sepa-
rately for PMJDY and non-PMJDY accounts and also models with interactions of ac-
count age with the PMJDY dummy variable. For the PMJDY sample, we test whether
the coe�cient �PMJDY,q increases over time. For the sample with both PMJDY and
non-PMJDY accounts, we test whether the di↵erence �k=PMJDY,q � �k=non�PMJDY,q
increases over time. Such a finding would indicate increasing PMJDY activity relative
to non-PMJDY accounts. The standard errors are clustered at account holder level
and adjusted for heteroskedasticity.
The dependent variable in our preferred specification is the number of transactions
in an account. We choose this variable rather than transaction value as it is more
agnostic to the levels of wealth and income of account holders. For completeness,
we display estimates of models with other dependent variables such as final account
balances or type of transactions (e.g., ATM transactions or debit transactions). We
initially estimate linear regressions and we later show estimates of Poisson models to
account for the fact that transactions are count data as well as zero-inflated models
that allow for excess mass at zero. We include a dummy variable for whether there
is a government direct benefit transfer in the current or previous quarter.
16
6 Results
If the unbanked have positive demand for financial services, the PMJDY accounts
should display positive activity, and, potentially, savings that increase with account
age. Alternatively, exclusion could reflect the lack of demand, due to the lack of
resources, illiteracy, health reasons, or blind beliefs about the unsuitability of banks.
Additionally, following Tzioumis and Gee (2013), agency problems at banks could
impede usage. Bank employees under pressure to meet account opening targets could
perhaps focus on opening bank accounts and not account usage. If so, new accounts
could display limited activity.
6.1 Univariate Analysis
In Panel A of Table 7, we report data on activity levels in PMJDY accounts. Trans-
actions are from quarters 1 through 7 after account opening. The total number of
active transactions increases from 2,102 in the first quarter to 3,728 in quarter 7.
The number of transactions per account per quarter increases from 0.61 in quarter
1 to 1.12 in quarter 7. Thus, by the end of quarter 7, the PMJDY account holder
transacts once per quarter on average.
Panel B of Table 7 presents data for non-PMJDY accounts. While we sample 2,611
such accounts, the exact opening date of the account is available for only 1,475 of these
accounts, which constitute our non-PMJDY sample in the regressions. Interestingly
and in contrast to the PMJDY accounts, the number of active transactions decreases
with age. The total number of transactions between quarter 1 and quarter 7 decreases
from 3,143 to 2,254 and the number of active transactions per account per quarter
declines from 2.13 in quarter 1 to 1.72 in quarter 7 for non-PMJDY accounts. Figures
3 and 4 plot these results. The di↵erential pattern for PMJDY and non-PMJDY
accounts suggests that usage di↵erences between the two account shrink with age.
We characterize this more formally using regressions.
17
We analyze the extensive margin, or the transition from no use to first use in Table
5. 1,018 out of 3,418 PMJDY accounts, or 29.8% of the accounts do not transition
into positive use versus 329 out of 2,611, or 12.6% for non-PMJDY accounts. Figure
2, which plots the non-parametric Kaplan-Meier survival estimates for the event of
the first active transaction, characterizes this di↵erence more formally. The time-
to-first-use shows small and persistent di↵erences between PMJDY and non-PMJDY
accounts. Thus, PMJDY accounts are less likely to start usage. Given that the
PMJDY accounts are less likely to be used, the activity levels in Table 7 understate
the true convergence in usage of the account holders who actually transact.
The di↵erences in extensive versus intensive margin provide a useful characteri-
zation of the barriers to financial inclusion. The unbanked poor targeted in PMJDY
show significant static friction in beginning to use their accounts. However, once ini-
tial usage starts, PMJDY accounts display increased activity. The data are consistent
with a learning-by-doing mechanism for technology adoption by the poor.
The data also speak to why literacy interventions do not necessarily improve inclu-
sion, a puzzle noted by Cole, Sampson, and Zia (2011). The process of using accounts
for transactions requires expense of a fixed amount of e↵ort, whose benefits are per-
haps ex-ante unclear to the unbanked. A di↵erent point is about what these benefits
are and how they can be learnt. If the primary usage of accounts is transactional, the
relevant literacy dimension is liquidity management. Account holders must learn that
banks provide a safe storage technology and ready access when funds are needed. In
determining required balances, individuals must forecast fluctuations in transactional
cash demand, transaction costs associated with usage, stock-out costs, and develop
trust in cash in bank relative to cash in hand.
Financial literacy for liquidity management is di↵erent from literacy for savings
accumulation, which requires, is tested, and is delivered through training on interest
rates and compounding (Cole, Sampson, and Zia (2011)). Di↵erent metrics of literacy
may be necessary for di↵erent uses (Lusardi and Mitchell (2009)). A related question
18
is how the skills can be delivered to the poor. Our evidence that there is significant
takeup suggests that even without training, experiential learning that comes from
actual use of bank accounts aids uptake.
6.2 Regression Evidence
Table 8 presents estimates of Equation (1). In Panel A, the dependent variable is
the number of transactions per account while Panels B and C use value transacted
per account per quarter and value per transaction per account, respectively. To
facilitate interpretation, observe that each row in the Table represents a coe�cient
from separate estimation of Equation (1). For example, the row labeled “Quarter =
3” compares average activity in quarter 3 to all preceding quarters.
Our preferred specification is in Panel A of Table 8. The results in column (1)
results pertain to all PMJDY accounts. We find that the activity level of PMJDY ac-
counts increases with age. For instance, in quarter 7, there are 0.226 more transactions
than the average of prior quarters. We note that the model includes individual fixed
e↵ects. Thus, we control for time-invariant factors such as age, education, gender,
personal financial circumstances or literacy, or geographic distances or transportation
di�culties in accessing bank accounts that can explain usage as well as sources of un-
observed heterogeneity. In columns (2) and (3), we analyze accounts receiving or not
receiving government benefit transfers. Activity increases in both types of accounts.
We next compare the PMJDY and non-PMJDY estimates. Columns (4) to (6)
in each panel of Table 8 report these results. Unlike the coe�cients for PMJDY
accounts, the non-PMJDY account coe�cients are negative. That is, account usage
in non-PMJDY accounts decreases over time, especially in accounts without direct
government benefit transfers. Thus, the increasing trend in transactions in PMJDY
accounts is not a generic feature of accounts opened in the normal course of business.
We examine this hypothesis formally in di↵erence-in-di↵erence settings.
19
Panels B and C report activity measures by value. The PMJDY results in columns
(1) to (3) display mixed significance but are directionally similar to those based on the
number of transactions. For instance, in Panel B, the value transacted per account in
quarter 7 exceeds the average for prior quarters by INR 1,910. For the same period,
Panel C shows that the value per transaction increases by INR 281.
6.3 PMJDY versus non-PMJDY Accounts
Table 9 presents the regression estimates of a di↵erence in di↵erence specification. We
estimate Equation (1) for the combined sample of PMJDY and non-PMJDY accounts
but with interaction terms in which the age in quarters is interacted with a PMJDY
account dummy variable. To save space, we only report the coe�cients of interest,
viz., for the PMJDY-age interaction term. As in Table 8, we report results for all
accounts and those receiving or not government assistance in columns 1, 4 and 7,
columns 2, 5 and 8, and columns 3, 6 and 9, respectively.
The main results are in column (1). We find that the di↵erence-in-di↵erence
coe�cients are consistently positive and statistically significant. For instance, the
coe�cient for all transactions for the PMJDY accounts is 0.502 for quarter 2 and 0.977
for quarter 7. The evidence a�rms the univariate statistics in which PMJDY activity
increases over time. The results in columns (2) and (3) suggest that the government
benefits transfer program does not drive the di↵erence in di↵erence results. In fact,
column (3) suggests greater increase over time for accounts without benefit transfers.
The remaining results in columns (4) through (9) are for the value of all trans-
actions and value per transaction. In contrast to the models with the number of
transactions as the dependent variable, the value specifications do not show conver-
gence between PMJDY and non-PMJDY accounts. Only 2 out of 36 coe�cients are
significant. This is unsurprising. The persistence in value di↵erences likely reflect
equally persistent income and wealth di↵erences between PMJDY and non-PMJDY
20
account holders.12 In our view, the results reinforce why activity counts are probably
better metrics of usage in the 2-year time horizon studied here.
6.4 Deposits and Withdrawals
We next examine the types of transactions for which PMJDY accounts are used. We
focus on 4 categories: withdrawals, deposits, ATM transactions, and cash deposits
and withdrawals at branches. These represent the major categories of transactions
in our sample. We start with deposits and withdrawals. If the PMJDY accounts are
primarily safe savings vehicles, withdrawals are likely to happen only when there are
unplanned expenditures or the event for which the funds were saved in the first place
occurs. We would then expect to see an increase in deposit transactions with time
but not withdrawals. On the other hand, if the account holders use the accounts as
convenient transaction vehicles, withdrawals should increase with account age.13
Table 10 reports the estimates of Equation (1) for deposits and withdrawals for
PMJDY and non-PMJDY accounts separately. The asymmetry between deposits
and withdrawals is a dominant feature of PMJDY accounts. In Panel A, we find
that the number of deposit transactions decrease with age but Panel B shows that
the number of withdrawal transactions increase with age. Conversations with bank
o�cials suggest that the results are best explained by the time costs of each type of
transaction. For deposits, account holders tend to visit branches and wait in queues
for service. ATMs are not used for deposits for three reasons. One, they require more
sophistication. Two, not all ATMs accept deposits. Third, PMJDY account holders
are relatively indigent and worry about machine malfunctions. Seeking redressal is
time consuming. Moreover, a stock-out from temporary loss of cash is costly for the
12The di↵erence is consistent with the univariate statistics in Table 5 where the average trans-action size for PMJDY account holders is INR 1,649 versus INR 13,275 for non-PMJDY accountholders, an 8X di↵erence.
13Transactions costs can drive the results. However, 3 transactions per month are free for PMJDYaccount holders while the fourth transaction and beyond attracts a transaction fee of INR 10 pertransaction, or 0.6% of the median transaction amount of INR 1,649 for PMJDY accounts in Table5. The typical usage is far less than the threshold of 3 transactions per month.
21
poor. Account holders thus accumulate cash balances and visit banks only after a
threshold is crossed. Withdrawals are straightforward and executable at many ATMs,
so they increase with time.
In Table 10, we find that non-PMJDY accounts also see decreases in the number
of deposits but the coe�cients tend to be more negative than for PMJDY accounts.
For instance, in quarter 7, the PMJDY coe�cient for deposits is -0.043 while the non-
PMJDY coe�cient is more than three times larger at -0.170. Transaction values are
occasionally significant and have positive values for PMJDY accounts, while they tend
to be negative and insignificant for non-PMJDY accounts. The Panel B results for
withdrawals reveal similar di↵erences. Withdrawal transactions increase for PMJDY
accounts as they age but decrease for non-PMJDY accounts.
The formal di↵erence in di↵erence specifications are in Table 11. While both spec-
ifications show positive coe�cients, the deposit coe�cients are consistently positive
while the withdrawal specifications are significant only towards the end of the sample
period. In both cases, the specifications suggest greater activity in PMJDY accounts
relative to non-PMJDY accounts.
6.5 ATM and In-Branch Transactions
We next estimate Equation (1) for ATM usage. The results are in Panel A of Table
12. We find that the usage of ATMs and value measures increase with account age
for PMJDY account holders. For instance, PMJDY account holders have an average
of 0.171 transactions more in quarter 7 relative to previous quarters. The increase
in value per transaction ranges from INR 40 to INR 95 and INR 166 to INR 646
for value per quarter per account. The non-PMJDY accounts do not display these
trends: none of the coe�cients are significant. The data suggest that PMJDY but
not non-PMJDY account holders increase ATM usage over time.
The increased usage of ATMs by PMJDY account holders is perhaps surprising.
22

Demirguc-Kunt, Klapper, Singer, and Van Oudheusden (2015) find that distance to
the bank is one of the important reasons for lack of demand for formal financial
services among the poor. ATMs help reduce this distance and hence, are likely to
be used actively by the PMJDY account holders. On the other hand, using ATMs
requires some basic literacy and familiarity with handling machines. In addition,
there is no live help available in ATMs, which may deter their use by PMJDY account
holders. Yet, they use ATMs. The findings are consistent with the learning by doing
by the poor in adopting basic technology applications relevant to banking.
Given the increased usage of ATMs with age, we expect the number of (non-
ATM) cash deposit and withdrawal transactions to come down over time for PMJDY
accounts. We report the results in Panel B of Table 12. The coe�cients for the
number of transactions are negative but not always statistically significant for PMJDY
accounts and are insignificant economically and statistically in quarter 7. We find
similar trends in non-PMJDY accounts although the results are now significant for
6 out of 7 quarters suggesting decreasing non-ATM transactions for non-PMJDY
account holders. We also examine the value per quarter and value per transaction per
quarter. Most coe�cients are not significant. The greater usage of ATM transactions
displaces non-ATM transactions only marginally for PMJDY account holders.
6.6 Account Balances
We examine the accumulation of balances in PMJDY accounts. Prior research (e.g.,
Rosenzweig and Wolpin (1993)) shows that the poor find it di�cult to smooth con-
sumption. Savings can help by allowing the poor to avoid consequences such as fire
sales of productive assets. The literature establishes that the inability to save is not
solely due to the lack of income. For instance, short term temptations and time in-
consistent preferences lead to insu�cient savings, which can be mitigated by savings
technologies including those without withdrawal restrictions (Dupas and Robinson
(2013, 2014)). Whether PMJDY accounts, which have no minimum balance require-
23
ments nor any restrictions on withdrawals, witness balance accumulation is thus an
empirically interesting issue.14
As before, we estimate regression equation (1). The dependent variable in the
specification for each quarter is the natural logarithm of the average of the account
balance at the end of each month within a quarter. Table 13 reports the results. In
column 1, the sample includes all PMJDY accounts and the results show that balances
increase. For example, the coe�cient reported in row 1, represents the di↵erence in
log account balance between quarter 2 and quarter 1 of an account’s life. For instance,
the account balance at the end of quarter 2 is about 29.2% more than the account
balance as at the end of quarter 1. Figures 5 and 6 depict the trends in account
balances.
As before, we separate accounts that receive government transfers and those that
do not. Table 13 shows that the coe�cient is always significant for PMJDY accounts
receiving government benefits and the growth estimates range from 10.1% to 40.4%.
For the PMJDY accounts not receiving government transfer benefits, the coe�cients
are significant in quarter 1 and end of time period quarters 6 and 7, in which the
coe�cients reflect a 15.2% and 27% growth relative to 36.9% and 33.4% growth
for accounts with a government transfer. We conclude that using accounts leads to
balance accumulation.
Table 13 also analyzes balances in non-PMJDY accounts. These accounts show
mixed results and less frequent significance. For instance, 4 out of 7 quarters have
significant coe�cients for accounts with government transfers, while 1 out of 7 are sig-
nificant for accounts without such transfers. For a more formal analysis, we estimate
a di↵erence-in-di↵erence regression as in equation 1. The dependent variable is log
of average of account balance at the end of each month within a quarter. The results
are reported in Table 14. As in Table 9, we report only the interaction term coe�-
14Withdrawals by check are free. There is charge of INR 10 per withdrawal after 3 free with-drawals. In the Demirguc-Kunt, Klapper, Ansar, and Jagati (2017) survey, savings and sending orreceiving money is the most common reason for opening PMJDY accounts.
24
cients. PMJDY accounts display greater growth in balance accumulation relative to
non-PMJDY accounts.
6.7 Poisson Model Estimates
The key dependent variable of interest in our study is the number of transactions.
We estimate Poisson regressions in which the number of transactions nq follows a
Poisson distribution Pr(nq = k) = �kexp
��
k! where � ⌘ �(q) denotes the transaction
event rate per quarter (Cameron and Trivedi (2013)). We also include a model with
zero inflation to correct for over-dispersion. Table 15 reports results of the baseline
Poisson models. The dependent variable is the number of transactions per account
in a given quarter. The independent variable of interest in all models is the age of
an account, which we specify as the quarter number since opening, or one plus the
greatest integer less than the number of days since opening divided by 90.
Specification (1) in Table 15 is estimated on PMJDY accounts alone. We find that
the coe�cient for age is positive, indicating that PMJDY account usage increases
with age. Specification (2) adds the control for government benefit transfers. This
is a dummy variable that takes the value 1 if the account holder has received a
benefits transfer in the current and the previous quarter. Such transfers can induce
usage through withdrawals. We find that the government benefits transfer itself has
the expected positive coe�cient and reduces the coe�cient for age, which, however,
remains significant.
Specification (3) in Table 15 expands the sample to include both PMJDY and
non-PMJDY accounts. Of focal interest is the coe�cient for the interaction term,
viz., age ⇥ the PMJDY dummy variable, which captures the incremental activity
change for PMJDY relative to non-PMJDY accounts as accounts age. We find that
the interaction term has a positive and significant coe�cient. Thus, as accounts
age, activity in the PMJDY accounts increase more than it does for non-PMJDY
25
accounts. Specification (4) in Table 15 shows the quarter-by-quarter coe�cients for
PMJDY accounts alone. These coe�cients are positive and significant.
We next characterize the quantitative magnitudes of the Poisson regression results.
Given the coe�cient estimates in Table 15, the incremental e↵ect for PMJDY accounts
without a government benefit transfer for quarter q is �0.0492⇥ q + 0.118⇥ q. The
government benefit transfer increases this value by 0.443. We find that the estimated
transaction intensity coe�cient � for PMJDY accounts exceeds that for non-PMJDY
accounts by 0.0688 in quarter 1, and the di↵erential increases to 0.4816 in quarter
7. If there is a government benefit transfer, the estimates for quarter 1 and quarter
7 are 0.5118 and 0.9246, respectively. These estimates represent the increase in the
quarterly transaction rates.
Table 16 reports the Poisson estimates for deposits and withdrawals separately.
The structure of the table parallels that in Table 15. The PMJDY-only samples
in columns (1) and (2) show that deposits decrease with account age. Quarters
with direct benefit transfers see less deposit activity but do not significantly alter
the coe�cient for account age. The quarter by quarter results in column (4) shows
a similar decrease in account deposits over time. In column (3), we find that the
coe�cient for the interaction between age and PMJDY is positive. Thus, while both
PMJDY and non-PMJDY accounts show fewer deposits over time, the decrease in
deposit activity is more pronounced for the non-PMJDY accounts. Columns (5)-(8)
deal with withdrawals. We find that withdrawals increase with account age even
after controlling for quarters in which there is direct government benefits transfer
and increase more for PMJDY accounts relative to non-PMJDY accounts. In terms
of economic magnitudes, the transaction intensity for PMJDY accounts over non-
PMJDY accounts equals 0.14 in quarter 1 and 1.01 in quarter 7, which increases to
0.76 and 1.63 transactions in periods when there is a direct benefits transfer.
Table 17 reports estimates of a zero-inflated Poisson model. The model accounts
for over-dispersion relative to a standard Poisson model. It also helps di↵erentiate
26
between the extensive margin, or the probability of transitioning from no use to
positive use, and the intensive margin, or the extent to which the account is used
conditional on use. We specify two variables plausibly related to the probability of
zero inflation. One is whether the account is a PMJDY account. As seen in Table
5, the probability of zero balance accounts for PMJDY accounts is more than double
the probability for non-PMJDY accounts. The second variable is whether there is a
government benefit transfer in a quarter. Such transfers are likely to trigger account
activity away from a dormant state.
We find that the extensive margin inflation instruments are significant. The
PMJDY dummy variable has a positive coe�cient and the government benefit trans-
fer coe�cient is negative. In particular, the positive sign for the PMJDY dummy
variable indicates that the PMJDY accounts are less likely to migrate out of dormant
state. The intensive margin results are in column (3) of Table 17. Curiously, gov-
ernment benefit transfers have a negative e↵ect: they are likely to increase migration
away from dormancy but not in increasing usage.
The negative coe�cient for the PMJDY dummy indicates that the baseline usage
of PMJDY accounts is lower. The key coe�cient is for the age-PMJDY interaction
variable. It is positive, indicating that PMJDY accounts experience increasing usage
over time. As before, the Poisson coe�cient estimates can be used to infer economic
magnitudes. In quarter 1, the PMJDY accounts have mean transaction rates of 0.11
above non-PMJDY accounts, which increases to 0.78 transactions in quarter 7. If we
include government benefit transfers, the coe�cients are -0.12 and 0.55 in quarters 1
and 7, respectively.
6.8 Additional Discussion
Our results shed light on the adoption of formal banking by the unbanked. Adoption
is not instantaneous. The positive coe�cients for quarter 7 suggests that usage is
27
continuing to increase nearly two years from account opening. This is not surpris-
ing. Individuals opening PMJDY accounts are relatively poor, historically excluded
from the financial system, and are unfamiliar with the operation of bank accounts
or account benefits. In addition, as the survey evidence in Demirguc-Kunt, Klapper,
Ansar, and Jagati (2017) shows, individuals continue to harbor misperceptions that
the accounts cost money. Thus, in our view, realized adoption rates probably under-
state potential usage. Further time series evidence can shed light on this issue, but a
key impediment is that another shock, India’s currency demonetization, takes place
on November 8, 2016. This is just after the end of our sample period. In this sense, we
have about as much time series duration as possible without the confounding e↵ects
of the second shock.
A contemporaneous study of PMJDY accounts by Agarwal, Alok, Ghosh, Ghosh,
Piskorski, and Seru (2017) further underlines the importance of measuring activity
over longer time periods. Their sample of 1.5 million accounts is wider than ours but
is shorter as it spans only about 3 quarters from account opening. Agarwal et al.
find low activity in their narrower time period. For instance, 81% of customers do
not make even one deposit, 87% do not make even one withdrawal, 66% receive no
money, and 79% send no money in their sample. As they write, “... longer time series
data is needed to evaluate the long-run validity of these facts.” Our study addresses
precisely this gap by providing evidence from a longer panel.
A longer time series also seems necessary to assess macroeconomic outcomes of
bank lending.15 If adoption of banking technology itself takes time, it appears reason-
able to surmise that its economic e↵ects on outcomes such as employment, education,
health or investment growth will also be manifest over longer time periods. Con-
straints in financing supply are also non-trivial. Banks administratively overwhelmed
by the sheer number of new accounts are unlikely to be able to make loans to new
entities. Wider – rather than longer – samples may be useful in analyzing infrequent
15King and Levine (1993), Levine (1997), and Rajan and Zingales (1998) discuss the e↵ect offinance on economic growth.
28

transactions such as mobile money transfers and point-of-sale transactions.
Survey evidence of PMJDY account holders o↵ers interesting external validation
for some of our findings. CAFRAL, the research and learning arm of India’s cen-
tral bank RBI, conducted a survey of 313 PMJDY account holders (Aggarwal and
Chandra (2015)). The survey finds that the dominant reason for opening PMJDY
accounts is to deposit savings, which is cited by 52% of account holders. The next
highest reason (23%) is to avail of insurance attached to the accounts, followed
by the desire to avail of direct benefit transfers and subsidies (16%). These rou-
tine uses are what we find in our sample. Another survey conducted by Microsave
(http://goo.gl/Aj8Trb) focuses on 4,859 account holders. 88% of accounts are
opened through bank “mitra” agents, whose dominant o↵erings are accounts for sav-
ings (94%) or insurance (70%). 79% of respondents report using the “Rupay” ATM
card associated with PMJDY accounts. Using accounts for routine purposes is what
we too find in our study.16
A final point we address concerns heterogeneity in transactional activity across
di↵erent demographics. To conserve space, we do not report the results here but the
tables are available upon request. We examine demographics along two dimensions,
viz., age and gender.17 These are dimensions along which there are inclusion gaps
(Demirguc-Kunt, Klapper, Singer, and Van Oudheusden (2015), Gunther (2016)).
We find that transactional activity is lower for accounts owned by women but both
men-owned and women-owned accounts increase transactional activity over time. The
median accountholder age in our sample is close to 32 years. Both accountholders
below median age and those above median age show increased account activity over
time. The increase is more prominent for younger account holders suggesting that the
young have greater take-up in the intensive margin sense. We also examine account
balances, and find that they increase across all demographic cuts.
16We thank Smita Aggarwal and Pulak Ghosh for pointing us to these survey data.17We cannot include these as explanatory variables as the fixed e↵ects absorb these time-invariant
characteristics.
29

7 Conclusion
Data on financial inclusion indicate that over 2.5 billion individuals around the world
lack a bank account, which represents the most basic form of access to the formal
financial system. A question of economic and policy interest is whether the exclu-
sion reflects the lack of demand for banking or that there is underlying demand but
insu�cient supply of banking. We provide new evidence on this question from an
unanticipated big bang shock in the supply of banking services to the unbanked. In
2014, India announced the PMJDY program that aimed to supply bank accounts to
virtually all its 260 million unbanked.
We obtain a sample of the newly opened PMJDY accounts and track transactional
activity in these accounts. We also obtain a sample of non-PMJDY accounts opened
around the same time to assess the di↵erences between PMJDY and non-PMJDY
accounts. We report three main findings. First, we find that while about 30% of
PMJDY accounts remain unused, 70% of the accounts migrate out of dormancy into
active use. Second, activity levels in PMJDY accounts increase over time, a pat-
tern not necessarily seen in non-PMJDY accounts. In many specifications, activity
increases in PMJDY accounts relative to non-PMJDY accounts. These findings are
especially stark given that non-PMJDY accountholders in our sample appear to be
much poorer and have transaction sizes that are one order of magnitude smaller. Fi-
nally, we find that the active accounts experience significant increases in cash balances.
Government direct benefits transfer aids but does not fully explain usage. Overall,
the data indicate that the unbanked learn by doing, and increase usage of accounts
for transactions, liquidity management, and increasingly, balance accumulation.
Our study adds to the work on interventions aimed at enhancing inclusion. Con-
ventional financial literacy interventions (e.g., Cole, Sampson, and Zia (2011)) have
had limited e�cacy in stimulating use. The PMJDY experiment has no explicit in-
centives or prior literacy interventions to encourage uptake. Yet, we find uptake and
30

increasing activity. One interpretation, on the lines of Lusardi and Mitchell (2009), is
that financial literacy is perhaps multi-faceted. Literacy relevant to savings accumula-
tion is perhaps di↵erent from literacy related to use of bank accounts for transactions
and liquidity management, which may be complex and better understood through
actual use.
We also find a di↵erence between the extensive and the intensive margins. PMJDY
accounts are less likely to move out of dormancy but once use begins, there is signif-
icant activity that increases over time. Our evidence is consistent with a learning by
doing view of inclusion. Adopting a new product requires assessment of its benefits
relative to adoption costs. Some of this knowledge can come only with experiential
learning. Supply can create its own demand, perhaps by raising awareness of a latent
demand, as the introductory quote cited in our study suggests.
Finally, our study focuses on a large economy-wide supply shock in the supply of
banking. Micro-level evidence on these types of interventions is relatively rare. Our
findings can help inform other countries that may consider similar interventions to
improve inclusion.
31
References
Agarwal, Sumit, Shashwat Alok, Pulak Ghosh, Soumyakanti Ghosh, Tomasz Pisko-rski, and Amit Seru, 2017, Banking the unbanked: What Do 255 Million New BankAccounts Reveal About Financial Access?, Georgetown University Working Paper.
Aggarwal, Smita, and Bhagvath Chandra, 2015, Survey of PMJDY Account Holders,CAFRAL Working Paper.
Aleem, Irfan, 1990, Imperfect Information, Screening, and the Costs of InformalLending: A Study of a Rural Credit Market in Pakistan, World Bank EconomicReview 4, 329–349.
Ashraf, Nava, Dean Karlan, and Wesley Yin, 2006, Tying Odysseus to the Mast: Ev-idence from a Commitment Savings Product in the Philippines, Quarterly Journalof Economics pp. 635–672.
Banerjee, Abhijit, and Esther Duflo, 2007, The Economic Lives Of The Poor, Journalof Economic Perspectives 21, 141–168.
Banerjee, Abhijit, and Esther Duflo, 2014, Do Firms Want to Borrow More? TestingCredit Constraints Using a Directed Lending Program, Review of Economic Studies81, 572–607.
Bruhn, Miriam, and Inessa Love, 2014, The Real Impact of Improved Access toFinance: Evidence from Mexico, Journal of Finance 69, 1347–1376.
Burgess, Robin, and Rohini Pande, 2005, Do Rural Banks Matter? Evidence fromThe Indian Social Banking Experiment, American Economic Review 95, 780–795.
Cameron, A Colin, and Pravin K Trivedi, 2013, Count Panel Data, Oxford Handbookof Panel Data Econometrics (Oxford: Oxford University Press, 2013).
Carpena, Fenella, Shawn Allen Cole, Jeremy Shapiro, and Bilal Zia, 2011, Unpackingthe Causal Chain of Financial Literacy, World Bank Policy Research WorkingPaper No. 5798.
Carrell, Scott, and Jonathan Zinman, 2014, In Harm’s Way? Payday Loan Accessand Military Personnel Performance, Review of Financial Studies 27, 2805–2840.
Cole, Shawn, 2009, Financial development, bank ownership, and growth: or, doesquantity imply quality?, Review of Economics and Statistics 91, 33–51.
Cole, Shawn, Xavier Gine, Jeremy Tobacman, Petia Topalova, Robert Townsend,and James Vickery, 2013, Barriers to Household Risk Management: Evidence fromIndia, American Economic Journal: Applied Economics 5, 104–135.
Cole, Shawn, Thomas Sampson, and Bilal Zia, 2011, Prices or knowledge? whatdrives demand for financial services in emerging markets?, Journal of Finance 66,1933–1967.
32

Demetriades, Panicos O, and Kul B Luintel, 1996, Financial Development, EconomicGrowth and Banking Sector Controls: Evidence from India, The Economic Journalpp. 359–374.
Demirguc-Kunt, Asli, Leora Klapper, Saniya Ansar, and Aditya Jagati, 2017, Makingit Easier to Apply for a Bank Account: A Study of the Indian Market, World BankWorking Paper.
Demirguc-Kunt, Asli, Leora F Klapper, Dorothe Singer, and Peter Van Oudheusden,2015, The Global Findex Database 2014: Measuring Financial Inclusion aroundthe World, World Bank Policy Research Working Paper No. 7255.
Duflo, Esther, Michael Kremer, and Jonathan Robinson, 2011, Nudging Farmers toUse Fertilizer: Theory and Experimental Evidence from Kenya, American Eco-nomic Review 101, 2350–2390.
Duflo, Esther, and Emmanuel Saez, 2004, Implications of Pension Plan Features, In-formation, and Social Interactions for Retirement Saving Decisions, Pension Designand Structure: New Lessons from Behavioral Finance pp. 137–153.
Dupas, Pascaline, and Jonathan Robinson, 2013, Savings constraints and microenter-prise development: Evidence from a field experiment in Kenya, American EconomicJournal: Applied Economics 5, 163–192.
Dupas, Pascaline, and Jonathan Robinson, 2014, Why Don’t the Poor Save More? Ev-idence from Health Savings Experiments, American Economic Review 103, 1138–1171.
Garg, Sonu, and Parul Agarwal, 2014, Financial Inclusion in India – A Review ofInitiatives and Achievements, IOSR Journal of Business and Management 16, 52–61.
Ghosh, D. N., 2015, No Regrets, Rupa Publications.
Gneezy, Uri, Stephan Meier, and Pedro Rey-Biel, 2011, When and Why Incentives(Don’t) Work to Modify Behavior, Journal of Economic Perspectives 25, 191–209.
Gunther, Manuela Kristin, 2016, The progress of financial inclusion in India: Insightsfrom multiple waves of survey data, CAFRAL Working Paper.
Iyer, Rajkamal, and Manju Puri, 2012, Understanding Bank Runs: The Importanceof Depositor-Bank Relationships and Networks, American Economic Review 102,1414–1445.
Karlan, Dean, Margaret McConnell, Sendhil Mullainathan, and Jonathan Zinman,2016, Getting to the Top of Mind: How Reminders Increase Saving, ManagementScience 62, 3393–3411.
Keynes, John Maynard, 1936, The General Theory of Employment, Interest andMoney. London, 1936, Keynes: The General Theory of Employment, Interest andMoney 1936.
33
King, Robert G, and Ross Levine, 1993, Finance and Growth: Schupmeter Might beRight, Quarterly Journal of Economics 108, 717–738.
Levine, Ross, 1997, Financial development and economic growth: views and agenda,Journal of Economic Literature pp. 688–726.
Lusardi, Annamaria, 2008, Financial Literacy: An Essential Tool for Informed Con-sumer Choice?, Discussion paper, National Bureau of Economic Research.
Lusardi, Annamaria, and Olivia S Mitchell, 2009, How Ordinary Consumers MakeComplex Economic Decisions: Financial Literacy and Retirement Readiness, CFSWorking Paper No. 2010/11.
Melzer, Brian T, 2011, The Real Costs of Credit Access: Evidence from the PaydayLending Market, Quarterly Journal of Economics 126, 517–555.
Morduch, Jonathan, 1995, Income Smoothing and Consumption Smoothing, TheJournal of Economic Perspectives 9, 103–114.
Rajan, Raghuram G, and Luigi Zingales, 1998, Financial dependence and growth,American Economic Review 88, 559–586.
Rosenzweig, Mark R, and Kenneth I Wolpin, 1993, Credit Market Constraints, Con-sumption Smoothing, and the Accumulation of Durable Production Assets in LowIncome Countries: Investments in Bullocks in India, Journal of Political Economy101, 223–244.
Thaler, Richard H, 1999, Mental Accounting Matters, Journal of Behavioral DecisionMaking 12, 183–206.
Tzioumis, Konstantinos, and Matthew Gee, 2013, Nonlinear Incentives and MortgageO�cers’ Decisions, Journal of Financial Economics 107, 436–453.
34
Tab
le1:
NationwidePMJDY
Data
:ByBank
Type
Tab
le1reports
aggregatePMJD
Ydata.
Pan
elA
reports
dataas
ofJanu
ary31,2015
andPan
elB
reports
dataas
ofDecem
ber
14,2016.Columns(1)-(3)reportthenu
mber
ofaccounts,
column(4)thenu
mber
ofRupay
cards,
andcolumn(5)theaggregate
balan
ceunder
thePMJD
Yschem
e.Column(6)reports
theproportion
ofaccountswithzero
balan
ce.Columns(7)-(9)presentsthe
proportion
sof
tenu
mber
ofaccounts,
aggregatebalan
cean
dzero
balan
ceaccountsforeach
ban
ktype.
Column(10)
reports
the
number
ofzero
balan
ceaccounts.
Column(11)
reports
thenu
mber
ofaccountsthat
areAad
haarseeded.Dataarefrom
thePMJD
Ywebsite
http://www.pmjdy.gov.in.
(1)
(2)
(3)
(4)
(5)
(6)
(7)
(8)
(9)
(10)
(11)
Pan
elA:Asof
Janu
ary31
2015
#Acc
ounts
#Rupay
Balance
%with
Zero
Mark
et
Mark
et
Mark
etShare
#with
#Aadhaar
BankType
Rura
lUrb
an
Total
Card
sM
illion
Balance
Share
#Share
INR
Zero
Balance
Zero
Balance
Seeded
PublicSectorBan
k53.3
45.1
98.4
91.2
817.5
66.6%
78.46%
77.86%
77.59%
65.5
NA
RuralRegional
Ban
k18.5
3.3
21.8
15.0
159.9
73.1%
17.36%
15.23%
18.86%
15.9
NA
Private
Ban
ks3.2
2.0
5.2
4.6
72.6
57.2%
4.17%
6.91%
3.55%
3.0
NA
Total
75.0
50.5
125.5
110.8
1050.0
67.3%
84.5
NA
Pan
elB:Asof
Decem
ber
14,2016
#Acc
ounts
#Rupay
Balance
%with
Zero
Mark
et
Mark
et
Mark
etShare
#with
#Aadhaar
BankType
Rura
lUrb
an
Total
Card
sBillion
Balance
Share
#Share
INR
Zero
Balance
Zero
Balance
Seeded
PublicSectorBan
k115.2
91.8
207
162.9
579.9
23.4%
79.68%
78.23%
80.36%
48.5
117.6
Regional
RuralBan
k38
6.1
44.1
32.9
134.1
20.0%
16.97%
18.09%
14.65%
8.8
21.7
Private
Ban
ks5.2
3.5
8.6
8.1
27.2
34.7%
3.31%
3.67%
4.94%
3.0
3.7
Total
158.4
101.4
259.8
204.0
741.2
23.2%
60.3
143
35
Tab
le2:
NationwidePMJDY
Data
:PublicSectorBanks
Tab
le2reports
PMJD
Ydataforpublicsector
ban
ksas
ofJanu
ary31,2015.
Columns(1)-(3)reportthenu
mber
ofaccounts,
column(4)thenu
mber
ofRupay
cardsissued,column(5),
theaggregatebalan
ceunder
thePMJD
Yschem
e.Column(6)reports
theproportion
ofaccountswithzero
balan
ce.
Incolumn(7)-(9),
wereportthemarketshareof
number
ofaccounts,
aggregate
balan
cean
dzero
balan
ceaccounts.
Column(10)
reports
thenu
mber
ofzero
balan
ceaccounts.
Dataarefrom
thePMJD
Ywebsite
http://pmjdy.gov.in.
#Acc
ounts
#Rupay
Balance
%with
Zero
Mark
et
Mark
et
Mark
etShare
#with
Banks
Rura
lUrb
an
Total
Card
sBillion
Balance
Share
#Share
INR
Zero
Balance
Zero
Balance
(1)
(2)
(3)
(4)
(5)
(6)
(7)
(8)
(9)
(10)
Allah
abad
Ban
k1.7
0.7
2.4
2.4
0.65
75.8%
2.45%
0.80%
2.79%
1.83
Andhra
Ban
k1.1
0.7
1.7
1.7
0.66
69.9%
1.74%
0.81%
1.83%
1.20
Ban
kof
Barod
a2.8
3.9
6.7
6.5
6.41
52.3%
6.76%
7.84%
5.31%
3.48
Ban
kOfIndia
2.4
3.4
5.8
5.6
2.76
67.0%
5.87%
3.37%
5.91%
3.87
Ban
kof
Mah
arastra
1.2
0.6
1.8
1.7
1.84
64.6%
1.79%
2.25%
1.74%
1.14
Bhartiya
Mah
ilaBan
k0.0
0.1
0.1
0.1
0.05
38.8%
0.06%
0.06%
0.03%
0.02
Can
araBan
k4.1
2.0
6.0
6.0
7.38
41.0%
6.13%
9.03%
3.77%
2.47
Central
ban
kof
India
4.0
1.2
5.2
4.7
2.02
72.0%
5.31%
2.47%
5.74%
3.76
CorporationBan
k0.9
0.9
1.9
1.7
2.79
37.4%
1.89%
3.42%
1.06%
0.70
DenaBan
k1.5
0.8
2.3
2.2
1.39
68.9%
2.36%
1.71%
2.44%
1.60
IDBI
0.4
0.4
0.9
0.8
0.25
78.4%
0.87%
0.31%
1.03%
0.67
Indianban
k1.5
0.9
2.4
2.3
1.18
63.5%
2.47%
1.44%
2.36%
1.54
IndianOverseasBan
k1.0
1.9
2.8
2.7
0.13
85.0%
2.89%
0.15%
3.69%
2.42
OrientalBan
kof
Com
merce
1.2
0.9
2.1
2.0
8.85
38.2%
2.12%
10.83%
1.22%
0.80
Punjab&
SindBan
k0.8
0.4
1.2
1.1
4.17
53.4%
1.21%
5.11%
0.97%
0.64
PunjabNational
Ban
k5.8
1.4
7.2
6.3
7.77
77.5%
7.29%
9.50%
8.48%
5.56
State
Ban
kof
Bikan
eran
dJaipur
1.0
1.2
2.2
1.9
4.69
55.2%
2.25%
5.74%
1.87%
1.22
State
Ban
kof
Hyd
erab
ad0.8
1.5
2.4
2.2
1.02
73.5%
2.41%
1.25%
2.66%
1.75
State
Ban
kof
India
10.5
15.3
25.8
22.9
7.38
78.9%
26.24%
9.03%
31.10%
20.38
State
Ban
kof
Mysore
0.6
0.2
0.8
0.7
0.03
95.0%
0.78%
0.04%
1.11%
0.73
State
Ban
kof
Patiala
0.4
0.7
1.1
1.0
2.32
69.4%
1.10%
2.84%
1.15%
0.75
State
Ban
kof
Travancore
0.0
0.3
0.3
0.3
1.24
12.4%
0.33%
1.52%
0.06%
0.04
Syn
dicateBan
k2.1
1.1
3.2
3.1
2.70
66.1%
3.27%
3.30%
3.25%
2.13
Uco
Ban
k1.9
1.9
3.8
3.4
3.99
58.4%
3.87%
4.88%
3.40%
2.23
UnionBan
kOfIndia
3.1
1.0
4.0
3.8
2.23
68.3%
4.11%
2.73%
4.22%
2.77
United
Ban
kOfIndia
1.8
1.4
3.2
3.0
7.43
35.0%
3.25%
9.09%
1.71%
1.12
VijayaBan
k0.7
0.5
1.2
1.1
0.39
63.1%
1.17%
0.48%
1.11%
0.73
Sub-T
otal
53.3
45.1
98.4
91.2
81.75
66.6%
65.54
36
Tab
le3:
NationwidePMJDY
Data
:PrivateSectorBanks
Tab
le2reports
PMJD
Ydataforprivate
sector
ban
ksas
ofJanu
ary31,2015.
Columns(1)-(3)reportthenu
mber
ofaccounts,
column(4)thenu
mber
ofRupay
cardsissued,column(5),
theaggregatebalan
ceunder
thePMJD
Yschem
e.Column(6)reports
theproportion
ofaccountswithzero
balan
ce.
Incolumn(7)-(9),
wereportthemarketshareof
number
ofaccounts,
aggregate
balan
cean
dzero
balan
ceaccounts.
Column(10)
reports
thenu
mber
ofzero
balan
ceaccounts.
Dataarefrom
thePMJD
Ywebsite
http://pmjdy.gov.in.
#Acc
ounts
#Rupay
Balance
%with
Zero
Mark
et
Mark
et
Mark
etShare
#with
Banks
Rura
lUrb
an
Total
Card
sBillion
Balance
Share
#Share
INR
Zero
Balance
Zero
Balance
(1)
(2)
(3)
(4)
(5)
(6)
(7)
(8)
(9)
(10)
CityUnionBan
kLtd
0.01
0.06
0.07
0.00
0.05
53.6%
1.33%
0.64%
1.24%
0.04
Federal
Ban
k0.18
0.05
0.23
0.22
0.95
54.4%
4.30%
13.14%
4.09%
0.12
HDFC
Ban
k0.17
0.77
0.94
0.94
3.51
61.7%
17.98%
48.33%
19.39%
0.58
ICIC
I1.78
0.29
2.07
2.03
1.38
44.1%
39.50%
19.05%
30.45%
0.91
IndusindBan
k0.01
0.12
0.14
0.14
0.04
51.2%
2.65%
0.61%
2.37%
0.07
Jammuan
dKashmirBan
k0.81
0.10
0.91
0.50
0.97
72.5%
17.38%
13.44%
22.03%
0.66
KarurVaisyaBan
k0.01
0.09
0.09
0.09
0.03
69.6%
1.77%
0.39%
2.15%
0.06
Kotak
Mah
indra
Ban
k0.05
0.05
0.10
0.09
0.03
85.0%
1.91%
0.43%
2.84%
0.09
Lak
shmiVilas
Ban
k0.02
0.05
0.06
0.02
0.01
39.3%
1.16%
0.20%
0.80%
0.02
Ratnakar
Ban
k0.06
0.03
0.09
0.09
0.01
56.8%
1.72%
0.15%
1.70%
0.05
Sou
thIndianBan
k0.02
0.08
0.10
0.05
0.06
50.8%
1.81%
0.81%
1.61%
0.05
Yes
Ban
k0.01
0.00
0.01
0.00
0.00
85.3%
0.17%
0.04%
0.25%
0.01
Sub-T
otal
3.23
2.01
5.24
4.59
7.26
57.2%
3.00
37
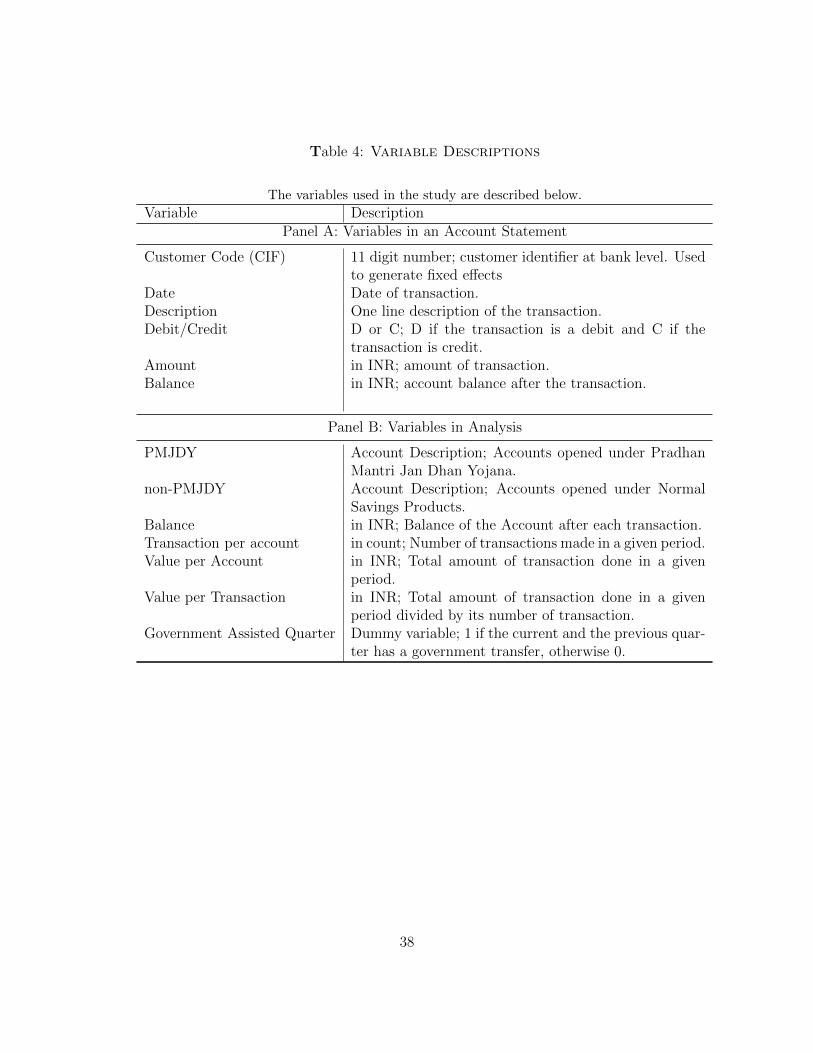
Table 4: Variable Descriptions
The variables used in the study are described below.
Variable DescriptionPanel A: Variables in an Account Statement
Customer Code (CIF) 11 digit number; customer identifier at bank level. Usedto generate fixed e↵ects
Date Date of transaction.Description One line description of the transaction.Debit/Credit D or C; D if the transaction is a debit and C if the
transaction is credit.Amount in INR; amount of transaction.Balance in INR; account balance after the transaction.
Panel B: Variables in Analysis
PMJDY Account Description; Accounts opened under PradhanMantri Jan Dhan Yojana.
non-PMJDY Account Description; Accounts opened under NormalSavings Products.
Balance in INR; Balance of the Account after each transaction.Transaction per account in count; Number of transactions made in a given period.Value per Account in INR; Total amount of transaction done in a given
period.Value per Transaction in INR; Total amount of transaction done in a given
period divided by its number of transaction.Government Assisted Quarter Dummy variable; 1 if the current and the previous quar-
ter has a government transfer, otherwise 0.
38
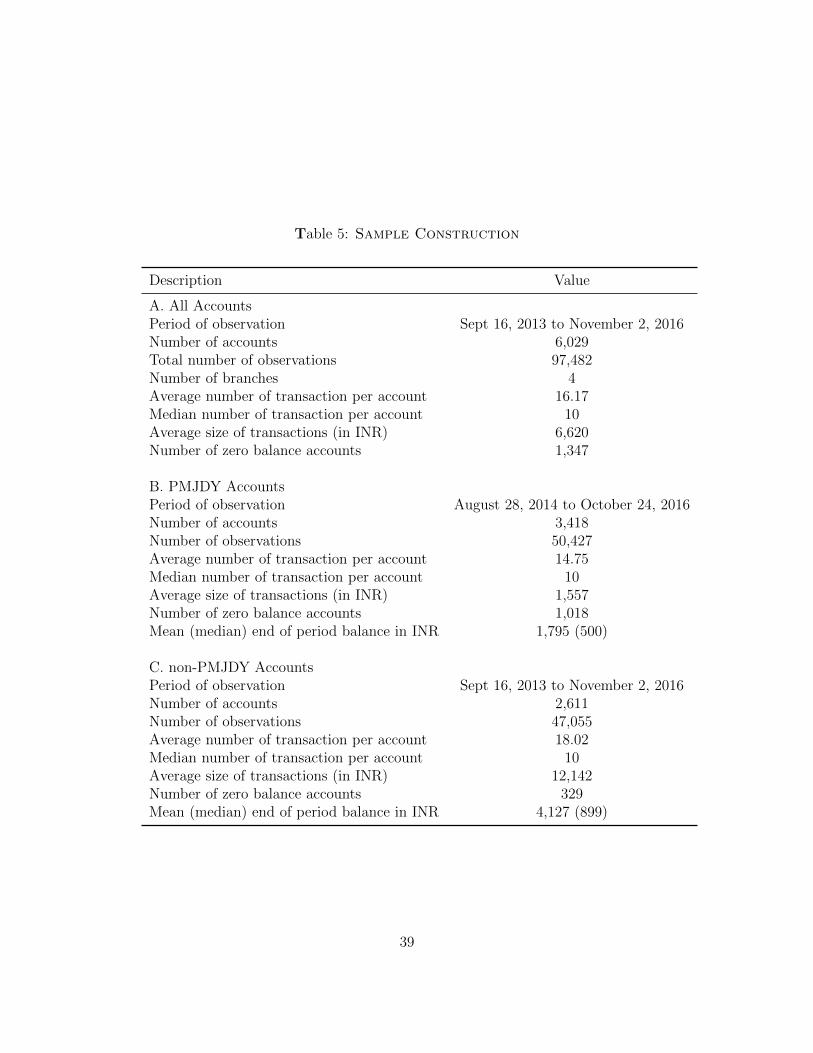
Table 5: Sample Construction
Description Value
A. All AccountsPeriod of observation Sept 16, 2013 to November 2, 2016Number of accounts 6,029Total number of observations 97,482Number of branches 4Average number of transaction per account 16.17Median number of transaction per account 10Average size of transactions (in INR) 6,620Number of zero balance accounts 1,347
B. PMJDY AccountsPeriod of observation August 28, 2014 to October 24, 2016Number of accounts 3,418Number of observations 50,427Average number of transaction per account 14.75Median number of transaction per account 10Average size of transactions (in INR) 1,557Number of zero balance accounts 1,018Mean (median) end of period balance in INR 1,795 (500)
C. non-PMJDY AccountsPeriod of observation Sept 16, 2013 to November 2, 2016Number of accounts 2,611Number of observations 47,055Average number of transaction per account 18.02Median number of transaction per account 10Average size of transactions (in INR) 12,142Number of zero balance accounts 329Mean (median) end of period balance in INR 4,127 (899)
39
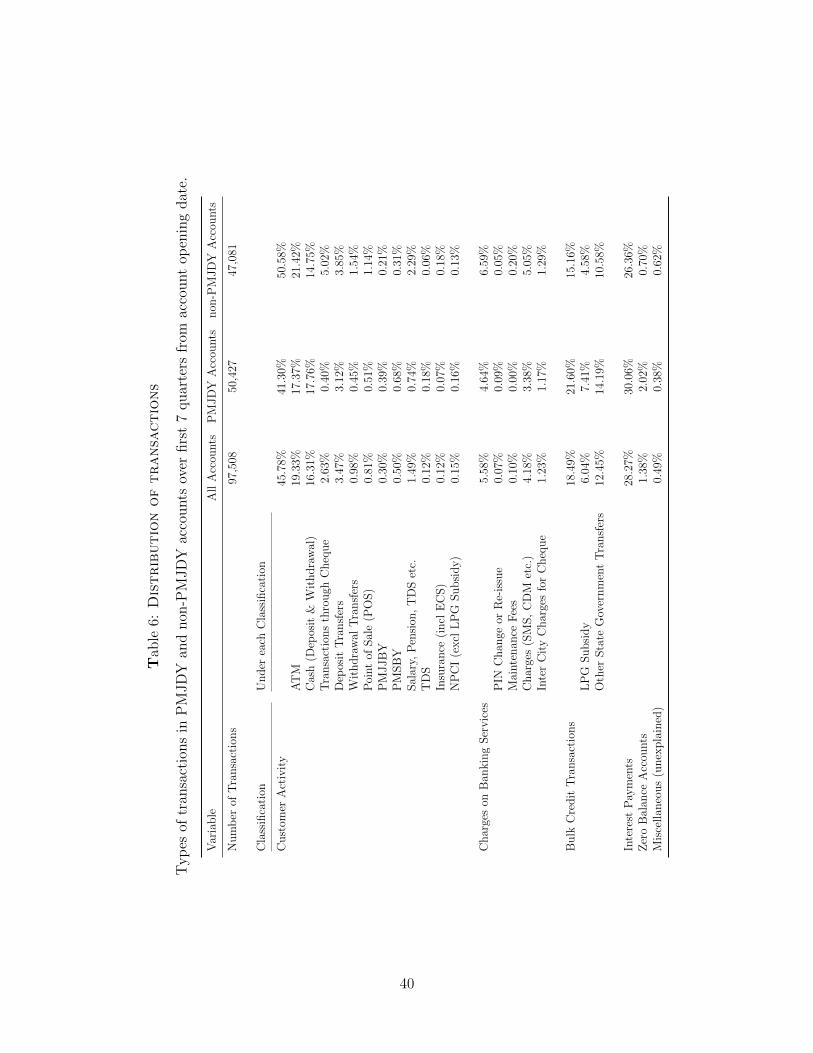
Tab
le6:
Distributionoftransactions
Typ
esof
tran
sactionsin
PMJD
Yan
dnon
-PMJD
Yaccountsover
first7qu
arters
from
account
openingdate.
Variable
AllAccou
nts
PMJD
YAccou
nts
non
-PMJD
YAccou
nts
Number
ofTransactions
97,508
50,427
47,081
Classification
Under
each
Classification
Custom
erActivity
45.78%
41.30%
50.58%
ATM
19.33%
17.37%
21.42%
Cash(D
eposit&
Withdrawal)
16.31%
17.76%
14.75%
Transactionsthrough
Cheque
2.63%
0.40%
5.02%
Dep
ositTransfers
3.47%
3.12%
3.85%
Withdrawal
Transfers
0.98%
0.45%
1.54%
Point
ofSale(P
OS)
0.81%
0.51%
1.14%
PMJJ
BY
0.30%
0.39%
0.21%
PMSBY
0.50%
0.68%
0.31%
Salary,
Pension
,TDSetc.
1.49%
0.74%
2.29%
TDS
0.12%
0.18%
0.06%
Insurance
(incl
ECS)
0.12%
0.07%
0.18%
NPCI(exclLPG
Subsidy)
0.15%
0.16%
0.13%
Chargeson
Ban
kingServices
5.58%
4.64%
6.59%
PIN
Chan
geor
Re-issue
0.07%
0.09%
0.05%
Maintenan
ceFees
0.10%
0.00%
0.20%
Charges(SMS,CDM
etc.)
4.18%
3.38%
5.05%
InterCityChargesforCheque
1.23%
1.17%
1.29%
Bulk
CreditTransactions
18.49%
21.60%
15.16%
LPG
Subsidy
6.04%
7.41%
4.58%
Other
State
GovernmentTransfers
12.45%
14.19%
10.58%
Interest
Payments
28.27%
30.06%
26.36%
ZeroBalan
ceAccou
nts
1.38%
2.02%
0.70%
Miscellan
eous(unexplained)
0.49%
0.38%
0.62%
40

Tab
le7:
NumberofTransactionsbyaccountageinquarters:PMJDY
Accounts
Tab
le7reports
thenu
mber
oftran
sactionsin
each
quartersince
account
opening.
For
each
tran
sactiontype,
rows(1)-(3)report
thenu
mber
oftran
sactions,
number
oftran
sactionsper
account
andtheratioof
thenu
mber
ofthetypeof
tran
sactionto
thetotal
number
oftran
sactionsin
thequ
arter.
Inthelast
row
oftheTab
le,wereporttotaltran
sactionsper
account
foragivenqu
arter.
Pan
elA:PMJD
YAccou
nts
Age
(inQuarters)
Variable
12
34
56
7Total
Number
ofAccou
nts
3,418
3,418
3,418
3,418
3,360
3,338
3,321
3,418
Classification
ActiveTransactions
2,102
2,427
2,912
3,086
3,031
3,540
3,728
20,826
0.61
0.71
0.85
0.90
0.90
1.06
1.12
6.09
43.95%
38.46%
37.71%
35.25%
44.61%
45.13%
45.36%
41.30%
Chargeson
Ban
kingServices
614
1,055
115
107
141
155
152
2,339
0.18
0.31
0.03
0.03
0.04
0.05
0.05
0.68
12.84%
16.72%
1.49%
1.22%
2.08%
1.98%
1.85%
4.64%
Bulk
CreditTransactions
410
1,237
1,858
1,400
1,675
2,061
2,253
10,894
0.12
0.36
0.54
0.41
0.50
0.62
0.68
3.19
8.57%
19.60%
24.06%
15.99%
24.65%
26.27%
27.42%
21.60%
Interest
Payments
619
1,558
2,815
4,133
1,920
2,063
2,051
15,159
0.18
0.46
0.82
1.21
0.57
0.62
0.62
4.44
12.94%
24.69%
36.45%
47.21%
28.26%
26.30%
24.96%
30.06%
41

Table7(continued)
Pan
elB:non
-PMJD
YAccou
nts
Age
(inQuarters)
Variable
12
34
56
7Total
Number
ofAccou
nts
1,475
1,475
1,475
1,475
1,418
1,329
1,309
1,475
Classification
ActiveTransactions
3,143
2,552
2,535
2,650
2,442
2,465
2,254
18,041
2.13
1.73
1.72
1.80
1.72
1.85
1.72
12.23
65.96%
49.92%
56.97%
46.44%
57.42%
56.28%
55.90%
55.17%
Chargeson
Ban
kingServices
235
806
248
306
233
305
304
2,437
0.16
0.55
0.17
0.21
0.16
0.23
0.23
1.65
4.93%
15.77%
5.57%
5.36%
5.48%
6.96%
7.54%
7.45%
Bulk
CreditTransactions
249
640
579
688
560
681
584
3,981
0.17
0.43
0.39
0.47
0.39
0.51
0.45
2.70
5.23%
12.52%
13.01%
12.06%
13.17%
15.55%
14.48%
12.18%
Interest
Payments
748
1,084
1,062
2,041
999
902
859
7,695
0.51
0.73
0.72
1.38
0.70
0.68
0.66
5.22
15.70%
21.21%
23.87%
35.77%
23.49%
20.59%
21.30%
23.53%
42
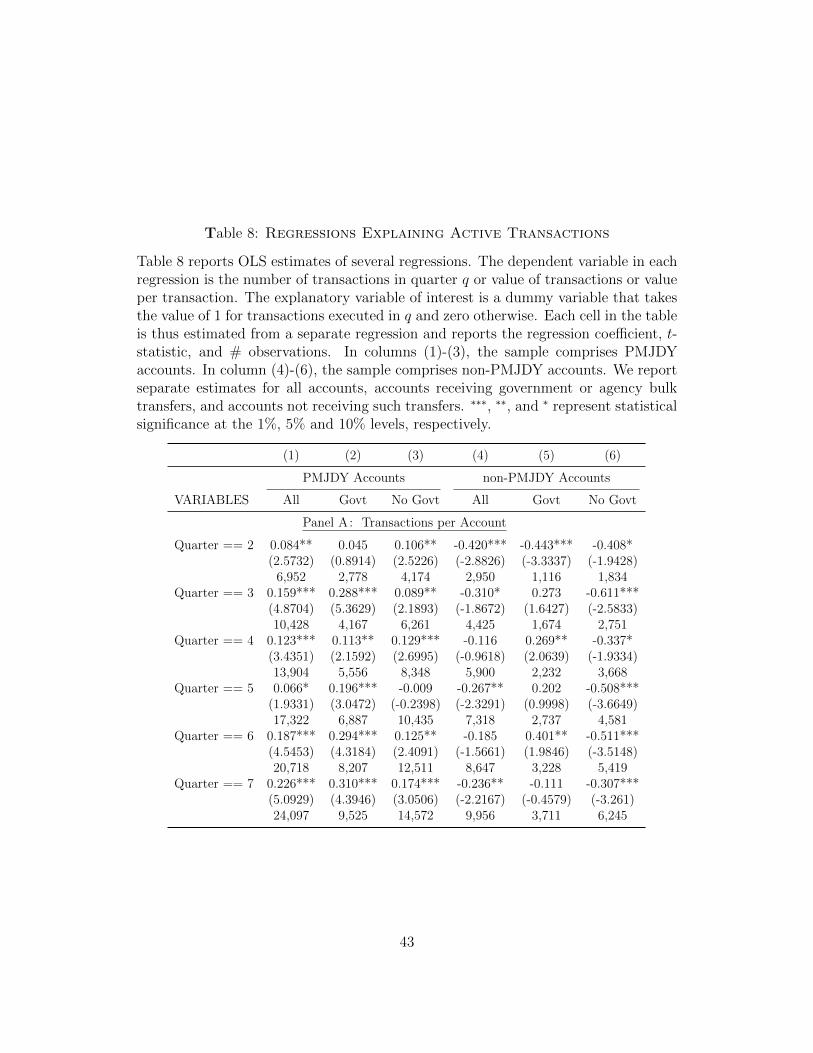
Table 8: Regressions Explaining Active Transactions
Table 8 reports OLS estimates of several regressions. The dependent variable in eachregression is the number of transactions in quarter q or value of transactions or valueper transaction. The explanatory variable of interest is a dummy variable that takesthe value of 1 for transactions executed in q and zero otherwise. Each cell in the tableis thus estimated from a separate regression and reports the regression coe�cient, t-statistic, and # observations. In columns (1)-(3), the sample comprises PMJDYaccounts. In column (4)-(6), the sample comprises non-PMJDY accounts. We reportseparate estimates for all accounts, accounts receiving government or agency bulktransfers, and accounts not receiving such transfers. ⇤⇤⇤, ⇤⇤, and ⇤ represent statisticalsignificance at the 1%, 5% and 10% levels, respectively.
(1) (2) (3) (4) (5) (6)
PMJDY Accounts non-PMJDY Accounts
VARIABLES All Govt No Govt All Govt No Govt
Panel A: Transactions per Account
Quarter == 2 0.084** 0.045 0.106** -0.420*** -0.443*** -0.408*(2.5732) (0.8914) (2.5226) (-2.8826) (-3.3337) (-1.9428)6,952 2,778 4,174 2,950 1,116 1,834
Quarter == 3 0.159*** 0.288*** 0.089** -0.310* 0.273 -0.611***(4.8704) (5.3629) (2.1893) (-1.8672) (1.6427) (-2.5833)10,428 4,167 6,261 4,425 1,674 2,751
Quarter == 4 0.123*** 0.113** 0.129*** -0.116 0.269** -0.337*(3.4351) (2.1592) (2.6995) (-0.9618) (2.0639) (-1.9334)13,904 5,556 8,348 5,900 2,232 3,668
Quarter == 5 0.066* 0.196*** -0.009 -0.267** 0.202 -0.508***(1.9331) (3.0472) (-0.2398) (-2.3291) (0.9998) (-3.6649)17,322 6,887 10,435 7,318 2,737 4,581
Quarter == 6 0.187*** 0.294*** 0.125** -0.185 0.401** -0.511***(4.5453) (4.3184) (2.4091) (-1.5661) (1.9846) (-3.5148)20,718 8,207 12,511 8,647 3,228 5,419
Quarter == 7 0.226*** 0.310*** 0.174*** -0.236** -0.111 -0.307***(5.0929) (4.3946) (3.0506) (-2.2167) (-0.4579) (-3.261)24,097 9,525 14,572 9,956 3,711 6,245
43

Table 8 (continued)
(1) (2) (3) (4) (5) (6)PMJDY Accounts non-PMJDY Accounts
VARIABLES All Govt No Govt All Govt No Govt
Panel B: Value per Account
Quarter == 2 1019 -567 1950* 27720 -5793 45043(1.1765) (-0.3653) (1.8944) (0.6348) (-0.917) (0.6806)6,952 2,778 4,174 2,950 1,116 1,834
Quarter == 3 891 609 1042 -25411 62630 -70663*(1.5252) (1.0017) (1.2463) (-0.7465) (0.9857) (-1.7736)10,428 4,167 6,261 4,425 1,674 2,751
Quarter == 4 -595* -378 -720 -445 25690 -15450(-1.6698) (-0.637) (-1.6135) (-0.0377) (1.269) (-1.0624)13,904 5,556 8,348 5,900 2,232 3,668
Quarter == 5 1091** 2710** 140 -13255 9140 -24751*(2.1388) (2.3101) (0.3298) (-1.1273) (0.3921) (-1.8801)17,322 6,887 10,435 7,318 2,737 4,581
Quarter == 6 655* 722 616 -3693 27474 -21001*(1.8182) (1.1174) (1.4387) (-0.35) (1.3995) (-1.7159)20,718 8,207 12,511 8,647 3,228 5,419
Quarter == 7 1910*** 1313 2279*** -14804* -21214 -11153(3.1379) (1.3703) (2.8961) (-1.6902) (-1.0709) (-1.4175)24,097 9,525 14,572 9,956 3,711 6,245
Panel C: Value per Transaction
Quarter == 2 302* 262 326* 8662 -698 13500(1.8238) (0.7995) (1.8145) (0.7985) (-0.5632) (0.8209)6,952 2,778 4,174 2,950 1,116 1,834
Quarter == 3 252* 82 343* -6180 3389 -11099(1.8305) (0.4405) (1.8399) (-1.0736) (0.7111) (-1.3268)10,428 4,167 6,261 4,425 1,674 2,751
Quarter == 4 -128 63 -238** 1050 2315 324(-1.5534) (0.4161) (-2.4624) (0.664) (1.109) (0.1482)13,904 5,556 8,348 5,900 2,232 3,668
Quarter == 5 240** 429** 129 -222 4719 -2758**(2.2484) (2.1186) (1.0692) (-0.1658) (1.4973) (-2.2751)17,322 6,887 10,435 7,318 2,737 4,581
Quarter == 6 123 227 63 48 2080 -1080(1.5275) (1.633) (0.6326) (0.0401) (0.9017) (-0.7888)20,718 8,207 12,511 8,647 3,228 5,419
Quarter == 7 281** 440** 183 -732 -105 -1088(2.512) (2.0475) (1.4859) (-1.1623) (-0.1155) (-1.2934)24,097 9,525 14,572 9,956 3,711 6,245
44
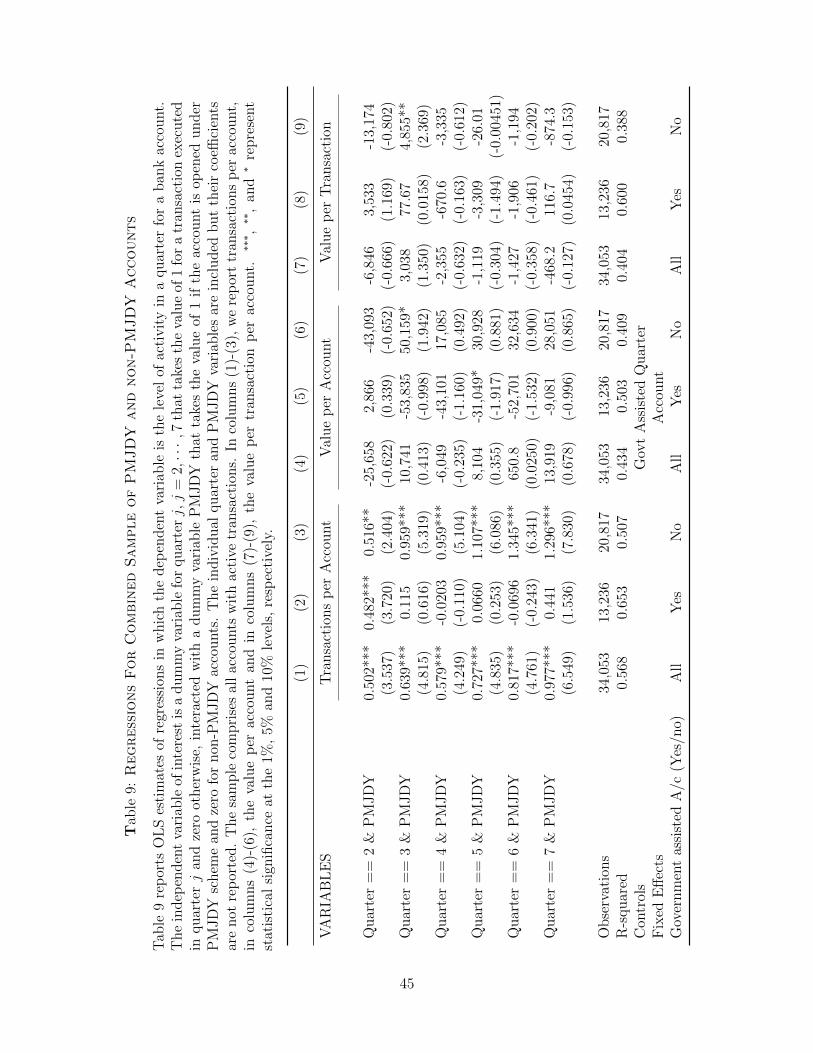
Tab
le9:
RegressionsForCombined
SampleofPMJDY
and
non-PMJDY
Accounts
Tab
le9reports
OLSestimates
ofregression
sin
whichthedep
endentvariab
leisthelevelof
activity
inaqu
arterforaban
kaccount.
Theindep
endentvariab
leof
interest
isadummyvariab
leforqu
arterj,
j=
2,···,
7that
takesthevalueof
1foratran
sactionexecuted
inqu
arterjan
dzero
otherwise,
interacted
withadummyvariab
lePMJD
Ythat
takesthevalueof
1iftheaccount
isop
ened
under
PMJD
Yschem
ean
dzero
fornon
-PMJD
Yaccounts.
Theindividual
quarteran
dPMJD
Yvariab
lesareincluded
buttheircoe�
cients
arenot
reported.Thesamplecomprisesallaccountswithactive
tran
sactions.
Incolumns(1)-(3),wereporttran
sactionsper
account,
incolumns(4)-(6),
thevalueper
account
andin
columns(7)-(9),
thevalueper
tran
sactionper
account.
⇤⇤⇤ ,
⇤⇤,an
d⇤represent
statisticalsign
ificance
atthe1%
,5%
and10%
levels,respectively.
(1)
(2)
(3)
(4)
(5)
(6)
(7)
(8)
(9)
VARIA
BLES
Transactionsper
Accou
ntValueper
Accou
ntValueper
Transaction
Quarter==
2&
PMJD
Y0.502***
0.482***
0.516**
-25,658
2,866
-43,093
-6,846
3,533
-13,174
(3.537)
(3.720)
(2.404)
(-0.622)
(0.339)
(-0.652)
(-0.666)
(1.169)
(-0.802)
Quarter==
3&
PMJD
Y0.639***
0.115
0.959***
10,741
-53,835
50,159*
3,038
77.67
4,855**
(4.815)
(0.616)
(5.319)
(0.413)
(-0.998)
(1.942)
(1.350)
(0.0158)
(2.369)
Quarter==
4&
PMJD
Y0.579***
-0.0203
0.959***
-6,049
-43,101
17,085
-2,355
-670.6
-3,335
(4.249)
(-0.110)
(5.104)
(-0.235)
(-1.160)
(0.492)
(-0.632)
(-0.163)
(-0.612)
Quarter==
5&
PMJD
Y0.727***
0.0660
1.107***
8,104
-31,049*
30,928
-1,119
-3,309
-26.01
(4.835)
(0.253)
(6.086)
(0.355)
(-1.917)
(0.881)
(-0.304)
(-1.494)
(-0.00451)
Quarter==
6&
PMJD
Y0.817***
-0.0696
1.345***
650.8
-52,701
32,634
-1,427
-1,906
-1,194
(4.761)
(-0.243)
(6.341)
(0.0250)
(-1.532)
(0.900)
(-0.358)
(-0.461)
(-0.202)
Quarter==
7&
PMJD
Y0.977***
0.441
1.296***
13,919
-9,081
28,051
-468.2
116.7
-874.3
(6.549)
(1.536)
(7.830)
(0.678)
(-0.996)
(0.865)
(-0.127)
(0.0454)
(-0.153)
Observations
34,053
13,236
20,817
34,053
13,236
20,817
34,053
13,236
20,817
R-squ
ared
0.568
0.653
0.507
0.434
0.503
0.409
0.404
0.600
0.388
Con
trols
GovtAssistedQuarter
Fixed
E↵ects
Accou
ntGovernmentassisted
A/c
(Yes/n
o)All
Yes
No
All
Yes
No
All
Yes
No
45
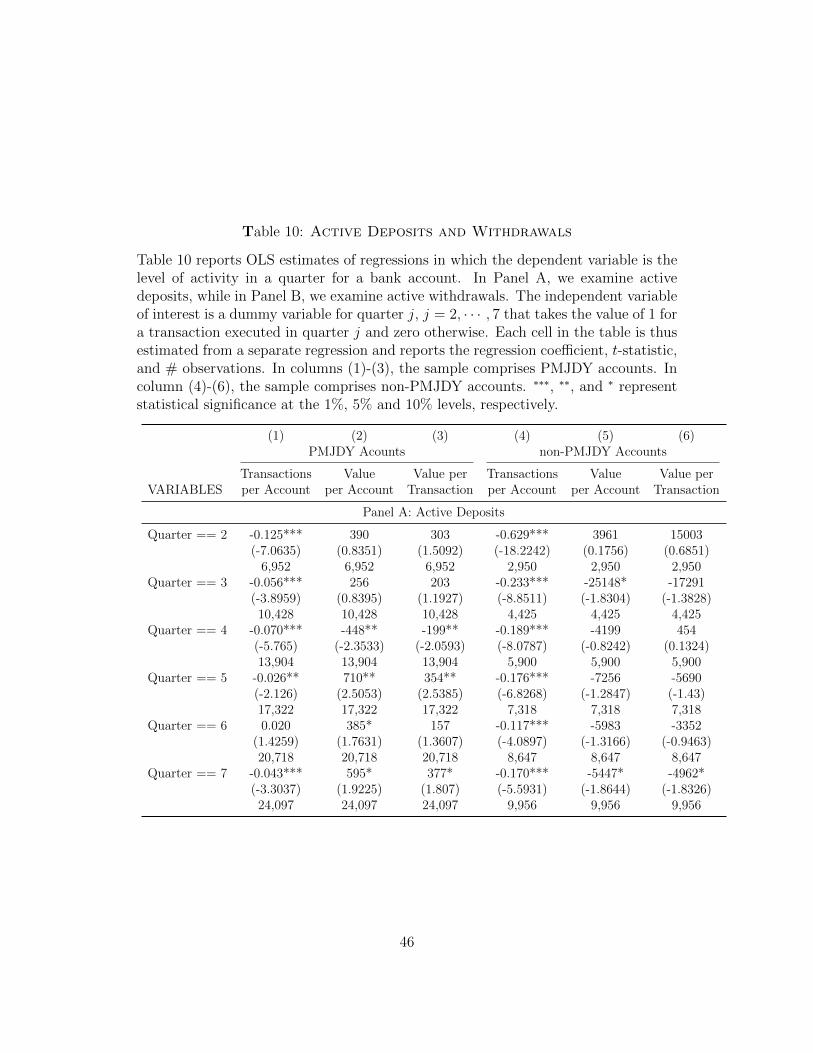
Table 10: Active Deposits and Withdrawals
Table 10 reports OLS estimates of regressions in which the dependent variable is thelevel of activity in a quarter for a bank account. In Panel A, we examine activedeposits, while in Panel B, we examine active withdrawals. The independent variableof interest is a dummy variable for quarter j, j = 2, · · · , 7 that takes the value of 1 fora transaction executed in quarter j and zero otherwise. Each cell in the table is thusestimated from a separate regression and reports the regression coe�cient, t-statistic,and # observations. In columns (1)-(3), the sample comprises PMJDY accounts. Incolumn (4)-(6), the sample comprises non-PMJDY accounts. ⇤⇤⇤, ⇤⇤, and ⇤ representstatistical significance at the 1%, 5% and 10% levels, respectively.
(1) (2) (3) (4) (5) (6)PMJDY Acounts non-PMJDY Accounts
Transactions Value Value per Transactions Value Value perVARIABLES per Account per Account Transaction per Account per Account Transaction
Panel A: Active Deposits
Quarter == 2 -0.125*** 390 303 -0.629*** 3961 15003(-7.0635) (0.8351) (1.5092) (-18.2242) (0.1756) (0.6851)6,952 6,952 6,952 2,950 2,950 2,950
Quarter == 3 -0.056*** 256 203 -0.233*** -25148* -17291(-3.8959) (0.8395) (1.1927) (-8.8511) (-1.8304) (-1.3828)10,428 10,428 10,428 4,425 4,425 4,425
Quarter == 4 -0.070*** -448** -199** -0.189*** -4199 454(-5.765) (-2.3533) (-2.0593) (-8.0787) (-0.8242) (0.1324)13,904 13,904 13,904 5,900 5,900 5,900
Quarter == 5 -0.026** 710** 354** -0.176*** -7256 -5690(-2.126) (2.5053) (2.5385) (-6.8268) (-1.2847) (-1.43)17,322 17,322 17,322 7,318 7,318 7,318
Quarter == 6 0.020 385* 157 -0.117*** -5983 -3352(1.4259) (1.7631) (1.3607) (-4.0897) (-1.3166) (-0.9463)20,718 20,718 20,718 8,647 8,647 8,647
Quarter == 7 -0.043*** 595* 377* -0.170*** -5447* -4962*(-3.3037) (1.9225) (1.807) (-5.5931) (-1.8644) (-1.8326)24,097 24,097 24,097 9,956 9,956 9,956
46

Table 10 (continued)
(1) (2) (3) (4) (5) (6)PMJDY Acounts non-PMJDY Accounts
Transactions Value Value per Transactions Value Value perVARIABLES per Account per Account Transaction per Account per Account Transaction
Panel B: Active Withdrawals
Quarter == 2 0.209*** 629 179 0.208 23759 7228(9.5534) (1.5036) (1.0282) (1.5077) (1.0868) (1.0003)6,952 6,952 6,952 2,950 2,950 2,950
Quarter == 3 0.216*** 634** 203 -0.077 -263 -2873(9.1834) (2.0878) (1.5793) (-0.4935) (-0.0105) (-0.7161)10,428 10,428 10,428 4,425 4,425 4,425
Quarter == 4 0.194*** -147 -118 0.072 3754 1352(6.7617) (-0.7975) (-1.393) (0.6549) (0.4384) (1.0417)13,904 13,904 13,904 5,900 5,900 5,900
Quarter == 5 0.092*** 381 40 -0.090 -5998 1601(3.4695) (1.5634) (0.4562) (-0.8852) (-0.7748) (1.2928)17,322 17,322 17,322 7,318 7,318 7,318
Quarter == 6 0.167*** 270 39 -0.068 2290 -194(5.2093) (1.513) (0.5222) (-0.6619) (0.2916) (-0.2089)20,718 20,718 20,718 8,647 8,647 8,647
Quarter == 7 0.269*** 1315*** 325*** -0.066 -9357 365(7.2945) (3.889) (2.8521) (-0.7756) (-1.257) (0.663)24,097 24,097 24,097 9,956 9,956 9,956
47
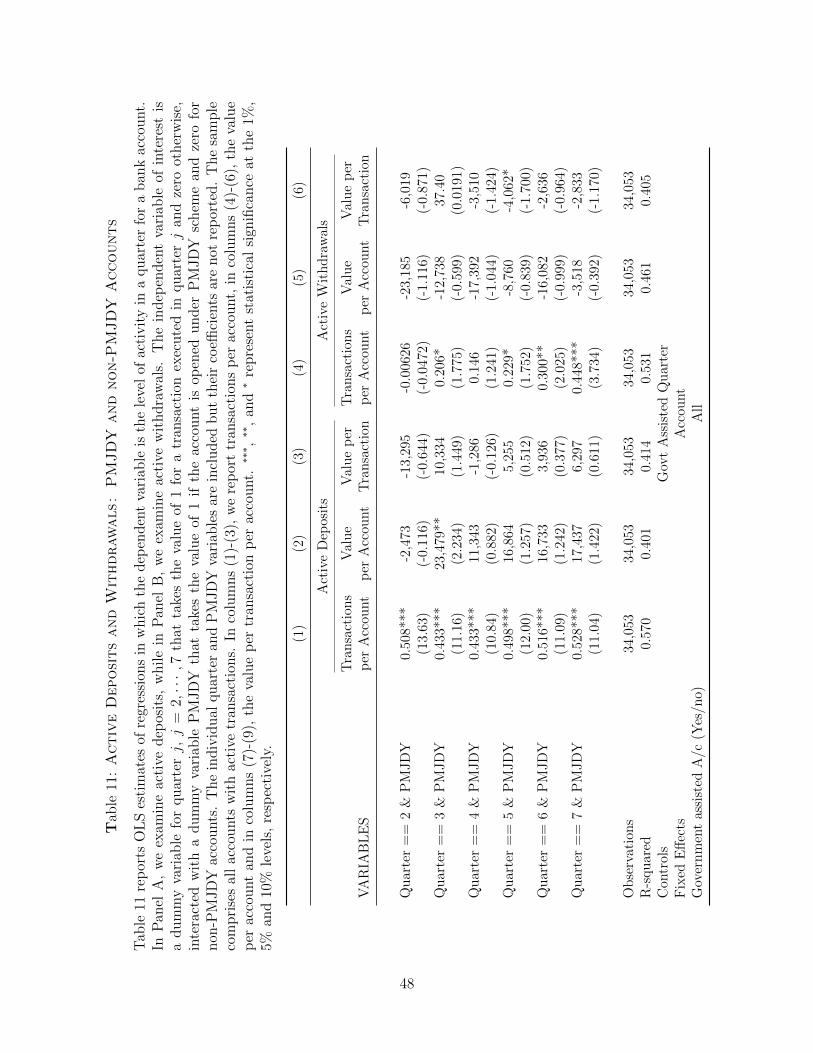
Tab
le11:ActiveDepositsand
Withdrawals:PMJDY
and
non-PMJDY
Accounts
Tab
le11
reports
OLSestimates
ofregression
sin
whichthedep
endentvariab
leisthelevelof
activity
inaqu
arterforaban
kaccount.
InPan
elA,weexam
ineactive
dep
osits,
whilein
Pan
elB,weexam
ineactive
withdrawals.
Theindep
endentvariab
leof
interest
isadummyvariab
leforqu
arterj,
j=
2,···,
7that
takesthevalueof
1foratran
sactionexecutedin
quarterjan
dzero
otherwise,
interacted
withadummyvariab
lePMJD
Ythat
takesthevalueof
1iftheaccount
isop
ened
under
PMJD
Yschem
ean
dzero
for
non
-PMJD
Yaccounts.
Theindividual
quarteran
dPMJD
Yvariab
lesareincluded
buttheircoe�
cients
arenot
reported.Thesample
comprisesallaccountswithactive
tran
sactions.
Incolumns(1)-(3),wereporttran
sactionsper
account,in
columns(4)-(6),thevalue
per
account
andin
columns(7)-(9),thevalueper
tran
sactionper
account.
⇤⇤⇤ ,
⇤⇤,an
d⇤represent
statisticalsign
ificance
atthe1%
,5%
and10%
levels,respectively.
(1)
(2)
(3)
(4)
(5)
(6)
ActiveDep
osits
ActiveW
ithdrawals
Transactions
Value
Valueper
Transactions
Value
Valueper
VARIA
BLES
per
Accou
ntper
Accou
ntTransaction
per
Accou
ntper
Accou
ntTransaction
Quarter==
2&
PMJD
Y0.508***
-2,473
-13,295
-0.00626
-23,185
-6,019
(13.63)
(-0.116)
(-0.644)
(-0.0472)
(-1.116)
(-0.871)
Quarter==
3&
PMJD
Y0.433***
23,479**
10,334
0.206*
-12,738
37.40
(11.16)
(2.234)
(1.449)
(1.775)
(-0.599)
(0.0191)
Quarter==
4&
PMJD
Y0.433***
11,343
-1,286
0.146
-17,392
-3,510
(10.84)
(0.882)
(-0.126)
(1.241)
(-1.044)
(-1.424)
Quarter==
5&
PMJD
Y0.498***
16,864
5,255
0.229*
-8,760
-4,062*
(12.00)
(1.257)
(0.512)
(1.752)
(-0.839)
(-1.700)
Quarter==
6&
PMJD
Y0.516***
16,733
3,936
0.300**
-16,082
-2,636
(11.09)
(1.242)
(0.377)
(2.025)
(-0.999)
(-0.964)
Quarter==
7&
PMJD
Y0.528***
17,437
6,297
0.448***
-3,518
-2,833
(11.04)
(1.422)
(0.611)
(3.734)
(-0.392)
(-1.170)
Observations
34,053
34,053
34,053
34,053
34,053
34,053
R-squ
ared
0.570
0.401
0.414
0.531
0.461
0.405
Con
trols
GovtAssistedQuarter
Fixed
E↵ects
Accou
ntGovernmentassisted
A/c
(Yes/n
o)All
48
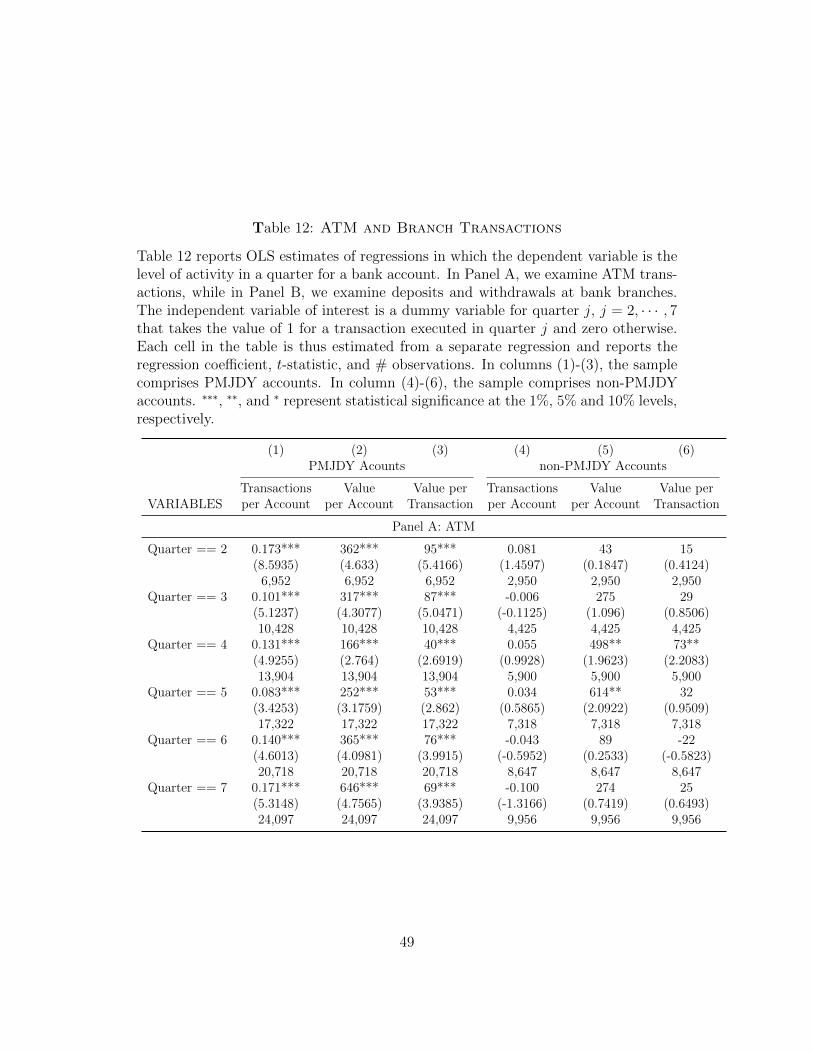
Table 12: ATM and Branch Transactions
Table 12 reports OLS estimates of regressions in which the dependent variable is thelevel of activity in a quarter for a bank account. In Panel A, we examine ATM trans-actions, while in Panel B, we examine deposits and withdrawals at bank branches.The independent variable of interest is a dummy variable for quarter j, j = 2, · · · , 7that takes the value of 1 for a transaction executed in quarter j and zero otherwise.Each cell in the table is thus estimated from a separate regression and reports theregression coe�cient, t-statistic, and # observations. In columns (1)-(3), the samplecomprises PMJDY accounts. In column (4)-(6), the sample comprises non-PMJDYaccounts. ⇤⇤⇤, ⇤⇤, and ⇤ represent statistical significance at the 1%, 5% and 10% levels,respectively.
(1) (2) (3) (4) (5) (6)PMJDY Acounts non-PMJDY Accounts
Transactions Value Value per Transactions Value Value perVARIABLES per Account per Account Transaction per Account per Account Transaction
Panel A: ATM
Quarter == 2 0.173*** 362*** 95*** 0.081 43 15(8.5935) (4.633) (5.4166) (1.4597) (0.1847) (0.4124)6,952 6,952 6,952 2,950 2,950 2,950
Quarter == 3 0.101*** 317*** 87*** -0.006 275 29(5.1237) (4.3077) (5.0471) (-0.1125) (1.096) (0.8506)10,428 10,428 10,428 4,425 4,425 4,425
Quarter == 4 0.131*** 166*** 40*** 0.055 498** 73**(4.9255) (2.764) (2.6919) (0.9928) (1.9623) (2.2083)13,904 13,904 13,904 5,900 5,900 5,900
Quarter == 5 0.083*** 252*** 53*** 0.034 614** 32(3.4253) (3.1759) (2.862) (0.5865) (2.0922) (0.9509)17,322 17,322 17,322 7,318 7,318 7,318
Quarter == 6 0.140*** 365*** 76*** -0.043 89 -22(4.6013) (4.0981) (3.9915) (-0.5952) (0.2533) (-0.5823)20,718 20,718 20,718 8,647 8,647 8,647
Quarter == 7 0.171*** 646*** 69*** -0.100 274 25(5.3148) (4.7565) (3.9385) (-1.3166) (0.7419) (0.6493)24,097 24,097 24,097 9,956 9,956 9,956
49
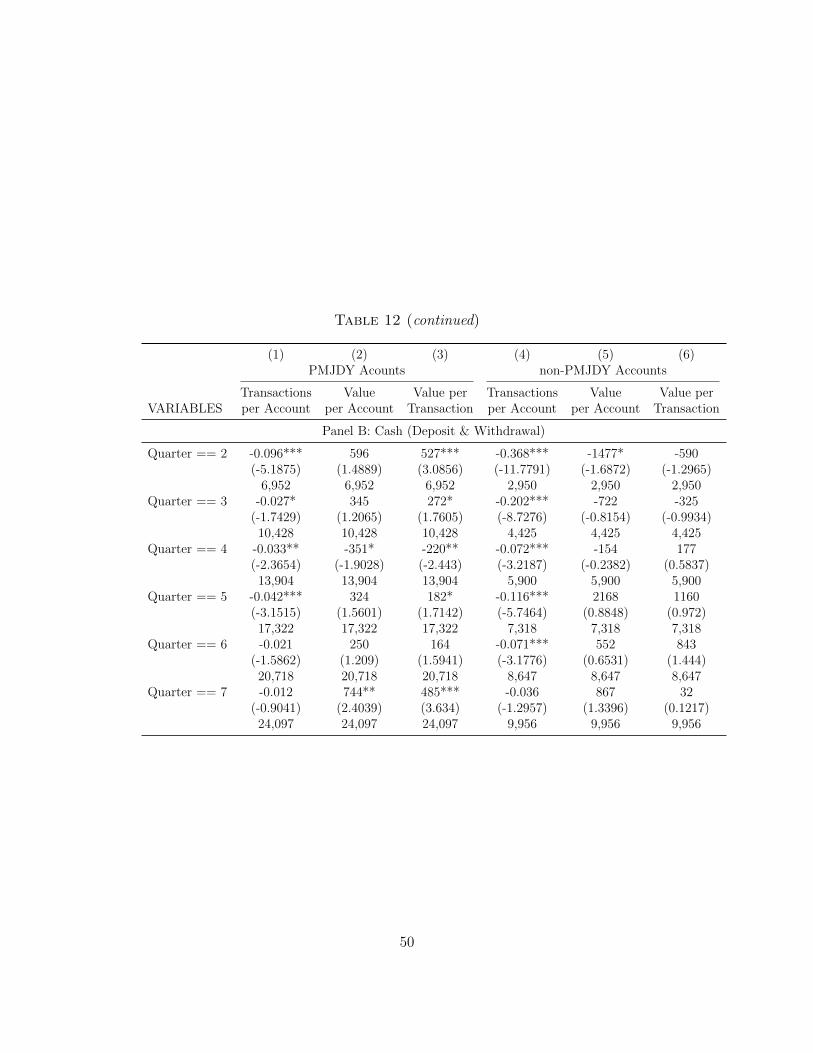
Table 12 (continued)
(1) (2) (3) (4) (5) (6)PMJDY Acounts non-PMJDY Accounts
Transactions Value Value per Transactions Value Value perVARIABLES per Account per Account Transaction per Account per Account Transaction
Panel B: Cash (Deposit & Withdrawal)
Quarter == 2 -0.096*** 596 527*** -0.368*** -1477* -590(-5.1875) (1.4889) (3.0856) (-11.7791) (-1.6872) (-1.2965)6,952 6,952 6,952 2,950 2,950 2,950
Quarter == 3 -0.027* 345 272* -0.202*** -722 -325(-1.7429) (1.2065) (1.7605) (-8.7276) (-0.8154) (-0.9934)10,428 10,428 10,428 4,425 4,425 4,425
Quarter == 4 -0.033** -351* -220** -0.072*** -154 177(-2.3654) (-1.9028) (-2.443) (-3.2187) (-0.2382) (0.5837)13,904 13,904 13,904 5,900 5,900 5,900
Quarter == 5 -0.042*** 324 182* -0.116*** 2168 1160(-3.1515) (1.5601) (1.7142) (-5.7464) (0.8848) (0.972)17,322 17,322 17,322 7,318 7,318 7,318
Quarter == 6 -0.021 250 164 -0.071*** 552 843(-1.5862) (1.209) (1.5941) (-3.1776) (0.6531) (1.444)20,718 20,718 20,718 8,647 8,647 8,647
Quarter == 7 -0.012 744** 485*** -0.036 867 32(-0.9041) (2.4039) (3.634) (-1.2957) (1.3396) (0.1217)24,097 24,097 24,097 9,956 9,956 9,956
50
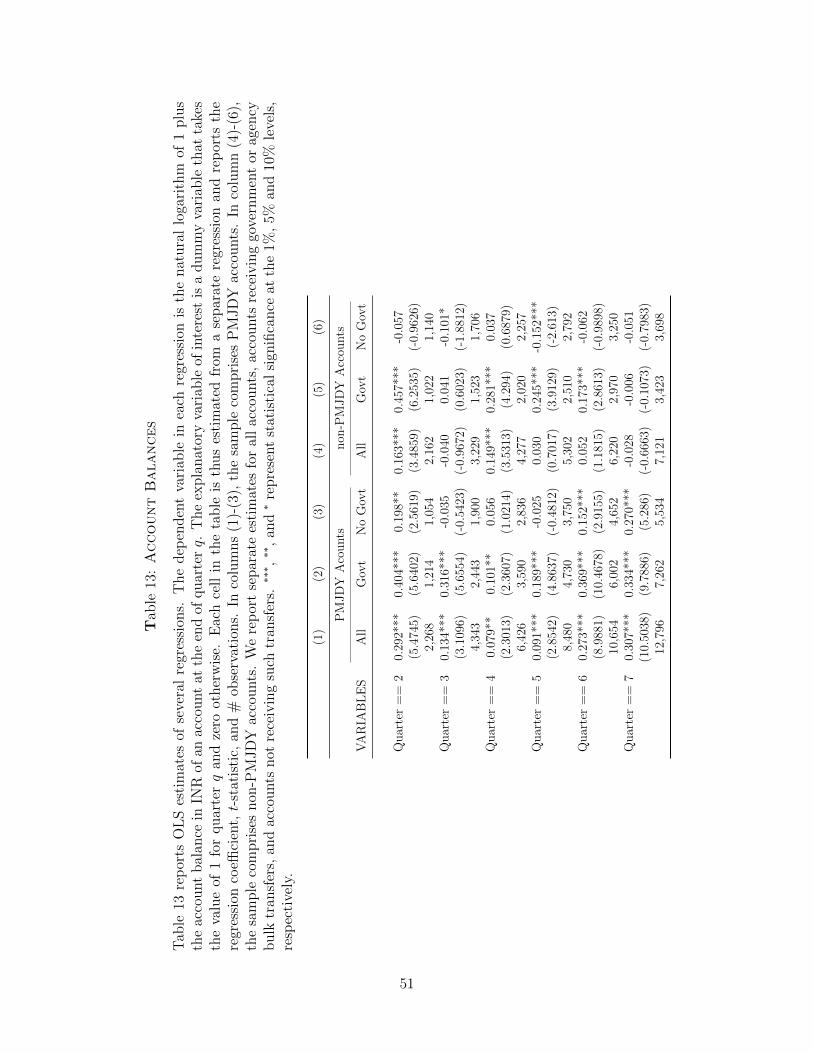
Tab
le13:AccountBalances
Tab
le13
reports
OLSestimates
ofseveralregression
s.Thedep
endentvariab
lein
each
regression
isthenaturallogarithm
of1plus
theaccount
balan
cein
INR
ofan
account
attheendof
quarterq.
Theexplanatoryvariab
leof
interest
isadummyvariab
lethat
takes
thevalueof
1forqu
arterqan
dzero
otherwise.
Eachcellin
thetable
isthusestimated
from
aseparateregression
andreports
the
regression
coe�
cient,t-statistic,
and#
observations.
Incolumns(1)-(3),thesample
comprisesPMJD
Yaccounts.
Incolumn(4)-(6),
thesample
comprisesnon
-PMJD
Yaccounts.
Wereportseparateestimates
forallaccounts,accountsreceivinggovernmentor
agency
bulk
tran
sfers,an
daccountsnot
receivingsuch
tran
sfers.
⇤⇤⇤ ,
⇤⇤,an
d⇤represent
statisticalsign
ificance
atthe1%
,5%
and10%
levels,
respectively.
(1)
(2)
(3)
(4)
(5)
(6)
PMJD
YAcounts
non
-PMJD
YAccou
nts
VARIA
BLES
All
Govt
NoGovt
All
Govt
NoGovt
Quarter==
20.292***
0.404***
0.198**
0.163***
0.457***
-0.057
(5.4745)
(5.6402)
(2.5619)
(3.4859)
(6.2535)
(-0.9626)
2,268
1,214
1,054
2,162
1,022
1,140
Quarter==
30.134***
0.316***
-0.035
-0.040
0.041
-0.101*
(3.1096)
(5.6554)
(-0.5423)
(-0.9672)
(0.6023)
(-1.8812)
4,343
2,443
1,900
3,229
1,523
1,706
Quarter==
40.079**
0.101**
0.056
0.149***
0.281***
0.037
(2.3013)
(2.3607)
(1.0214)
(3.5313)
(4.294)
(0.6879)
6,426
3,590
2,836
4,277
2,020
2,257
Quarter==
50.091***
0.189***
-0.025
0.030
0.245***
-0.152***
(2.8542)
(4.8637)
(-0.4812)
(0.7017)
(3.9129)
(-2.613)
8,480
4,730
3,750
5,302
2,510
2,792
Quarter==
60.273***
0.369***
0.152***
0.052
0.173***
-0.062
(8.9881)
(10.4678)
(2.9155)
(1.1815)
(2.8613)
(-0.9898)
10,654
6,002
4,652
6,220
2,970
3,250
Quarter==
70.307***
0.334***
0.270***
-0.028
-0.006
-0.051
(10.5038)
(9.7886)
(5.286)
(-0.6663)
(-0.1073)
(-0.7983)
12,796
7,262
5,534
7,121
3,423
3,698
51
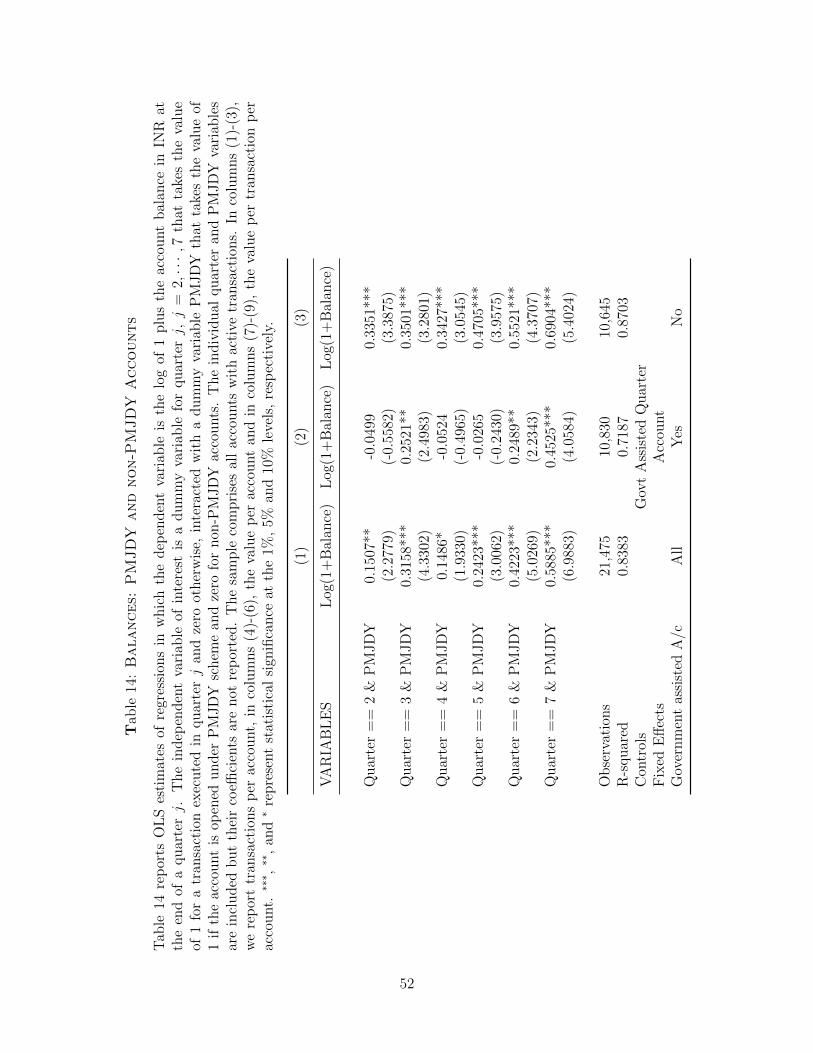
Tab
le14:Balances:PMJDY
and
non-PMJDY
Accounts
Tab
le14
reports
OLSestimates
ofregression
sin
whichthedep
endentvariab
leis
thelogof
1plustheaccount
balan
cein
INR
attheendof
aqu
arterj.
Theindep
endentvariab
leof
interest
isadummyvariab
leforqu
arterj,
j=
2,···,
7that
takesthevalue
of1foratran
sactionexecutedin
quarterjan
dzero
otherwise,
interacted
withadummyvariab
lePMJD
Ythat
takesthevalueof
1iftheaccount
isop
ened
under
PMJD
Yschem
ean
dzero
fornon
-PMJD
Yaccounts.
Theindividual
quarteran
dPMJD
Yvariab
les
areincluded
buttheircoe�
cients
arenot
reported.Thesample
comprisesallaccountswithactive
tran
sactions.
Incolumns(1)-(3),
wereporttran
sactionsper
account,in
columns(4)-(6),
thevalueper
account
andin
columns(7)-(9),
thevalueper
tran
sactionper
account.
⇤⇤⇤ ,
⇤⇤,an
d⇤represent
statisticalsign
ificance
atthe1%
,5%
and10%
levels,respectively.
(1)
(2)
(3)
VARIA
BLES
Log(1+Balan
ce)
Log(1+Balan
ce)
Log(1+Balan
ce)
Quarter==
2&
PMJD
Y0.1507**
-0.0499
0.3351***
(2.2779)
(-0.5582)
(3.3875)
Quarter==
3&
PMJD
Y0.3158***
0.2521**
0.3501***
(4.3302)
(2.4983)
(3.2801)
Quarter==
4&
PMJD
Y0.1486*
-0.0524
0.3427***
(1.9330)
(-0.4965)
(3.0545)
Quarter==
5&
PMJD
Y0.2423***
-0.0265
0.4705***
(3.0062)
(-0.2430)
(3.9575)
Quarter==
6&
PMJD
Y0.4223***
0.2489**
0.5521***
(5.0269)
(2.2343)
(4.3707)
Quarter==
7&
PMJD
Y0.5885***
0.4525***
0.6904***
(6.9883)
(4.0584)
(5.4024)
Observations
21,475
10,830
10,645
R-squ
ared
0.8383
0.7187
0.8703
Con
trols
GovtAssistedQuarter
Fixed
E↵ects
Accou
ntGovernmentassisted
A/c
All
Yes
No
52
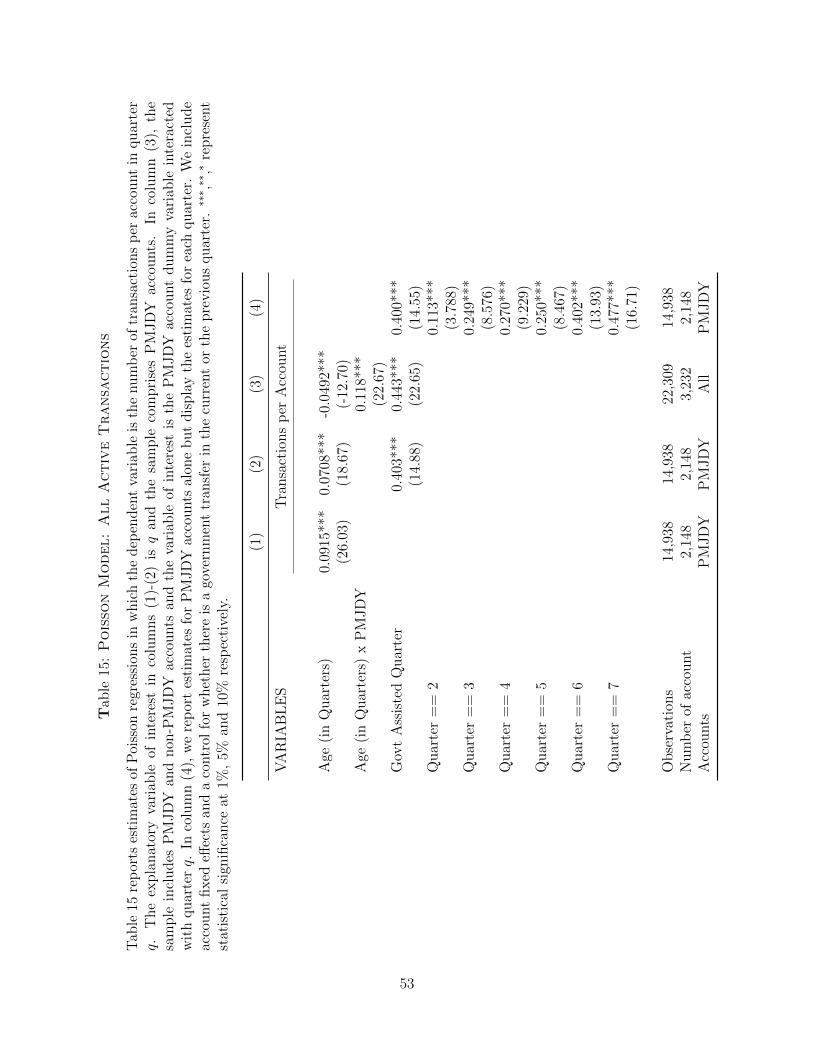
Tab
le15:PoissonModel:AllActiveTransactions
Tab
le15
reports
estimates
ofPoisson
regression
sin
whichthedep
endentvariab
leisthenu
mber
oftran
sactionsper
account
inqu
arter
q.Theexplanatoryvariab
leof
interest
incolumns(1)-(2)is
qan
dthesample
comprisesPMJD
Yaccounts.
Incolumn(3),
the
sample
includes
PMJD
Yan
dnon
-PMJD
Yaccountsan
dthevariab
leof
interest
isthePMJD
Yaccount
dummyvariab
leinteracted
withqu
arterq.
Incolumn(4),wereportestimates
forPMJD
Yaccountsalon
ebutdisplaytheestimates
foreach
quarter.
Weinclude
account
fixede↵
ects
andacontrolforwhether
thereisagovernmenttran
sfer
inthecurrentor
thepreviou
squ
arter.
⇤⇤⇤ ,
⇤⇤,⇤represent
statisticalsign
ificance
at1%
,5%
and10%
respectively.
(1)
(2)
(3)
(4)
VARIA
BLES
Transactionsper
Accou
nt
Age
(inQuarters)
0.0915***
0.0708***
-0.0492***
(26.03)
(18.67)
(-12.70)
Age
(inQuarters)xPMJD
Y0.118***
(22.67)
GovtAssistedQuarter
0.403***
0.443***
0.400***
(14.88)
(22.65)
(14.55)
Quarter==
20.113***
(3.788)
Quarter==
30.249***
(8.576)
Quarter==
40.270***
(9.229)
Quarter==
50.250***
(8.467)
Quarter==
60.402***
(13.93)
Quarter==
70.477***
(16.71)
Observations
14,938
14,938
22,309
14,938
Number
ofaccount
2,148
2,148
3,232
2,148
Accou
nts
PMJD
YPMJD
YAll
PMJD
Y
53

Tab
le16:PoissonModel:ByTransactionType
Tab
le16
reports
estimates
ofPoisson
regression
s.In
columns(1)-(4),
thedep
endentvariab
leis
thenu
mber
ofdep
osit
tran
sactions
per
account
inqu
arterq.
Incolumns(5)-(8),thedep
endentvariab
leisthenu
mber
ofactive
withdrawals.
Theexplanatoryvariab
leof
interest
incolumns(1)-(2)an
d(5)-(6)isqan
dthesample
comprisesPMJD
Yaccounts.
Incolumns(3)an
d(7),thesample
includes
PMJD
Yan
dnon
-PMJD
Yaccountsan
dthevariab
leof
interest
isthePMJD
Yaccount
dummyvariab
leinteracted
withqu
arterq.
Incolumns(4)an
d(8),wereportestimates
forPMJD
Yaccountsalon
ebutdisplaytheestimates
foreach
quarter.
Weincludeaccount
fixede↵
ects
andacontrolfor
whether
thereisagovernmenttran
sfer
inthecurrentor
thepreviou
squ
arter.
⇤⇤⇤ ,
⇤⇤,⇤represent
statistical
sign
ificance
at1%
,5%
and10%
respectively. (1
)(2)
(3)
(4)
(5)
(6)
(7)
(8)
VARIA
BLES
Transactionsper
Accou
nt
ActiveDep
osits
ActiveW
ithdrawals
Age
(inQuarters)
-0.0641***
-0.0535***
-0.129***
0.178***
0.146***
-0.00853*
(-10.80)
(-8.565)
(-18.92)
(39.71)
(30.07)
(-1.793)
Age
(inQuarters)xPMJD
Y0.0709***
0.153***
(7.924)
(23.46)
GovtAssistedQuarter
-0.271***
-0.158***
-0.232***
0.597***
0.620***
0.529***
(-5.168)
(-4.109)
(-4.431)
(17.90)
(26.30)
(15.51)
Quarter==
2-0.355***
0.787***
(-8.761)
(16.11)
Quarter==
3-0.376***
1.034***
(-9.084)
(21.87)
Quarter==
4-0.522***
1.134***
(-11.87)
(24.05)
Quarter==
5-0.430***
1.068***
(-9.984)
(22.46)
Quarter==
6-0.279***
1.230***
(-6.640)
(26.21)
Quarter==
7-0.484***
1.399***
(-10.95)
(30.23)
Observations
13,778
13,778
21,060
13,778
11,341
11,341
16,696
11,341
Number
ofaccount
1,982
1,982
3,052
1,982
1,627
1,627
2,406
1,627
Accou
nts
PMJD
YPMJD
YAll
PMJD
YPMJD
YPMJD
YAll
PMJD
Y
54
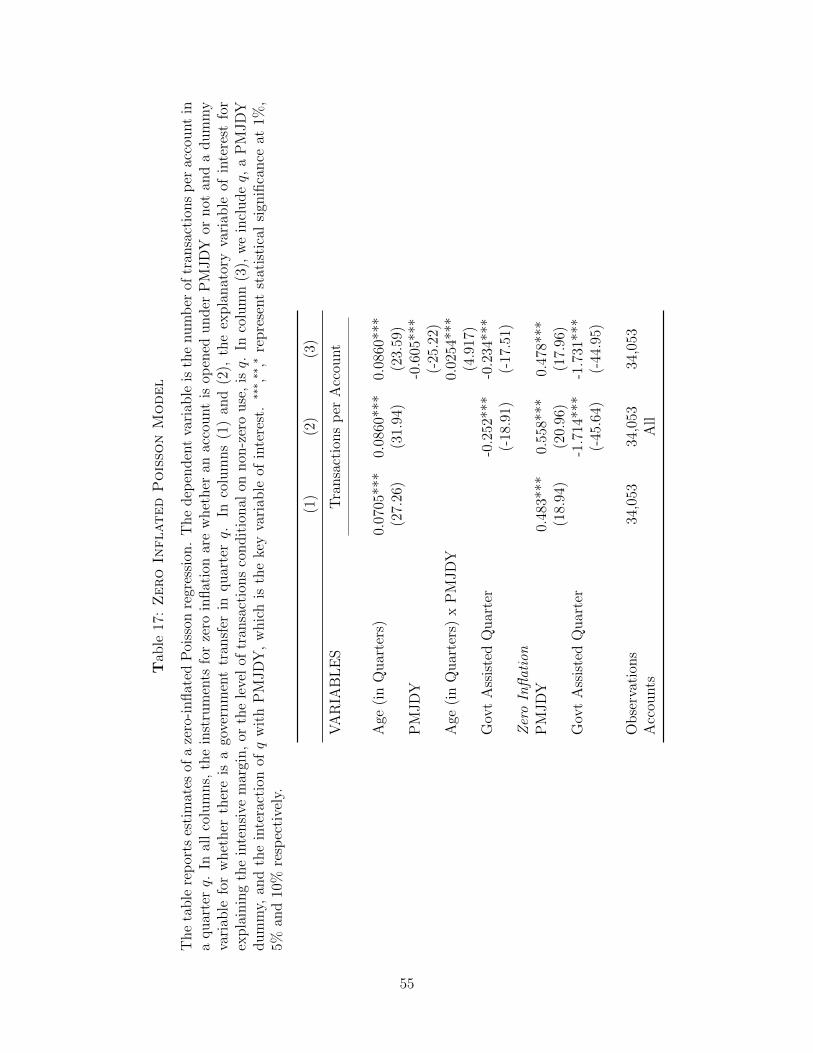
Tab
le17:Zero
Inflated
PoissonModel
Thetablereports
estimates
ofazero-inflated
Poisson
regression
.Thedep
endentvariab
leisthenu
mber
oftran
sactionsper
account
inaqu
arterq.
Inallcolumns,theinstruments
forzero
inflationarewhether
anaccount
isop
ened
under
PMJD
Yor
not
andadummy
variab
leforwhether
thereis
agovernmenttran
sfer
inqu
arterq.
Incolumns(1)an
d(2),
theexplanatoryvariab
leof
interest
for
explainingtheintensive
margin,or
thelevelof
tran
sactionsconditional
onnon
-zerouse,isq.
Incolumn(3),weincludeq,
aPMJD
Ydummy,
andtheinteractionof
qwithPMJD
Y,whichis
thekeyvariab
leof
interest.
⇤⇤⇤ ,
⇤⇤,⇤
represent
statisticalsign
ificance
at1%
,5%
and10%
respectively.
(1)
(2)
(3)
VARIA
BLES
Transactionsper
Accou
nt
Age
(inQuarters)
0.0705***
0.0860***
0.0860***
(27.26)
(31.94)
(23.59)
PMJD
Y-0.605***
(-25.22)
Age
(inQuarters)xPMJD
Y0.0254***
(4.917)
GovtAssistedQuarter
-0.252***
-0.234***
(-18.91)
(-17.51)
ZeroInflation
PMJD
Y0.483***
0.558***
0.478***
(18.94)
(20.96)
(17.96)
GovtAssistedQuarter
-1.714***
-1.731***
(-45.64)
(-44.95)
Observations
34,053
34,053
34,053
Accou
nts
All
55

Figure 1: Percentage of zero balance versus total number of accounts opened
56

Figure 2: Kaplan Meier Survival Estimates for the hazard of account
becoming active
57
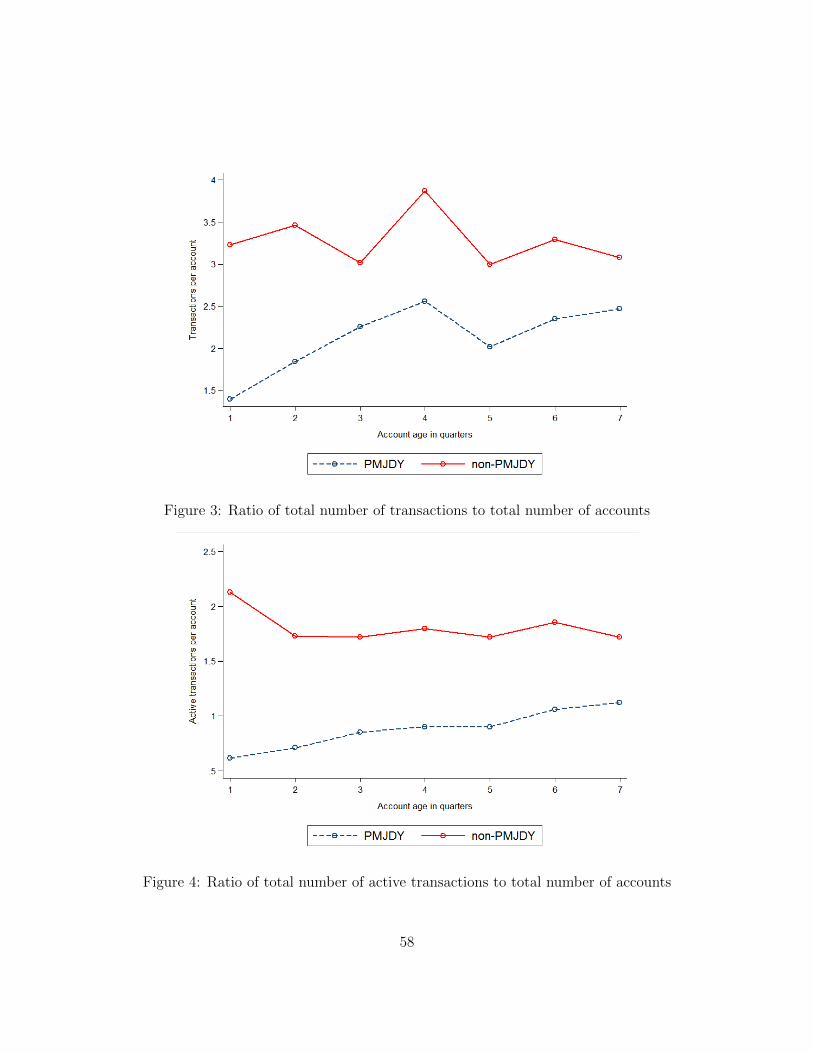
Figure 3: Ratio of total number of transactions to total number of accounts
Figure 4: Ratio of total number of active transactions to total number of accounts
58
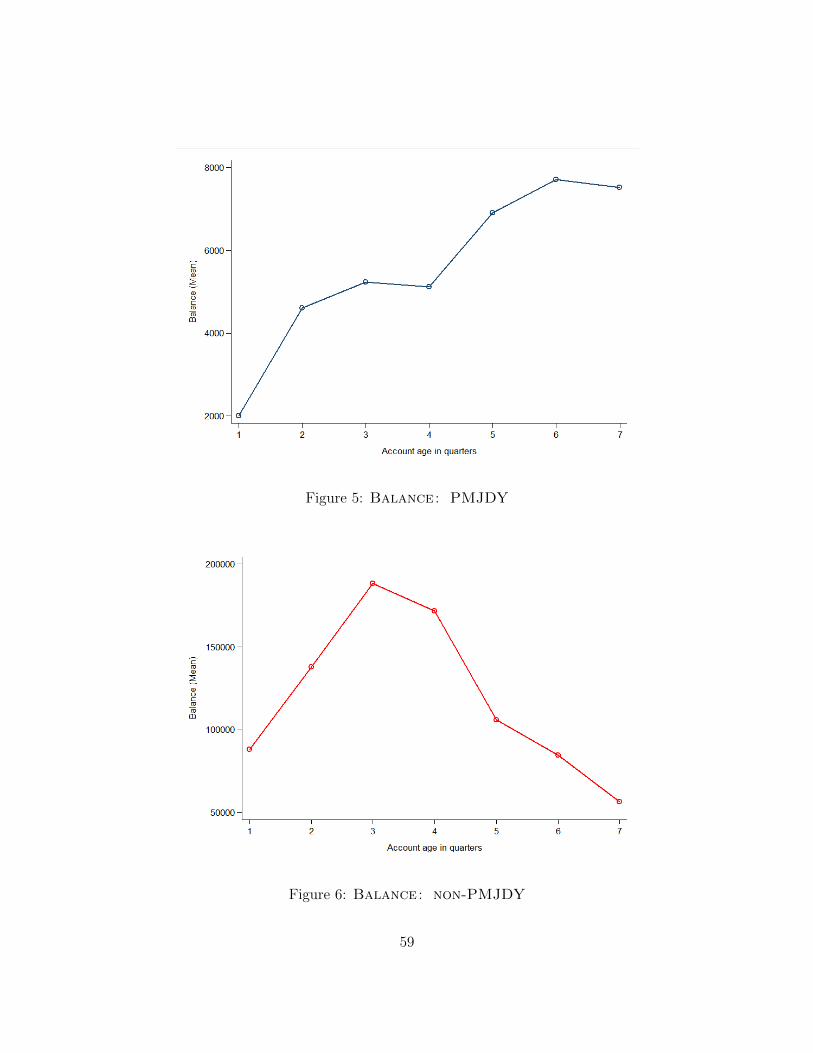
Figure 5: Balance : PMJDY
Figure 6: Balance : non-PMJDY
59