BANCA TRANSILVANIA 2015 Financial Results · Cost to income was negatively influenced by one-off...
25
BANCA TRANSILVANIA 2015 Financial Results
Transcript of BANCA TRANSILVANIA 2015 Financial Results · Cost to income was negatively influenced by one-off...

BANCA TRANSILVANIA
2015 Financial Results
The information contained in the present document has not been independently verified and
no representation or warranty expressed or implied is made as to, and no reliance should be
placed on the fairness, accuracy, completeness or correctness of this information or opinions
contained herein.
Banca Transilvania cautions readers that no forward-looking statement that may be contained
in the present document is a guarantee of future performance and that actual results could
differ materially from those contained in the forward-looking statements. Forward-looking
statements speak only as of the date they are made, and Banca Transilvania undertakes no
obligation to update publicly any of them in light of new information or future events.
None of Banca Transilvania or any of its affiliates, advisors or representatives shall have any
liability for any loss howsoever arising from any use of this document or its content or
otherwise arising in connection with this document.
The present document does not constitute a public offer under any applicable legislation or an
offer to sell or solicitation of any offer to buy any securities or financial instruments or any
advice or recommendation with respect to such securities or other financial instruments.
DISCLAIMER
2

AGENDA
Banking Sector Dynamics
2015 Preliminary highlights
Performance in 2015
Overview of Business Lines
BT Financial Group
1
2
3
4
5
3

ROMANIAN BANKING SECTOR – 2015
briefing
● The Romanian banking system stays solid:
● average CAR at 18.7%
● NPL ratio markedly improved to less than 12% from cca. 22% in 2013
● The non-government loans rose by 3.6% ytd, as the increase of the RON
component (by 20.6% ytd) counterbalanced the decline of the FX
component (by 9.7%)
BANKING SECTOR DYNAMICS 2015 highlights PERFORMANCE IN 2015 OVERVIEW OF BUSINESS LINES BT FINANCIAL GROUP
4

21.6% 21.9%
20.4%
19.2%
15.3%
13.9% 13.9%
12.8%12.3%
3Q13 4Q13 1Q14 2Q14 3Q14 4Q14 1Q15 2Q15 3Q15
NPL ratio, % source: NBR
354
362
353 352351
364
361
363
360
-5.3%
-0.9% -1.0%-0.7% -0.6%
0.5%
2.4%
3.1%
2.3%
340
345
350
355
360
365
-6%
-4%
-2%
0%
2%
4%
6%
8%
3Q13 4Q13 1Q14 2Q14 3Q14 4Q14 1Q15 2Q15 3Q15
total bank net assets source: NBR
BANK ASSETS RECOVERING AT A 2-3% ANNUAL
RATE
net assets
in RONbn
net assets
%YoY
Bank assets recovering at a
relatively stable annual growth
rate
NPL numbers have
continuously improved during
2015
BANKING SECTOR DYNAMICS 2015 highlights PERFORMANCE IN 2015 OVERVIEW OF BUSINESS LINES BT FINANCIAL GROUP
5
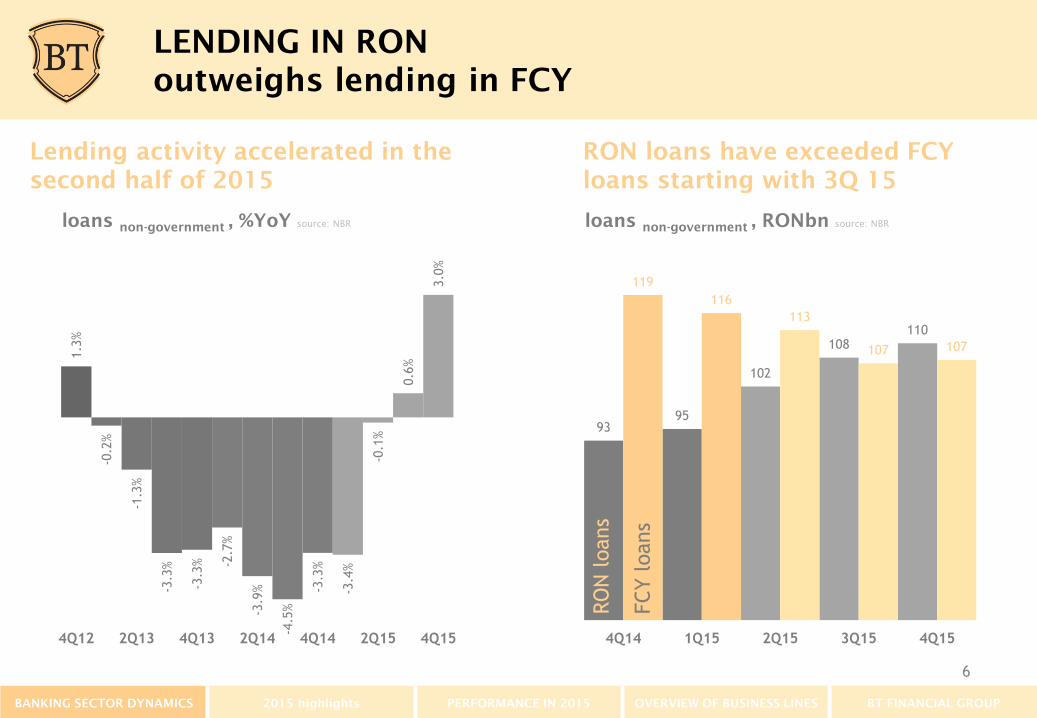
LENDING IN RON
outweighs lending in FCY
9395
102
108110
119
116
113
107 107
6000%
7000%
8000%
9000%
10000%
11000%
12000%
13000%
4Q14 1Q15 2Q15 3Q15 4Q15
loans non-government
, RONbn source: NBR
RO
N l
oans
FCY l
oans
Lending activity accelerated in the
second half of 2015
RON loans have exceeded FCY
loans starting with 3Q 15
1.3
%
-0.2
%
-1.3
%
-3.3
%
-3.3
% -2.7
%
-3.9
%
-4.5
%
-3.3
%
-3.4
%
-0.1
%
0.6
%
3.0
%
-5%
-4%
-3%
-2%
-1%
0%
1%
2%
3%
4%
4Q12 2Q13 4Q13 2Q14 4Q14 2Q15 4Q15
loans non-government
, %YoY source: NBR
BANKING SECTOR DYNAMICS 2015 highlights PERFORMANCE IN 2015 OVERVIEW OF BUSINESS LINES BT FINANCIAL GROUP
6
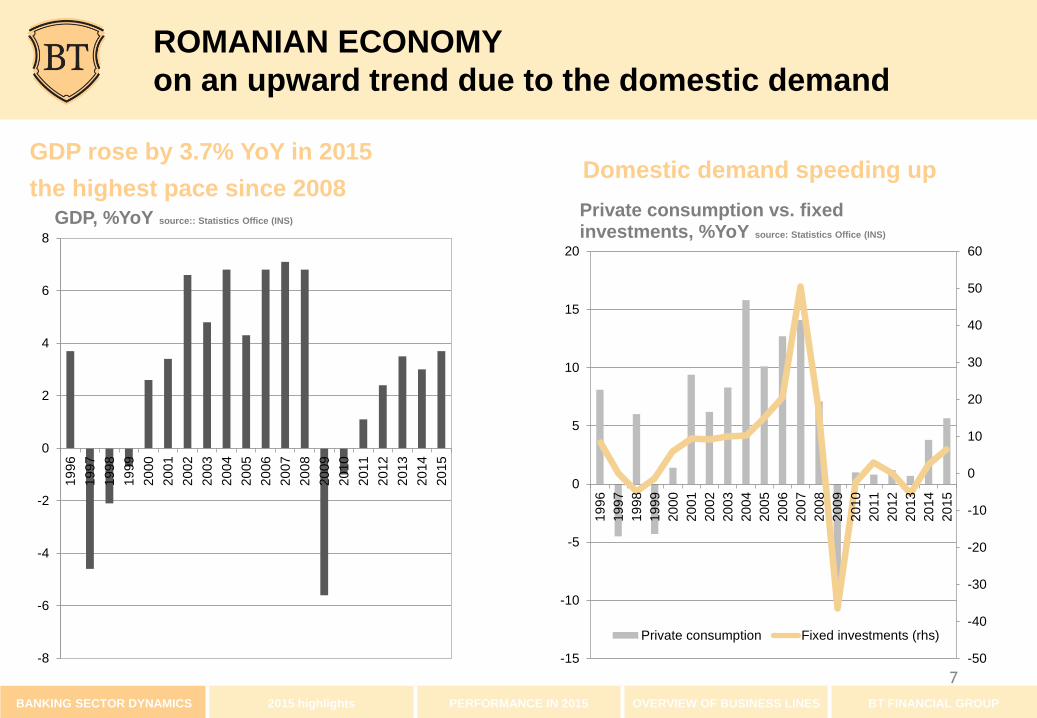
ROMANIAN ECONOMY
on an upward trend due to the domestic demand
GDP rose by 3.7% YoY in 2015
the highest pace since 2008Domestic demand speeding up
BANKING SECTOR DYNAMICS 2015 highlights PERFORMANCE IN 2015 OVERVIEW OF BUSINESS LINES BT FINANCIAL GROUP
-8
-6
-4
-2
0
2
4
6
8
19
96
19
97
19
98
19
99
20
00
20
01
20
02
20
03
20
04
20
05
20
06
20
07
20
08
20
09
20
10
20
11
20
12
20
13
20
14
20
15
GDP, %YoY source:: Statistics Office (INS)
-50
-40
-30
-20
-10
0
10
20
30
40
50
60
-15
-10
-5
0
5
10
15
20
19
96
19
97
19
98
19
99
20
00
20
01
20
02
20
03
20
04
20
05
20
06
20
07
20
08
20
09
20
10
20
11
20
12
20
13
20
14
20
15
Private consumption vs. fixed investments, %YoY source: Statistics Office (INS)
Private consumption Fixed investments (rhs)
7

HIGH MACRO-FINANCIAL STABILITY
before the introduction of the Fiscal Act
Decline of the consumer prices due to
VAT cut
C/A and public finance deficits close
to record low levels
BANKING SECTOR DYNAMICS 2015 highlights PERFORMANCE IN 2015 OVERVIEW OF BUSINESS LINES BT FINANCIAL GROUP
-3.0
-2.0
-1.0
0.0
1.0
2.0
3.0
4.0
5.0
6.0
7.0
Jan-1
3
Ma
r-1
3
Ma
y-1
3
Jul-1
3
Sep-1
3
No
v-1
3
Jan-1
4
Ma
r-1
4
Ma
y-1
4
Jul-1
4
Sep-1
4
No
v-1
4
Jan-1
5
Ma
r-1
5
Ma
y-1
5
Jul-1
5
Sep-1
5
No
v-1
5
consumer prices, %YOY source: Statistics Office (INS)
-16.0
-14.0
-12.0
-10.0
-8.0
-6.0
-4.0
-2.0
0.0
2001
2002
2003
2004
2005
2006
2007
2008
2009
2010
2011
2012
2013
2014
2015
C/A vs. budget deficits (%GDP) source: NBR,
Ministry of Finance
Current account (% GDP) Budget balance (% GDP)
8

BANKING SECTOR DYNAMICS 2015 HIGHLIGHTS PERFORMANCE IN 2015 OVERVIEW OF BUSINESS LINES BT FINANCIAL GROUP
Banca Transilvania’s
business development and
financial performance
at the end of 2015
9

YTD Dec’15 Highlights
PR
OF
ITA
BIL
ITY
Mil. RONYTD Dec'15
(unaudited)
YTD Dec'14
(audited)∆
Operating income 2,286.2 2,000.5 14.3%
Operating expenses (1,341.9) (828.4) 62.0%
Bargaining gain 1,650.6
Gross profit before provisions 2,594.9 1,172.1 121.4%
Net income 2,418.0 434.3 456.7%
EPS RON 0.80 0.15 448.6%
Cost of risk (%) 1.16% 3.3% -65.1%
NIM (%) 3.1% 3.4% -0.3 pp
ROE without Bargaining gain (%) 18.6% 12.8% 5.8 pp
ROE with Bargaining gain (%) 45.4%
Cost-to-income ratio (%) without Bargaining gain 58.7% 41.4% 17.3 pp
Cost-to-income ratio (%) with Bargaining gain 34.1% 34.1 pp
CR
ED
ITA
CT
IVIT
Y
Dec-15 Dec-14 ∆
Gross loans to customers 28,790.6 20,020.0 43.8%
Deposits from customers 38,395.3 30,045.5 27.8%
Loans-to-deposits ratio 75.0% 66.6% 8.4 pp
NPL ratio 9.7% 10.9% -1.1 pp
CA
PIT
A
L
Dec-15 Dec-14 ∆
Total equity 6,016.4 3,702.0 62.5%
Tier 1 capital ratio (profit included) 21.2% 15.5%
Total capital ratio (profit included) 22.6% 17.3%
10
BANKING SECTOR DYNAMICS 2015 HIGHLIGHTS PERFORMANCE IN 2015 OVERVIEW OF BUSINESS LINES BT FINANCIAL GROUP

BUSINESS PERFORMANCE 2015
at a glance
BANKING SECTOR DYNAMICS 2015 HIGHLIGHTS PERFORMANCE IN 2015 OVERVIEW OF BUSINESS LINES BT FINANCIAL GROUP
Total assets at RON 47.2 bn
32.6% YTD
● Organic growth of loan portfolio in 2015 disregarding VBRO acquisition
● Boost due to VBRO acquisition
● Significant growth of customer deposits
Capital adequacy ratio at 22.6% ● Strong capital base, supporting organic and non organic growth
Net fees and commissions at RON
457.6 mn 12.0% Y/Y● Driven by increased number of operations and additional cross-sell
CoR on a sound path
by 50.0% Y/Y
● Positively affected by the fair value adjustments estimated for the loan
portfolio transferred from VBRO, as well as the positive effect of other
programs at Volksbank level
● CoR at 1.16% as compared to 3.3% as of end of 2014
Net profit at
RON 2,418 mn 500% Y/Y
● Operating income positively influenced by increase in commission income
and trading income
● Net profit reflects the 9 months result of VBRO and also the bargaining gain
linked to the acquisition
Cost/income at 58.7%
● Cost to income was negatively influenced by one-off type of expenses linked
to VBRO integration
● Without the 9 months results of VBRO and without one-offs cost to income is
below 50%
11

PROFIT&LOSS ACCOUNT STRUCTURE
434
71
667
828
328
127
408
-153
329271
179
458
1.651
+41,5%
Net profitCost of risk
1.138
-17,5%
+456,7%
-50,6%
+12,0%
+62,0%
Bargaining gain
Operating expenses
Net interest income
Net fee and commission
income
Net trading income
Other net operating
income
1.342
-315,7%
2.418
+21,2%
Income tax
1.379
YTD Dec’14 YTD Dec’15
12
BANKING SECTOR DYNAMICS 2015 HIGHLIGHTS PERFORMANCE IN 2015 OVERVIEW OF BUSINESS LINES BT FINANCIAL GROUP

LOAN STRUCTURE
Loans to households 2 times higher
than in 2014
Higher proportion of investment
loans to companies
*SMEs identified according to internal classification rules
Dec’15
14,33
8,87
5,42
0,04
Dec’14
7,47
4,73
2,70
0,04
consumptionhousingothers
Loans to Households, RONbn
9,97
2,58
Dec’15
14,46
11,26
3,20
Dec’14
12,55
large corporatesSMEs
Loans to Companies, RONbn
39%61%
RON FX
Loans to Households, RONbnLoans to Companies, RONbn
23%77%
RON FX13
BANKING SECTOR DYNAMICS 2015 HIGHLIGHTS PERFORMANCE IN 2015 OVERVIEW OF BUSINESS LINES BT FINANCIAL GROUP

DEPOSIT STRUCTURE
Deposits from households
continue the growth path
Deposits from companies remain
stable
*SMEs identified according to internal classification rules
18,6
15,7
2,95,1
23,3
18,2
Dec’14 Dec’15
Current accountsDeposits
Deposits from Households, RONbn
9,9
11,4
Dec’15
7,8
Dec’14
5,23,6
15,1
large corporates SMEs
Deposits from Companies, RONbn
43%57%
RON FX
21%79%
RON FX
Deposits from Households, RONbn Deposits from Companies, RONbn
14
BANKING SECTOR DYNAMICS 2015 HIGHLIGHTS PERFORMANCE IN 2015 OVERVIEW OF BUSINESS LINES BT FINANCIAL GROUP
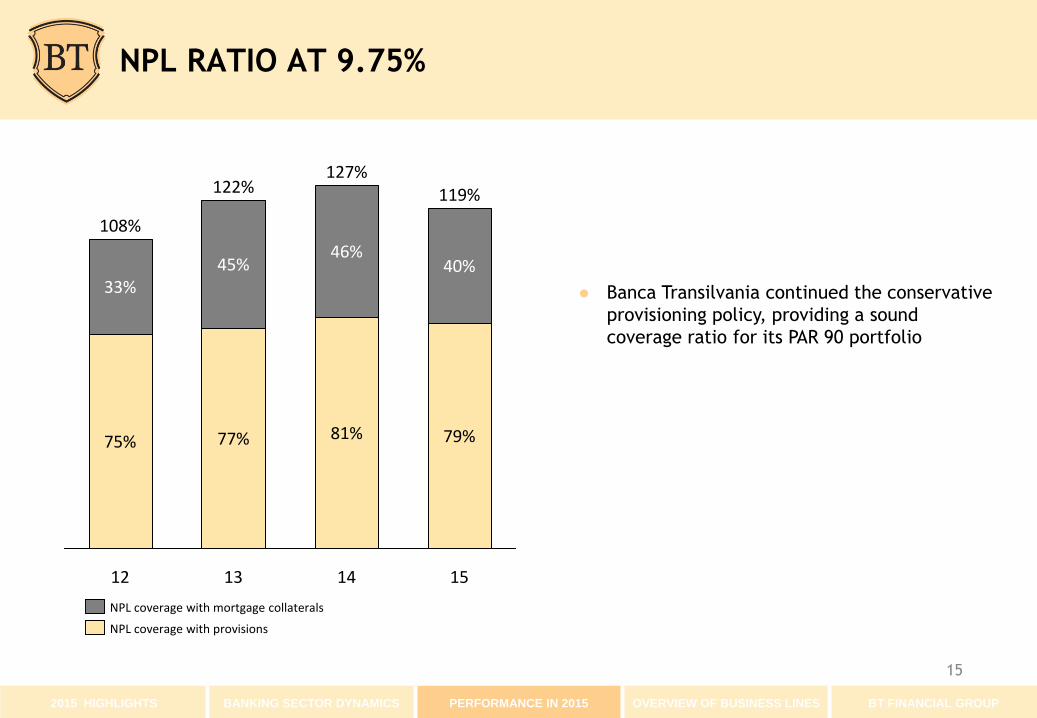
NPL RATIO AT 9.75%
2015 HIGHLIGHTS BANKING SECTOR DYNAMICS PERFORMANCE IN 2015 OVERVIEW OF BUSINESS LINES BT FINANCIAL GROUP
● Banca Transilvania continued the conservative
provisioning policy, providing a sound
coverage ratio for its PAR 90 portfolio
75%
108%
40%
127%
14
79%
119%
81%
15
77%
12 13
122%
45%46%
33%
NPL coverage with provisions
NPL coverage with mortgage collaterals
15

Retail banking
BANKING SECTOR DYNAMICS 2015 HIGHLIGHTS PERFORMANCE IN 2015 OVERVIEW OF BUSINESS LINES BT FINANCIAL GROUP
● Sound organic growth of loan portfolio in 2015
disregarding the boost from VBRO acquisition
Banca Transilvania is number 1 in Romania in
terms of the transactions turnover on its cards
portfolio with a market share of 18.5%; a total
card portfolio of close to 2.5 million (19.15% more
transactions than last)
● BT 24 and mobile banking remained top priority
6.28 6.326.80
7.47
11.00
3.30
500%
600%
700%
800%
900%
1000%
1100%
1200%
1300%
1400%
1500%
11 12 13 14 15
Retail Loan Portfolio, RONbn source: BT
loans transferred
from VBR
Retail loan portfolio reached RON
14.33bn in 2015
16

SME Banking
● Banca Transilvania continued its specific focus on
the SME business sector, processing over 16,300
new loans in 2015
BT continued its partnership with DFIs, offering
special loan and guarantee products to its SME
clients
● Agriculture, Healthcare and European Structural
Funds are on BT radar as specialized sectorial
approaches
SME loan portfolio up to RON 3.17bn and
184,500 active clients
2.9, 1.81
2.51 2.482.58
2.87
0.3
160%
180%
200%
220%
240%
260%
280%
300%
320%
11 12 13 14 15
SME Loan Portfolio, RONbn source: BT
loans transferred
from VBR
17
BANKING SECTOR DYNAMICS 2015 HIGHLIGHTS PERFORMANCE IN 2015 OVERVIEW OF BUSINESS LINES BT FINANCIAL GROUP

Corporate Banking
BT was present with lending facilities especially in
the industrial manufacturing and agribusiness
segments
BT continued to play an important role as co-
lender of EU structural funds eligible projects
Corporate loan portfolio above
RON 11.2bn
7.61
8.74
9.88 9.9710.41
0.88
700%
750%
800%
850%
900%
950%
1000%
1050%
1100%
1150%
1200%
11 12 13 14 15
Corporate Loan Portfolio, RONbn source: BT
loans transferred
from VBR
18
BANKING SECTOR DYNAMICS 2015 HIGHLIGHTS PERFORMANCE IN 2015 OVERVIEW OF BUSINESS LINES BT FINANCIAL GROUP

BANCA TRANSILVANIA FINANCIAL GROUP
full array of financial services
Total assets: 82 RON mn.
Total assets: 32 RON mn.
Total assets: 106 RON mn.
Total assets: 369 RON mn.
Total assets: 74 RON mn.
BANKING SECTOR DYNAMICS 2015 HIGHLIGHTS PERFORMANCE IN 2015 OVERVIEW OF BUSINESS LINES BT FINANCIAL GROUP
Total assets: 47.2 RON bn
As of 31.12.2015:
19
BANKING SECTOR DYNAMICS 2015 HIGHLIGHTS PERFORMANCE IN 2015 OVERVIEW OF BUSINESS LINES BT FINANCIAL GROUP
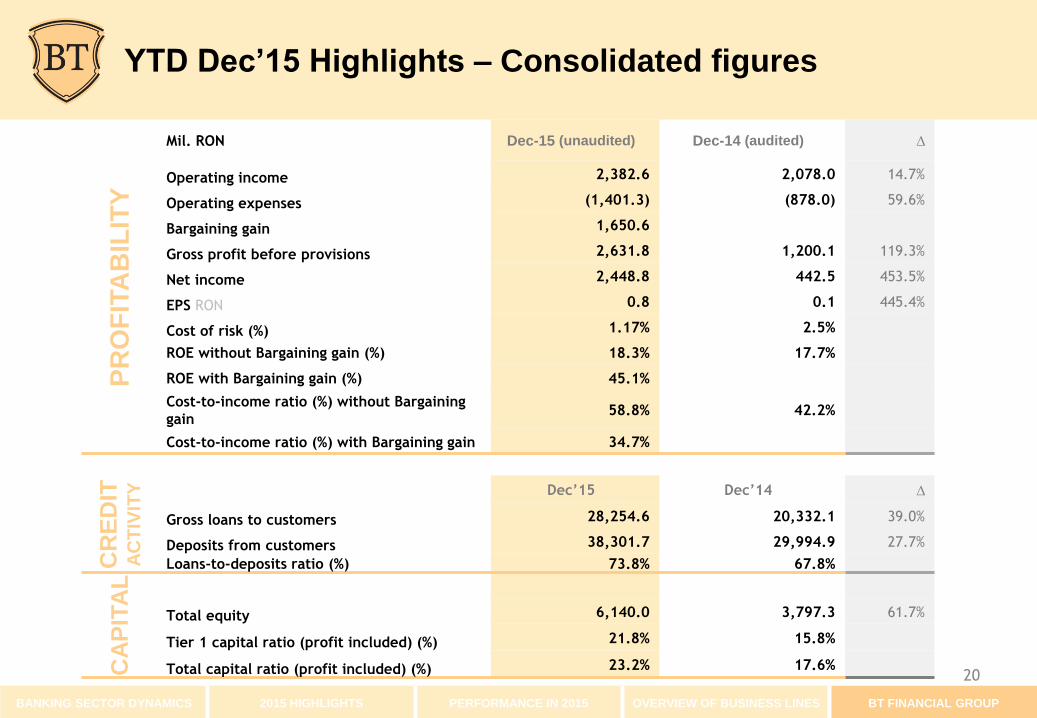
PR
OF
ITA
BIL
ITY
Mil. RON Dec-15 (unaudited) Dec-14 (audited) ∆
Operating income 2,382.6 2,078.0 14.7%
Operating expenses (1,401.3) (878.0) 59.6%
Bargaining gain 1,650.6
Gross profit before provisions 2,631.8 1,200.1 119.3%
Net income 2,448.8 442.5 453.5%
EPS RON 0.8 0.1 445.4%
Cost of risk (%) 1.17% 2.5%
ROE without Bargaining gain (%) 18.3% 17.7%
ROE with Bargaining gain (%) 45.1%
Cost-to-income ratio (%) without Bargaining
gain58.8% 42.2%
Cost-to-income ratio (%) with Bargaining gain 34.7%
CR
ED
ITA
CT
IVIT
Y Dec’15 Dec’14 ∆
Gross loans to customers 28,254.6 20,332.1 39.0%
Deposits from customers 38,301.7 29,994.9 27.7%
Loans-to-deposits ratio (%) 73.8% 67.8%
CA
PIT
AL
Total equity 6,140.0 3,797.3 61.7%
Tier 1 capital ratio (profit included) (%) 21.8% 15.8%
Total capital ratio (profit included) (%) 23.2% 17.6%
YTD Dec’15 Highlights – Consolidated figures
20

ANNEX I INCOME STATEMENT
IFRS, individual, RONmnDec-15*
unaudited
Dec-14
audited∆
Net interest income 1,378.7 1,137.6 21.2%
Net fee and commission income 457.6 408.4 12.0%
Net trading income 179.4 126.8 41.5%
Other net income 270.5 327.7 -17.5%
Operating income 2,286.2 2,000.5 14.3%
Personnel expenses (651.6) (451.6) 44.3%
D&A (77.6) (57.4) 35.3%
Other operating expenses (612.7) (319.4) 91.8%
Operating expenses (1,341.9) (828.4) 62.0%
Cost of risk (329.4) (667.1) -50.6%
Bargaining Gain 1,650.6
Net income before taxation 2,265.5 505.0 348.6%
Income tax expense 152.5 (70.7) -315.7%
Net income after taxation 2,418.0 434.3 456.7%
*Preliminary figures 21

ANNEX II BALANCE SHEET
IFRS, individual, RON mnDec-15*
unaudited
Dec-14
audited∆
Cash & cash equivalents 5,104.9 4,226.0 20.8%
Placements with banks 3,569.8 2,216.1 61.1%
Loans to customers, net 25,107.5 17,517.2 43.3%
T-bills & securities 12,481.0 11,068.0 12.8%
Fixed assets 409.1 360.1 13.6%
Participations 84.9 74.9 13.4%
Other assets 483.3 157.3 207.3%
Total assets 47,240.5 35,619.5 32.6%
Deposits from banks 388.4 133.3 191.3%
Deposits customers 38,395.3 30,045.5 27.8%
Loans from banks and FIs 985.1 949.1 3.8%
Subordinated loan 416.4 394.7 5.5%
Deferred tax liabilities 0.0 43.7 -100.0%
Other liabilities 1,038.9 351.3 195.7%
Total liabilities 41,224.1 31,917.6 29.2%
Shareholders’ equity 6,016.4 3,702.0 62.5%
*Preliminary figures
22

ANNEX III INCOME STATEMENT
IFRS, consolidated, RONmn*Dec -15
unaudited
Dec – 14
audited∆
Net interest income 1,421.2 1,175.7 20.9%
Net fee and commission income 487.1 425.5 14.5%
Net trading income 178.8 126.8 41.0%
Other net income 295.6 350.0 -15.5%
Operating income 2,382.6 2,078.0 14.7%
Personnel expenses (676.8) (474.4) 42.7%
D&A (91.7) (66.1) 38.6%
Other operating expenses (632.8) (337.4) 87.6%
Operating expenses (1,401.3) (878.0) 59.6%
Cost of risk (330.1) (684.4) -51.8%
Bargaining gain 1,650.6
Net income before taxation 2,301.8 515.6 346.4%
Income tax expense 147.0 (73.2) -300.9%
Net income after taxation 2,448.8 442.5 453.5%
*Preliminary figures 23

ANNEX IV BALANCE SHEET
IFRS, consolidated, RONmnDec-15*
unaudited
Dec-14
audited∆
Cash & cash equivalents 5,109.1 4,234.2 20.7%
Placements with banks 3,585.0 2,224.3 61.2%
Loans to customers, net 25,227.4 17,663.0 42.8%
T-bills & securities 12,507.4 11,078.6 12.9%
Fixed assets 526.7 412.3 27.7%
Participations 0.0 0.0
Other assets 521.7 183.6 184.1%
Total assets 47,477.4 35,795.9 32.6%
Deposits from banks 388.4 133.3 191.3%
Deposits customers 38,301.7 29,994.9 27.7%
Loans from banks and FIs 1,129.7 1,052.7 7.3%
Subordinated loan 416.4 394.7 5.5%
Deferred tax liabilities 0.0 41.0 -100.0%
Other liabilities 1,101.1 381.9 188.3%
Total liabilities 41,337.4 31,998.7 29.2%
Total equity 6,140.0 3,797.3 61.7%
*Preliminary figures
24

Banca Transilvania HQ8, G. Baritiu Street, Cluj-Napoca
400027, Romania
+ 40 264 407 150
+ 40 264 407 179 /FAX
www.bancatransilvania.ro/en/investor-relations
www.bancatransilvania.ro
www.bt24.ro
facebook.com/BancaTransilvania
twitter.com/b_Transilvania
linkedin.com/company/banca-transilvania#