BamBoo forest change and its effect on Biomass … · buluh adalah antara -66.5 × 10² Mg C tahun-1...
11
Journal of Tropical Forest Science 24(3): 426–435 (2012) Xu X et al. 426 © Forest Research Institute Malaysia BAMBOO FOREST CHANGE AND ITS EFFECT ON BIOMASS CARBON STOCKS: A CASE STUDY OF ANJI COUNTY, ZHEJIANG PROVINCE, CHINA X Xu 1 , G Zhou 1, 2, *, H Du 2 & A Partida 2 1 College of Forestry, Beijing Forestry University, Beijing 100083, China 2 Zhejiang Provincial Key Laboratory of Carbon Cycling in Forest Ecosystems and Carbon Sequestration, Zhejiang A & F University, Lin’an 311300, China Received December 2011 XU X, ZHOU G, DU H & PARTIDA A. 2012. Bamboo forest change and its effect on biomass carbon stocks: a case study of Anji county, Zhejiang province, China. The distribution of bamboo forest in south and south- eastern Asia is increasing. Based on Landsat satellite imagery data, rates and causes of change in bamboo forests and changes associated with biomass carbon stocks were analysed in Anji county, Zhejiang province, China. Results indicated notable increase in bamboo forest area and simultaneous loss in needleleaf and broadleaf forests as well as farm land between 1986 and 2008. Annual net flux of atmospheric carbon release from the increase in bamboo forest area was -66.5 × 10 2 to -117.6 ×10 2 Mg C year -1 . One of the most significant causative factors of biomass carbon stock losses was the conversions of needleleaf and broadleaf forests into bamboo forest. In this area of study, bamboo harvested for production accumulated carbon at a rate of 0.86 to 1.83 Mg C ha -1 year -1 . When carbon sequestration estimate in harvested bamboo was taken into consideration, the contribution of bamboo forest to the local carbon balance became significant. Keywords: Bamboo products, Landsat thematic mapper imagery XU X, ZHOU G, DU H & PARTIDA A. 2012. Perubahan dalam hutan buluh dan kesannya terhadap biojisim stok karbon: kajian kes di wilayah Anji, daerah Zhejiang, negara China. Taburan hutan buluh di selatan Asia dan tenggara Asia semakin meluas. Kadar dan sebab berlakunya perubahan dalam hutan buluh serta perubahan yang berkaitan dengan biojisim stok karbon dianalisis di wilayah Anji, daerah Zhejiang, negara China berdasarkan data imejan satelit Landsat. Keputusan menunjukkan pertambahan kawasan hutan buluh yang ketara dan kehilangan serentak hutan daun jejarum dan daun lebar serta tanah ladang antara tahun 1986 dengan tahun 2008. Pelepasan bersih karbon atmosfera tahunan daripada pertambahan kawasan hutan buluh adalah antara -66.5 × 10 2 Mg C tahun -1 hingga -117.6 × 10 2 Mg C tahun -1 . Salah satu faktor penyebab kehilangan biojisim stok karbon ialah penukaran hutan daun jejarum dan daun lebar menjadi hutan buluh. Di kawasan kajian, buluh yang dituai untuk penghasilan produk mengumpul karbon pada kadar 0.86 Mg C ha -1 tahun -1 hingga 1.83 Mg C ha -1 tahun -1 . Apabila anggaran pensekuesteran karbon dalam buluh yang dituai diambil kira, sumbangan hutan buluh kepada imbangan karbon tempatan menjadi ketara. *Author for correspondence. E-mail: [email protected] INTRODUCTION The current rates and intensities of landuse and the resulting land cover change are greater than ever before, making unprecedented changes in ecosystems and environmental processes at local, regional and global scales (Ellis & Pontius 2007). These changes encompass the greatest environmental concerns for humans today, including climate change, biodiversity loss, wildlife habitat destruction, and the pollution of water, soil and air (Fearnside et al. 2009, Kaul et al. 2009, O’Connor & Kuyler 2009, Wang et al. 2009, Wiens et al. 2009). Monitoring and mediating the negative consequences of landuse and land- cover change (LULCC) while enhancing carbon sequestration have become a major priority for researchers and policy-makers. Presently, carbon emitted from forest land due to deforestation is substantial. However, changes in carbon levels as a result of subtle landuse changes, such as the conversions of other forests into bamboo forest, remain unclear. Due to its high profitability, bamboo distribution in south and south-eastern Asia is continuously increasing (Sharma 1980). India (almost 11.4 × 10 6 ha) and China (over 5.4 × 10 6 ha) are the major bamboo producing countries in Asia
Transcript of BamBoo forest change and its effect on Biomass … · buluh adalah antara -66.5 × 10² Mg C tahun-1...
Journal of Tropical Forest Science 24(3): 426–435 (2012) Xu X et al.
426© Forest Research Institute Malaysia
BamBoo forest change and its effect on Biomass carBon stocks: a case study of anji county, Zhejiang province, china
X Xu1, g Zhou1, 2, *, h du2 & a partida2
1College of Forestry, Beijing Forestry University, Beijing 100083, China 2Zhejiang Provincial Key Laboratory of Carbon Cycling in Forest Ecosystems and Carbon Sequestration, Zhejiang A & F University, Lin’an 311300, China
Received December 2011
Xu X, Zhou g, du h & partida a. 2012. Bamboo forest change and its effect on biomass carbon stocks: a case study of anji county, Zhejiang province, china. The distribution of bamboo forest in south and south-eastern Asia is increasing. Based on Landsat satellite imagery data, rates and causes of change in bamboo forests and changes associated with biomass carbon stocks were analysed in Anji county, Zhejiang province, China. Results indicated notable increase in bamboo forest area and simultaneous loss in needleleaf and broadleaf forests as well as farm land between 1986 and 2008. Annual net flux of atmospheric carbon release from the increase in bamboo forest area was -66.5 × 10² to -117.6 ×10² Mg C year-1. One of the most significant causative factors of biomass carbon stock losses was the conversions of needleleaf and broadleaf forests into bamboo forest. In this area of study, bamboo harvested for production accumulated carbon at a rate of 0.86 to 1.83 Mg C ha-1 year-1. When carbon sequestration estimate in harvested bamboo was taken into consideration, the contribution of bamboo forest to the local carbon balance became significant.
Keywords: Bamboo products, Landsat thematic mapper imagery
Xu X, Zhou g, du h & partida a. 2012. perubahan dalam hutan buluh dan kesannya terhadap biojisim stok karbon: kajian kes di wilayah anji, daerah Zhejiang, negara china. Taburan hutan buluh di selatan Asia dan tenggara Asia semakin meluas. Kadar dan sebab berlakunya perubahan dalam hutan buluh serta perubahan yang berkaitan dengan biojisim stok karbon dianalisis di wilayah Anji, daerah Zhejiang, negara China berdasarkan data imejan satelit Landsat. Keputusan menunjukkan pertambahan kawasan hutan buluh yang ketara dan kehilangan serentak hutan daun jejarum dan daun lebar serta tanah ladang antara tahun 1986 dengan tahun 2008. Pelepasan bersih karbon atmosfera tahunan daripada pertambahan kawasan hutan buluh adalah antara -66.5 × 10² Mg C tahun-1 hingga -117.6 × 10² Mg C tahun-1. Salah satu faktor penyebab kehilangan biojisim stok karbon ialah penukaran hutan daun jejarum dan daun lebar menjadi hutan buluh. Di kawasan kajian, buluh yang dituai untuk penghasilan produk mengumpul karbon pada kadar 0.86 Mg C ha-1 tahun-1 hingga 1.83 Mg C ha-1 tahun-1. Apabila anggaran pensekuesteran karbon dalam buluh yang dituai diambil kira, sumbangan hutan buluh kepada imbangan karbon tempatan menjadi ketara.
*Author for correspondence. E-mail: [email protected]
introduction
The current rates and intensities of landuse and the resulting land cover change are greater than ever before, making unprecedented changes in ecosystems and environmental processes at local, regional and global scales (Ellis & Pontius 2007). These changes encompass the greatest environmental concerns for humans today, including climate change, biodiversity loss, wildlife habitat destruction, and the pollution of water, soil and air (Fearnside et al. 2009, Kaul et al. 2009, O’Connor & Kuyler 2009, Wang et al. 2009, Wiens et al. 2009). Monitoring and mediating the negative consequences of landuse and land-
cover change (LULCC) while enhancing carbon sequestration have become a major priority for researchers and policy-makers. Presently, carbon emitted from forest land due to deforestation is substantial. However, changes in carbon levels as a result of subtle landuse changes, such as the conversions of other forests into bamboo forest, remain unclear. Due to its high profitability, bamboo distribution in south and south-eastern Asia is continuously increasing (Sharma 1980). India (almost 11.4 × 10⁶ ha) and China (over 5.4 × 10⁶ ha) are the major bamboo producing countries in Asia

Journal of Tropical Forest Science 24(3): 426–435 (2012) Xu X et al.
427© Forest Research Institute Malaysia
(Lobovikov et al. 2006). Due to large-scale planting of bamboo (mainly moso bamboo, Phyllostachys heterocycla var. pubescens) in China over the last 15 years, bamboo areas in Asia had increased by 10% (Lobovikov et al. 2006). In 2005, it was reported that bamboo forest had reached an area of some 5 × 10⁶ ha (Government of China 2005). This is a 1.5-fold increase compared with that of the 1950s (Lobovikov et al. 2006). Due to carbon sequestering benefits, we are interested in the impacts of bamboo forest change on biomass carbon stocks. Remote sensing is an essential tool of LULCC because it enables observations across larger areas of the earth’s surface than by ground-based observations. The post-classification comparison algorithm is one of the most common techniques used in detecting landuse changes (Ahlqvist 2008, Wang et al. 2009). The algorithm not only provides area and rate changes but also detailed information about LULCC (Lu et al. 2004). In addition, the post-classification comparison algorithm is not restricted by atmospheric, sensor and environmental differences between multi-temporal images (Coppin et al. 2004, Lu et al. 2004, Shalaby & Tateishi 2007). The post-classification comparison algorithm becomes the preferred method for detecting landuse changes because of its advantages. LULCC plays a major role in climate change at local, regional and global levels. Hence, it is important to study effects of increasing bamboo forests on land cover and biomass carbon stocks. The objectives of this study were to: (1) explore the temporal and spatial characteristics of bamboo forest change between 1986 and 2008 based on Landsat Thematic Mapper (TM) data, (2) discover the sources facilitating bamboo forest change and (3) analyse the effects of increasing bamboo forest on changes in biomass carbon stocks. This study can provide some suggestions for enhancing carbon sequestration during landuse decision-making. materiaLs and methods
study area
Anji county (Figure 1) is located in the north-western part of Zhejiang province, China. The county has been named the home of moso bamboo forest because of its large area of distribution and important role in supporting
the local economy. The study area covered 1886.45 km2, of which 71.1% was covered by forests. The needleleaf forest is mainly dominated by Pinus massoniana and Cunninghamia lanceolata, while the broadleaf forest mainly consists of Cyclobalanopsis glauca, Castanopsis sclerophylla, Castanopsis eyrei, Schima superba and Quercus fabri. Bamboo forests accounted for 56.47% of the forested areas (79.3% moso bamboo). From 1983 till 2007, bamboo areas increased dramatically from 5.40 × 10⁵ ha to 6.97 × 10⁵ ha. The annual increased rate was 1.21% during that period. The terrain is undulating with elevation ranging from 4 to 1587 m above sea level. The annual precipitation average is between 1.1 and 1.9 m. Annual temperature averages between 12.2 and 15.6 °C.
Landsat tm image processing
Landsat TM images acquired on 25 July 1986 and 5 July 2008 were used in this study. These TM images were rectified to Transverse Mercator coordinate system using control points taken from topographic maps, with the root mean square errors of 0.51 and 0.67 pixels. The nearest neighbour algorithm was used to resample the TM images into pixel size of 30 m × 30 m during the image rectification. The auxiliary data were then collected, including forest inventory data, forest resource distribution maps and topographic maps.
image classification and change detection
Land cover was classified into eight landuse categories: (1) bamboo forest, (2) broadleaf forest (BLF), (3) needleleaf forest (NLF), (4) farm land (FL), (5) orchards/nurseries/ shrub land (ONSL), (6) urban, (7) barren land (BL), and (8) water (Table 1). Feature selection for multispectral data is an effective method to remove redundancy among bands and improve classification accuracy (Jensen 2005, Sanchez-Hernandez et al. 2007). The Jeffries–Matusita (JM) distance method was used to select the optimal feature subsets (Jensen 2005). The training data sets of each landuse category were extracted from the six bands (except for band 6), normalised difference vegetation index [NDVI, (TM4-TM3)/(TM4+TM3)] image, and infrared index vegetation index [IIVI, (TM4-TM5)/(TM4+TM5)] image using the Area of

Journal of Tropical Forest Science 24(3): 426–435 (2012) Xu X et al.
428© Forest Research Institute Malaysia
Interest (AOI) tool. The NDVI stresses the difference between vegetation cover and no vegetation cover, while the IIVI is a useful index to identify relative variations of vegetation cover. The optimal feature subsets were selected according to the evaluation criterion of higher JM statistic and lesser features. Maximum likelihood classification (MLC) algorithm was applied
to detect the landuse categories (Lu & Weng 2007, Dewan & Yamaguchi 2009). In this study, the post-classification comparison algorithm was used to detect landuse changes. The cross-tabulation table and spatial distribution map of changed categories were produced using the GIS analysis imbedded in ERDAS IMAGINE 9.1 software.
figure 1 The study area in Anji county, Zhejiang province, China
table 1 Descriptions of landuse categories
Landuse category Description
Bamboo forest Tree species mainly include moso bamboo (79.3%) and other bamboo species (20.7%)
BLF Tree species mainly include Cyclobalanopsis glauca, Castanopsis sclerophylla, Castanopsis eyrei, Schima superba, Quercus fabri
NFL Tree species mainly include Pinus massoniana and Cunninghamia lanceolata
FL Areas used for the production of crops such as rice, wheat, corn, cotton, tea, vegetables; includes grasslands
ONSL Areas planted or maintained for the production of fruits, nuts, berries or ornamental trees and flowers
Urban Residential, commercial services, industrial, transportation, communications, industrial and commercial, mixed urban or built-up land, other urban or built-up land
BL Land areas of exposed soil surface as influenced by human impacts and/or natural causes; contains sparse vegetation with very low plant cover value as a result of overgrazing, woodcutting; includes fallow and transitional
Water Permanent open water, lakes, reservoirs, streams and rivers
BF = broadleaf forest, NLF = needleleaf forest, FL = farm land, ONSL = orchards/nurseries/shrub land, BL = barren land
N

Journal of Tropical Forest Science 24(3): 426–435 (2012) Xu X et al.
429© Forest Research Institute Malaysia
classification and accuracy assessment
Accuracy assessment is an important part of classification and the change detection process (Lu et al. 2004, Lu et al. 2005). The error matrix-based accuracy assessment method was applied to determine classification map accuracies (Lu et al. 2005, Thapa & Murayama 2009). The stratified random sampling method was used to locate random sample points. In this study, 400 reference pixels were collected through forest inventory data and forest resource distribution maps. The minimum threshold of sample points for each landuse category was set at 20. The accuracies of the two classification maps were multiplied to estimate the expected accuracy for the change map (Yuan et al. 2005, Wang et al. 2009).
Biomass carbon stock change analysis
The effects of increasing bamboo forests on soil carbon stocks were not considered in this study. Annual change in biomass carbon stocks from the conversion of one landuse category to another has been estimated using equations 1 and 2. It refers to the stock-difference method described in IPCC (2006). The biomass carbon density of each landuse category was collected from published literature and forest inventory (Xu et al. 2011) (Table 2).
(1)
(2)
where ∆C is the annual biomass carbon stocks change in the pool between time t1 and t2, Mg C year-1; is the annual biomass carbon stocks change in the pool from landuse category i (i =1 to n, n is total number of categories) to landuse category j (j = 1 to n) between time t1 and t2, Mg C year-1; Di is the biomass carbon density of landuse category i, Mg C ha-1; is change in area from landuse category i to landuse category j between time t1 and t2, ha. The remaining carbon stored in biomass, in the form of different bamboo products, serves as carbon sink before decay (Upadhyay et al. 2005). Bamboo, especially moso bamboo, grows rapidly and is used to make a variety of products. These products can be preserved over decades. In this study, carbon sequestration in harvested bamboo products was taken into account. Carbon sequestration in harvested bamboo products was calculated using the following equations.
(3) (4)
table 2 Biomass carbon densities of different categories
Landuse category Biomass carbon density(Mg C ha-1)
Source
Lower limit Upper limit
Bamboo forest Aboveground 14.23 30.43 Xu et al. (2011)
Underground 11.50 11.50 Zhou & Jiang (2004)
Total 25.73 41.93
BLF Total 68.60 127.30 Fang et al. (1996)
NLF Total 58.20 85.00 Fang et al. (1996)
FL Total 6.80 9.30 Fang et al. (1996)
ONSL Total 9.88 11.85 Zhang & Wang (2008)
Urban 0
BL 0
Water 0
BLF = broadleaf forest, NLF = needleleaf forest, FL = farm land, ONSL = orchards/nurseries/shrub land, BL = barren land

Journal of Tropical Forest Science 24(3): 426–435 (2012) Xu X et al.
430© Forest Research Institute Malaysia
where ∆Cproducts is the annual carbon sequestration in bamboo products, Mg C year-1; ∆RCproducts is the rate of carbon sequestration in bamboo products, Mg C ha-1 year-1; ε is the average utilisation ratio of bamboo; Dabove is the aboveground biomass carbon density, Mg C ha-1; floor means to get the integer part; ω is the cutting cycle; and are the areas of bamboo in time t1 and t2 respectively, ha. The average utilisation ratio of bamboo (ε) was 0.4 (Zhang et al. 2006). Areas of bamboo forests in 1986 and 2008 estimated based on remote sensing classification were 529.4 × 10² ha and 718.4 × 10² ha respectively. The aboveground biomass carbon density (Dabove) ranged from 14.23 to 30.43 Mg C ha-1 (Xu et al. 2011) and the cutting cycle (ω) of moso bamboo forest was five years.
resuLts
classification and accuracy assessment
According to JM distance method, the optimal feature subsets (including band 1, band 3, band 4, band 5, NDVI and IIVI) were used to classify the images. The classification maps based on MLC algorithm are shown in Figure 2. Figure 2 shows that most of study area is covered by bamboo forest. The land cover area changed dramatically during the 1986–2008 period. An error matrix was generated to examine and display the overall accuracy and Kappa statistics.
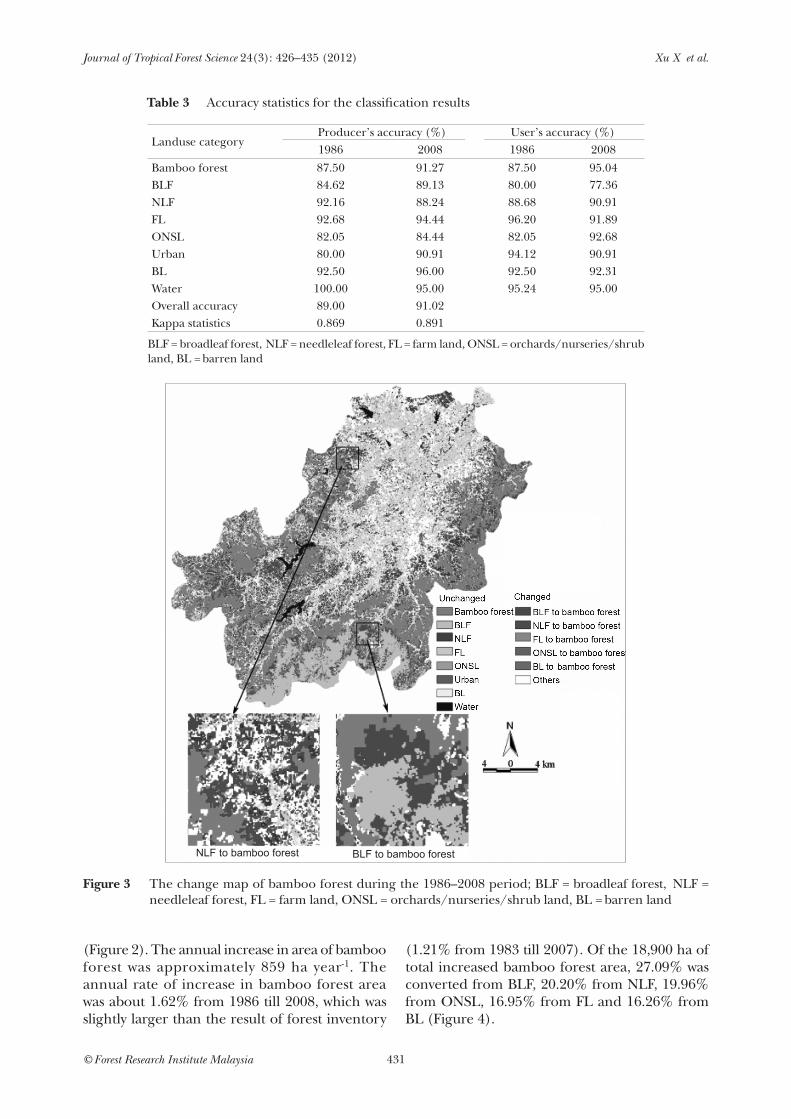
The overall accuracy values of the classification maps for 1986 and 2008 were 89.00 and 91.02% respectively (Table 3). The Kappa statistics were 0.869 for 1986 and 0.891 for 2008 (Table 3). The expected accuracy of change map from 1986 till 2008 was calculated by multiplying the accuracy of the two classification maps. The overall accuracy for change map was 81.01%, with Kappa statistics of 0.775. The producer’s accuracies for change map (Table 3) ranged from 67.55% (urban converted into ONSL) to 96.00% (water converted into BL) while those of the user’s ranged from 63.47% (ONSL converted into BLF) to 91.43% (FL converted into bamboo forest). The level of accuracy was sufficient for detecting bamboo forest change.
change map and statistics
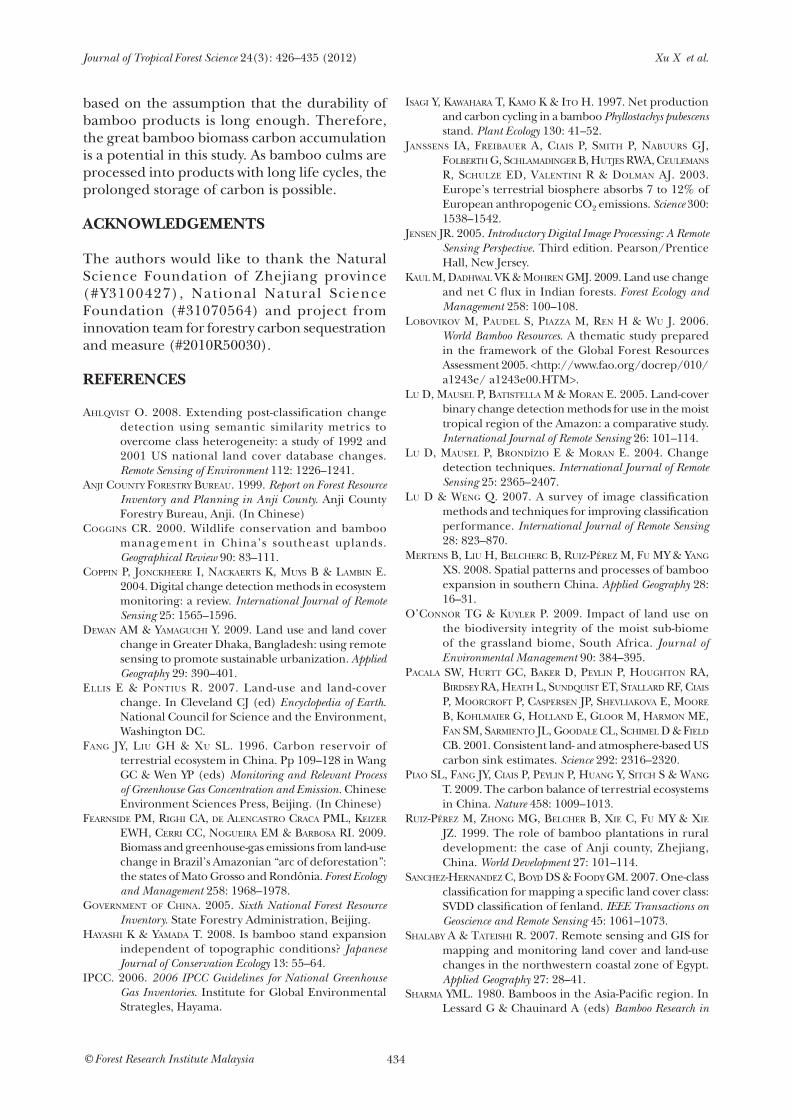
The change in the spatial distribution of bamboo forest is shown in Figure 3. The most significant change of land cover was the conversions of BLF and NLF into bamboo forest. Bamboo forests have strong ability to invade adjacent landuse categories. Land cover, near existing built-up areas, is more likely to be converted into other categories, such as the conversion of farm land into urban land (Figures 2 and 3). To further understand the status of bamboo forest conversions, changes in bamboo forest areas during the 1986–2008 period are shown in Figure 4. The bamboo forest area increased from 529.4 × 10² to 718.4 × 10² ha from 1986 till 2008
figure 2 The classification maps of Anji Country in (a) 1986 and (b) 2008; BLF = broadleaf forest, NLF = needleleaf forest, FL = farm land, ONSL = orchards/nurseries/shrub land, BL = barren land
Journal of Tropical Forest Science 24(3): 426–435 (2012) Xu X et al.
431© Forest Research Institute Malaysia
(Figure 2). The annual increase in area of bamboo forest was approximately 859 ha year-1. The annual rate of increase in bamboo forest area was about 1.62% from 1986 till 2008, which was slightly larger than the result of forest inventory
(1.21% from 1983 till 2007). Of the 18,900 ha of total increased bamboo forest area, 27.09% was converted from BLF, 20.20% from NLF, 19.96% from ONSL, 16.95% from FL and 16.26% from BL (Figure 4).
table 3 Accuracy statistics for the classification results
Landuse categoryProducer’s accuracy (%) User’s accuracy (%)1986 2008 1986 2008
Bamboo forest 87.50 91.27 87.50 95.04BLF 84.62 89.13 80.00 77.36NLF 92.16 88.24 88.68 90.91FL 92.68 94.44 96.20 91.89ONSL 82.05 84.44 82.05 92.68Urban 80.00 90.91 94.12 90.91BL 92.50 96.00 92.50 92.31Water 100.00 95.00 95.24 95.00Overall accuracy 89.00 91.02Kappa statistics 0.869 0.891
BLF = broadleaf forest, NLF = needleleaf forest, FL = farm land, ONSL = orchards/nurseries/shrub land, BL = barren land
figure 3 The change map of bamboo forest during the 1986–2008 period; BLF = broadleaf forest, NLF = needleleaf forest, FL = farm land, ONSL = orchards/nurseries/shrub land, BL = barren land
NLF to bamboo forest BLF to bamboo forest

Journal of Tropical Forest Science 24(3): 426–435 (2012) Xu X et al.
432© Forest Research Institute Malaysia
Biomass carbon stock change statistics
The changes in biomass carbon stocks were calculated using equations 1 and 2 (Figure 5). The annual net flux of atmospheric carbon from increase in bamboo forest area was -66.5 × 10² to -117.6 × 10² Mg C year-1. Atmospheric carbon release, due to the conversions of BLF and NLF into bamboo forests, was notable during the 1986–2008 period. The annual release of atmospheric carbon from the conversion of BLF into bamboo forest was the largest (-99.8 × 10² to -198.7 × 10² Mg C year-1), followed by the NLF. Meanwhile, atmospheric carbon removal was 91.0 × 10² to 158.1 × 10² Mg C year-1 due to the conversions of FL, ONSL and BL into bamboo forest. Between 1986 and 2008, the carbon sequestration in bamboo products (∆Cproducts) was 614.6 × 10² to 1314.2 × 102 Mg C year-1
using equations 3 and 4. Bamboo products (∆RCproducts) served as a large carbon sink and accumulated carbon at a rate of 0.86 to 1.83 Mg C ha-1 year-1. During the study period, the annual atmospheric carbon removal by bamboo products was approximately 10 times greater than annual carbon emissions due to the increase in bamboo forest area. The annual net carbon removal rate from the atmosphere due to bamboo forest changes was 548.1 × 10² to 1196.6 × 102 Mg C year-1.
discussion
reasons for bamboo forest change
The results showed notable increase in bamboo forest area and simultaneous loss in BLF and NLF. The active process of replacing bamboo and its ability to expand are the two main
figure 5 The annual changes in biomass carbon due to bamboo forest changes; BLF = broadleaf forest, NLF = needleleaf forest, FL = farm land, ONSL = orchards/nurseries/shrub land, BL = barren land
Landuse category
BLF NLF FL ONSL Urban BL water
100
50
0
-50
-100
-150
-200
-250Ann
ual c
hang
e in
bio
mas
s ca
rbon
(100
Mg
C y
ear-1
)
figure 4 Changes in bamboo forest area during the 1986–2008 period; BLF = broadleaf forest, NLF = needle-leaf forest, FL = farm land, ONSL = orchards/nurseries/shrub land, BL = barren land
Landuse categoryBLF NLF FL ONSL Urban BL water
8070605040302010
0-10
Are
a 10
0 ha
Bamboo forest converted into categories Other categories converted into bamboo forest Net change

Journal of Tropical Forest Science 24(3): 426–435 (2012) Xu X et al.
433© Forest Research Institute Malaysia
reasons for the rapid increase in bamboo forest area. There is an active process of replacing other landuse categories by bamboo because of the high profitability of bamboo (Figure 3). Bamboo, characterised by shorter rotation, plays an important role in raising farmers’ income (Ruiz-Pérez et al. 1999). Bamboo products also have more ability to respond to national and international market demands (Mertens et al. 2008). Afforestation activities financed by the World Bank played an important role in the conversion of barren land into bamboo forest during the study period (Anji County Forestry Bureau 1999). Another reason for the rapid increase in bamboo forest area is its strong ability to expand. As the growth of bamboo shoot is dependent on photosynthetic products transported from other culms through the rhizome system, a bamboo shoot can reach crown height within a few months (Isagi et al. 1997). Monopodial bamboo, including the genera Phyllostachys and Pleioblastus, generates culm clumps and can be invasive (Lobovikov et al. 2006). This makes it difficult for understorey plants to absorb enough sunlight and nutrition and they gradually disappear. Figure 3 shows bamboo invading adjacent BLF and this is consistent with the results of Coggins (2000) as well as Hayashi and Yamada (2008).
effects of bamboo forest on biomass carbon
Figures 4 and 5 show similarities in the areas converted from BLF, NLF, FL, ONLS and BL into bamboo forests. Their associated changes in biomass carbon were significantly different. Atmospheric carbon removal from FL and ONLS conversions into bamboo forest was far less than the atmospheric carbon release from BLF and NLF conversions. Subtle changes in landuse resulted in significant difference between the terrestrial ecosystem and atmosphere carbon exchanges. Based on these findings, carbon sequestration can be enhanced by converting a lower biomass carbon density landuse category into a higher one. Implementing such policies would be greatly beneficial in landuse decision-making and environmental management. Although increase in bamboo forest areas results in carbon emitted into the atmosphere, harvested bamboo products play a very important role in carbon sequestration. When the quantity of
carbon stored in bamboo products is incorporated into carbon estimations, the bamboo forest becomes a large carbon sink and makes a great contribution to decreasing carbon dioxide from the atmosphere. The rate of carbon sequestration in bamboo products (0.86 to 1.83 Mg C ha-1 year-1) was 1.2 to 2.8 times greater than those from standing tree biomass in China (0.31 to 0.83 Mg C ha-1 year-1), the United States (0.52 to 0.71 Mg C ha-1 year-1) and Europe (0.60 to 1.50 Mg C ha-1 year-1) (Pacala et al. 2001, Janssens et al. 2003, Piao et al. 2009). In order to optimise and prolong carbon stock in bamboo products, it is important to produce more durable bamboo products with longer life cycles such as construction materials, panel products and furniture. Many factors may affect estimation results in remote-sensing-based methods. In this study, the image classification accuracy was an important factor because the area of each category was estimated by image classification. It is important to maintain image classification accuracy. Due to the lack of reliable data, this study did not include the following factors: (1) changes in soil carbon due to land cover conversion, (2) annual increase in biomass carbon stocks due to biomass increment in land remaining in the same land cover category and (3) annual decrease in carbon stocks due to biomass losses in land remaining in the same land cover category such as wood and fuelwood removal.
concLusions
LULCC occurred dramatically in this study area. Bamboo forest had notably increased in area, while BLF and NLF had simultaneously decreased. The annual net carbon emission to the atmosphere due to increase in bamboo areas was -66.5 × 10² to -117.6 × 10² Mg C year-1. One of the main causes for biomass carbon loss was the conversions of BLF and NLF into bamboo forest. Based on these findings, careful attention should be paid to subtle landuse changes during landuse decision-making, environmental management and policy implementation. When carbon stored in bamboo products were taken into carbon estimations, the bamboo forest became a large carbon sink. During the 1986–2008 study period, the annual net carbon removal from the atmosphere by bamboo forests was 548.1×10² to 1196.7 × 102 Mg C year-1. The great carbon accumulation of bamboo forest is
Journal of Tropical Forest Science 24(3): 426–435 (2012) Xu X et al.
434© Forest Research Institute Malaysia
based on the assumption that the durability of bamboo products is long enough. Therefore, the great bamboo biomass carbon accumulation is a potential in this study. As bamboo culms are processed into products with long life cycles, the prolonged storage of carbon is possible.
acknowLedgements
The authors would like to thank the Natural Science Foundation of Zhejiang province (#Y3100427), National Natural Science Foundation (#31070564) and project from innovation team for forestry carbon sequestration and measure (#2010R50030).
references
Ahlqvist O. 2008. Extending post-classification change detection using semantic similarity metrics to overcome class heterogeneity: a study of 1992 and 2001 US national land cover database changes. Remote Sensing of Environment 112: 1226–1241.
Anji COunty FOrestry BureAu. 1999. Report on Forest Resource Inventory and Planning in Anji County. Anji County Forestry Bureau, Anji. (In Chinese)
COggins Cr. 2000. Wildlife conservation and bamboo management in China’s southeast uplands. Geographical Review 90: 83–111.
COppin p, jOnCkheere i, nACkAerts k, Muys B & lAMBin e. 2004. Digital change detection methods in ecosystem monitoring: a review. International Journal of Remote Sensing 25: 1565–1596.
DewAn AM & yAMAguChi y. 2009. Land use and land cover change in Greater Dhaka, Bangladesh: using remote sensing to promote sustainable urbanization. Applied Geography 29: 390–401.
ellis e & pOntius R. 2007. Land-use and land-cover change. In Cleveland CJ (ed) Encyclopedia of Earth. National Council for Science and the Environment, Washington DC.
FAng jy, liu gh & Xu sl. 1996. Carbon reservoir of terrestrial ecosystem in China. Pp 109–128 in Wang GC & Wen YP (eds) Monitoring and Relevant Process of Greenhouse Gas Concentration and Emission. Chinese Environment Sciences Press, Beijing. (In Chinese)
FeArnsiDe pM, righi CA, De AlenCAstrO CrAcA pMl, keizer ewh, Cerri CC, nOgueirA eM & BArBOsA ri. 2009. Biomass and greenhouse-gas emissions from land-use change in Brazil’s Amazonian “arc of deforestation”: the states of Mato Grosso and Rondônia. Forest Ecology and Management 258: 1968–1978.
gOvernMent OF ChinA. 2005. Sixth national Forest Resource Inventory. State Forestry Administration, Beijing.
hAyAshi k & yAMADA t. 2008. Is bamboo stand expansion independent of topographic conditions? Japanese Journal of Conservation Ecology 13: 55–64.
IPCC. 2006. 2006 IPCC Guidelines for national Greenhouse Gas Inventories. Institute for Global Environmental Strategles, Hayama.
isAgi y, kAwAhArA t, kAMO k & itO h. 1997. Net production and carbon cycling in a bamboo Phyllostachys pubescens stand. Plant Ecology 130: 41–52.
jAnssens iA, FreiBAuer A, CiAis p, sMith p, nABuurs gj, FOlBerth g, sChlAMADinger B, hutjes rwA, CeuleMAns r, sChulze eD, vAlentini r & DOlMAn Aj. 2003. Europe’s terrestrial biosphere absorbs 7 to 12% of European anthropogenic CO2 emissions. Science 300: 1538–1542.
jensen jr. 2005. Introductory Digital Image Processing: A Remote Sensing Perspective. Third edition. Pearson/Prentice Hall, New Jersey.
kAul M, DADhwAl vk & MOhren gMj. 2009. Land use change and net C flux in Indian forests. Forest Ecology and Management 258: 100–108.
lOBOvikOv M, pAuDel s, piAzzA M, ren h & wu j. 2006.World Bamboo Resources. A thematic study prepared in the framework of the Global Forest Resources Assessment 2005. <http://www.fao.org/docrep/010/a1243e/ a1243e00.HTM>.
lu D, MAusel p, BAtistellA M & MOrAn e. 2005. Land-cover binary change detection methods for use in the moist tropical region of the Amazon: a comparative study. International Journal of Remote Sensing 26: 101–114.
lu D, MAusel p, BrOnDíziO e & MOrAn e. 2004. Change detection techniques. International Journal of Remote Sensing 25: 2365–2407.
lu D & weng q. 2007. A survey of image classification methods and techniques for improving classification performance. International Journal of Remote Sensing 28: 823–870.
Mertens B, liu h, BelCherC B, ruiz-pérez M, Fu My & yAng Xs. 2008. Spatial patterns and processes of bamboo expansion in southern China. Applied Geography 28: 16–31.
O’COnnOr tg & kuyler p. 2009. Impact of land use on the biodiversity integrity of the moist sub-biome of the grassland biome, South Africa. Journal of Environmental Management 90: 384–395.
pACAlA sw, hurtt gC, BAker D, peylin p, hOughtOn rA, BirDsey rA, heAth l, sunDquist et, stAllArD rF, CiAis p, MOOrCrOFt p, CAspersen jp, shevliAkOvA e, MOOre B, kOhlMAier g, hOllAnD e, glOOr M, hArMOn Me, FAn sM, sArMientO jl, gOODAle Cl, sChiMel D & FielD CB. 2001. Consistent land- and atmosphere-based US carbon sink estimates. Science 292: 2316–2320.
piAO sl, FAng jy, CiAis p, peylin p, huAng y, sitCh s & wAng t. 2009. The carbon balance of terrestrial ecosystems in China. nature 458: 1009–1013.
ruiz-pérez M, zhOng Mg, BelCher B, Xie C, Fu My & Xie jz. 1999. The role of bamboo plantations in rural development: the case of Anji county, Zhejiang, China. World Development 27: 101–114.
sAnChez-hernAnDez C, BOyD Ds & FOODy gM. 2007. One-class classification for mapping a specific land cover class: SVDD classification of fenland. IEEE Transactions on Geoscience and Remote Sensing 45: 1061–1073.
shAlABy A & tAteishi r. 2007. Remote sensing and GIS for mapping and monitoring land cover and land-use changes in the northwestern coastal zone of Egypt. Applied Geography 27: 28–41.
shArMA yMl. 1980. Bamboos in the Asia-Pacific region. In Lessard G & Chauinard A (eds) Bamboo Research in

Journal of Tropical Forest Science 24(3): 426–435 (2012) Xu X et al.
435© Forest Research Institute Malaysia
Asia. Proceedings of the Workshop held in Singapore, 28–30 May 1980. International Development Research Centre, Ottawa.
thApA rB & MurAyAMA y. 2009. Urban mapping, accuracy, and image classification: a comparison of multiple approaches in Tsukuba City, Japan. Applied Geography 29: 135–144.
upADhyAy tp, sAnkhAyAn pl & sOlBerg B. 2005. A review of carbon sequestration dynamics in the Himalayan region as a function of land-use change and forest/soil degradation with special reference to Nepal. Agriculture, Ecosystems and Environment 105: 449–465.
wAng y, MitChell Br, nugrAnAD-MArzilli j, BOnynge g, zhOu y & shriver g. 2009. Remote sensing of land-cover change and landscape context of the National Parks: a case study of the Northeast Temperate Network. Remote Sensing of Environment 113: 1453–1461.
wiens j, sutter r, AnDersOn M, BlAnChArD j, BArnett A, AguilAr-AMuChAstegui n, Avery C & lAine s. 2009. Selecting and conserving lands for biodiversity: the role of remote sensing. Remote Sensing of Environment 113: 1370–1381.
Xu X, Du h, zhOu g, ge h, shi y, zhOu y, FAn w & FAn w. 2011. Estimation of aboveground carbon stock of moso bamboo (Phyllostachys heterocycla var. pubescens) forest with a Landsat thematic mapper image. International Journal of Remote Sensing 32: 1431–1448.
yuAn F, sAwAyA ke, lOeFFelhOlz BC & BAuer Me. 2005. Land cover classification and change analysis of the Twin Cities (Minnesota) Metropolitan Area by multitemporal Landsat remote sensing. Remote Sensing of Environment 98: 317–328.
zhAng j, wAng k, li q & huA X. 2006. Status analysis and suggestions for bamboo utilization ratio in China. Forestry Machinery and Wood Working Equipment 34: 7–9. (In Chinese)
zhAng M & wAng g. 2008. The forest biomass dynamics of Zhejiang Province. Acta Ecologica Sinica 28: 5665–5674.
zhOu g & jiAng p. 2004. Density, storage and spatial distribution of carbon in Phyllostachy pubescens forest. Scientia Silvae Sinicae 40: 20–24. (In Chinese)