B ALTIMORE C ITY P UBLIC S CHOOLS City Schools New Teacher Contract The Ratification Process 1.
B’MORE DB8 Camp 2012
Name _________________________________ School___________________________________________
Baltimore Evidence And Source Text:
The BEAST TAKES ON THE 2012-2013 HIGH SCHOOL DEBATE TOPIC:Resolved: The United States federal government should substantially increase its transportation
infrastructure investment in the United States.
USING THE PLAN:Plan: The United States federal government should substantially increase investment in urban mass
transit to promote transportation equality.
Researcher: Beth SkinnerEditor: Chris Baron
The
A WORKBOOK of Evidence for theB-More Debate Institute
Mass Transit B’MORE DB8 Camp 2012
IndexIntroductionFormat of a Debate....................................................................................3Introduction to Transportation..................................................................4Introduction to Public Transportation.......................................................5
Building your case (all of the pages in this section can be pulled out for you to reorganize and build your case)1AC Affirmative.......................................................................................62AC Sheet.................................................................................................91NC Negative............................................................................................102NC Sheet.................................................................................................13Debate Card Sheet.....................................................................................14Analytical sheet.........................................................................................15
Some debate toolsSome Basic Debate Concepts...................................................................16Disadvantages...........................................................................................18Answers to Disadvantages........................................................................19How to Cut a Card....................................................................................20Sample Argument.....................................................................................22Sample Card..............................................................................................23Transportation Vocabulary Organizer......................................................24Debate Vocabulary Organizer...................................................................28Get ready for a Saturday competition!......................................................31Cool Quotations for Debate......................................................................32Cool QuotationsAbout Getting Around....................................................33
Researching TransportationWhat is the current transportation policy?................................................34How does transportation affect our lives?.................................................36How does transportation affect health?.....................................................40How does transportation affect the economy?..........................................42Is transportation a civil right?...................................................................46Is there a legal right to transportation?......................................................48Does public transportation hurt neighborhoods?......................................50Is transportation a state or federal issue?..................................................51
Page 2 of 57

Mass Transit B’MORE DB8 Camp 2012
Page 3 of 57
Mass Transit B’MORE DB8 Camp 2012
Page 4 of 57
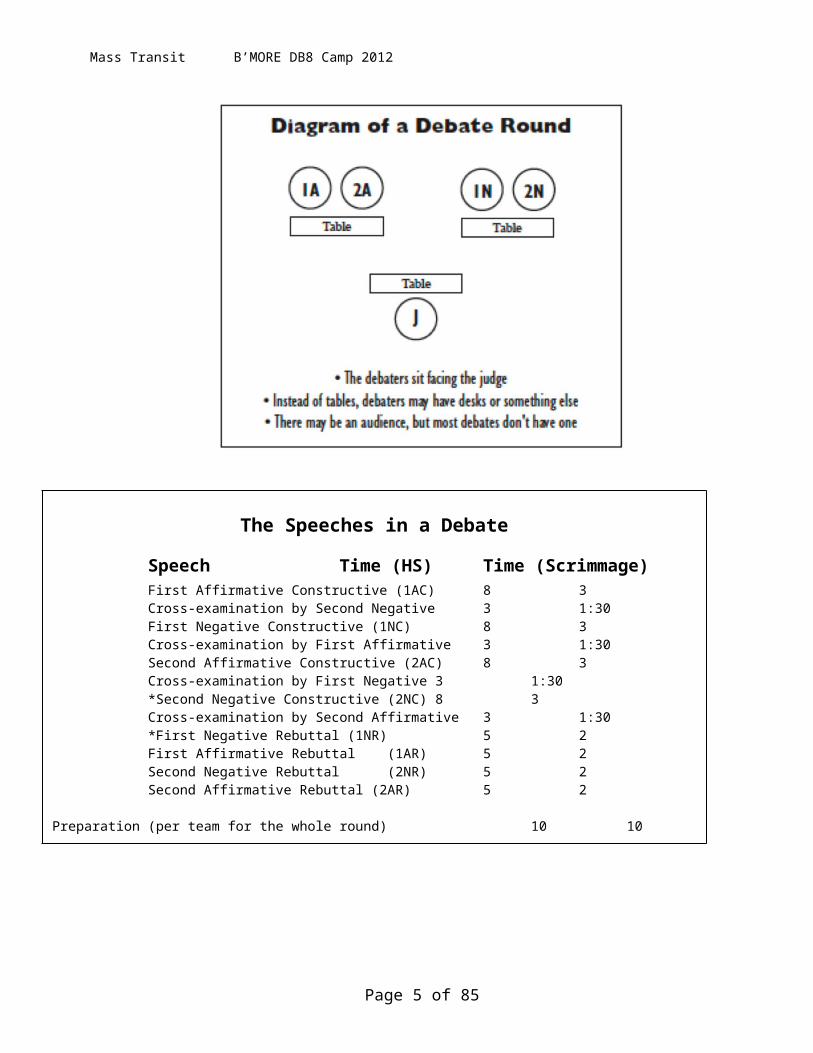
The Speeches in a Debate
Speech Time (HS) Time (Scrimmage)First Affirmative Constructive (1AC) 8 3Cross-examination by Second Negative 3 1:30First Negative Constructive (1NC) 8 3Cross-examination by First Affirmative 3 1:30Second Affirmative Constructive (2AC) 8 3Cross-examination by First Negative 3 1:30*Second Negative Constructive (2NC) 8 3Cross-examination by Second Affirmative 3 1:30*First Negative Rebuttal (1NR) 5 2First Affirmative Rebuttal (1AR) 5 2Second Negative Rebuttal (2NR) 5 2Second Affirmative Rebuttal (2AR) 5 2
Preparation (per team for the whole round) 10 10*These two speeches, 2NC and 1NR, are called the “negative block” and are treated as one long speech (with a cross-ex in between). The negative speakers should divide the important issues in the debate between them so that they each handle separate arguments rather than having the 1NR merely repeat the same ones the 2NC made.
Mass Transit B’MORE DB8 Camp 2012
A few points on the topic of transportation infrastructure:
Sample Affirmative Claims
Sample Negative Claims
Transportation is vital to jobs and the economy.
Building new infrastructure is too expensive – we cannot afford it now.
The federal government is the only one with resources to build infrastructure.
Cities and states best know their own transportation needs.
Without good transportation systems our cities become more segregated.
New transportation infrastructure will increase sprawl and hurt the environment.
We need better mass transit to decrease the pollution caused by cars.
More mass transit will hurt the auto industry and cause people to lose their jobs.
Roads and bridges are old and unsafe so we need to repair them.
The current system is doing a good job of meeting our transportation needs.
Add your own claims & warrants here:Affirmative Arguments Negative Arguments
Some questions to consider:Is our current transportation infrastructure adequate to meet our needs?What are the costs and benefits of more transportation infrastructure projects?If we didn’t spend money on transportation, what would the government be most likely to do with the money?
Page 5 of 57

Mass Transit B’MORE DB8 Camp 2012
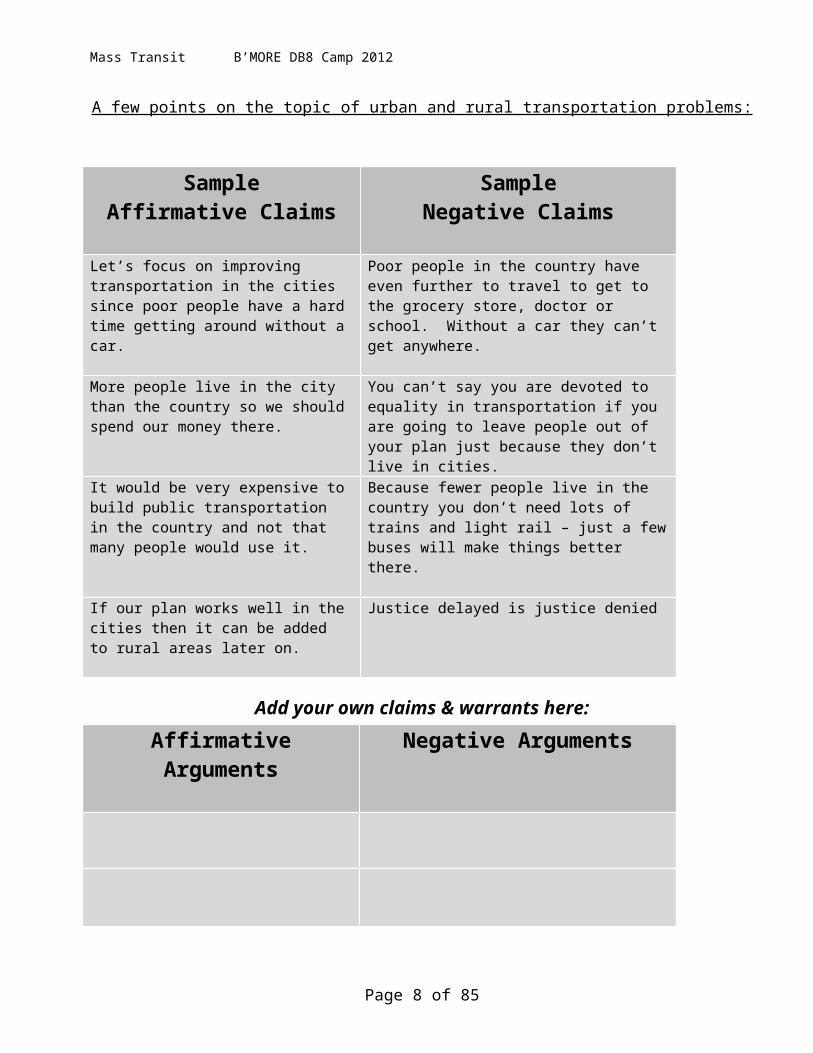
A few points on the topic of urban and rural transportation problems:
Sample
Affirmative ClaimsSample
Negative Claims
Let’s focus on improving transportation in the cities since poor people have a hard time getting around without a car.
Poor people in the country have even further to travel to get to the grocery store, doctor or school. Without a car they can’t get anywhere.
More people live in the city than the country so we should spend our money there.
You can’t say you are devoted to equality in transportation if you are going to leave people out of your plan just because they don’t live in cities.
It would be very expensive to build public transportation in the country and not that many people would use it.
Because fewer people live in the country you don’t need lots of trains and light rail – just a few buses will make things better there.
If our plan works well in the cities then it can be added to rural areas later on.
Justice delayed is justice denied
Add your own claims & warrants here:Affirmative Arguments Negative Arguments
Page 6 of 57
Mass Transit B’MORE DB8 Camp 2012
First Affirmative Speech 1/3Introduction:
Harm (describe the problem)
Insert Your Card! Card # :
Harm (describe the problem)
Page 7 of 57
Mass Transit B’MORE DB8 Camp 2012
Insert Your Card! Card # :
Page 8 of 57
Mass Transit B’MORE DB8 Camp 2012
First Affirmative Speech 2/3Inherency (describe how the current system won’t address the harm)
Insert Your Card! Card # :
THE PLAN: THE US FEDERAL GOVERNMENT WILL SUBSTANTIALLY INCREASE FUNDING FOR PUBLIC TRANSPORTATION INFRASTRUCTURE IN THE UNITED STATES.
Page 9 of 57

Mass Transit B’MORE DB8 Camp 2012
First Affirmative Speech 3/3Solvency (describe why your plan will solve the problem)
Insert Your Card! Card # :
Solvency (describe why your plan will solve the problem)
Page 10 of 57
Mass Transit B’MORE DB8 Camp 2012
Insert Your Card! Card # :
Page 11 of 57
Mass Transit B’MORE DB8 Camp 2012
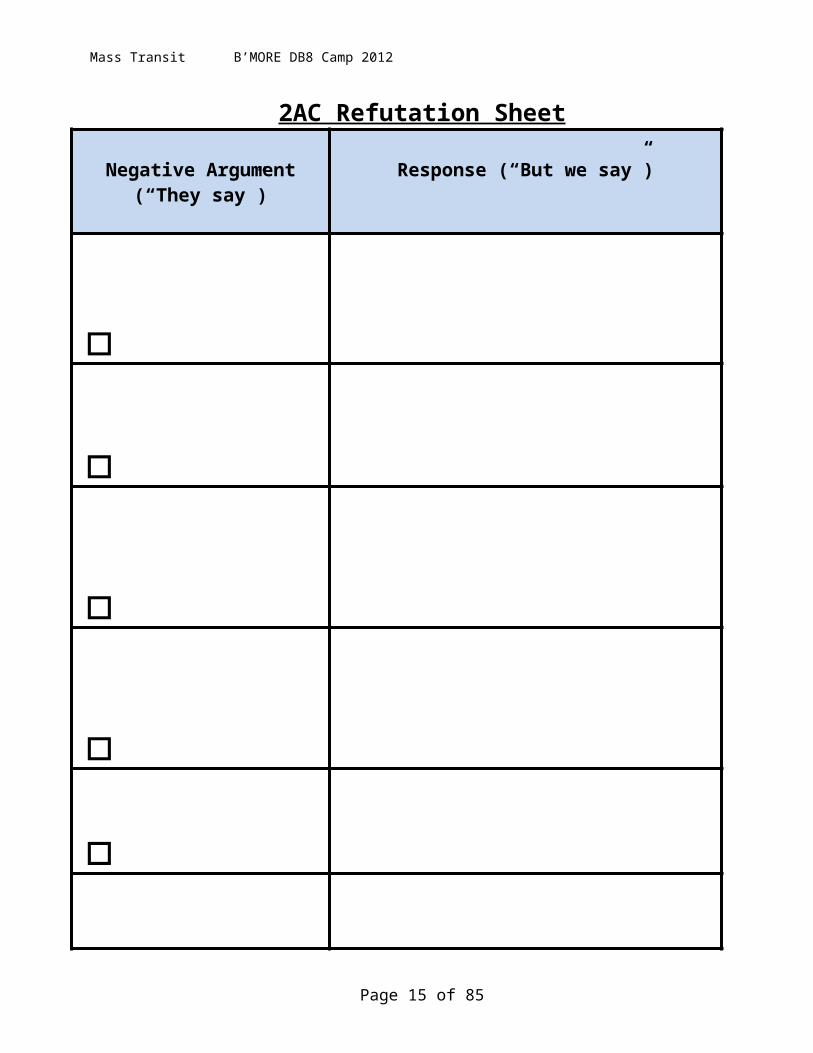
2AC Refutation Sheet
Negative Argument (“They say”)
Response (“But we say”)
Rank their arguments from strongest to weakestYou want to have more than one good answer to their best argumentsLook for places you can use your partner’s evidence from 1AC or bring in new evidence (including cards)
Page 12 of 57

Mass Transit B’MORE DB8 Camp 2012
First Negative Speech 1/3Introduction:
Title of your disadvantage:
Uniqueness (the beginning of the story: why things are okay now)
Insert Your Card! Card # :
Page 13 of 57
Mass Transit B’MORE DB8 Camp 2012
First Negative Speech 2/3Link (the middle of the story: how the affirmative causes something bad)
Insert Your Card! Card # :
Impact (the tragic end of the story: how they make things bad)
Page 14 of 57
Mass Transit B’MORE DB8 Camp 2012
Insert Your Card! Card # :
Page 15 of 57
Mass Transit B’MORE DB8 Camp 2012
First Negative Speech 3/3Now attack the affirmative case! Argue against their Inherency, Harm, Solvency, or even all 3!This is against their: Harm Inherency Solvency (circle one)Describe your point:
Insert Your Card! Card # :
This is against their: Harm Inherency Solvency (circle one)Describe your point:
Insert Your Card! Card # :
This is against their: Harm Inherency Solvency (circle one)Describe your point:
Page 16 of 57

Mass Transit B’MORE DB8 Camp 2012
Insert Your Card! Card # :
Page 17 of 57
Mass Transit B’MORE DB8 Camp 2012
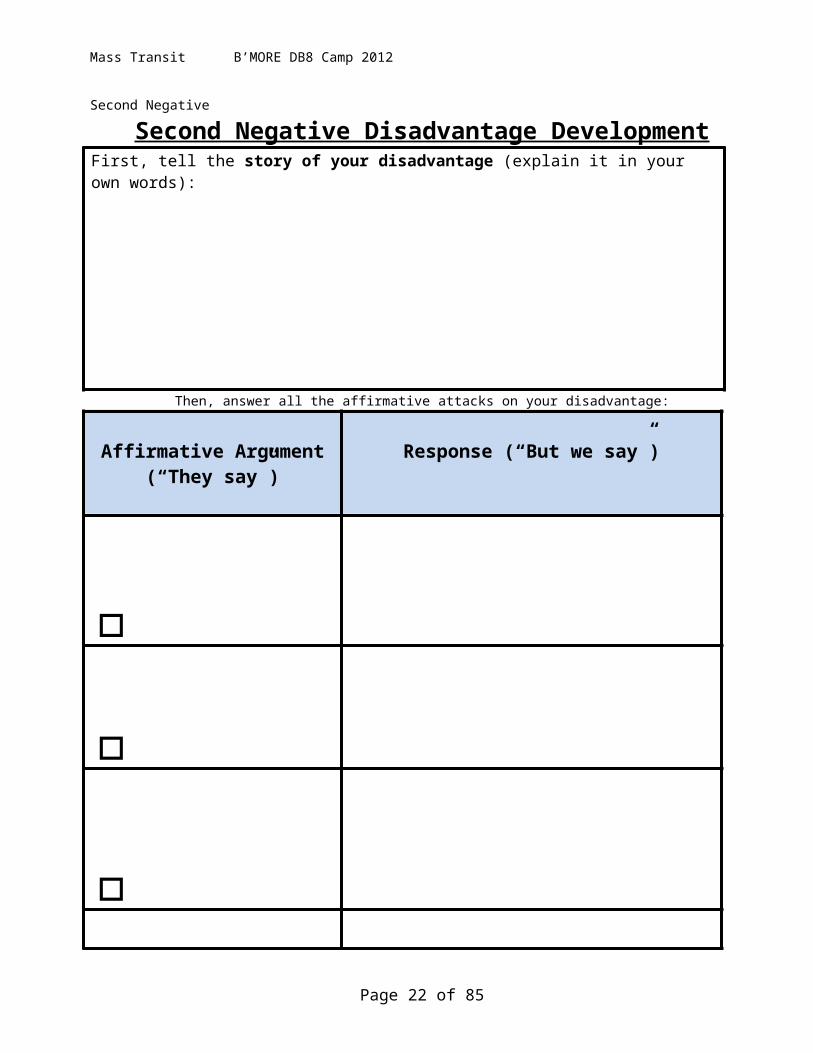
Second Negative
Second Negative Disadvantage DevelopmentFirst, tell the story of your disadvantage (explain it in your own words):
Then, answer all the affirmative attacks on your disadvantage:
Affirmative Argument (“They say”)
Response (“But we say”)
Finally, build your disadvantage up, with more evidence!
Page 18 of 57
Mass Transit B’MORE DB8 Camp 2012
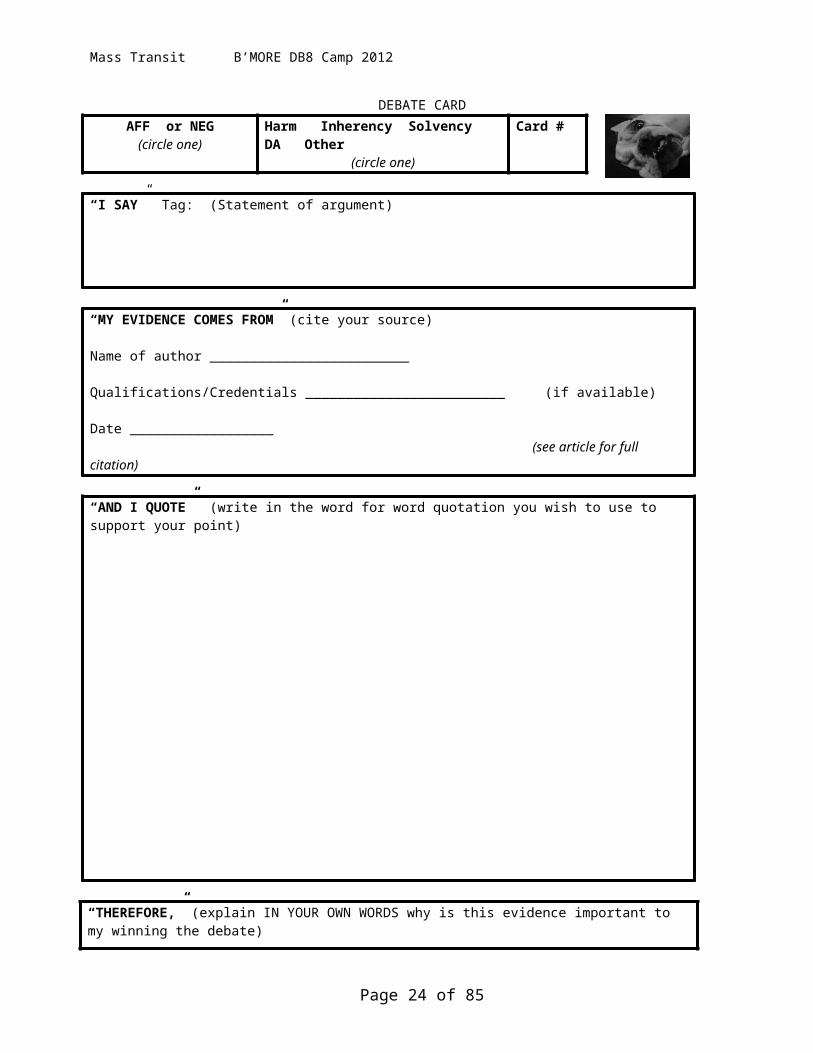
DEBATE CARDAFF or NEG
(circle one)Harm Inherency Solvency DA Other
(circle one)Card #
“I SAY” Tag: (Statement of argument)
“MY EVIDENCE COMES FROM” (cite your source)
Name of author _________________________
Qualifications/Credentials _________________________ (if available)
Date __________________ (see article for full citation)
“AND I QUOTE” (write in the word for word quotation you wish to use to support your point)
“THEREFORE,” (explain IN YOUR OWN WORDS why is this evidence important to my winning the debate)
Page 19 of 57
Mass Transit B’MORE DB8 Camp 2012
ANALYTICAL ARGUMENTAFF or NEG
(circle one)Harm Inherency Solvency DA Other
(circle one)Card #
Type of argument (circle one)
Example Analogy Story Personal experience Common knowledge Poem/Song Other
“I SAY” Tag: (Statement of argument)
“BECAUSE” Support (back up your point by explaining, using the story, example, analogy, etc.)
“THEREFORE,” (explain why is this evidence important to my winning the debate)
Page 20 of 57

Mass Transit B’MORE DB8 Camp 2012
Some Basic Debate Concepts 1/2You don’t have to know all these ideas backwards and forward to get started in debate, but they are the things that will help you figure out which points are important and which ones aren’t.Remember that everything in debate is DEBATABLE, so don’t rely on any RULES. If you can make a good point and defend it, you can win, regardless of what anyone says you are “supposed to do” in debate.
The affirmative side in the debate must argue for changing policy. They come into the debate needing to prove their case, much like the prosecution in a criminal trial. If the affirmative doesn’t meet their burden to prove their case, the negative can win, without putting on a case of their own.
The affirmative team can meet the burden of proof by addressing what are termed stock issues. These are the issues the affirmative needs to win to argue a new policy should be adopted. There are basically five stock issues. First, the issue of topicality is the question of whether the affirmative plan meets the words in the resolution. If the affirmative presents a strong case but does not meet the words in the resolution, the judge cannot endorse their plan. They are outside of the judge’s jurisdiction. Debates on topicality are sometimes technical and are debates about debating. For example, the negative says the affirmative is not a “substantial” increase, and defines substantial as 5%. The affirmative argues that this interpretation is bad for debate, and that substantial should mean “large in scope.” The judge must decide whose interpretation is better.
The second stock issue is harms (sometimes also described as “significance”). The affirmative must be able to show that a harm is occurring that requires action. They must show a felt difficulty—people must be suffering, the environment is being damaged, rights are violated, etc. If the negative is able to show that there is no harm or that the harm is inconsequential, there is no need for a plan.
The third stock issue is inherency. The Affirmative must show that the current system is not addressing the harm. If there is a harm but it is being adequately addressed, there is once again no need for action. For example, people may be victims of racism due to racial profiling, but if the negative could show that national legislation has just been passed, there would be no need pass it again.
The fourth stock issue is solvency. The affirmative plan must solve the harm they have outlined. If they can show a need for action but present a solution that will not address the need, action is futile. Negatives may attack the feasibility or workability of the plan, or may argue that the harm has alternate causes that make it difficult or impossible for the affirmative to solve.
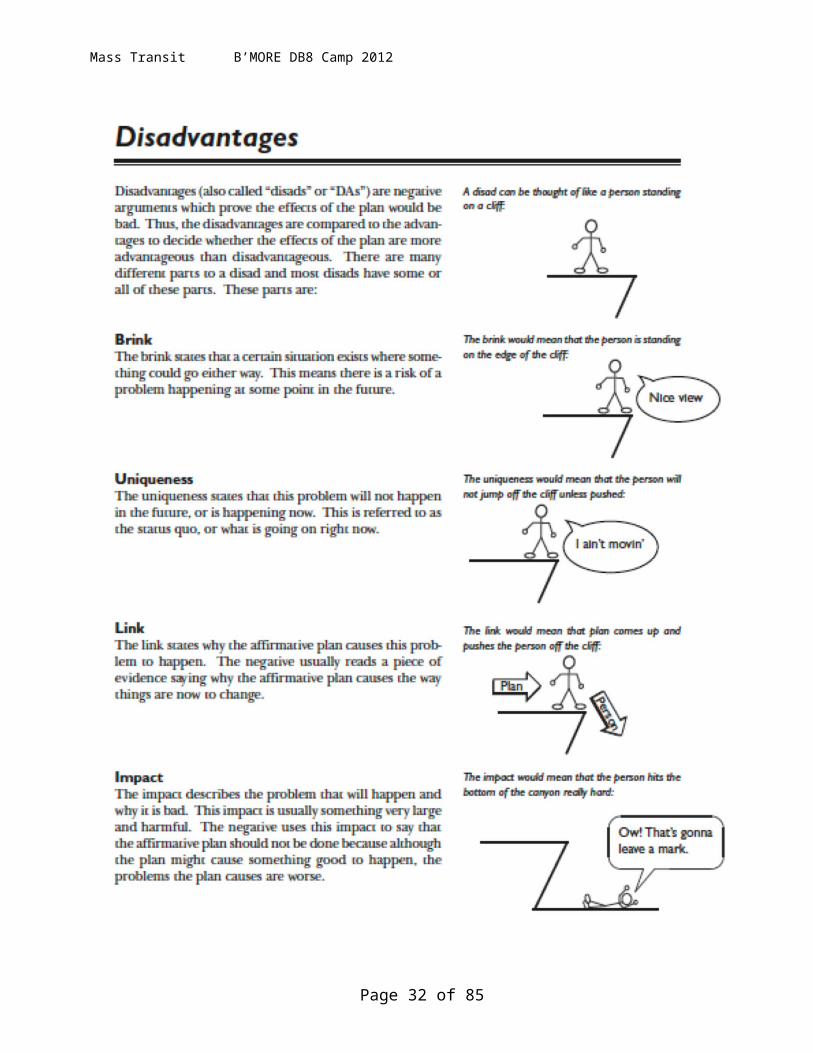
The last stock issue is disadvantage. Here the question is: do the drawbacks to action outweigh the advantages. There are three main parts to a disadvantage. The link is the connection between the affirmative plan and the disadvantage. The uniqueness is the part where the negative shows that the disadvantage is not happening. The impact is the portion of the disadvantage where the negative demonstrates the consequence of acting. More than one link may be needed to get from “point A” (the affirmative plan) to “point B” (the impact). For example, a negative might argue a disadvantage called federalism, where they take the position that the federal government should leave state issues to the states. An outline might look like this:
Disadvantage Spending:A. Uniqueness: Although they have not been cut yet, disaster relief is vulnerable to budget cuts.B. Link: the affirmative forces a trade off with disaster relief aid.
1. The affirmative plan is costly.2.New federal spending will force cuts in other areas.
C. Impact: Lack of disaster relief will cause massive deaths from natural disasters.Remember that all takes for the negative to win is to win one stock issue. If they only attack the affirmative on topicality, for example, they will still win if they win their topicality argument. They may also win on a combination of issues. One of the most common negative strategies, for example, is to minimize the affirmative solvency and outweigh what the affirmative has left with a disadvantage.
Page 21 of 57
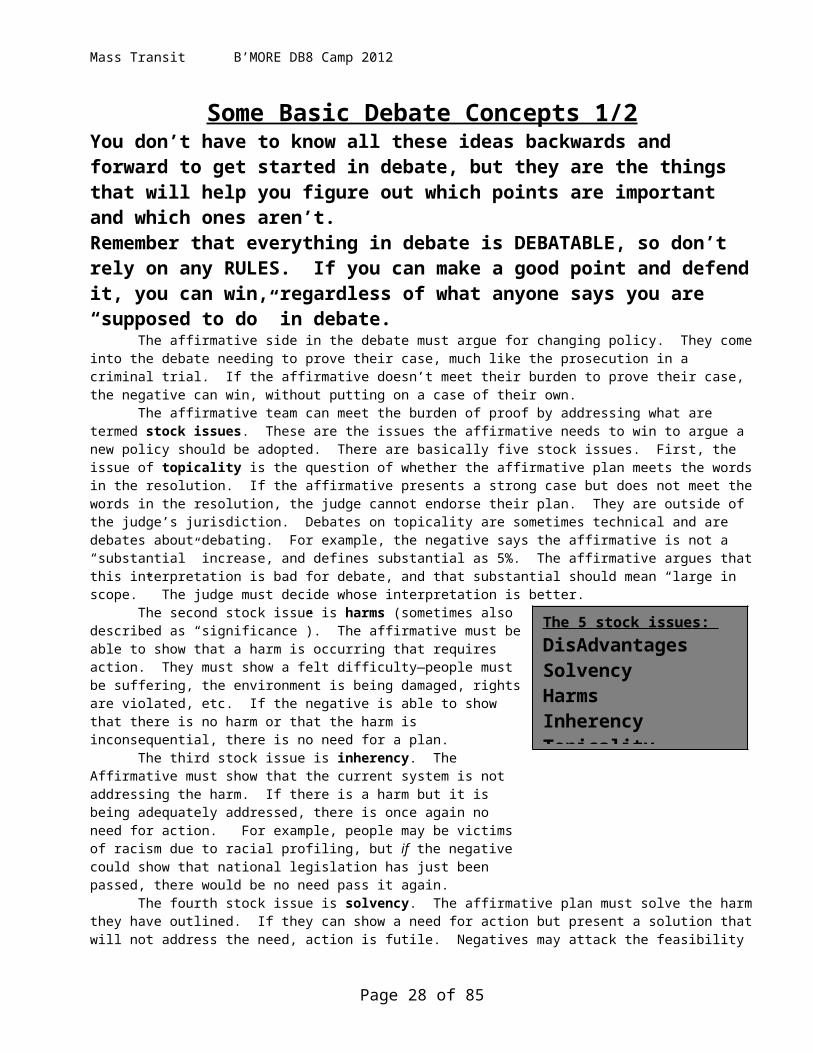
The 5 stock issues: DisAdvantagesSolvencyHarmsInherency Topicality
Mass Transit B’MORE DB8 Camp 2012
Some Basic Debate Concepts 2/2If you understand the stock issues, you are in good shape. Here are a few of the more
advanced ideas in debate:Two common, important arguments that are not specifically stock issues but are worth noting are counterplans
and critiques. When the negative abandons the status quo and advances their own counterplan, the debate becomes more complex. Generally speaking, the negative will need to show that their counterplan is a reason to vote against the plan. Most teams do this with a disadvantage that applies to the plan and not to the counterplan. Negatives also run critiques that question the assumptions of the affirmative team (like gendered language, western science, or state based solutions).
Using the Flow to win DebatesA speaker (any speaker, on either side) in a debate has the burden to refute the arguments made by the other side,
or else concede the arguments. Stated another way, in debate—silence means consent. This burden means several important things. First, it means that debaters can use what is previous speakers have said or not said to their strategic advantage. They may capitalize on arguments that their opponents ignored, pointing out that these concessions should cost them the debate. They may employ a “spread” strategy of presenting a large array of arguments in hopes that one will get past their opponents. Second, the judge must carefully track arguments to be able to identify dropped positions. If a speaker claims a position was
conceded, the judge must be able to verify this claim. The only way to do so is to take notes on all arguments made in the debate, to know what speech they were made in, and to be able to identify point of clash (so that it is clear which arguments answer other arguments).
Notes in debate are taken on what is called a flowsheet (more frequently abbreviated a flow). Judges “flow” the arguments by writing each claim in the debate down in the column in which the speaker makes the argument. Abbreviations, shorthand, and small handwriting are suggested. Because many arguments are made in a debate, and cramped flows can become messy, judges tend to use at least one sheet of paper for each stock issue presented in the first speech (usually labeled as “observations” “contentions” or “advantages”), as well as one sheet for each major negative position (disadvantages, topicality and similar important arguments are often labeled “off case” arguments). Debaters will sometimes present roadmaps before they begin their speeches to help the judge organize their flowsheets.
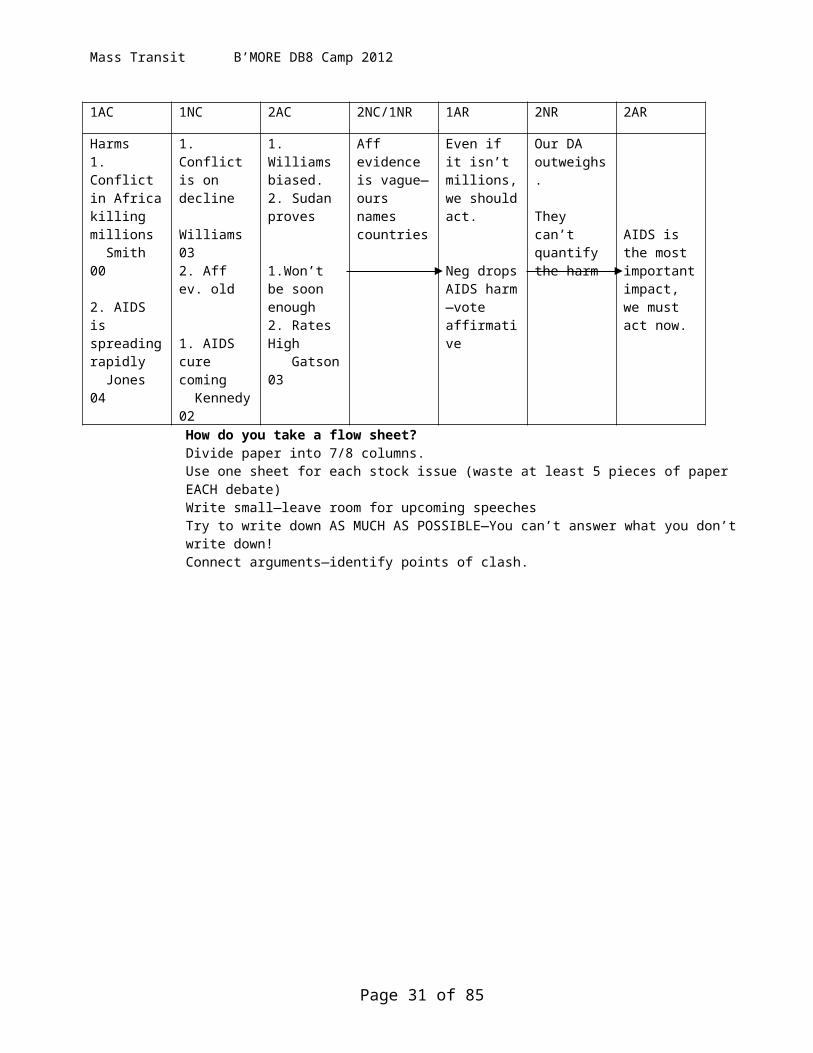
How do you take a flow sheet? Divide paper into 7/8 columns.Use one sheet for each stock issue (waste at least 5 pieces of paper EACH debate)Write small—leave room for upcoming speechesTry to write down AS MUCH AS POSSIBLE—You can’t answer what you don’t write down!Connect arguments—identify points of clash.
Page 22 of 57
1AC 1NC 2AC 2NC/1NR 1AR 2NR 2AR
Harms1. Conflict in Africa killing millions Smith 00
2. AIDS is spreading rapidly Jones 04
1. Conflict is on decline Williams 032. Aff ev. old
1. AIDS cure coming Kennedy 02
1. Williams biased.2. Sudan proves
1.Won’t be soon enough2. Rates High Gatson 03
Aff evidence is vague—ours names countries
Even if it isn’t millions, we should act.
Neg drops AIDS harm—vote affirmative
Our DA outweighs.
They can’t quantify the harm AIDS is the
most important impact, we must act now.
In debate, silence means consent.
Mass Transit B’MORE DB8 Camp 2012
Page 23 of 57
Mass Transit B’MORE DB8 Camp 2012
Page 24 of 57
Mass Transit B’MORE DB8 Camp 2012
How to Cut a Card What is a “Card”?A card is a tool you can use to help you make a strong point in a debate. People used to cut quotations out of newspaper and magazine articles and tape them to index cards. Now,many debaters do their work using computers.
Steps for Creating Evidence Cards
1. First find an important and relevant statement (this is a quotation from a book, article, etc.).
2. Next, record the citation (author’s name, author’s qualifications, source, date, page).
3. Then, decide which side (affirmative or negative) and stock issue best describes the evidence that you’ve found.
4. Finally, create a statement that summarizes the information (called a claim).
Labeling a card by side and stock issue– use this chart to help in directing your research. When researching for affirmative harm, try to find evidence that proves there are serious problems happening now to justify a change in policy. The claim and quote in your evidence card should be clear examples of the side and stock issue you’re trying to support.
Stock IssueSide Harm Inherency Solvency DisadvantageAffirmative serious problems
are happening nowthe current policy is responsible for the harm
changing to the aff policy will solve the harm
there aren’t serious drawbacks to change
Negative serious problems are not happening now
the current policy is not responsible for the harm
changing to the aff policy will not solve the harm
there are serious drawbacks to the aff change
Sample Claims – these are the types of claims that you might make on your evidence cards. Don’t just copy these claims – make sure your claim reflects the reasons given in the quote.
Harms Aff – Humans don’t care enough about the planet.Neg – People are working together to solve global problems now.
InherencyAff – Current funding for the telescopes to find alien life are not enough.Neg – The private sector can fund the search for alien life without government help.
SolvencyAff – More funding would allow SETI to be successful in finding out if we are alone.Neg – Radio telescopes will not be able to detect aliens.
DisadvantageNeg – Making service compulsory is coercive and violates important rights to Aff – National service is a reasonable price for all Americans to pay to support their
Page 25 of 57
Mass Transit B’MORE DB8 Camp 2012
Tips for card cutting
1. Find a Quotation – A direct quote from a published source.
a. Find full sentences – don’t leave out any part between the beginning and the end of the sentence.
b. Great quotes give a reason to support the argument you are making in the claim
c. Good quotes make claims themselves and also give reasons to support the claims—find parts of the articles where the authors explain why they believe what they believe.
d. Remember, this is the raw material for your evidence card -- find this first and build on it
2. Record the Citation for your quote– The cite tells the audience where the quote came from so they can judge its credibility. It should also be enough information for someone to find your exact quote again.
a. Required elements of a complete citation are: author's name, author's qualifications, source, publication date, and page number (plus URL and date accessed for internet sources)
b. If you are unable to find any one of these elements, you must indicate that on the card. For instance, you need to write "no author available" for a newspaper article without a byline
c. Special warnings for internet sources
- The whole URL is needed (all the way out to the .html part). If you have only www.cnn.com that’s not enough for someone to find your quote.- If all you can find for the citation is a URL address (www.zygote.com) then you don't have a good citation, or, therefore, a good evidence card.
- You may have to search for the author’s qualifications – start by looking at the beginning and end of an article or book.
- You may have to search for a source – the source is often the organization hosting the site (cnn.com would be Cable News Network, for instance). - Every internet source needs to include a download date in addition to a publication date.
3. Write a Claim (also called a “tag”) – This is the argument you’re trying to prove with your quote.
a. A claim is a single, simple sentence that makes your argument.
b. An acceptable claim goes beyond just summarizing or repeating words in the quote.
c. A good claim provides a link between the quotation and the wider issues of the debate (i.e. that there is a serious problem in the current system or that the problem cannot be solved by the affirmative proposal).
Page 26 of 57
Mass Transit B’MORE DB8 Camp 2012
SAMPLE Argument This is an example of an AFFIRMATIVE argument you could make in a speech. But make your own!Harm (describe the problem)
Many people can’t get to work at good jobs because they don’t have good transportation.
Insert Your Card! Card # : 1 (see sample card)
Page 27 of 57
Mass Transit B’MORE DB8 Camp 2012
SAMPLE DEBATE CARDThis is just a sample. Make your own!!!
AFF or NEG(circle one)
Harm Inherency Solvency DA Other(circle one)
Card #1
“I SAY” Tag: (Statement of argument)
Many people can’t get to work at good jobs because they don’t have good transportation
“MY EVIDENCE COMES FROM” (cite your source)
Name of author ___Timothy Baldwin ______Qualifications/Credentials Northwestern University law school (if available)
Date ____2006______________ (see article for full citation)
“AND I QUOTE” (write in the word for word quotation you wish to use to support your point)
The dilemma facing the poor in New Orleans during Hurricane Katrina symbolizes the larger transportation problem facing the poor in the U.S. They often bear the brunt of the nation's transportation problems. During the 1950s, the first major decade of interstate highway construction in the U.S., over 350,000 homes were raised, and new highways were often placed in poor communities. Today, even though most individuals live near road networks, ninety percent of former welfare recipients do not have access to a car. Less than half of all jobs in the U.S. are accessible by public transportation. Poorer individuals like welfare recipients, most of whom cannot or can only barely afford a car, are shut out from half of all jobs in the country. Compounding the problem, most cities do not provide public transportation during the second and third shift jobs that tend to be available to the poor. Unable to afford a car and without any method of commuting to work, many welfare recipients are unable to find jobs.
Page 28 of 57
“THEREFORE,” (explain IN YOUR OWN WORDS why is this evidence important to winning the debate)
Unless we take action many people will be unable to escape the cycle of poverty.
Mass Transit B’MORE DB8 Camp 2012
Transportation VocabularyC
onte
xt
We
can’
t hav
e a
stro
ng e
con
omy
if w
e ha
ve a
w
eak
infr
astru
cutre
.
Gen
trific
atio
n ra
ised
pro
perty
val
ues a
nd fo
rced
po
orer
peo
ple
out o
f nei
ghbo
rhoo
ds li
ke F
eder
al
Hill
, C
anto
n an
d Fe
ll’s P
oint
Def
initi
on
The
unde
rlyin
g fo
unda
tion
or fr
amew
ork
of a
syst
em.
A p
roce
ss i
n w
hich
rich
er p
eopl
e m
ove
into
the
com
mun
ities
of p
oore
r peo
ple,
of
ten
disp
laci
ng th
em
Ter
m
infr
astr
uctu
re
gent
rific
atio
n
mas
s tra
nsit
inve
stm
ent
Page 29 of 57
Mass Transit B’MORE DB8 Camp 2012
Transportation VocabularyC
onte
xtD
efin
ition
Ter
m
de fa
cto
righ
t
disp
arat
e im
pact
spra
wl
fede
ralis
m
Page 30 of 57
Mass Transit B’MORE DB8 Camp 2012
Transportation VocabularyC
onte
xtD
efin
ition
Ter
m
gas t
ax
bloc
k gr
ant
part
isan
ship
appr
opri
atio
n
Page 31 of 57
Mass Transit B’MORE DB8 Camp 2012
Transportation VocabularyC
onte
xtD
efin
ition
Ter
m
Page 32 of 57

Mass Transit B’MORE DB8 Camp 2012
Debate VocabularyC
onte
xtD
efin
ition
Ter
m
Car
d
Res
olut
ion
Cla
im
Ref
ute
Page 33 of 57

Mass Transit B’MORE DB8 Camp 2012
Debate VocabularyC
onte
xtD
efin
ition
Ter
m
DA
Flow
Kri
tik
Solv
ency
Page 34 of 57

Mass Transit B’MORE DB8 Camp 2012
Debate VocabularyC
onte
xtD
efin
ition
Ter
m
Page 35 of 57

Mass Transit B’MORE DB8 Camp 2012
Get Ready for a Saturday Competition!Novices should attend at least 3 meetings to get ready for winning trophies at a Saturday tournament. You want to make sure you have received materials and/or help with 3 major topics:
A. The Basics of Debate. What are the Stock Issues (DA SHIT)? What are the time limits/the order of the speeches? How do you take a flow sheet? What is this year’s resolution? Who decides who wins? Who do we debate against? What does the affirmative have to do to win? What does the negative have to do to win?
B. Winning on the Affirmative. What does the affirmative case say? What are the harms? How does it solve? What happens in cross examination? How do we answer negative attacks? What do we do in rebuttals?
C. Winning on the Negative. What are disadvantages? What are the parts of a disadvantage? How can we attack the case? How do we extend our arguments? How do we beat the affirmative’s answers? What do we do in cross examination?
You will also need: A partner (if there isn’t one, come to the tournament—we will find you one from another school) Affirmative and Negative Evidence Speech materials for the first two speeches (and ideas/arguments for the 2AC/2NC Paper (to take notes on) Pen
Knowledge is power. The more information you have, the more likely you are to get a trophy. Attending more meetings, getting more evidence, and practicing will help you defeat the opposition. But if you can answer the questions listed above, you are ready for tournament competition!!
Page 36 of 57
Mass Transit B’MORE DB8 Camp 2012
Cool Quotations You Can Use In Any Debate“Never doubt that a small group of thoughtful, committed citizens can change the world. Indeed, it is the only thing that ever has.“--Margaret Mead, American Anthropologist
“Don't think there are no crocodiles because the water is calm. “Malayan Proverb
“The only thing we have to fear is fear itself.”Franklin D. Roosevelt, US president, inauguration speech
“We allow our ignorance to prevail upon us and make us think we can survive alone, alone in patches, alone in groups, alone in races, even alone in genders. “Maya Angelou
“It may be true that the law cannot make a man love me, but it can stop him from lynching me, and I think that's pretty important. “Martin Luther King Jr.
“If you don't stand for something you will fall for anything. “Malcolm X
"I'm worried that students will take their obedient place in society and look to become successful cogs in the wheel - let the wheel spin them around as it wants without taking a look at what they're doing. I'm concerned that students not become passive acceptors of the official doctrine that's handed down to them from the White House, the media, textbooks, teachers and preachers." — Howard Zinn
“And so, my fellow Americans, ask not what your country can do for you; ask what you can do for your country. “John F. Kennedy
"You can't lead the people if you don't love the people. You can't save the people if you don't serve the people." — Cornel West
“Without a struggle, there can be no progress.” Frederick Douglass
“As human beings, our greatness lies not so much in being able to remake the world - that is the myth of the atomic age - as in being able to remake ourselves. “Mohandas Gandhi
Imagination is more important than knowledge. Albert Einstein
Page 37 of 57

Mass Transit B’MORE DB8 Camp 2012
Quotations About Getting Around
“The automobile has not merely taken over the street, it has dissolved the living tissue of the city. Its appetite for space is absolutely insatiable; moving and parked, it devours urban land, leaving the buildings as mere islands of habitable space in a sea of dangerous and ugly traffic.” ---James Marston Fitch, Architect and Urban Planner, New York Times, 1 May 1960
You got a fast carAnd I got a plan to get us out of hereI been working at the convenience storeManaged to save just a little bit of moneyWe won't have to drive too farJust 'cross the border and into the cityYou and I can both get jobsAnd finally see what it means to be living …
You got a fast carAnd we go cruising to entertain ourselvesYou still ain't got a jobAnd I work in a market as a checkout girlI know things will get betterYou'll find work and I'll get promotedWe'll move out of the shelterBuy a big house and live in the suburbs
---Tracy Chapman, Fast Car, 1988
“Lots of people want to ride with you in the limo, but what you want is someone who will take the bus with you when the limo breaks down.”
---Oprah Winfrey,
“ We willingly pay 30,000-40,000 fatalities per year for the advantages of individual transportation by automobile.”---Jon von Neumann, mathematician and scientist
One has to go back a while to recall a time when cars were simply means of transportation. In those days, they were just considered automobiles. Today, cars are extensions of their owners. They make statements about the character and status of their owners. They are loved, polished and pampered by some owners. They elicit a wide range of emotions, ranging from exasperation when they don't work to pure delight when they are expensive, beautiful and drive like a dream. They cause people to stare and drool and say "Some day...."
Ebony Magazine, "Celebrities and Their Favorite Cars," Nov. 1987
“When decisions are made about transportation resources and funding, those decisions are rarely made in consultation with or in consideration of low-income people who tend to rely heavily on public transportation as their main access to services.” –Wade Henderson, President and CEO, The Leadership Conference on Civil and Human Rights.
People in neighborhoods with plentiful transit options spend just nine percent of their incomes on transportation, compared to the average American family’s expenditure of 19 percent. In car-dependent outer suburbs, families spend 25 percent of their incomes on transportation. Leadership Conference Civil and Human Rights Coalition
Page 38 of 57

Mass Transit B’MORE DB8 Camp 2012
ARTICLE 1: WHAT IS THE CURRENT TRANSPORTATION POLICY?
Baltimore Sun, February 27, 2012(Editorial: The Gridlock over Transportation Spending, accessed June 6, 2012 athttp://articles.baltimoresun.com/2012-02-27/news/bs-ed-transportation-20120227_1_transportation-bill-gas-tax-transit-program)
When U.S. Transportation Secretary Ray LaHood, a Republican, recently called the House transportation bill the worst such measure he's seen in 35 years of public service, he was being kind. Surely, it's among the worst, most cynically partisan bills to ever threaten U.S. highway and transit infrastructure in all of recorded history.
That's because the serious business of building and maintaining roads, bridges, rail systems and other vital transportation assets is usually among the most bipartisan of Congressional actions. Every community requires such spending whether it's rural, a small town or a big city. Decaying bridges are a danger, and without transit, cities would not function.
But it's clear House Republicans have decided to ignore precedent, and the result has been an absolute mess. As introduced earlier this month, the $260 billion American Energy and Infrastructure Jobs Act would strip public transportation of its gas tax funding and pour it all into highways, open up protected lands to oil and gas drilling, and roll back contributions to federal employee pensions.When it became clear that wasn't going to fly, House Speaker John Boehner broke it up into three components, won approval for the drilling and pension changes but pulled back the transportation bill for lack of support. Even so, the measure — HR7 — is expected to land this week on the floor, where it faces some 300 possible amendments.
Even by Congressional standards, this is heavy-handed stuff. The Senate's version of the transportation bill, a more conventional two-year, $109 billion program, has won support from both Democrats and Republicans and is nothing like the House monstrosity. It, too, is soon headed to floor debate.
Even if the House chooses not to gut the nation's transit program, Mr. Boehner and others in the Republican leadership are still pressing to tie future transportation funding to highly speculative domestic oil and gas drilling. They would also require approval of the Keystone XL pipeline — just another sign that politics, not policy, is driving this transportation bill off the veritable bridge to nowhere.
But wait, there's a lot more. The House would eliminate the federal bridge repair program and leave the country's 69,000 deficient bridges up to states and local governments. The plan diverts money that's supposed to be used to improve air quality into road construction (hardly the way to reduce emissions) and even sets new rules on local agencies that provide bus and rail service that experts say will only increase government bureaucracy and waste.
What's particularly distressing about the House's irresponsible proposal is that rarely has the country been in greater need of transportation investment. The federal Highway Trust Fund is running on empty because the federal gas tax hasn't been increased since 1993. Had the tax just been allowed to
Page 39 of 57
Mass Transit B’MORE DB8 Camp 2012
keep up with inflation since it was created in the 1950s, it would be 7 cents higher than the current 18.4 cents per gallon of gasoline.
Admittedly, the Obama administration has failed to show much leadership in this arena. The president's $476 billion, six-year transportation reauthorization included in its Fiscal 2013 budget proposes a level of spending that's appropriately high but unlikely to win Congressional approval. Worse, the administration wants to finance much of it through savings from reduced military operations in Iraq and Afghanistan, an uncertain funding source at best.
Polls show Americans hate the gas tax, and clearly, nobody in Washington is brave enough to even suggest raising it. Yet this failure to maintain adequate roads and transit is going to cost consumers as much as rising gasoline prices. As the nation's economy picks up speed, traffic won't. And getting stuck in gridlock while burning $4-a-gallon gasoline will be costly, as will be the time wasted and all the risks to human life posed by unsafe roads (not mention higher repair, insurance and maintenance costs).
Something close to the Senate bill — a short-term patch — is probably the most the nation can expect, at least until Congress and the White House craft a more serious solution to the nation's worsening transportation woes. The motoring public should be at least as outraged by this failure to craft a long-term transportation policy (something well within the grasp of Congress) than upset by prices at the pump which, in a global energy market, are largely out of Washington's control.
Page 40 of 57

Mass Transit B’MORE DB8 Camp 2012
ARTICLE 2: HOW DOES TRANSPORTATION AFFECT OUR LIVES?
Bullard, professor of sociology at Clark Atlanta University, 2006(Robert D. Bullard is the Ware Distinguished Professor of Sociology and Director of the Environmental Justice Resource Center at Clark Atlanta University. He is the author of fourteen books, including Highway Robbery: Transportation Racism and New Routes to Equity (South End Press, 2004), Race, Poverty and the Environment Winter 2005-2006)
Follow the transportation dollars and one can tell who is important and who is not. While many barriers to equitable transportation for low-income and people of color have been removed, much more needs to be done. Transportation spending programs do not benefit all populations equally. The lion's share of transportation dollars is spent on roads, while urban transit systems are often left in disrepair. Nationally, 80 percent of all surface transportation funds is earmarked for highways and 20 percent for public transportation. Generally, states spend less than 20 percent of federal transportation funding on transit.1 Some 30 states even restrict the use of the gas tax revenue—the single largest source of transportation funding—to funding highway programs only.
In the real world, all transit is not created equal. In general, most transit systems tend to take their low-income “captive riders” for granted and concentrate their fare and service policies on attracting middle-class and affluent riders.3 Hence, transit subsidies disproportionately favor suburban transit and expensive new commuter bus and rail lines that serve wealthier “discretionary riders.”
What We PayOn average, Americans spend 19 cents out of every dollar earned on transportation—an expense second only to housing. Transportation costs range from 17.1 percent in the Northeast to 20.8 percent in the South, and eat up more than 40 percent of the takehome pay of the nation’s poorest. This is an especially significant statistic for African American households, which typically earn 35 percent less than the average white household.4
How We Get AroundThe private automobile is still the most dominant mode of transportation for every segment of
the American population and provides enormous employment access advantages to its owner. Automobile ownership is almost universal in the United States with 91.7 percent of households owning at least one vehicle.
According to the 2001 National Household Travel Survey (NHTS) released in 2003, 87.6 percent of white people, 83.1 percent of Asians and Hispanics, and 78.9 percent of African Americans rely on the private car to get around.5 Clearly then, a lack of car ownership - especially among low-income people of color - combined with an inadequate public transit service in many central cities and metropolitan regions only serve to exacerbate social, economic, and racial isolation.
Living near a seven-lane freeway is not much of a benefit for someone who does not have access to a car. Nationally, only seven percent of white households do not own a car, compared to 24 percent of African American households, 17 percent of Latino households, and 13 percent of Asian American households. African Americans are almost six times as likely as whites to use transit to get around. In urban areas, African Americans and Latinos comprise over 54 percent oftransit users (62 percent of bus riders, 35 percent of subway riders, and 29 percent of commuter rail riders).
Page 41 of 57
Mass Transit B’MORE DB8 Camp 2012
How Race Defines SpaceIn 2000, population in the U.S. was 69 percent European American, 12 percent African
American, 12.5 percent Hispanic, and 3.6 percent Asian American. In the nation's 100 largest cities, people of color comprise nearly half of the population. In the major metropolitan areas where most African Americans, Latinos, and Asians live, segregation levels changed little between 1990 and 2000. Black-White segregation is still significantly higher than segregation levels for other ethnic groups. The average white American lived in a neighborhood that was 80 percent white, eight percent Hispanic, seven percent Black, and four percent Asian. Similarly, the typical African American lived in a neighborhood that was 51 percent Black, 33 percent white, 12 percent Hispanic, and three percent Asian. Three-fifths of all Blacks live in ten states—New York, California, Texas, Florida, Georgia, Illinois, North Carolina, Maryland, Michigan, and Louisiana—and nearly 55 percent of them live in the South. The Northeast and Midwest each had 19 percent of the Black population in 2000, and the West had about 10 percent. Over 88 percent of Blacks live in metropolitan areas and 53.1 percent live inside central cities.
For the nation’s 36.4 million African Americans, race clearly underlies and intersects with other factors in explaining the socio-spatial layout of most of our cities, suburbs, and metropolitan regions, and a host of other quality-of-life indicators, such as the location of job centers, housing patterns and land use, the quality of air, transportation, and schools, streets and highway configuration, commercial and business development, and access to health care.
When Jobs Go SuburbanCentral cities contain 20 percent of all workers and account for 69 percent of all transit use. On
the other hand, suburbs account for half of all workers but generate only 29 percent of all transit trips. Nationwide, nearly 60 percent of transit riders are served by the ten largest urban transit systems and the remaining 40 percent by the other 5,000 transit systems.
In recent years, many jobs have shifted to the suburbs and communities where public transportation is inadequate or nonexistent. The exodus of lowskilled jobs to the suburbs disproportionately affects central city residents, particularly people of color, who often face a more limited choice of housing location and transportation in growing areas. Between 1990 and 1997, jobs on the fringe of metropolitan areas grew by 19 percent versus four percent in core areas.
The suburban share of the metropolitan office space is 69.5 percent in Detroit, 65.8 percent in Atlanta, 57.7, percent in Washington DC, 57.4 percent in Miami, and 55.2 percent in Philadelphia. Getting to these suburban jobs without a car is next to impossible. It is no accident that Detroit leads in suburban “office sprawl.” Detroit is also the most segregated big city in the United States and the only major metropolitan area without a regional transit system. Only about 2.4 percent of metropolitan Detroiters use transit to get to work.
The Worst Polluters of AllTransportation-related sources account for over 30 percent of the primary smog-forming
pollutants emitted and 28 percent of the fine particulates. Vehicle emissions are the main reason why 121 Air Quality Districts in the U.S. are in noncompliance with the 1970 Clean Air Act's National Ambient Air Quality Standards. Over 140 million Americans, 25 percent of them children, live, work, and play in areas where air quality does not meet national standards.
Page 42 of 57
Mass Transit B’MORE DB8 Camp 2012
Emissions from cars, trucks, and buses cause 25 to 51 percent of the air pollution in the nation's non-attainment areas. Transportation related emissions also generate more than a quarter of the greenhouse gases.Improvements in transportation investments and air quality are of special significance to low-income persons and people of color who are more likely to live in areas with reduced air quality. National Argonne Laboratory researchers discovered that 57 percent of whites, 65 percent of African Americans, and 80 percent of Latinos lived in the 437 counties that failed to meet at least one of the EPA ambient air quality standards.10 A 2000 study from the American Lung Association shows that children of color are disproportionately represented in areas with high ozone levels. Additionally, 61.3 percent of Black children, 69.2 percent of Hispanic children, and 67.7 percent of Asian American children live in areas that exceed the 0.08 parts per million ozone standard, while only 50.8 percent of white children live in such areas.
Asthma—The Price of PollutionAir pollution from vehicle emissions causes significant amounts of illness, hospitalization, and
premature deaths. A 2002 study published in The Lancet shows a strong causal link between ozone and asthma. Ground-level ozone may exacerbate health problems such as asthma, nasal congestion, throat irritation, respiratory tract inflammation, reduced resistance to infection, changes in cell function, loss of lung elasticity, chest pains, lung scarring, formation of lesions within the lungs, and premature aging of lung tissues.
Air pollution claims 70,000 lives a year, nearly twice the number killed in traffic accidents.14 A 2001 Center for Disease Control report, “Creating a Healthy Environment: The Impact of the Built Environment on Health,” points a finger at transportation and sprawl as major health threats. Although it is difficult to put a single price tag on the cost of air pollution, estimates range from $10 billion to $200 billion a year.16 Asthma is the number one reason for childhood emergency room visits in most major cities in the country. The hospitalization rate for African Americans is three to four times the rate for whites and they are three times more likely than whites to die from asthma. Moreover, Blacks and Hispanics now comprise 52.6 percent of the 43 million Americans without health insurance. Nearly one-half of working-age Hispanics (46 percent) lacked health insurance for all or part of the year prior to the survey, as did one-third of African Americans (30 percent). In comparison, one-fifth of whites and Asian Americans (21 and 20 percent, respectively) in the 18 to 64 age group lacked coverage for all or part of the year.
Energy Security or ‘War for Oil’?Today, transportation accounts for about half of the world oil demand, and road vehicles are
responsible for over 70 percent of transportation energy consumption. In addition to the health and environmental reasons for moving beyond oil to more secure and sustainable alternative fuels, there are compelling energy security and economic strength reasons to invest in clean fuels technology.
The United States accounts for almost one-third of the world’s vehicles, with over 217 million cars, buses, and trucks that consume 67 percent of the nation’s oil. Transportation-related oil consumption in the U.S. has risen 43 percent since 1975. With just five percent of the world’s population, Americans consume more than 25 percent of the oil produced worldwide. More importantly, with almost 60 percent of our oil coming from foreign sources, ‘war for oil’ looms as a constant scenario, with the burdens of war falling heaviest on the poor, the working class, and the people of color who make up a disproportionately large share of the all-volunteer military. (Although
Page 43 of 57
Mass Transit B’MORE DB8 Camp 2012
African Americans represent only 13 percent of the U.S. population, they make up 20 percent of the war dead in the current conflict with Iraq.)
Seeking an End to Transportation Racism
Discrimination still places an extra “tax” on poor people and people of color who need safe, affordable, and accessible transportation. Many of the nation’s transportation-related disparities have accumulated over a century, and it will likely take years, great effort, and plenty of resources to dismantle the deeply ingrained legacy of transportation racism. The effort has begun with grassroots leaders from New York City to Los Angeles demanding an end to transportation racism. They are spreading the word that transportation dollars are aiding and abetting the flight of people, jobs, and development to the suburban fringe. They are fighting for affordable fares, representation on transportation boards and commissions, and their fair share of transit services, bus shelters, handicapped accessible vehicles, and other transit-related amenities. Some groups are waging grassroots campaigns to get “dirty diesel” buses and bus depots out of their neighborhoods. Others are struggling to get public transit systems linked to job and economic activity centers, and to get workers a livable wage so that they, too, can have transportation options.
Page 44 of 57
Mass Transit B’MORE DB8 Camp 2012
ARTICLE 3: HOW DOES TRANSPORTATION AFFECT HEALTH?
Gottlieb and Fisher, University of California Transportation Center, 1996Robert Gottlieb, Andrew Fisher, et. al; UC Transportation Center, 1996Accessed June 6, 2012 at http://www.foodsecurity.org/homewardbound.pdf
…In sum, transportation obstacles prevent inner city residents from shopping where they would like. For those households without access to a vehicle, distance, not price or selection,is the primary factor determining choice of food store.23 Food shopping becomes a question of not what one would like to buy, but what is available, given mobility restrictions. In this context, the development of a centralized supermarket-based food distribution system, as facilitated by the growth in popular ownership of the automobile, and in conjunction with the unresponsiveness of the mass transit sector to the food shopping-related transportation needsof the poor, has substantially diminished the food security of many inner city communities.
Poor food access negatively affects the health of inner city consumers through three fundamental avenues. As shown above, transit dependent residents often must dedicate substantial resources to obtain transportation to and from the store, reducing funds available for food purchases. Similarly, high prices reduce the buying power of the poor. In both cases, the ensuing result of reduced purchasing power from an individual standpoint is increased hunger and reduced abilityto purchase non-staples with greater price elasticity such as fruits and vegetables.
Up to one billion dollars in food stamp purchasing power may be lost due to higher prices in inner city markets. 24 A price comparison in Los Angeles found that a market basket containing items necessary for a minimally nutritionally adequate diet would cost a family of three $285 more per year when purchased in inner city supermarkets than in comparable suburban markets. 25 While supermarkets in low income neighborhoods may charge high prices (for the reasons described in the previous section), corner mom and pop stores’ prices are often astronomical.
With their lack of an economy of scale, small stores often purchase their items at near retail prices at “cash and carry” outlets, and must charge substantial margins on their goods. Prices at mom and pop stores have been reported to be 42%-64% higher than at surrounding supermarkets. 26 Just as mom and pop stores must charge high margins to be economically viable, they must stock goods with high profit margins.
Limited shelf and cooler space combined with the costs of spoilage preclude them from carrying a full line of healthy foods and produce. Surveys of mom and pop stores have found little in the way of produce, which, when present, includes an abundance of packaged processed foods, is often of poor quality and aged, and often provides little selection of low-fat products, such as skim milk. Research of Los Angeles “mom and pops” found it impossible to purchase a nutritionally adequate diet as defined by the USDA’s Thrifty Food Plan in any one or combination of these stores. By way of example, in another low income community, only five of 38 convenience stores stocked the ingredients for a balanced meal. Of these stores, only half carried milk, while all sold alcohol.27
Page 45 of 57
Mass Transit B’MORE DB8 Camp 2012
The lack of availability of healthy foods can aggravate high rates of diet-related diseases to which Latinos and African Americans (who often are the primary demographic groups in inner cities) are most vulnerable. One of the most important outcomes of poor nutrition is increased incidence of chronic disease; studies show that 35-60% of all cancers in the US are diet-related. 28 According to a leading expert on the relationship between disease and diet among minorities:
Dietary factors are epidemiologically linked to chronic diseases, include overconsumption of kilocalories, and fat, leading to diabetes mellitus, obesity, cardiovascular disease and certaincancers, excess intakes of sodium or salt- cured or pickled foods-, leading to hypertension or stomach cancer and inadequate consumption of foods or nutrients that may protect against cardiovascular disease, cancer, or osteoporosis, (e.g. vitamin A, caretenoids, vitamin C, potassium, calcium, fiber, and complex carbohydrates, fruits and vegetables, cruciferous vegetables, or beta carotene rich fruits and vegetables). 29
Latinos and African- Americans in the US suffer from higher than average rates of chronic disease. Poverty, lack of education, and access to health care may influence disproportionate morbidity levels for many minorities.
African-Americans have a 110% higher rate of low birth weight infants, which is a typical measure of maternal nutrition. Childhood anemia, due to poor nutrition, is found in 20-33% of all black children. Heart disease (related to saturated fat intake among other factors) is twice as common among African Americans as among whites. African Americans tend to suffer from obesity at greater rates than among whites. Blacks also have higher rates of diabetes and stomach cancer than whites. 30
Latinos suffer from higher rates of a variety of diet related diseases than whites. Latinos have three times the likelihood of contracting diabetes than whites. Latinos also suffer from excess incidence of cancers of the stomach, pancreas, esophagus, gallbladder, and cervix, and lower rates of breast and colon cancer. Obesity and higher prevalence of cardiovascular diseases are also common among Latinos. 31
Page 46 of 57
Mass Transit B’MORE DB8 Camp 2012
ARTICLE 4: HOW DOES TRANSPORTATION AFFECT THE ECONOMY?
The Economist, 2011(America's transport infrastructure: Life in the slow lane, April 28, 2011; accessed June 6, 2012 at http://www.economist.com/node/18620944)
America, despite its wealth and strength, often seems to be falling apart. American cities have suffered a rash of recent infrastructure calamities, from the failure of the New Orleans levees to the collapse of a highway bridge in Minneapolis, to a fatal crash on Washington, DC’s (generally impressive) metro system. But just as striking are the common shortcomings. America’s civil engineers routinely give its transport structures poor marks, rating roads, rails and bridges as deficient or functionally obsolete. And according to a World Economic Forum study America’s infrastructure has got worse, by comparison with other countries, over the past decade. In the WEF 2010 league table America now ranks 23rd for overall infrastructure quality, between Spain and Chile. Its roads, railways, ports and air-transport infrastructure are all judged mediocre against networks in northern Europe.
The country’s already stressed infrastructure must handle a growing load in decades to come, thanks to America’s distinctly non-European demographics. The Census Bureau expects the population to grow by 40% over the next four decades, equivalent to the entire population of Japan. All this is puzzling. America’s economy remains the world’s largest; its citizens are among the world’s richest. The government is not constitutionally opposed to grand public works. The country stitched its continental expanse together through two centuries of ambitious earthmoving. Almost from the beginning of the republic the federal government encouraged the building of critical canals and roadways. In the 19th century Congress provided funding for a transcontinental railway linking the east and west coasts. And between 1956 and 1992 America constructed the interstate system, among the largest public-works projects in history, which criss-crossed the continent with nearly 50,000 miles of motorways.
But modern America is stingier. Total public spending on transport and water infrastructure has fallen steadily since the 1960s and now stands at 2.4% of GDP. Europe, by contrast, invests 5% of GDP in its infrastructure, while China is racing into the future at 9%. America’s spending as a share of GDP has not come close to European levels for over 50 years. Over that time funds for both capital investments and operations and maintenance have steadily dropped (see chart 2).
Although America still builds roads with enthusiasm, according to the OECD’s International Transport Forum, it spends considerably less than Europe on maintaining them. In 2006 America spent more than twice as much per person as Britain on new construction; but Britain spent 23% more per person maintaining its roads.
America’s dependence on its cars is reinforced by a shortage of alternative forms of transport. Europe’s large economies and Japan routinely spend more than America on rail investments, in absolute not just relative terms, despite much smaller populations and land areas. America spends more building airports than Europe but its underdeveloped rail network shunts more short-haul traffic onto planes, leaving many of its airports perpetually overburdened. Plans to upgrade air-traffic-control technology to a
Page 47 of 57

Mass Transit B’MORE DB8 Camp 2012
modern satellite-guided system have faced repeated delays. The current plan is now threatened by proposed cuts to the budget of the Federal Aviation Administration. The Congressional Budget Office estimates that America needs to spend $20 billion more a year just to maintain its infrastructure at the present, inadequate, levels. Up to $80 billion a year in additional spending could be spent on projects which would show positive economic returns. Other reports go further. In 2005 Congress established the National Surface Transportation Policy and Revenue Study Commission. In 2008 the commission reckoned that America needed at least $255 billion per year in transport spending over the next half-century to keep the system in good repair and make the needed upgrades. Current spending falls 60% short of that amount.
If Washington is spending less than it should, falling tax revenues are partly to blame. Revenue from taxes on petrol and diesel flow into trust funds that are the primary source of federal money for roads and mass transit. That flow has diminished to a drip. America’s petrol tax is low by international standards, and has not gone up since 1993 (see chart 3). While the real value of the tax has eroded, the cost of building and maintaining infrastructure has gone up. As a result, the highway trust fund no longer supports even current spending. Congress has repeatedly been forced to top up the trust fund, with $30 billion since 2008.
Other rich nations avoid these problems. The cost of car ownership in Germany is 50% higher than it is in America, thanks to higher taxes on cars and petrol and higher fees on drivers’ licences. The result is a more sustainably funded transport system. In 2006 German road fees brought in 2.6 times the money spent building and maintaining roads. American road taxes collected at the federal, state and local level covered just 72% of the money spent on highways that year, according to the Brookings Institution, a think-tank.
The federal government is responsible for only a quarter of total transport spending, but the way it allocates funding shapes the way things are done at the state and local levels. Unfortunately, it tends not to reward the prudent, thanks to formulas that govern over 70% of federal investment. Petrol-tax revenues, for instance, are returned to the states according to the miles of highway they contain, the distances their residents drive, and the fuel they burn. The system is awash with perverse incentives. A state using road-pricing to limit travel and congestion would be punished for its efforts with reduced funding, whereas one that built highways it could not afford to maintain would receive a larger allocation.
Formula-determined block grants to states are, at least, designed to leave important decisions to local authorities. But the formulas used to allocate the money shape infrastructure planning in a remarkably block-headed manner. Cost-benefit studies are almost entirely lacking. Federal guidelines for new construction tend to reflect politics rather than anything else. States tend to use federal money as a substitute for local spending, rather than to supplement or leverage it. The Government Accountability Office estimates that substitution has risen substantially since the 1980s, and increases particularly when states get into budget difficulties. From 1998 to 2002, a period during which economic fortunes were generally deteriorating, state and local transport investment declined by 4% while federal investment rose by 40%. State and local shrinkage is almost certainly worse now.
States can make bad planners. Big metropolitan areas—Chicago, New York and Washington among them—often sprawl across state lines. State governments frequently bicker over how (and how much)
Page 48 of 57

Mass Transit B’MORE DB8 Camp 2012
to invest. Facing tight budget constraints, New Jersey’s Republican governor, Chris Christie, recently scuttled a large project to expand the railway network into New York City. New Jersey commuter trains share a 100-year-old tunnel with Amtrak, a major bottleneck. Mr Christie’s decision was widely criticised for short-sightedness; but New Jersey faced cost overruns that in a better system should have been shared with other potential beneficiaries all along the north-eastern corridor. Regional planning could help to avoid problems like this.
The rehabilitation of America’s transport network will be neither easy nor cheap. To make the necessary repairs and upgrades, America will need to spend a lot more. In a deficit-conscious environment, that will require new revenue. The most straightforward first step would be a rise in fuel-tax rates, currently at 18.4 cents a gallon. But petrol-tax increases are even more unpopular than deficits, and rises may prove riskier as oil prices increase.
Some in Washington would rather take their cut further away from consumers. A tax on oil, rather than petrol, could be a little easier for consumers to stomach. America’s big oil producers signalled openness to a similar policy during negotiations over the ill-fated but bipartisan Kerry-Graham-Lieberman climate bill. It could return as a means to fund infrastructure.
Economists press for direct user fees. An early Obama administration flirtation with a tax on miles driven attracted little support, but some cities have run, or are thinking of running, pilot schemes. Congestion charges present another possibility. State governments have increasingly turned to tolls to fund individual projects, but tolling inevitably meets stiff public resistance. Meanwhile, Manhattan’s attempt to duplicate the congestion charges of London and Stockholm failed to win the necessary political support, despite the offer of a generous federal subsidy in return for trying the experiment. An earlier attempt to auction scarce landing and departure slots at New York’s three large airports faced stiff resistance from airlines and was ultimately killed.
Whatever the source of new revenue, America’s Byzantine funding system will remain an obstacle to improved planning. Policymakers are looking for ways around these constraints. Supporters of a National Infrastructure Bank—Mr Obama among them—believe it offers America just such a shortcut. A bank would use strict cost-benefit analyses as a matter of course, and could make interstate investments easier. A European analogue, the European Investment Bank, has turned out to work well. Co-owned by the member states of the European Union, the EIB holds some $300 billion in capital which it uses to provide loans to deserving projects across the continent. EIB funding may provide up to half the cost for projects that satisfy EU objectives and are judged cost-effective by a panel of experts.
American leaders hungrily eye the private money the EIB attracts, spying a potential solution to their own fiscal dilemma. But there are no free lunches. To keep project costs down, the bank must offer low rates, which depend in turn upon low capital costs. That may be impossible without government backing, but the spectacular failure of the two government-sponsored housing organisations, Fannie Mae and Freddie Mac, illustrates the dangers of such an arrangement. The EIB mitigates this problem by attempting to maximise public return rather than profit. To earn funding, projects must meet developmental and environmental goals, along with other requirements. But giving the bank a public mission would invite congressional oversight—and tempt legislators to meddle in funding decisions. The right balance of government support and independence may prove elusive.
Page 49 of 57
Mass Transit B’MORE DB8 Camp 2012
Budget crises could give a boost to public-private partnerships. Partnerships can be a useful way to screen out poorly conceived projects that are unlikely to generate the promised returns. No private firm will bid to build and operate a project that will probably fail to cover its costs through toll or fare revenue. Well-designed contracts can also improve incentives by giving the construction firm a long-run interest in the project. Infrastructure projects built through public-private partnerships in Britain and Chile, where the arrangement is far more common than in America, have sometimes, though not always, been completed more cheaply and quickly than public plans.
At the state and local level transport budgets will remain tight while unemployment is high. With luck, this pressure could spark a wave of innovative planning focused on improving the return on infrastructure spending. The question in Washington, apart from how to escape the city on traffic-choked Friday afternoons, is whether political leaders are capable of building on these ideas. The early signs are not encouraging.
Mr Obama is thinking big. His 2012 budget proposal contains $556 billion for transport, to be spent over six years. But his administration has declined to explain where the money will come from. Without new funding, some Democratic leaders have warned, a new, six-year transport bill will have to trim annual highway spending by about a third to keep up with falling petrol-tax revenues. But Republicans are increasingly sceptical of any new infrastructure spending. Party leaders have taken to using inverted commas around the word “investment” when Democrats apply it to infrastructure. Roads, bridges and railways used to be neutral ground on which the parties could come together to support the country’s growth. But as politics has become more bitter, public works have been neglected. If the gridlock choking Washington finds its way to America’s statehouses too, then the American economy risks grinding to a standstill.
Page 50 of 57
Mass Transit B’MORE DB8 Camp 2012
ARTICLE 5: IS TRANSPORTATION A CIVIL RIGHT?
Leadership Conference Education Fund, 2011(Excerpt from: Where We Need to Go: A Civil Rights Roadmap for Transportation EquityMarch 2011, The Leadership Conference Education Fund, www.civilrights.orghttp://www.protectcivilrights.org/pdf/docs/transportation/52846576-Where-We-Need-to-Go-A-Civil-Rights-Roadmap-for-Transportation-Equity.pdf, accessed June 6, 2012)
Transportation Policy Priorities for Civil and Human Rights Organizations Today’s transportation infrastructure perpetuates public health problems, environmental
damage, and unequal opportunity. Although our nation will continue to be primarily dependent on automobiles for the foreseeable future, we also must invest in equitable alternatives that will benefit our economy, environment, and underserved communities. As we consider how to rebuild and rethink our transportation policies, we must make decisions with civil and human rights considerations in mind. This means that advocates must mobilize to educate and advocate for a shared vision of transportation equity.
a. Transportation equity provides people with multiple transportation options Creating and maintaining affordable and accessible transportation options are priorities. Ending
the disproportionate investment in car-based transit must be a centerpiece of the transportation equity agenda. Highways and streets without space for non-motorized traffic isolate those without access to cars and people with disabilities, force low-income people to overspend on transportation and forego other necessities, and contribute to pedestrian fatalities. Civil and human rights advocates should encourage investments in “multi-modal” forms of transit, including sidewalks, bike lanes, and dedicated street and highway lanes for rapid bus transit that can connect urban and low-income people to jobs.
In addition, our transportation policy should expand and improve service for people who depend on public transportation, including older adults, people with disabilities, people in rural areas, and low-income people. New highways exacerbate transportation inequities by increasing transportation costs for these communities and potentially putting jobs and affordable housing out of reach. An equity agenda should favor incentives to fix existing infrastructure and develop vacant or underutilized property within metro areas.
Although investment in non-automobile transportation options will undoubtedly benefit people with disabilities, policy makers must nonetheless seek guidance from accessibility experts when selecting projects in which to invest. People with disabilities live in every community, and the growing elderly population shares many of their concerns. Transportation planning must therefore concern more than geography; it must also be about accessibility and maximizing usability.
b. Transportation equity projects promote equal employment opportunities Our next major federal investment in transportation will create hundreds of thousands of jobs in
the transportation sector. To promote equal job opportunity, the federal government should end requirements that most funds be spent on highways. We must invest in transit options that will enable low-income people to reach a greater variety of job opportunities—including transportation projects in outlying areas. Federal law should create incentives for states and localities to provide jobs to people from low-income communities, including: dedicating transportation funds toward the recruitment, training, and retention of underrepresented workers of local residents, the chronically unemployed,
Page 51 of 57

Mass Transit B’MORE DB8 Camp 2012
lower-income people, women, and minorities; and tying federal funding to compliance with contracting goals for disadvantaged business enterprises.
c. Transportation equity requires equal decision-making power Our transportation policy has been made by bodies that do not represent all constituents equally.
A more equitable transportation system is only possible if low-income people, people of color, and people with disabilities have meaningful representation in local decision-making bodies such as Metropolitan Planning Organizations. Everyone should have a seat at the table when transportation policy is developed and funds are spent. We should reform the transportation planning process to be more outcome-oriented, using measures that promote equity, including mobility, job access, health, safety, and making investments in local communities.
d. Transportation equity promotes healthy and sustainable communities Effective coordination of transportation and housing policy is essential for achieving
transportation equity. Our transportation policy should reward and promote affordable housing near public transportation by reforming funding programs and providing station area planning grants to local communities. We should work to reduce transportation costs in places where housing costs are low by strengthening reverse-commute systems or expanding public transit service to low-income neighborhoods or communities, people with disabilities, and the elderly.
e. Transportation equity requires meaningful civil rights protections In addition to investing in transportation equity, we must ensure vigorous enforcement of
existing civil rights legislation and pursue improved civil rights protections in federal statutes covering recipients of public funds. Ensuring fair and equitable access to the benefits of our transportation system and preventing disproportionate negative impacts on disadvantaged communities should remain a priority.
ConclusionThe absence of affordable, accessible transportation options threatens the civil rights of millions
of Americans. Past investment has disproportionately benefitted people in outlying areas, leaving many jobs out of reach for low-income Americans, and forcing others to exhaust their budgets on transportation at the expense of other needs such as health care, housing, food, and education. Our transportation policy has also undermined the Americans with Disabilities Act’s promise of equal opportunity in transportation for people with disabilities, resulting in isolation from jobs, housing, health care, and education.
Constituencies that are directly harmed by inequitable transportation policy have a stake in federal transportation policy decisions. Future transportation policy must promote accessible and equitable transit options, shift funds to communities that have been overlooked, end the cycle of sprawl that perpetuates poverty and inequality, ensure that job creation benefits all communities equally, promote affordable housing, and protect the civil rights of all.
Page 52 of 57

Mass Transit B’MORE DB8 Camp 2012
ARTICLE 6: IS THERE A LEGAL RIGHT TO TRANSPORTATION?
Dombrowski, Columbia Law Review, 2005(Matthew A. Dombroski, M.A. Population Geography, University of Georgia 2003. J.D. Candidate 2005. Managing Editor, Columbia Law Review, 105 Colum. L. Rev. 503, Securing Access to Transportation for the Urban Poor, March.
Prior to technological innovations allowing long-distance travel, there was little reason to venture far from home. Many rural Americans were self-sufficient, n2 and most American cities were small enough that urban residents usually needed to travel only short distances to satisfy [*504] most needs. The urban landscape was such that satisfying the basic necessities of life could be accomplished using nonmechanized forms of transportation. n3
This basic pattern has changed n4 - industrialization, mechanization, and labor specialization have resulted in much more dependence on the products of others' labor. Few Americans are self-sufficient with regard to any of the basic staples of life. Urbanization and subsequent suburbanization, especially as they have progressed in the second half of the twentieth century, have exaggerated the effect of this interdependence, creating landscapes where one might be required to travel great distances to satisfy even the most basic needs. Aggravating the effects of sprawl are urban and suburban designs in which travel by foot is nearly impossible. The pre-automobile preponderance of unpaved roads gave way to the development of two-and four-lane roads and, eventually, the development of divided highways that cannot be safely crossed on foot. These multilane roads create divisions within cities and increase the difficulties one must overcome to travel without an automobile. Evidencing their dependence on automobiles, many suburban subdivisions completely lack sidewalks.
Without transportation to overcome the difficulties associated with these patterns of landscape development, the widely recognized right to interstate travel and freedom of movement are less meaningful than they were in the past, especially for the poorest Americans. The right to travel, although not explicitly granted in the Constitution, is considered to be a basic right necessary to secure personal liberty and the overall strength of the Union. n5 As suggested by Chief Justice Taney, the right exists with regard to interstate travel throughout the United States and may exist with regard to intrastate travel. n6 Freedom of movement, distinct from the right to travel yet with similar implications, recognizes that mobility is an aspect of individual liberty that may not be burdened by the state without a compelling justification. n7
…This Note argues that a de facto right to transportation exists and is supported by, though not
based on, the right to travel and freedom of movement. Federal and state governments have devoted massive amounts of funding to transportation projects, creating a de facto right to transportation. This devotion to the development of transportation networks is likely to continue given transportation's importance to economic development. This de facto right to transportation must apply equally to all citizens through the Equal Protection Clause of the Fourteenth Amendment. However, this right currently does not exist equally for all classes - the urban poor, a large proportion of whom are minorities, are disproportionately excluded from its benefits. Transportation funding has been used primarily for the development of highways and roads, to the benefit of car owners. This focus on highway development has also disrupted other forms of urban mobility. This Note argues for greater funding of urban mass transportation systems as a means of alleviating this disparity.…
Page 53 of 57
Mass Transit B’MORE DB8 Camp 2012
Of course, the creation of a legal right is not the only way in which Congress can address inequalities in transportation. Various studies demonstrate the importance of transportation for economic development and escaping poverty. n222 In light of the economic and social importance of transportation, Congress should devote resources to make equal access to transportation a reality. A successful congressional approach includes a focus on not only transportation networks, but also attention to overall development patterns. Encouraging smart growth n223 by curtailing highway development, devoting resources to urban redevelopment, and accommodating alternative forms of transportation, including the promotion of walking, has been shown to be an effective means of limiting sprawl, improving the quality of the environment, and promoting social justice. n224 These strategies, like the transportation problems they address, have effects that span racial, social, and economic boundaries but predominantly impact those most affected by the current highway dominated transportation regime: the urban poor.
In the end, a de facto right to transportation may indeed exist as a result of the massive government expenditures on transportation networks. Such expenditures are likely to continue because transportation is necessary for economic development, and the provision of transportation has come to be an expected duty of government. Thus, government-funded transportation may be a morally entrenched right, at least to the extent that curtailing or eliminating government funding for transportation infrastructure would result in significant political upheaval. As already mentioned, however, a right is only a right if it is protected, subject to limited exceptions. n225 The burden of protecting rights belongs to public institutions, n226 usually federal or state governments, depending on the nature of the right.
Given that mobility is primarily denied to those vulnerable groups who have been limited by segregation, suburbanization, and car dependence, the de facto right of transportation is really only a right for those who can afford the type of transportation the government prefers: automobiles. However, the right to interstate travel and freedom of movement, and to a lesser degree, the right to intrastate travel, all support a view that mobility is valued and is instrumental in economic and social development, and should thus be equally protected for all. Unfortunately, the Equal Protection Clause of the Fourteenth Amendment and related statutes, though intended to prevent preferential treatment of particular groups, have been limited to such an extent that they are of little use in the transportation context without clear and obvious evidence of discriminatory intent.
Because of the importance of mobility, and because it has been provided to some groups while denied to others, one solution is for Congress to amend Title VI of the Civil Rights Act of 1964 to include the disparate impact prohibitions of 49 C.F.R. 21.5(b)(2). Once amended, and if validated by the Supreme Court, the disparate impact prohibition on acts of the Department of Transportation will be a meaningful protection for minorities and the urban poor, who receive too few transportation benefits. Alternately, Congress could codify the right to transportation for the urban poor as a programmatic right - that is, through legislation that seeks to ensure urban transportation networks are adequately funded and low-income individuals have access to these networks, perhaps by providing subsidies or by implementing reduced-fare programs. If either of these options proves to be politically or legally untenable, the most straightforward solution is for Congress to devote more resources to facilitating urban transportation networks that do not further promote the use of cars. This approach would benefit the urban poor and would have collateral benefits for every socioeconomic group by decreasing urban congestion and environmental degradation.
Page 54 of 57
Mass Transit B’MORE DB8 Camp 2012
ARTICLE 7: DOES PUBLIC TRANSPORTATION HURT NEIGHBORHOODS?
Southern California Association of NonProfit Housing, accessed June 6, 2012(no publication date available, http://www.scanph.org/node/2506)
A new report by the Kitty & Michael Dukakis Center for Urban & Regional Policy at Northeastern University validates concerns that the growing popularity of rail transit can bring undesirable changes to nearby neighborhoods. "While patterns of neighborhood change varied," explained lead author Stephanie Pollack, "the most predominant pattern we saw was one in which neighborhood renters are forced to pay more for housing and vehicle ownership becomes more common as neighborhood incomes rise. If gentrification is defined as a pattern of neighborhood change marked by rising housing costs and incomes, we found evidence of gentrification in the majority of newly transit-served neighborhoods we studied." The report, Maintaining Diversity in America's Transit-Rich Neighborhoods: Tools for Equitable Neighborhood Change, includes new research analyzing socioeconomic changes in 42 neighborhoods in 12 metropolitan areas first served by rail transit between 1990 and 2000. Co-author Barry Bluestone, a housing expert and Dean of Northeastern University's School of Public Policy and Urban Affairs, noted that the report's findings confirm other research that shows neighborhoods with a large number of renters are more susceptible to gentrification. "In the neighborhoods where new light rail stations were built, almost every aspect of neighborhood change was magnified," Bluestone explained. "Rents rose faster; owner-occupied units became more prevalent. Before transit was built, these neighborhoods had been dominated by low-income, renter households." Bluestone also noted that, as calculated in the report, slightly over half of all rental housing units in the United States are located in the relatively small number of metropolitan areas served by rail transit. Pollack, a transportation policy expert and associate director of the Dukakis Center, similarly noted that the 37 metropolitan regions with rail transit systems "constitute just over 10 percent of all U.S. metropolitan areas, but are both economically important and extraordinarily diverse." According to the report, nearly half of all Americans and more than two thirds of all U.S. workers live in metropolitan areas served by rail transit. These regions are home to over half of all blacks, 60 percent of all Hispanics and 70 percent of all immigrants in the U.S. This diverse population is important because transit systems draw a majority of their ridership from low income households, people of color and renters. "Transit planners frequently speak of the need for transit-oriented development to support ridership," Pollack explained, "but what transit stations need is transit-oriented neighbors who will regularly use the system." In some of the newly transit-rich neighborhoods, however, the research reveals how a new transit station can set in motion a cycle of unintended consequences in which core transit users¬such as renters and low income households¬are priced out in favor of higher-income, car owning residents who are less likely to use public transit for commuting. Utilization of public transit for commuting in this problematic subset of newly transit-served neighborhoods actually rose more slowly (or, in some cases, declined faster) than in the corresponding metropolitan area as a whole. "Understanding the mechanisms behind such undesirable patterns of neighborhood change," Bluestone said, "can allow policymakers, planners and advocates to implement policies and programs designed to produce more equitable patterns of neighborhood change." The good news, Pollack added, is that such policy tools are increasingly available and in use across the country.
Page 55 of 57

Mass Transit B’MORE DB8 Camp 2012
ARTICLE 8: IS TRANSPORTATION A STATE OR FEDERAL ISSUE?
Utt, Heritage Foundation research fellow, 2012(Ronald D. Utt, Ph.D., is Herbert and Joyce Morgan Senior Research Fellow in the Thomas A. Roe Institute for Economic Policy Studies at The Heritage Foundation, “Turn Back” Transportation to the States, February 7, 2012, accessed June 6, 2012 at http://www.heritage.org/research/reports/2012/02/turn-back-transportation-to-the-states)
Conflict and Deficiencies Inherent in a National Program
While these debates over spending totals consume much of the conversation about transportation policy—as well as create much of the conflict—the spending totals themselves often do little to meet transportation objectives or improve mobility. Transportation spending totals are determined largely by the overall macroeconomic budgetary goals of either holding the line on budget deficits (2005) or stimulating the economy (2012) while preventing any increase in taxes, including the federal fuel tax that finances the trust fund. It is all about the money, not performance, and the traveling public suffers accordingly.
…
Options for Reform
The federal transportation program has lost its way: It is less and less about transportation and mobility and, for the most part, has evolved into a costly spending program distributing financial rewards to a growing number of influential constituencies on a pay-to-play basis.One reform proposal that could substantially change this is legislation to “turn back” the federal highway program to the states, where it once was lodged. Arguing that the program was created to build the interstate highway system—a goal that was met in the early 1980s—turnback advocates believe it is time to declare victory and shift the resources back to the states, recognizing that today’s surface transportation problems are largely local or regional in nature and that a Washington-based, centrally planned, command-and-control program has little to offer in the way of solutions.Also, as the record of the past few authorizations reveals, a Washington-based program is more vulnerable to a wheeling-and-dealing political process that has contributed to many of the existing diversions and regional inequities as elected officials pander to influential constituencies at the expense of the taxpaying motorist.
Under the turnback proposals that have been introduced in Congress since 1997, the federal government would incrementally shift to the states, over a period of five or six years, both the highway responsibilities and the financial resources to fulfill them. Most proposals would accomplish this by reducing the federal gas tax by annual increments—say four cents per year—and allowing the state to add that amount to the gas tax that the state collects on its own. The total tax paid by the motorist stays the same, but the allocation of that revenue shifts to the states year by year until the collection of all 18.3 cents per dollar of the federal fuel tax is shifted to the states and all federal collections cease.[3]Currently, the most direct legislation to implement turnback is the Transportation Empowerment Act, introduced in the Senate as S. 1164 by Senator Jim DeMint (R–SC) and in the House as H.R. 3264 by
Page 56 of 57
Mass Transit B’MORE DB8 Camp 2012
Representative Tom Graves (R–GA). Under the act, states would still be responsible for interstate maintenance and improvement, as they are today, but would now be free to do it in a way that best suits their interests, whether through tolls, partnerships, privatization, competitive contracting, or some combination of means.
Now free of the federal one-size-fits-all program, states could tailor their spending and investment strategies to their particular needs, not those of a Washington bureaucracy or the privileged constituencies appended to it like barnacles on an aging ship. States would also be free of the costly and time-consuming regulatory mandates that the federal program now imposes on their transportation programs.
Finally, as a consequence of these improvements and the more efficient use of resources that turnback would yield, transportation service for the traveling public would improve at a much lower cost than the attainment of that same measure of improvement would have required under the old system. At the same time, and once an improved economy restores fuel tax revenues to their long-run trend, donor states that lose money under the current system would be made whole, while donee states would no longer benefit from undeserved subsidies.
Keep the Pressure On
The first “turn back” bill was introduced in Congress in 1997 by Senator Connie Mack (R–FL) and Representative John Kasich (R–OH). It earned about two dozen co-sponsors and received the explicit endorsement of more than 20 states—mostly donors. Since then, some version of a turnback bill has been introduced in every Congress, and while none has come close to passing, the defects in the program that have led to ongoing interest in the bills have come under scrutiny and concern.Subsequent reauthorization bills have attempted, with some modest success, to address the equity issue. More recently, however, the House and Senate versions of the next reauthorization bill propose to reverse the past trends toward an increasingly Washington-centric program significantly by giving the states more flexibility in deciding how the funds they receive from the federal trust fund can be spent. With momentum moving in turnback’s favor, the existence of these bills will keep the pressure on for a program of greater state responsibility and discretion.
.
Page 57 of 57