BALTIMORE CITY · 3 Narrative Summary of Data ... Annual See Section 5.3. Part IV.D.4 Trash and...
134
Baltimore City MS4 Annual Report BALTIMORE CITY MS4 ANNUAL REPORT Reporting Period: July 1, 2016 to June 30, 2017
Transcript of BALTIMORE CITY · 3 Narrative Summary of Data ... Annual See Section 5.3. Part IV.D.4 Trash and...
Baltimore City MS4 Annual Report
BALTIMORE CITYMS4 ANNUAL REPORT
Reporting Period: July 1, 2016 to June 30, 2017
Baltimore City MS4 Annual Report
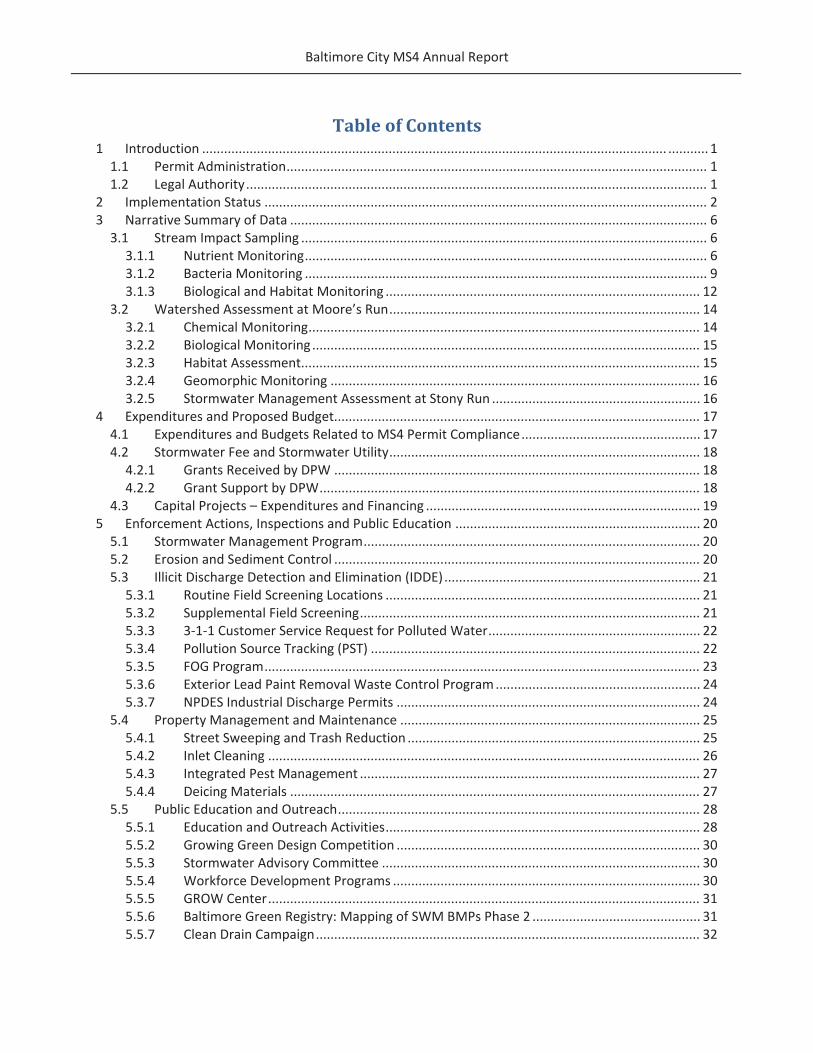
Table of Contents1 Introduction ............................................................................................................................... ........... 11.1 Permit Administration................................................................................................................... 11.2 Legal Authority.............................................................................................................................. 1
2 Implementation Status ......................................................................................................................... 23 Narrative Summary of Data .................................................................................................................. 63.1 Stream Impact Sampling ............................................................................................................... 6
3.1.1 Nutrient Monitoring.............................................................................................................. 63.1.2 Bacteria Monitoring .............................................................................................................. 93.1.3 Biological and Habitat Monitoring ...................................................................................... 12
3.2 Watershed Assessment at Moore’s Run..................................................................................... 143.2.1 Chemical Monitoring........................................................................................................... 143.2.2 Biological Monitoring.......................................................................................................... 153.2.3 Habitat Assessment............................................................................................................. 153.2.4 Geomorphic Monitoring ..................................................................................................... 163.2.5 Stormwater Management Assessment at Stony Run ......................................................... 16
4 Expenditures and Proposed Budget.................................................................................................... 174.1 Expenditures and Budgets Related to MS4 Permit Compliance................................................. 174.2 Stormwater Fee and Stormwater Utility..................................................................................... 18
4.2.1 Grants Received by DPW .................................................................................................... 184.2.2 Grant Support by DPW........................................................................................................ 18
4.3 Capital Projects – Expenditures and Financing ........................................................................... 195 Enforcement Actions, Inspections and Public Education ................................................................... 205.1 Stormwater Management Program............................................................................................ 205.2 Erosion and Sediment Control .................................................................................................... 205.3 Illicit Discharge Detection and Elimination (IDDE)...................................................................... 21
5.3.1 Routine Field Screening Locations ...................................................................................... 215.3.2 Supplemental Field Screening............................................................................................. 215.3.3 3 1 1 Customer Service Request for Polluted Water.......................................................... 225.3.4 Pollution Source Tracking (PST) .......................................................................................... 225.3.5 FOG Program....................................................................................................................... 235.3.6 Exterior Lead Paint Removal Waste Control Program........................................................ 245.3.7 NPDES Industrial Discharge Permits ................................................................................... 24
5.4 Property Management and Maintenance .................................................................................. 255.4.1 Street Sweeping and Trash Reduction ................................................................................ 255.4.2 Inlet Cleaning ...................................................................................................................... 265.4.3 Integrated Pest Management ............................................................................................. 275.4.4 Deicing Materials ................................................................................................................ 27
5.5 Public Education and Outreach................................................................................................... 285.5.1 Education and Outreach Activities...................................................................................... 285.5.2 Growing Green Design Competition ................................................................................... 305.5.3 Stormwater Advisory Committee ....................................................................................... 305.5.4 Workforce Development Programs .................................................................................... 305.5.5 GROW Center...................................................................................................................... 315.5.6 Baltimore Green Registry: Mapping of SWM BMPs Phase 2 .............................................. 315.5.7 Clean Drain Campaign......................................................................................................... 32
Baltimore City MS4 Annual Report
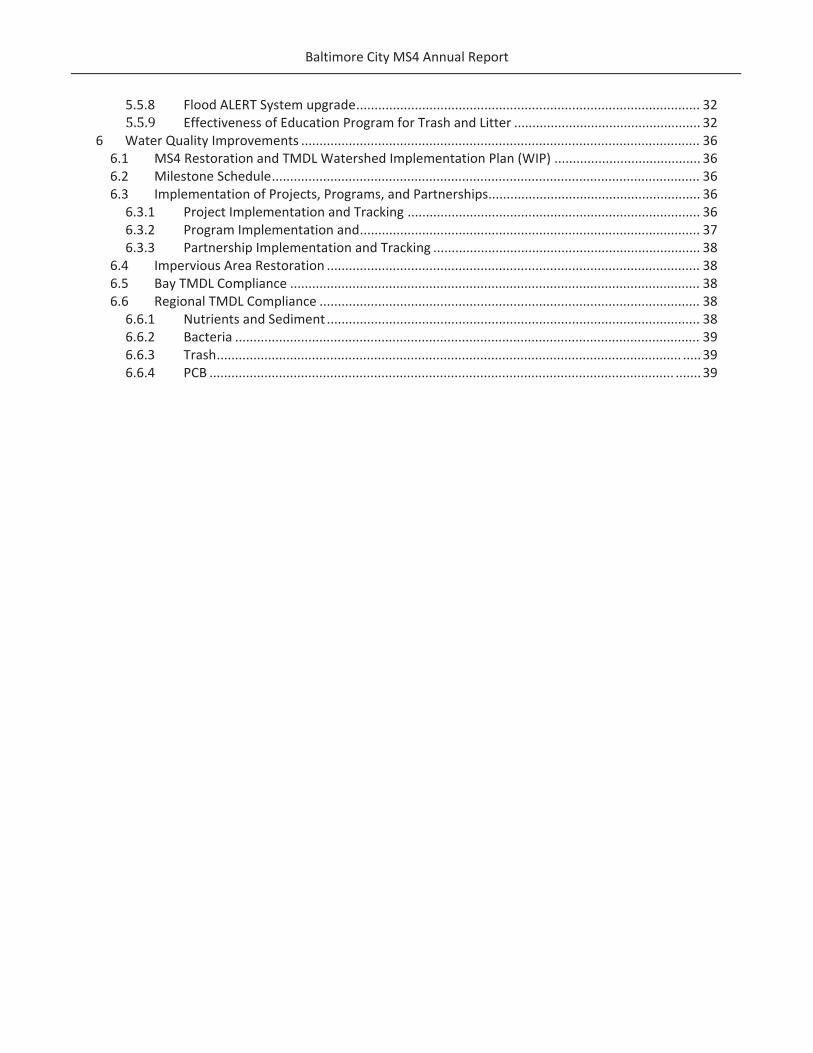
5.5.8 Flood ALERT System upgrade.............................................................................................. 32Effectiveness of Education Program for Trash and Litter ................................................... 32
6 Water Quality Improvements ............................................................................................................. 366.1 MS4 Restoration and TMDL Watershed Implementation Plan (WIP) ........................................ 366.2 Milestone Schedule..................................................................................................................... 366.3 Implementation of Projects, Programs, and Partnerships.......................................................... 36
6.3.1 Project Implementation and Tracking ................................................................................ 366.3.2 Program Implementation and............................................................................................. 376.3.3 Partnership Implementation and Tracking ......................................................................... 38
6.4 Impervious Area Restoration ...................................................................................................... 386.5 Bay TMDL Compliance ................................................................................................................ 386.6 Regional TMDL Compliance ........................................................................................................ 38
6.6.1 Nutrients and Sediment ...................................................................................................... 386.6.2 Bacteria ............................................................................................................................... 396.6.3 Trash............................................................................................................................... .....396.6.4 PCB ............................................................................................................................... ....... 39
Baltimore City MS4 Annual Report
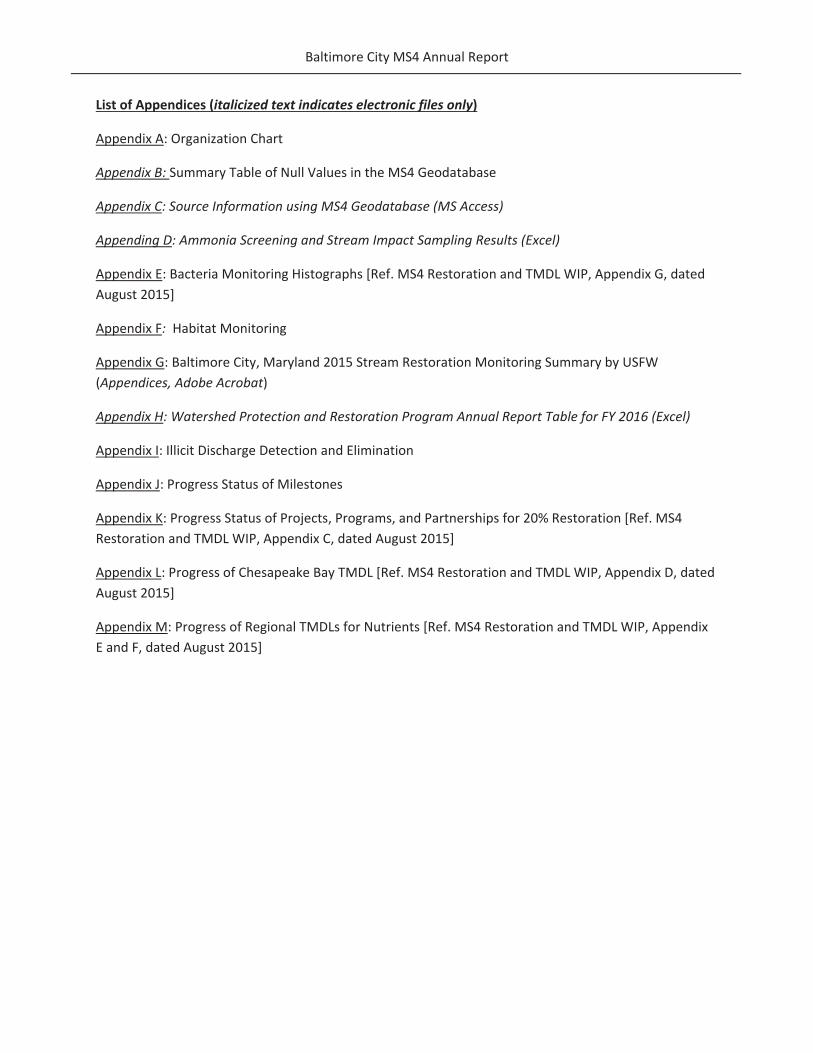
List of Appendices (italicized text indicates electronic files only)
Appendix A: Organization Chart
Appendix B: Summary Table of Null Values in the MS4 Geodatabase
Appendix C: Source Information using MS4 Geodatabase (MS Access)
Appending D: Ammonia Screening and Stream Impact Sampling Results (Excel)
Appendix E: Bacteria Monitoring Histographs [Ref. MS4 Restoration and TMDL WIP, Appendix G, datedAugust 2015]
Appendix F: Habitat Monitoring
Appendix G: Baltimore City, Maryland 2015 Stream Restoration Monitoring Summary by USFW(Appendices, Adobe Acrobat)
Appendix H: Watershed Protection and Restoration Program Annual Report Table for FY 2016 (Excel)
Appendix I: Illicit Discharge Detection and Elimination
Appendix J: Progress Status of Milestones
Appendix K: Progress Status of Projects, Programs, and Partnerships for 20% Restoration [Ref. MS4Restoration and TMDL WIP, Appendix C, dated August 2015]
Appendix L: Progress of Chesapeake Bay TMDL [Ref. MS4 Restoration and TMDL WIP, Appendix D, datedAugust 2015]
Appendix M: Progress of Regional TMDLs for Nutrients [Ref. MS4 Restoration and TMDL WIP, AppendixE and F, dated August 2015]

Baltimore City MS4 Annual Report
Reporting Period: July 1, 2016 to June 30, 2017 Page 1
1 IntroductionThis report includes the progress of compliance for the period of Fiscal Year (FY) 2017, in associationwith Baltimore City’s National Pollutant Discharge Elimination System (NPDES) Municipal SeparateStorm Sewer System (MS4) Discharge Permit (Permit Number: 11 DP 3315, MD0068292). The currentpermit was issued on December 27, 2013. Annual report periods follow the City’s fiscal calendar: July 1to June 30. This Annual report has been formatted to match the reporting requirements as listed in PartV of the permit.
1.1 Permit AdministrationDesignation of individual to act as a liaison between the City and the Maryland Department ofEnvironment (MDE) for the implementation of this permit:
Kimberly L. Grove, P.E.Chief, Office of Compliance and Laboratories3001 Druid Park Drive, Rm 232Baltimore, MD 21215410 396 [email protected]
Two organization charts (as of June 30, 2017) are provided in Appendix A of this report:
City agency organization chart with designations of MS4 permit condition responsibilities.DPW organization chart.
In December 2016, Catherine Pugh took office as the Mayor of the City of Baltimore. Also in FY 2017,new directors were appointed for the Departments of Transportation (Michelle Pourciau) andRecreation and Parks (Reginald Moore). Baltimore Housing (a quasi federal government agency) was reorganized and split into a local government agency (Baltimore City Department of Housing andCommunity Development, DHCD) and a federal government agency (Housing Authority of BaltimoreCity). Michael Braverman was appointed the Commissioner of DHCD.
Within the Department of Public Works, the Bureau of Solid Waste was re organized by dissolving someof the Divisions currently organized by function and reassembling them geographically. The RoutineServices, Special Services and Property Management Divisions were disassembled and re organized intofour new divisions, each assigned to a quadrant of the City: Northwest, Northeast, Southwest andSoutheast. By shrinking the responsible area and increasing the range of resources available, QuadrantChiefs obtained the ability to better respond to sanitation problems involving multiple issues.
1.2 Legal AuthorityThe City maintained adequate legal authority in accordance with NPDES regulations 40 CFR 122.26(d) (2)(i) during FY 2017.
Baltimore City MS4 Annual Report
Reporting Period: July 1, 2016 to June 30, 2017 Page 2
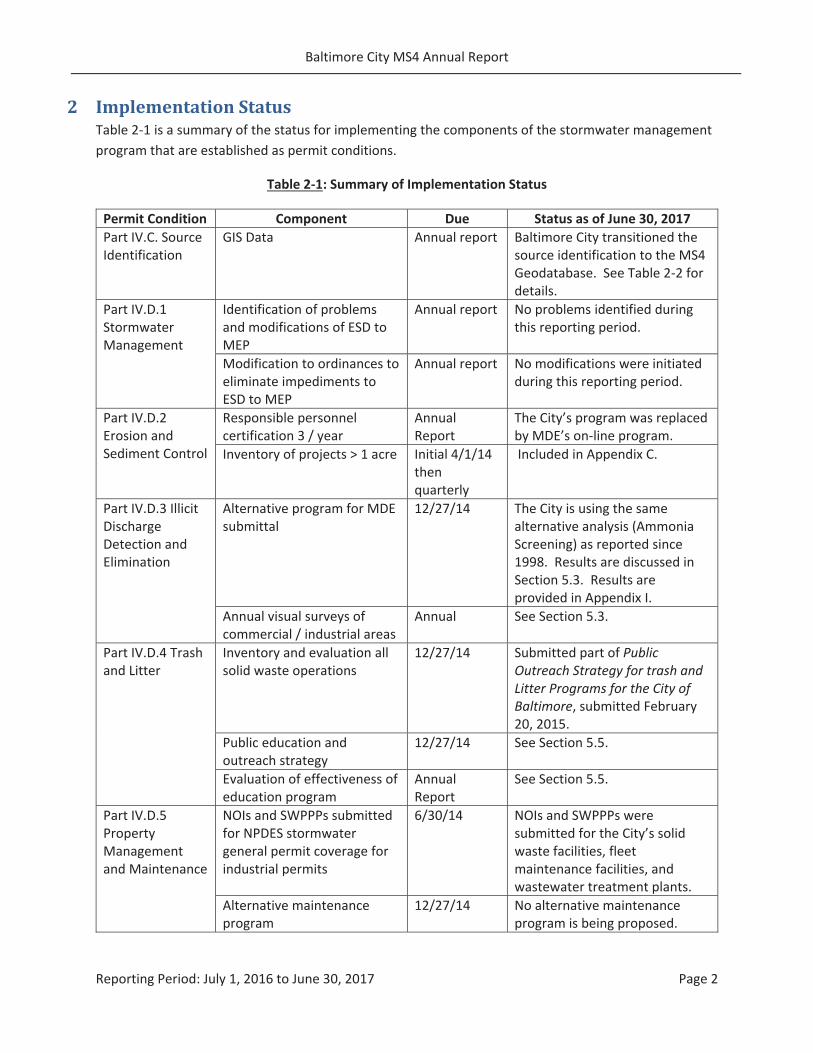
2 Implementation StatusTable 2 1 is a summary of the status for implementing the components of the stormwater managementprogram that are established as permit conditions.
Table 2 1: Summary of Implementation Status
Permit Condition Component Due Status as of June 30, 2017Part IV.C. SourceIdentification
GIS Data Annual report Baltimore City transitioned thesource identification to the MS4Geodatabase. See Table 2 2 fordetails.
Part IV.D.1StormwaterManagement
Identification of problemsand modifications of ESD toMEP
Annual report No problems identified duringthis reporting period.
Modification to ordinances toeliminate impediments toESD to MEP
Annual report No modifications were initiatedduring this reporting period.
Part IV.D.2Erosion andSediment Control
Responsible personnelcertification 3 / year
AnnualReport
The City’s program was replacedby MDE’s on line program.
Inventory of projects > 1 acre Initial 4/1/14thenquarterly
Included in Appendix C.
Part IV.D.3 IllicitDischargeDetection andElimination
Alternative program for MDEsubmittal
12/27/14 The City is using the samealternative analysis (AmmoniaScreening) as reported since1998. Results are discussed inSection 5.3. Results areprovided in Appendix I.
Annual visual surveys ofcommercial / industrial areas
Annual See Section 5.3.
Part IV.D.4 Trashand Litter
Inventory and evaluation allsolid waste operations
12/27/14 Submitted part of PublicOutreach Strategy for trash andLitter Programs for the City ofBaltimore, submitted February20, 2015.
Public education andoutreach strategy
12/27/14 See Section 5.5.
Evaluation of effectiveness ofeducation program
AnnualReport
See Section 5.5.
Part IV.D.5PropertyManagementand Maintenance
NOIs and SWPPPs submittedfor NPDES stormwatergeneral permit coverage forindustrial permits
6/30/14 NOIs and SWPPPs weresubmitted for the City’s solidwaste facilities, fleetmaintenance facilities, andwastewater treatment plants.
Alternative maintenanceprogram
12/27/14 No alternative maintenanceprogram is being proposed.

Baltimore City MS4 Annual Report
Reporting Period: July 1, 2016 to June 30, 2017 Page 3
Permit Condition Component Due Status as of June 30, 2017Part IV.D.6 PublicEducation
Maintain a compliancehotline for water qualitycomplaints
AnnualReport
2 new customer service requeststo 3 1 1 system were added inNovember 2014. See Sections5.2 and 5.3.
Part IV.E.1WatershedAssessment
Detailed watershedassessments of entire City
12/27/18 Updated assessments forBaltimore Harbor and NorthLower Branch of PatapscoWatersheds continued.
Part IV.E.2Restoration Plans
Impervious surfaceassessment consistent withMDE methods = baseline
12/27/14 MDE approved the baselineimpervious area on July 28,2015. See Section 6 for moredetails.Restoration of 20% of City’s
impervious surface area12/27/18
Restoration Plan for eachWLA approved by EPA priorto the effective date of thepermit
12/27/14
Restoration Plan for ofsubsequent TMDL WLA
One year ofapproval
Implementation Plan for theMiddle Branch / NorthwestBranch TMDL in Baltimore Citywas submitted on January 4,2016. MDE provided commentson April 1, 2016. Comments areaddressed in Section 6.6.3.
Part IV.E.4. TMDLCompliance
Annual assessment toevaluate the effectiveness ofthe City’s restoration plans
AnnualReport
See Section 6.
Part IV.F.Assessment ofControls
Continue assessments AnnualReport
See Appendices C and F G.
Part IV.G.Program Funding
Fiscal analysis of the capital,operation, and maintenanceexpenditures necessary tocomply with all conditions ofthis permit
AnnualReport
See Section 4 and Appendix H.
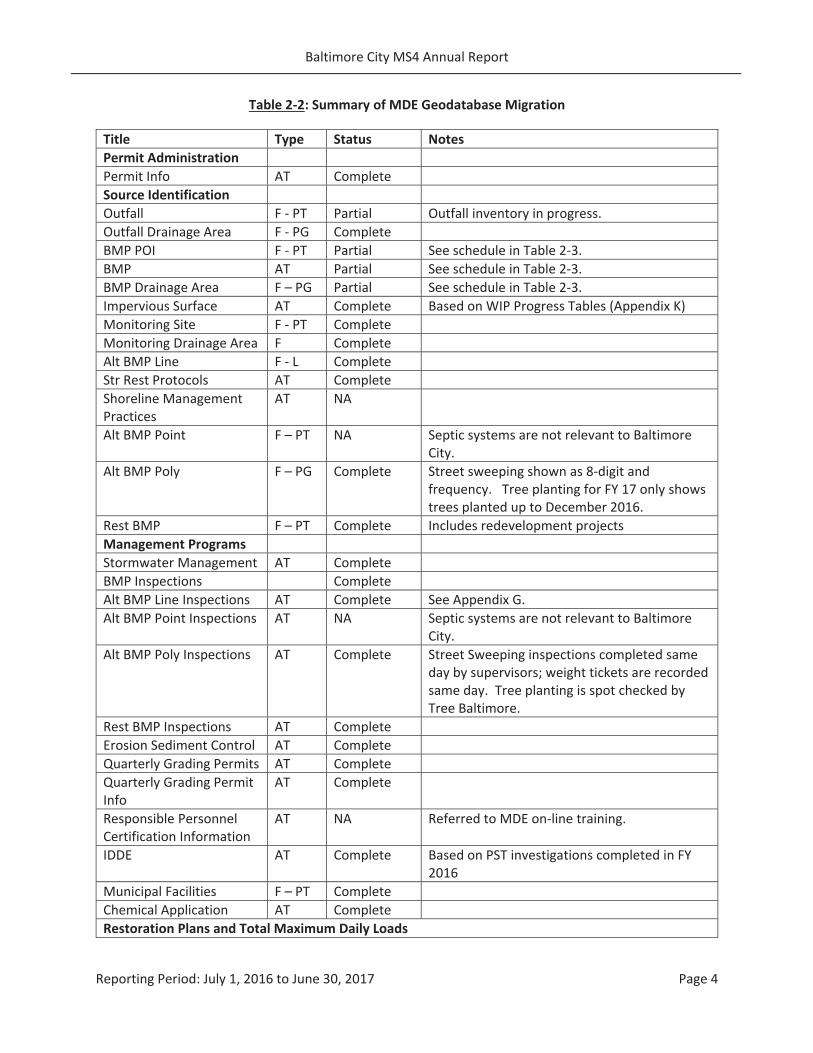
In Fiscal Year 2017, Baltimore City continued the migration of the source identification data to aprescribed geodatabase, per MDE’s NPDES MS4 Geodatabase Design and User’s Guide, dated March2015. A summary of the migration efforts are provided in Table 2 2. The geodatabase also includedrules for completed records related to mandatory fields. As a short term solution to complete thedatabase, Baltimore City used designated values as a “null” value. These values are listed in Appendix B.
Baltimore City MS4 Annual Report
Reporting Period: July 1, 2016 to June 30, 2017 Page 4
Table 2 2: Summary of MDE Geodatabase Migration
Title Type Status NotesPermit AdministrationPermit Info AT CompleteSource IdentificationOutfall F PT Partial Outfall inventory in progress.Outfall Drainage Area F PG CompleteBMP POI F PT Partial See schedule in Table 2 3.BMP AT Partial See schedule in Table 2 3.BMP Drainage Area F – PG Partial See schedule in Table 2 3.Impervious Surface AT Complete Based on WIP Progress Tables (Appendix K)Monitoring Site F PT CompleteMonitoring Drainage Area F CompleteAlt BMP Line F L CompleteStr Rest Protocols AT CompleteShoreline ManagementPractices
AT NA
Alt BMP Point F – PT NA Septic systems are not relevant to BaltimoreCity.
Alt BMP Poly F – PG Complete Street sweeping shown as 8 digit andfrequency. Tree planting for FY 17 only showstrees planted up to December 2016.
Rest BMP F – PT Complete Includes redevelopment projectsManagement ProgramsStormwater Management AT CompleteBMP Inspections CompleteAlt BMP Line Inspections AT Complete See Appendix G.Alt BMP Point Inspections AT NA Septic systems are not relevant to Baltimore
City.Alt BMP Poly Inspections AT Complete Street Sweeping inspections completed same
day by supervisors; weight tickets are recordedsame day. Tree planting is spot checked byTree Baltimore.
Rest BMP Inspections AT CompleteErosion Sediment Control AT CompleteQuarterly Grading Permits AT CompleteQuarterly Grading PermitInfo
AT Complete
Responsible PersonnelCertification Information
AT NA Referred to MDE on line training.
IDDE AT Complete Based on PST investigations completed in FY2016
Municipal Facilities F – PT CompleteChemical Application AT CompleteRestoration Plans and Total Maximum Daily Loads
Baltimore City MS4 Annual Report
Reporting Period: July 1, 2016 to June 30, 2017 Page 5
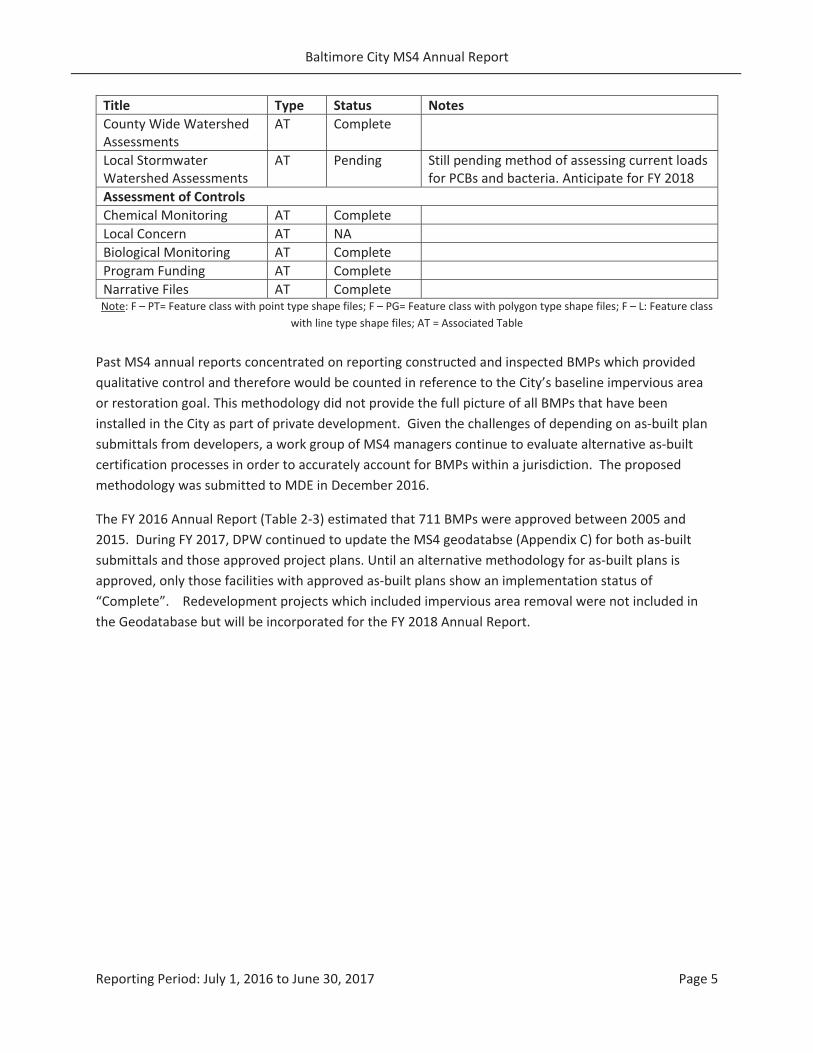
Title Type Status NotesCounty Wide WatershedAssessments
AT Complete
Local StormwaterWatershed Assessments
AT Pending Still pending method of assessing current loadsfor PCBs and bacteria. Anticipate for FY 2018
Assessment of ControlsChemical Monitoring AT CompleteLocal Concern AT NABiological Monitoring AT CompleteProgram Funding AT CompleteNarrative Files AT CompleteNote: F – PT= Feature class with point type shape files; F – PG= Feature class with polygon type shape files; F – L: Feature class
with line type shape files; AT = Associated Table
Past MS4 annual reports concentrated on reporting constructed and inspected BMPs which providedqualitative control and therefore would be counted in reference to the City’s baseline impervious areaor restoration goal. This methodology did not provide the full picture of all BMPs that have beeninstalled in the City as part of private development. Given the challenges of depending on as built plansubmittals from developers, a work group of MS4 managers continue to evaluate alternative as builtcertification processes in order to accurately account for BMPs within a jurisdiction. The proposedmethodology was submitted to MDE in December 2016.
The FY 2016 Annual Report (Table 2 3) estimated that 711 BMPs were approved between 2005 and2015. During FY 2017, DPW continued to update the MS4 geodatabse (Appendix C) for both as builtsubmittals and those approved project plans. Until an alternative methodology for as built plans isapproved, only those facilities with approved as built plans show an implementation status of“Complete”. Redevelopment projects which included impervious area removal were not included inthe Geodatabase but will be incorporated for the FY 2018 Annual Report.
Baltimore City MS4 Annual Report
Reporting Period: July 1, 2016 to June 30, 2017 Page 6
3 Narrative Summary of Data
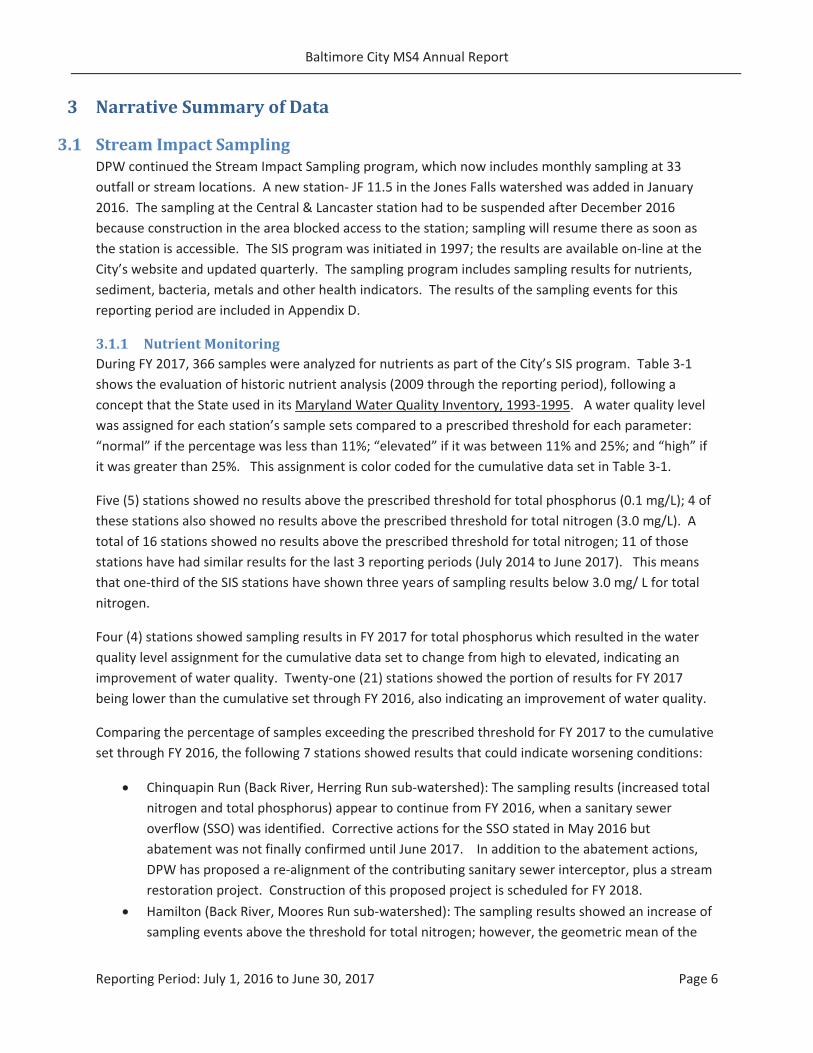
3.1 Stream Impact SamplingDPW continued the Stream Impact Sampling program, which now includes monthly sampling at 33outfall or stream locations. A new station JF 11.5 in the Jones Falls watershed was added in January2016. The sampling at the Central & Lancaster station had to be suspended after December 2016because construction in the area blocked access to the station; sampling will resume there as soon asthe station is accessible. The SIS program was initiated in 1997; the results are available on line at theCity’s website and updated quarterly. The sampling program includes sampling results for nutrients,sediment, bacteria, metals and other health indicators. The results of the sampling events for thisreporting period are included in Appendix D.
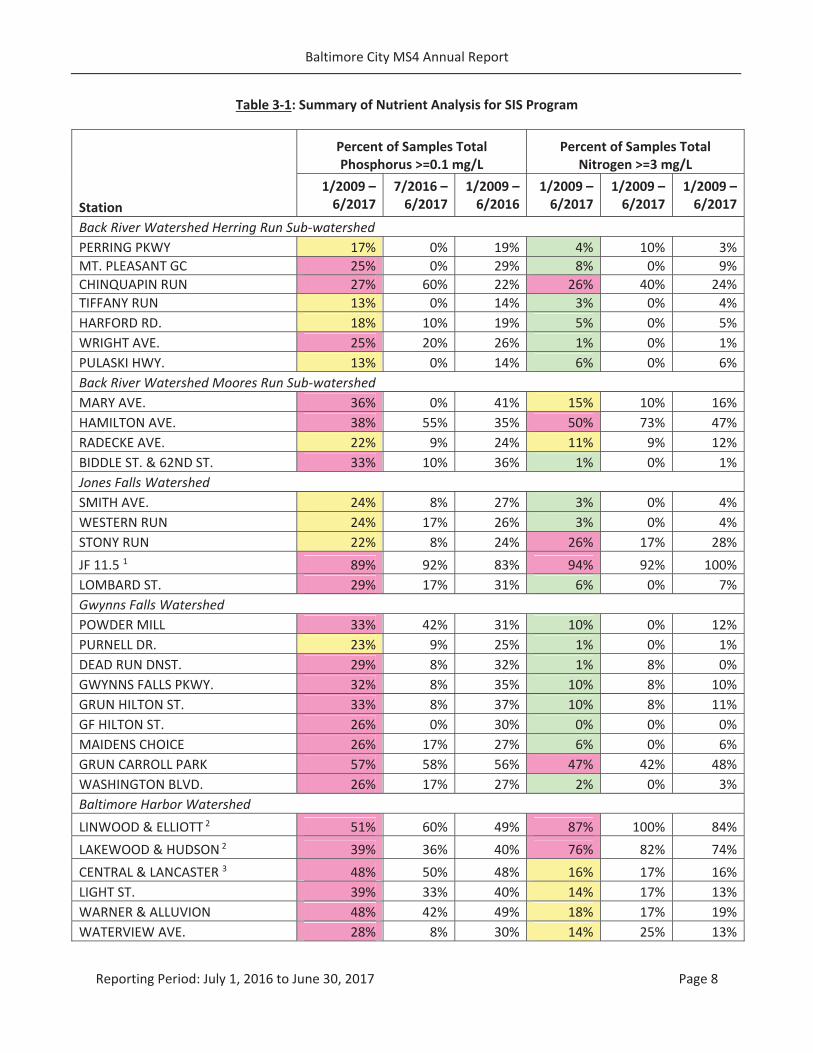
3.1.1 Nutrient MonitoringDuring FY 2017, 366 samples were analyzed for nutrients as part of the City’s SIS program. Table 3 1shows the evaluation of historic nutrient analysis (2009 through the reporting period), following aconcept that the State used in its Maryland Water Quality Inventory, 1993 1995. A water quality levelwas assigned for each station’s sample sets compared to a prescribed threshold for each parameter:“normal” if the percentage was less than 11%; “elevated” if it was between 11% and 25%; and “high” ifit was greater than 25%. This assignment is color coded for the cumulative data set in Table 3 1.
Five (5) stations showed no results above the prescribed threshold for total phosphorus (0.1 mg/L); 4 ofthese stations also showed no results above the prescribed threshold for total nitrogen (3.0 mg/L). Atotal of 16 stations showed no results above the prescribed threshold for total nitrogen; 11 of thosestations have had similar results for the last 3 reporting periods (July 2014 to June 2017). This meansthat one third of the SIS stations have shown three years of sampling results below 3.0 mg/ L for totalnitrogen.
Four (4) stations showed sampling results in FY 2017 for total phosphorus which resulted in the waterquality level assignment for the cumulative data set to change from high to elevated, indicating animprovement of water quality. Twenty one (21) stations showed the portion of results for FY 2017being lower than the cumulative set through FY 2016, also indicating an improvement of water quality.
Comparing the percentage of samples exceeding the prescribed threshold for FY 2017 to the cumulativeset through FY 2016, the following 7 stations showed results that could indicate worsening conditions:
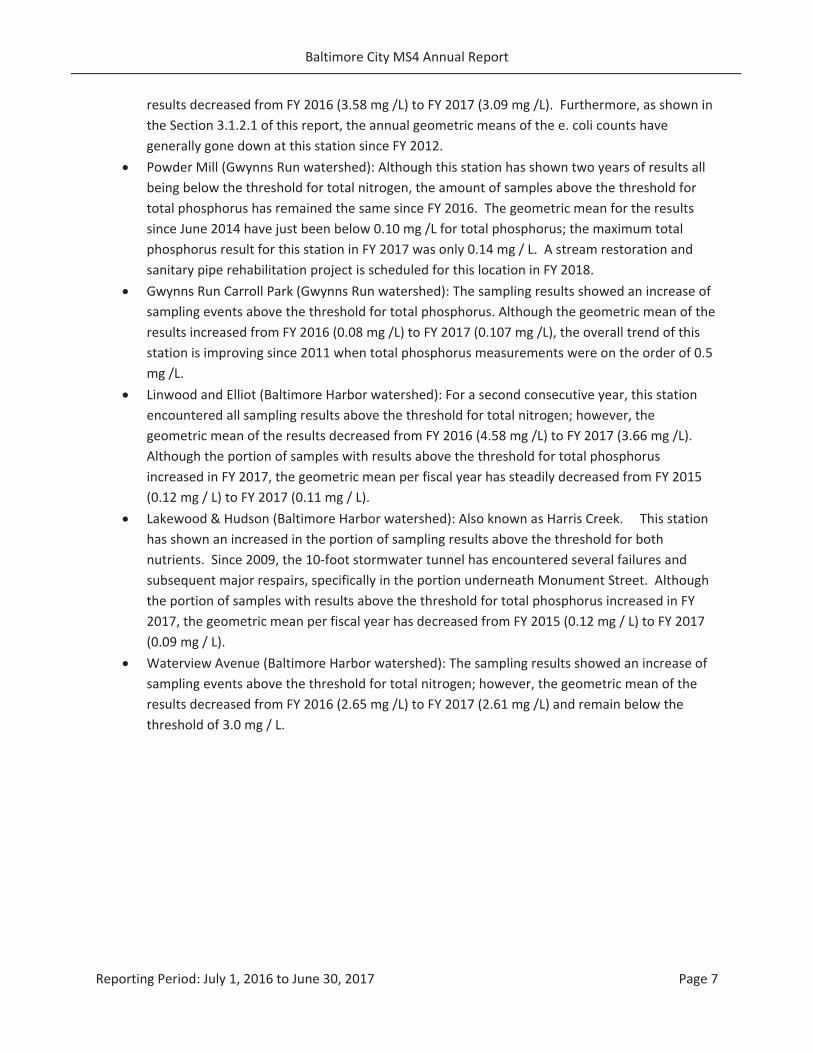
Chinquapin Run (Back River, Herring Run sub watershed): The sampling results (increased totalnitrogen and total phosphorus) appear to continue from FY 2016, when a sanitary seweroverflow (SSO) was identified. Corrective actions for the SSO stated in May 2016 butabatement was not finally confirmed until June 2017. In addition to the abatement actions,DPW has proposed a re alignment of the contributing sanitary sewer interceptor, plus a streamrestoration project. Construction of this proposed project is scheduled for FY 2018.Hamilton (Back River, Moores Run sub watershed): The sampling results showed an increase ofsampling events above the threshold for total nitrogen; however, the geometric mean of the
Baltimore City MS4 Annual Report
Reporting Period: July 1, 2016 to June 30, 2017 Page 7
results decreased from FY 2016 (3.58 mg /L) to FY 2017 (3.09 mg /L). Furthermore, as shown inthe Section 3.1.2.1 of this report, the annual geometric means of the e. coli counts havegenerally gone down at this station since FY 2012.Powder Mill (Gwynns Run watershed): Although this station has shown two years of results allbeing below the threshold for total nitrogen, the amount of samples above the threshold fortotal phosphorus has remained the same since FY 2016. The geometric mean for the resultssince June 2014 have just been below 0.10 mg /L for total phosphorus; the maximum totalphosphorus result for this station in FY 2017 was only 0.14 mg / L. A stream restoration andsanitary pipe rehabilitation project is scheduled for this location in FY 2018.Gwynns Run Carroll Park (Gwynns Run watershed): The sampling results showed an increase ofsampling events above the threshold for total phosphorus. Although the geometric mean of theresults increased from FY 2016 (0.08 mg /L) to FY 2017 (0.107 mg /L), the overall trend of thisstation is improving since 2011 when total phosphorus measurements were on the order of 0.5mg /L.Linwood and Elliot (Baltimore Harbor watershed): For a second consecutive year, this stationencountered all sampling results above the threshold for total nitrogen; however, thegeometric mean of the results decreased from FY 2016 (4.58 mg /L) to FY 2017 (3.66 mg /L).Although the portion of samples with results above the threshold for total phosphorusincreased in FY 2017, the geometric mean per fiscal year has steadily decreased from FY 2015(0.12 mg / L) to FY 2017 (0.11 mg / L).Lakewood & Hudson (Baltimore Harbor watershed): Also known as Harris Creek. This stationhas shown an increased in the portion of sampling results above the threshold for bothnutrients. Since 2009, the 10 foot stormwater tunnel has encountered several failures andsubsequent major respairs, specifically in the portion underneath Monument Street. Althoughthe portion of samples with results above the threshold for total phosphorus increased in FY2017, the geometric mean per fiscal year has decreased from FY 2015 (0.12 mg / L) to FY 2017(0.09 mg / L).Waterview Avenue (Baltimore Harbor watershed): The sampling results showed an increase ofsampling events above the threshold for total nitrogen; however, the geometric mean of theresults decreased from FY 2016 (2.65 mg /L) to FY 2017 (2.61 mg /L) and remain below thethreshold of 3.0 mg / L.
Baltimore City MS4 Annual Report
Reporting Period: July 1, 2016 to June 30, 2017 Page 8
Table 3 1: Summary of Nutrient Analysis for SIS Program
Station
Percent of Samples TotalPhosphorus >=0.1 mg/L
Percent of Samples TotalNitrogen >=3 mg/L
1/2009 –6/2017
7/2016 –6/2017
1/2009 –6/2016
1/2009 –6/2017
1/2009 –6/2017
1/2009 –6/2017
Back River Watershed Herring Run Sub watershedPERRING PKWY 17% 0% 19% 4% 10% 3%MT. PLEASANT GC 25% 0% 29% 8% 0% 9%CHINQUAPIN RUN 27% 60% 22% 26% 40% 24%TIFFANY RUN 13% 0% 14% 3% 0% 4%HARFORD RD. 18% 10% 19% 5% 0% 5%WRIGHT AVE. 25% 20% 26% 1% 0% 1%PULASKI HWY. 13% 0% 14% 6% 0% 6%Back River Watershed Moores Run Sub watershedMARY AVE. 36% 0% 41% 15% 10% 16%HAMILTON AVE. 38% 55% 35% 50% 73% 47%RADECKE AVE. 22% 9% 24% 11% 9% 12%BIDDLE ST. & 62ND ST. 33% 10% 36% 1% 0% 1%Jones Falls WatershedSMITH AVE. 24% 8% 27% 3% 0% 4%WESTERN RUN 24% 17% 26% 3% 0% 4%STONY RUN 22% 8% 24% 26% 17% 28%JF 11.5 1 89% 92% 83% 94% 92% 100%LOMBARD ST. 29% 17% 31% 6% 0% 7%Gwynns Falls WatershedPOWDER MILL 33% 42% 31% 10% 0% 12%PURNELL DR. 23% 9% 25% 1% 0% 1%DEAD RUN DNST. 29% 8% 32% 1% 8% 0%GWYNNS FALLS PKWY. 32% 8% 35% 10% 8% 10%GRUN HILTON ST. 33% 8% 37% 10% 8% 11%GF HILTON ST. 26% 0% 30% 0% 0% 0%MAIDENS CHOICE 26% 17% 27% 6% 0% 6%GRUN CARROLL PARK 57% 58% 56% 47% 42% 48%WASHINGTON BLVD. 26% 17% 27% 2% 0% 3%Baltimore Harbor WatershedLINWOOD & ELLIOTT 2 51% 60% 49% 87% 100% 84%LAKEWOOD & HUDSON 2 39% 36% 40% 76% 82% 74%CENTRAL & LANCASTER 3 48% 50% 48% 16% 17% 16%LIGHT ST. 39% 33% 40% 14% 17% 13%WARNER & ALLUVION 48% 42% 49% 18% 17% 19%WATERVIEW AVE. 28% 8% 30% 14% 25% 13%
Baltimore City MS4 Annual Report
Reporting Period: July 1, 2016 to June 30, 2017 Page 9
Station
Percent of Samples TotalPhosphorus >=0.1 mg/L
Percent of Samples TotalNitrogen >=3 mg/L
1/2009 –6/2017
7/2016 –6/2017
1/2009 –6/2016
1/2009 –6/2017
1/2009 –6/2017
1/2009 –6/2017
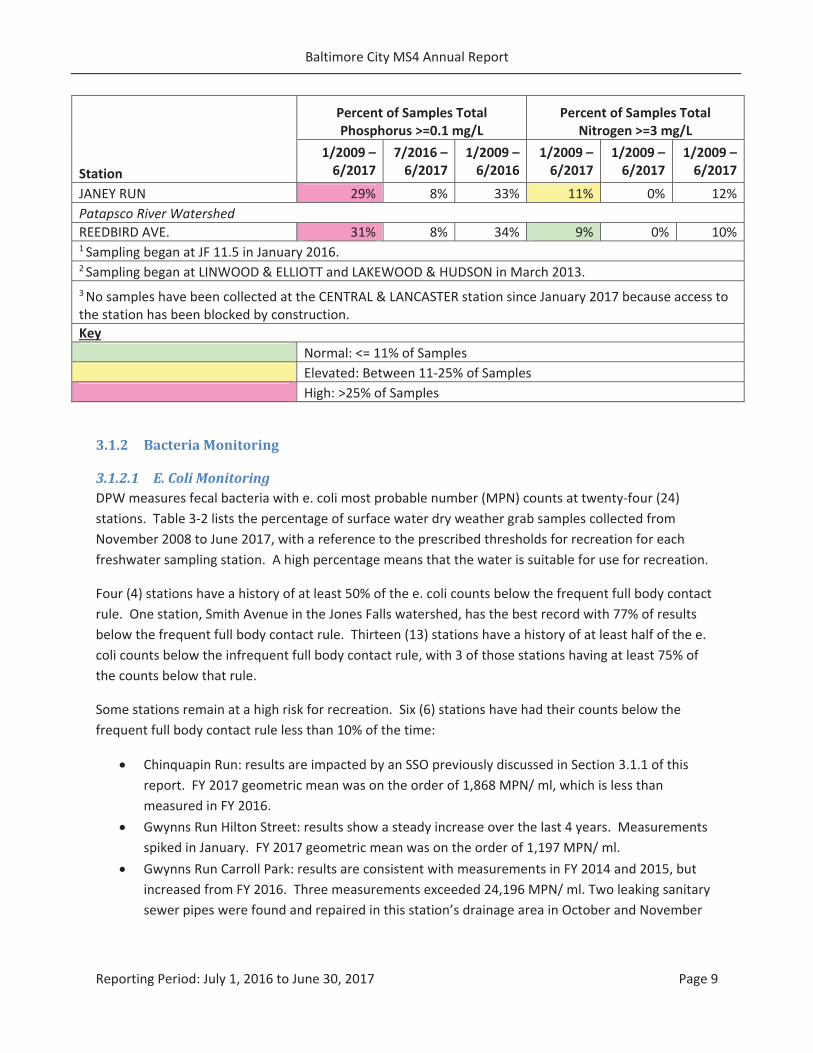
JANEY RUN 29% 8% 33% 11% 0% 12%Patapsco River WatershedREEDBIRD AVE. 31% 8% 34% 9% 0% 10%1 Sampling began at JF 11.5 in January 2016.2 Sampling began at LINWOOD & ELLIOTT and LAKEWOOD & HUDSON in March 2013.3No samples have been collected at the CENTRAL & LANCASTER station since January 2017 because access tothe station has been blocked by construction.Key
Normal: <= 11% of SamplesElevated: Between 11 25% of SamplesHigh: >25% of Samples
3.1.2 Bacteria Monitoring
3.1.2.1 E. Coli MonitoringDPWmeasures fecal bacteria with e. coli most probable number (MPN) counts at twenty four (24)stations. Table 3 2 lists the percentage of surface water dry weather grab samples collected fromNovember 2008 to June 2017, with a reference to the prescribed thresholds for recreation for eachfreshwater sampling station. A high percentage means that the water is suitable for use for recreation.
Four (4) stations have a history of at least 50% of the e. coli counts below the frequent full body contactrule. One station, Smith Avenue in the Jones Falls watershed, has the best record with 77% of resultsbelow the frequent full body contact rule. Thirteen (13) stations have a history of at least half of the e.coli counts below the infrequent full body contact rule, with 3 of those stations having at least 75% ofthe counts below that rule.
Some stations remain at a high risk for recreation. Six (6) stations have had their counts below thefrequent full body contact rule less than 10% of the time:
Chinquapin Run: results are impacted by an SSO previously discussed in Section 3.1.1 of thisreport. FY 2017 geometric mean was on the order of 1,868 MPN/ ml, which is less thanmeasured in FY 2016.Gwynns Run Hilton Street: results show a steady increase over the last 4 years. Measurementsspiked in January. FY 2017 geometric mean was on the order of 1,197 MPN/ ml.Gwynns Run Carroll Park: results are consistent with measurements in FY 2014 and 2015, butincreased from FY 2016. Three measurements exceeded 24,196 MPN/ ml. Two leaking sanitarysewer pipes were found and repaired in this station’s drainage area in October and November
Baltimore City MS4 Annual Report
Reporting Period: July 1, 2016 to June 30, 2017 Page 10
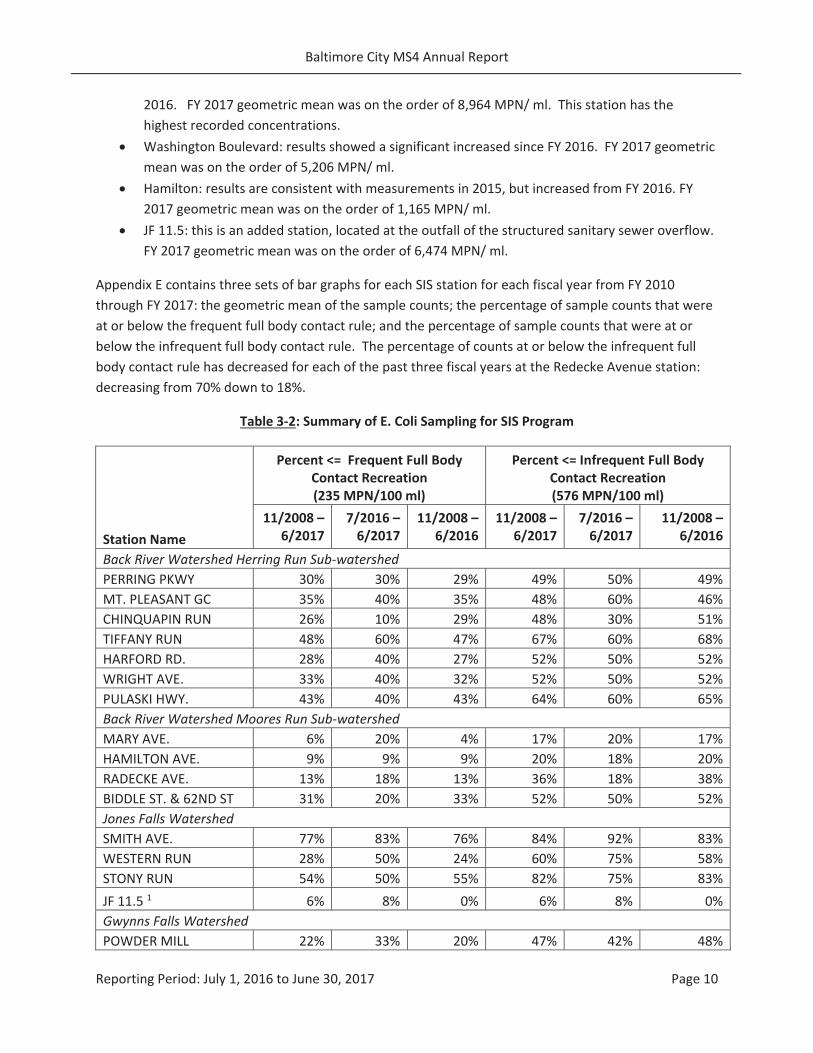
2016. FY 2017 geometric mean was on the order of 8,964 MPN/ ml. This station has thehighest recorded concentrations.Washington Boulevard: results showed a significant increased since FY 2016. FY 2017 geometricmean was on the order of 5,206 MPN/ ml.Hamilton: results are consistent with measurements in 2015, but increased from FY 2016. FY2017 geometric mean was on the order of 1,165 MPN/ ml.JF 11.5: this is an added station, located at the outfall of the structured sanitary sewer overflow.FY 2017 geometric mean was on the order of 6,474 MPN/ ml.
Appendix E contains three sets of bar graphs for each SIS station for each fiscal year from FY 2010through FY 2017: the geometric mean of the sample counts; the percentage of sample counts that wereat or below the frequent full body contact rule; and the percentage of sample counts that were at orbelow the infrequent full body contact rule. The percentage of counts at or below the infrequent fullbody contact rule has decreased for each of the past three fiscal years at the Redecke Avenue station:decreasing from 70% down to 18%.
Table 3 2: Summary of E. Coli Sampling for SIS Program
Station Name
Percent <= Frequent Full BodyContact Recreation(235 MPN/100 ml)
Percent <= Infrequent Full BodyContact Recreation(576 MPN/100 ml)
11/2008 –6/2017
7/2016 –6/2017
11/2008 –6/2016
11/2008 –6/2017
7/2016 –6/2017
11/2008 –6/2016
Back River Watershed Herring Run Sub watershedPERRING PKWY 30% 30% 29% 49% 50% 49%MT. PLEASANT GC 35% 40% 35% 48% 60% 46%CHINQUAPIN RUN 26% 10% 29% 48% 30% 51%TIFFANY RUN 48% 60% 47% 67% 60% 68%HARFORD RD. 28% 40% 27% 52% 50% 52%WRIGHT AVE. 33% 40% 32% 52% 50% 52%PULASKI HWY. 43% 40% 43% 64% 60% 65%Back River Watershed Moores Run Sub watershedMARY AVE. 6% 20% 4% 17% 20% 17%HAMILTON AVE. 9% 9% 9% 20% 18% 20%RADECKE AVE. 13% 18% 13% 36% 18% 38%BIDDLE ST. & 62ND ST 31% 20% 33% 52% 50% 52%Jones Falls WatershedSMITH AVE. 77% 83% 76% 84% 92% 83%WESTERN RUN 28% 50% 24% 60% 75% 58%STONY RUN 54% 50% 55% 82% 75% 83%JF 11.5 1 6% 8% 0% 6% 8% 0%Gwynns Falls WatershedPOWDER MILL 22% 33% 20% 47% 42% 48%
Baltimore City MS4 Annual Report
Reporting Period: July 1, 2016 to June 30, 2017 Page 11
Station Name
Percent <= Frequent Full BodyContact Recreation(235 MPN/100 ml)
Percent <= Infrequent Full BodyContact Recreation(576 MPN/100 ml)
11/2008 –6/2017
7/2016 –6/2017
11/2008 –6/2016
11/2008 –6/2017
7/2016 –6/2017
11/2008 –6/2016
PURNELL DR. 25% 25% 25% 54% 42% 56%DEAD RUN DNST. 52% 58% 51% 77% 83% 77%GWYNNS FALLS PKWY. 59% 75% 57% 73% 75% 73%GRUN HILTON ST. 9% 8% 9% 27% 42% 25%GF HILTON ST. 41% 50% 40% 63% 75% 61%MAIDENS CHOICE 36% 42% 35% 60% 58% 61%GRUN CARROLL PARK 2% 0% 3% 2% 0% 3%WASHINGTON BLVD. 2% 0% 3% 12% 0% 14%1 Sampling began at JF 11.5 in January 2016.
DPWmeasures fecal bacteria with enterococci most probable number (MPN) counts at nine (9) stations.Samples for enterococci counts are collected at these stations twice per month. Table 3 3 lists thepercentage of surface water dry weather grab samples collected from November 2008 to June 2017,with a reference to the prescribed thresholds for recreation for each sampling station.
Some stations remain at a high risk for recreation. Four (4) of the stations showed results at or belowthe frequent full body contact rule for less than 10% of the counts; the station at Linwood & Elliot alsoshowed counts at or below the infrequent full body contact rule for less than 10% of the counts.
Comparing the counts from FY 2017 to the accumulation of counts through FY 2016, four stations (4)had a large increase (improving water quality) in the percentage of counts at or below the frequent fullbody contact rule; and one station (Lakewood & Hudson) had a decrease with 0% for FY 2017 comparedto the historic level of 12%. Five (5) stations had a large increase in the percentage of counts at or belowthe infrequent full body contact rule.
Appendix E contains three sets of bar graphs for each SIS station for each fiscal year from FY 2010through FY 2017: the geometric mean of the sample counts; the percentage of sample counts that wereat or below the frequent full body contact rule; and the percentage of sample counts that were at orbelow the infrequent full body contact rule. Light Street station had its best year to date in FY 2017 with73% of counts at or below the frequent full body contact rule.
Baltimore City MS4 Annual Report
Reporting Period: July 1, 2016 to June 30, 2017 Page 12
Table 3 3: Summary of Enterococci Sampling for SIS Program
Station
Percent <= Frequent Full BodyContact Recreation(104 MPN/100 ml)
Percent <= Infrequent Full BodyContact Recreation(500 MPN/100 ml)
1/2009 –6/2017
7/2016 –6/2017
1/2009 –6/2016
1/2009 –6/2017
7/2016 –6/2017
1/2009 –6/2016
Patapsco River Watershed REEDBIRD AVE. 48% 68% 45% 71% 86% 69%Baltimore Harbor Watershed WATERVIEW AVE. 27% 41% 25% 63% 73% 61%WARNER & ALLUVION 7% 14% 6% 31% 50% 29%LIGHT ST. 46% 73% 42% 74% 91% 72%CENTRAL &LANCASTER 1 11% 38% 8% 38% 62% 36%LAKEWOOD &HUDSON2 9% 0% 12% 24% 29% 22%LINWOOD & ELLIOTT 2 1% 0% 1% 8% 5% 9%JANEY RUN 36% 36% 36% 62% 64% 62%Jones Falls Watershed LOMBARD ST. 9% 9% 9% 37% 59% 34%1We were not able to sample at CENTRAL & LANCASTER mid February through June 2017 becauseof construction in the area.2 Sampling began at LINWOOD & ELLIOTT and LAKEWOOD & HUDSON in March 2013.
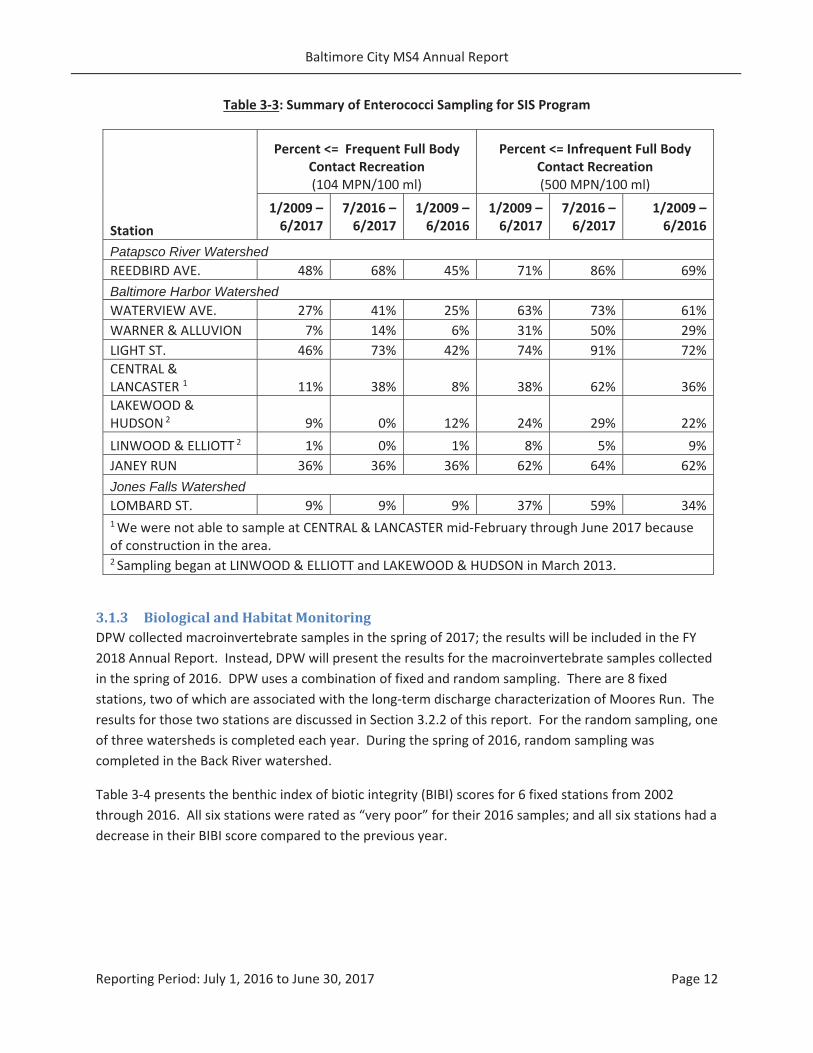
3.1.3 Biological and Habitat MonitoringDPW collected macroinvertebrate samples in the spring of 2017; the results will be included in the FY2018 Annual Report. Instead, DPW will present the results for the macroinvertebrate samples collectedin the spring of 2016. DPW uses a combination of fixed and random sampling. There are 8 fixedstations, two of which are associated with the long term discharge characterization of Moores Run. Theresults for those two stations are discussed in Section 3.2.2 of this report. For the random sampling, oneof three watersheds is completed each year. During the spring of 2016, random sampling wascompleted in the Back River watershed.
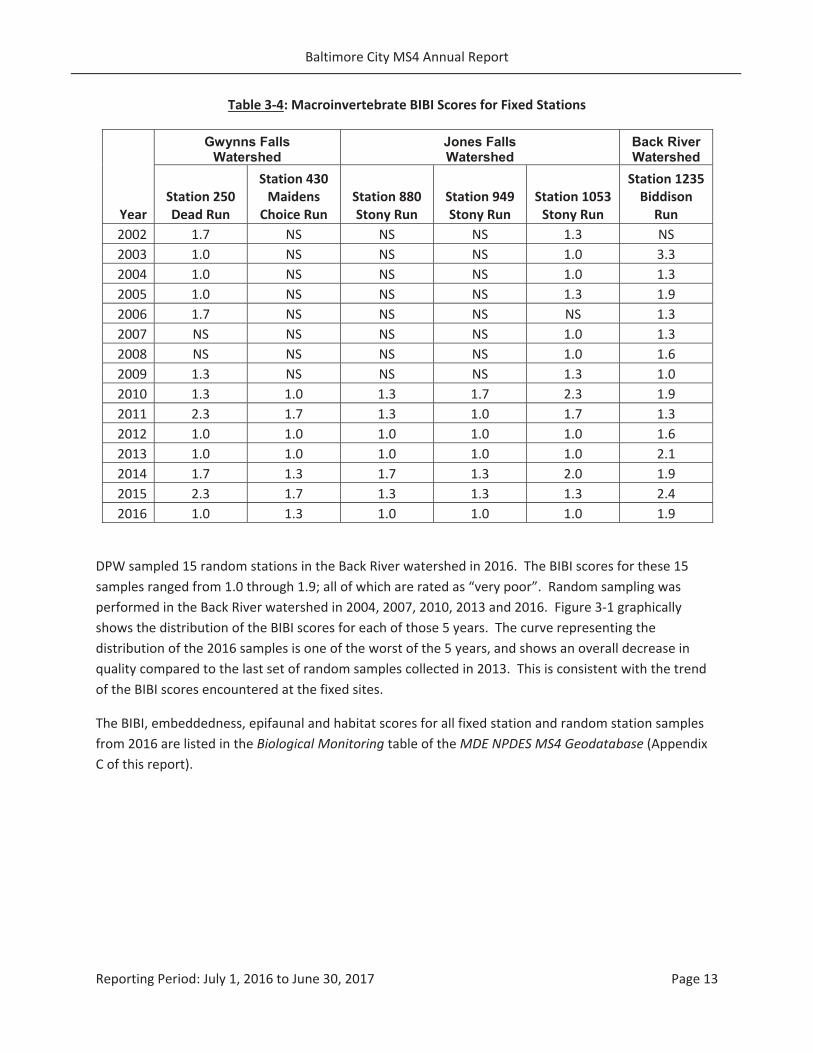
Table 3 4 presents the benthic index of biotic integrity (BIBI) scores for 6 fixed stations from 2002through 2016. All six stations were rated as “very poor” for their 2016 samples; and all six stations had adecrease in their BIBI score compared to the previous year.
Baltimore City MS4 Annual Report
Reporting Period: July 1, 2016 to June 30, 2017 Page 13
Table 3 4: Macroinvertebrate BIBI Scores for Fixed Stations
Year
Gwynns Falls Watershed
Jones Falls Watershed
Back River Watershed
Station 250Dead Run
Station 430Maidens
Choice RunStation 880Stony Run
Station 949Stony Run
Station 1053Stony Run
Station 1235BiddisonRun
2002 1.7 NS NS NS 1.3 NS2003 1.0 NS NS NS 1.0 3.32004 1.0 NS NS NS 1.0 1.32005 1.0 NS NS NS 1.3 1.92006 1.7 NS NS NS NS 1.32007 NS NS NS NS 1.0 1.32008 NS NS NS NS 1.0 1.62009 1.3 NS NS NS 1.3 1.02010 1.3 1.0 1.3 1.7 2.3 1.92011 2.3 1.7 1.3 1.0 1.7 1.32012 1.0 1.0 1.0 1.0 1.0 1.62013 1.0 1.0 1.0 1.0 1.0 2.12014 1.7 1.3 1.7 1.3 2.0 1.92015 2.3 1.7 1.3 1.3 1.3 2.42016 1.0 1.3 1.0 1.0 1.0 1.9
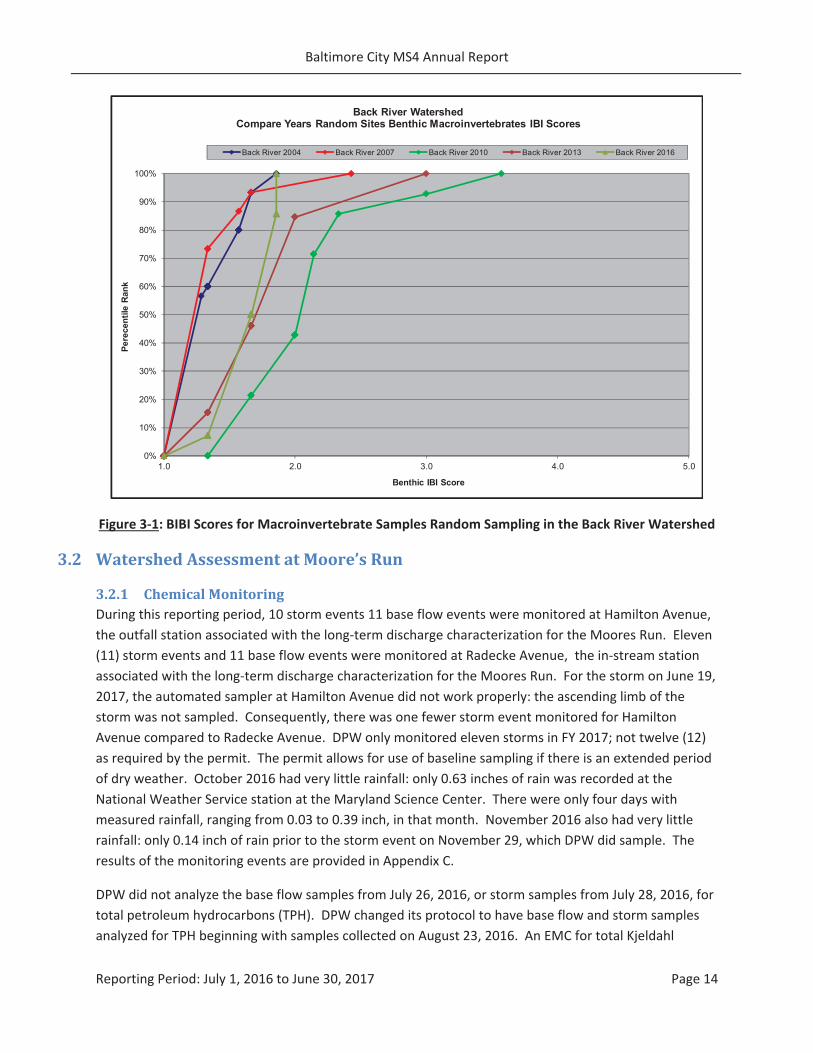
DPW sampled 15 random stations in the Back River watershed in 2016. The BIBI scores for these 15samples ranged from 1.0 through 1.9; all of which are rated as “very poor”. Random sampling wasperformed in the Back River watershed in 2004, 2007, 2010, 2013 and 2016. Figure 3 1 graphicallyshows the distribution of the BIBI scores for each of those 5 years. The curve representing thedistribution of the 2016 samples is one of the worst of the 5 years, and shows an overall decrease inquality compared to the last set of random samples collected in 2013. This is consistent with the trendof the BIBI scores encountered at the fixed sites.
The BIBI, embeddedness, epifaunal and habitat scores for all fixed station and random station samplesfrom 2016 are listed in the Biological Monitoring table of theMDE NPDES MS4 Geodatabase (AppendixC of this report).
Baltimore City MS4 Annual Report
Reporting Period: July 1, 2016 to June 30, 2017 Page 14
Figure 3 1: BIBI Scores for Macroinvertebrate Samples Random Sampling in the Back River Watershed
3.2 Watershed Assessment at Moore’s Run
3.2.1 Chemical MonitoringDuring this reporting period, 10 storm events 11 base flow events were monitored at Hamilton Avenue,the outfall station associated with the long term discharge characterization for the Moores Run. Eleven(11) storm events and 11 base flow events were monitored at Radecke Avenue, the in stream stationassociated with the long term discharge characterization for the Moores Run. For the storm on June 19,2017, the automated sampler at Hamilton Avenue did not work properly: the ascending limb of thestorm was not sampled. Consequently, there was one fewer storm event monitored for HamiltonAvenue compared to Radecke Avenue. DPW only monitored eleven storms in FY 2017; not twelve (12)as required by the permit. The permit allows for use of baseline sampling if there is an extended periodof dry weather. October 2016 had very little rainfall: only 0.63 inches of rain was recorded at theNational Weather Service station at the Maryland Science Center. There were only four days withmeasured rainfall, ranging from 0.03 to 0.39 inch, in that month. November 2016 also had very littlerainfall: only 0.14 inch of rain prior to the storm event on November 29, which DPW did sample. Theresults of the monitoring events are provided in Appendix C.
DPW did not analyze the base flow samples from July 26, 2016, or storm samples from July 28, 2016, fortotal petroleum hydrocarbons (TPH). DPW changed its protocol to have base flow and storm samplesanalyzed for TPH beginning with samples collected on August 23, 2016. An EMC for total Kjeldahl
0%
10%
20%
30%
40%
50%
60%
70%
80%
90%
100%
1.0 2.0 3.0 4.0 5.0
Pere
cent
ile R
ank
Benthic IBI Score
Back River Watershed Compare Years Random Sites Benthic Macroinvertebrates IBI Scores
Back River 2004 Back River 2007 Back River 2010 Back River 2013 Back River 2016
Baltimore City MS4 Annual Report
Reporting Period: July 1, 2016 to June 30, 2017 Page 15
nitrogen (TKN) and total phosphorus was not calculated for the Hamilton Avenue station for the stormon September 27, 2016, due to an accident at the lab with the samples.
In addition to these monitoring events, these two locations were monitored as part of the AmmoniaScreening program. The results of that monitoring are included in Appendix D of this Annual Report.
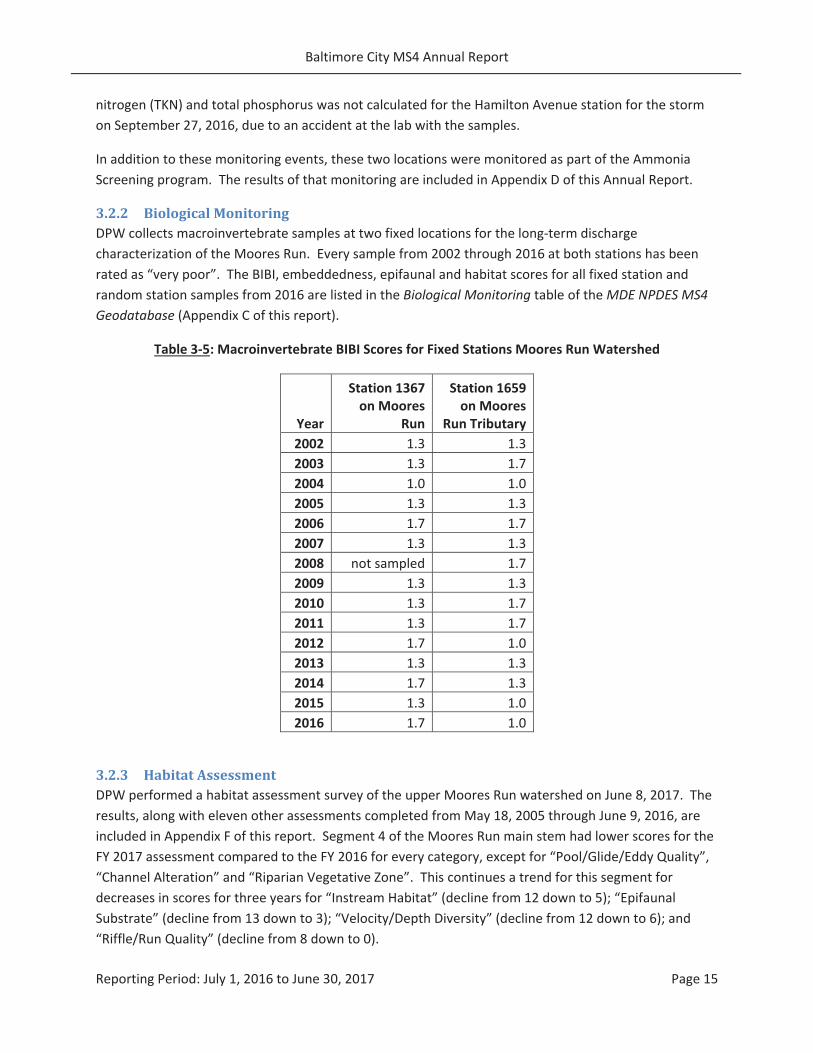
3.2.2 Biological MonitoringDPW collects macroinvertebrate samples at two fixed locations for the long term dischargecharacterization of the Moores Run. Every sample from 2002 through 2016 at both stations has beenrated as “very poor”. The BIBI, embeddedness, epifaunal and habitat scores for all fixed station andrandom station samples from 2016 are listed in the Biological Monitoring table of theMDE NPDES MS4Geodatabase (Appendix C of this report).
Table 3 5: Macroinvertebrate BIBI Scores for Fixed Stations Moores Run Watershed
Year
Station 1367on Moores
Run
Station 1659on Moores
Run Tributary2002 1.3 1.32003 1.3 1.72004 1.0 1.02005 1.3 1.32006 1.7 1.72007 1.3 1.32008 not sampled 1.72009 1.3 1.32010 1.3 1.72011 1.3 1.72012 1.7 1.02013 1.3 1.32014 1.7 1.32015 1.3 1.02016 1.7 1.0
3.2.3 Habitat AssessmentDPW performed a habitat assessment survey of the upper Moores Run watershed on June 8, 2017. Theresults, along with eleven other assessments completed from May 18, 2005 through June 9, 2016, areincluded in Appendix F of this report. Segment 4 of the Moores Run main stem had lower scores for theFY 2017 assessment compared to the FY 2016 for every category, except for “Pool/Glide/Eddy Quality”,“Channel Alteration” and “Riparian Vegetative Zone”. This continues a trend for this segment fordecreases in scores for three years for “Instream Habitat” (decline from 12 down to 5); “EpifaunalSubstrate” (decline from 13 down to 3); “Velocity/Depth Diversity” (decline from 12 down to 6); and“Riffle/Run Quality” (decline from 8 down to 0).
Baltimore City MS4 Annual Report
Reporting Period: July 1, 2016 to June 30, 2017 Page 16
Approximately 1.7 miles of stream restoration is proposed for Moore’s Run as part of the MS4Restoration and TMDL WIP, as shown in Appendix K of this report.
3.2.4 Geomorphic MonitoringThe U.S. Fish and Wildlife Service (USFW) completed the physical monitoring of the Moore’s Run site;the results were included in the FY 2017 Annual Report. DPW initiated a hydrologic and hydraulic (H &H) model of a prescribed reach of stream in FY 2017. The results of the model, including an analysis ofthe effected of rainfall, discharge rates, stage and continuous flow on channel geometry will be includedin the FY 2018 Annual Report.
3.2.5 Stormwater Management Assessment at Stony RunIn 2016, the City contracted USFW to evaluate five stream restoration projects completed within theCity to date, including Stony Run. USFW used a stream restoration monitoring methodology to evaluatethe stability and functional success of stream restoration projects in Baltimore City. The results of theevaluation are included in Appendix G of this report. The reports indicated several locations that neededrepair; DPW has procured the necessary contracted services and obtained all relevant permits for theserepairs and will initiate the repairs (starting in Upper Stony Run) in FY 2018.
The physical survey of the stream profile and of permanently monumented cross sections in the StonyRun were completed in FY 2017, to complement USFW assessment. Furthermore, in FY 2017, DPWinitiated an H & H model of the former stream restoration project, known as Upper Stony Run. Theresults of the model, including an analysis of the effected of rainfall, discharge rates, stage andcontinuous flow on channel geometry will be included in the FY 2018 Annual Report.
Baltimore City MS4 Annual Report
Reporting Period: July 1, 2016 to June 30, 2017 Page 17
4 Expenditures and Proposed Budget
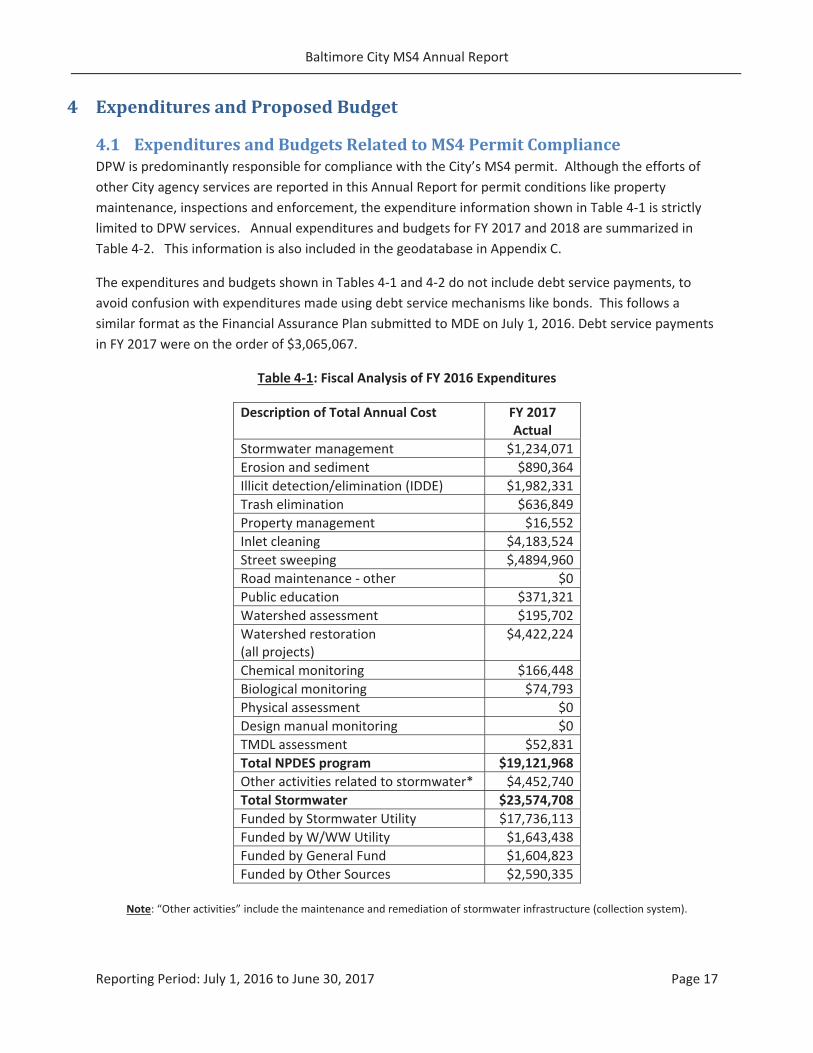
4.1 Expenditures and Budgets Related to MS4 Permit ComplianceDPW is predominantly responsible for compliance with the City’s MS4 permit. Although the efforts ofother City agency services are reported in this Annual Report for permit conditions like propertymaintenance, inspections and enforcement, the expenditure information shown in Table 4 1 is strictlylimited to DPW services. Annual expenditures and budgets for FY 2017 and 2018 are summarized inTable 4 2. This information is also included in the geodatabase in Appendix C.
The expenditures and budgets shown in Tables 4 1 and 4 2 do not include debt service payments, toavoid confusion with expenditures made using debt service mechanisms like bonds. This follows asimilar format as the Financial Assurance Plan submitted to MDE on July 1, 2016. Debt service paymentsin FY 2017 were on the order of $3,065,067.
Table 4 1: Fiscal Analysis of FY 2016 Expenditures
Description of Total Annual Cost FY 2017Actual
Stormwater management $1,234,071Erosion and sediment $890,364Illicit detection/elimination (IDDE) $1,982,331Trash elimination $636,849Property management $16,552Inlet cleaning $4,183,524Street sweeping $,4894,960Road maintenance other $0Public education $371,321Watershed assessment $195,702Watershed restoration(all projects)
$4,422,224
Chemical monitoring $166,448Biological monitoring $74,793Physical assessment $0Design manual monitoring $0TMDL assessment $52,831Total NPDES program $19,121,968Other activities related to stormwater* $4,452,740Total Stormwater $23,574,708Funded by Stormwater Utility $17,736,113Funded by W/WW Utility $1,643,438Funded by General Fund $1,604,823Funded by Other Sources $2,590,335
Note: “Other activities” include the maintenance and remediation of stormwater infrastructure (collection system).
Baltimore City MS4 Annual Report
Reporting Period: July 1, 2016 to June 30, 2017 Page 18
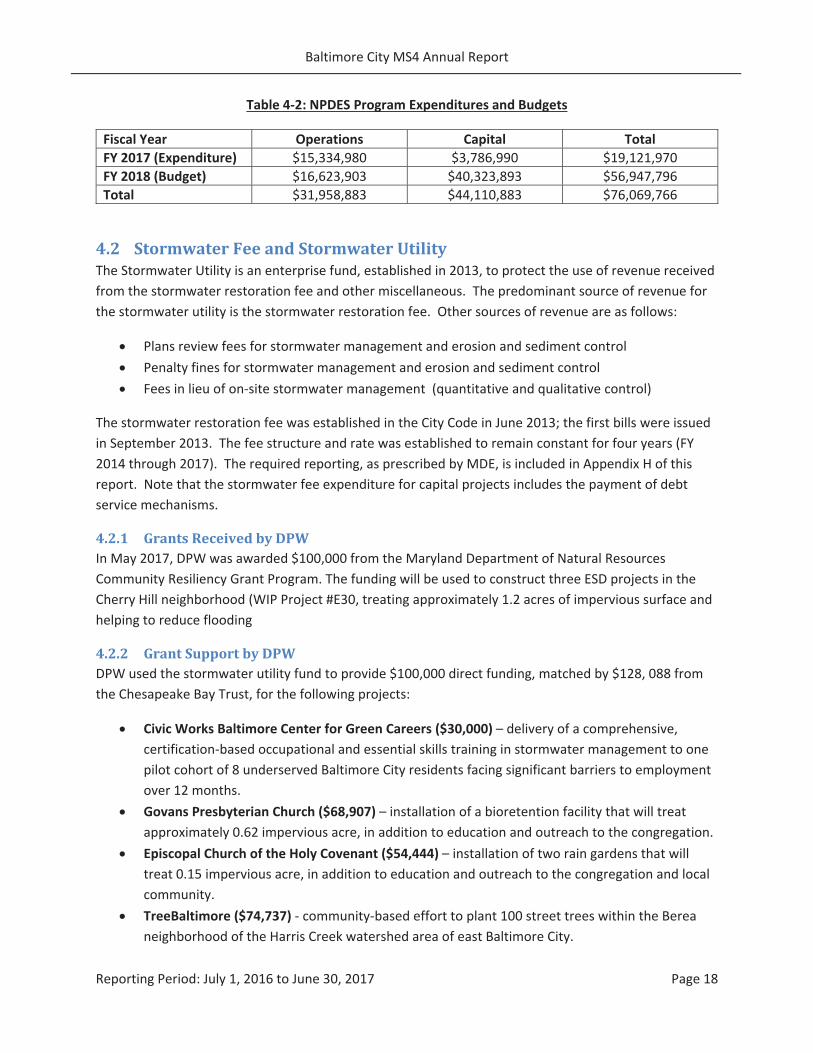
Table 4 2: NPDES Program Expenditures and Budgets
Fiscal Year Operations Capital TotalFY 2017 (Expenditure) $15,334,980 $3,786,990 $19,121,970FY 2018 (Budget) $16,623,903 $40,323,893 $56,947,796Total $31,958,883 $44,110,883 $76,069,766
4.2 Stormwater Fee and Stormwater UtilityThe Stormwater Utility is an enterprise fund, established in 2013, to protect the use of revenue receivedfrom the stormwater restoration fee and other miscellaneous. The predominant source of revenue forthe stormwater utility is the stormwater restoration fee. Other sources of revenue are as follows:
Plans review fees for stormwater management and erosion and sediment controlPenalty fines for stormwater management and erosion and sediment controlFees in lieu of on site stormwater management (quantitative and qualitative control)
The stormwater restoration fee was established in the City Code in June 2013; the first bills were issuedin September 2013. The fee structure and rate was established to remain constant for four years (FY2014 through 2017). The required reporting, as prescribed by MDE, is included in Appendix H of thisreport. Note that the stormwater fee expenditure for capital projects includes the payment of debtservice mechanisms.
4.2.1 Grants Received by DPWIn May 2017, DPW was awarded $100,000 from the Maryland Department of Natural ResourcesCommunity Resiliency Grant Program. The funding will be used to construct three ESD projects in theCherry Hill neighborhood (WIP Project #E30, treating approximately 1.2 acres of impervious surface andhelping to reduce flooding
4.2.2 Grant Support by DPWDPW used the stormwater utility fund to provide $100,000 direct funding, matched by $128, 088 fromthe Chesapeake Bay Trust, for the following projects:
Civic Works Baltimore Center for Green Careers ($30,000) – delivery of a comprehensive,certification based occupational and essential skills training in stormwater management to onepilot cohort of 8 underserved Baltimore City residents facing significant barriers to employmentover 12 months.Govans Presbyterian Church ($68,907) – installation of a bioretention facility that will treatapproximately 0.62 impervious acre, in addition to education and outreach to the congregation.Episcopal Church of the Holy Covenant ($54,444) – installation of two rain gardens that willtreat 0.15 impervious acre, in addition to education and outreach to the congregation and localcommunity.TreeBaltimore ($74,737) community based effort to plant 100 street trees within the Bereaneighborhood of the Harris Creek watershed area of east Baltimore City.
Baltimore City MS4 Annual Report
Reporting Period: July 1, 2016 to June 30, 2017 Page 19
In addition to the direct funding listed above, DPW provided thirteen (13) letters of support to nonprofits and academic institutions for grant applications that would improve water quality in BaltimoreCity.
4.3 Capital Projects – Expenditures and Financing
The capital improvements for the stormwater management include projects specifically listed in theAppendix K of this report, plus the capital projects to remediate or replace stormwater infrastructure.These projects are funded by a combination of the stormwater utility, county transportation bonds,general obligation bonds, and grant funding. The capital costs listed in Appendix H include both theexpenditure for contracted services, capitalization of in house efforts, and the payment of debt servicefor capital contracted expenditures from previous years. The stormwater utility is responsible forpaying the principle, interest, and administrative costs related to these bonds.
In addition to the State Revolving Loan Fund, the City was invited by the U.S. EPA to apply for $200 M incredit assistance to improve its water, wastewater and stormwater infrastructure. Only 12 projects in 9states were selected to apply for loans under US EPA’s Water Infrastructure Finance and Innovation Act(WIFIA) program. The City’s application included stormwater projects that are listed in Appendix K ofthis Report.
Baltimore City MS4 Annual Report
Reporting Period: July 1, 2016 to June 30, 2017 Page 20
5 Enforcement Actions, Inspections and Public Education
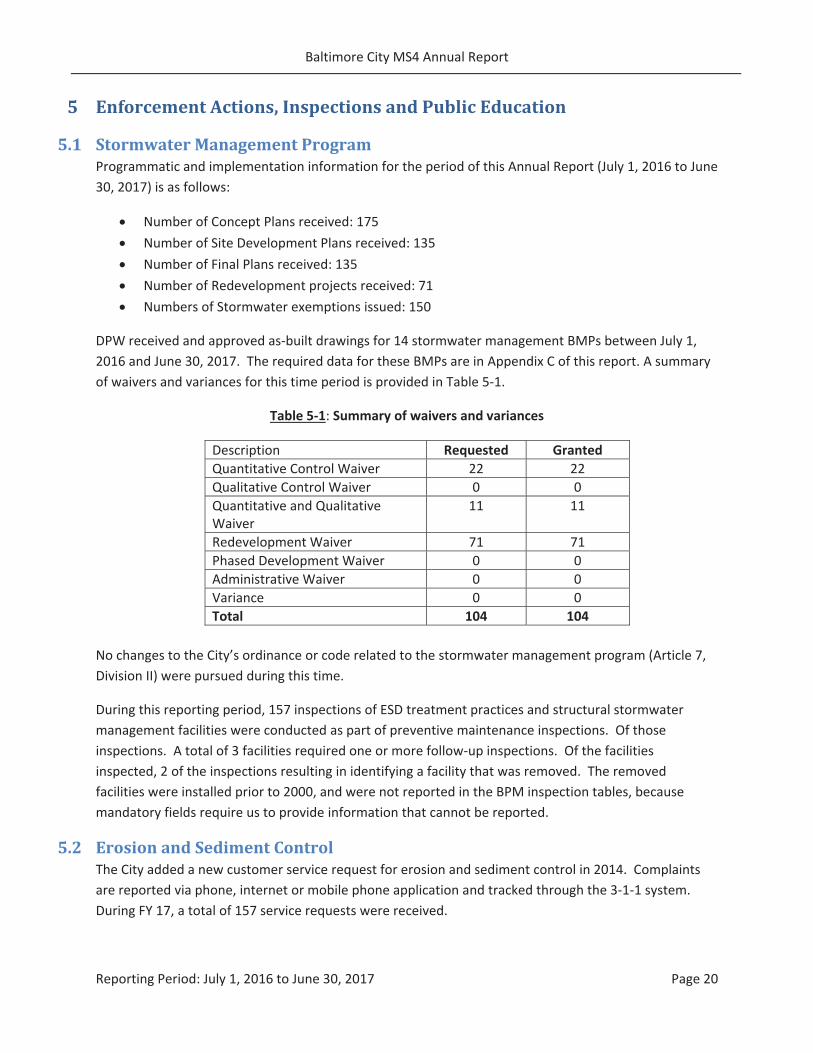
5.1 Stormwater Management ProgramProgrammatic and implementation information for the period of this Annual Report (July 1, 2016 to June30, 2017) is as follows:
Number of Concept Plans received: 175Number of Site Development Plans received: 135Number of Final Plans received: 135Number of Redevelopment projects received: 71Numbers of Stormwater exemptions issued: 150
DPW received and approved as built drawings for 14 stormwater management BMPs between July 1,2016 and June 30, 2017. The required data for these BMPs are in Appendix C of this report. A summaryof waivers and variances for this time period is provided in Table 5 1.
Table 5 1: Summary of waivers and variances
Description Requested GrantedQuantitative Control Waiver 22 22Qualitative Control Waiver 0 0Quantitative and QualitativeWaiver
11 11
Redevelopment Waiver 71 71Phased Development Waiver 0 0Administrative Waiver 0 0Variance 0 0Total 104 104
No changes to the City’s ordinance or code related to the stormwater management program (Article 7,Division II) were pursued during this time.
During this reporting period, 157 inspections of ESD treatment practices and structural stormwatermanagement facilities were conducted as part of preventive maintenance inspections. Of thoseinspections. A total of 3 facilities required one or more follow up inspections. Of the facilitiesinspected, 2 of the inspections resulting in identifying a facility that was removed. The removedfacilities were installed prior to 2000, and were not reported in the BPM inspection tables, becausemandatory fields require us to provide information that cannot be reported.
5.2 Erosion and Sediment ControlThe City added a new customer service request for erosion and sediment control in 2014. Complaintsare reported via phone, internet or mobile phone application and tracked through the 3 1 1 system.During FY 17, a total of 157 service requests were received.
Baltimore City MS4 Annual Report
Reporting Period: July 1, 2016 to June 30, 2017 Page 21
During this reporting period, 2,766 inspections were conducted for compliance with approved erosionand sediment control plans. A total of 5 violation notices were issued by the City, resulting in a sum of$16,200 received as penalty fines and 3 stop work orders. The summary information regarding earthdisturbances exceeding one acre are included in Appendix C of this report.
No changes to the City’s ordinance or code related to the erosion and sediment control program (Article7, Division III) were pursued during this time.
5.3 Illicit Discharge Detection and Elimination (IDDE)
5.3.1 Routine Field Screening LocationsDPW conducts an MDE approved alternative to IDDE: ammonia screening (AS) and stream impactsampling (SIS) to initiate pollution source tracking (PST) investigations. The AS and SIS samplinglocations are included in the geo reference data provided in Appendix C. As noted in Section 3.1, thestation at Central & Lancaster was suspended and the station at JF 11.5 was added this fiscal year. Themonitoring results from the surveys for the AS and SIS programs for FY 2017 are included in Appendix Dof this report. These monitoring results, plus historic data, are also available on line at the City’s DPWwebsite.
5.3.2 Supplemental Field Screening
5.3.2.1 East Harbor Storm Drain Ammonia SurveyThe Baltimore Harbor Storm Drain Survey concluded in early 2017 with sample locations in east Cantonthrough Dundalk. Twenty two (22) stormwater assets were visited, mostly storm drain manholes. Thearea surveyed consisted primarily of commercial and industrial land use. Most outfalls were eitherinaccessible or below tidal waters. No PSTs were initiated for ammonia during this time; all highammonia values were accompanied by low enterococci bacteria values. Two (2) PST investigations wereinitiated based on high chlorine values that led to potable water leaks. These illicit discharges areincluded in the number of illicit discharges reported in Section 5.3.4.
5.3.2.2 Blue Water Baltimore Outfall ScreeningThe civic organization Blue Water Baltimore (BWB) performs some screening at storm drain outfalls.When BWB finds a water quality issue at an outfall, they report it to OCAL, and request an investigation.During FY 2017, OCAL initiated 22 PSTs in response to BWB water quality complaints. During these PSTs,OCAL found 9 potable water discharges and 3 sanitary sewer discharges at Western Run and HerringRun. These illicit discharges are included in the number of illicit discharges reported in Section 5.3.4.
5.3.2.3 Ridge to Reefs Illicit Discharge ProjectDPW assisted Ridges to Reef on an illicit discharge project, supported by the Chesapeake Bay TrustWatershed Assistance Grant. The purpose of the project was to test new equipment in the field,specifically a Turner Designs Aquafluor handheld fluorometer that could test for optical brighteners.Blue Water Baltimore also supported the project, as discussed in Section 5.3.2.2. DPW used theproposed equipment along with current methodologies used as part of the AS program. Results of by allusers were compiled and it was determined that the results of the flourometer could be used as a
Baltimore City MS4 Annual Report
Reporting Period: July 1, 2016 to June 30, 2017 Page 22
supplemental indicator of illicit discharges, especially when there are possible water chemistryinterferences with the ammonia nitrogen test. The project resulted in the donation of the equipment toDPW. The final project report will be included in the FY 2018 Annual Report.
5.3.2.4 Microbial Source TrackingThe City contracted with the University of Baltimore and the University of Maryland Baltimore County(UB/UMBC) to perform microbial source tracking. During FY 2017, two sets of samples were collectedon March 23, 2017 and May 18, 2017 within the storm drain network and submitted for analysis. Therewere eight (8) samples collected on each date. This project will completed by June 2018. All results andan analysis of the usefulness of microbial source tracking will be presented in the FY 2018 AnnualReport.
5.3.3 3 1 1 Customer Service Request for Polluted WaterComplaints are reported via phone, internet or mobile phone application and tracked through the 3 1 1system. Complaints that are designated with the type “WWWaterway Pollution Investigation” areinitially assigned to the Water Quality Monitoring and Inspections Section of OCAL. During FY 2017, atotal of 178 service requests were received. Forty three (43) resulted in a pollution source trackinginvestigation. Twelve (12) of these investigations led to the discovery of an illicit discharge or activitythat was removed or corrected:
Three (3) dry weather sanitary sewer overflows (SSO) from the public system;One repair to a contractor’s pump around equipment that was being used during the repair of asanitary sewer line;One replacement of a sanitary sewer manhole stack that had been damaged during a storm;Two (2) potable water system leaks;One clean up of a private sump pump;One stop work order and clean up of unauthorized in door lead paint removal operation;One clean up of spilled motor oil at an automotive service lot; andTwo (2) enforcements of proper sediment and erosion controls at construction sites.
Three (3) of these investigations led to the discovery of an illicit discharge, but the repairs were notcompleted by the end of FY 2017:
one (1) potable water system leak;one (1) private sanitary sewer discharge; andone (1) improper control of sediment and erosion at a construction site.
These illicit discharges are included among those further discussed in Section 5.3.4.
5.3.4 Pollution Source Tracking (PST)DPW initiates PST investigations based on the results of field screening, 3 1 1 customer service requestsor requests from other programs (such as Blue Water Baltimore, MDE or EPA). During FY 2017, a total of206 PST investigations were conducted: 178 PST investigations were initiated during FY 2017 and theothers were a continuation of PST investigations initiated prior to FY 2017. The PST investigations
Baltimore City MS4 Annual Report
Reporting Period: July 1, 2016 to June 30, 2017 Page 23
resulted in mobilizing to 1,211 locations in the open channel and storm drain system to conduct waterquality chemical analyses, make observations, drop dye, etc. As a result of the PST investigations, thefollowing illicit discharges were identified and abated, with further details provided in Appendix I:
Fifty three (53) dry weather sanitary sewer overflows (SSOs) from the public sewer; nine (9) ofthese were designated as sanitary discharge of unknown origin (SDUOs) at some point duringtheir investigations;Eleven (11) sewage inputs from private properties to the storm drain system; eight (8) of thesewere designated as sanitary discharge of unknown origin (SDUOs) at some point during theirinvestigations;Fifteen (15) drinking water transmission losses; andNineteen (19) with other types of illicit discharge:
o Nine (9) related to constructions sites where erosion and sediment controls needed tobe corrected;
o Six (6) related to projects in which City owned sanitary sewer or potable waterinfrastructure was being repaired;
o Two (2) involving proper clean up and containment of used motor oil at automotiveservice lots; and
o Two (2) involving improper containment of wastes from interior paint removaloperations.
Additionally, twenty two (22) illicit discharge sources were located and await further repairs:
Five (5) sanitary sewage inputs from private properties; four (4) of which were designated asSDUOs at some point during their investigations;One (1) SSO, which began as an SDUO;Fifteen (15) drinking water transmission losses; andOne (1) for sediment laden discharge from a construction that has sediment and erosioncontrols, but still some sediment laden discharge would come off the site. The incident wasreferred to OCAL’s sediment and erosion control inspectors to enforce.
There are five (5) on going investigations for which a pollution source has not yet been identified:
Three (3) discharges that suggest that the source is coming from the sanitary sewer network;andTwo (2) with high chlorine levels suggesting the source is from drinking water transmissionlosses.
5.3.5 FOG ProgramIn November 2013, DPW initiated an inspection program to reduce fats, oils and grease (FOG) within thesanitary sewer system. The FOG Program has a two pronged approach that manages FOG from both theprivate and public sides of the property line by:
Baltimore City MS4 Annual Report
Reporting Period: July 1, 2016 to June 30, 2017 Page 24
Requiring all food services establishments (FSE) that have the potential to discharge FOG ladenwastewater to have an adequate grease control device (GCD), andReducing build up of fats, oils and grease in the sewer lines using a commercial grade degreaser.
FOG education efforts are focused on both residents and owners of FSEs. Flyers were included withwater bills. Outreach at festivals and community meetings included distribution of education materials.All education materials are available on the City’s DPW website.
The DPW Pollution Control Section performs the inspections and educates FSEs about FOG bestmanagement practices. There were 3,999 inspections of FSEs during FY 2017: this is an increase of 10%compared to the 3,623 inspections during FY 2016. During FY 2017, 1,404 FSEs (35%) were found not tobe in compliance. There were 1,948 notices of violation (NOV) issued to the 1,404 FSEs were found notto be in compliance. Thirty (30) FSEs were issued consent agreements. A breakdown by type of NOV isincluded in Appendix I of this Annual Report.
In FY 32015 Annual Report, the City reported that there were 144 Baltimore City Public Schools thatneeded to install GCDs. The State Board of Public Works approved funding for renovations at 32 out ofthose 144 schools in early September 2016. The Pollution Control Section confirmed that GCDs wereinstalled in 9 of those 32 schools during FY 2017. Approval for renovations (which includes installationof GCDs) for the remaining 112 schools was still pending at the time of this report. The City will reporton the progress of funding and installing GCDs in those schools in the FY 2018 Annual Report.
5.3.6 Exterior Lead Paint Removal Waste Control ProgramThis program is administered by the DPW Pollution Control Section. During FY 2017, there were 287permitted sites. Inspectors made 265 site visits and issued 55 stop work notices requiring correctiveaction. There were no documented illegal discharges to the storm drain system.
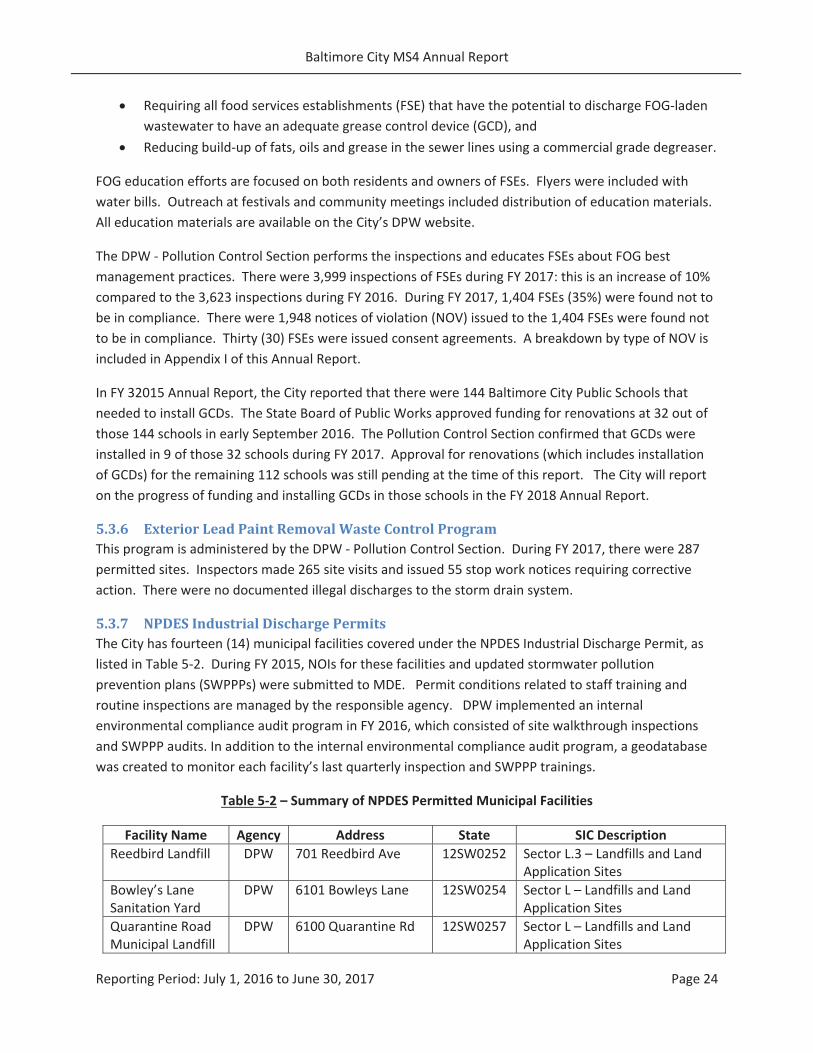
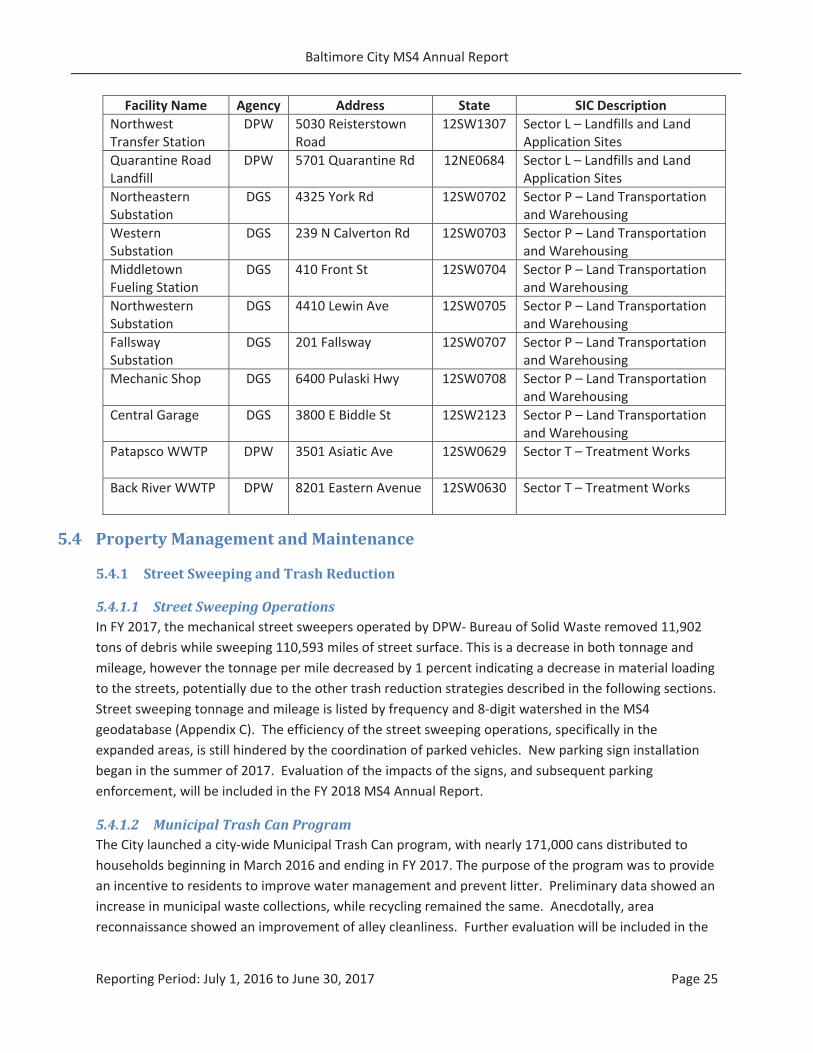
5.3.7 NPDES Industrial Discharge PermitsThe City has fourteen (14) municipal facilities covered under the NPDES Industrial Discharge Permit, aslisted in Table 5 2. During FY 2015, NOIs for these facilities and updated stormwater pollutionprevention plans (SWPPPs) were submitted to MDE. Permit conditions related to staff training androutine inspections are managed by the responsible agency. DPW implemented an internalenvironmental compliance audit program in FY 2016, which consisted of site walkthrough inspectionsand SWPPP audits. In addition to the internal environmental compliance audit program, a geodatabasewas created to monitor each facility’s last quarterly inspection and SWPPP trainings.
Table 5 2 – Summary of NPDES Permitted Municipal Facilities
Facility Name Agency Address State SIC DescriptionReedbird Landfill DPW 701 Reedbird Ave 12SW0252 Sector L.3 – Landfills and Land
Application SitesBowley’s LaneSanitation Yard
DPW 6101 Bowleys Lane 12SW0254 Sector L – Landfills and LandApplication Sites
Quarantine RoadMunicipal Landfill
DPW 6100 Quarantine Rd 12SW0257 Sector L – Landfills and LandApplication Sites
Baltimore City MS4 Annual Report
Reporting Period: July 1, 2016 to June 30, 2017 Page 25
Facility Name Agency Address State SIC DescriptionNorthwestTransfer Station
DPW 5030 ReisterstownRoad
12SW1307 Sector L – Landfills and LandApplication Sites
Quarantine RoadLandfill
DPW 5701 Quarantine Rd 12NE0684 Sector L – Landfills and LandApplication Sites
NortheasternSubstation
DGS 4325 York Rd 12SW0702 Sector P – Land Transportationand Warehousing
WesternSubstation
DGS 239 N Calverton Rd 12SW0703 Sector P – Land Transportationand Warehousing
MiddletownFueling Station
DGS 410 Front St 12SW0704 Sector P – Land Transportationand Warehousing
NorthwesternSubstation
DGS 4410 Lewin Ave 12SW0705 Sector P – Land Transportationand Warehousing
FallswaySubstation
DGS 201 Fallsway 12SW0707 Sector P – Land Transportationand Warehousing
Mechanic Shop DGS 6400 Pulaski Hwy 12SW0708 Sector P – Land Transportationand Warehousing
Central Garage DGS 3800 E Biddle St 12SW2123 Sector P – Land Transportationand Warehousing
Patapsco WWTP DPW 3501 Asiatic Ave 12SW0629 Sector T – Treatment Works
Back River WWTP DPW 8201 Eastern Avenue 12SW0630 Sector T – Treatment Works
5.4 Property Management and Maintenance
5.4.1 Street Sweeping and Trash Reduction
5.4.1.1 Street Sweeping OperationsIn FY 2017, the mechanical street sweepers operated by DPW Bureau of Solid Waste removed 11,902tons of debris while sweeping 110,593 miles of street surface. This is a decrease in both tonnage andmileage, however the tonnage per mile decreased by 1 percent indicating a decrease in material loadingto the streets, potentially due to the other trash reduction strategies described in the following sections.Street sweeping tonnage and mileage is listed by frequency and 8 digit watershed in the MS4geodatabase (Appendix C). The efficiency of the street sweeping operations, specifically in theexpanded areas, is still hindered by the coordination of parked vehicles. New parking sign installationbegan in the summer of 2017. Evaluation of the impacts of the signs, and subsequent parkingenforcement, will be included in the FY 2018 MS4 Annual Report.
5.4.1.2 Municipal Trash Can ProgramThe City launched a city wide Municipal Trash Can program, with nearly 171,000 cans distributed tohouseholds beginning in March 2016 and ending in FY 2017. The purpose of the program was to providean incentive to residents to improve water management and prevent litter. Preliminary data showed anincrease in municipal waste collections, while recycling remained the same. Anecdotally, areareconnaissance showed an improvement of alley cleanliness. Further evaluation will be included in the
Baltimore City MS4 Annual Report
Reporting Period: July 1, 2016 to June 30, 2017 Page 26
FY 2018 Annual Report. A description of the education and outreach are discussed in Section 5.5.6 ofthis report.
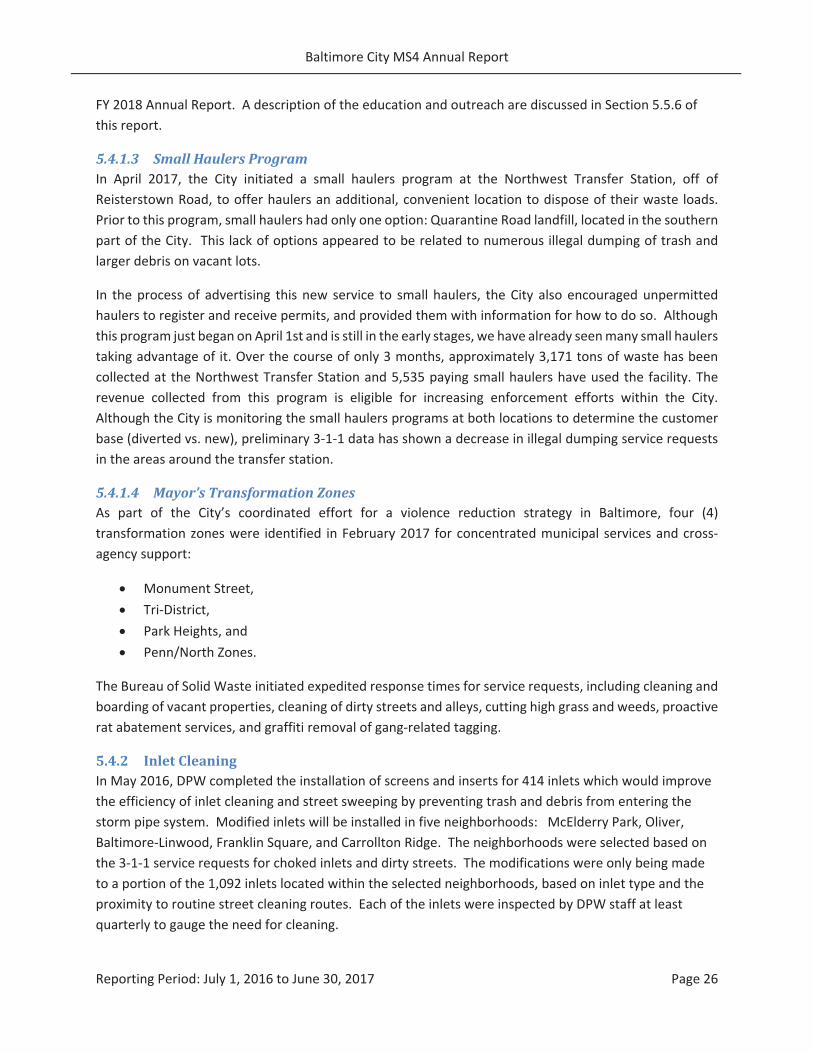
5.4.1.3 Small Haulers ProgramIn April 2017, the City initiated a small haulers program at the Northwest Transfer Station, off ofReisterstown Road, to offer haulers an additional, convenient location to dispose of their waste loads.Prior to this program, small haulers had only one option: Quarantine Road landfill, located in the southernpart of the City. This lack of options appeared to be related to numerous illegal dumping of trash andlarger debris on vacant lots.
In the process of advertising this new service to small haulers, the City also encouraged unpermittedhaulers to register and receive permits, and provided them with information for how to do so. Althoughthis program just began on April 1st and is still in the early stages, we have already seenmany small haulerstaking advantage of it. Over the course of only 3 months, approximately 3,171 tons of waste has beencollected at the Northwest Transfer Station and 5,535 paying small haulers have used the facility. Therevenue collected from this program is eligible for increasing enforcement efforts within the City.Although the City is monitoring the small haulers programs at both locations to determine the customerbase (diverted vs. new), preliminary 3 1 1 data has shown a decrease in illegal dumping service requestsin the areas around the transfer station.
5.4.1.4 Mayor’s Transformation ZonesAs part of the City’s coordinated effort for a violence reduction strategy in Baltimore, four (4)transformation zones were identified in February 2017 for concentrated municipal services and crossagency support:
Monument Street,Tri District,Park Heights, andPenn/North Zones.
The Bureau of Solid Waste initiated expedited response times for service requests, including cleaning andboarding of vacant properties, cleaning of dirty streets and alleys, cutting high grass and weeds, proactiverat abatement services, and graffiti removal of gang related tagging.
5.4.2 Inlet CleaningIn May 2016, DPW completed the installation of screens and inserts for 414 inlets which would improvethe efficiency of inlet cleaning and street sweeping by preventing trash and debris from entering thestorm pipe system. Modified inlets will be installed in five neighborhoods: McElderry Park, Oliver,Baltimore Linwood, Franklin Square, and Carrollton Ridge. The neighborhoods were selected based onthe 3 1 1 service requests for choked inlets and dirty streets. The modifications were only being madeto a portion of the 1,092 inlets located within the selected neighborhoods, based on inlet type and theproximity to routine street cleaning routes. Each of the inlets were inspected by DPW staff at leastquarterly to gauge the need for cleaning.
Baltimore City MS4 Annual Report
Reporting Period: July 1, 2016 to June 30, 2017 Page 27
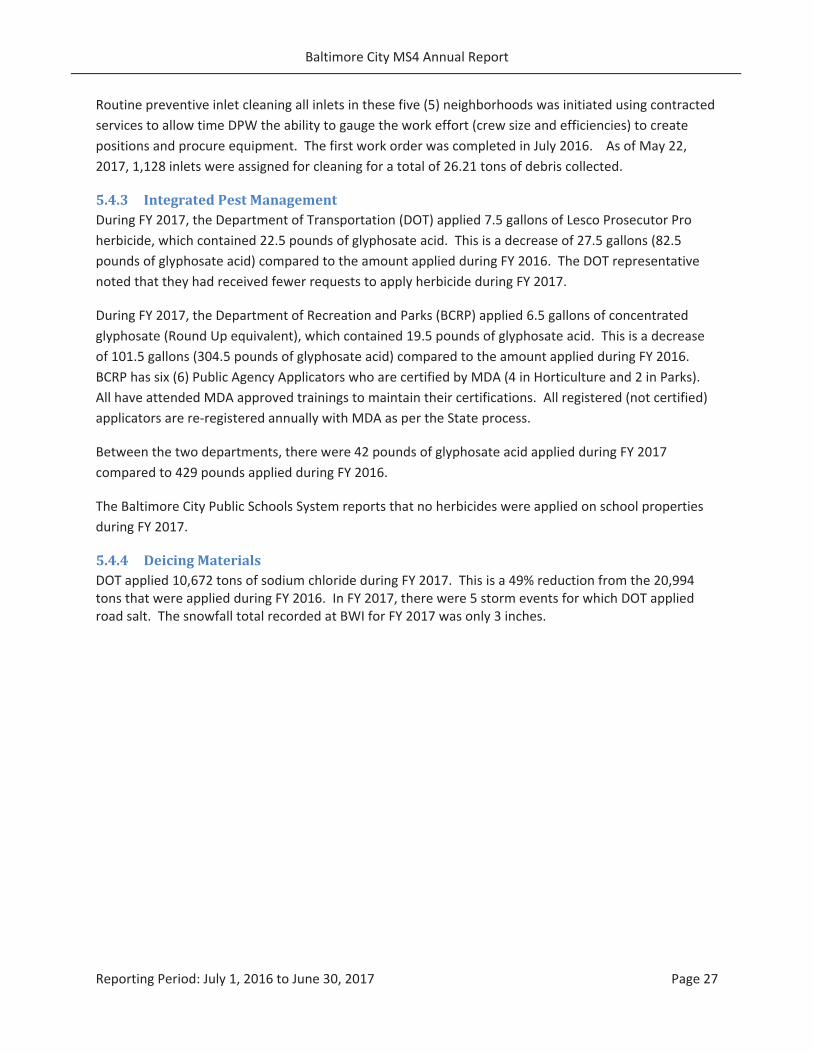
Routine preventive inlet cleaning all inlets in these five (5) neighborhoods was initiated using contractedservices to allow time DPW the ability to gauge the work effort (crew size and efficiencies) to createpositions and procure equipment. The first work order was completed in July 2016. As of May 22,2017, 1,128 inlets were assigned for cleaning for a total of 26.21 tons of debris collected.
5.4.3 Integrated Pest ManagementDuring FY 2017, the Department of Transportation (DOT) applied 7.5 gallons of Lesco Prosecutor Proherbicide, which contained 22.5 pounds of glyphosate acid. This is a decrease of 27.5 gallons (82.5pounds of glyphosate acid) compared to the amount applied during FY 2016. The DOT representativenoted that they had received fewer requests to apply herbicide during FY 2017.
During FY 2017, the Department of Recreation and Parks (BCRP) applied 6.5 gallons of concentratedglyphosate (Round Up equivalent), which contained 19.5 pounds of glyphosate acid. This is a decreaseof 101.5 gallons (304.5 pounds of glyphosate acid) compared to the amount applied during FY 2016.BCRP has six (6) Public Agency Applicators who are certified by MDA (4 in Horticulture and 2 in Parks).All have attended MDA approved trainings to maintain their certifications. All registered (not certified)applicators are re registered annually with MDA as per the State process.
Between the two departments, there were 42 pounds of glyphosate acid applied during FY 2017compared to 429 pounds applied during FY 2016.
The Baltimore City Public Schools System reports that no herbicides were applied on school propertiesduring FY 2017.
5.4.4 Deicing MaterialsDOT applied 10,672 tons of sodium chloride during FY 2017. This is a 49% reduction from the 20,994tons that were applied during FY 2016. In FY 2017, there were 5 storm events for which DOT appliedroad salt. The snowfall total recorded at BWI for FY 2017 was only 3 inches.
Baltimore City MS4 Annual Report
Reporting Period: July 1, 2016 to June 30, 2017 Page 28
5.5 Public Education and Outreach
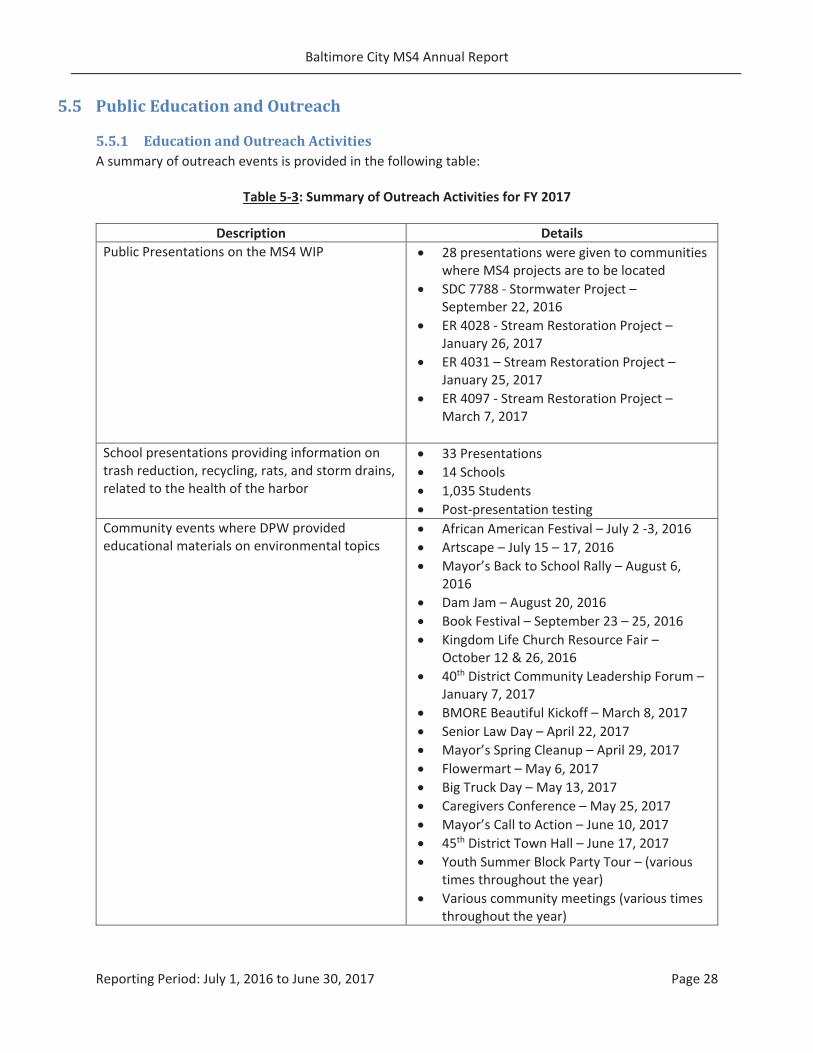
5.5.1 Education and Outreach ActivitiesA summary of outreach events is provided in the following table:
Table 5 3: Summary of Outreach Activities for FY 2017
Description DetailsPublic Presentations on the MS4 WIP 28 presentations were given to communities
where MS4 projects are to be locatedSDC 7788 Stormwater Project –September 22, 2016ER 4028 Stream Restoration Project –January 26, 2017ER 4031 – Stream Restoration Project –January 25, 2017ER 4097 Stream Restoration Project –March 7, 2017
School presentations providing information ontrash reduction, recycling, rats, and storm drains,related to the health of the harbor
33 Presentations14 Schools1,035 StudentsPost presentation testing
Community events where DPW providededucational materials on environmental topics
African American Festival – July 2 3, 2016Artscape – July 15 – 17, 2016Mayor’s Back to School Rally – August 6,2016Dam Jam – August 20, 2016Book Festival – September 23 – 25, 2016Kingdom Life Church Resource Fair –October 12 & 26, 201640th District Community Leadership Forum –January 7, 2017BMORE Beautiful Kickoff – March 8, 2017Senior Law Day – April 22, 2017Mayor’s Spring Cleanup – April 29, 2017Flowermart – May 6, 2017Big Truck Day – May 13, 2017Caregivers Conference – May 25, 2017Mayor’s Call to Action – June 10, 201745th District Town Hall – June 17, 2017Youth Summer Block Party Tour – (varioustimes throughout the year)Various community meetings (various timesthroughout the year)
Baltimore City MS4 Annual Report
Reporting Period: July 1, 2016 to June 30, 2017 Page 29
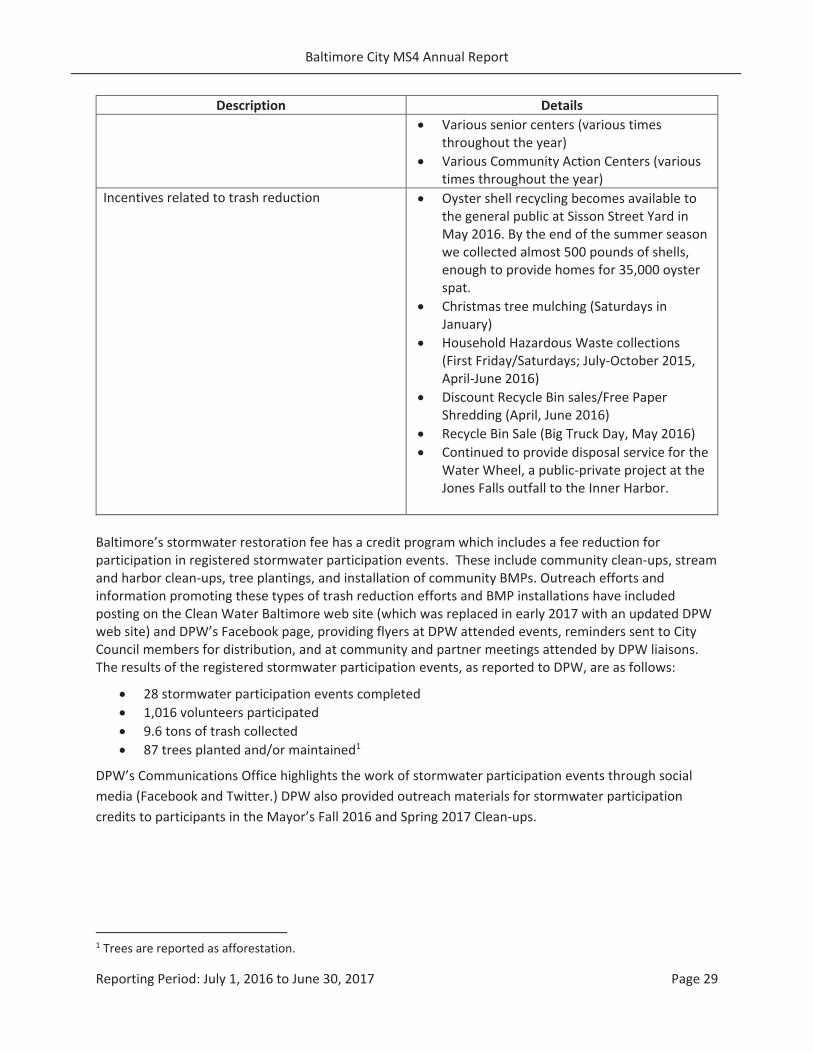
Description DetailsVarious senior centers (various timesthroughout the year)Various Community Action Centers (varioustimes throughout the year)
Incentives related to trash reduction Oyster shell recycling becomes available tothe general public at Sisson Street Yard inMay 2016. By the end of the summer seasonwe collected almost 500 pounds of shells,enough to provide homes for 35,000 oysterspat.Christmas tree mulching (Saturdays inJanuary)Household Hazardous Waste collections(First Friday/Saturdays; July October 2015,April June 2016)Discount Recycle Bin sales/Free PaperShredding (April, June 2016)Recycle Bin Sale (Big Truck Day, May 2016)Continued to provide disposal service for theWater Wheel, a public private project at theJones Falls outfall to the Inner Harbor.
Baltimore’s stormwater restoration fee has a credit program which includes a fee reduction forparticipation in registered stormwater participation events. These include community clean ups, streamand harbor clean ups, tree plantings, and installation of community BMPs. Outreach efforts andinformation promoting these types of trash reduction efforts and BMP installations have includedposting on the Clean Water Baltimore web site (which was replaced in early 2017 with an updated DPWweb site) and DPW’s Facebook page, providing flyers at DPW attended events, reminders sent to CityCouncil members for distribution, and at community and partner meetings attended by DPW liaisons.The results of the registered stormwater participation events, as reported to DPW, are as follows:
28 stormwater participation events completed1,016 volunteers participated9.6 tons of trash collected87 trees planted and/or maintained1
DPW’s Communications Office highlights the work of stormwater participation events through socialmedia (Facebook and Twitter.) DPW also provided outreach materials for stormwater participationcredits to participants in the Mayor’s Fall 2016 and Spring 2017 Clean ups.
1 Trees are reported as afforestation.
Baltimore City MS4 Annual Report
Reporting Period: July 1, 2016 to June 30, 2017 Page 30
5.5.2 Growing Green Design CompetitionIn 2015 the “Baltimore City Growing Green Design Competition: Vacant Lots Transformed” awardedfunding to six projects for the design and implementation of innovative concepts for retrofitting vacantlots, creating community spaces, and reducing and treating stormwater. The competition was anopportunity to pilot the Green Pattern Book and test community based stormwater managementprojects. In FY17 the Chesapeake Bay Trust, in partnership with DPW and the Office of Sustainability,contracted Tetra Tech to create signage for each of the award winning sites. The signage will be installedin the Fall of 2017.
5.5.3 Stormwater Advisory CommitteeIn 2014, DPW established the Stormwater Advisory Committee (SWAC) to be advisory to the Director ofthe Department. Applications for membership were accepted and members were chosen to representspecified stakeholder groups including nonprofit organizations, business and development groups,religious groups, citizen groups, and others. Certain City agency representatives served as ex officiomembers. This group worked for two years on stormwater related issues and provided valuable input.One of the notable accomplishments of the committee was the creation of revised stormwaterremediation fee regulations.
The SWAC was discontinued in early 2017 in order to transition into the newly established StormwaterRemediation Fee Oversight Committee, which was established by City Council Resolution 17 0014R. ThisCommittee reports to the Judiciary and Legislative Investigations Committee of the City Council. Similarto the SWAC, its members include representatives from various stakeholder groups and City agencyrepresentatives serve as ex officio members. This Committee is charged with the review, assessmentand communication of various items related to the stormwater remediation fee, stormwater fund, andstormwater projects. The Committee plans to periodically review documents such as the MS4 Annualreport, the Financial Assurance Plan, quarterly reports, and other items. It will also assist withcommunicating this information to the public and to stakeholders. DPW has been working with the Chairof the Judiciary and Legislative Investigations Committee to organize this committee and will beparticipating in its meetings, the first of which is scheduled for August 2017.
5.5.4 Workforce Development Programs
5.5.4.1 Baltimore City Water Industry Career Mentoring ProgramIn January 2015, DPW and the Mayor’s Office of Employment Development, together with theChesapeake Water Environment Association (CWEA), launched the Baltimore City Water Industry CareerMentoring Program. The program had two goals: (1) educating local young adults about the waterindustry and its career opportunities; and (2) developing a pipeline of future workers with the right skillsto fill entry level positions in the field. The mentoring program targeted City residents between the agesof 18 and 24 who had their high school diploma or GED, but were unemployed or underemployed, andnot engaged in post secondary education or job training. DPW continued this effort for a third year with15 of the program participants hired by DPW or private employer. In November 2017, the program wasre branded as Y H20—the Youth Water Mentoring Program, which will serve as a national model forother cities.
Baltimore City MS4 Annual Report
Reporting Period: July 1, 2016 to June 30, 2017 Page 31
5.5.4.2 National Green Infrastructure Certification Program (NGICP)DPW coordinated with the Water Environment Federation and 14 partner organizations to develop theNational Green Infrastructure Certification Program (NGICP). The purpose of the NGICP was to setnational certification standards for green infrastructure construction, inspection, and maintenanceworkers. Designed to meet international best practice standards, the certification advances theestablishment of sustainable communities by promoting green infrastructure as an environmentally andeconomically beneficial stormwater management option, supporting the development of proficientgreen workforces, and establishing a career path for skilled green infrastructure workers. Baltimoreparticipated on both the technical advisory group and strategic advisory group, in addition to activelydeveloping both the training curriculum and exam questions. In FY 2017, Baltimore hosted two trainingsessions and exams for the region.
5.5.5 GROW CenterBaltimore City generates a great deal of waste from trees and limbs that have been cut and removedfrom our parks and streets, as well as waste from demolished houses and renovated roadways.Currently, this material is either stored at Camp Smallwood (tree debris) or taken to landfills (buildingdebris). As a means for repurposing this waste for greening and stormwater management projects, theCity is exploring the creation of “GROW Centers”. GROW stands for Green Resources and Outreach forWatersheds, and will be a place that links existing community greening networks to a much neededsource of free/low cost materials and technical expertise for stormwater management installation andvacant lot revitalization. The GROW Centers would provide the following services:
Materials for purchase. Mulch, bricks, crushed concrete, wood products, salvaged buildingmaterials and other quality controlled materials that would be free and/or available forpurchase by city residents and non profits to use in micro practice installation such as raingardens, community gardens, and permeable paths and walkways. Trees, plants and qualitycontrolled materials like bio soils will also be available in manageable volumes.
Education and training. Experts will provide advice and guidance on green infrastructureprojects, including hands on training sessions, workshops, and educational classes on design,the proper use of the materials, securing funds and resources, and maintenance.
In March 2017, DPW received a $100,000 grant from the US Forest Service (USFS), which will be used to1) prepare a feasibility study and business plan for GROW Centers, and (2) test and refine the deliverymodel of GROW Centers through a second round of “pop up” GROW Center events in the community.DPW was also selected by the Shriver Center at the University of Maryland, Baltimore County to receivea Peaceworker Fellow. The Fellow will be providing assistance in the development of the GROW Centers.
5.5.6 Baltimore Green Registry: Mapping of SWM BMPs Phase 2In July 2016, DPW awarded $26,386 to the Baltimore Neighborhoods Indicators Alliance (BNIA) forPhase 2 of the Baltimore Green Registry: Mapping of Stormwater Management BMPs. The goal of Phase2 was to create an interactive resource tool for urban water quality and community based efforts onimproving water quality for timely monitoring, research and more coordinated activities, whilestrengthening the relationship between improving urban waters and community revitalization. In
Baltimore City MS4 Annual Report
Reporting Period: July 1, 2016 to June 30, 2017 Page 32
addition to the upgraded restoration BMP data from this Annual Report (including ESD locations foundinfeasible for construction), Phase 2 will include the ability for user based / crowd sourced dataacquisition and editing. Concurrently with this effort, the mapping tool was upgraded to includemapping urban forest patches and street trees, an effort funded by the US Forest Service.
5.5.7 Clean Drain Campaign
On March 16, 2017, DPW launched the Clean Drain Campaign, in coordination Ridges to Reefs, InterfaithPartners for the Chesapeake, and Lori A. Lilly Environmental Solutions. The Clean Drain Campaign was aone month campaign to raise the awareness of Baltimore residents about proper disposal practices forcooking fats, oils, and grease (FOG); wet wipes; and other household waste, while raising funds for alocal food pantries. A total of 713 City residents pledged to put FOG in the trash and keep wipes out oftoilets, triggering cash donations to their selected local food pantry. Money for the donations came fromthe Chesapeake Bay Trust and Walmart; food donations were from MOM’s Organic Market. Educationalmaterials developed and tested for the initiative have been retained on DPW’s website.
5.5.8 Flood ALERT System upgradeDuring FY 2017, DPW upgraded its Flood ALERT (Automated Local Evaluation in Real Time) system andprovided training to City staff. The features of the upgraded system allow real time monitoring (tabularand chart formats) of the City’s flood ALERT rain and stream gauges, in addition to nearby USGSgauges. In FY 2018, DPW, the Department of Planning, and the Mayor’s Office of EmergencyManagement will establish thresholds for alerts / notifications for gauges along the Jones Falls and itstributaries, which are prone to flooding and property damage.
5.5.9 Effectiveness of Education Program for Trash and LitterPublic education and outreach is an essential strategy to achieve the long term, sustained prevention oftrash entering our streams and waterways. Whereas DPW is the responsible party for implementing andproviding solid waste services, public education and outreach requires partnerships to be effective.Partnerships involve voluntarily actions and/or cooperation by State, federal, private, non profits, andcommunity groups and residents, and can be both structural and non structural practices.
5.5.9.1 Municipal Can ProgramAs described in Section 5.4.1, the City completed the roll out of the Municipal Trash Can program in July2017. During the distribution period, DPW provided extensive education and outreach to help residentsunderstand the program, how to properly manage their waste, and the benefits of the cans for reducinglitter and rats. Outreach consisted of mailers, flyers (in English and Spanish), community meetings, socialmedia and press coverage, and an FAQ section on the DPW website. In a Baltimore Sun article fromJanuary 18, 2017, residents note that they are seeing less trash, and rats, after the cans were delivered.Also, the Municipal Trash Can Program was named “2017 Project of the Year” by the American PublicWorks Association (APWA) Mid Atlantic Chapter.
Baltimore City MS4 Annual Report
Reporting Period: July 1, 2016 to June 30, 2017 Page 33
5.5.9.2 B’More BeautifulBMORE Beautiful is a City led peer to peer beautification program that launched April 2017 inconjunction with the Mayor’s Spring Cleanup. BMORE Beautiful is an enhanced version of Clean Corps,which encouraged residents to engage in activities to reduce trash and litter in their communities. Thenewly enhanced program expands on trash reduction by working with residents to improve the overallaesthetic of their neighborhood.
BMORE Beautiful is intended to be a citywide initiative; however for one year it will be piloted in 23neighborhoods. The participating neighborhoods are:
4x4Belair EdisonCARECarrollton RidgeCharles VillageCurtis BayGlen OaksGreektownHampdenHighlandtownMcElderry ParkMondawmin
MosherOliverPark HeightsParklanePatterson ParkPenn NorthPigtownRosemontSandtown WinchesterWaverlyBoChK
During the pilot year, the City will engage residents in these neighborhoods to make a BMORE Beautifulpledge. In exchange for the signed pledge, participants will receive a BMORE Beautiful Kit that includesa trash grabber, reusable bag, durable gloves, safety vest, and information about city services &resources.
Each participating neighborhood has a trained Block Captain. During the reconstruction of the program,the Block Captains were invited to participate in a series of focus groups that aimed to develop abeautification program that (1) address the needs of the residents, (2) identify resources needed tosupport residents in their efforts (3) improve communication between residents and the city. Thesecommunity leaders are trained to follow the ROLE model. Under the ROLE model captains areresponsible for:
Recruiting neighbors to sign the pledge and participate in BMORE Beautiful.Organizing ongoing beautification and cleaning activities;Leading others to change their negative behaviors regarding neighborhood cleanliness; andEducating neighbors on how to comply with City Code requirements, and how they can makesimple changes to keep the neighborhood beautiful.
Block Captains are eligible to apply small grants that will help piloted neighborhoods achieve theirbeautification goals. City officials will measure the pilot’s success by gathering community perception
Baltimore City MS4 Annual Report
Reporting Period: July 1, 2016 to June 30, 2017 Page 35
surveys, collecting before and after photographs to demonstrate change, cleanliness score cards, andanalyzing 311 data.
Since the launch, BMORE Beautiful has achieved the following:1 Neighborhood Block Captain Training19 Baseline Community Surveys10 Community Cleanups3 Beautification Projects
5.5.9.3 Anti Litter Campaign ResearchIn FY 2017, Trash Free Maryland published a report entitled “Litter Behavior in Baltimore City: AFormative Focus Group Study”. The study was conducted by Opinion Works to explore behaviors andattitudes related to littering among City residents and Port employees, with the goal of helping toinform a public outreach campaign that will motivate targeted audiences to pick up litter when they seeit. In FY2016, DPW worked with federal, state, and local NGOs to secure funding for the focus groupstudy.
“Recovery”, whether of individuals, neighborhoods, or the City, was a reoccurring theme of theneighborhood focus groups. Based on these results, Trash Free Maryland will be targeting messagingand education to recovery centers and methadone clinics in FY 2018. For the Port focus group, the senseof pride in work place was strong. In FY 2017, one of the Port lease holders is testing a text message app,logos, workplace ambassadors, and operational changes to reduce litter. DPW will be working withTrash Free Maryland and other partners to continue testing the results of the focus groups and theapplicability City wide.
5.5.9.4 Mayor’s Fall and Spring Clean ups / Community Pitch insThe Mayor’s Spring and Fall Clean ups are opportunities for residents to organize community clean upsand beautification projects. The purpose of the clean ups is to collect litter and trash. DPW providesbags to residents, coordinates dumpsters, and picks up the trash from each location. In FY17:
460 communities participated8,430 residents volunteered424.04 tons of trash was collected
DPW also coordinates the Community Pitch in program, which provides up to 4 dumpsters/year tocommunity groups. In FY17, 616 requests were made for dumpsters, with 1,850.5 tons of debriscollected. These events focus on larger debris collection, like old furniture and other material that islikely to be dumped.
Baltimore City MS4 Annual Report
Reporting Period: July 1, 2016 to June 30, 2017 Page 36
6 Water Quality Improvements
6.1 MS4 Restoration and TMDLWatershed Implementation Plan (WIP)The City submitted its WIP to MDE on December 22, 2014. The public comment period associated withthe WIP ended on January 30, 3015, due to a request to extend the public comment period inconsideration of the holiday season. The City received over 200 comments during the public commentperiod; the comments and the City's response were summarized in a Comment Response Document.
Comments were received from MDE on March 23, 2015. A revised calculation of the baselineimpervious area, with supporting GIS files and responses to the specific MDE comments, was submittedto MDE on June 30, 2015. MDE approved the baseline impervious area and 20% restoration goal of4,291 acres on July 28, 2015. The WIP was revised based on public and MDE comments. Both therevised WIP and Comment Response Document were submitted to MDE on August 24, 2015 and postedon the Cleanwater Baltimore website. The proposed restoration plans cited in Section 6 of this AnnualReport refer to the revised WIP and MDE approved baseline impervious area.
6.2 Milestone ScheduleThe WIP included programmatic and project milestones as part of an accountability framework forrestoring the Chesapeake Bay. The proposed milestone schedule and status as of June 30, 2017, relatedto the Chesapeake Bay TMDL, are included in Appendix J.
6.3 Implementation of Projects, Programs, and Partnerships
6.3.1 Project Implementation and TrackingThe progress status of the projects listed in the WIP is provided in Appendix K of this Annual Report,specifically Table K 1. The original plan scope, cost and schedule are shown in addition to the currentprojections. Most of the projects continued through the design phase during Fiscal Year 2017; 2initiated the construction phase and 3 were completed. The current projections are based on theprogress of the design at the time of this report. Each of the current proposed projects, with specificlocations, is included in the restoration BMPs tables of the georeference database in Appendix C.
Several of the ESD projects listed in Table M 1 include multiple locations. During FY 2016 and 2017, DPWvisited approximately 507 potential projects for these project types. All of the locations were in theright of way or on public property, typically under the control of government agency outside of DPW.Only 353 of the locations were approved by the local government agencies. Usually, the reason for thedisapproval was a conflict with the proposed use of the space to serve the public needs (such as aconflict with a proposed active recreation field). Of the remaining locations, only 235 were found to befeasible, with utility conflicts being the most prevalent conflict for constructability. Finally, only 52locations were able to treat more than 0.3 acre of impervious area per facility, relating to cost benefitefficiency for both construction and maintenance. This ratio of feasibility compared (10%) is consistentwith the experience that DPW encountered with the Watershed 263 project in 2009 and echoes thechallenges and practicality of installation of ESD practices in an urban environment. All of the visited
Baltimore City MS4 Annual Report
Reporting Period: July 1, 2016 to June 30, 2017 Page 37
locations, included the results of the feasibility evaluation, will be included in the Baltimore GreenRegistry mapping tool, described in in Section 5.5.4 of this report.
A total of thirty one (31) projects were removed or postponed from the list based on the feasibility ofthe project completion by the end of this permit period. The specific reasons for removal orpostponement are included the “Notes” section of the table. Postponed projects are scheduled forcompletion for the next MS4 permit.
MDE has noted that the City has used conservative nutrient reduction efficiencies for the projects andhas suggested using a higher efficiency similar to Stormwater to the MEP, as listed in the MAST program.However, the City will continue to use an efficiency assigned to “Micro bioretention (C/ D soils)” aslisted in the supporting documents for the on line Maryland Assessment Scenario Tool (MAST).
6.3.2 Program Implementation andThe progress status of the programs listed in the WIP is provided in Appendix K of this Annual Report,specifically Table K 2. Street sweeping operations decreased in FY 2017; however the ton / mile ratioappears to have increased, possibly indicating the effect of the municipal trash can program andcorresponding outreach and education. Current program implementation and correspondinggeoreference database records are reported as based on frequency and geographic distribution of theoperation (weight and tonnage by watershed) in the georeference database in Appendix K.
In the past, inlet cleaning was reported based on complaint response, not necessarily meeting thecriteria of quarterly cleaning. In May 2016, the City initiated a routine inspection and pro activecleaning program for the 5 neighborhoods where inlet modifications were installed. In June 2016, theCity also initiated pro active cleaning of inlets along interstate highway I 83 and I 295. The expendituresfor inlet cleaning listed in Table 4 1 include both the complaint driven and pro active cleaning. Only theresults of this routine inlet cleaning program for the 5 neighborhoods are included in Table K 2.
Although the City’s IDDE program identified and abated many illicit discharges, only the disconnectionsof illicit connections are listed in Table K 1. These connections were confirmed as existing prior to 2010.The equivalent impervious area restoration was calculated using the same calculation for septic systemconnections to a WWTP, as listed in the “Accounting for Stormwater Wasteload Allocations andImpervious Area Treated” guidance document by MDE, dated August 2014. The City plans to work withMDE to revise this credit for direct sanitary discharges to the storm system since this type of dischargewould have a higher, direct pollutant loading than a septic system discharging through groundwatermigration. The nutrient reductions for IDDE are based on the “Recommendations of the Expert Panel toDefine Removal Rates for the Elimination for Discovered Nutrient Discharges from Grey Infrastructure”,dated November 10, 2014. The calculations are included in Appendix I of this report. Furthermore, theCity initiated collaboration with Baltimore County to quantify the impervious area restoration credit forother illicit discharges; the results of the collaboration will be submitted separately to MDE for approvaland will be considered in future Annual Reports.
Baltimore City MS4 Annual Report
Reporting Period: July 1, 2016 to June 30, 2017 Page 38
6.3.3 Partnership Implementation and TrackingThe progress status of the partnerships listed in the WIP is provided in Appendix K of this Annual Report,specifically Table K 3. The migration of the georeference database was the main focus of FY 2017efforts; all BMPs with approved plans and estimated status of “completed”, implemented to meetdevelopment requirements, were simply listed in the Table under development, using conservativepollutant removal efficiencies for pond and bioretention retrofits. The majority of these projects haveapproved as built documentation; some have been inspected but are pending approval of an alternativeas built process. The City continues better define these facilities by type and geography (watershed) aspart of the georeference database, included in Appendix C.
6.4 Impervious Area RestorationThe progress status of implementation of proposed projects, programs, and partnerships of the WIP isprovided in Appendix K. Since most of the projects are still in the design phase, the majority of theimpervious area restoration is provided by programs, specifically street sweeping. Although theproposed projects were reduced based on feasibility, about 385 acres of impervious restoration projectsare already in design or completed by the end of FY 2017. Based on the tables listed in the Appendix K,the current impervious acre restoration achieved within this permit period is estimated as 3,953 acres.This is equivalent to 92% of the current permit goal. The City is still on track for meeting the imperviousarea restoration goals by the end of the permit period.
6.5 Bay TMDL ComplianceThe current status of implementation of proposed projects, programs, and partnerships were input intothe Maryland Assessment Scenario Tool (MAST) to evaluate compliance with the Bay TMDL. The outputfrom this model included in Appendix L. An estimation of the pollutant removals using MDE’s GuidanceDocument is also provided in Appendix L. IDDE practices were not available in the current MAST.
6.6 Regional TMDL Compliance
6.6.1 Nutrients and SedimentAn estimation of the nutrient and sediment removals, based on the current implementation status,using MDE’s Guidance Document is provided in Appendix M. Currently, records for inlet cleaning arenot geographically referenced so the estimated reduction per watershed (regional TMDL comparison) isnot accurate. This accuracy will be improved pending modifications of the data collection for thisprogram. As street sweeping and inlet cleaning are continuous activities, the removal estimates forthese activities will be shown as a historic trend to account for any impacts due education, outreach, orenforcement.
IDDE efforts for sanitary direct connections were incorporated into the estimation for nutrient andsediment removal. In the WIP, the City proposed a re evaluation of the baseline load allocations forsediment based on a feasibility analysis. Coordination with MDE was initiated in FY 2016 and continuedin FY 2017.
Baltimore City MS4 Annual Report
Reporting Period: July 1, 2016 to June 30, 2017 Page 39
6.6.2 BacteriaThe results of the City’s routine stream sampling program of e.coli at monitoring stations in non tidalwaters are shown in Appendix E for the Jones Falls, Back River, and Gwynns Falls watersheds. There areno stream sampling stations in the Lower North Branch Patapsco watershed. A comparison of thehistoric monitoring results with the prescribed thresholds for frequent and infrequent full body contactrecreation is provided in Section 3.1 of this Annual Report.
The City is under a consent decree in Civil Action No. JFM 02 1524 for unpermitted discharges from thewastewater collection system. A modification to the consent decree was lodged on June 1, 2016 in theUnited States District Court for the District of Maryland by the U.S. Department of Justice, the U.S.Environmental Protection Agency, and the Maryland Department of the Environment. The modificationwas approved on October 6, 2017. The City plans to issue a revised bacteria TMDL implementation planfor public comment by June 2018, which will incorporate the schedule approved in this modifiedconsent decree.
The City has continued to make significant capital investments in rehabilitating the sanitary sewersystem. This capital investment, in combination with IDDE operations listed in Section 5.3 and publiceducation efforts, prevent bacteria loadings. Further information on these efforts is provided inquarterly Consent Decree reports, posted on the City’s website.
6.6.3 TrashOn January 5, 2015, EPA approved the report entitled “Total Maximum Daily Loads (TMDL) of Trash andDebris for the Middle Branch and Northwest Branch Portions of the Patapsco River Mesohaline TidalChesapeake Bay Segment, Baltimore City and County, Maryland”. In compliance with the MS4 permit,the City developed the “Baltimore City Trash TMDL Implementation Plan”, submitted to MDE on January4, 2016, to present strategies to meet the TMDL waste load allocations. In addition to the trashreduction efforts noted in the previous sections of this report, progress on the milestone schedule forthe trash TMDL is included in Appendix J of this report.
6.6.4 PCBThe MS4 WIP included a vague schedule for implementation to address PCB waste load allocations. TheCity has continued discussions with MDE to better define the allocations and methodologies forprogress assessments. Furthermore, the City has initiated collaboration with USGS and BaltimoreCounty on PCB monitoring. The City plans to issue a revised PCB TMDL implementation plan for publiccomment by June 2018, which will incorporate the results of these collaborations and discussions.

Appendix A: Organization Chart
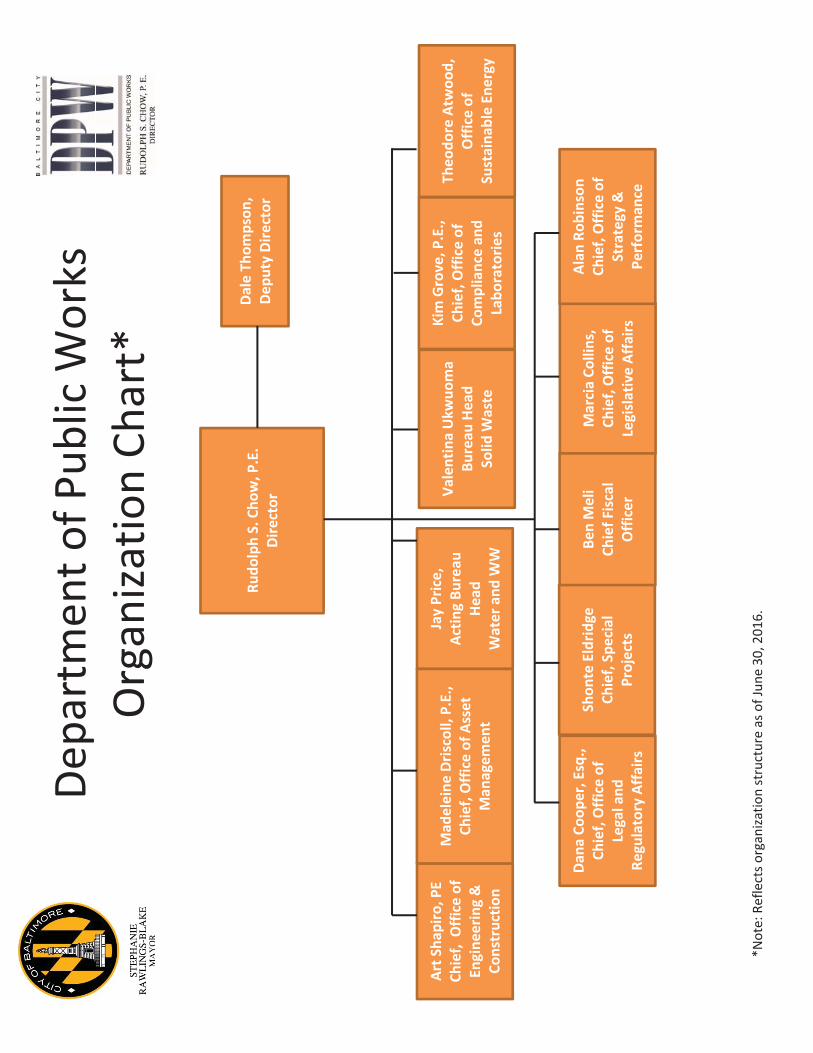
Departmen
tofP
ublic
Works
Organiza
tionCh
art*
*Note:Re
flectso
rganiza
tionstructureas
ofJune
30,201
6.
Rudo
lphS.Ch
ow,P
.E.
Director
Dana
Coop
er,Esq.,
Chief,Office
ofLegaland
Regulatory
Affairs
MarciaCo
llins,
Chief,Office
ofLegislativeAffairs
DaleTh
ompson
,De
puty
Director
JayPrice,
Actin
gBu
reau
Head
Water
andWW
Shon
teEldridge
Chief,Special
Projects
ValentinaUkw
uoma
Bureau
Head
Solid
Waste
ArtS
hapiro,PE
Chief,
Office
ofEn
gine
ering&
Constructio
n
BenMeli
ChiefFiscal
Officer
Alan
Robinson
Chief,Office
ofStrategy
&Pe
rforman
ce
Mad
eleine
Driscoll,P.E.,
Chief,Office
ofAsset
Man
agem
ent
Kim
Grove,P.E.,
Chief,Office
ofCo
mpliancean
dLabo
ratorie
s
Theo
dore
Atwoo
d,Office
ofSustaina
bleEn
ergy
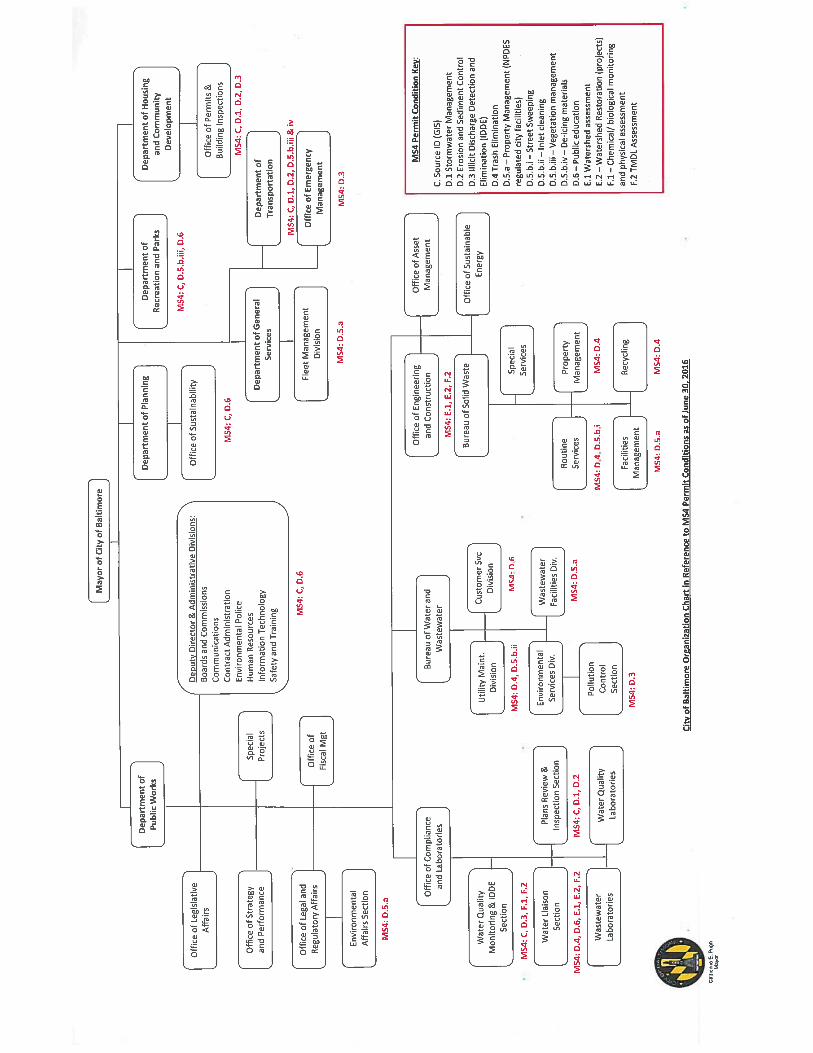
Appendix B: Summary Table of Null Values in the MS4 Geodatabase

Summaryof
NullV
alue
sUsedon
MDE
Geod
atab
ase
Table
Field
Value
Commen
tsSche
ma
EVEN
T_TIME
12:00
Not
recorded
infie
ldrepo
rt.
FIBI
999
FIBI
isno
tdon
e;itisno
treq
uiredforthisp
ermit.
XEM
BEDD
EDNESS
999
Not
recorded
infie
ldrepo
rt.
WAT
ER_TEM
P99
9Not
recorded
infie
ldrepo
rt.
pH99
9Not
recorded
infie
ldrepo
rt.
BOD_
dt99
9Not
recorded
infie
ldrepo
rt.
BOD_
EMC0
999
Not
recorded
infie
ldrepo
rt.
BOD_
EMC_
dt99
9Not
recorded
infie
ldrepo
rt.
TSS_dt
999
Not
recorded
infie
ldrepo
rt.
TSS_EM
C099
9Not
recorded
infie
ldrepo
rt.
TSS_EM
C_dt
999
Not
recorded
infie
ldrepo
rt.
TPH_
dt99
9TPHisno
tdon
eTPH_
EMC0
999
TPHisno
tdon
eTPH_
EMC_
dt99
9TPHisno
tdon
eIM
P_AC
RES
999
Data
notsho
wnon
asbu
iltplans
APPR
_DAT
E1/1/19
00Da
tano
tsho
wnon
asbu
iltplans
BUILT_DA
TE1/1/19
00Da
tano
tsho
wnon
asbu
iltplans
XIM
P_AC
RES
999
Forp
rojectsn
otconstructed
BUILT_DA
TE1/1/19
00Forp
rojectsn
otconstructed
PE_A
DR99
9Forp
rojectsn
otconstructed
PROJECT
ED_IMPL_YR
9999
Forp
rojectsn
otconstructed
IMPL_C
OST
999
Missingdata
ordata
was
notrecorde
dBM
P_DR
AIN_A
REA
999
Data
notsho
wnon
asbu
iltplans
BUILT_DA
TE1/1/19
00Da
tano
tsho
wnon
asbu
iltplans
AltBMPP
oly
IMPL_C
OST
999
Missingdata
ordata
was
notrecorde
dAltBMPLine
MAX
_DUR_
CRED
I T99
9Willbe
provided
inFY
2017
DIM_O
UTFALL
999
Missingdata
HT_O
UTFALL
999
Missingdata
WT_OUTFALL
999
Missingdata
BMP_
Inspectio
nsRE
INSP_D
ATE
1/1/19
00Forfacilitie
swhich
have
been
removed
XLAST_R
AIN
1/1/19
00Da
tawas
notrecorde
dat
samplingtim
eSCRE
EN_TIM
E12
00Da
tawas
notrecorde
dat
samplingtim
eWAT
ER_TEM
P99
9Da
tawas
notrecorde
dat
samplingtim
eAIR_
TEMP
999
Data
was
notrecorde
dat
samplingtim
eALGA
EGRO
WN
Data
was
notrecorde
dat
samplingtim
eODO
RSE
Data
was
notrecorde
dat
samplingtim
eDE
POSITS
NDa
tawas
notrecorde
dat
samplingtim
eVE
G_CO
ND
NDa
tawas
notrecorde
dat
samplingtim
eSTRU
CT_C
OND
NDa
tawas
notrecorde
dat
samplingtim
eER
OSION
NDa
tawas
notrecorde
dat
samplingtim
eNarrativ
eFile
MDE
_STA
TION_ID
999Do
cumen
tisn
otassociated
with
amon
itorin
gsite.
X
Note:Sche
maindicatesM
DEplanstochange
thefie
ldto
optio
nalinne
xtgene
ratio
nof
database.
IDDE
BiologicalMon
itorin
g
Chem
icalMon
itorin
g
BMPP
OI
RestBM
P
BMP
Outfall
BaltimoreCity
FY20
17An
nualRe
port
Page
1of
1
Appendix C: Source Information using MS4 Geodatabase(electronic files only)
Appending D: Ammonia Screening and Stream Impact Sampling Results(electronic files only)

Appendix E: Bacteria Monitoring Histographs
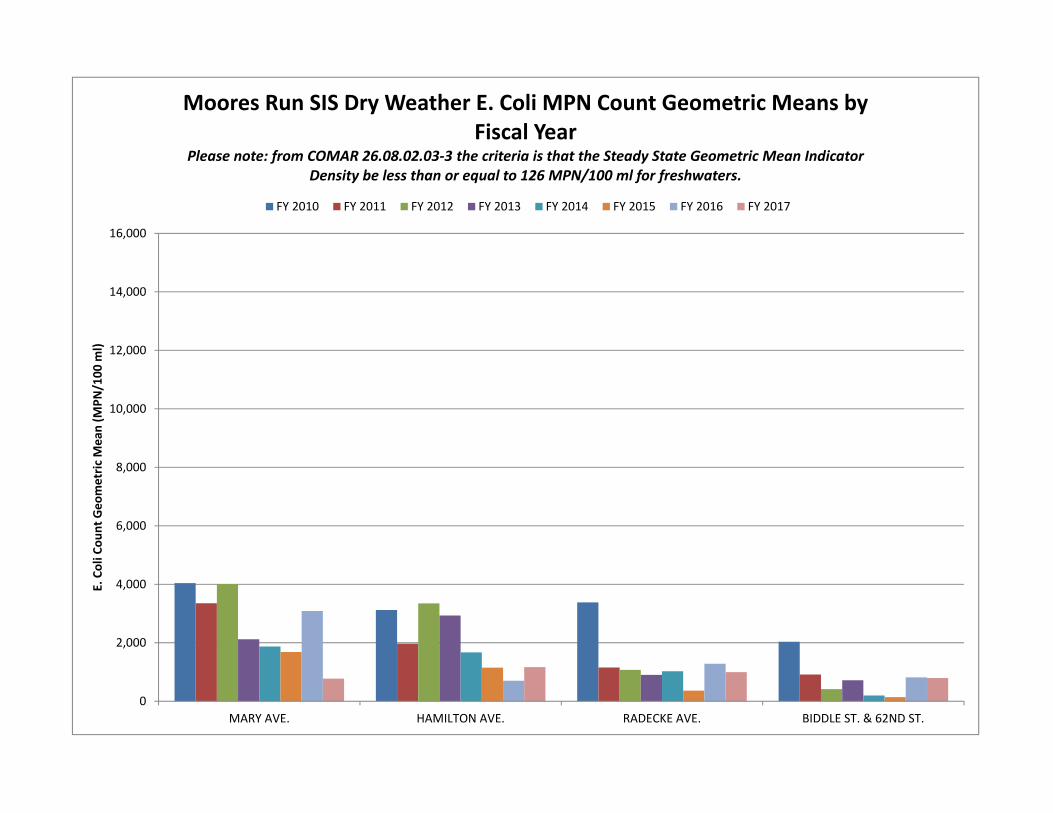
0
2,000
4,000
6,000
8,000
10,000
12,000
14,000
16,000
MARY AVE. HAMILTON AVE. RADECKE AVE. BIDDLE ST. & 62ND ST.
E. Coli C
ount Geo
metric
Mea
n (M
PN/100
ml)
Moores Run SIS Dry Weather E. Coli MPN Count Geometric Means by Fiscal Year
Please note: from COMAR 26.08.02.03‐3 the criteria is that the Steady State Geometric Mean Indicator Density be less than or equal to 126 MPN/100 ml for freshwaters.
FY 2010 FY 2011 FY 2012 FY 2013 FY 2014 FY 2015 FY 2016 FY 2017
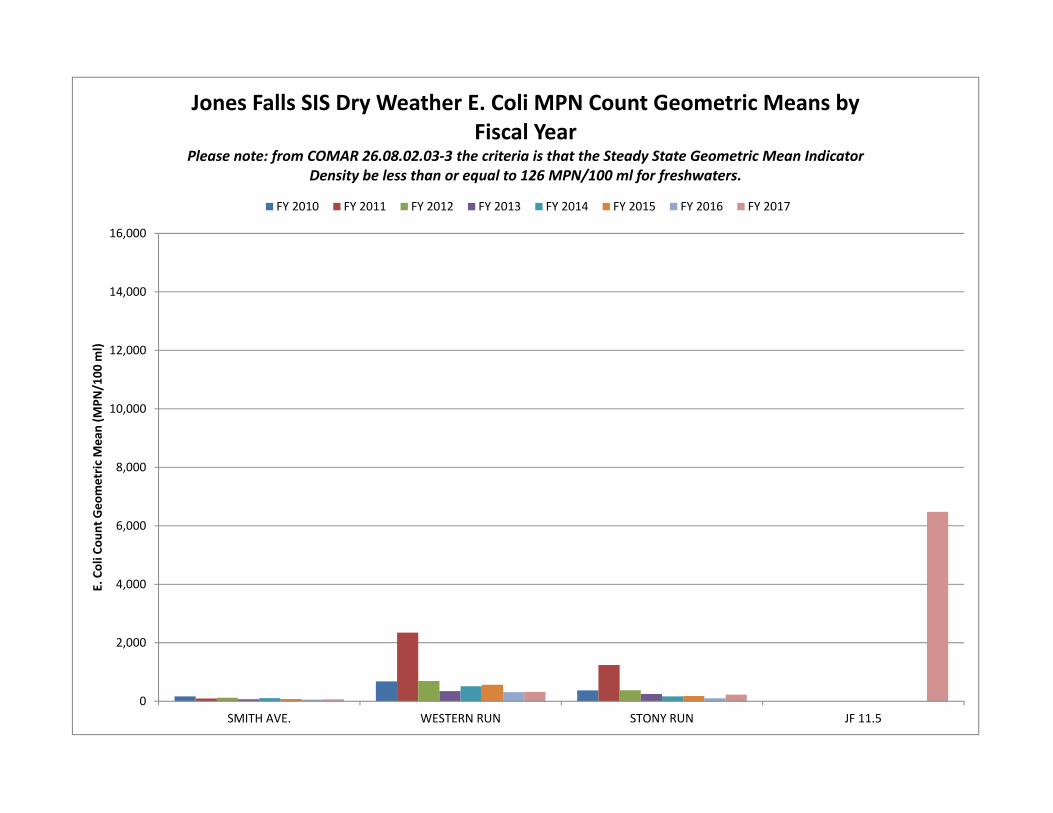
0
2,000
4,000
6,000
8,000
10,000
12,000
14,000
16,000
SMITH AVE. WESTERN RUN STONY RUN JF 11.5
E. Coli C
ount Geo
metric
Mea
n (M
PN/100
ml)
Jones Falls SIS Dry Weather E. Coli MPN Count Geometric Means by Fiscal Year
Please note: from COMAR 26.08.02.03‐3 the criteria is that the Steady State Geometric Mean Indicator Density be less than or equal to 126 MPN/100 ml for freshwaters.
FY 2010 FY 2011 FY 2012 FY 2013 FY 2014 FY 2015 FY 2016 FY 2017
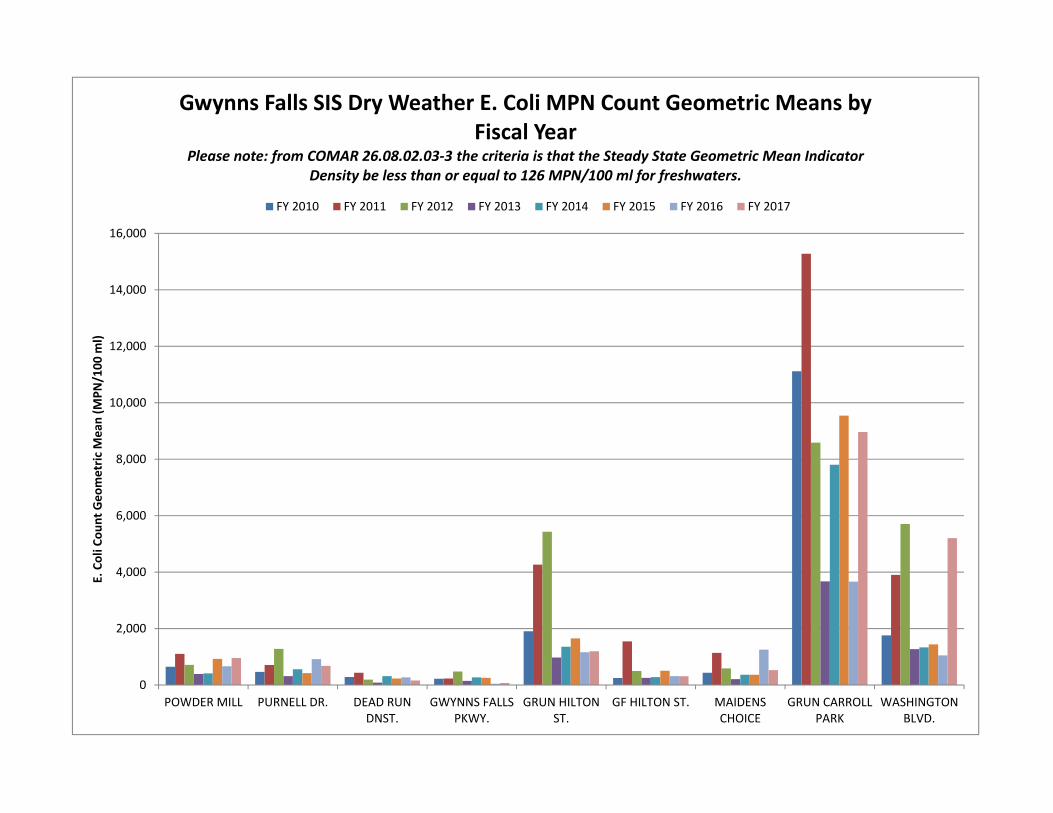
0
2,000
4,000
6,000
8,000
10,000
12,000
14,000
16,000
POWDER MILL PURNELL DR. DEAD RUNDNST.
GWYNNS FALLSPKWY.
GRUN HILTONST.
GF HILTON ST. MAIDENSCHOICE
GRUN CARROLLPARK
WASHINGTONBLVD.
E. Coli C
ount Geo
metric
Mea
n (M
PN/100
ml)
Gwynns Falls SIS Dry Weather E. Coli MPN Count Geometric Means by Fiscal Year
Please note: from COMAR 26.08.02.03‐3 the criteria is that the Steady State Geometric Mean Indicator Density be less than or equal to 126 MPN/100 ml for freshwaters.
FY 2010 FY 2011 FY 2012 FY 2013 FY 2014 FY 2015 FY 2016 FY 2017
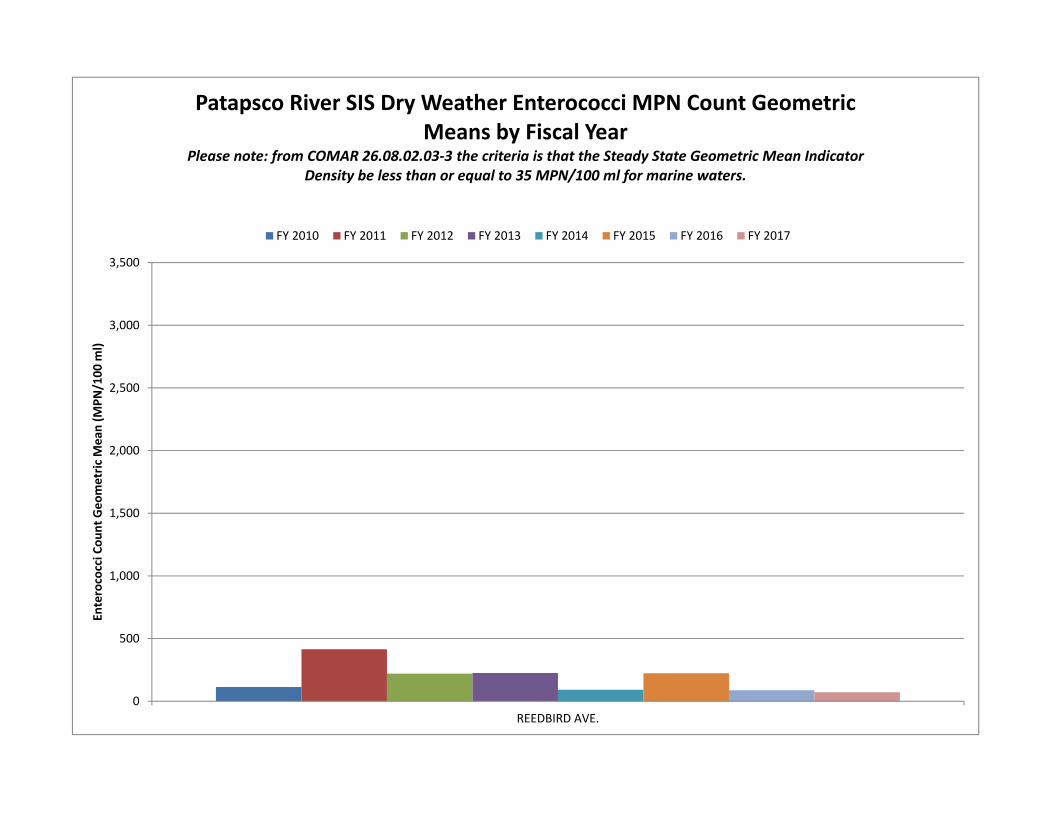
0
500
1,000
1,500
2,000
2,500
3,000
3,500
REEDBIRD AVE.
Enterococci C
ount Geo
metric
Mea
n (M
PN/100
ml)
Patapsco River SIS Dry Weather Enterococci MPN Count Geometric Means by Fiscal Year
Please note: from COMAR 26.08.02.03‐3 the criteria is that the Steady State Geometric Mean Indicator Density be less than or equal to 35 MPN/100 ml for marine waters.
FY 2010 FY 2011 FY 2012 FY 2013 FY 2014 FY 2015 FY 2016 FY 2017
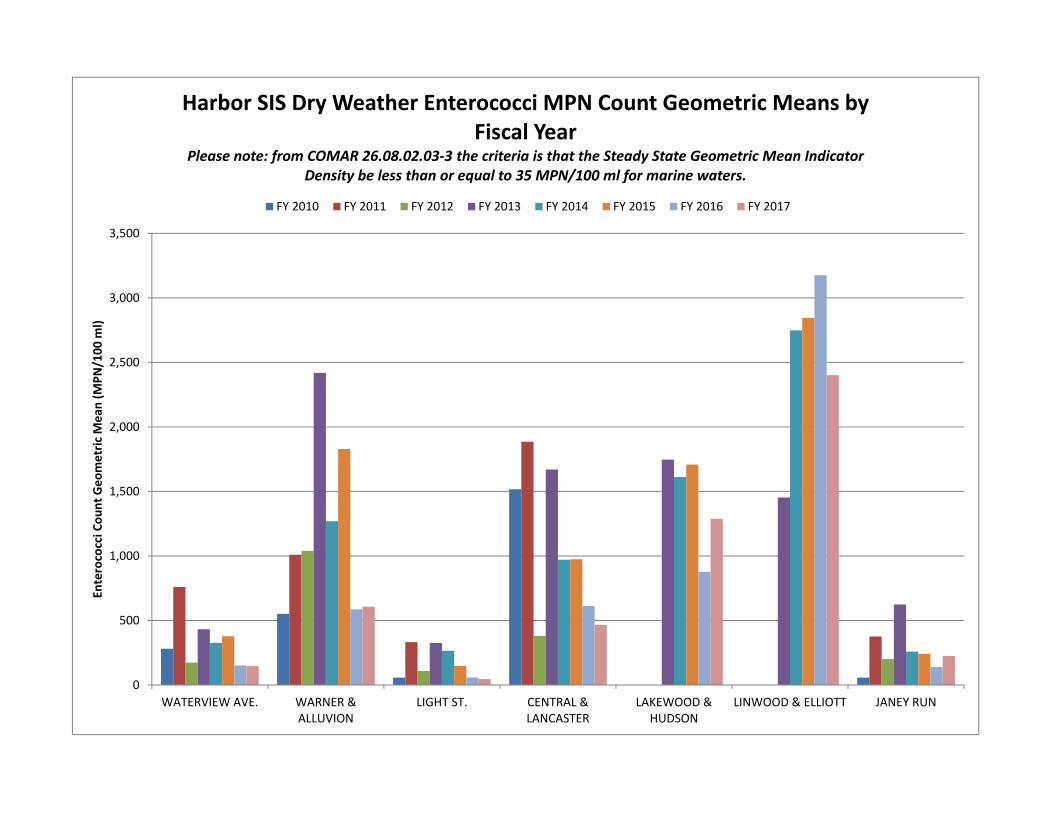
0
500
1,000
1,500
2,000
2,500
3,000
3,500
WATERVIEW AVE. WARNER &ALLUVION
LIGHT ST. CENTRAL &LANCASTER
LAKEWOOD &HUDSON
LINWOOD & ELLIOTT JANEY RUN
Enterococci C
ount Geo
metric
Mea
n (M
PN/100
ml)
Harbor SIS Dry Weather Enterococci MPN Count Geometric Means by Fiscal Year
Please note: from COMAR 26.08.02.03‐3 the criteria is that the Steady State Geometric Mean Indicator Density be less than or equal to 35 MPN/100 ml for marine waters.
FY 2010 FY 2011 FY 2012 FY 2013 FY 2014 FY 2015 FY 2016 FY 2017
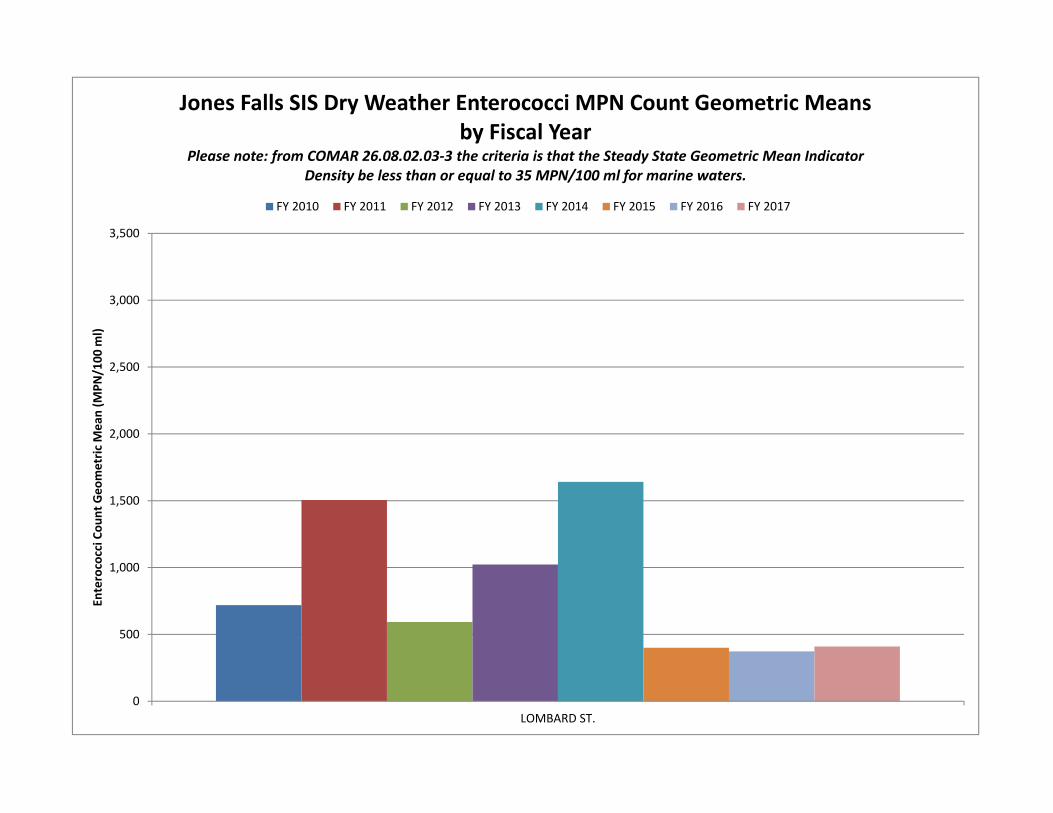
0
500
1,000
1,500
2,000
2,500
3,000
3,500
LOMBARD ST.
Enterococci C
ount Geo
metric
Mea
n (M
PN/100
ml)
Jones Falls SIS Dry Weather Enterococci MPN Count Geometric Means by Fiscal Year
Please note: from COMAR 26.08.02.03‐3 the criteria is that the Steady State Geometric Mean Indicator Density be less than or equal to 35 MPN/100 ml for marine waters.
FY 2010 FY 2011 FY 2012 FY 2013 FY 2014 FY 2015 FY 2016 FY 2017

Appendix F: Habitat Monitoring
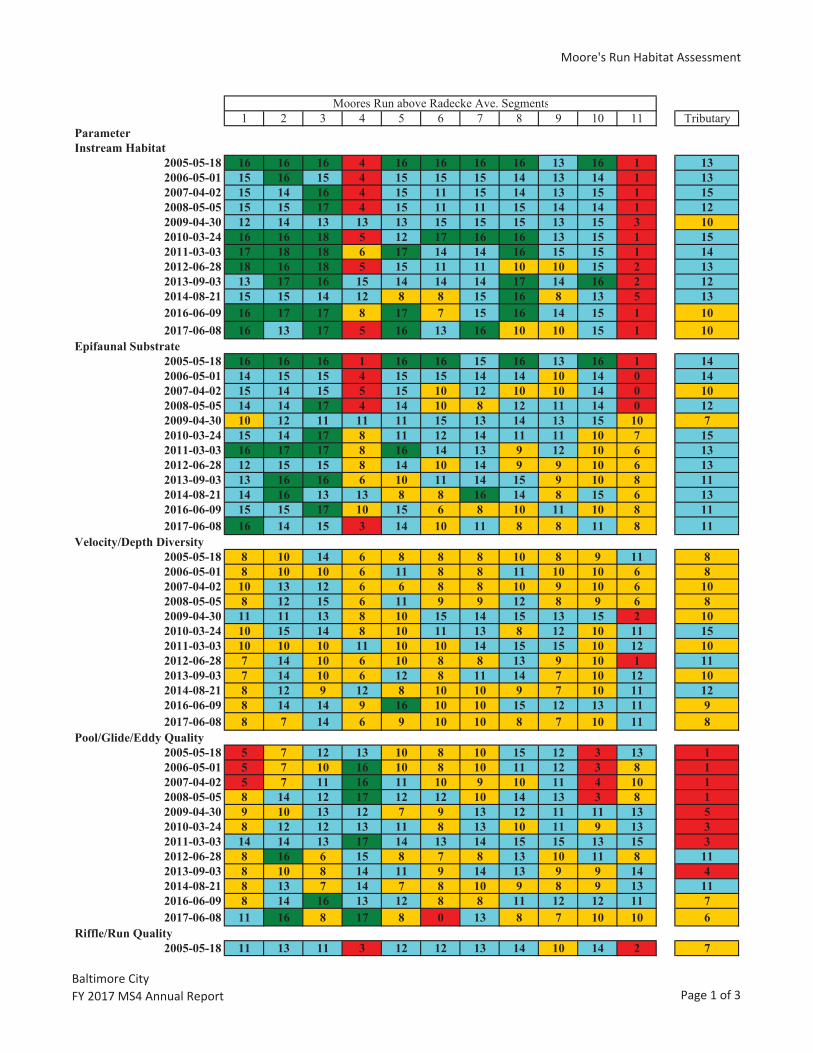
Moore's Run Habitat Assessment
1 2 3 4 5 6 7 8 9 10 11 TributaryParameterInstream Habitat
2005-05-18 16 16 16 4 16 16 16 16 13 16 1 132006-05-01 15 16 15 4 15 15 15 14 13 14 1 132007-04-02 15 14 16 4 15 11 15 14 13 15 1 152008-05-05 15 15 17 4 15 11 11 15 14 14 1 122009-04-30 12 14 13 13 13 15 15 15 13 15 3 102010-03-24 16 16 18 5 12 17 16 16 13 15 1 152011-03-03 17 18 18 6 17 14 14 16 15 15 1 142012-06-28 18 16 18 5 15 11 11 10 10 15 2 132013-09-03 13 17 16 15 14 14 14 17 14 16 2 122014-08-21 15 15 14 12 8 8 15 16 8 13 5 132016-06-09 16 17 17 8 17 7 15 16 14 15 1 102017-06-08 16 13 17 5 16 13 16 10 10 15 1 10
Epifaunal Substrate2005-05-18 16 16 16 1 16 16 15 16 13 16 1 142006-05-01 14 15 15 4 15 15 14 14 10 14 0 142007-04-02 15 14 15 5 15 10 12 10 10 14 0 102008-05-05 14 14 17 4 14 10 8 12 11 14 0 122009-04-30 10 12 11 11 11 15 13 14 13 15 10 72010-03-24 15 14 17 8 11 12 14 11 11 10 7 152011-03-03 16 17 17 8 16 14 13 9 12 10 6 132012-06-28 12 15 15 8 14 10 14 9 9 10 6 132013-09-03 13 16 16 6 10 11 14 15 9 10 8 112014-08-21 14 16 13 13 8 8 16 14 8 15 6 132016-06-09 15 15 17 10 15 6 8 10 11 10 8 112017-06-08 16 14 15 3 14 10 11 8 8 11 8 11
Velocity/Depth Diversity2005-05-18 8 10 14 6 8 8 8 10 8 9 11 82006-05-01 8 10 10 6 11 8 8 11 10 10 6 82007-04-02 10 13 12 6 6 8 8 10 9 10 6 102008-05-05 8 12 15 6 11 9 9 12 8 9 6 82009-04-30 11 11 13 8 10 15 14 15 13 15 2 102010-03-24 10 15 14 8 10 11 13 8 12 10 11 152011-03-03 10 10 10 11 10 10 14 15 15 10 12 102012-06-28 7 14 10 6 10 8 8 13 9 10 1 112013-09-03 7 14 10 6 12 8 11 14 7 10 12 102014-08-21 8 12 9 12 8 10 10 9 7 10 11 122016-06-09 8 14 14 9 16 10 10 15 12 13 11 92017-06-08 8 7 14 6 9 10 10 8 7 10 11 8
Pool/Glide/Eddy Quality2005-05-18 5 7 12 13 10 8 10 15 12 3 13 12006-05-01 5 7 10 16 10 8 10 11 12 3 8 12007-04-02 5 7 11 16 11 10 9 10 11 4 10 12008-05-05 8 14 12 17 12 12 10 14 13 3 8 12009-04-30 9 10 13 12 7 9 13 12 11 11 13 52010-03-24 8 12 12 13 11 8 13 10 11 9 13 32011-03-03 14 14 13 17 14 13 14 15 15 13 15 32012-06-28 8 16 6 15 8 7 8 13 10 11 8 112013-09-03 8 10 8 14 11 9 14 13 9 9 14 42014-08-21 8 13 7 14 7 8 10 9 8 9 13 112016-06-09 8 14 16 13 12 8 8 11 12 12 11 72017-06-08 11 16 8 17 8 0 13 8 7 10 10 6
Riffle/Run Quality2005-05-18 11 13 11 3 12 12 13 14 10 14 2 7
Moores Run above Radecke Ave. Segments
Baltimore CityFY 2017 MS4 Annual Report Page 1 of 3
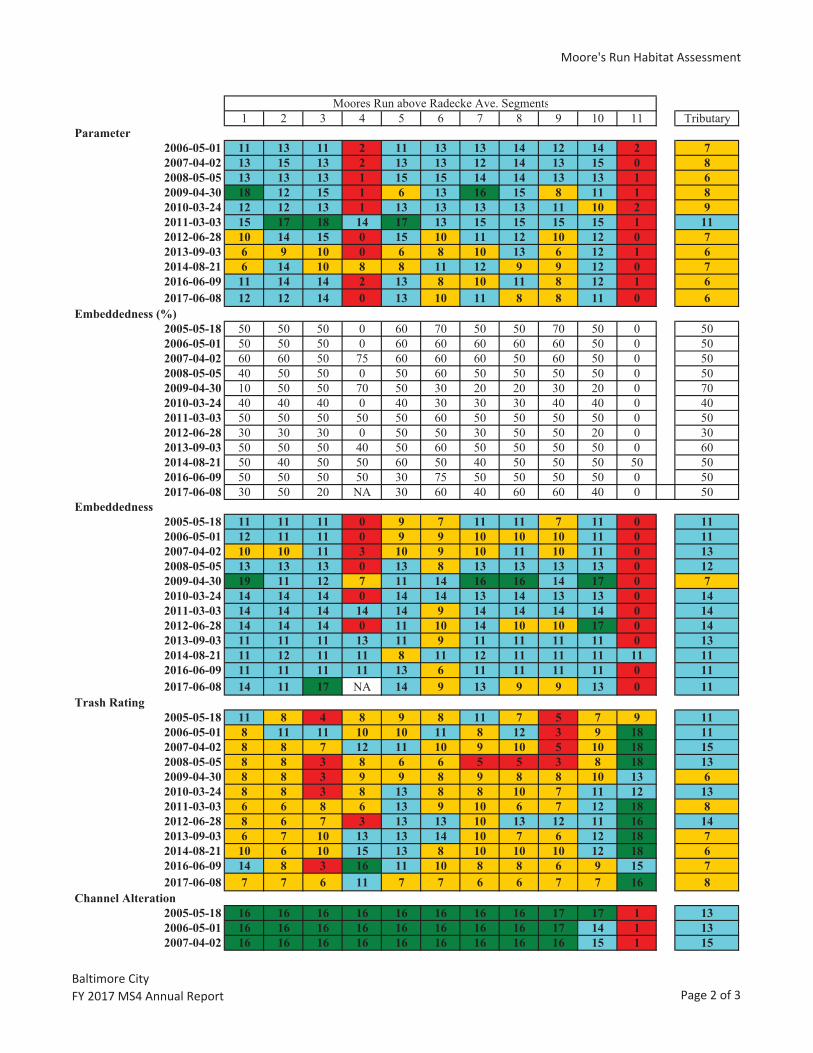
Moore's Run Habitat Assessment
1 2 3 4 5 6 7 8 9 10 11 TributaryParameter
Moores Run above Radecke Ave. Segments
2006-05-01 11 13 11 2 11 13 13 14 12 14 2 72007-04-02 13 15 13 2 13 13 12 14 13 15 0 82008-05-05 13 13 13 1 15 15 14 14 13 13 1 62009-04-30 18 12 15 1 6 13 16 15 8 11 1 82010-03-24 12 12 13 1 13 13 13 13 11 10 2 92011-03-03 15 17 18 14 17 13 15 15 15 15 1 112012-06-28 10 14 15 0 15 10 11 12 10 12 0 72013-09-03 6 9 10 0 6 8 10 13 6 12 1 62014-08-21 6 14 10 8 8 11 12 9 9 12 0 72016-06-09 11 14 14 2 13 8 10 11 8 12 1 62017-06-08 12 12 14 0 13 10 11 8 8 11 0 6
Embeddedness (%)2005-05-18 50 50 50 0 60 70 50 50 70 50 0 502006-05-01 50 50 50 0 60 60 60 60 60 50 0 502007-04-02 60 60 50 75 60 60 60 50 60 50 0 502008-05-05 40 50 50 0 50 60 50 50 50 50 0 502009-04-30 10 50 50 70 50 30 20 20 30 20 0 702010-03-24 40 40 40 0 40 30 30 30 40 40 0 402011-03-03 50 50 50 50 50 60 50 50 50 50 0 502012-06-28 30 30 30 0 50 50 30 50 50 20 0 302013-09-03 50 50 50 40 50 60 50 50 50 50 0 602014-08-21 50 40 50 50 60 50 40 50 50 50 50 502016-06-09 50 50 50 50 30 75 50 50 50 50 0 502017-06-08 30 50 20 NA 30 60 40 60 60 40 0 50
Embeddedness2005-05-18 11 11 11 0 9 7 11 11 7 11 0 112006-05-01 12 11 11 0 9 9 10 10 10 11 0 112007-04-02 10 10 11 3 10 9 10 11 10 11 0 132008-05-05 13 13 13 0 13 8 13 13 13 13 0 122009-04-30 19 11 12 7 11 14 16 16 14 17 0 72010-03-24 14 14 14 0 14 14 13 14 13 13 0 142011-03-03 14 14 14 14 14 9 14 14 14 14 0 142012-06-28 14 14 14 0 11 10 14 10 10 17 0 142013-09-03 11 11 11 13 11 9 11 11 11 11 0 132014-08-21 11 12 11 11 8 11 12 11 11 11 11 112016-06-09 11 11 11 11 13 6 11 11 11 11 0 112017-06-08 14 11 17 NA 14 9 13 9 9 13 0 11
Trash Rating2005-05-18 11 8 4 8 9 8 11 7 5 7 9 112006-05-01 8 11 11 10 10 11 8 12 3 9 18 112007-04-02 8 8 7 12 11 10 9 10 5 10 18 152008-05-05 8 8 3 8 6 6 5 5 3 8 18 132009-04-30 8 8 3 9 9 8 9 8 8 10 13 62010-03-24 8 8 3 8 13 8 8 10 7 11 12 132011-03-03 6 6 8 6 13 9 10 6 7 12 18 82012-06-28 8 6 7 3 13 13 10 13 12 11 16 142013-09-03 6 7 10 13 13 14 10 7 6 12 18 72014-08-21 10 6 10 15 13 8 10 10 10 12 18 62016-06-09 14 8 3 16 11 10 8 8 6 9 15 72017-06-08 7 7 6 11 7 7 6 6 7 7 16 8
Channel Alteration2005-05-18 16 16 16 16 16 16 16 16 17 17 1 132006-05-01 16 16 16 16 16 16 16 16 17 14 1 132007-04-02 16 16 16 16 16 16 16 16 16 15 1 15
Baltimore CityFY 2017 MS4 Annual Report Page 2 of 3
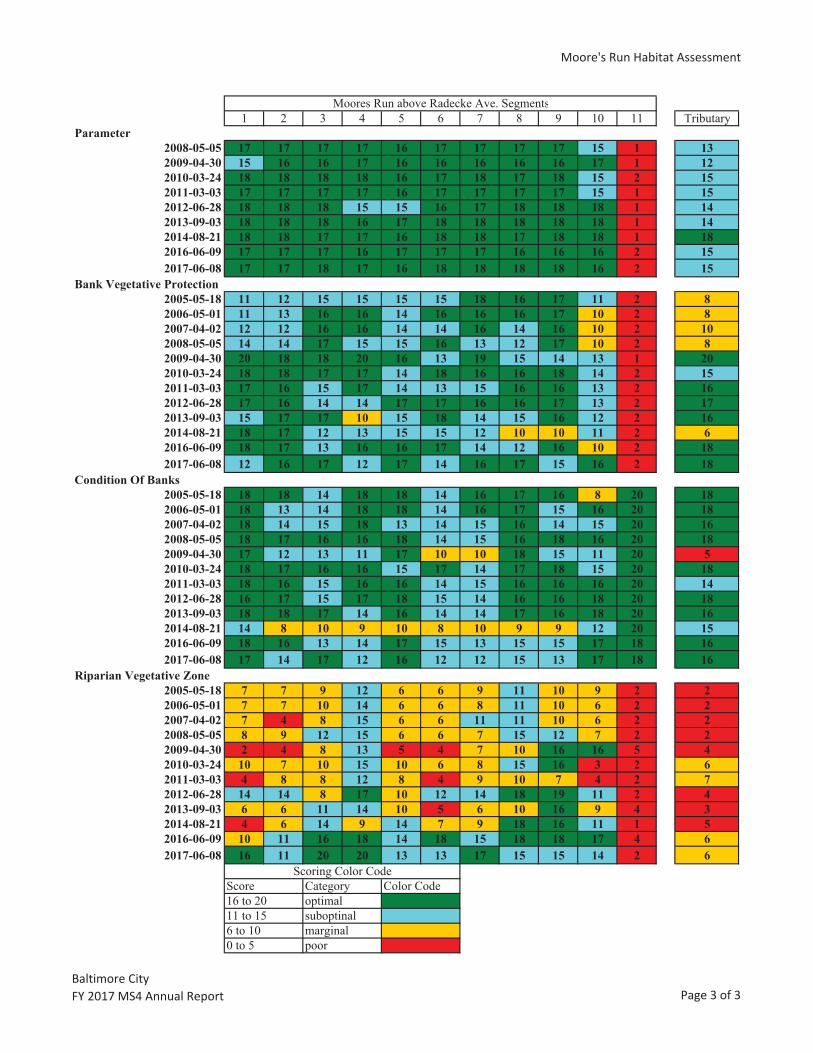
Moore's Run Habitat Assessment
1 2 3 4 5 6 7 8 9 10 11 TributaryParameter
Moores Run above Radecke Ave. Segments
2008-05-05 17 17 17 17 16 17 17 17 17 15 1 132009-04-30 15 16 16 17 16 16 16 16 16 17 1 122010-03-24 18 18 18 18 16 17 18 17 18 15 2 152011-03-03 17 17 17 17 16 17 17 17 17 15 1 152012-06-28 18 18 18 15 15 16 17 18 18 18 1 142013-09-03 18 18 18 16 17 18 18 18 18 18 1 142014-08-21 18 18 17 17 16 18 18 17 18 18 1 182016-06-09 17 17 17 16 17 17 17 16 16 16 2 152017-06-08 17 17 18 17 16 18 18 18 18 16 2 15
Bank Vegetative Protection2005-05-18 11 12 15 15 15 15 18 16 17 11 2 82006-05-01 11 13 16 16 14 16 16 16 17 10 2 82007-04-02 12 12 16 16 14 14 16 14 16 10 2 102008-05-05 14 14 17 15 15 16 13 12 17 10 2 82009-04-30 20 18 18 20 16 13 19 15 14 13 1 202010-03-24 18 18 17 17 14 18 16 16 18 14 2 152011-03-03 17 16 15 17 14 13 15 16 16 13 2 162012-06-28 17 16 14 14 17 17 16 16 17 13 2 172013-09-03 15 17 17 10 15 18 14 15 16 12 2 162014-08-21 18 17 12 13 15 15 12 10 10 11 2 62016-06-09 18 17 13 16 16 17 14 12 16 10 2 182017-06-08 12 16 17 12 17 14 16 17 15 16 2 18
Condition Of Banks2005-05-18 18 18 14 18 18 14 16 17 16 8 20 182006-05-01 18 13 14 18 18 14 16 17 15 16 20 182007-04-02 18 14 15 18 13 14 15 16 14 15 20 162008-05-05 18 17 16 16 18 14 15 16 18 16 20 182009-04-30 17 12 13 11 17 10 10 18 15 11 20 52010-03-24 18 17 16 16 15 17 14 17 18 15 20 182011-03-03 18 16 15 16 16 14 15 16 16 16 20 142012-06-28 16 17 15 17 18 15 14 16 16 18 20 182013-09-03 18 18 17 14 16 14 14 17 16 18 20 162014-08-21 14 8 10 9 10 8 10 9 9 12 20 152016-06-09 18 16 13 14 17 15 13 15 15 17 18 162017-06-08 17 14 17 12 16 12 12 15 13 17 18 16
Riparian Vegetative Zone2005-05-18 7 7 9 12 6 6 9 11 10 9 2 22006-05-01 7 7 10 14 6 6 8 11 10 6 2 22007-04-02 7 4 8 15 6 6 11 11 10 6 2 22008-05-05 8 9 12 15 6 6 7 15 12 7 2 22009-04-30 2 4 8 13 5 4 7 10 16 16 5 42010-03-24 10 7 10 15 10 6 8 15 16 3 2 62011-03-03 4 8 8 12 8 4 9 10 7 4 2 72012-06-28 14 14 8 17 10 12 14 18 19 11 2 42013-09-03 6 6 11 14 10 5 6 10 16 9 4 32014-08-21 4 6 14 9 14 7 9 18 16 11 1 52016-06-09 10 11 16 18 14 18 15 18 18 17 4 62017-06-08 16 11 20 20 13 13 17 15 15 14 2 6
6 to 10 marginal0 to 5 poor
16 to 20 optimal11 to 15 suboptinal
Score Category Color CodeScoring Color Code
Baltimore CityFY 2017 MS4 Annual Report Page 3 of 3
Appendix G: Baltimore City, Maryland 2015 Stream RestorationMonitoring Summary by USFW
Main ReportAppendices A to F (electronic files only)

Draft BALTIMORE CITY, MARYLAND2015 STREAM RESTORATION MONITORING SUMMARY
By: Sandra L. Davis, Ben J. Hutzel, Mark A. Secrist and Richard R. Starr
Stream Habitat Assessment and Restoration Coastal ProgramU.S. Fish and Wildlife ServiceChesapeake Bay Field Office
CBFO-S16-05
Prepared in cooperation with: City of Baltimore, Department of Public Works, Bureau of Water and Wastewater
Annapolis, MDAugust 2016
Draft Baltimore City 2015 Stream Restoration Monitoring – Baltimore City, Maryland
U. S. Fish and Wildlife Service August 2016Chesapeake Bay Field Office Page i of ii
TABLE OF CONTENTS
I. INTRODUCTION .......................................................................................... 1
II. METHODOLOGY ......................................................................................... 1
III. MONITORING RESULTS AND RECOMMENDATIONS...................... 2
IV. CONCLUSIONS.......................................................................................…...26
LITERATURE CITED
APPENDIX A – UPPER STONY RUN
APPENDIX B – MIDDLE STONY RUN
APPENDIX C -- BIDDISON RUN
APPENDIX D -- MAIDENS CHOICE
APPENDIX E – WESTERN RUN
APPENDIX F – EVALUATION ATTRIBUTES

Draft Baltimore City 2015 Stream Restoration Monitoring – Baltimore City, Maryland
U. S. Fish and Wildlife Service August 2016Chesapeake Bay Field Office Page i of ii
LIST OF PHOTOGRAPHS
Photo 1. Upper Stony Run. Stable reach at station 24+25.Photo 2. Upper Stony Run. Lateral bank erosion due to improper structure placement at station 25+50.Photo 3. Upper Stony Run. Cross vane at station 25+95 showing typical structure issues and results: scour on upstream of vane arm and deposition along downstream vane arms. Photo 4. Upper Stony Run. Station 08+70 showing debris jam and start of cutoff channel on right bank.Photo 5. Upper Stony Run. Station 12+00 showing right bank erosion.Photo 6. Upper Stony Run. Right bank erosion at station 27+40.Photo 7. Middle Stony Run. Excess sediment causing bar formation and lateral erosion downstream of vane arm at station 10+90.Photo 8. Middle Stony Run. Cross vane 14 at station 25+40 showing shallow pool.Photo 9. Middle Stony Run. Left bank erosion causing failure of cross vane 6 left vane arm at station 13+35.Photo 10. Middle Stony Run. Right bank erosion showing failure of cross vane 7 right vane arm at station 14+30.Photo 11. Middle Stony Run. Right bank erosion causing failure of cross vane 8 right vane arm at station 14+61.Photo 12. Biddison Run. Excessive sediment deposition at station 00+00.Photo 13. Biddison Run. Excessive sediment deposition in front of imbricated wall at station 01+60.Photo 14. Biddison Run. Scour behind structure at station 07+40.Photo 15. Biddison Run. Major bank erosion on right bank of station 07+70 – 08+35.Photo 16. Biddison Run. Depositonal fan at end of project (looking upstream).Photo 17. Maidens Choice. Excessive sediment deposition.Photo 18. Maidens Choice. Excessive sediment deposition.Photo 19. Maidens Choice. Station 06+00. Stream structure with pool filled in with sediment.Photo 20. Maidens Choice. Station 06+00. Stream structure right arm buried from sediment.Photo 21. Maidens Choice. Station 17+25 flanked J-hook.Photo 22. Western Run. Lateral bank erosion.Photo 23. Western Run. Lateral bank erosion causing structure flanking on left bank.Photo 24. Western Run. Excessive deposition covering cross vane 2.Photo 25. Western Run. Excessive deposition filling the channel and causing left bank lateral erosion.
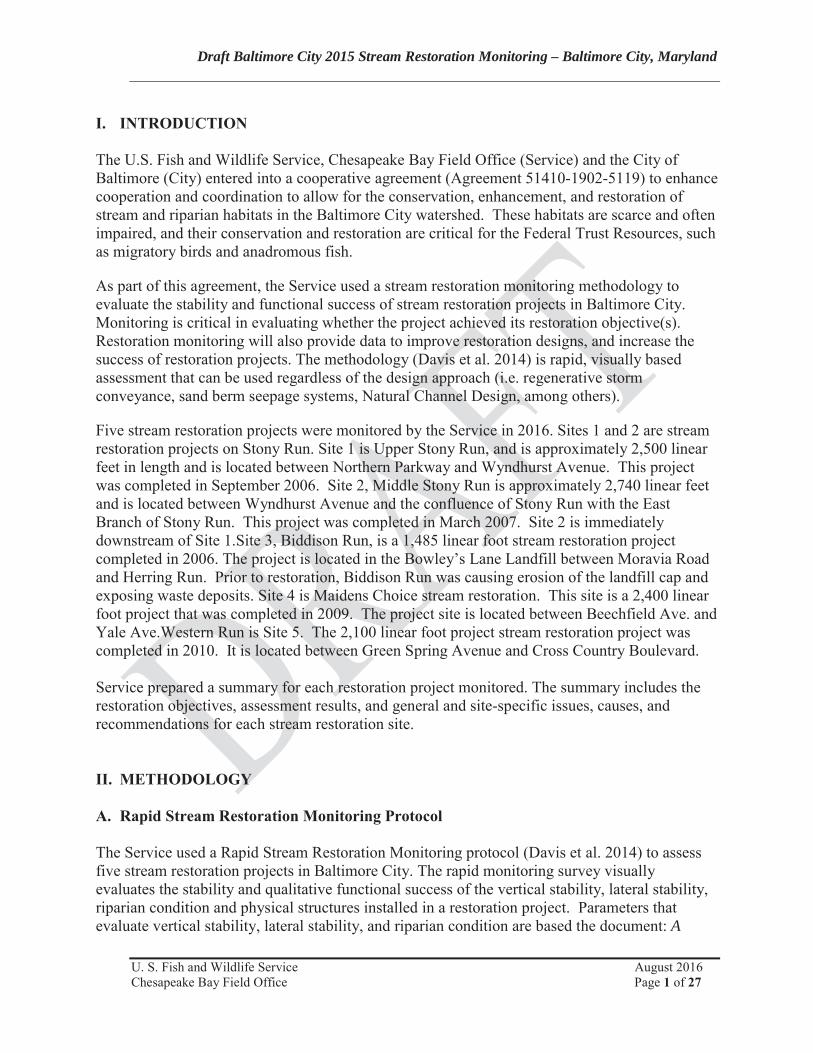
Draft Baltimore City 2015 Stream Restoration Monitoring – Baltimore City, Maryland
U. S. Fish and Wildlife Service August 2016Chesapeake Bay Field Office Page 1 of 27
I. INTRODUCTION
The U.S. Fish and Wildlife Service, Chesapeake Bay Field Office (Service) and the City of Baltimore (City) entered into a cooperative agreement (Agreement 51410-1902-5119) to enhance cooperation and coordination to allow for the conservation, enhancement, and restoration of stream and riparian habitats in the Baltimore City watershed. These habitats are scarce and often impaired, and their conservation and restoration are critical for the Federal Trust Resources, such as migratory birds and anadromous fish.
As part of this agreement, the Service used a stream restoration monitoring methodology to evaluate the stability and functional success of stream restoration projects in Baltimore City. Monitoring is critical in evaluating whether the project achieved its restoration objective(s). Restoration monitoring will also provide data to improve restoration designs, and increase the success of restoration projects. The methodology (Davis et al. 2014) is rapid, visually based assessment that can be used regardless of the design approach (i.e. regenerative storm conveyance, sand berm seepage systems, Natural Channel Design, among others).
Five stream restoration projects were monitored by the Service in 2016. Sites 1 and 2 are stream restoration projects on Stony Run. Site 1 is Upper Stony Run, and is approximately 2,500 linear feet in length and is located between Northern Parkway and Wyndhurst Avenue. This project was completed in September 2006. Site 2, Middle Stony Run is approximately 2,740 linear feet and is located between Wyndhurst Avenue and the confluence of Stony Run with the East Branch of Stony Run. This project was completed in March 2007. Site 2 is immediately downstream of Site 1.Site 3, Biddison Run, is a 1,485 linear foot stream restoration project completed in 2006. The project is located in the Bowley’s Lane Landfill between Moravia Road and Herring Run. Prior to restoration, Biddison Run was causing erosion of the landfill cap and exposing waste deposits. Site 4 is Maidens Choice stream restoration. This site is a 2,400 linear foot project that was completed in 2009. The project site is located between Beechfield Ave. and Yale Ave.Western Run is Site 5. The 2,100 linear foot project stream restoration project was completed in 2010. It is located between Green Spring Avenue and Cross Country Boulevard.
Service prepared a summary for each restoration project monitored. The summary includes the restoration objectives, assessment results, and general and site-specific issues, causes, and recommendations for each stream restoration site.
II. METHODOLOGY
A. Rapid Stream Restoration Monitoring Protocol
The Service used a Rapid Stream Restoration Monitoring protocol (Davis et al. 2014) to assess five stream restoration projects in Baltimore City. The rapid monitoring survey visually evaluates the stability and qualitative functional success of the vertical stability, lateral stability, riparian condition and physical structures installed in a restoration project. Parameters that evaluate vertical stability, lateral stability, and riparian condition are based the document: A

Draft Baltimore City 2015 Stream Restoration Monitoring – Baltimore City, Maryland
U. S. Fish and Wildlife Service August 2016Chesapeake Bay Field Office Page 2 of 27
Function-Based Framework for Stream Assessment and Restoration Projects, (Harman et al.2012). The framework is illustrated by a functional pyramid, which is a five-level hierarchical framework that categorizes stream functions and the parameters that describe those functions. The stability of the physical structures (i.e. log vane, cross vane) are evaluated using parameters based on a combination of stream functional and structural measures. The rapid methodology uses these function-based parameters to identify restoration success and recommend further action. Recommended future actions always include the rapid assessment protocol, but may include other, more intensive survey monitoring, remediation and/or repair.
The rapid stream restoration monitoring protocol consists of eight main components: A) design approach, B) bankfull determination, C) limits of investigation, D) rapid stream restoration monitoring form, E) evaluation parameter definitions, F) monitoring procedures, G) limited stream measurements, and H) monitoring/restoration thresholds. An example data sheet and the evaluation attribute table portions of the rapid stream restoration protocol can be found in Appendix F.
B. Constraints
In addition to the rapid stream restoration monitoring protocol forms and evaluation attributes, the Service used all available as-built surveys and design reports to assess the five restoration projects. All stationing is taken from the as-built surveys provided by the City. In some cases, complete assessment and design reports were not available for use in conjunction with the protocol. However, this did not hinder the Service’s ability to monitor the restoration success.
III.MONITORING RESULTS AND RECOMMENDATIONS
As part of the rapid monitoring protocol, the Service assessed the vertical stability, lateral stability, riparian condition and instream structures (i.e. log vanes, w-weir) for the entire restoration area for the Upper and Middle Stony Run, Biddison Run, Maidens Choice and Western Run restoration projects. The monitoring reaches started and ended at the point where the restoration had no visible influence on the stream, and included areas in the reach that are currently stable. The assessment includes problem identification, as well as information about the severity, implication, apparent cause of the problem, and recommended corrective actions (if any). Representative photographs were taken at each station evaluated.
All detailed assessment results and photographs are located in Appendices A – E. However, the Service has summarized the restoration objectives, assessment results, and general and site-specific issues, causes, and recommendations for each stream restoration site in Sections A through E below.
A. Upper Stony Run Monitoring Summary
The Upper Stony Run was identified in need of restoration due to active bank erosion and channel widening. Prior to restoration, the site was predominately a Rosgen F stream type with active bank erosion. While the Service did not have a full copy of the Stony Run Restoration
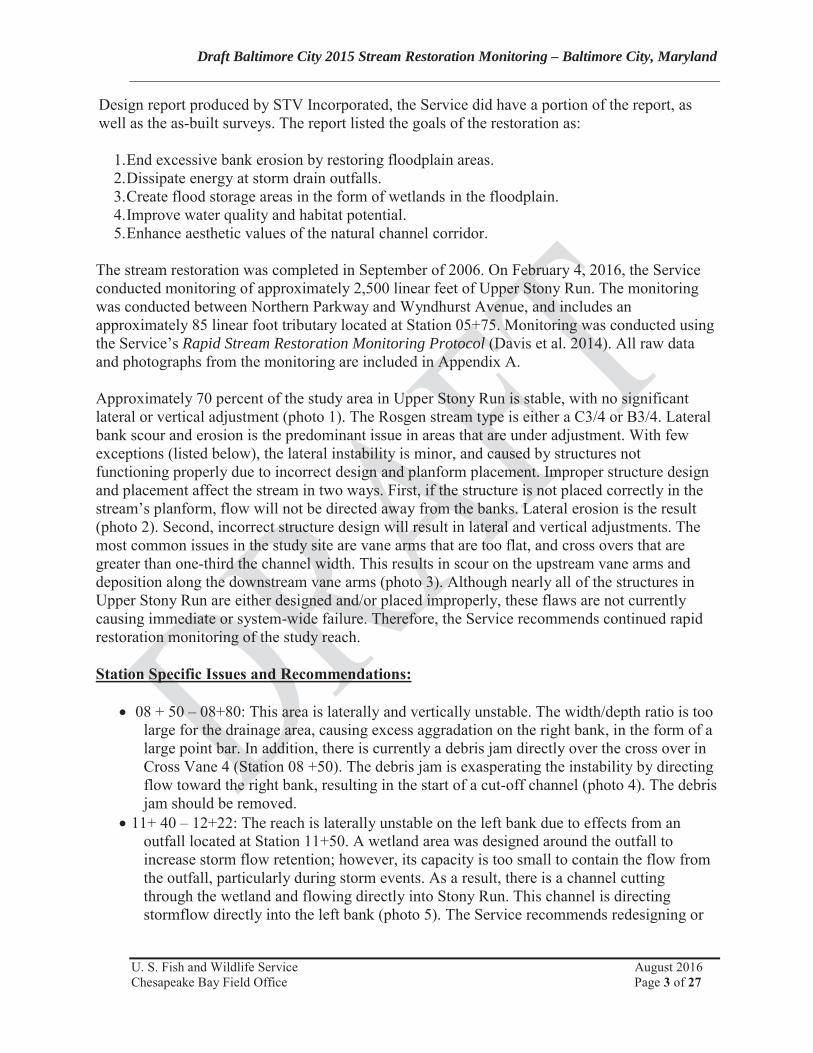
Draft Baltimore City 2015 Stream Restoration Monitoring – Baltimore City, Maryland
U. S. Fish and Wildlife Service August 2016Chesapeake Bay Field Office Page 3 of 27
Design report produced by STV Incorporated, the Service did have a portion of the report, as well as the as-built surveys. The report listed the goals of the restoration as:
1.End excessive bank erosion by restoring floodplain areas.2.Dissipate energy at storm drain outfalls.3.Create flood storage areas in the form of wetlands in the floodplain.4.Improve water quality and habitat potential.5.Enhance aesthetic values of the natural channel corridor.
The stream restoration was completed in September of 2006. On February 4, 2016, the Service conducted monitoring of approximately 2,500 linear feet of Upper Stony Run. The monitoring was conducted between Northern Parkway and Wyndhurst Avenue, and includes an approximately 85 linear foot tributary located at Station 05+75. Monitoring was conducted using the Service’s Rapid Stream Restoration Monitoring Protocol (Davis et al. 2014). All raw data and photographs from the monitoring are included in Appendix A.
Approximately 70 percent of the study area in Upper Stony Run is stable, with no significant lateral or vertical adjustment (photo 1). The Rosgen stream type is either a C3/4 or B3/4. Lateral bank scour and erosion is the predominant issue in areas that are under adjustment. With few exceptions (listed below), the lateral instability is minor, and caused by structures not functioning properly due to incorrect design and planform placement. Improper structure design and placement affect the stream in two ways. First, if the structure is not placed correctly in the stream’s planform, flow will not be directed away from the banks. Lateral erosion is the result (photo 2). Second, incorrect structure design will result in lateral and vertical adjustments. The most common issues in the study site are vane arms that are too flat, and cross overs that are greater than one-third the channel width. This results in scour on the upstream vane arms and deposition along the downstream vane arms (photo 3). Although nearly all of the structures in Upper Stony Run are either designed and/or placed improperly, these flaws are not currently causing immediate or system-wide failure. Therefore, the Service recommends continued rapid restoration monitoring of the study reach.
Station Specific Issues and Recommendations:
08 + 50 – 08+80: This area is laterally and vertically unstable. The width/depth ratio is too large for the drainage area, causing excess aggradation on the right bank, in the form of a large point bar. In addition, there is currently a debris jam directly over the cross over in Cross Vane 4 (Station 08 +50). The debris jam is exasperating the instability by directing flow toward the right bank, resulting in the start of a cut-off channel (photo 4). The debrisjam should be removed.
11+ 40 – 12+22: The reach is laterally unstable on the left bank due to effects from an outfall located at Station 11+50. A wetland area was designed around the outfall to increase storm flow retention; however, its capacity is too small to contain the flow from the outfall, particularly during storm events. As a result, there is a channel cutting through the wetland and flowing directly into Stony Run. This channel is directing stormflow directly into the left bank (photo 5). The Service recommends redesigning or
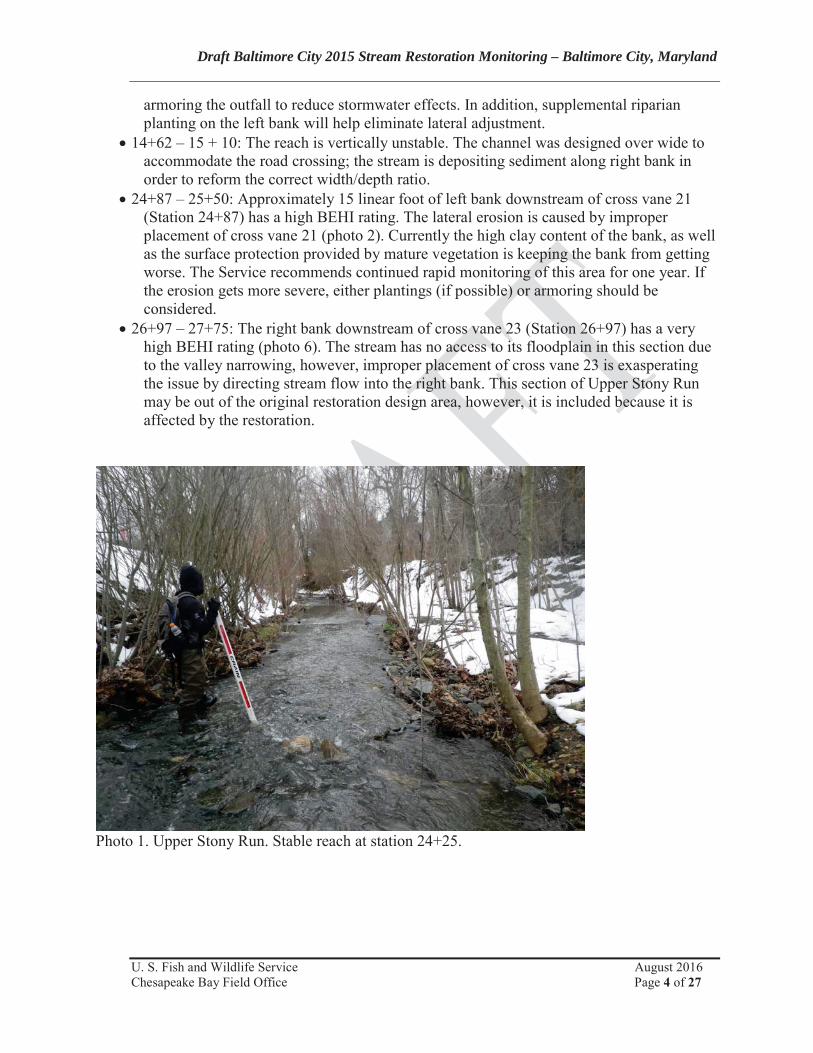
Draft Baltimore City 2015 Stream Restoration Monitoring – Baltimore City, Maryland
U. S. Fish and Wildlife Service August 2016Chesapeake Bay Field Office Page 4 of 27
armoring the outfall to reduce stormwater effects. In addition, supplemental riparian planting on the left bank will help eliminate lateral adjustment.
14+62 – 15 + 10: The reach is vertically unstable. The channel was designed over wide to accommodate the road crossing; the stream is depositing sediment along right bank in order to reform the correct width/depth ratio.
24+87 – 25+50: Approximately 15 linear foot of left bank downstream of cross vane 21 (Station 24+87) has a high BEHI rating. The lateral erosion is caused by improper placement of cross vane 21 (photo 2). Currently the high clay content of the bank, as well as the surface protection provided by mature vegetation is keeping the bank from getting worse. The Service recommends continued rapid monitoring of this area for one year. If the erosion gets more severe, either plantings (if possible) or armoring should be considered.
26+97 – 27+75: The right bank downstream of cross vane 23 (Station 26+97) has a very high BEHI rating (photo 6). The stream has no access to its floodplain in this section due to the valley narrowing, however, improper placement of cross vane 23 is exasperating the issue by directing stream flow into the right bank. This section of Upper Stony Run may be out of the original restoration design area, however, it is included because it is affected by the restoration.
Photo 1. Upper Stony Run. Stable reach at station 24+25.
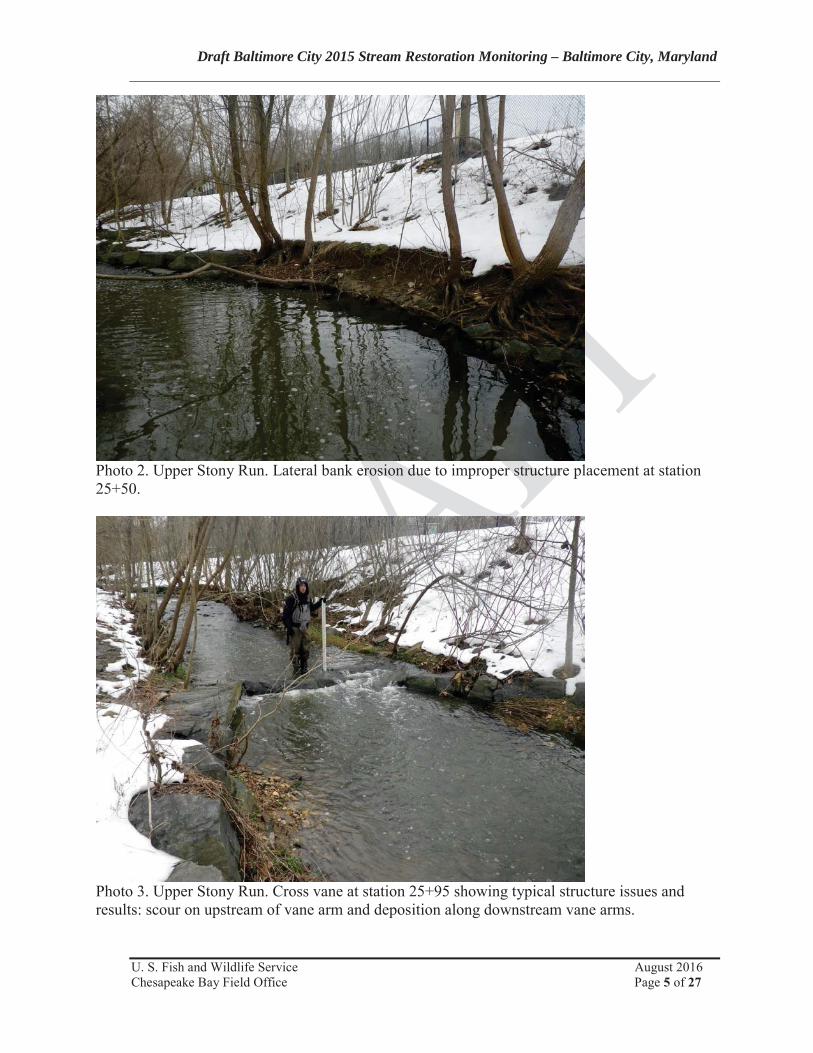
Draft Baltimore City 2015 Stream Restoration Monitoring – Baltimore City, Maryland
U. S. Fish and Wildlife Service August 2016Chesapeake Bay Field Office Page 5 of 27
Photo 2. Upper Stony Run. Lateral bank erosion due to improper structure placement at station 25+50.
Photo 3. Upper Stony Run. Cross vane at station 25+95 showing typical structure issues and results: scour on upstream of vane arm and deposition along downstream vane arms.
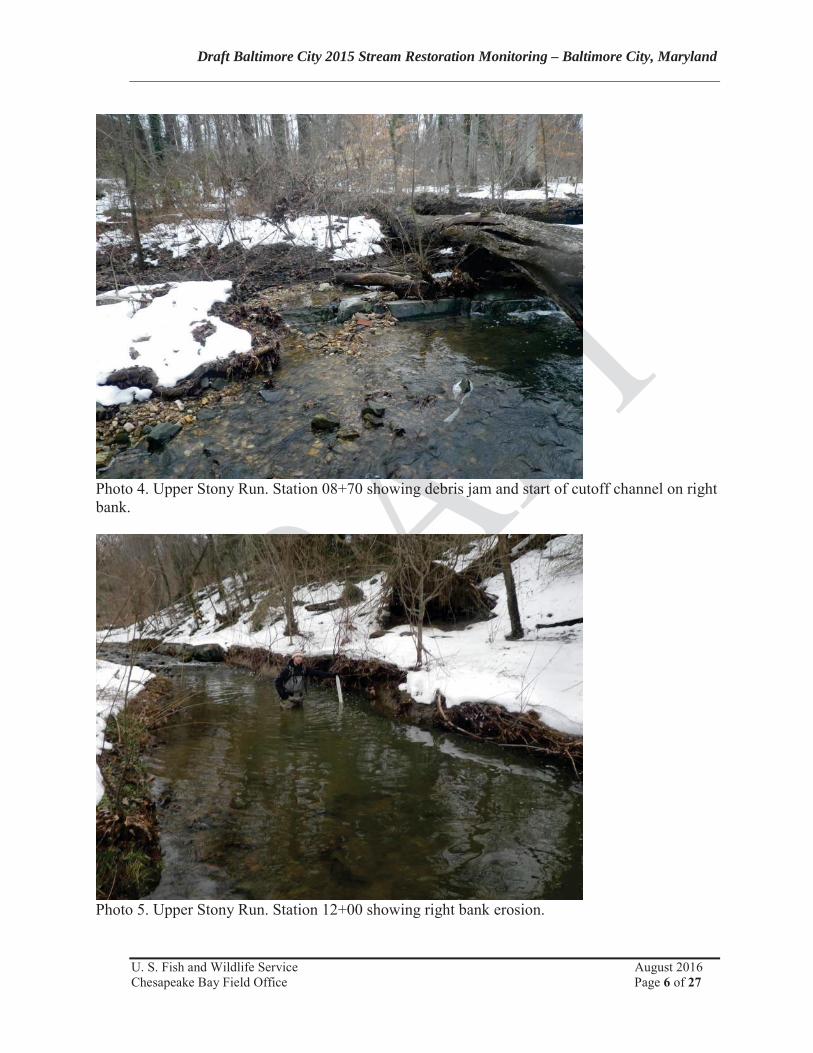
Draft Baltimore City 2015 Stream Restoration Monitoring – Baltimore City, Maryland
U. S. Fish and Wildlife Service August 2016Chesapeake Bay Field Office Page 6 of 27
Photo 4. Upper Stony Run. Station 08+70 showing debris jam and start of cutoff channel on right bank.
Photo 5. Upper Stony Run. Station 12+00 showing right bank erosion.
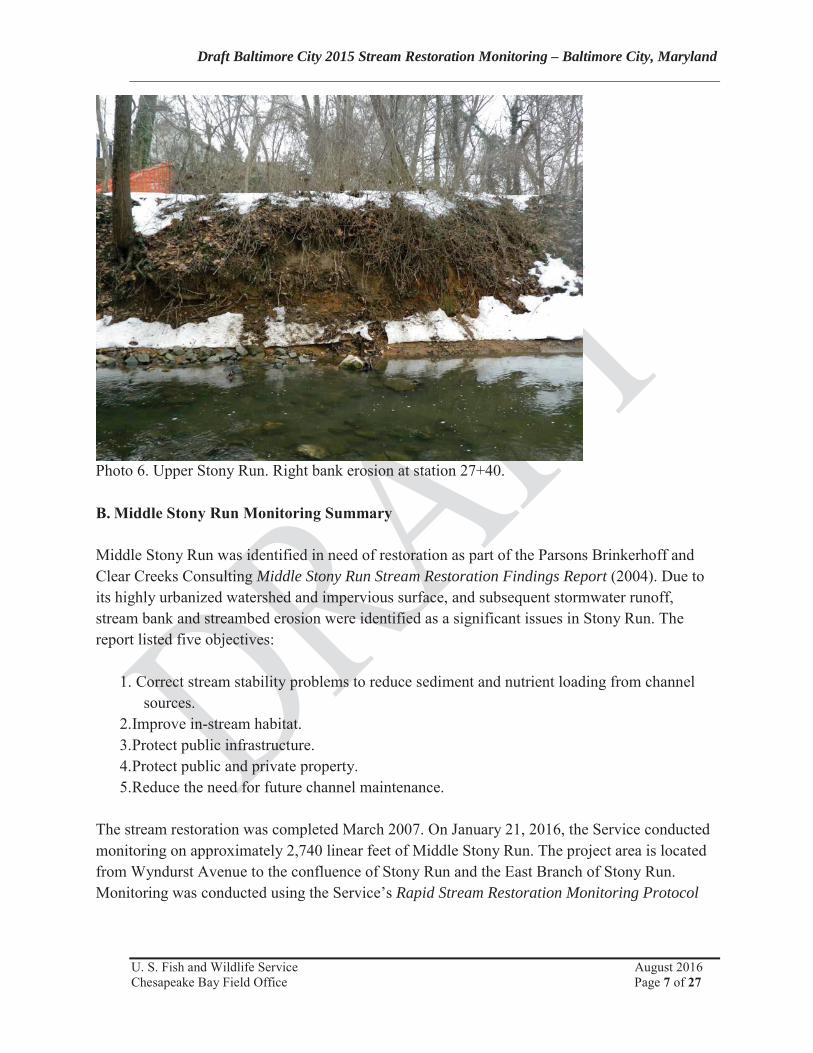
Draft Baltimore City 2015 Stream Restoration Monitoring – Baltimore City, Maryland
U. S. Fish and Wildlife Service August 2016Chesapeake Bay Field Office Page 7 of 27
Photo 6. Upper Stony Run. Right bank erosion at station 27+40.
B. Middle Stony Run Monitoring Summary
Middle Stony Run was identified in need of restoration as part of the Parsons Brinkerhoff and Clear Creeks Consulting Middle Stony Run Stream Restoration Findings Report (2004). Due to its highly urbanized watershed and impervious surface, and subsequent stormwater runoff,stream bank and streambed erosion were identified as a significant issues in Stony Run. The report listed five objectives:
1. Correct stream stability problems to reduce sediment and nutrient loading from channel sources.
2.Improve in-stream habitat.3.Protect public infrastructure.4.Protect public and private property.5.Reduce the need for future channel maintenance.
The stream restoration was completed March 2007. On January 21, 2016, the Service conducted monitoring on approximately 2,740 linear feet of Middle Stony Run. The project area is located from Wyndurst Avenue to the confluence of Stony Run and the East Branch of Stony Run. Monitoring was conducted using the Service’s Rapid Stream Restoration Monitoring Protocol
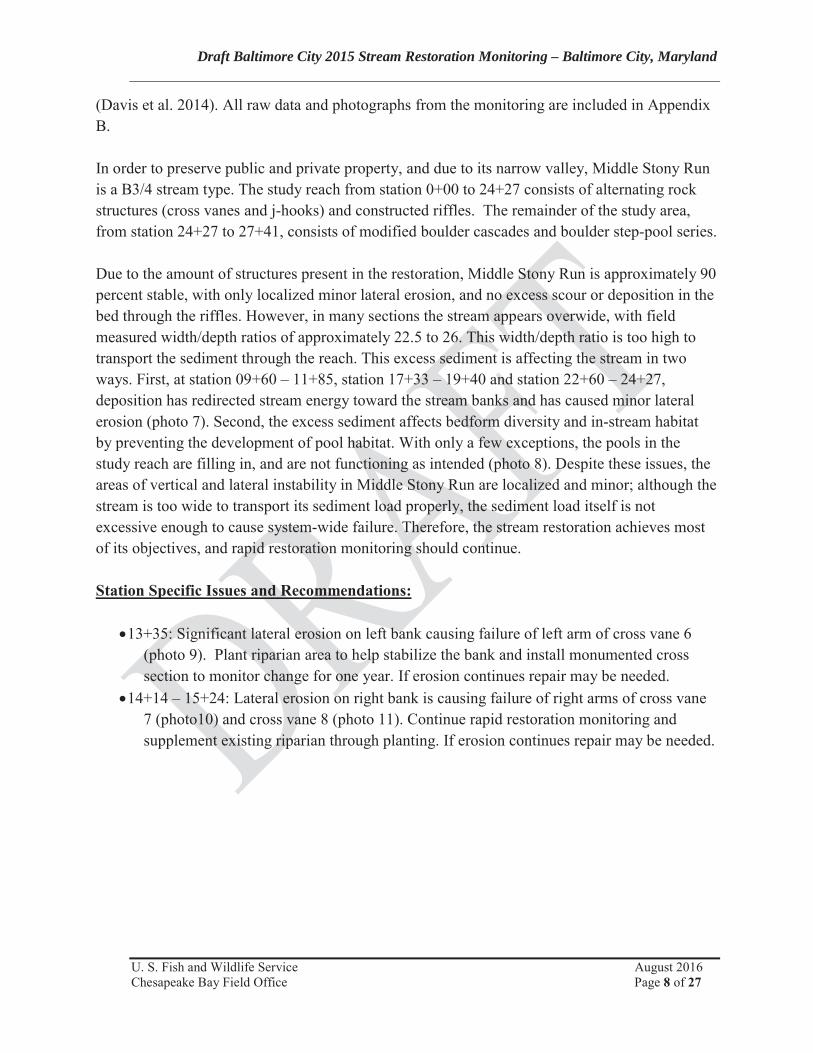
Draft Baltimore City 2015 Stream Restoration Monitoring – Baltimore City, Maryland
U. S. Fish and Wildlife Service August 2016Chesapeake Bay Field Office Page 8 of 27
(Davis et al. 2014). All raw data and photographs from the monitoring are included in Appendix B.
In order to preserve public and private property, and due to its narrow valley, Middle Stony Run is a B3/4 stream type. The study reach from station 0+00 to 24+27 consists of alternating rock structures (cross vanes and j-hooks) and constructed riffles. The remainder of the study area, from station 24+27 to 27+41, consists of modified boulder cascades and boulder step-pool series.
Due to the amount of structures present in the restoration, Middle Stony Run is approximately 90 percent stable, with only localized minor lateral erosion, and no excess scour or deposition in the bed through the riffles. However, in many sections the stream appears overwide, with field measured width/depth ratios of approximately 22.5 to 26. This width/depth ratio is too high to transport the sediment through the reach. This excess sediment is affecting the stream in twoways. First, at station 09+60 – 11+85, station 17+33 – 19+40 and station 22+60 – 24+27,deposition has redirected stream energy toward the stream banks and has caused minor lateral erosion (photo 7). Second, the excess sediment affects bedform diversity and in-stream habitat by preventing the development of pool habitat. With only a few exceptions, the pools in the study reach are filling in, and are not functioning as intended (photo 8). Despite these issues, the areas of vertical and lateral instability in Middle Stony Run are localized and minor; although the stream is too wide to transport its sediment load properly, the sediment load itself is not excessive enough to cause system-wide failure. Therefore, the stream restoration achieves most of its objectives, and rapid restoration monitoring should continue.
Station Specific Issues and Recommendations:
13+35: Significant lateral erosion on left bank causing failure of left arm of cross vane 6 (photo 9). Plant riparian area to help stabilize the bank and install monumented cross section to monitor change for one year. If erosion continues repair may be needed.
14+14 – 15+24: Lateral erosion on right bank is causing failure of right arms of cross vane 7 (photo10) and cross vane 8 (photo 11). Continue rapid restoration monitoring and supplement existing riparian through planting. If erosion continues repair may be needed.
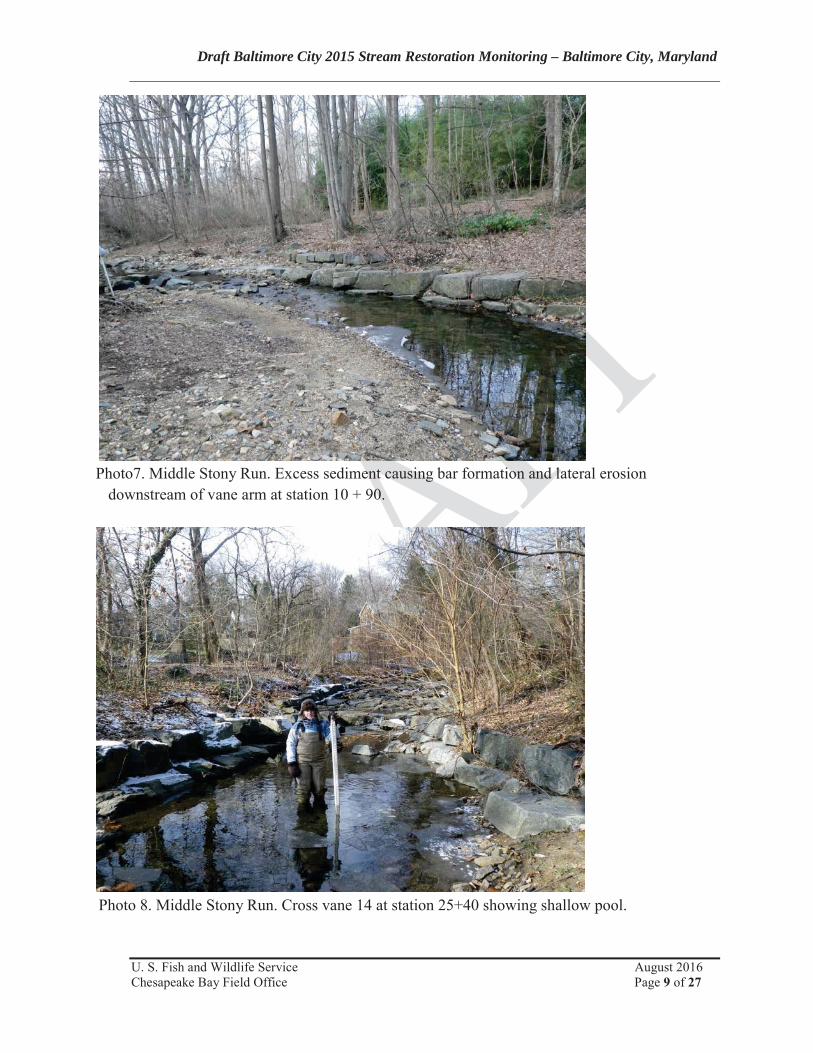
Draft Baltimore City 2015 Stream Restoration Monitoring – Baltimore City, Maryland
U. S. Fish and Wildlife Service August 2016Chesapeake Bay Field Office Page 9 of 27
Photo7. Middle Stony Run. Excess sediment causing bar formation and lateral erosion downstream of vane arm at station 10 + 90.
Photo 8. Middle Stony Run. Cross vane 14 at station 25+40 showing shallow pool.
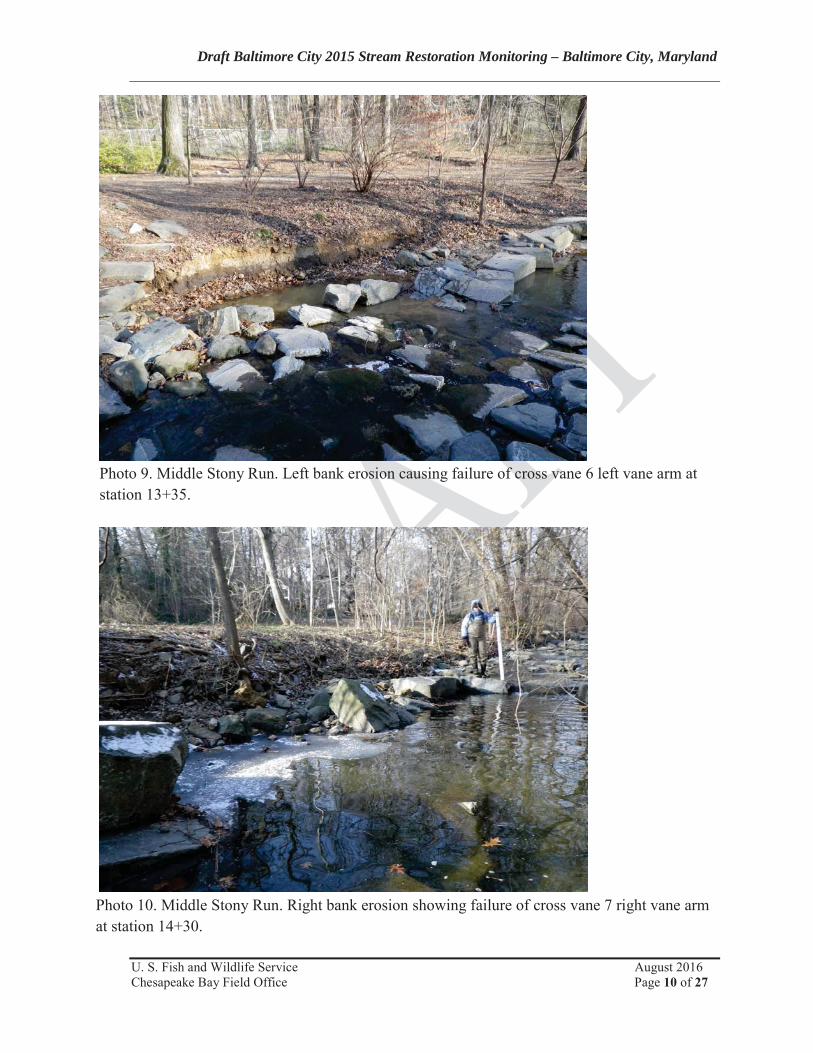
Draft Baltimore City 2015 Stream Restoration Monitoring – Baltimore City, Maryland
U. S. Fish and Wildlife Service August 2016Chesapeake Bay Field Office Page 10 of 27
Photo 9. Middle Stony Run. Left bank erosion causing failure of cross vane 6 left vane arm at station 13+35.
Photo 10. Middle Stony Run. Right bank erosion showing failure of cross vane 7 right vane arm at station 14+30.
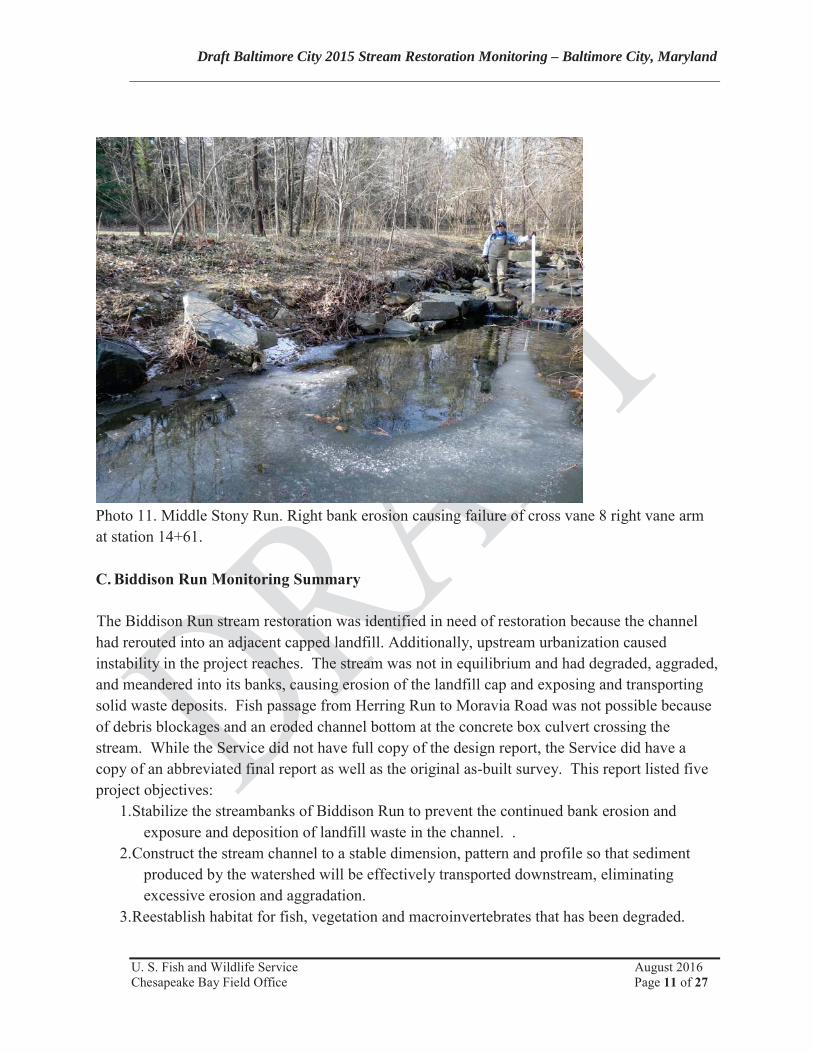
Draft Baltimore City 2015 Stream Restoration Monitoring – Baltimore City, Maryland
U. S. Fish and Wildlife Service August 2016Chesapeake Bay Field Office Page 11 of 27
Photo 11. Middle Stony Run. Right bank erosion causing failure of cross vane 8 right vane arm at station 14+61.
C. Biddison Run Monitoring Summary
The Biddison Run stream restoration was identified in need of restoration because the channel had rerouted into an adjacent capped landfill. Additionally, upstream urbanization causedinstability in the project reaches. The stream was not in equilibrium and had degraded, aggraded, and meandered into its banks, causing erosion of the landfill cap and exposing and transporting solid waste deposits. Fish passage from Herring Run to Moravia Road was not possible because of debris blockages and an eroded channel bottom at the concrete box culvert crossing the stream. While the Service did not have full copy of the design report, the Service did have a copy of an abbreviated final report as well as the original as-built survey. This report listed five project objectives:
1.Stabilize the streambanks of Biddison Run to prevent the continued bank erosion and exposure and deposition of landfill waste in the channel. .
2.Construct the stream channel to a stable dimension, pattern and profile so that sediment produced by the watershed will be effectively transported downstream, eliminating excessive erosion and aggradation.
3.Reestablish habitat for fish, vegetation and macroinvertebrates that has been degraded.
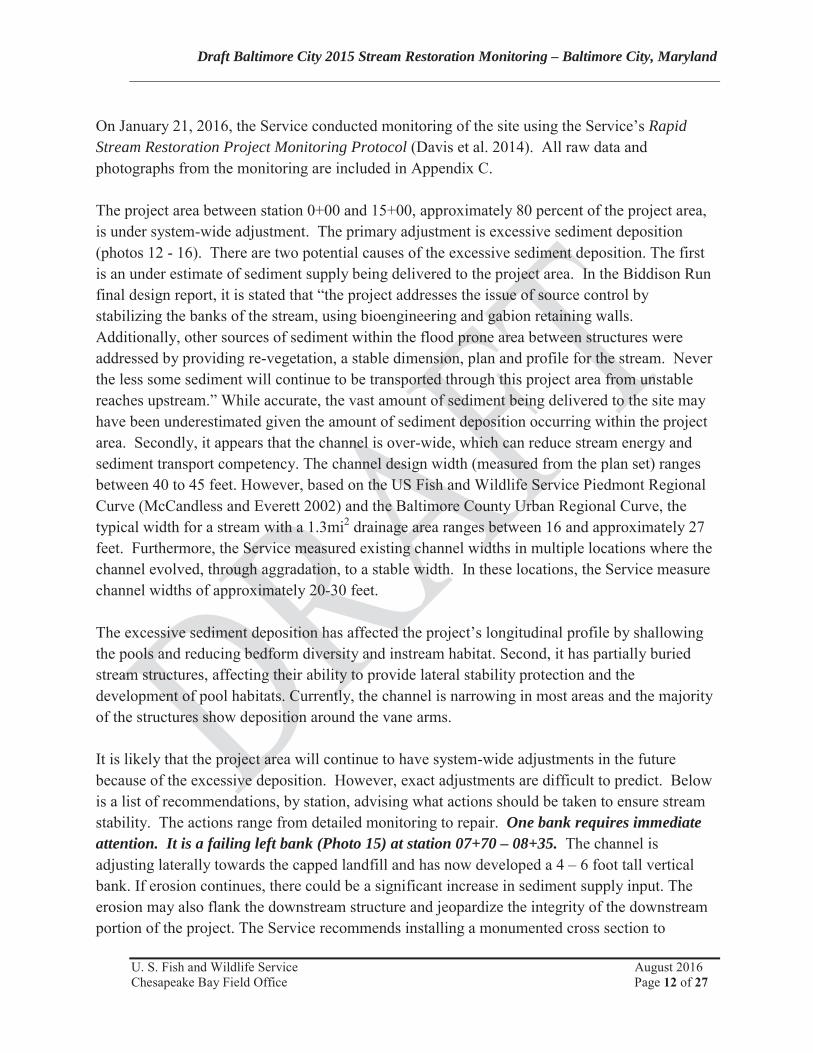
Draft Baltimore City 2015 Stream Restoration Monitoring – Baltimore City, Maryland
U. S. Fish and Wildlife Service August 2016Chesapeake Bay Field Office Page 12 of 27
On January 21, 2016, the Service conducted monitoring of the site using the Service’s Rapid Stream Restoration Project Monitoring Protocol (Davis et al. 2014). All raw data and photographs from the monitoring are included in Appendix C.
The project area between station 0+00 and 15+00, approximately 80 percent of the project area, is under system-wide adjustment. The primary adjustment is excessive sediment deposition (photos 12 - 16). There are two potential causes of the excessive sediment deposition. The first is an under estimate of sediment supply being delivered to the project area. In the Biddison Run final design report, it is stated that “the project addresses the issue of source control by stabilizing the banks of the stream, using bioengineering and gabion retaining walls. Additionally, other sources of sediment within the flood prone area between structures were addressed by providing re-vegetation, a stable dimension, plan and profile for the stream. Never the less some sediment will continue to be transported through this project area from unstable reaches upstream.” While accurate, the vast amount of sediment being delivered to the site may have been underestimated given the amount of sediment deposition occurring within the project area. Secondly, it appears that the channel is over-wide, which can reduce stream energy and sediment transport competency. The channel design width (measured from the plan set) ranges between 40 to 45 feet. However, based on the US Fish and Wildlife Service Piedmont Regional Curve (McCandless and Everett 2002) and the Baltimore County Urban Regional Curve, the typical width for a stream with a 1.3mi2 drainage area ranges between 16 and approximately 27feet. Furthermore, the Service measured existing channel widths in multiple locations where the channel evolved, through aggradation, to a stable width. In these locations, the Service measure channel widths of approximately 20-30 feet.
The excessive sediment deposition has affected the project’s longitudinal profile by shallowing the pools and reducing bedform diversity and instream habitat. Second, it has partially buried stream structures, affecting their ability to provide lateral stability protection and the development of pool habitats. Currently, the channel is narrowing in most areas and the majority of the structures show deposition around the vane arms.
It is likely that the project area will continue to have system-wide adjustments in the future because of the excessive deposition. However, exact adjustments are difficult to predict. Below is a list of recommendations, by station, advising what actions should be taken to ensure stream stability. The actions range from detailed monitoring to repair. One bank requires immediate attention. It is a failing left bank (Photo 15) at station 07+70 – 08+35. The channel is adjusting laterally towards the capped landfill and has now developed a 4 – 6 foot tall vertical bank. If erosion continues, there could be a significant increase in sediment supply input. The erosion may also flank the downstream structure and jeopardize the integrity of the downstream portion of the project. The Service recommends installing a monumented cross section to
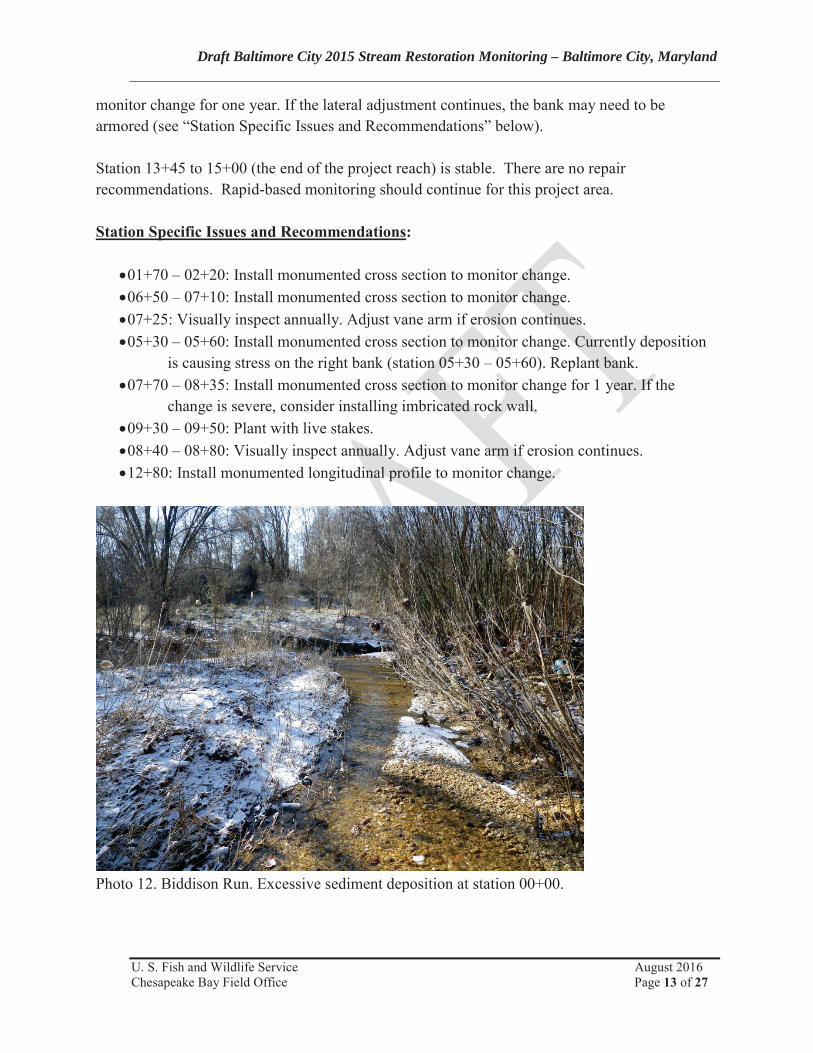
Draft Baltimore City 2015 Stream Restoration Monitoring – Baltimore City, Maryland
U. S. Fish and Wildlife Service August 2016Chesapeake Bay Field Office Page 13 of 27
monitor change for one year. If the lateral adjustment continues, the bank may need to be armored (see “Station Specific Issues and Recommendations” below).
Station 13+45 to 15+00 (the end of the project reach) is stable. There are no repair recommendations. Rapid-based monitoring should continue for this project area.
Station Specific Issues and Recommendations:
01+70 – 02+20: Install monumented cross section to monitor change.06+50 – 07+10: Install monumented cross section to monitor change.07+25: Visually inspect annually. Adjust vane arm if erosion continues.05+30 – 05+60: Install monumented cross section to monitor change. Currently deposition
is causing stress on the right bank (station 05+30 – 05+60). Replant bank.07+70 – 08+35: Install monumented cross section to monitor change for 1 year. If the
change is severe, consider installing imbricated rock wall.09+30 – 09+50: Plant with live stakes.08+40 – 08+80: Visually inspect annually. Adjust vane arm if erosion continues.12+80: Install monumented longitudinal profile to monitor change.
Photo 12. Biddison Run. Excessive sediment deposition at station 00+00.
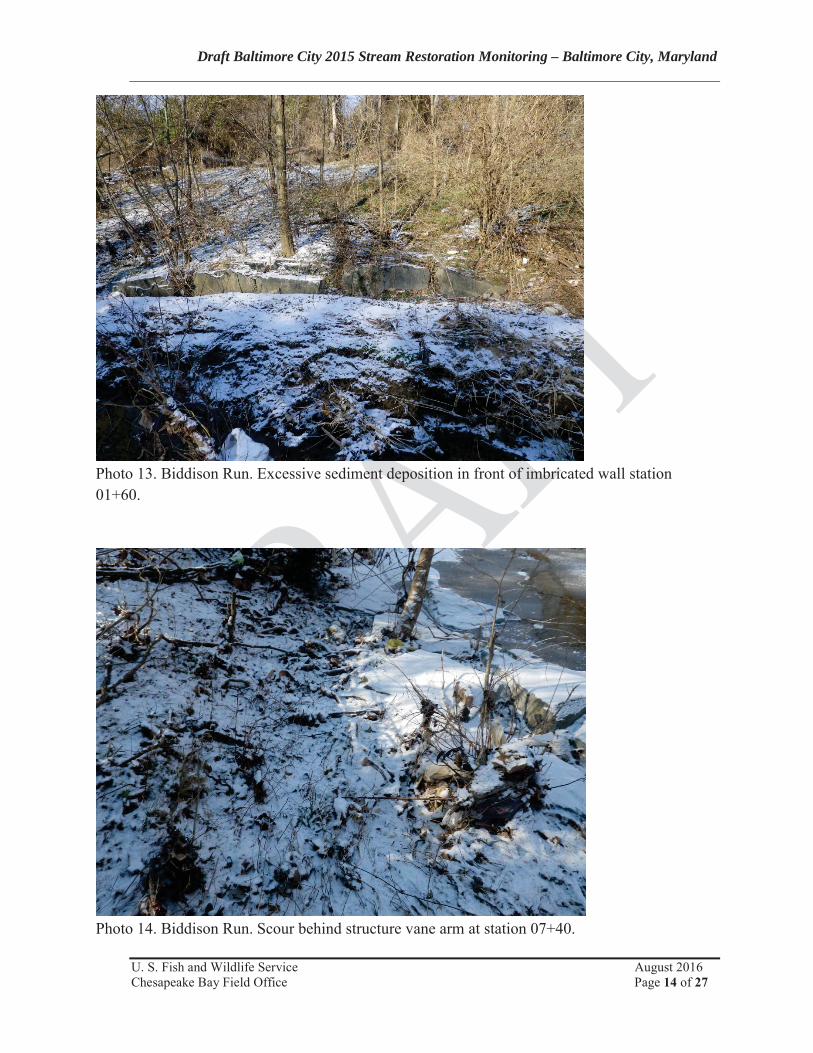
Draft Baltimore City 2015 Stream Restoration Monitoring – Baltimore City, Maryland
U. S. Fish and Wildlife Service August 2016Chesapeake Bay Field Office Page 14 of 27
Photo 13. Biddison Run. Excessive sediment deposition in front of imbricated wall station01+60.
Photo 14. Biddison Run. Scour behind structure vane arm at station 07+40.
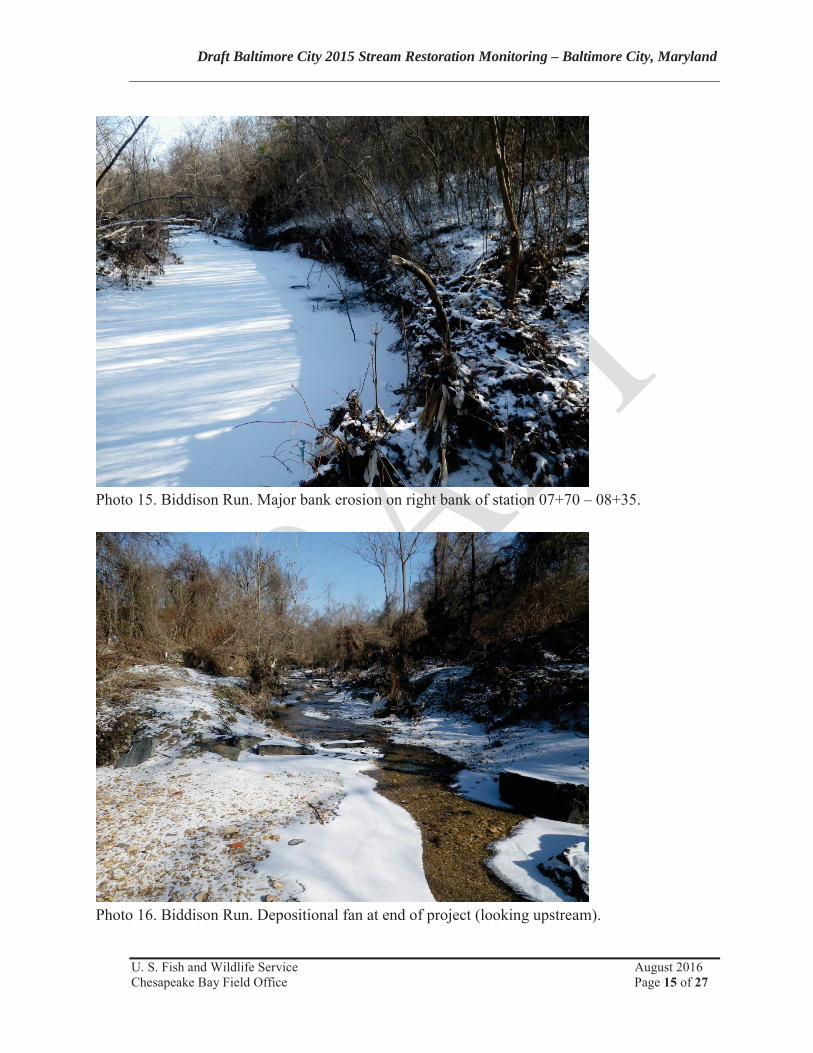
Draft Baltimore City 2015 Stream Restoration Monitoring – Baltimore City, Maryland
U. S. Fish and Wildlife Service August 2016Chesapeake Bay Field Office Page 15 of 27
Photo 15. Biddison Run. Major bank erosion on right bank of station 07+70 – 08+35.
Photo 16. Biddison Run. Depositional fan at end of project (looking upstream).
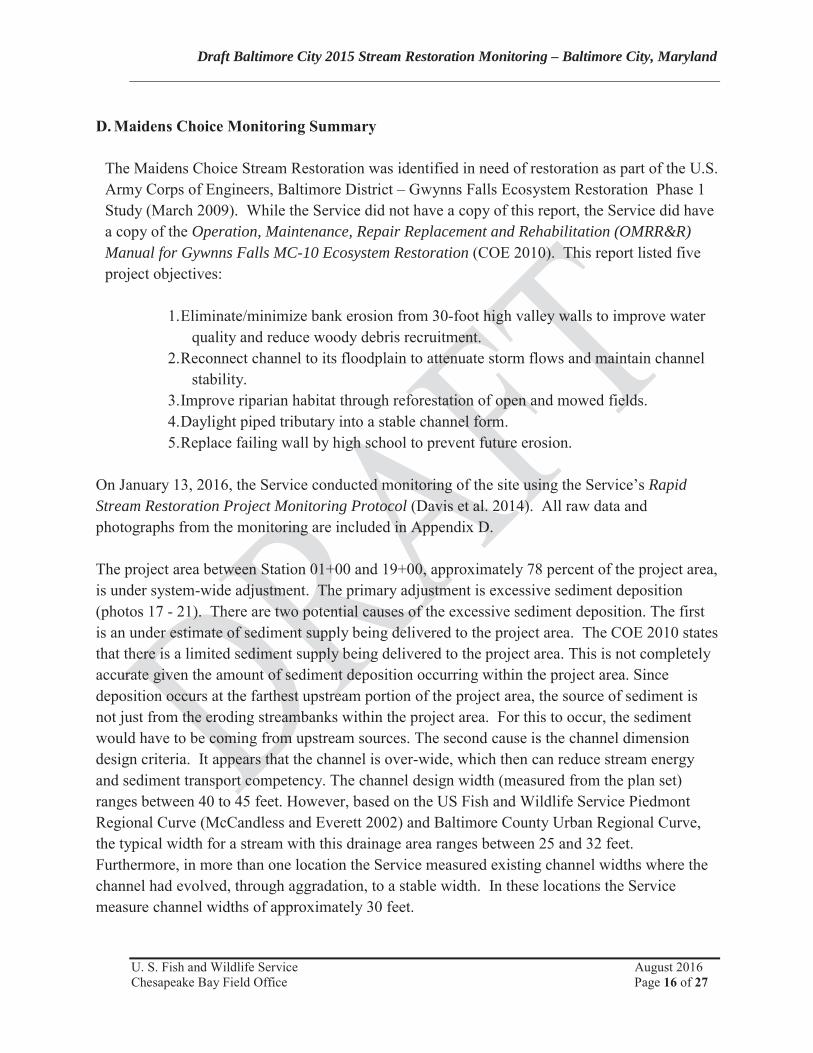
Draft Baltimore City 2015 Stream Restoration Monitoring – Baltimore City, Maryland
U. S. Fish and Wildlife Service August 2016Chesapeake Bay Field Office Page 16 of 27
D. Maidens Choice Monitoring Summary
The Maidens Choice Stream Restoration was identified in need of restoration as part of the U.S. Army Corps of Engineers, Baltimore District – Gwynns Falls Ecosystem Restoration Phase 1 Study (March 2009). While the Service did not have a copy of this report, the Service did have a copy of the Operation, Maintenance, Repair Replacement and Rehabilitation (OMRR&R) Manual for Gywnns Falls MC-10 Ecosystem Restoration (COE 2010). This report listed five project objectives:
1.Eliminate/minimize bank erosion from 30-foot high valley walls to improve water quality and reduce woody debris recruitment.
2.Reconnect channel to its floodplain to attenuate storm flows and maintain channel stability.
3.Improve riparian habitat through reforestation of open and mowed fields.4.Daylight piped tributary into a stable channel form.5.Replace failing wall by high school to prevent future erosion.
On January 13, 2016, the Service conducted monitoring of the site using the Service’s Rapid Stream Restoration Project Monitoring Protocol (Davis et al. 2014). All raw data andphotographs from the monitoring are included in Appendix D.
The project area between Station 01+00 and 19+00, approximately 78 percent of the project area, is under system-wide adjustment. The primary adjustment is excessive sediment deposition (photos 17 - 21). There are two potential causes of the excessive sediment deposition. The first is an under estimate of sediment supply being delivered to the project area. The COE 2010 statesthat there is a limited sediment supply being delivered to the project area. This is not completely accurate given the amount of sediment deposition occurring within the project area. Since deposition occurs at the farthest upstream portion of the project area, the source of sediment is not just from the eroding streambanks within the project area. For this to occur, the sediment would have to be coming from upstream sources. The second cause is the channel dimension design criteria. It appears that the channel is over-wide, which then can reduce stream energy and sediment transport competency. The channel design width (measured from the plan set) ranges between 40 to 45 feet. However, based on the US Fish and Wildlife Service Piedmont Regional Curve (McCandless and Everett 2002) and Baltimore County Urban Regional Curve,the typical width for a stream with this drainage area ranges between 25 and 32 feet. Furthermore, in more than one location the Service measured existing channel widths where the channel had evolved, through aggradation, to a stable width. In these locations the Service measure channel widths of approximately 30 feet.
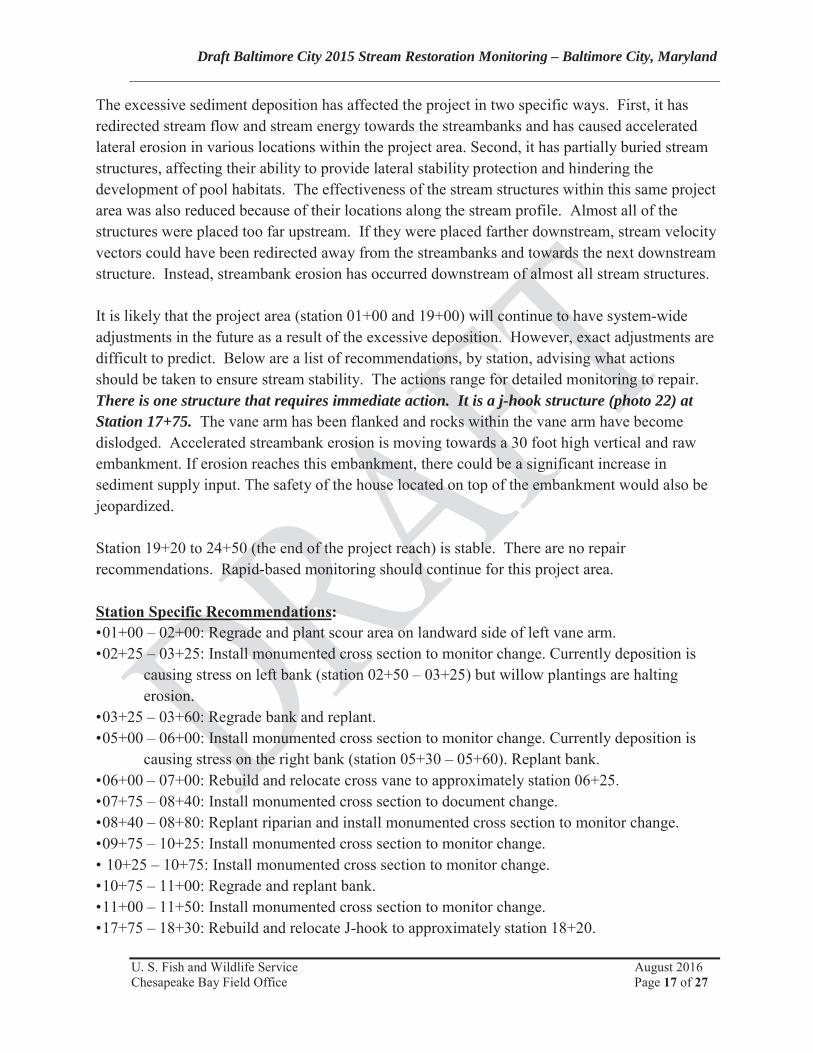
Draft Baltimore City 2015 Stream Restoration Monitoring – Baltimore City, Maryland
U. S. Fish and Wildlife Service August 2016Chesapeake Bay Field Office Page 17 of 27
The excessive sediment deposition has affected the project in two specific ways. First, it has redirected stream flow and stream energy towards the streambanks and has caused acceleratedlateral erosion in various locations within the project area. Second, it has partially buried stream structures, affecting their ability to provide lateral stability protection and hindering thedevelopment of pool habitats. The effectiveness of the stream structures within this same project area was also reduced because of their locations along the stream profile. Almost all of the structures were placed too far upstream. If they were placed farther downstream, stream velocity vectors could have been redirected away from the streambanks and towards the next downstream structure. Instead, streambank erosion has occurred downstream of almost all stream structures.
It is likely that the project area (station 01+00 and 19+00) will continue to have system-wide adjustments in the future as a result of the excessive deposition. However, exact adjustments are difficult to predict. Below are a list of recommendations, by station, advising what actions should be taken to ensure stream stability. The actions range for detailed monitoring to repair. There is one structure that requires immediate action. It is a j-hook structure (photo 22) at Station 17+75. The vane arm has been flanked and rocks within the vane arm have become dislodged. Accelerated streambank erosion is moving towards a 30 foot high vertical and raw embankment. If erosion reaches this embankment, there could be a significant increase in sediment supply input. The safety of the house located on top of the embankment would also be jeopardized.
Station 19+20 to 24+50 (the end of the project reach) is stable. There are no repair recommendations. Rapid-based monitoring should continue for this project area.
Station Specific Recommendations:•01+00 – 02+00: Regrade and plant scour area on landward side of left vane arm.•02+25 – 03+25: Install monumented cross section to monitor change. Currently deposition is
causing stress on left bank (station 02+50 – 03+25) but willow plantings are halting erosion.
•03+25 – 03+60: Regrade bank and replant.•05+00 – 06+00: Install monumented cross section to monitor change. Currently deposition is
causing stress on the right bank (station 05+30 – 05+60). Replant bank.•06+00 – 07+00: Rebuild and relocate cross vane to approximately station 06+25.•07+75 – 08+40: Install monumented cross section to document change.•08+40 – 08+80: Replant riparian and install monumented cross section to monitor change.•09+75 – 10+25: Install monumented cross section to monitor change.• 10+25 – 10+75: Install monumented cross section to monitor change.•10+75 – 11+00: Regrade and replant bank.•11+00 – 11+50: Install monumented cross section to monitor change.•17+75 – 18+30: Rebuild and relocate J-hook to approximately station 18+20.
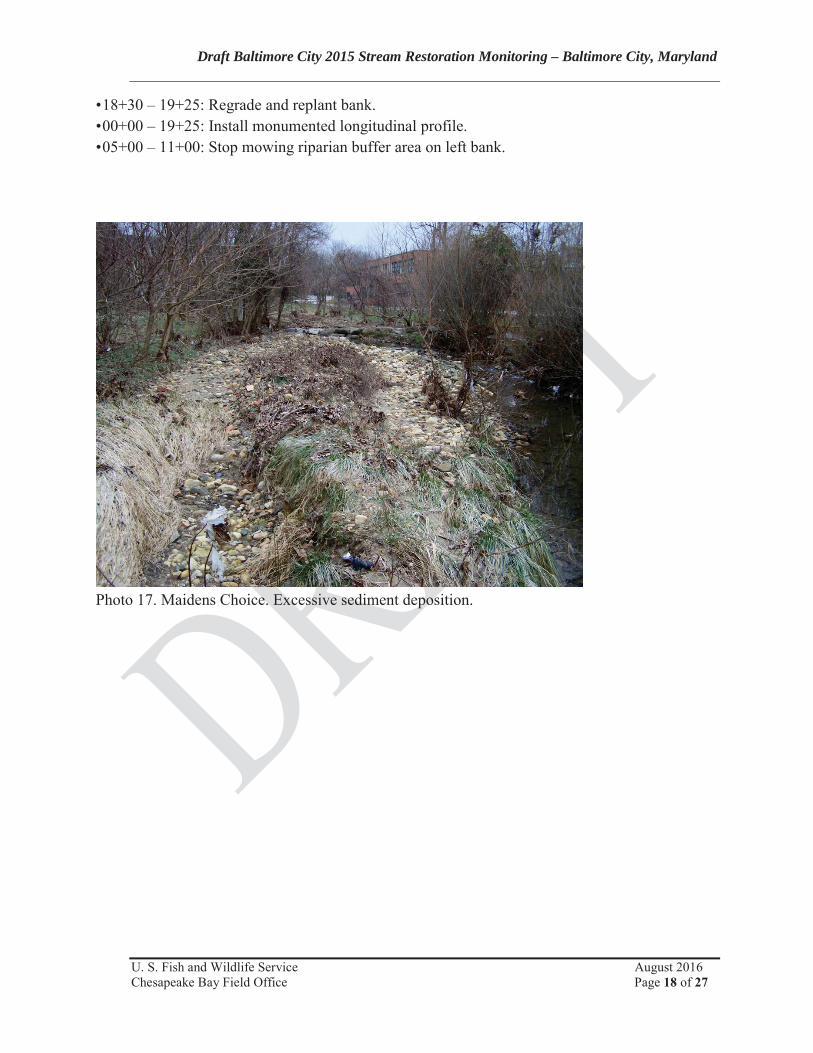
Draft Baltimore City 2015 Stream Restoration Monitoring – Baltimore City, Maryland
U. S. Fish and Wildlife Service August 2016Chesapeake Bay Field Office Page 18 of 27
•18+30 – 19+25: Regrade and replant bank.•00+00 – 19+25: Install monumented longitudinal profile.•05+00 – 11+00: Stop mowing riparian buffer area on left bank.
Photo 17. Maidens Choice. Excessive sediment deposition.
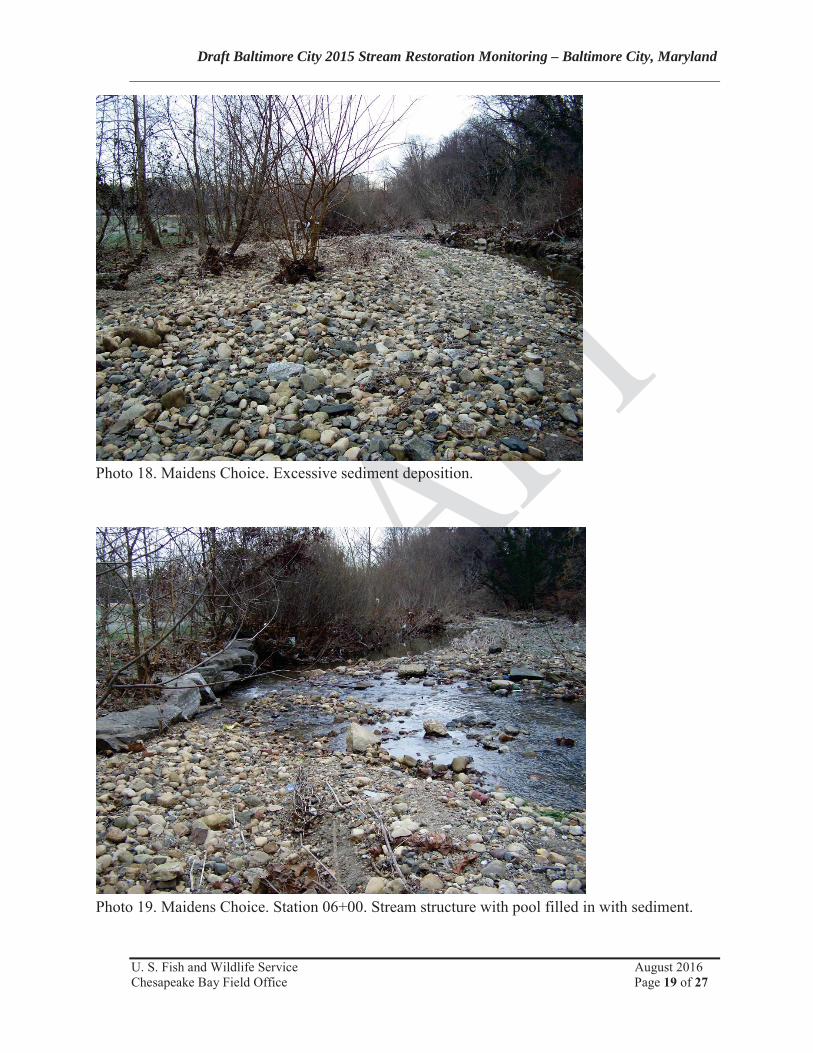
Draft Baltimore City 2015 Stream Restoration Monitoring – Baltimore City, Maryland
U. S. Fish and Wildlife Service August 2016Chesapeake Bay Field Office Page 19 of 27
Photo 18. Maidens Choice. Excessive sediment deposition.
Photo 19. Maidens Choice. Station 06+00. Stream structure with pool filled in with sediment.
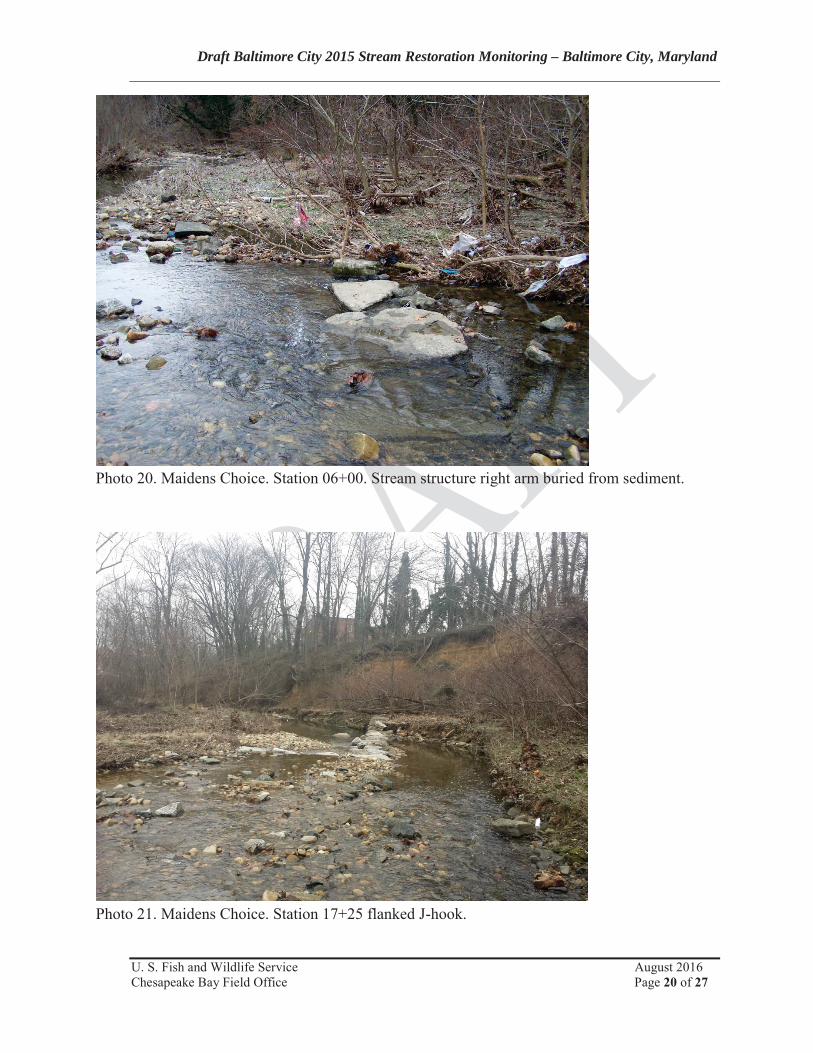
Draft Baltimore City 2015 Stream Restoration Monitoring – Baltimore City, Maryland
U. S. Fish and Wildlife Service August 2016Chesapeake Bay Field Office Page 20 of 27
Photo 20. Maidens Choice. Station 06+00. Stream structure right arm buried from sediment.
Photo 21. Maidens Choice. Station 17+25 flanked J-hook.
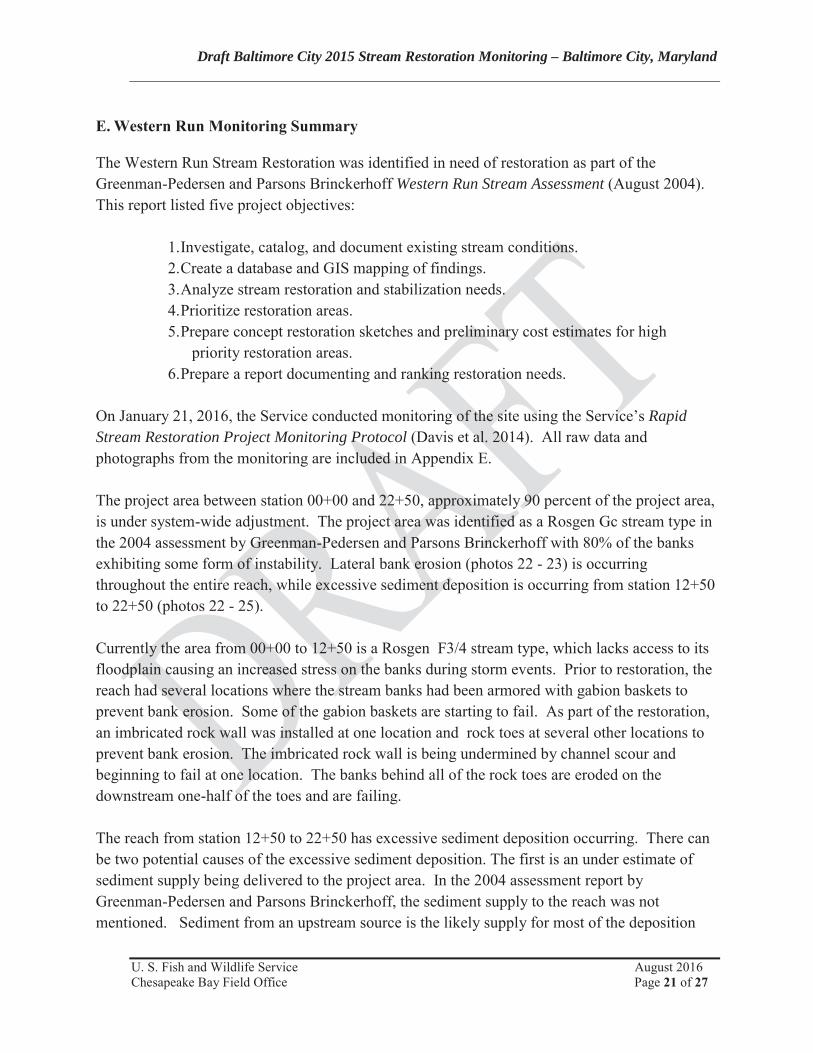
Draft Baltimore City 2015 Stream Restoration Monitoring – Baltimore City, Maryland
U. S. Fish and Wildlife Service August 2016Chesapeake Bay Field Office Page 21 of 27
E. Western Run Monitoring Summary
The Western Run Stream Restoration was identified in need of restoration as part of the Greenman-Pedersen and Parsons Brinckerhoff Western Run Stream Assessment (August 2004). This report listed five project objectives:
1.Investigate, catalog, and document existing stream conditions.2.Create a database and GIS mapping of findings.3.Analyze stream restoration and stabilization needs.4.Prioritize restoration areas.5.Prepare concept restoration sketches and preliminary cost estimates for high
priority restoration areas.6.Prepare a report documenting and ranking restoration needs.
On January 21, 2016, the Service conducted monitoring of the site using the Service’s Rapid Stream Restoration Project Monitoring Protocol (Davis et al. 2014). All raw data and photographs from the monitoring are included in Appendix E.
The project area between station 00+00 and 22+50, approximately 90 percent of the project area, is under system-wide adjustment. The project area was identified as a Rosgen Gc stream type in the 2004 assessment by Greenman-Pedersen and Parsons Brinckerhoff with 80% of the banks exhibiting some form of instability. Lateral bank erosion (photos 22 - 23) is occurring throughout the entire reach, while excessive sediment deposition is occurring from station 12+50 to 22+50 (photos 22 - 25).
Currently the area from 00+00 to 12+50 is a Rosgen F3/4 stream type, which lacks access to its floodplain causing an increased stress on the banks during storm events. Prior to restoration, the reach had several locations where the stream banks had been armored with gabion baskets to prevent bank erosion. Some of the gabion baskets are starting to fail. As part of the restoration, an imbricated rock wall was installed at one location and rock toes at several other locations to prevent bank erosion. The imbricated rock wall is being undermined by channel scour and beginning to fail at one location. The banks behind all of the rock toes are eroded on the downstream one-half of the toes and are failing.
The reach from station 12+50 to 22+50 has excessive sediment deposition occurring. There can be two potential causes of the excessive sediment deposition. The first is an under estimate of sediment supply being delivered to the project area. In the 2004 assessment report by Greenman-Pedersen and Parsons Brinckerhoff, the sediment supply to the reach was not mentioned. Sediment from an upstream source is the likely supply for most of the deposition
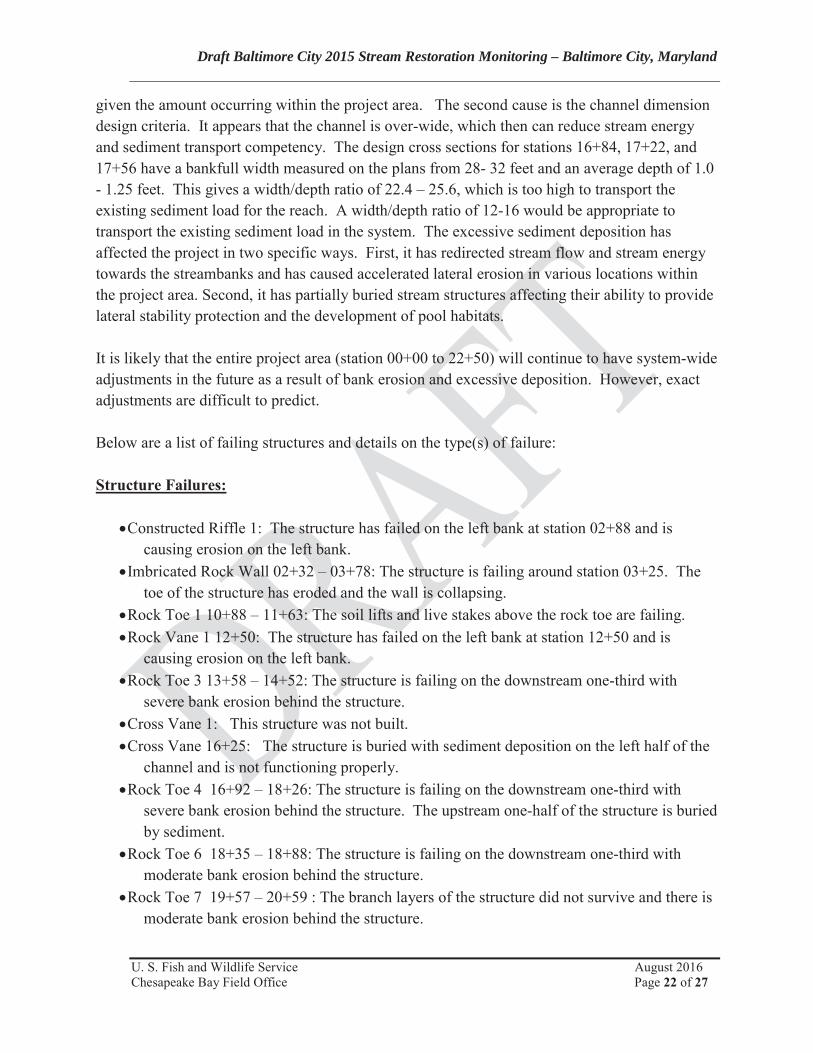
Draft Baltimore City 2015 Stream Restoration Monitoring – Baltimore City, Maryland
U. S. Fish and Wildlife Service August 2016Chesapeake Bay Field Office Page 22 of 27
given the amount occurring within the project area. The second cause is the channel dimension design criteria. It appears that the channel is over-wide, which then can reduce stream energy and sediment transport competency. The design cross sections for stations 16+84, 17+22, and 17+56 have a bankfull width measured on the plans from 28- 32 feet and an average depth of 1.0 - 1.25 feet. This gives a width/depth ratio of 22.4 – 25.6, which is too high to transport the existing sediment load for the reach. A width/depth ratio of 12-16 would be appropriate to transport the existing sediment load in the system. The excessive sediment deposition has affected the project in two specific ways. First, it has redirected stream flow and stream energy towards the streambanks and has caused accelerated lateral erosion in various locations within the project area. Second, it has partially buried stream structures affecting their ability to provide lateral stability protection and the development of pool habitats.
It is likely that the entire project area (station 00+00 to 22+50) will continue to have system-wide adjustments in the future as a result of bank erosion and excessive deposition. However, exact adjustments are difficult to predict.
Below are a list of failing structures and details on the type(s) of failure:
Structure Failures:
Constructed Riffle 1: The structure has failed on the left bank at station 02+88 and is causing erosion on the left bank.
Imbricated Rock Wall 02+32 – 03+78: The structure is failing around station 03+25. The toe of the structure has eroded and the wall is collapsing.
Rock Toe 1 10+88 – 11+63: The soil lifts and live stakes above the rock toe are failing.Rock Vane 1 12+50: The structure has failed on the left bank at station 12+50 and is
causing erosion on the left bank.Rock Toe 3 13+58 – 14+52: The structure is failing on the downstream one-third with
severe bank erosion behind the structure. Cross Vane 1: This structure was not built.Cross Vane 16+25: The structure is buried with sediment deposition on the left half of the
channel and is not functioning properly.Rock Toe 4 16+92 – 18+26: The structure is failing on the downstream one-third with
severe bank erosion behind the structure. The upstream one-half of the structure is buried by sediment.
Rock Toe 6 18+35 – 18+88: The structure is failing on the downstream one-third with moderate bank erosion behind the structure.
Rock Toe 7 19+57 – 20+59 : The branch layers of the structure did not survive and there is moderate bank erosion behind the structure.
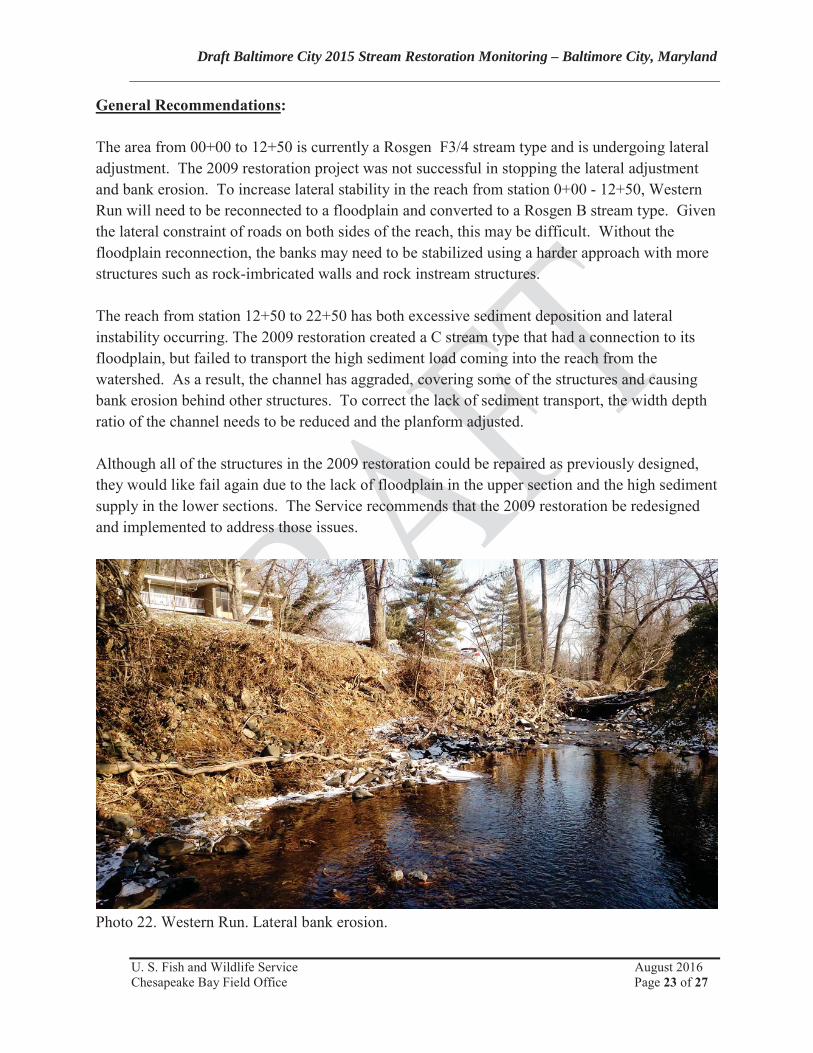
Draft Baltimore City 2015 Stream Restoration Monitoring – Baltimore City, Maryland
U. S. Fish and Wildlife Service August 2016Chesapeake Bay Field Office Page 23 of 27
General Recommendations:
The area from 00+00 to 12+50 is currently a Rosgen F3/4 stream type and is undergoing lateral adjustment. The 2009 restoration project was not successful in stopping the lateral adjustment and bank erosion. To increase lateral stability in the reach from station 0+00 - 12+50, Western Run will need to be reconnected to a floodplain and converted to a Rosgen B stream type. Given the lateral constraint of roads on both sides of the reach, this may be difficult. Without the floodplain reconnection, the banks may need to be stabilized using a harder approach with more structures such as rock-imbricated walls and rock instream structures.
The reach from station 12+50 to 22+50 has both excessive sediment deposition and lateral instability occurring. The 2009 restoration created a C stream type that had a connection to its floodplain, but failed to transport the high sediment load coming into the reach from the watershed. As a result, the channel has aggraded, covering some of the structures and causing bank erosion behind other structures. To correct the lack of sediment transport, the width depth ratio of the channel needs to be reduced and the planform adjusted.
Although all of the structures in the 2009 restoration could be repaired as previously designed, they would like fail again due to the lack of floodplain in the upper section and the high sediment supply in the lower sections. The Service recommends that the 2009 restoration be redesigned and implemented to address those issues.
Photo 22. Western Run. Lateral bank erosion.
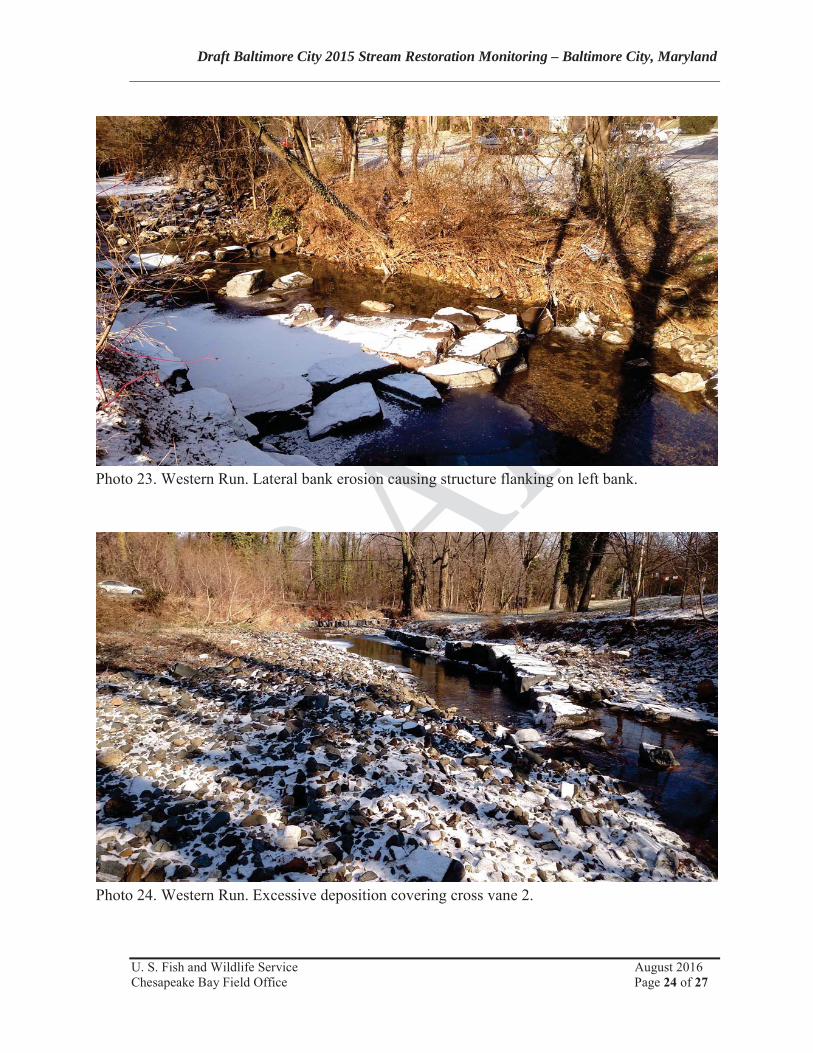
Draft Baltimore City 2015 Stream Restoration Monitoring – Baltimore City, Maryland
U. S. Fish and Wildlife Service August 2016Chesapeake Bay Field Office Page 24 of 27
Photo 23. Western Run. Lateral bank erosion causing structure flanking on left bank.
Photo 24. Western Run. Excessive deposition covering cross vane 2.
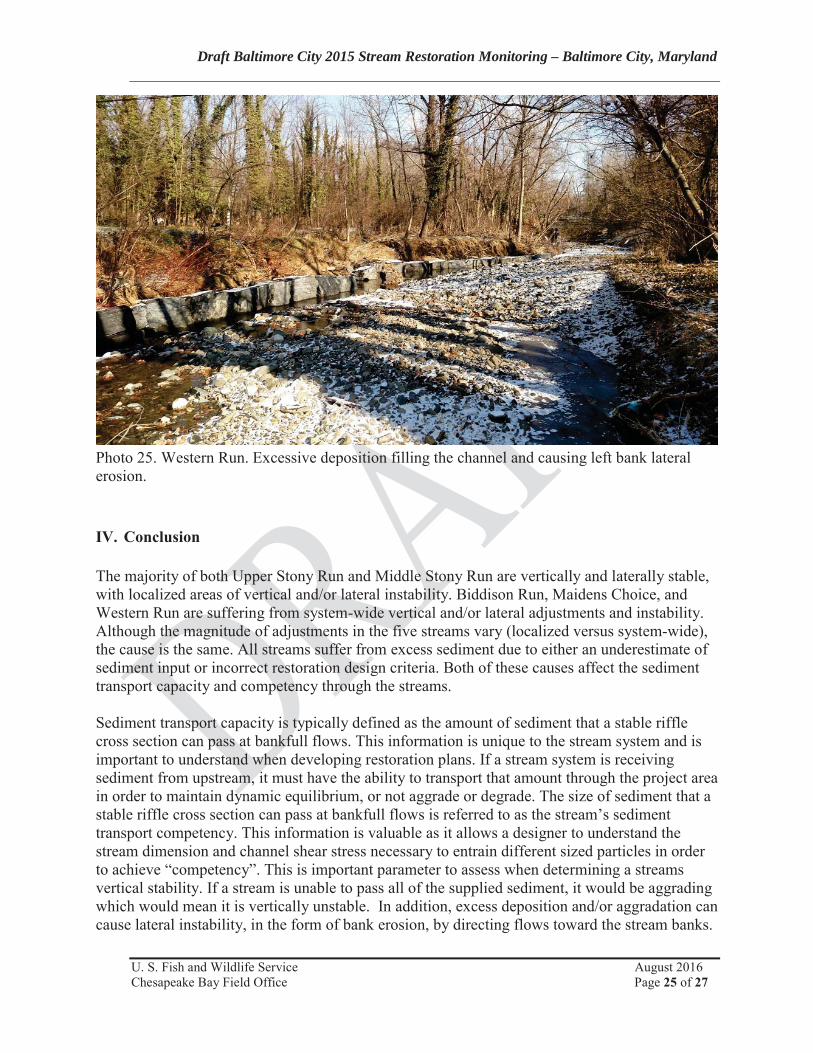
Draft Baltimore City 2015 Stream Restoration Monitoring – Baltimore City, Maryland
U. S. Fish and Wildlife Service August 2016Chesapeake Bay Field Office Page 25 of 27
Photo 25. Western Run. Excessive deposition filling the channel and causing left bank lateral erosion.
IV. Conclusion
The majority of both Upper Stony Run and Middle Stony Run are vertically and laterally stable, with localized areas of vertical and/or lateral instability. Biddison Run, Maidens Choice, and Western Run are suffering from system-wide vertical and/or lateral adjustments and instability. Although the magnitude of adjustments in the five streams vary (localized versus system-wide), the cause is the same. All streams suffer from excess sediment due to either an underestimate of sediment input or incorrect restoration design criteria. Both of these causes affect the sediment transport capacity and competency through the streams.
Sediment transport capacity is typically defined as the amount of sediment that a stable riffle cross section can pass at bankfull flows. This information is unique to the stream system and is important to understand when developing restoration plans. If a stream system is receiving sediment from upstream, it must have the ability to transport that amount through the project area in order to maintain dynamic equilibrium, or not aggrade or degrade. The size of sediment that a stable riffle cross section can pass at bankfull flows is referred to as the stream’s sediment transport competency. This information is valuable as it allows a designer to understand the stream dimension and channel shear stress necessary to entrain different sized particles in order to achieve “competency”. This is important parameter to assess when determining a streams vertical stability. If a stream is unable to pass all of the supplied sediment, it would be aggrading which would mean it is vertically unstable. In addition, excess deposition and/or aggradation can cause lateral instability, in the form of bank erosion, by directing flows toward the stream banks.
Draft Baltimore City 2015 Stream Restoration Monitoring – Baltimore City, Maryland
U. S. Fish and Wildlife Service August 2016Chesapeake Bay Field Office Page 26 of 27
In order for a stream restoration to have sufficient sediment capacity and competency, and therefore not aggrade or degrade, the restorations must be designed to allow the sediment to be properly passed downstream, without excess deposition or erosion. The proper design criteria (i.e. stream dimensions such as width/depth ratio) are crucial in providing conditions conducive to sediment capacity and competence. In addition, the proper design and placement of structures within the design provide additional lateral and vertical protection.
All of the stream restoration projects assessed had some degree of incorrect design criteria (particularly a high width/depth ratio, which results in excess deposition) and incorrect design and placement of instream structures. The overall and site-specific recommendations in Sections A-E of this report will assist the City in either remedying the problems identified, or monitoring the rate of change over time. In addition to the site-specific recommendations, the Service recommends continuing rapid assessments of the five restoration projects on a yearly basis to monitor for additional change.
.
Draft Baltimore City 2015 Stream Restoration Monitoring – Baltimore City, Maryland
U. S. Fish and Wildlife Service August 2016Chesapeake Bay Field Office Page 27 of 27
LITERATURE CITED
1.Davis S., R. Starr, and C.Eng. 2014. Rapid Stream Restoration Monitoring Protocol. U.S. Fish and Wildlife Service, Annapolis, MD. CBFO-S14-01.
2. Greenman-Pedersen, Inc. and Parsons Brinckerhoff. 2004. Western Run Stream Assessment. Baltimore, MD.
3.Harman, W.,R. Starr, M. Carter, K. Tweedy, M. Clemmons, K. Suggs, C. Miller. 2012. A Function-Based Framework for Stream Assessment and Restoration Projects. U.S. Environmental Protection Agency, Office of Wetlands, Oceans, and Watersheds. Washington, D.C. EPA 843-K-12-006.
4.McCandless, T.L. and R.A. Everett. 2002. Maryland stream survey: Bankfull discharge and channel characteristics in the Piedmont hydrologic region. U.S. Fish and Wildlife Service, Annapolis, MD. CBFO-S02-02.
5. Parsons Brinckerhoff and Clear Creeks Consulting. 2004. Middle Stony Run Stream Restoration Findings Report (30% Submission). Baltimore, MD.
6.U.S. Army Corps of Engineers. 2010. Operation, Maintenance, Repair Replacement and Rehabilitation (OMRR&R) Manual for Gywnns Falls MC-10 Ecosystem Restoration.U.S. Army Corps of Engineers, Baltimore District, Baltimore, MD.
Appendix H: Watershed Protection and Restoration Program AnnualReport Table for FY 2016(electronic files only)
Appendix I: Illicit Discharge Detection and Elimination
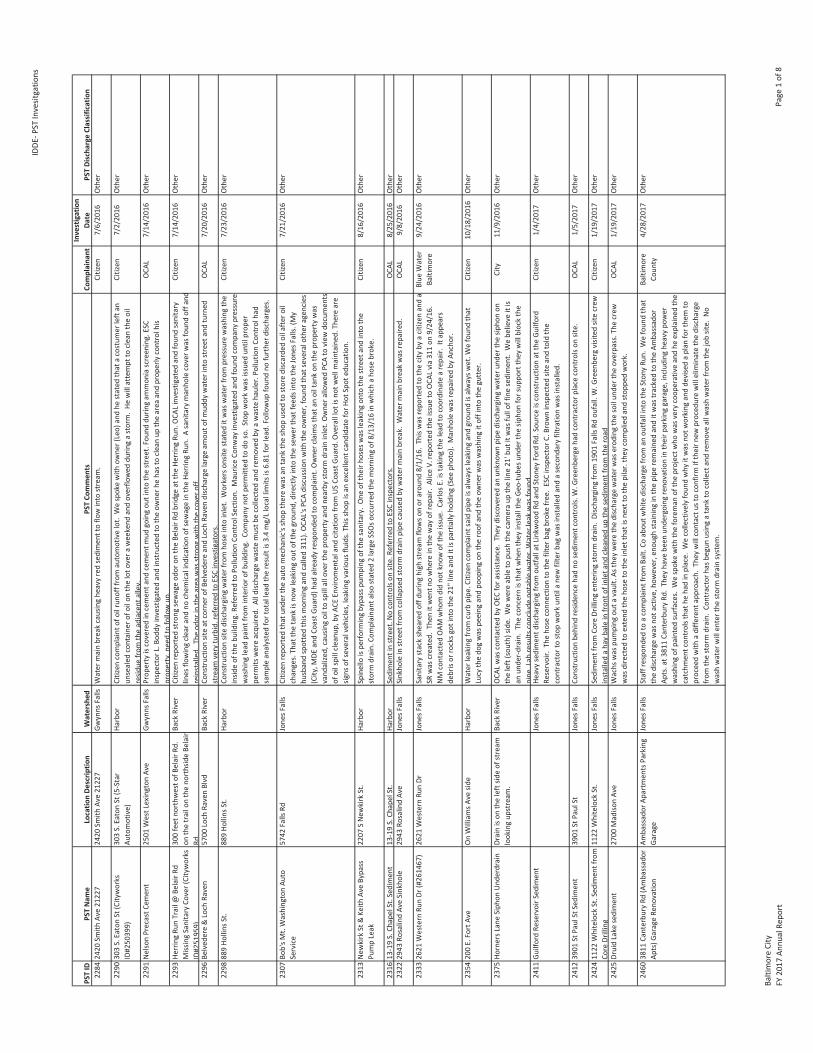
IDDE
PSTInvesitgatio
ns
PSTID
PSTNam
eLocatio
nDe
scrip
tion
Watershed
PSTCo
mmen
tsCo
mplaina
ntInvestigation
Date
PSTDischa
rgeClassification
2284
2420
Smith
Ave21
227
2420
Smith
Ave21
227
Gwynns
Falls
Water
mainbreakcausinghe
avyredsedimen
ttoflo
winto
stream
.Citizen
7/6/20
16Other
2290
303S.EatonSt
(City
works
ID#250
399)
303S.EatonSt
(5Star
Automotive)
Harbor
Citizen
complaint
ofoilrun
offfrom
automotivelot.
Wespokewith
owne
r(Leo)
andhe
stated
that
acostum
erleftan
unsealed
containe
rofo
ilon
theloto
vera
weekend
andoverflo
wed
durin
gastorm.He
willattempt
tocleantheoil
resid
uefrom
theadjacent
alley.
Citizen
7/2/20
16Other
2291
NelsonPrecastC
emen
t25
01WestLexington
Ave
Gwynns
Falls
Prop
erty
iscoveredincemen
tand
cemen
tmud
goingou
tintothestreet.Fou
nddu
ringam
mon
iascreen
ing.ESC
inspectorL.B
oddy
investigated
andinstructed
totheow
nerh
ehastocleanup
thearea
andprop
erlycontrolhis
prop
erty.needto
followup
.
OCA
L7/14
/201
6Other
2293
HerringRu
nTrail@
BelairRd
MissingSanitary
Cover(Cityworks
ID#251
959)
300feet
northw
esto
fBelairR
d.on
thetrailontheno
rthsideBe
lair
Rd.
Back
River
Citizen
repo
rted
strong
sewageod
oron
theBe
lairRd
bridge
attheHe
rringRu
n.OCA
Linvestigated
andfoun
dsanitary
lines
flowingcleara
ndno
chem
icalindicatio
nof
sewageintheHe
rringRu
n.Asanitary
manho
lecoverw
asfoun
doffand
reinstalled.
Theod
orinthearea
was
strong
with
thecovero
ff.
Citizen
7/14
/201
6Other
2296
Belved
ere&Loch
Raven
5700
Loch
RavenBlvd
Back
River
Constructio
nsiteat
corner
ofBe
lved
ereandLoch
Ravendischargelargeam
outo
fmud
dywater
into
street
andturned
stream
ver y
turbid.referredto
ESCinvestigators.
OCA
L7/20
/201
6Other
2298
889Ho
llins
St.
889Ho
llins
St.
Harbor
Constructio
nsitedischargingwater
from
hose
into
inlet.
Workerson
sitestated
itwas
water
from
pressure
washing
the
insid
eof
thebu
ilding.Re
ferred
toPo
llutio
nCo
ntrolSectio
n.MauriceCo
nway
investigated
andfoun
dcompany
pressure
washing
lead
paintfrom
interio
rofb
uilding.
Company
notp
ermitted
todo
so.Stop
workwas
issue
dun
tilprop
erpe
rmits
wereacqu
ired.
Alldisc
hargewaste
mustb
ecollected
andremoved
byawaste
hauler.Pollutio
nCo
ntrolhad
sampleanalystedfortotallead
theresultis3.4mg/Llocallim
itsis6.81
forlead.Followup
foun
dno
furthe
rdisc
harges.
Citizen
7/23
/201
6Other
2307
Bob'sM
t.WashingtonAu
toService
5742
Falls
RdJone
sFalls
Citizen
repo
rted
that
unde
rthe
auto
mechanic'ssho
ptherewas
antank
theshop
used
tostorediscarde
doilafter
oil
changes.That
thetank
isno
wleakingou
tofthe
grou
nd,dire
ctlyinto
thesewer
that
feed
sintotheJone
sFalls.
(My
husbandspottedthismorning
andcalled31
1).O
CAL'sP
CAdiscussio
nwith
theow
ner,foun
dthat
severalother
agen
cies
(City
,MDE
andCo
astG
uard)h
adalreadyrespon
dedto
complaint.O
wne
rclaim
sthata
noiltankon
theprop
erty
was
vand
alize
d,causingoiltospillalloverthe
prop
erty
andne
arby
storm
draininlet.Owne
rallowed
PCAto
view
documen
tsof
oilspillcleanu
p,by
ACEEnviromen
taland
citatio
nfrom
USCo
astG
uard.O
veralllotisn
otwellm
aintaine
d.Thereare
signs
ofseveralveh
icles,leakingvario
usflu
ids.Thisshop
isan
excellent
cand
idateforH
otSpot
education.
Citizen
7/21
/201
6Other
2313
New
kirk
St&Ke
ithAv
eBypass
PumpLeak
2207
SNew
kirk
St.
Harbor
Spinelloispe
rformingbypasspu
mping
ofthesanitary.One
oftheirh
oses
was
leakingon
tothestreet
andinto
the
storm
drain.Co
mplainant
also
stated
2largeSSOso
ccurredthemorning
of8/13
/16inwhich
aho
sebroke.
Citizen
8/16
/201
6Other
2316
1319
S.Ch
a pelSt.Sed
imen
t13
19S.Ch
apelSt.
Harbor
Sedimen
tinstreet.N
ocontrolson
site.Re
ferred
toESCinspectors.
OCA
L8/25
/2016
Other
2322
2943
RosalindAv
eSinkho
le29
43Ro
salindAv
eJone
sFalls
Sinkho
leinstreet
from
collapsed
storm
drainpipe
caused
bywater
mainbreak.
Water
mainbreakwas
repaire
d.OCA
L9/8/20
16Other
2333
2621
Western
RunDr
(#26
1467
)26
21Western
RunDr
Jone
sFalls
Sanitary
stackshearedoffd
uringhigh
stream
flowso
nor
arou
nd8/1/16
.Thiswas
repo
rted
tothecityby
acitizen
anda
SRwas
created.
Then
itwen
tnowhe
reintheway
ofrepair.
AliceV.
repo
rted
theissue
toOCA
Lvia31
1on
9/24
/16.
NM
contactedOAM
who
mdidno
tkno
wof
theissue
.Carlo
sE.istakingthelead
tocoordinate
arepair.
Itappe
ars
debrisor
rocksg
otinto
the21
"lineanditispartially
holding(See
photo).Manho
lewas
repaire
dby
Anchor.
Blue
Water
Baltimore
9/24
/201
6Other
2354
200E.FortAv
eOnWilliamsA
vesid
eHa
rbor
Water
leakingfrom
curb
pipe
.Citizencomplaint
saidpipe
isalwaysleaking
andgrou
ndisalwaysw
et.W
efoun
dthat
Lucy
thedo
gwas
peeing
andpo
opingon
theroof
andtheow
nerw
aswashing
itoffintothegutter.
Citizen
10/18/20
16Other
2375
HornersL
aneSiph
onUnd
erdrain
Drainison
theleftsid
eof
stream
lookingup
stream
.Ba
ckRiver
OCA
Lwas
contactedby
OEC
fora
ssistance.They
discovered
anun
know
npipe
dischargingwater
unde
rthe
sipho
non
theleft(sou
th)side.
Wewereableto
push
thecameraup
theline21
'but
itwas
fullof
finesedimen
t.Webe
lieve
itis
anun
derdrain.
Theconcernisthat
whe
nthey
installthe
Geotube
sund
erthesip
honforsup
portthey
willblockthe
pipe
Labresults
conclude
potablewater
Water
leak
was
foun
d
City
11/9/201
6Other
2411
GuilfordRe
servoirS
edim
ent
Jone
sFalls
Heavysedimen
tdisc
hargingfrom
outfallatLinkw
oodRd
andSton
eyFord
Rd.Sou
rceisconstructio
nat
theGu
ilford
Reservoir.
Theho
seconn
ectio
nto
thefilterb
agbrokefree.ESCinspectorC
.Browninspectedsiteandtoldthe
contractor
tostop
workun
tilane
wfilterb
agwas
installedandasecond
aryfiltrationwas
installed.
Citizen
1/4/20
17Other
2412
3901
StPaulSt
Sedimen
t39
01St
PaulSt
Jone
sFalls
Constructio
nbe
hind
resid
ence
hadno
sedimen
tcon
trols.W.G
reen
bergehadcontractor
placecontrolson
site.
OCA
L1/5/20
17Other
2424
1122
Whitelock
St.Sed
imen
tfrom
Core
Drilling
1122
Whitelock
St.
Jone
sFalls
Sedimen
tfrom
Core
Drillingen
terin
gstorm
drain.
Dischargingfrom
1901
Falls
Rdou
fall.W.G
reen
berg
visited
sitecrew
installedahaybaleinfron
tofinlet
andcleane
dup
thesedimen
tfrom
theroad
Citizen
1/19
/201
7Other
2425
DruidLake
sedimen
t27
00Madiso
nAv
eJone
sFalls
Wachs
was
pumping
outa
vault.As
they
werethedischargewater
was
erod
ingthesoilun
derthe
overpass.The
crew
was
directed
toextend
theho
seto
theinletthatisn
exttothepilar.they
compliedandstop
pedwork.
OCA
L1/19
/201
7Other
2460
3811
Canterbu
ryRd
(Ambassador
Apts)G
arageRe
novatio
nAm
bassador
Apartm
entsParking
Garage
Jone
sFalls
Staffrespo
nded
toacomplaint
from
Balt.
Coabou
twhite
dischargefrom
anou
tfallintotheSton
yRu
n.Wefoun
dthat
thedischargewas
nota
ctive,ho
wever,eno
ughstaining
inthepipe
remaine
danditwas
trackedto
theAm
bassador
Apts.at3
811Canterbu
ryRd
.They
have
been
unde
rgoing
reno
vatio
nintheirp
arking
garage,including
heavypo
wer
washing
ofpaintedsurfaces.Wespokewith
theforeman
oftheprojectw
howas
very
coop
erativeandhe
explaine
dthe
catchm
entcon
trolsthath
ehadinplace.
Wecollectivelyfoun
dwhy
itwas
notw
orking
andde
visedaplan
forthe
mto
proceedwith
adiffe
rent
approach.They
willcontactu
stoconfirm
iftheirn
ewproced
urewillelim
inatethedischarge
from
thestorm
drain.
Contractor
hasb
egun
usingatank
tocollectandremoveallw
ashwater
from
thejobsite.
No
washwater
willen
terthe
storm
drainsystem
.
Baltimore
Coun
ty4/28
/201
7Other
BaltimoreCity
FY20
17An
nualRe
port
Page
1of
8
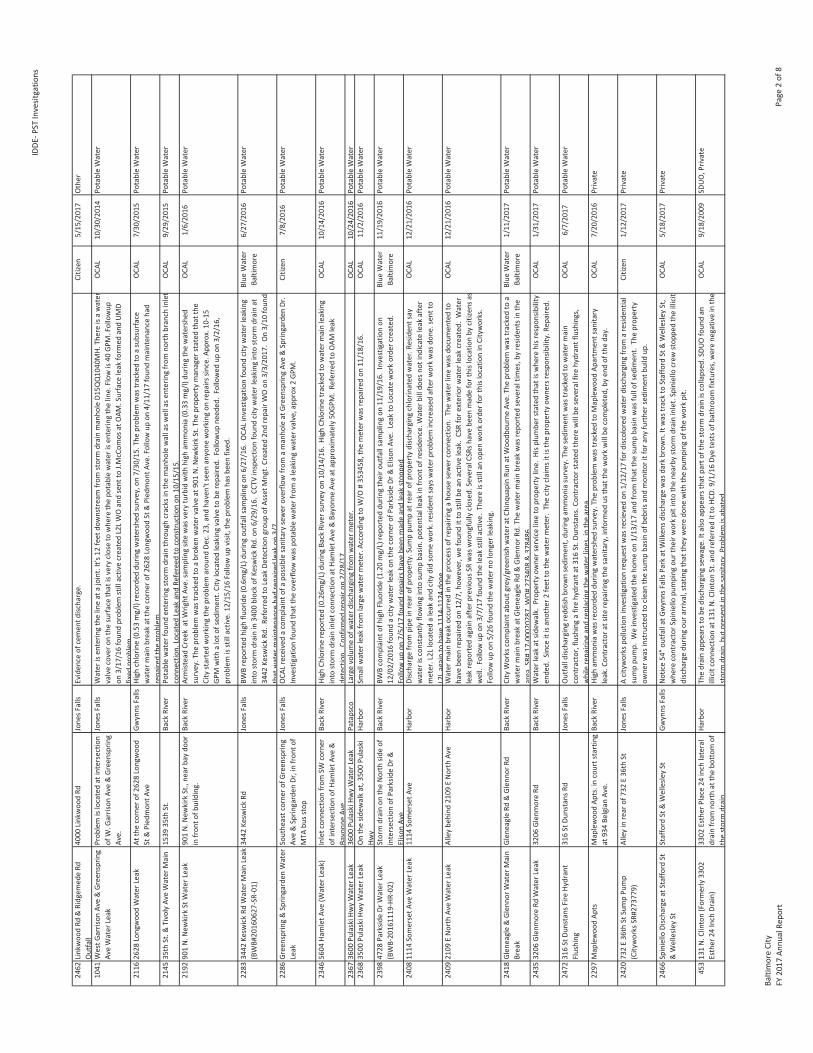
IDDE
PSTInvesitgatio
ns
2462
Linkwoo
dRd
&Ridgem
edeRd
Outfall
4000
Linkwoo
dRd
Jone
sFalls
Eviden
ceof
cemen
tdisc
harge.
Citizen
5/15
/201
7Other
1041
WestG
arrison
Ave&Greenspring
AveWater
Leak
Prob
lem
islocatedat
intersectio
nof
W.G
arrison
Ave&Greenspring
Ave.
Jone
sFalls
Water
isen
terin
gthelineat
ajoint.It's1
2feet
downstream
from
storm
drainmanho
leD1
5QQ10
40MH.
Thereisawater
valvecovero
nthesurfacethat
isvery
closeto
whe
rethepo
tablewater
isen
terin
gtheline.Flow
is40
GPM.Followup
on3/17
/16foun
dprob
lem
stillactiv
ecreatedL2LWOandsent
toJ.M
cCom
osat
OAM
.Surface
leak
form
edandUMD
fixed
prob
lem
OCA
L10
/30/20
14Po
tableWater
2116
2628
Longwoo
dWater
Leak
Atthecorner
of26
28Longwoo
dSt
&Pied
mon
tAve
Gwynns
Falls
High
chlorin
e(0.53mg/l)recorded
durin
gwatershed
survey,on7/30
/15.Theprob
lem
was
trackedto
asubsurface
water
mainbreakat
thecorner
of26
28Longwoo
dSt
&Pied
mon
tAve.Followup
on4/11
/17foun
dmainten
ance
had
repaire
dtheprob
lem.
OCA
L7/30
/201
5Po
tableWater
2145
35th
St.&
TivolyAv
eWater
Main
1539
35th
St.
Back
River
Potablewater
foun
den
terin
gstorm
drainthroughcracks
inthemanho
lewallasw
ellase
nteringfrom
northbranch
inlet
conn
ectio
n.LocatedLeak
andRe
fereed
toconstructio
non
10/15/15
.OCA
L9/29
/201
5Po
tableWater
2192
901N.N
ewkirk
StWater
Leak
901N.N
ewkirk
St.,ne
arbaydo
orinfron
tofb
uilding.
Back
River
ArmisteadCreekat
Wrig
htAv
e.samplingsitewas
very
turbidwith
high
ammon
ia(0.33mg/l)du
ringthewatershed
survey.The
prob
lem
was
trackedto
abroken
water
valveat
901N.N
ewkirk
St.The
prop
ertymanager
stated
that
the
City
startedworking
theprob
lem
arou
ndDe
c.23
,and
haven'tseenanyone
working
onrepairs
since.A
pprox.10
15GP
Mwith
aloto
fsed
imen
t.City
locatedleakingvalveto
berepaire
d.Followup
need
ed.Followed
upon
3/2/16
,prob
lem
isstillactiv
e.12
/15/16
Followup
visit,the
prob
lem
hasb
eenfixed
.
OCA
L1/6/20
16Po
tableWater
2283
3442
Kesw
ickRd
Water
MainLeak
(BWB#
2016
0627
SR01
)34
42Ke
swickRd
Jone
sFalls
BWBrepo
rted
high
fluoride(0.6mg/L)du
ringou
tfallsam
plingon
6/27
/16.
OCA
Linvestigationfoun
dcity
water
leaking
into
storm
drainin34
00blockof
Kesw
ickRd
.on6/29
/16.
CCTV
inspectio
nfoun
dcity
water
leakinginto
storm
drainat
3442
Kesw
ickRd
.Re
ferred
toLeak
Detectiongrou
pof
AssetM
ngt.Created2n
drepairWOon
3/3/20
17.On3/10
foun
dthat
water
mainten
ance
hadrepaire
dleak
on3/7
Blue
Water
Baltimore
6/27
/201
6Po
tableWater
2286
Greenspring&Sprin
garden
Water
Leak
Southe
astcorne
rofG
reen
sprin
gAv
e&Sprin
garden
Dr,infron
tof
MTA
busstop
Jone
sFalls
OCA
Lreceived
acomplaint
ofapo
ssiblesanitary
sewer
overflo
wfrom
amanho
leat
GreenspringAv
e&Sprin
garden
Dr.
Investigationfoun
dthat
theoverflo
wwas
potablewater
from
aleakingwater
valve,approx
2GP
M.
Citizen
7/8/20
16Po
tableWater
2346
5604
HamletA
ve(W
ater
Leak)
Inletcon
nectionfrom
SWcorner
ofintersectio
nof
HamletA
ve&
Bayonn
eAv
e
Back
River
High
Chlorin
erepo
rted
(0.26m
g/L)du
ringBa
ckRiversurveyon
10/14/16
.High
Chlorin
etrackedto
water
mainleaking
into
storm
draininletcon
nectionat
HamletA
ve&Ba
yonn
eAv
eat
approxim
ately50
GPM.Re
ferred
toOAM
leak
detection.
Confirm
edrepairon
2/28
/17.
OCA
L10
/14/20
16Po
tableWater
2367
3600
PulaskiH
wyWater
Leak
3600
PulaskiH
wyWater
Leak
Patapsco
Largevolumeof
water
dischargingfrom
water
meter.
OCA
L10
/24/20
16Po
tableWater
2368
3500
PulaskiH
wyWater
Leak
Onthesid
ewalkat,350
0Pu
laski
Hwy
Harbor
Smallw
ater
leak
from
largewater
meter.A
ccording
toW/O
#35
3458
,the
meter
was
repaire
don
11/18/16
.OCA
L11
/2/201
6Po
tableWater
2398
4728
Parksid
eDr
Water
Leak
(BWB20
1611
19HR
02)
Storm
drainon
theNorth
sideof
intersectio
nof
Parksid
eDr
&Eliso
nAv
e
Back
River
BWBcomplaint
ofhigh
Fluo
ride(1.20mg/L)repo
rted
durin
gtheiro
utfallsamplingon
11/19/16
.Investigationon
12/02/20
16foun
dacity
water
leak
onthecorner
ofParksid
eDr
&Eliso
nAv
e.Leak
toLocate
workorde
rcreated
.Followup
on7/5/17
foun
drepairs
have
been
madeandleak
stop
ped
Blue
Water
Baltimore
11/19/20
16Po
tableWater
2408
1114
SomersetA
veWater
Leak
1114
SomersetA
veHa
rbor
Dischargefrom
pipe
inrear
ofprop
erty.Sum
ppu
mpat
rear
ofprop
erty
dischargingchlorin
ated
water.R
esiden
tsay
water
isconstantlyflo
winginto
sumpbasin
.poten
tialleakinfron
tofresiden
ce.W
ater
billdo
esno
tind
icateleak
after
meter.L2L
locatedaleak
andcity
didsomework.resid
entsaysw
ater
prob
lem
increasedafterw
orkwas
done
.sen
tto
L2Lagainto
have
1114
1124
done
OCA
L12
/21/20
16Po
tableWater
2409
2109
ENorth
AveWater
Leak
Alleybe
hind
2109
ENorth
Ave
Harbor
Water
mainbreakoccurred
intheprocesso
frep
airin
gaho
usesewer
conn
ectio
n.Thewater
linewas
documen
tedto
have
been
repaire
don
12/7,how
ever,w
efoun
ditto
stillbe
anactiv
eleak.CSRfore
xteriorw
ater
leak
created.
Water
leak
repo
rted
againafterp
reviou
sSRwas
wrongfully
closed
.SeveralCSRs
have
been
madeforthislocationby
citizen
sas
well.Followup
on3/7/17
foun
dtheleak
stillactiv
e.Thereisstillan
open
workorde
rfor
thislocatio
ninCityworks.
Followup
on5/26
foun
dthewater
nolonger
leaking.
OCA
L12
/21/20
16Po
tableWater
2418
Glen
eagle&Glen
norW
ater
Main
Break
Glen
eagleRd
&Glen
norR
dBa
ckRiver
City
Works
complaint
abou
tgrey/greenish
water
atCh
inqu
apinRu
nat
Woo
dbou
rneAv
e.Theprob
lem
was
trackedto
awater
mainbreakat
Glen
eagleRd
&Glen
norR
d.Thewater
mainbreakwas
repo
rted
severaltim
es,byresid
entsinthe
area.SR#
1700
0202
87,W
O#27
3408
&37
8486
Blue
Water
Baltimore
1/11
/201
7Po
tableWater
2435
3206
Glen
moreRd
Water
Leak
3206
Glen
moreRd
Back
River
Water
leak
atsid
ewalk.
Prop
ertyow
nerservice
lineto
prop
ertyline.
Hisp
lumbe
rstatedthat
iswhe
rehisrespo
nsibility
ende
d.Sinceitisanothe
r2feet
tothewater
meter.Thecity
claimsitisthe
prop
erty
owne
rsrespon
sibility.R
epaired.
OCA
L1/31
/201
7Po
tableWater
2472
316St
Dunstans
Fire
Hydrant
Flushing
316St
Dunstans
RdJone
sFalls
Outfalldischargingredd
ishbrow
nsedimen
t,du
ringam
mon
iasurvey.The
sedimen
twas
trackedto
water
main
contractor,flushingafirehydranta
t316
St.D
unstans.Co
ntractor
stated
therewillbe
severalfire
hydrantflushings,
whilerepairing
andreplacingthewater
lines,inthearea.
OCA
L6/7/20
17Po
tableWater
2297
Maplewoo
dAp
tsMaplewoo
dAp
ts.incourtstarting
at93
4Be
lgianAv
e.Ba
ckRiver
High
ammon
iawas
recorded
durin
gwatershed
survey.The
prob
lem
was
trackedto
Maplewoo
dAp
artm
entsanita
ryleak.Con
tractora
tsite
repairing
thesanitary,informed
usthat
theworkwillbe
completed
,byen
dof
theday.
OCA
L7/20
/201
6Private
2420
732E36
thSt
SumpPu
mp
(City
works
SR#273
779)
Alleyinrear
of73
2E36
thSt
Jone
sFalls
Acityworks
pollutio
ninvestigationrequ
estw
asrecieved
on1/12
/17ford
iscolored
water
dischargingfrom
aresid
entia
lsumppu
mp.
Weinvestigated
theho
meon
1/13
/17andfrom
that
thesumpbasin
was
fullof
sedimen
t.Theprop
erty
owne
rwas
instructed
tocleanthesumpbasin
ofbe
brisandmon
itoritfor
anyfurthe
rsed
imen
tbuildup
.
Citizen
1/12
/201
7Private
2466
Spiniello
Dischargeat
Stafford
St&Wellesle
ySt
Stafford
St&Wellesle
ySt
Gwynns
Falls
Notice54
"outfallat
Gwynns
Falls
Park
atWilken
sdisc
hargewas
dark
brow
n.Itwas
trackto
Stafford
St&Wellesle
ySt,
whe
recontractor
Spiniello
pumping
ourthe
irworkpitintothene
arby
storm
draininlet.Spiniello
crew
stop
pedtheillicit
dischargedu
ringou
rarrival,statin
gthat
they
weredo
newith
thepu
mping
oftheworkpit.
OCA
L5/18
/201
7Private
45313
1N.Clinton(Formerly33
02Esther
24Inch
Drain)
3302
Esther
Place24
inch
lateral
drainfrom
northat
thebo
ttom
ofthestorm
drain.
Harbor
Thedrainappe
arstobe
dischargingsewage.Italso
appe
arsthatp
arto
fthe
storm
drainiscollapsed
.SDU
Ofoun
dan
illicitconn
ectio
nat
131N.ClintonSt.and
referred
itto
HCD.
9/1/16
Dyetestso
fbathroo
mfixtures,werene
gativ
einthe
storm
drain,bu
tpresent
inthesanitary.Problem
isabated
.
OCA
L9/18
/200
9SD
UO,Priv
ate
BaltimoreCity
FY20
17An
nualRe
port
Page
2of
8
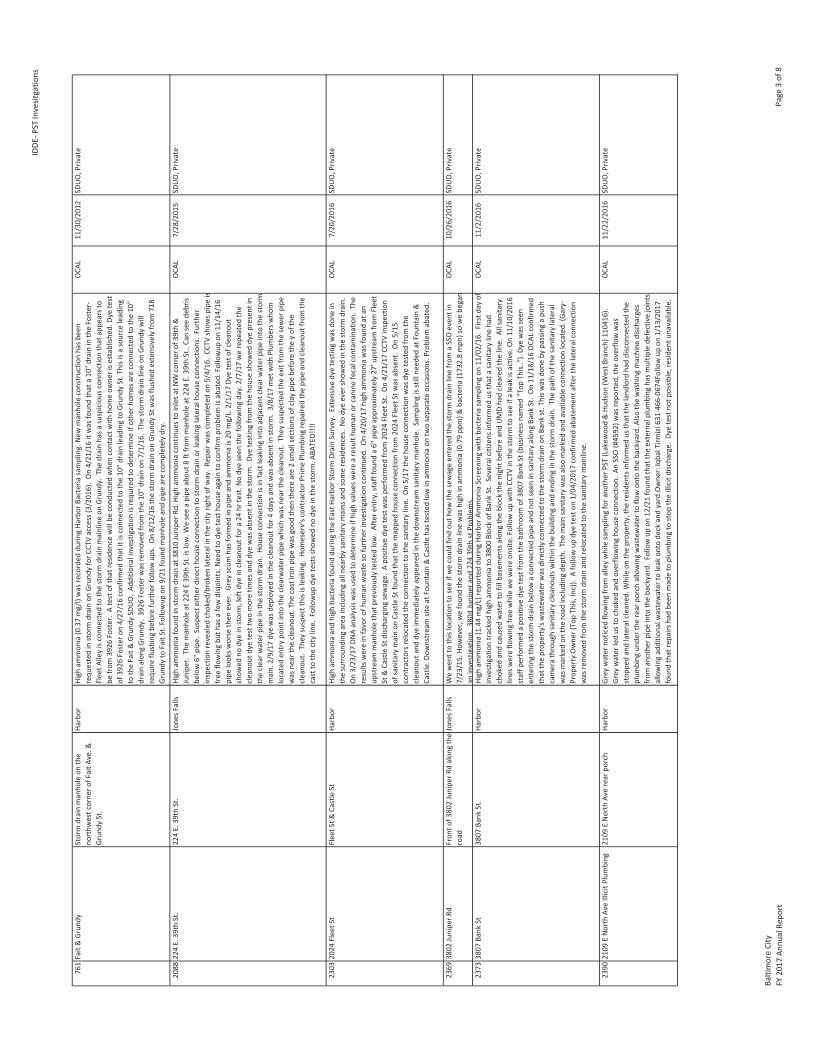
IDDE
PSTInvesitgatio
ns
761Fait&Grun
dyStorm
drainmanho
leon
the
northw
estcorne
rofFaitA
ve.&
Grun
dySt.
Harbor
High
ammon
ia(0.37mg/l)was
recorded
durin
gHa
rbor
Bacteriasampling.New
manho
leconstructio
nhasb
een
requ
estedinstorm
drainon
Grun
dyforC
CTVaccess(3/201
6).On4/21
/16itwas
foun
dthat
a10
"drainintheFoster
FleetA
lleyisconn
ectedto
thestorm
drainmainlineon
Grun
dy.Thedrainhasa
suspicious
conn
ectio
nthat
appe
arsto
befrom
3926
Foster.Atestof
that
resid
ence
willbe
cond
uctedwhe
ncontactw
ithho
meow
nerise
stablishe
d.Dy
etest
of39
26Foster
on4/27
/16confirm
edthat
itisconn
ectedto
the10
"drainleadingto
Grun
dySt.Thisisa
source
leading
totheFait&Grun
dySD
UO.Ad
ditio
nalinvestig
ationisrequ
iredto
determ
ineifothe
rhom
esareconn
ectedto
the10
"drainalon
gGrun
dy.39
26Foster
was
removed
from
the10
"drainon
7/1/16
.Thestorm
drainlineon
Grun
dywill
requ
ireflu
shingbe
fore
furthe
rfollowup
s.On8/12
/16thestorm
drainon
Grun
dySt
was
flushed
extensivelyfrom
718
Grun
dyto
FaitSt.Followup
on9/21
foun
dmanho
leandpipe
arecompletelydry.
OCA
L11
/30/20
12SD
UO,Priv
ate
2088
224E.39
thSt.
224E.39
thSt.
Jone
sFalls
High
ammon
iafoun
dinstorm
drainat
3810
Junipe
rRd.High
ammon
iacontinue
stoinleta
tNW
corner
of39
th&
Junipe
r.Themanho
leat
224E39
thSt.islow
.Weseeapipe
abou
t8ftfrom
manho
leat
224E.39
thSt..Canseede
bris
below6"
pipe
.Suspecte
ither
directho
useconn
ectio
nto
storm
drainor
leakinglateralhou
seconn
ectio
ns.Furthe
rinspectio
nrevealed
choked
/brokenlateralinthecity
right
ofway.Re
pairwas
completed
on5/4/16
.CC
TVshow
spipeis
free
flowingbu
thas
afewdisjo
ints.N
eedto
dyetestho
useagainto
confirm
prob
lem
isabated
.Followup
on11
/14/16
pipe
looksw
orse
then
ever.Grey
scum
hasformed
inpipe
andam
mon
iais20
mg/L.2/1/17
Dyetestof
cleano
utshow
edno
dyeinstorm,leftd
yeincleano
utfora
24hr
test.N
odyeseen
thefollowingday.2/7/17
werepe
ated
the
cleano
utdyetesttw
omoretim
esanddyewas
absent
inthestorm.Dy
etestingfrom
theho
useshow
eddyepresen
tin
theclearw
ater
pipe
inthestorm
drain.
Houseconn
ectio
nisinfactleakinginto
adjacent
clearw
ater
pipe
into
thestorm
main.2/9/17
dyewas
deployed
inthecleano
utfor4
days
andwas
absent
instorm.3/8/17
met
with
Plum
berswho
mlocateden
trypo
intintotheclearw
ater
pipe
which
was
near
thecleano
ut.They
suspectedtheexitfrom
thesewer
pipe
was
near
thecleano
ut.The
castiro
npipe
was
good
then
thereare2sm
allsectio
nsof
clay
pipe
before
theyof
the
cleano
ut.They
suspectthisisleaking.Ho
meserv'sc
ontractorP
rimePlum
bing
repaire
dthepipe
andcleano
utfrom
the
castto
thecity
line.
Followup
dyetestssho
wed
nodyeinthestorm.A
BATED!!!!
OCA
L7/28
/201
5SD
UO,Priv
ate
2303
2024
FleetS
tFleetS
t&CastleSt
Harbor
High
ammon
iaandhigh
bacteriafoun
ddu
ringtheEastHa
rbor
Storm
DrainSurvey.Extensivedyetestingwas
done
inthesurrou
ndingarea
includ
ingallnearbysanitary
mains
andsomeresid
ences.
Nodyeever
show
edinthestorm
drain.
On3/23
/17DN
Aanalysiswas
used
tode
term
ineifhigh
values
werearesulthu
man
orcanine
fecalcon
tamination.
The
results
wereinfavoro
fhum
anwaste
sofurthe
rinvestig
ationcontinue
d.On4/20
/17high
ammon
iawas
foun
dat
anup
stream
manho
lethat
previouslytested
low.Aftere
ntry,stafffoun
da6"
pipe
approxim
ately27
'upstream
from
Fleet
St&CastleSt
dischargingsewage.
Apo
sitivedyetestwas
performed
from
2024
FleetS
t.On4/21
/17CC
TVinspectio
nof
sanitary
mainon
CastleSt
foun
dthat
themappe
dho
useconn
ectio
nfrom
2024
FleetS
twas
absent.On5/15
contractorsrelocated
theconn
ectio
nto
thesanitary
line.
On5/17
theho
useconn
ectio
nwas
dyetested
from
the
cleano
utanddyeim
med
iatelyappe
ared
inthedo
wnstream
sanitary
manho
le.Samplingisstillne
eded
atFoun
tain&
Castle.D
ownstream
siteat
Foun
tain&Castlehastestedlowinam
mon
iaon
twoseparate
occasio
ns.Problem
abated
.
OCA
L7/20
/201
6SD
UO,Priv
ate
2369
3802
Junipe
rRd
Fron
tof3
802Junipe
rRdalon
gthe
road
Jone
sFalls
Wewen
ttothislocatio
nto
seeifwecouldfin
dou
thow
thesewageen
teredthestorm
drainlinefrom
aSSOeven
tin
7/23
/15.Ho
wever,w
efoun
dthestorm
drainlinewas
high
inam
mon
ia(0.79pp
m)&
bacteria(173
2.8mpn
)sowebe
gan
aninvestigation.
3804
Junipe
rand
22439
thstProb
lems.
OCA
L10
/26/20
16SD
UO,Priv
ate
2373
3807
Bank
St38
07Ba
nkSt.
Harbor
High
ammon
ia(1.44mg/L)repo
rted
durin
gHa
rbor
Ammon
iaScreen
ingwith
bacteriasamplingon
11/02/16
.Firstd
ayof
investigationtrackedhigh
ammon
iato
3800
Blockof
Bank
St.Severalcitizens
inform
edus
that
asanitary
linehad
choked
andcaused
water
tofillbasem
entsalon
gtheblockthenightb
eforeandUMDhadclearedtheline.
Allsanita
rylines
wereflo
wingfree
whilewewereon
site.Followup
with
CCTV
inthestorm
toseeifaleak
isactiv
e.On11
/10/20
16staffp
erform
edapo
sitivedyetestfrom
thebathroom
of38
07Ba
nkSt
(businessn
amed
"Top
This..").Dy
ewas
seen
enterin
gthestorm
drainbe
lowaconn
ectedpipe
andno
tseeninsanitary
alon
gBa
nkSt.On11
/18/16
OCA
Lconfirm
edthat
theprop
erty'swastewater
was
directlyconn
ectedto
thestorm
drainon
Bank
st.Thisw
asdo
neby
passingapu
shcamerathroughsanitary
cleano
utsw
ithinthebu
ildinganden
ding
inthestorm
drain.
Thepath
ofthesanitary
lateral
was
markedon
theroad
includ
ingde
pth.
Themainsanitary
was
also
markedandavailableconn
ectio
nlocated.(Gary
Prop
ertyOwne
r(TopThis,
Inc)).Afollowup
dyeteston
1/04
/201
7confirm
edabatem
enta
fter
thelateralcon
nection
was
removed
from
thestorm
drainandrelocatedto
thesanitary
mainline.
OCA
L11
/2/201
6SD
UO,Priv
ate
2390
2109
ENorth
AveIllicitPlum
bing
2109
ENorth
Averear
porch
Harbor
Grey
water
noticed
flowingfrom
alleywhilesamplingfora
nother
PST(Lakew
ood&Hu
dson
(WestB
ranch)
1104
16).
Grey
water
ledus
tochoked
andoverflo
wingho
useconn
ectio
n.An
SSO(#45
92)w
asrepo
rted
,the
overflo
wwas
stop
pedandlateralcleaned
.Whileon
theprop
erty,the
resid
entsinform
edus
that
theland
lord
haddiscon
nected
the
plum
bing
unde
rthe
rear
porchallowingwastewater
toflo
won
tothebackyard.A
lsothewashing
machine
discharges
from
anothe
rpipeinto
thebackyard.Followup
on12
/21foun
dthat
theexternalplum
bing
hasm
ultip
lede
fectivejoints
allowingadditio
nalw
astewater
toleak
onto
deck
andyard.Owne
r:IqbalTirm
izi63
146
60674Followup
on1/13
/201
7foun
dthat
repairs
hadbe
enmadeto
plum
bing
tostop
theillicitdischarge.
Dyetestno
tpossib
le,residen
tunavailable.
OCA
L11
/22/20
16SD
UO,Priv
ate
BaltimoreCity
FY20
17An
nualRe
port
Page
3of
8

IDDE
PSTInvesitgatio
ns
2423
4518
WakefieldRd
4518
WakefieldRd
Gwynns
Falls
Twoun
chartedpipe
s.4or
6inch
pipe
at63
ftfrom
D01Q
Q_059
MH.
12inch
pipe
at69
ft.Dy
ede
ployed
inho
useand
was
presen
tintw
oincomingpipe
s.03
/22/17
locatedcleano
ut(7
fteastof
walk,9ftno
rthof
sidew
alk).On4/28
/17dye
was
deployed
intheho
meandinthecleano
ut.Onlythedyede
ployed
intheho
mewas
presen
tinthestorm
drain.
Owne
rcon
tactinfo:703
39599
22Ra
phael
Prop
ertymanager:240
90609
96Am
y.6/13
/17met
plum
berw
hom
cctv'd
conn
ectio
n.He
pushed
ablockage
outw
ithhisc
amera.
After thisw
ewereno
tableto
getd
yeto
show
inthestorm
and
theflo
wstop
ped.
Itisbe
lievedthat
thiswas
thecauseto
theprob
lem.Wewillcontinue
tomon
itorthislocation.(OCA
Lcctvused
).Followup
on7/12
/17foun
datrickleinthedo
wnstream
storm
drainwith
lowam
mon
ia.Followup
an7/17
/17foun
dTricklewith
lowam
mon
ia.ClosingSD
UO.
OCA
L1/5/20
17SD
UO,Priv
ate
633Mannasota
&Parksid
eOutfallun
derneath
the
Mannasota
Ave.&Parksid
eDr.
bridge
Back
River
Ammon
iahigh
durin
gfollowup
toMannasota
&Nicho
lasS
DUO.H
igham
mon
iano
tassociatedwith
Mannasota
&Nicho
lasS
DUO.Sew
ageleakinginto
storm
butcanno
tdye
testsanitary
becauseinhasa
very
largevolume.
Thiswas
supp
osed
tobe
lined
butcon
tractorlined
thewrong
segm
ento
fline.Itisun
clearw
henliningof
thissegm
entw
illbe
performed
.Arou
nd6/29
/16contractorslined
thesanitary
mainon
Mannasota
betw
eenSham
rock
andParksid
e.As
of9/21
theam
mon
iaresults
werelowandthereisno
scum
onthewall.9/22
bacteriaresults
conclude
abatem
ent.
OCA
L8/9/20
11SD
UO,SSO
Subsurface
847Bloo
mSt
Und
erdrainforsanita
ryno
rthw
est
ofsid
eof
36"s
torm
drainbe
low
at50
2Bloo
mSt
Jone
sFalls
Observedwaste
water
contam
inationby
DavidFlores
atou
tfallJ23
6.Prob
lem
was
trackedto
a6"
unde
rdrainfor
sanitary
line(S25
II_02
5G1),inside36
"storm
drainon
Bloo
mSt.Sew
ageisescaping
thesanitary
system
anden
terin
gthe
storm
drainby
way
oftheun
derd
rain.W
aste
Water
Engine
ersh
adthesanitary
assestS25II_02
5G1andthemanho
lesa
teach
ends
lined
.But
theliningdidno
tabate
theprob
lem.OnOctob
er30
,201
5,OCA
Lsuccessfullydyetested
the
sanitary
tonarrow
/pinpo
intthe
locatio
nof
sewageisex
filtratingfrom
thesanitary
assetS
25II02
5G1anden
terin
gthe
unde
rdrainbe
lowit.
Aplastic
halfgallonjugabou
t1/3
fullof
water
was
tethered
into
the50
1Go
ldSt.sanita
rymanho
le(S25
II_02
5MH)
with
aspoo
lofn
ylon
cord
tiedto
it.Thenyloncord
was
slowlyreleased
from
thespoo
l,allowingthejugto
flowdo
wnstream
alon
gthesanitary
curren
tfor
371feet
tothene
xtdo
wnstream
sanitary
manho
le(S25
II_02
3MH)
at50
0Bloo
mSt.The
jugwas
retrievedandadyebagwas
attached
.With
thenyloncord
stillattached
atGo
ldSt.,thejuganddyebagwerepu
lledback
upstream
in5feet
increm
ents.Sho
rtlyafterthe
dyewas
heldinplace,an
iden
tifiedsurgeof
water
flowed
throughthestorm
drainsystem
atBloo
mSt.A
fter
16minutes
ofdyede
ploymen
tthe
iden
tifiedsurgeof
water
stop
pedandthedyewas
presen
tinthestorm
drain.Du
eto
thistest,itisc
onclud
edthat
sewageisescaping
thesanitary
system
arou
ndfivefeet
upstream
from
thesanitary
manho
leat
Bloo
mSt.Asegm
ento
fsanitary
pipe
was
replaced
upstream
ofthemanho
leandinto
themanho
leon
12/10/15
.Followup
dyetestingand
ammon
iavalues
indicate
that
sewageisstillleavingthesystem
anden
terin
gtheun
derdrainon
Bloo
mSt.Po
sitivedye
teston
3/2/16
insanitary
lineflo
wingfrom
thewestise
vide
ntof
additio
nalsew
ageleaks.2/27
/17followup
dyetestto
manho
lereplacem
ento
n2/24
confirm
NOdyepresen
tinstorm
from
either
unde
rdrain.2/28/17
nodyepresen
tfrom
dyetest,und
erdrainam
mon
inalow,disc
overed
possibleup
stream
prob
lem
atDivisio
n.
Blue
Water
Baltimore
7/22
/201
3SD
UO,SSO
Subsurface
959Ch
arles&
Lanvale(6
Inch
Pipe
)SD
UO
SWCo
rner
ofNCh
arlesS
t&W
LanvaleSt
Jone
sFalls
Sewageisen
terin
gstorm
drainsystem
from
a6"
pipe
onsouthwallofm
anho
le.Prob
lem
foun
dwhileconfirm
ing
repairs
toprevious
prob
lem
atCh
arles&
Lanvale.2/10
/16Pipe
segm
entw
illbe
pipe
burstb
yAn
chor
Constructio
nbu
tdu
eto
gasleakworkison
holdun
tilBG
Ehasrep
aircom
plete.Po
intrep
airm
adedu
ringweekof
5/9/16
didno
tresolve
theSD
UO.Stillactiveon
5/12
/16.
Sanitary
mainlinehasb
eenreferred
forC
IPP.
OCA
L6/6/20
14SD
UO,SSO
Subsurface
1093
2500
BlockW.ColdspringLn.
2500
Blockof
WCo
ldsprin
gLane
,be
tweenPallMallRdandFenn
eyAv
e.
Jone
sFalls
Sewageisescaping
thesystem
onW.ColdspringLn,betweenPallMalland
Fenn
eyAv
eandappe
arsinthestorm
drain
system
ata15
"collapsed
storm
draininletp
ipeat
2426
W.Coldspring.
Also
thestorm
drainmainflowisescaping
the
system
andreappe
ar.2/18/20
16Water
mainleak
stop
pedanddyeisstillappe
aringinthestorm.N
eedto
dofurthe
rdyetestingto
isolate
theassetthatisleaking.CC
TVinspectio
non
4/8/16
foun
dabroken
sanitary
pipe
segm
ent2
12'
downstream
from
manho
le13
II101
7MH(W
.Coldspring&Finn
ey).4/21
/16po
intrep
airw
asmadedo
neon
thesanitary.
4/22
/16po
sitivefollowup
dyetestsc
onfirmed
that
therearemultip
leprob
lemso
nthissanitary
system
,thatw
ereno
telim
inated
with
thepo
intrep
air.
Followup
dyeteston
6/30
/16aftersanita
rymainlining(251
8&25
08Co
ldsprin
g)was
absent
from
thestorm
drainwhe
nde
ployed
atCo
ldsprin
g&Finn
eyandat
Coldsprin
g&PallMall.As
of8/15
/16after
receivingandreview
ingtheLabresultfrom
7/28
thisinvestigationandSD
UOareconsidered
closed
.Thelabresults
are
cond
uciveto
grou
ndwater
inMarylandandtheBa
cteriavalues
dono
tind
icateasewageprob
lem.
OCA
L2/10
/201
5SD
UO,SSO
Subsurface
BaltimoreCity
FY20
17An
nualRe
port
Page
4of
8
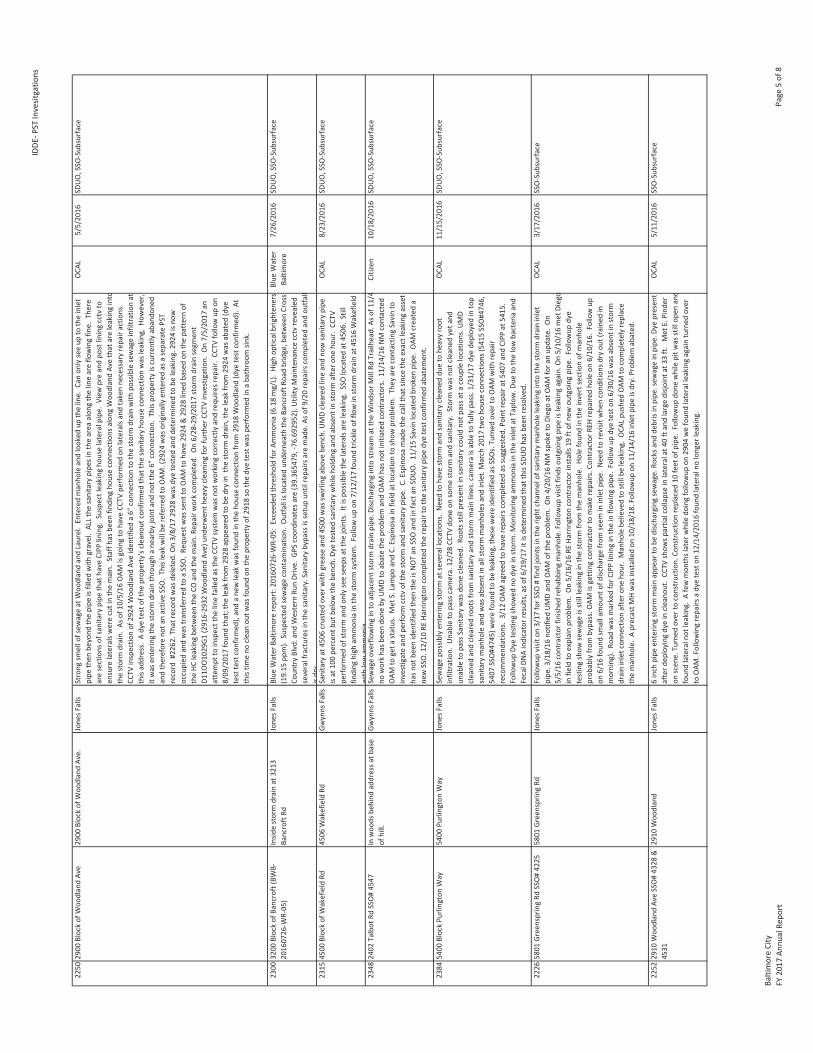
IDDE
PSTInvesitgatio
ns
2250
2900
Blockof
Woo
dlandAv
e29
00Blockof
Woo
dlandAv
e.Jone
sFalls
Strong
smellofsew
ageat
Woo
dlandandLaurel.Enteredmanho
leandlooked
uptheline.
Canon
lyseeup
totheinlet
pipe
then
beyond
thepipe
isfilledwith
gravel.ALLthesanitary
pipe
sinthearea
alon
gthelineareflo
wingfin
e.There
aresections
ofsanitary
pipe
that
have
CIPP
lining.
Suspectleaking
houselateralpipe.
View
preandpo
stliningcctvto
ensure
lateralswerecutinthemain.
Staffh
asbe
enfin
ding
houseconn
ectio
nsalon
gWoo
dlandAv
ethat
areleakingint o
thestorm
drain.
Asof
10/5/16OAM
isgoingto
have
CCTV
performed
onlateralsandtakenne
cessaryrepairactio
ns.
CCTV
inspectio
nof
2924
Woo
dlandAv
eiden
tifieda6"
conn
ectio
nto
thestorm
drainwith
possiblesewageinfiltrationat
thisaddress.
Adyetestof
theprop
erty'scleano
utconfirm
edthat
thesanitary
houseconn
ectio
nwas
leaking.
However,
itwas
enterin
gthestorm
drainthroughane
arby
jointa
ndno
tthe
6"conn
ectio
n.Thisprop
erty
iscurren
tlyabando
ned
andthereforeno
tanactiv
eSSO.Thisleak
willbe
referred
toOAM
.(29
24was
originallyen
teredas
aseparate
PST
record
#226
2.That
record
was
deleted.On3/8/17
2928
was
dyetested
andde
term
ined
tobe
leaking.29
24isno
woccupied
andwas
transferredto
aSSO.Re
questw
assent
toOAM
tohave
2924
&29
28lined
basedon
thepatternof
theHC
leakingbe
tweentheCO
andthemain.Re
pairworkcompleted
.On6/28
29/201
7storm
drainsegm
ent
D11O
O10
29G1
(291
629
32Woo
dlandAv
e)un
derw
enth
eavy
cleaning
forfurther
CCTV
investigation.
On7/5/20
17an
attempt
toinspectthe
linefailedas
theCC
TVsystem
was
notw
orking
correctly
andrequ
iresrep
air.
CCTV
followup
on8/09
/201
7foun
dthat;the
leak
from
2928
appe
ared
tobe
dryin
thestorm
drain,theleak
from
2924
was
abated
(dye
testtestconfirm
ed),andane
wleak
was
foun
dintheho
useconn
ectio
nfrom
2918
Woo
dland(dye
testconfirm
ed).At
thistim
eno
cleanou
twas
foun
don
theprop
erty
of29
18so
thedyetestwas
performed
inabathroom
sink.
OCA
L5/5/20
16SD
UO,SSO
Subsurface
2300
3200
Blockof
Bancroft(BWB
2016
0726
WR05
)Insid
estorm
drainat
3213
BancroftRd
Jone
sFalls
Blue
Water
Baltimorerepo
rt:201
6072
6WR05
:Exceed
edthresholdforA
mmon
ia(6.18mg/L).High
opticalbrighten
ers
(19.15
ppm).Suspectedsewagecontam
ination.
Outfallislocatedun
derneath
theBa
ncroftRo
adbridge,betweenCross
Coun
tryBlvd.and
Western
RunDrive.
GPScoordinatesa
re(39.36
5479
,76
.692
952).U
tility
Mainten
ance
cctvrevealed
severalfractures
inthesanitary.Sanita
rybypassissetupun
tilrepairs
aremade.As
of9/20
repairs
completed
andou
tfall
isdry
Blue
Water
Baltimore
7/26
/201
6SD
UO,SSO
Subsurface
2315
4500
Blockof
WakefieldRd
4506
WakefieldRd
Gwynns
Falls
Sanitary
at45
06crustedover
with
grease
and45
00was
swirlingabovebe
nch.UMDclearedlineandno
wsanitary
pipe
isat
100pe
rcen
tbut
belowthebe
nch.Dy
etested
sanitary
whileho
ldingandabsent
instorm
after o
neho
ur.CC
TVpe
rformed
ofstorm
andon
lyseeseep
satthe
joints.Itispo
ssiblethelateralsareleaking.
SSOlocatedat
4506
.Still
finding
high
ammon
iainthestorm
system
.Followup
on7/12
/17foun
dtrickleof
flowinstorm
drainat
4516
Wakefield
with
lowam
mon
ia
OCA
L8/23
/201
6SD
UO,SSO
Subsurface
2348
2402
Talbot
RdSSO#45
47Inwoo
dsbe
hind
addressa
tbase
ofhill.
Gwynns
Falls
Sewageoverflo
winginto
adjacent
storm
drainpipe
.Disc
harginginto
stream
attheWindsor
MillRd
Trailhead.As
of11
/ 4no
workhasb
eendo
neby
UMDto
abatetheprob
lem
andOAM
hasn
otinitiated
contractors.
11/14/16
NM
contacted
OAM
togeta
status.Met
S.Lampo
andC.Espino
sainfie
ldat
locatio
nto
show
prob
lem.They
arecontactin
gSavinto
investigateandpe
rform
cctvof
thestorm
andsanitary
pipe
.C.Espino
samadethecallthat
since
theexactleaking
asset
hasn
otbe
eniden
tifiedthen
theisNOTan
SSOandinfactan
SDUO.11
/15Savinlocatedbroken
pipe
.OAM
createda
newSSO.12/10
REHa
rrington
completed
therepairto
thesanitary
pipe
dyetestconfirm
edabatem
ent.
Citizen
10/18/20
16SD
UO,SSO
Subsurface
2384
5400
BlockPu
rlingtonWay
5400
PurlingtonWay
Jone
sFalls
Sewagepo
ssiblyen
terin
gstorm
atseverallocations.Needto
have
storm
andsanitary
cleane
ddu
eto
heavyroot
infiltration.
Unableto
passcamera.12
/28CC
TVdo
neon
somestorm
andsanitary.Storm
was
notcleaned
yeta
ndun
ableto
passSanitary
was
done
cleane
d.Ro
otsstillpresent
insanitary
couldno
tpassa
tacoup
lelocatio
ns.U
MD
cleane
dandclearedrootsfrom
sanitary
andstorm
mainlines.cam
eraisableto
fully
pass.1/31/17
dyede
ployed
intop
sanitary
manho
leandwas
absent
inallstorm
manho
lesa
ndinlet.March
2017
twoho
useconn
ectio
ns(541
5SSO#474
6,54
07SSO#474
5)werefoun
dto
beleaking,thesewereiden
tifiedas
SSOs.Turned
over
toOAM
with
repair
recommen
datio
ns.3/12
OAM
agreed
tohave
repairs
completed
assuggested.Po
intrep
aira
t540
7andCIPP
at54
15.
Followup
Dyetestingshow
edno
dyeinstorm.M
onito
ringam
mon
iaintheinleta
tTaplow.D
ueto
thelowbacteriaand
FecalD
NAindicatorresults,aso
f6/19/17
itisde
term
ined
that
thisSD
UOhasb
eenresolved
.
OCA
L11
/15/20
16SD
UO,SSO
Subsurface
2226
5801
GreenspringRd
SSO#42
2558
01GreenspringRd
Jone
sFalls
Followup
visit
on3/17
forS
SO#fin
djointsintherig
htchanne
lofsanita
rymanho
leleakinginto
thestorm
draininlet
pipe
.3/18/16
notifiedUMDandOAM
oftheprob
lem.On4/20
/16NM
spoketo
Diegoat
OAM
fora
nup
date.On
5/5/16
contractor
finish
edrehabb
ingmanho
le.Followup
visit
finds
outgoing
pipe
isleakingagain.On5/10
/16met
Diego
infie
ldto
explainprob
lem.On5/16
/16RE
Harrington
contractor
installs19
ftof
newou
tgoing
pipe
.Followup
dye
testingshow
sewageisstillleakinginthestorm
from
themanho
le.Ho
lefoun
dintheinvertsectionof
manho
leprob
ablyfrom
bypass.O
AMisgettingcontractor
tomakerepairs.Con
tractorR
EHrepaire
dho
leon
6/10
/16.
Followup
on6/16
foun
dsm
allamou
ntof
dischargefrom
seem
ininletp
ipe.
Needto
revisit
whe
ncond
ition
sdry
out(rained
inmorning).Ro
adwas
markedforC
IPPliningintheinflo
wingpipe
.Followup
dyeteston
6/30
/16was
absent
instorm
draininletcon
nectionaftero
neho
ur.Manho
lebe
lievedto
stillbe
leaking.
OCA
Lpu
shed
OAM
tocompletelyreplace
themanho
le.AprecastM
Hwas
installedon
10/18/18
.Followup
on11
/14/16
inletp
ipeisdry.Prob
lem
abated
.
OCA
L3/17
/201
6SSOSubsurface
2252
2910
Woo
dlandAv
eSSO#43
28&
4531
2910
Woo
dland
Jone
sFalls
6inch
pipe
enterin
gstorm
mainappe
arto
bedischargingsewage.Ro
cksa
ndde
brisinpipe
.sew
ageinpipe
.Dye
presen
tafterd
eploying
dyeincleano
ut.CC
TVshow
spartia
lcollapseinlateralat4
0ftandlargedisjo
inta
t33ft.Met
E.Pind
eron
scen
e.Turned
over
toconstructio
n.Co
nstructio
nreplaced
10feet
ofpipe
.Followup
done
whilepitw
asstillop
enand
foun
dlateralnot
leaking.
Afewmon
thslater
whiledo
ingfollowup
on29
04wefoun
dlateralleaking
againturned
over
toOAM
.Followingrepairs
adyeteston
12/14/20
16foun
dlateralnolonger
leaking.
OCA
L5/11
/201
6SSOSubsurface
BaltimoreCity
FY20
17An
nualRe
port
Page
5of
8
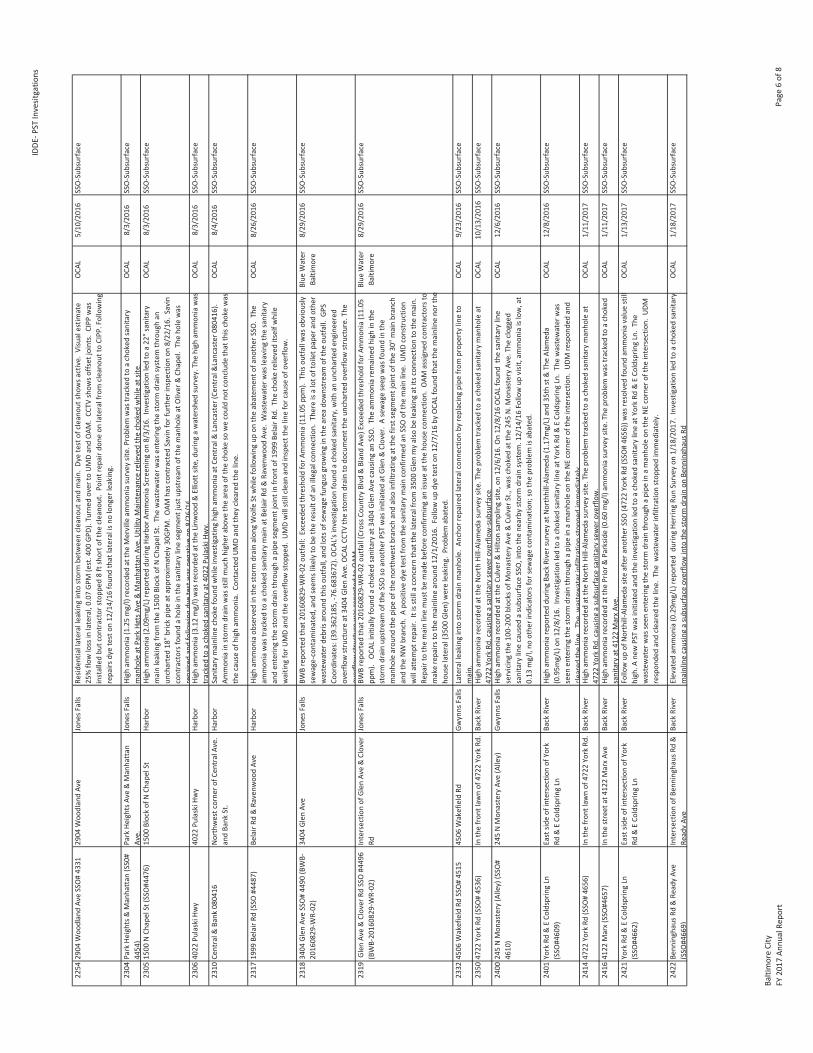
IDDE
PSTInvesitgatio
ns
2254
2904
Woo
dlandAv
eSSO#43
3129
04Woo
dlandAv
eJone
sFalls
Resid
entia
llateralleakinginto
storm
betw
eencleano
utandmain.
Dyetestof
cleano
utshow
sactive.
Visualestim
ate
25%flo
wlossinlateral,0.07
GPM
(est.400
GPD).Turne
dover
toUMDandOAM
.CC
TVshow
soffset
joints.CIPP
was
installedbu
tcon
tractorstopp
ed8ftshorto
fthe
cleano
ut.Po
intrep
aird
oneon
lateralfrom
cleano
utto
CIPP
.Following
repairs
dyeteston
12/14/16
foun
dthat
lateralisn
olonger
leaking.
OCA
L5/10
/201
6SSOSubsurface
2304
Park
Heights&
Manhattan
(SS0#
4454)
Park
HeightsA
ve&Manhattan
Ave.
Jone
sFalls
High
ammon
ia(1.25mg/l)recorded
attheMerville
ammon
iasurvey
site.Prob
lem
was
trackedto
achoked
sanitary
manho
leat
Park
HgtsAv
e&Manhattan
Ave.Utility
Mainten
ance
relievedthechoked
whileat
site.
OCA
L8/3/20
16SSOSubsurface
2305
1500
NCh
apelSt
(SSO
#447
6)15
00Blockof
NCh
apelSt
Harbor
High
ammon
ia(2.09m
g/L)repo
rted
durin
gHa
rbor
Ammon
iaScreen
ingon
8/3/16
.Investigationledto
a22
"sanita
rymainleakingfrom
the15
00Blockof
NCh
apelSt.Thewastewater
was
enterin
gthestorm
drainsystem
throughan
uncharted18
"brickpipe
atapproxim
ately30
GPM.OAM
hasc
ontractedSavinforfurther
inspectio
non
8/22
/16.
Savin
contractorsfou
ndaho
leinthesanitary
linesegm
entjustu
pstream
ofthemanho
leat
Oliver
&Ch
apel.Theho
lewas
repaire
dandfollowingdyetestwas
negativ
eon
8/26
/16
OCA
L8/3/20
16SSOSubsurface
2306
4022
PulaskiH
wy
4022
PulaskiH
wy
Harbor
High
ammon
ia(3.12mg/l)was
recorded
attheLinw
ood&Elliottsite,du
ringawatershed
survey.The
high
ammon
iawa s
trackedto
achoked
sanitary
at40
22Pu
laskiH
wy.
OCA
L8/3/20
16SSOSubsurface
2310
Central&
Bank
0804
16Northwestcorne
rofC
entralAv
e.andBa
nkSt.
Harbor
Sanitary
mainlinechokefoun
dwhileinvestigatinghigh
ammon
iaat
Central&
Lancaster(Ce
ntral&
Lancaster0
8041
6).
Ammon
iainstorm
drainwas
stillmuchhigher
abovethearea
ofthechokeso
wecouldno
tcon
clud
ethat
thischokewas
thecauseof
high
ammon
ia.Co
ntactedUMDandthey
clearedtheline.
OCA
L8/4/20
16SSOSubsurface
2317
1999
BelairRd
(SSO
#448
7)Be
lairRd
&Ra
venw
oodAv
eHa
rbor
High
ammon
iaob
served
inthestorm
drainalon
gWolfe
Stwhilefollowingup
ontheabatem
ento
fano
ther
SSO.The
ammon
iawas
trackedto
achoked
sanitary
mainat
BelairRd
&Ra
venw
oodAv
e.Wastewater
was
leavingthesanitary
anden
terin
gthestorm
drainthroughapipe
segm
entjoint
infron
tof1
999Be
lairRd
.Thechokerelieveditselfw
hile
waitin
gforU
MDandtheoverflo
wstop
ped.
UMDwillstillcleanandinspectthe
lineforcause
ofoverflo
w.
OCA
L8/26
/201
6SSOSubsurface
2318
3404
Glen
AveSSO#44
90(BWB
2016
0829
WR02
)34
04Glen
Ave
Jone
sFalls
BWBrepo
rted
that
2016
0829
WR02
outfall:Exceed
edthresholdforA
mmon
ia(11.05
ppm).Thisou
tfallw
asob
viou
slysewagecontam
inated
,and
seem
slikelyto
betheresultof
anillegalconn
ectio
n.Thereisaloto
ftoiletp
aper
andothe
rwastewater
debrisarou
ndthisou
tfall,andlotsof
sewagefungus
grow
inginthearea
downstream
oftheou
tfall.GP
SCo
ordinates:(39.36
2185
,76
.683
672).O
CAL'sinvestig
ationfoun
dachoked
sanitary,w
ithan
uncharteden
gine
ered
overflo
wstructureat
3404
Glen
Ave.OCA
LCC
TVthestorm
drainto
documen
tthe
unchartedoverflo
wstructure.The
overflo
wstructurewas
repo
rted
toOAM
Blue
Water
Baltimore
8/29
/201
6SSOSubsurface
2319
Glen
Ave&Clover
RdSSO#449
6(BWB20
1608
29WR02
)Intersectio
nof
Glen
Ave&Clover
RdJone
sFalls
BWBrepo
rted
that
2016
0829
WR02
outfall(CrossC
ountry
Blvd
&BlandAv
e)Exceed
edthresholdforA
mmon
ia(11.05
ppm).
OCA
Linitiallyfoun
dachoked
sanitary
at34
04Glen
Avecausingan
SSO.Theam
mon
iaremaine
dhigh
inthe
storm
drainup
stream
oftheSSOso
anothe
rPST
was
initiated
atGlen
&Clover.Asewageseep
was
foun
dinthe
manho
learou
ndthepipe
oftheno
rthw
estb
ranchandalso
infiltratingat
thefirstsegm
entjoint
ofthe30
"mainbranch
andtheNW
branch.Apo
sitivedyetestfrom
thesanitary
mainconfirm
edan
SSOof
themainline.
UMDconstructio
nwillattempt
repair.
Itisstillaconcernthat
thelateralfrom
3500
Glen
myalso
beleakingat
itsconn
ectio
nto
themain.
Repairto
themainlinemustb
emadebe
fore
confirm
ingan
issue
attheho
useconn
ectio
n.OAM
assig
nedcontractorsto
makerepairs
tothemainlinearou
nd12
/1/201
6.Followup
dyeteston
12/7/16by
OCA
Lfoun
dthat
themainlineno
rthe
houselateral(35
00Glen
)wereleaking.
Prob
lem
abated
.
Blue
Water
Baltimore
8/29
/201
6SSOSubsurface
2332
4506
WakefieldRd
SSO#45
1545
06WakefieldRd
Gwynns
Falls
Lateralleaking
into
storm
drainmanho
le.An
chor
repaire
dlateralcon
nectionby
replacingpipe
from
prop
ertylineto
main.
OCA
L9/23
/201
6SSOSubsurface
2350
4722
York
Rd(SSO
#45
36)
Inthefron
tlaw
nof
4722
York
Rd.Ba
ckRiver
High
ammon
iarecorded
attheNorth
HillAlam
edasurvey
site.Theprob
lem
trackedto
achoked
sanitary
manho
leat
4722
York
Rd,causin
gasanitary
sewer
overflo
wsubsurface.
OCA
L10
/13/20
16SSOSubsurface
2400
245NMon
astery
(Alley)(SSO
#46
10)
245NMon
astery
Ave(Alley)
Gwynns
Falls
High
ammon
iarecorded
attheCu
lver
&Hilto
nsamplingsite,on
12/6/16.On12
/8/16OCA
Lfoun
dthesanitary
line
servicingthe10
020
0blocks
ofMon
astery
Ave&Cu
lver
St.,was
choked
atthe24
5N.M
onastery
Ave.Theclogged
sanitary
linecaused
asubsurface
SSO,intothene
arby
storm
drainsystem
.12/14
/16Followup
visit,ammon
iaislow,at
0.13
mg/l,no
othe
rind
icatorsfor
sewagecontam
ination;
sotheprob
lem
isabated
.
OCA
L12
/6/201
6SSOSubsurface
2401
York
Rd&ECo
ldsprin
gLn
(SSO
#460
9)Eastsid
eof
intersectio
nof
York
Rd&ECo
ldsprin
gLn
Back
River
High
ammon
iarepo
rted
durin
gBa
ckRiversurveyat
NorthhillAlam
eda(1.17m
g/L)and35
thst&TheAlam
eda
(0.95m
g/L)on
12/8/16.
Investigationledto
achoked
sanitary
lineat
York
Rd&ECo
ldsprin
gLn.Thewastewater
was
seen
enterin
gthestorm
drainthroughapipe
inamanho
leon
theNEcorner
oftheintersectio
n.UDM
respon
dedand
clearedtheline
Thewastewater
infiltrationstop
pedim
med
iately
OCA
L12
/8/201
6SSOSubsurface
2414
4722
York
Rd(SSO
#46
56)
Inthefron
tlaw
nof
4722
York
Rd.Ba
ckRiver
High
ammon
iarecorded
attheNorth
HillAlam
edasurvey
site.Theprob
lem
trackedto
achoked
sanitary
manho
leat
4722
York
Rd,causin
gasubsurface
sanitary
sewer
overflo
w.
OCA
L1/11
/201
7SSOSubsurface
2416
4122
Marx(SSO
#465
7)Inthestreet
at41
22MarxAv
eBa
ckRiver
High
ammon
iarecorded
atthePrior&
Parksid
e(0.60mg/l)am
mon
iasurvey
site.Theprob
lem
was
trackedto
achoked
sanitary
at41
22MarxAv
e.OCA
L1/11
/201
7SSOSubsurface
2421
York
Rd&ECo
ldsprin
gLn
(SSO
#466
2)Eastsid
eof
intersectio
nof
York
Rd&ECo
ldsprin
gLn
Back
River
Followup
ofNorthillAlam
edasiteaftera
nother
SSO(472
2Yo
rkRd
(SSO
#46
56))was
resolved
foun
dam
mon
iavaluestill
high.A
newPSTwas
initiated
andtheinvestigationledto
achoked
sanitary
lineat
York
Rd&ECo
ldsprin
gLn.The
wastewater
was
seen
enterin
gthestorm
drainthroughapipe
inamanho
leon
theNEcorner
oftheintersectio
n.UDM
respon
dedandclearedtheline.
Thewastewater
infiltrationstop
pedim
med
iately.
OCA
L1/13
/201
7SSOSubsurface
2422
Benn
inghausR
d&Re
adyAv
e(SSO
#466
9)Intersectio
nof
Benn
inghausR
d&
ReadyAv
eBa
ckRiver
Elevated
ammon
ia(0.29m
g/L)repo
rted
durin
gHe
rringRu
nSurvey
on1/18
/201
7.Investigationledto
achoked
sanitary
mainlinecausingasubsurface
overflo
winto
thestorm
drainon
Benn
inghausR
dOCA
L1/18
/201
7SSOSubsurface
BaltimoreCity
FY20
17An
nualRe
port
Page
6of
8
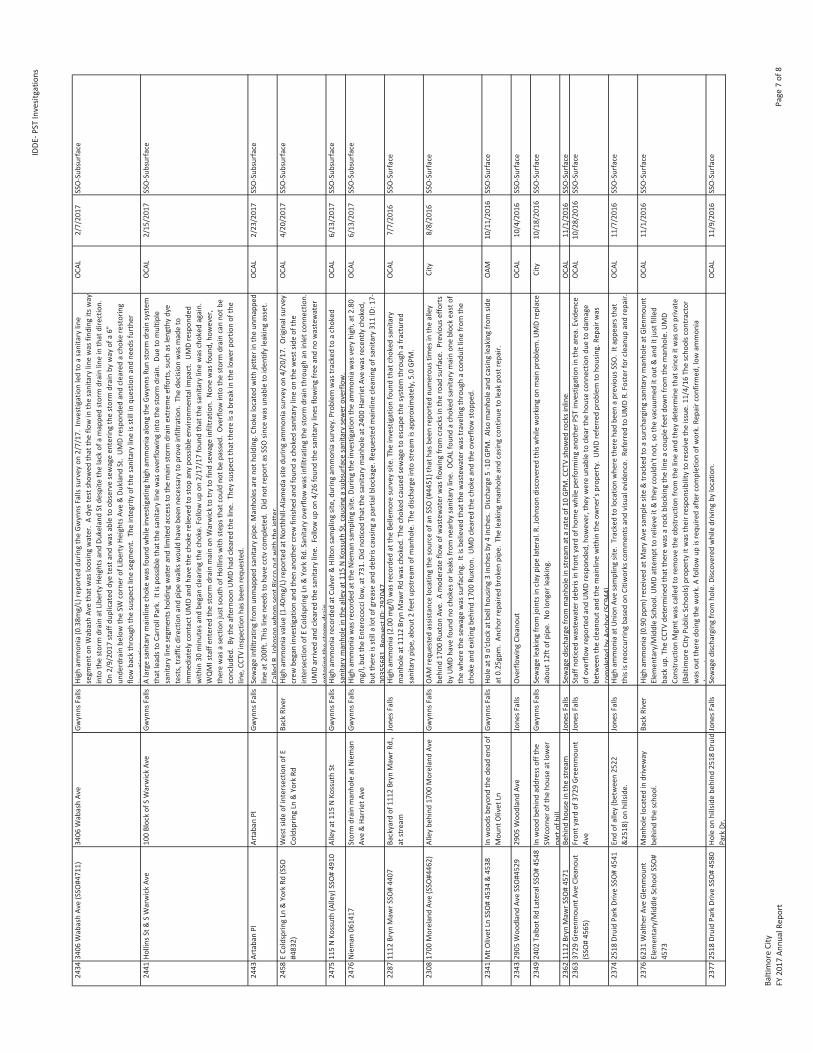
IDDE
PSTInvesitgatio
ns
2434
3406
WabashAv
e(SSO
#471
1)34
06WabashAv
eGw
ynns
Falls
High
ammon
ia(0.38m
g/L)repo
rted
durin
gtheGw
ynns
Falls
survey
on2/7/17
.Investigationledto
asanitary
line
segm
ento
nWabashAv
ethat
was
loosingwater.Adyetestshow
edthat
theflo
winthesanitary
linewas
finding
itsway
into
thestorm
drainat
Libe
rtyHe
ightsa
ndDu
keland
Stde
spite
thelack
ofamappe
dstorm
drainlineinthat
direction.
On2/9/20
17staffd
uplicated
dyetestandwas
ableto
observesewageen
terin
gthestorm
drainby
way
ofa6"
unde
rdrainbe
lowtheSW
corner
ofLibe
rtyHe
ightsA
ve&Du
klandSt.UMDrespon
dedandclearedachokerestoring
flowback
throughthesuspectlinesegm
ent.
Theintegrity
ofthesanitary
lineisstillinqu
estio
nandne
edsfurther
investigation
OCA
L2/7/20
17SSOSubsurface
2441
Hollins
St&SWarwickAv
e10
0Blockof
SWarwickAv
eGw
ynns
Falls
Alargesanitary
mainlinechokewas
foun
dwhileinvestigatinghigh
ammon
iaalon
gtheGw
ynns
Runstorm
drainsystem
that
leadstoCarrollPark.
Itispo
ssiblethat
thesanitary
linewas
overflo
winginto
thestorm
drain.
Dueto
multip
lesanitary
linesegm
entsho
ldingwater
andlim
itedaccessto
themainstorm
drainextrem
eefforts,such
aslengthydye
tests,traffic
directionandpipe
walks
wou
ldhave
been
necessaryto
proveinfiltration.
Thede
cisio
nwas
madeto
immed
iatelycontactU
MDandhave
thechokerelievedto
stop
anypo
ssibleen
vironm
entalimpact.UMDrespon
ded
with
in30
minutes
andbe
ganclearin
gthechoke.Followup
on2/17
/17foun
dthat
thesanitary
linewas
choked
again.
WQMIstaffen
teredthestorm
drainmainon
Warwickto
tryto
findsewageinfiltration.
Non
ewas
foun
d,ho
wever,
therewas
asectionjustsouthof
Hollins
with
step
sthatcou
ldno
tbepassed
.Overflowinto
thestorm
draincanno
tbe
conclude
d.By
theafternoo
nUMDhadclearedtheline.
They
suspectthatthe
reisabreakinthelower
portionof
the
line,CC
TVinspectio
nhasb
eenrequ
ested.
OCA
L2/15
/201
7SSOSubsurface
2443
ArtabanPl
ArtabanPl
Gwynns
Falls
Sewageinfiltratingfrom
unmappe
dsanitary
pipe
.Manho
lesa
reno
tholding.C
hoke
locatedwith
jetter
intheun
mappe
dlineat
200ft.Thislinene
edstohave
cctvcompleted
.Didno
trep
orta
sSSO
since
was
unableto
iden
tifyleakingasset.
CalledR.
John
sonwho
msent
Riccoou
twith
thejetter.
OCA
L2/23
/201
7SSOSubsurface
2458
ECo
ldsprin
gLn
&Yo
rkRd
(SSO
#483
2)Westsideof
intersectio
nof
ECo
ldsprin
gLn
&Yo
rkRd
Back
River
High
ammon
iavalue(1.40m
g/L)repo
rted
atNorthhillAlam
edasitedu
ringam
mon
iasurvey
on4/20
/17.
Orig
inalsurvey
crew
beganinvestigationandthen
anothe
rcrewfin
ished
andfoun
dachoked
sanitary
lineon
thewestsideof
the
intersectio
nof
ECo
ldsprin
gLn
&Yo
rkRd
.Sanita
ryoverflo
wwas
infiltratingthestorm
drainthroughan
inletcon
nection.
UMDarriv
edandclearedthesanitary
line.
Followup
on4/26
foun
dthesanitary
lines
flowingfree
andno
wastewater
enterin
gthestorm
drain
OCA
L4/20
/201
7SSOSubsurface
2475
115NKo
ssuth(Alley)SSO#49
10Alleyat
115NKo
ssuthSt
Gwynns
Falls
High
ammon
iarecorded
atCu
lver
&Hilto
nsamplingsite,du
ringam
mon
iasurvey.Problem
was
trackedto
achoked
sanitar y
manho
leinthealleyat
115NKo
ssuthSt,causin
gasubsurface
sanitary
sewer
overflo
w.
OCA
L6/13
/201
7SSOSubsurface
2476
Nieman
0614
17Storm
drainmanho
leat
Nieman
Ave&Ha
rrietA
veGw
ynns
Falls
High
ammon
iawas
recorded
attheNieman
samplingsite.Du
ringtheinvestigationtheam
mon
iawas
very
high,at2
.80
mg/l,bu
tthe
Enterococcilow
,at7
31.D
idno
ticed
that
thesanitary
manho
leat
2400
HarrietA
vewas
recentlychoked
,bu
tthe
reisstillaloto
fgreaseandde
briscausingapartialblockage.Re
questedmainlinecleaning
ofsanitary
311ID:17
0035
5681
Requ
estID:
2920
47
OCA
L6/13
/201
7SSOSubsurface
2287
1112
Bryn
Maw
rSSO
#44
07Ba
ckyard
of11
12Bryn
Maw
rRd.,
atstream
Jone
sFalls
High
ammon
ia(2.00mg/l)was
recorded
attheBe
llemoresurvey
site.Theinvestigationfoun
dthat
choked
sanitary
manho
leat
1112
Bryn
Maw
rRdwas
choked
.The
choked
caused
sewageto
escape
thesystem
throughafractured
sanitary
pipe
,abo
ut2feet
upstream
ofmanho
le.The
dischargeinto
stream
isapproxim
ately,5.0GP
M.
OCA
L7/7/20
16SSOSurface
2308
1700
MorelandAv
e(SSO
#446
2)Alleybe
hind
1700
MorelandAv
eGw
ynns
Falls
OAM
requ
estedassistancelocatin
gthesource
ofan
SSO(#44
51)thath
asbe
enrepo
rted
numerou
stim
esinthealley
behind
1700
Ruxton
Ave.
Amod
erateflo
wof
wastewater
was
flowingfrom
cracks
intheroad
surface.
Previous
efforts
byUMDhave
foun
dno
chokes
orleaksfrom
nearby
sanitary
line.
OCA
Lfoun
dachoked
sanitary
mainon
eblockeastof
thewhe
rethesewagewas
surfacing.
Itisbe
lievedthat
thewastewater
was
travelingthroughacond
uitlinefrom
the
chokeandexiting
behind
1700
Ruxton
.UMDclearedthechokeandtheoverflo
wstop
ped.
City
8/8/20
16SSOSurface
2341
MtO
livet
LnSSO#45
34&45
38Inwoo
dsbe
yond
thede
aden
dof
Mou
ntOlivet
LnGw
ynns
Falls
Holeat
9o'clockat
bellho
using3inches
by4inches.Discharge5
10GP
M.Also
manho
leandcasin
gleakingfrom
side
at0.25
gpm.An
chor
repaire
dbroken
pipe
.Theleakingmanho
leandcasin
gcontinue
toleak
postrepair.
OAM
10/11/20
16SSOSurface
2343
2905
Woo
dlandAv
eSSO#452
929
05Woo
dlandAv
eJone
sFalls
OverflowingCleano
utOCA
L10
/4/201
6SSOSurface
2349
2402
Talbot
RdLateralSSO
#45
48Inwoo
dbe
hind
addresso
ffthe
SWcorner
oftheho
useat
lower
partof
hill.
Gwynns
Falls
Sewageleakingfrom
jointsinclay
pipe
lateral.R.
John
sondiscovered
thiswhileworking
onmainprob
lem.U
MDreplace
abou
t12fto
fpipe.
Nolonger
leaking.
City
10/18/20
16SSOSurface
2362
1112
Bryn
Maw
rSSO
#45
71Be
hind
houseinthestream
Jone
sFalls
Sewagedischargefrom
manho
leinstream
atarate
of10
GPM.CCT
Vshow
edrocksinline.
OCA
L11
/1/2016
SSOSurface
2363
3729
Greenm
ount
AveCleano
ut(SSO
#45
65)
Fron
tyardof
3729
Greenm
ount
Ave
Jone
sFalls
Staffn
oticed
wastewater
debrisinfron
tyardof
homewhilepe
rforminganothe
rPST
investigationinthearea.Evide
nce
ofoverflo
wrepo
rted
andUMDrespon
ded,ho
wever,the
ywereun
ableto
clearthe
houseconn
ectio
ndu
eto
damage
betw
eenthecleano
utandthemainlinewith
intheow
ner's
prop
erty.UMDreferred
prob
lem
toho
using.Re
pairwas
completed
byAn
chor
(SC9
44)
OCA
L10
/28/20
16SSOSurface
2374
2518
DruidPark
DriveSSO#45
41Endof
alley(between25
22&25
18)o
nhillside.
Jone
sFalls
High
ammon
iaat
Union
Avesamplingsite.
Trackedto
locatio
nwhe
retherehadbe
enaprevious
SSO.Itappe
arsthat
thisisreoccurringbasedon
Citiw
orks
commen
tsandvisualeviden
ce.Re
ferred
toUMDR.
Foster
for cleanup
andrepair.
OCA
L11
/7/201
6SSOSurface
2376
6231
Walther
AveGlen
mou
ntElem
entary/M
iddleScho
olSSO#
4573
Manho
lelocatedindrivew
aybe
hind
thescho
ol.
Back
River
High
ammon
ia(0.90pp
m)receivedat
MaryAv
esamplesite&trackedto
asurchargingsanitary
manho
leat
Glen
mou
ntElem
entary/M
iddleScho
ol.U
MDattempt
torelieve
it&they
couldn
'tno
t,so
thevacuum
editou
t&anditjustfilled
back
up.The
CCTV
determ
ined
that
therewas
arock
blocking
thelineacoup
lefeet
downfrom
themanho
le.U
MD
Constructio
nMgm
twas
calledto
removetheob
structionfrom
thelineandthey
determ
inethat
since
itwas
onprivate
(Baltim
oreCity
PublicScho
ols)prop
ertyitwas
theirrespo
nsibility
toresolvetheissue
.11/4/16
Thescho
olsc
ontractor
was
outthe
redo
ingthework.Afollowup
isrequ
iredaftercom
pletionof
work.Re
pairconfirm
ed,low
ammon
iado
wnstream
OCA
L11
/1/201
6SSOSurface
2377
2518
DruidPark
DriveSSO#45
80Ho
leon
hillsidebe
hind
2518
Druid
Park
Dr.
Jone
sFalls
Sewagedischargingfrom
hole.D
iscovered
whiledrivingby
locatio
n.OCA
L11
/9/201
6SSOSurface
BaltimoreCity
FY20
17An
nualRe
port
Page
7of
8
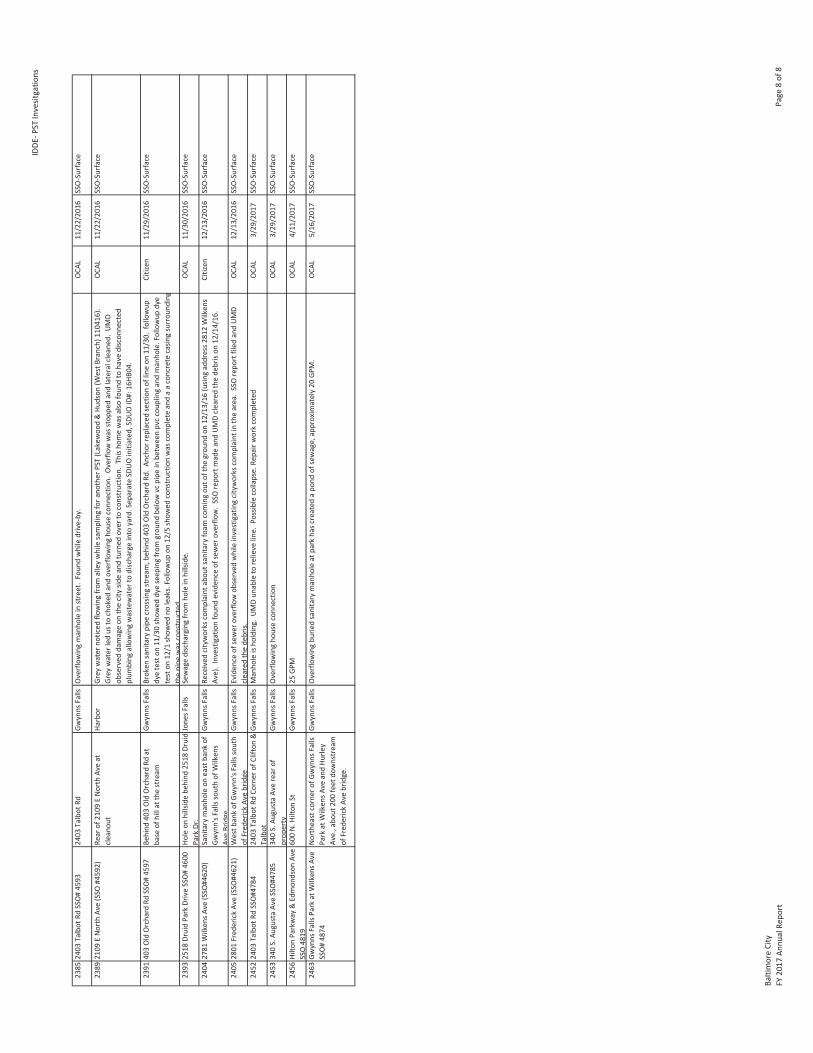
IDDE
PSTInvesitgatio
ns
2385
2403
Talbot
RdSSO#45
9324
03Talbot
RdGw
ynns
Falls
Overflowingmanho
leinstreet.Foun
dwhiledriveby.
OCA
L11
/22/20
16SSOSurface
2389
2109
ENorth
Ave(SSO
#459
2)Re
arof
2109
ENorth
Aveat
cleano
utHa
rbor
Grey
water
noticed
flowingfrom
alleywhilesamplingfora
nother
PST(Lakew
ood&Hu
dson
(WestB
ranch)
1104
16).
Grey
water
ledus
tochoked
andoverflo
wingho
useconn
ectio
n.Overflowwas
stop
pedandlateralcleaned
.UMD
observed
damageon
thecity
sideandturned
over
toconstructio
n.Thisho
mewas
also
foun
dto
have
discon
nected
plum
bing
allowingwastewater
todischargeinto
yard.Sep
arateSD
UOinitiated
,SDU
OID#:16
HB04
.
OCA
L11
/22/20
16SSOSurface
2391
403OldOrchard
RdSSO#45
97Be
hind
403OldOrchard
Rdat
base
ofhillat
thestream
Gwynns
Falls
Broken
sanitary
pipe
crossin
gstream
,beh
ind40
3OldOrchard
Rd.An
chor
replaced
sectionof
lineon
11/30.
followup
dyeteston
11/30show
eddyeseep
ingfrom
grou
ndbe
lowvc
pipe
inbe
tweenpvccoup
lingandmanho
le.Followup
dye
teston
12/1
show
edno
leaks.Followup
on12
/5show
edconstructio
nwas
completeandaaconcrete
casin
gsurrou
nding
thepipe
was
constructed
Citizen
11/29/20
16SSOSurface
2393
2518
DruidPark
DriveSSO#46
00Ho
leon
hillsidebe
hind
2518
Druid
Park
Dr.
Jone
sFalls
Sewagedischargingfrom
holeinhillside.
OCA
L11
/30/20
16SSOSurface
2404
2781
Wilken
sAve
(SSO
#462
0)Sanitary
manho
leon
eastbank
ofGw
ynn'sF
allssouthof
Wilken
sAv
eBridge
Gwynns
Falls
Received
cityworks
complaint
abou
tsanita
ryfoam
comingou
tofthe
grou
ndon
12/13/16
(usin
gaddress2
812Wilken
sAv
e).Investigationfoun
deviden
ceof
sewer
overflo
w.SSOrepo
rtmadeandUMDclearedthede
brison
12/14/16
.Citizen
12/13/20
16SSOSurface
2405
2801
Fred
erickAv
e(SSO
#462
1)Westb
ankof
Gwynn'sF
allssouth
ofFred
erickAv
ebridge
Gwynns
Falls
Eviden
ceof
sewer
overflo
wob
served
whileinvestigatingcityworks
complaint
inthearea.SSOrepo
rtfiled
andUMD
clearedthede
bris.
OCA
L12
/13/20
16SSOSurface
2452
2403
Talbot
RdSSO#478
424
03Talbot
RdCo
rner
ofClifton
&Talbot
Gwynns
Falls
Manho
leisho
lding.
UMDun
ableto
relieve
line.
Possiblecollapse.Re
pairworkcompleted
OCA
L3/29
/201
7SSOSurface
2453
340S.Au
gustaAv
eSSO#478
534
0S.Au
gustaAv
erear
ofprop
erty
Gwynns
Falls
Overflowingho
useconn
ectio
nOCA
L3/29
/201
7SSOSurface
2456
Hilto
nParkway
&Edmon
dson
Ave
SSO48
1960
0N.H
ilton
StGw
ynns
Falls
25GP
MOCA
L4/11
/201
7SSOSurface
2463
Gwynns
Falls
Park
atWilken
sAve
SSO#48
74Northeastcorner
ofGw
ynns
Falls
Park
atWilken
sAve
andHu
rley
Ave.,abo
ut20
0feet
downstream
ofFred
erickAv
ebridge.
Gwynns
Falls
Overflowingbu
riedsanitary
manho
leat
park
hasc
reated
apo
ndof
sewage,approxim
ately20
GPM.
OCA
L5/16
/201
7SSOSurface
BaltimoreCity
FY20
17An
nualRe
port
Page
8of
8
Appendix J: Progress Status of MilestonesTable J 1: MS4 and TMDL WIP Milestones [Ref. MS4 Restoration and TMDL WIP,part 5, dated August 2015]Table J 2: Trash TMDL Implementation Milestones [Ref. Implementation Plan for theMiddle Branch/Northwest Branch Trash TMDL in Baltimore, Part 7.1, dated January2016]
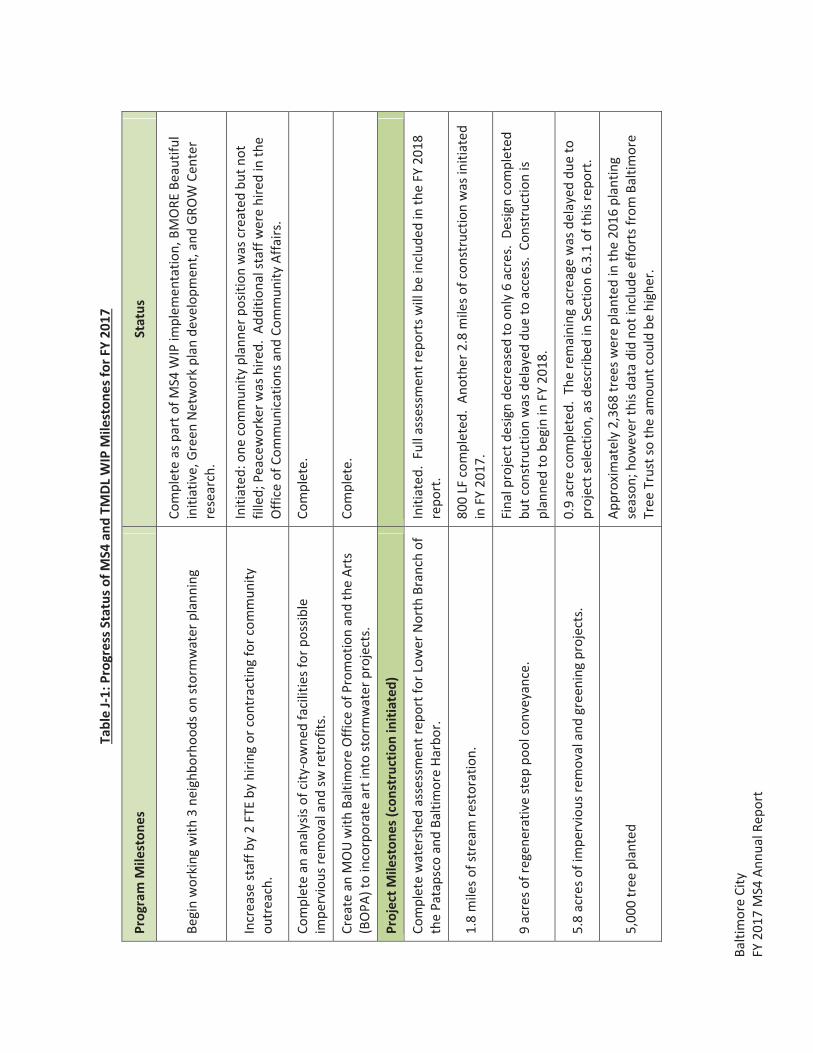
BaltimoreCity
FY20
17MS4
Annu
alRe
port
TableJ1:
Progress
Status
ofMS4
andTM
DLWIP
Mileston
esforF
Y20
17
Program
Mileston
esStatus
Beginworking
with
3ne
ighb
orho
odso
nstormwater
planning
Completeas
partof
MS4
WIPim
plem
entatio
n,BM
ORE
Beautiful
initiative,GreenNetworkplan
developm
ent,andGR
OW
Center
research.
Increase
staffb
y2FTEby
hirin
gor
contractingforcom
mun
ityou
treach.
Initiated
:one
commun
ityplanne
rposition
was
createdbu
tnot
filled;
Peacew
orkerw
ashired.
Additio
nalstaffwerehiredinthe
Office
ofCo
mmun
ications
andCo
mmun
ityAffairs.
Completean
analysisof
city
owne
dfacilitiesfor
possible
impe
rvious
removalandsw
retrofits.
Complete.
Create
anMOUwith
BaltimoreOffice
ofProm
otionandtheArts
(BOPA
)toincorporateartintostormwater
projects.
Complete.
ProjectM
ileston
es(con
structioninitiated
)
Completewatershed
assessmen
trep
ortfor
Lower
North
Branch
ofthePatapsco
andBa
ltimoreHa
rbor.
Initiated
.Fullassessmen
trep
ortswillbe
includ
edintheFY
2018
repo
rt.
1.8mileso
fstream
restoration.
800LF
completed
.An
othe
r2.8mileso
fcon
structionwas
initiated
inFY
2017
.
9acreso
fregen
erativestep
poolconveyance.
Finalprojectde
signde
creasedto
only6acres.
Desig
ncompleted
butcon
structionwas
delayeddu
eto
access.Co
nstructio
nis
planne
dto
begininFY
2018
.
5.8acreso
fimpe
rvious
removalandgreening
projects.
0.9acre
completed
.Th
eremaining
acreagewas
delayeddu
eto
projectselectio
n,as
describ
edinSection6.3.1of
thisrepo
rt.
5,00
0tree
planted
Approxim
ately2,36
8treesw
ereplantedinthe20
16plantin
gseason
;how
ever
thisdata
didno
tinclude
effortsfrom
Baltimore
Tree
Trustsotheam
ount
couldbe
higher.
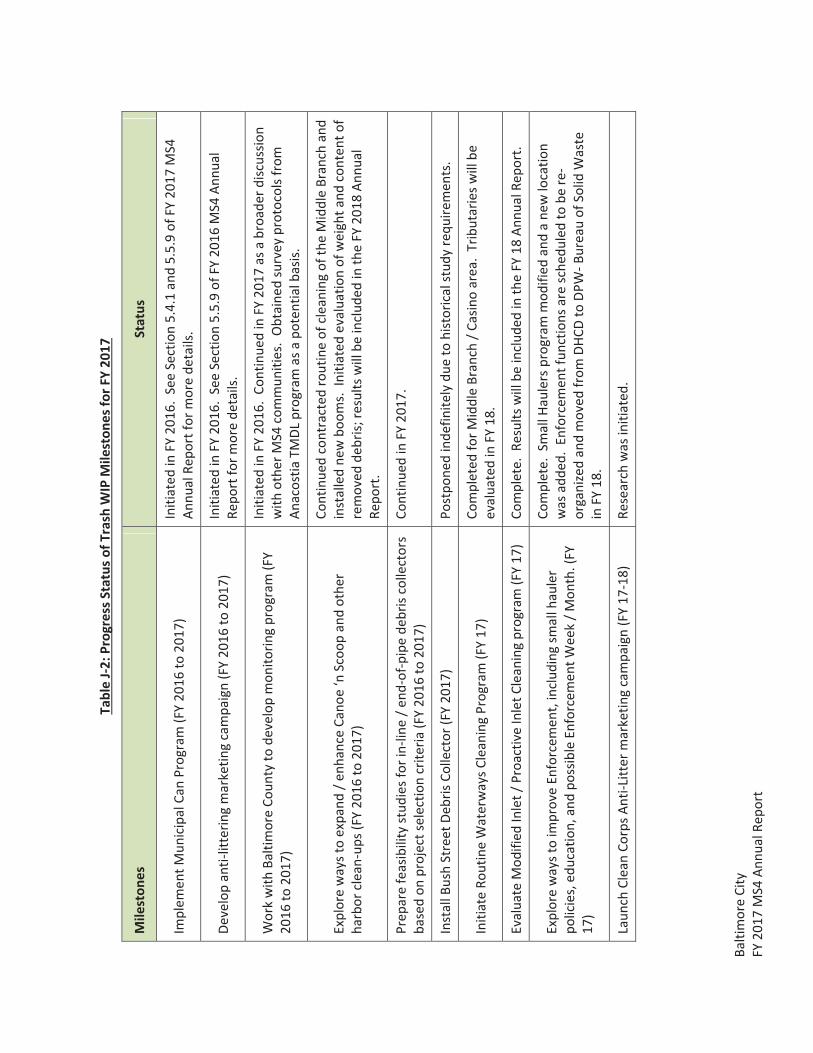
BaltimoreCity
FY20
17MS4
Annu
alRe
port
TableJ2:
Progress
Status
ofTrashWIP
Mileston
esforF
Y20
17
Mileston
esStatus
Implem
entM
unicipalCa
nProgram
(FY20
16to
2017
)Initiated
inFY
2016
.SeeSection5.4.1and5.5.9of
FY20
17MS4
Annu
alRe
portform
orede
tails.
Developantilitterin
gmarketin
gcampaign(FY20
16to
2017
)Initiated
inFY
2016
.SeeSection5.5.9of
FY20
16MS4
Annu
alRe
portform
orede
tails.
Workwith
BaltimoreCo
unty
tode
velopmon
itorin
gprogram
(FY
2016
to20
17)
Initiated
inFY
2016
.Co
ntinue
dinFY
2017
asabroade
rdisc
ussio
nwith
othe
rMS4
commun
ities.Obtaine
dsurvey
protocolsfrom
Anacostia
TMDL
program
asapo
tentialbasis.
Explorewaystoexpand
/enh
ance
Cano
e‘nScoo
pandothe
rharbor
cleanup
s(FY
2016
to20
17)
Continue
dcontracted
routineof
cleaning
oftheMiddleBranch
and
installedne
wbo
oms.
Initiated
evaluatio
nof
weighta
ndconten
tof
removed
debris;
results
willbe
includ
edintheFY
2018
Annu
alRe
port.
Prep
arefeasibility
stud
iesfor
inline/e
ndof
pipe
debriscollectors
basedon
projectselectio
ncrite
ria(FY20
16to
2017
)Co
ntinue
dinFY
2017
.
InstallBushStreet
DebrisCo
llector
(FY20
17)
Postpo
nedinde
finite
lydu
eto
historicalstud
yrequ
iremen
ts.
InitiateRo
utineWaterwaysC
leaningProgram
(FY17
)Co
mpleted
forM
iddleBranch
/Casinoarea.Tributariesw
illbe
evaluatedinFY
18.
Evaluate
Mod
ified
Inlet/
ProactiveInletC
leaningprogram
(FY17
)Co
mplete.
Results
willbe
includ
edintheFY
18An
nualRe
port.
Explorewaystoim
proveEn
forcem
ent,includ
ingsm
allhauler
policies,ed
ucation,andpo
ssibleEn
forcem
entW
eek/M
onth.(FY
17)
Complete.
SmallH
aulersprogram
mod
ified
andane
wlocatio
nwas
adde
d.En
forcem
entfun
ctions
aresche
duledto
bere
organizedan
dmoved
from
DHCD
toDP
WBu
reau
ofSolid
Waste
inFY
18.
Laun
chCleanCo
rpsA
ntiLitter
marketin
gcampaign(FY17
18)
Research
was
initiated
.
Appendix K: Progress Status of Projects, Programs, and Partnerships for20% Restoration
Table K 1: Progress Status of ProjectsTable K 2: Progress Status of ProgramsTable K 3: Progress Status of Partnerships
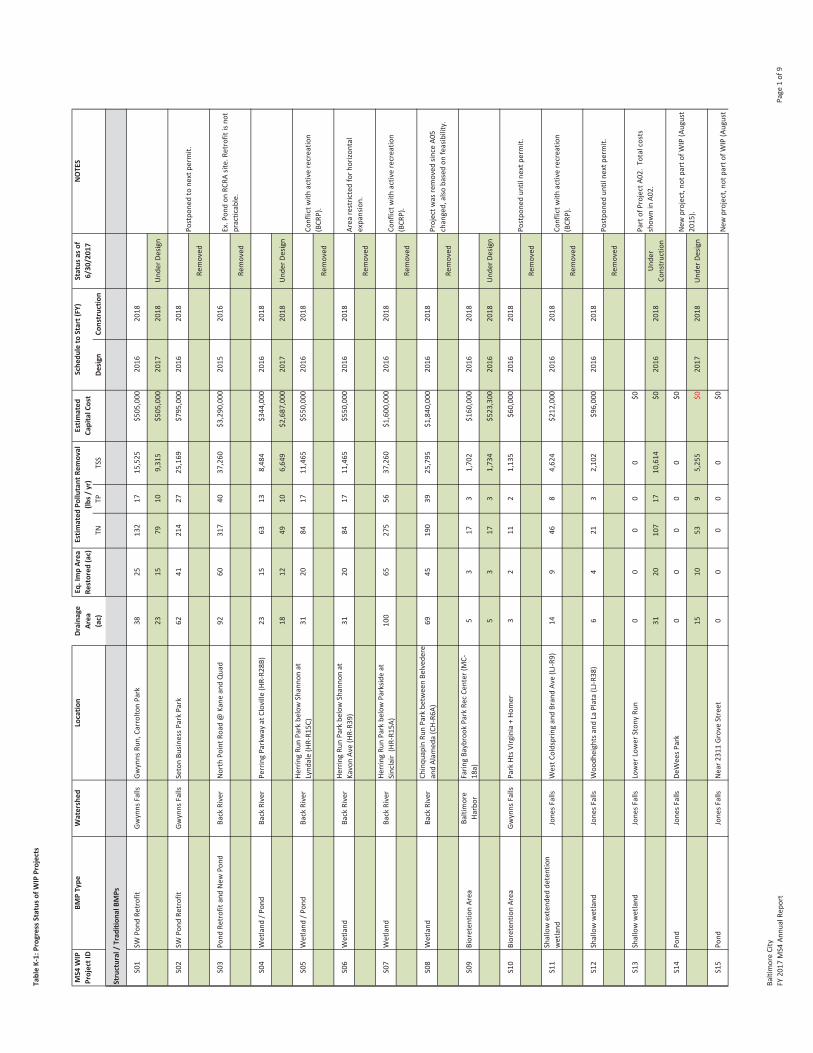
TableK1:Progress
Status
ofWIP
Projects
Draina
geArea
Status
asof
6/30
/201
7NOTES
(ac)
TNTP
TSS
Design
Constructio
n
Structural/Trad
ition
alBM
Ps
S01
SWPo
ndRe
trofit
Gwynns
Falls
Gwynns
Run,CarroltonPark
3825
132
1715
,525
$505
,000
2016
2018
SWPo
ndRe
trofit
Gwynns
Falls
123
1579
109,31
5$5
05,000
2017
2018
Und
erDe
sign
S02
SWPo
ndRe
trofit
Gwynns
Falls
SetonBu
sinessP
arkPark
6241
214
2725
,169
$795
,000
2016
2018
Removed
S03
Pond
RetrofitandNew
Pond
Back
River
North
PointR
oad@
Kane
andQuad
9260
317
4037
,260
$3,290
,000
2015
2016
Removed
S04
Wetland
/Pon
dBa
ckRiver
PerringParkway
atCloville(HRR2
8B)
2315
6313
8,48
4$3
44,000
2016
2018
Wetland
/Pon
dBa
ckRiver
118
1249
106,64
9$2
,687
,000
2017
2018
Und
erDe
sign
S05
Wetland
/Pon
dBa
ckRiver
HerringRu
nPark
belowShanno
nat
Lynd
ale(HRR1
5C)
3120
8417
11,465
$550
,000
2016
2018
Removed
S06
Wetland
Back
River
HerringRu
nPark
belowShanno
nat
KavonAv
e(HRR3
9)31
2084
1711
,465
$550
,000
2016
2018
Removed
S07
Wetland
Back
River
HerringRu
nPark
belowParksid
eat
Sinclair
(HRR1
5A)
100
6527
556
37,260
$1,600
,000
2016
2018
Removed
S08
Wetland
Back
River
Chinqu
apinRu
nPark
betw
eenBe
lved
ere
andAlam
eda(CHR6
A)69
4519
039
25,795
$1,840
,000
2016
2018
Removed
S09
Bioreten
tionArea
Baltimore
Harbor
Farin
gBa
ybrook
Park
RecCe
nter
(MC
18a)
53
173
1,70
2$1
60,000
2016
2018
Bioreten
tionArea
BaltimoreHa
rbo r
15
317
31,73
4$5
23,300
2016
2018
Und
erDe
sign
S10
Bioreten
tionArea
Gwynns
Falls
Park
HtsV
irginia+Ho
mer
32
112
1,13
5$6
0,00
020
1620
18
Removed
S11
Shallowextend
edde
tention
wetland
Jone
sFalls
WestC
oldspringandBrandAv
e(LJR
9)14
946
84,62
4$2
12,000
2016
2018
Removed
S12
Shallowwetland
Jone
sFalls
Woo
dheightsandLa
Plata(LJR
38)
64
213
2,10
2$9
6,00
020
1620
18
Removed
S13
Shallowwetland
Jone
sFalls
Lower
Lower
Ston
yRu
n0
00
00
$0
Shallowwetland
Jone
sFalls
131
2010
717
10,614
$020
1620
18Und
erCo
nstructio
n
S14
Pond
Jone
sFalls
DeWeesP
ark
00
00
0$0
Shallowwetland
Jone
sFalls
115
1053
95,25
5$0
2017
2018
Und
erDe
sign
S15
Pond
Jone
sFalls
Near2
311GroveStreet
00
00
0$0
MS4
WIP
ProjectID
BMPType
Sche
duleto
Start(FY)
Estim
ated
CapitalCost
Watershed
Locatio
nEstim
ated
Pollu
tant
Removal
(lbs/
yr)
Eq.ImpArea
Restored
(ac)
Postpo
nedto
nextpe
rmit.
Ex.Pon
don
RCRA
site.Re
trofitisno
tpracticable.
Conflictw
ithactiv
erecreatio
n(BCR
P).
Area
restrictedforh
orizo
ntal
expansion.
Conflictw
ithactiv
erecreatio
n(BCR
P).
Projectw
asremoved
since
A05
changed,also
basedon
feasibility.
Postpo
nedun
tilne
xtpe
rmit.
Conflictw
ithactiv
erecreatio
n(BCR
P).
Postpo
nedun
tilne
xtpe
rmit.
New
project,no
tparto
fWIP(August
2015
).
New
project,no
tparto
fWIP(August
Partof
ProjectA
02.To
talcosts
show
ninA0
2.
BaltimoreCity
FY20
17MS4
Annu
alRe
port
Page
1of
9
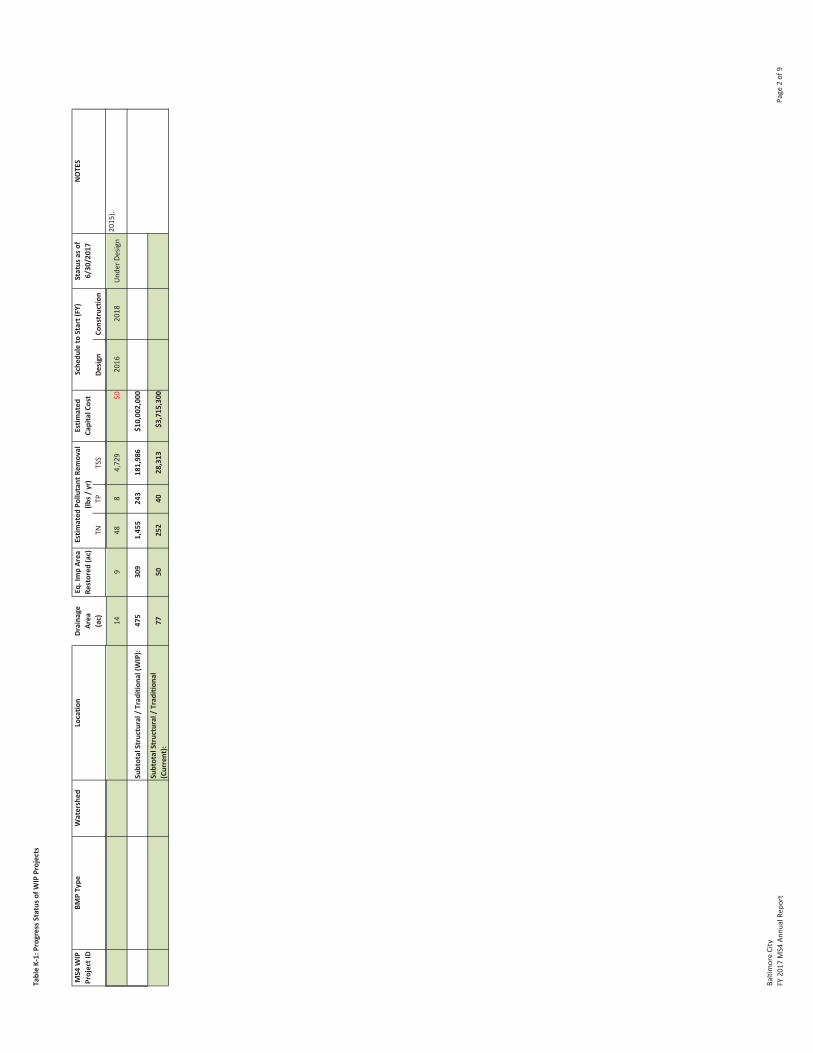
TableK1:Progress
Status
ofWIP
Projects
Draina
geArea
Status
asof
6/30
/201
7NOTES
(ac)
TNTP
TSS
Design
Constructio
n
MS4
WIP
ProjectID
BMPType
Sche
duleto
Start(FY)
Estim
ated
CapitalCost
Watershed
Locatio
nEstim
ated
Pollu
tant
Removal
(lbs/
yr)
Eq.ImpArea
Restored
(ac)
Shallowwetland
Jone
sFalls
114
948
84,72
9$0
2016
2018
Und
erDe
sign
SubtotalStructural/Trad
ition
al(W
IP):
475
309
1,45
524
318
1,98
6$1
0,00
2,00
0
SubtotalStructural/Trad
ition
al(Current):
7750
252
4028
,313
$3,715
,300
2015
).
BaltimoreCity
FY20
17MS4
Annu
alRe
port
Page
2of
9

TableK1:Progress
Status
ofWIP
Projects
Draina
geArea
Status
asof
6/30
/201
7NOTES
(ac)
TNTP
TSS
Design
Constructio
n
MS4
WIP
ProjectID
BMPType
Sche
duleto
Start(FY)
Estim
ated
CapitalCost
Watershed
Locatio
nEstim
ated
Pollu
tant
Removal
(lbs/
yr)
Eq.ImpArea
Restored
(ac)
ESDPractices
E01
Micro
bioreten
tion
Baltimore
Harbor
Cloverleaf
northw
esto
fI89
5and
FrankfurstAv
e(M
C30
)0.5
0.4
2.1
0.34
217
$50,00
020
1620
19
Removed
E02
Micro
bioreten
tion
Baltimore
Harbor
Bush
St.Curbbu
mpou
t0.3
0.2
1.2
0.20
127
$80,00
020
1120
16
Micro
bioreten
tion
BaltimoreHa
rbo r
10.3
0.2
1.2
0.19
121
$102
,900
2011
2017
Completed
E03
Micro
bioreten
tion
Baltimore
Harbor
Lafayetteinne
rblock
retrofit.
0.9
0.7
4.0
0.64
411
$240
,000
2011
2016
Micro
bioreten
tion
BaltimoreHa
rbo r
10.9
0.7
4.0
0.64
411
$308
,900
2011
2017
Completed
E14
Micro
bioreten
tion
Baltimore
Harbor
BayBroo
kMS(M
C18
b)0.3
0.3
1.5
0.2
157
$54,00
020
1520
16
Removed
E15
Micro
bioreten
tion
Baltimore
Harbor
BayBroo
kMS(M
C18
c)0.2
0.2
1.1
0.2
115
$46,80
020
1520
16
Removed
E16
Micro
bioreten
tion
Baltimore
Harbor
BayBroo
kMS
parkinglot(MC18
d)0.2
0.2
1.1
0.2
115
$34,80
020
1520
16
Removed
E18
Micro
bioreten
tion
Baltimore
Harbor
Broo
klyn
/Curtis
Bay
1.1
0.9
5.0
0.8
513
$19,80
020
1520
16
Micro
bioreten
tion
BaltimoreHa
rbo r
10.9
0.7
4.2
0.7
423
$508
,743
2016
2018
Und
erDe
sign
E19
Micro
bioreten
tion
Baltimore
Harbor
PattersonPark
(HAR5
A)0.3
0.2
1.4
0.2
139
$40,00
020
1620
18
Removed
E20
Micro
bioreten
tion
Baltimore
Harbor
Ellwoo
dPark
(HAR8
)0.2
0.1
0.7
0.1
72$2
1,00
020
1620
18
Removed
E21
Micro
bioreten
tion
Baltimore
Harbor
PattersonPark
Adjunct(HA
R6)
0.8
0.6
3.6
0.6
362
$105
,000
2016
2018
Removed
E22
Micro
bioreten
tion
Baltimore
Harbor
PattersonPark
/Highlandtow
n/
BaltimoreHighland
s5.1
4.1
24.1
3.79
2,44
6$7
10,000
2016
2018
Micro
bioreten
tion
BaltimoreHa
rbo r
11.6
1.3
7.7
1.22
785
$710
,000
2016
2018
Und
erDe
sign
E23
Micro
bioreten
tion
Back
River
Frankford/G
reater
Lauraville/B
elair
Ediso
n/C
edon
ia4.6
3.6
21.6
3.40
2,19
8$6
71,000
2016
2018
Micro
bioreten
tion
Back
River
14.8
3.8
22.6
3.55
2,29
5$6
71,000
2016
2018
Und
erDe
sign
E24
Micro
bioreten
tion
Back
River
Erdm
anAv
enue
1.4
1.2
6.8
1.07
694
$128
,000
2016
2018
Micro
bioreten
tion
Back
River
10.5
0.4
2.4
0.37
242
$128
,000
2016
2018
Und
erDe
sign
E25
Micro
bioreten
tion
Back
River
BelairRo
ad0.3
0.2
1.2
0.20
127
$77,00
020
1620
18
Micro
bioreten
tion
Back
River
10.3
0.2
1.2
0.20
127
$77,00
020
1620
18Und
erDe
sign
Postpo
nedun
tilne
xtpe
rmit.
Scho
olsche
duledforren
ovation
Scho
olsche
duledforren
ovation
Scho
olsche
duledforren
ovation
2facilities
Conflictw
ithactiv
erecreatio
n(BCR
P).
Conflictw
ithactiv
erecreatio
n(BCR
P).
Conflictw
ithactiv
erecreatio
n(BCR
P).
15facilities
32facilities
BaltimoreCity
FY20
17MS4
Annu
alRe
port
Page
3of
9
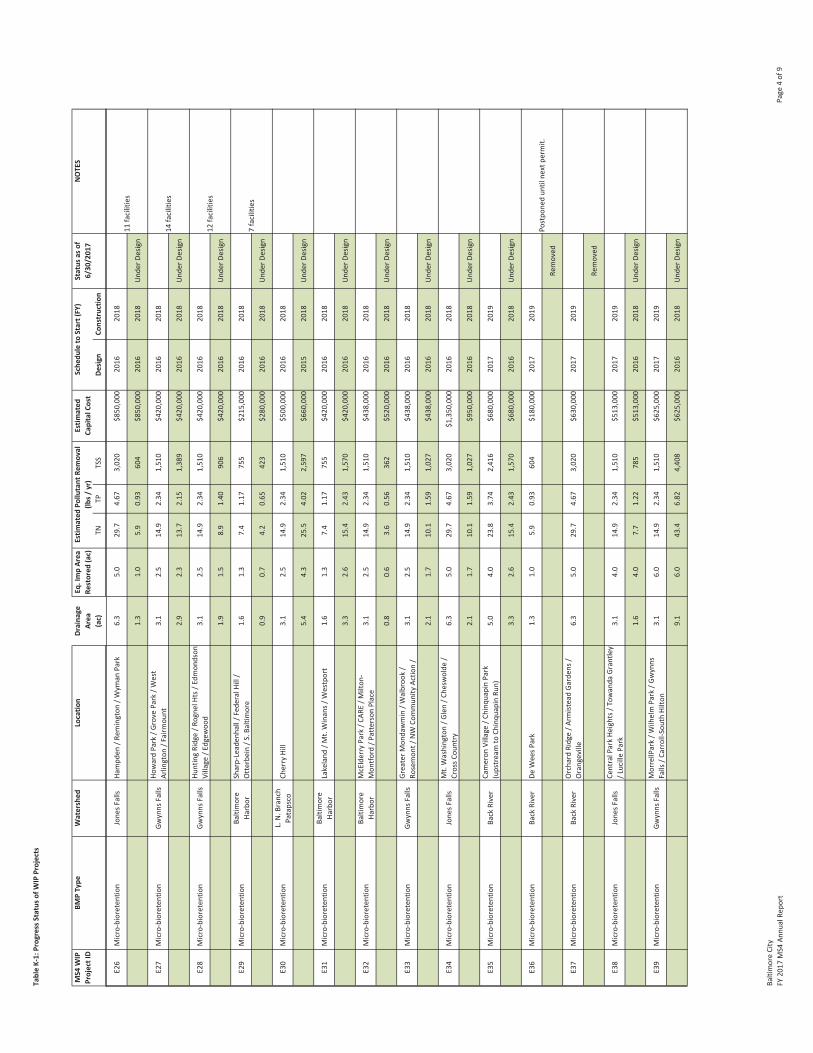
TableK1:Progress
Status
ofWIP
Projects
Draina
geArea
Status
asof
6/30
/201
7NOTES
(ac)
TNTP
TSS
Design
Constructio
n
MS4
WIP
ProjectID
BMPType
Sche
duleto
Start(FY)
Estim
ated
CapitalCost
Watershed
Locatio
nEstim
ated
Pollu
tant
Removal
(lbs/
yr)
Eq.ImpArea
Restored
(ac)
E26
Micro
bioreten
tion
Jone
sFalls
Hampd
en/R
emington
/Wym
anPark
6.3
5.0
29.7
4.67
3,02
0$8
50,000
2016
2018
Micro
bioreten
tion
Jone
sFalls
11.3
1.0
5.9
0.93
604
$850
,000
2016
2018
Und
erDe
sign
E27
Micro
bioreten
tion
Gwynns
Falls
HowardPark
/Grove
Park
/West
Arlington
/Fairm
ount
3.1
2.5
14.9
2.34
1,51
0$4
20,000
2016
2018
Micro
bioreten
tion
Gwynns
Falls
12.9
2.3
13.7
2.15
1,38
9$4
20,000
2016
2018
Und
erDe
sign
E28
Micro
bioreten
tion
Gwynns
Falls
HuntingRidge/R
ogne
lHts/E
dmon
dson
Village
/Edgew
ood
3.1
2.5
14.9
2.34
1,51
0$4
20,000
2016
2018
Micro
bioreten
tion
Gwynns
Falls
11.9
1.5
8.9
1.40
906
$420
,000
2016
2018
Und
erDe
sign
E29
Micro
bioreten
tion
Baltimore
Harbor
SharpLeaden
hall/F
ederalHill/
Otterbe
in/S
.Baltim
ore
1.6
1.3
7.4
1.17
755
$215
,000
2016
2018
Micro
bioreten
tion
BaltimoreHa
rbor
10.9
0.7
4.2
0.65
423
$280
,000
2016
2018
Und
erDe
sign
E30
Micro
bioreten
tion
L.N.B
ranch
Patapsco
Cherry
Hill
3.1
2.5
14.9
2.34
1,51
0$5
00,000
2016
2018
Micro
bioreten
tion
N.B
ranchPataps
15.4
4.3
25.5
4.02
2,59
7$6
60,000
2015
2018
Und
erDe
sign
E31
Micro
bioreten
tion
Baltimore
Harbor
Lakeland
/Mt.Winans/
Westport
1.6
1.3
7.4
1.17
755
$420
,000
2016
2018
Micro
bioreten
tion
BaltimoreHa
rbo r
13.3
2.6
15.4
2.43
1,57
0$4
20,000
2016
2018
Und
erDe
sign
E32
Micro
bioreten
tion
Baltimore
Harbor
McElderry
Park
/CAR
E/M
ilton
Mon
tford/P
atterson
Place
3.1
2.5
14.9
2.34
1,51
0$4
38,000
2016
2018
Micro
bioreten
tion
BaltimoreHa
rbor
10.8
0.6
3.6
0.56
362
$520
,000
2016
2018
Und
erDe
sign
E33
Micro
bioreten
tion
Gwynns
Falls
GreaterM
ondawmin/W
albroo
k/
Rosemon
t/NW
Commun
ityActio
n/
3.1
2.5
14.9
2.34
1,51
0$4
38,000
2016
2018
Micro
bioreten
tion
Gwynns
Falls
12.1
1.7
10.1
1.59
1,02
7$4
38,000
2016
2018
Und
erDe
sign
E34
Micro
bioreten
tion
Jone
sFalls
Mt.Washington/G
len/C
hesw
olde
/CrossC
ountry
6.3
5.0
29.7
4.67
3,02
0$1
,350
,000
2016
2018
Micro
bioreten
tion
Jone
sFalls
12.1
1.7
10.1
1.59
1,02
7$9
50,000
2016
2018
Und
erDe
sign
E35
Micro
bioreten
tion
Back
River
Cameron
Village
/Chinq
uapinPark
(upstream
toCh
inqu
apinRu
n)5.0
4.0
23.8
3.74
2,41
6$6
80,000
2017
2019
Micro
bioreten
tion
Back
River
13.3
2.6
15.4
2.43
1,57
0$6
80,000
2016
2018
Und
erDe
sign
E36
Micro
bioreten
tion
Back
River
DeWeesP
ark
1.3
1.0
5.9
0.93
604
$180
,000
2017
2019
Removed
E37
Micro
bioreten
tion
Back
River
Orchard
Ridge/A
rmisteadGa
rden
s/Orangeville
6.3
5.0
29.7
4.67
3,02
0$6
30,000
2017
2019
Removed
E38
Micro
bioreten
tion
Jone
sFalls
CentralParkHe
ights/
Towanda
Grantle
y/L
ucillePark
3.1
4.0
14.9
2.34
1,51
0$5
13,000
2017
2019
Micro
bioreten
tion
Jone
sFalls
11.6
4.0
7.7
1.22
785
$513
,000
2016
2018
Und
erDe
sign
E39
Micro
bioreten
tion
Gwynns
Falls
MorrellPark/W
ilhelm
Park
/Gwynns
Falls
/ CarrollSouthHilto
n3.1
6.0
14.9
2.34
1,51
0$6
25,000
2017
2019
Micro
bioreten
tion
Gwynns
Falls
19.1
6.0
43.4
6.82
4,40
8$6
25,000
2016
2018
Und
erDe
sign
11facilities
14facilities
12facilities
7facilities
Postpo
nedun
tilne
xtpe
rmit.
BaltimoreCity
FY20
17MS4
Annu
alRe
port
Page
4of
9

TableK1:Progress
Status
ofWIP
Projects
Draina
geArea
Status
asof
6/30
/201
7NOTES
(ac)
TNTP
TSS
Design
Constructio
n
MS4
WIP
ProjectID
BMPType
Sche
duleto
Start(FY)
Estim
ated
CapitalCost
Watershed
Locatio
nEstim
ated
Pollu
tant
Removal
(lbs/
yr)
Eq.ImpArea
Restored
(ac)
E41
Micro
bioreten
tion
Back
River
Clifton
Park
0.3
0.2
1.2
0.19
121
$35,00
020
1720
19
Removed
E42
Micro
bioreten
tion
Back
River
Clifton
Park
2.9
2.3
13.7
2.15
1,38
9$4
00,000
2017
2019
Removed
SubtotalESDPractices
(WIP):
6960
328
5233
,359
$10,39
1,40
0
SubtotalESDPractices
(Current):
4436
207
3321
,070
$9,282
,543
AlternativeBM
Ps(Stream
Restoration)
Draina
geArea
=Stream
RestorationLength
(LF)
A01
Stream
Restoration
Gwynns
Falls
LeakinPark
Stream
Restorationat
Fairm
ount
Storm
Drain
2,08
0LF
3115
614
162
,400
$700
,000
2010
2014
Stream
Restoration
Gwynns
Falls
12,08
0LF
3115
614
162
,400
$700
,000
2010
2014
Completed
A02
Stream
Restoration
Jone
sFalls
Lower
Lower
Ston
yRu
n4,50
0LF
6833
830
613
5,00
0$4
,030
,000
2015
2016
Stream
Restoration
Jone
sFalls
14,60
0LF
6934
531
313
8,00
0$4
,199
,700
2015
2017
Und
erCo
nstructio
n
A03
Stream
Restoration
Gwynns
Falls
Powde
rMillPh
ase1
3,90
0LF
5929
326
511
7,00
0$3
,420
,000
2009
2017
Stream
Restoration
Gwynns
Falls
13,90
0LF
5929
326
511
7,00
0$4
,580
,700
2009
2017
Und
erde
sign
A04
Stream
Restoration
Jone
sFalls
EastSton
yRu
nProject1
800LF
1260
5424
,000
$839
,000
2014
2017
Stream
Restoration
Jone
sFalls
180
0LF
1260
5424
,000
$1,135
,000
2014
2017
Completed
A05
Stream
Restoration
Back
River
Chinqu
apinRu
nProject1
2,20
0LF
3316
515
066
,000
$3,670
,000
2014
2017
Stream
Restoration
Back
River
110
,100
LF15
275
868
730
3,00
0$8
,103
,000
2014
2017
Und
erCo
nstructio
n
A06
Stream
Restoration
Back
River
Chinqu
apinRu
nProject2
2,60
0LF
3919
517
778
,000
$1,772
,000
2015
2017
Stream
Restoration
Back
River
12,60
0LF
3919
517
778
,000
$2,086
,000
Und
erde
sign
A07
Stream
Restoration
Gwynns
Falls
FranklintownCu
lvert
2,40
0LF
3618
016
372
,000
$1,700
,000
2015
2018
Stream
Restoration
Gwynns
Falls
12,90
0LF
4421
819
787
,000
$3,410
,300
2015
2018
Und
erDe
sign
A08
Stream
Restoration
Back
River
Lower
Moo
re'sRu
nProject2
2,50
0LF
3818
817
075
,000
$1,960
,000
2015
2018
Stream
Restoration
Back
River
12,50
0LF
3818
817
075
,000
$2,144
,000
2015
2018
Und
erDe
sign
A09
Stream
Restoration
Back
River
Bidd
isonRu
nProject2
3,03
0LF
4522
720
690
,900
$3,590
,000
2014
2018
Stream
Restoration
Back
River
13,06
0LF
4623
020
891
,800
$4,488
,000
2014
2018
Und
erde
sign
A10
Stream
Restoration
Jone
sFalls
Western
Runat
Kelly
Aven
ue80
0LF
1260
5424
,000
$1,324
,600
2015
2018
Stream
Restoration
Jone
sFalls
12,60
0LF
3919
517
778
,000
$2,500
,000
2016
2018
Und
erDe
sign
A11
Stream
Restoration
Jone
sFalls
EastSton
yRu
nProject2
1,34
0LF
2010
191
40,200
$2,040
,000
2015
2018
Removed
Conflictw
ithactiv
erecreatio
n(BCR
P).
Conflictw
ithactiv
erecreatio
n(BCR
P).
Costinclud
esS13andA4
4.Ad
vertise
dinAu
gust20
16.
Prop
osed
toalignwith
sanitary
improvem
ents.
Increasedlength
tocoincide
with
sanitary
replacem
entp
roject.
Coincide
swith
A06.
Priorityslo
pestabilizatio
nshow
nas
A43.
Postpo
neddu
eto
increasedscop
eof
A10.
BaltimoreCity
FY20
17MS4
Annu
alRe
port
Page
5of
9
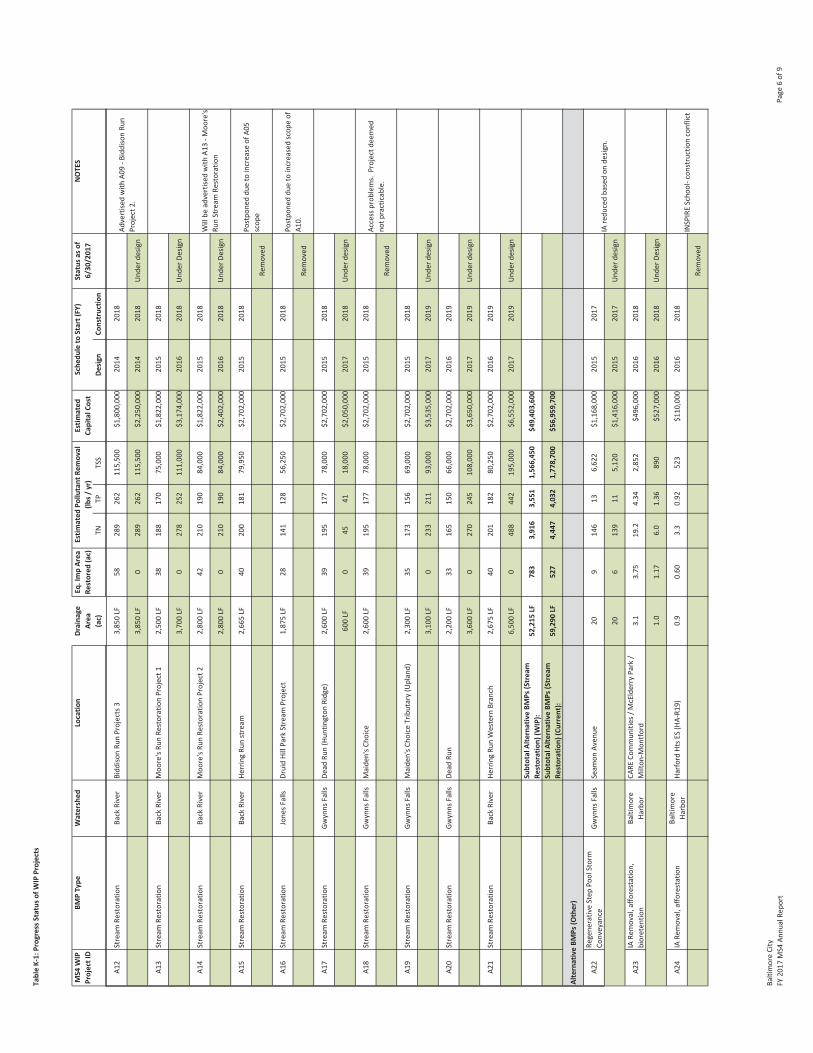
TableK1:Progress
Status
ofWIP
Projects
Draina
geArea
Status
asof
6/30
/201
7NOTES
(ac)
TNTP
TSS
Design
Constructio
n
MS4
WIP
ProjectID
BMPType
Sche
duleto
Start(FY)
Estim
ated
CapitalCost
Watershed
Locatio
nEstim
ated
Pollu
tant
Removal
(lbs/
yr)
Eq.ImpArea
Restored
(ac)
A12
Stream
Restoration
Back
River
Bidd
isonRu
nProjects3
3,85
0LF
5828
926
211
5,50
0$1
,800
,000
2014
2018
Stream
Restoration
Back
River
13,85
0LF
028
926
211
5,50
0$2
,250
,000
2014
2018
Und
erde
sign
A13
Stream
Restoration
Back
River
Moo
re'sRu
nRe
storationProject1
2,50
0LF
3818
817
075
,000
$1,822
,000
2015
2018
Stream
Restoration
Back
River
13,70
0LF
027
825
211
1,00
0$3
,174
,000
2016
2018
Und
erDe
sign
A14
Stream
Restoration
Back
River
Moo
re'sRu
nRe
storationProject2
2,80
0LF
4221
019
084
,000
$1,822
,000
2015
2018
Stream
Restoration
Back
River
12,80
0LF
021
019
084
,000
$2,402
,000
2016
2018
Und
erDe
sign
A15
Stream
Restoration
Back
River
HerringRu
nstream
2,66
5LF
4020
018
179
,950
$2,702
,000
2015
2018
Removed
A16
Stream
Restoration
Jone
sFalls
DruidHillPark
Stream
Project
1,87
5LF
2814
112
856
,250
$2,702
,000
2015
2018
Removed
A17
Stream
Restoration
Gwynns
Falls
Dead
Run(Hun
tington
Ridge)
2,60
0LF
3919
517
778
,000
$2,702
,000
2015
2018
Stream
Restoration
Gwynns
Falls
160
0LF
045
4118
,000
$2,050
,000
2017
2018
Und
erde
sign
A18
Stream
Restoration
Gwynns
Falls
Maide
n'sC
hoice
2,60
0LF
3919
517
778
,000
$2,702
,000
2015
2018
Removed
A19
Stream
Restoration
Gwynns
Falls
Maide
n'sC
hoiceTributary(Upland)
2,30
0LF
3517
315
669
,000
$2,702
,000
2015
2018
Stream
Restoration
Gwynns
Falls
13,10
0LF
023
321
193
,000
$3,535
,000
2017
2019
Und
erde
sign
A20
Stream
Restoration
Gwynns
Falls
Dead
Run
2,20
0LF
3316
515
066
,000
$2,702
,000
2016
2019
Stream
Restoration
Gwynns
Falls
13,60
0LF
027
024
510
8,00
0$3
,650
,000
2017
2019
Und
erde
sign
A21
Stream
Restoration
Back
River
HerringRu
nWestern
Branch
2,67
5LF
4020
118
280
,250
$2,702
,000
2016
2019
Stream
Restoration
Back
River
16,50
0LF
048
844
219
5,00
0$6
,552
,000
2017
2019
Und
erde
sign
SubtotalAlternativeBM
Ps(Stream
Restoration)
(WIP):
52,215
LF78
33,91
63,55
11,56
6,45
0$4
9,40
3,60
0
SubtotalAlternativeBM
Ps(Stream
Restoration)
(Current):
59,290
LF52
74,44
74,03
21,77
8,70
0$5
6,95
9,70
0
AlternativeBM
Ps(Other)
A22
Regene
rativ
eStep
PoolStorm
Conveyance
Gwynns
Falls
Seam
onAv
enue
209
146
136,62
2$1
,168
,000
2015
2017
Regene
rativ
eStep
PoolStorm
Conveya
Gwynns
Falls
120
613
911
5,12
0$1
,416
,000
2015
2017
Und
erde
sign
A23
IARe
moval,affo
restation,
bioreten
tion
Baltimore
Harbor
CARE
Commun
ities
/McElderry
Park
/Milton
Mon
tford
3.1
3.75
19.2
4.34
2,85
2$4
96,000
2016
2018
IARe
moval,affo
restation,bioreten
tiBa
ltimoreHa
rbo r
11.0
1.17
6.0
1.36
890
$527
,000
2016
2018
Und
erDe
sign
A24
IARe
moval,affo
restation
Baltimore
Harbor
HarfordHtsE
S(HAR1
9)0.9
0.60
3.3
0.92
523
$110
,000
2016
2018
Removed
Advertise
dwith
A09
Bidd
isonRu
nProject2
.
Willbe
advertise
dwith
A13
Moo
re's
RunStream
Restoration
Postpo
neddu
eto
increase
ofA0
5scop
e
Postpo
neddu
eto
increasedscop
eof
A10.
Accessprob
lems.
Projectd
eemed
notp
racticable.
IAredu
cedbasedon
desig
n.
INSPIREScho
olconstructio
nconflict
BaltimoreCity
FY20
17MS4
Annu
alRe
port
Page
6of
9

TableK1:Progress
Status
ofWIP
Projects
Draina
geArea
Status
asof
6/30
/201
7NOTES
(ac)
TNTP
TSS
Design
Constructio
n
MS4
WIP
ProjectID
BMPType
Sche
duleto
Start(FY)
Estim
ated
CapitalCost
Watershed
Locatio
nEstim
ated
Pollu
tant
Removal
(lbs/
yr)
Eq.ImpArea
Restored
(ac)
A25
IARe
moval,affo
restation,
bioreten
tion
Back
River
Northwoo
dES
andRe
cCe
nter
(CHR2
A)2.4
2.85
14.6
3.30
2,16
7$5
65,000
2016
2018
Removed
A26
IARe
moval,affo
restation
Back
River
SinclairLane
ES(HRR1
8)1.9
1.31
7.3
2.03
1,15
4$2
60,400
2016
2018
IARe
moval,affo
restation
Back
River
13.0
2.10
11.7
3.24
1,84
6$2
60,400
2016
2018
Und
erDe
sign
A27
IARe
moval,affo
restation
Back
River
WEB
DuBo
is(HRR2
9A)
0.8
0.53
2.9
0.81
461
$104
,200
2016
2018
Removed
A28
IARe
moval,affo
restation,
bioreten
tion
Back
River
Vario
usScho
ols
0.5
0.6
3.1
0.70
456
$120
,000
2016
2018
IARe
moval,affo
restation,bioreten
tiBa
ckRiver
10.5
0.6
3.1
0.70
456
$120
,000
2016
2018
Und
erDe
sign
A29
IARe
moval,affo
restation,
bioreten
tion
Gwynns
Falls
Mt.Winans
3.1
3.75
19.2
4.34
2,85
2$4
96,000
2016
2018
IARe
moval,affo
restation,bioreten
tiGw
ynns
Falls
12.5
315
.43.48
2,28
2$4
96,000
2016
2018
Und
erDe
sign
A30
IARe
moval,affo
restation,
bioreten
tion
Back
River
Mon
tebe
lloES
(HRR4
1A)
0.9
1.05
5.4
1.22
799
$208
,000
2016
2018
Removed
A31
IARe
moval,affo
restation,
bioreten
tion
City
wide
Vario
usScho
ols
1.5
1.76
9.0
2.03
1,33
5$3
50,000
2016
2018
IARe
moval,affo
restation,bioreten
tiCity
wide
15.2
6.25
32.0
7.24
4,75
1$3
50,000
2016
2018
Und
erDe
sign
A32
IARe
moval,affo
restation,
bioreten
tion
Jone
sFalls
PimlicoES
(LJR
6)1.1
1.35
6.9
1.56
1,02
7$2
68,000
2016
2018
Removed
A33
IARe
moval,affo
restation,
bioreten
tion
Jone
sFalls
PolyWestern
HS(LJR
8C)
1.4
1.65
8.5
1.91
1,25
5$3
28,000
2016
2018
IARe
moval,affo
restation,bioreten
tiJone
sFalls
11.4
1.65
8.5
1.91
1,25
5$3
28,000
2016
2018
Und
erDe
sign
A34
IARe
moval,affo
restation,
bioreten
tion
Baltimore
Harbor
DuaneAv
enue
Park
parkinglot(MC
21)
0.3
0.35
1.8
0.40
262
$42,00
020
1620
18
Removed
A35
IARe
moval,affo
restation
Baltimore
Harbor
Oliver
/Broadway
East
4.0
2.8
15.6
4.32
2,46
1$4
96,000
2017
2019
Removed
A36
IARe
moval,affo
restation
Gwynns
Falls
Carrollto
nRidge/S
hipley
Hill/M
illHill/
Pigtow
n/N
ewSouthw
est/
Union
4.0
2.8
15.6
4.32
2,46
1$4
96,000
2017
2019
IARe
moval,affo
restation
Gwynns
Falls
12.9
2.0
11.1
3.08
1,75
6$4
19,000
2016
2019
Und
erDe
sign
A37
IARe
moval,affo
restation
Baltimore
Harbor
Harle
mPark
/Sandtow
nWinchester/
Uplands
2.0
1.40
7.8
2.16
1,23
0$2
48,000
2017
2019
IARe
moval,affo
restation
Baltimore
Harbor
17.0
4.88
27.2
7.53
4,28
8$1
90,000
2016
2019
Und
erDe
sign
A38
IARe
moval,affo
restation
Baltimore
Harbor
Vario
usScho
ols
2.0
1.40
7.8
2.16
1,23
0$2
48,000
2017
2019
IARe
moval,affo
restation
Baltimore
Harbor
17.0
4.88
27.2
7.53
4,28
8$1
90,000
2016
2019
Und
erDe
sign
INSPIREScho
olconstructio
nconflict
Postpo
nedto
nextpe
rmit.
INSPIREScho
olconstructio
nconflict
INSPIREScho
olconstructio
nconflict
Curren
tdem
andforp
arking
lot.
Locatio
nswereno
tpracticable.
BaltimoreCity
FY20
17MS4
Annu
alRe
port
Page
7of
9
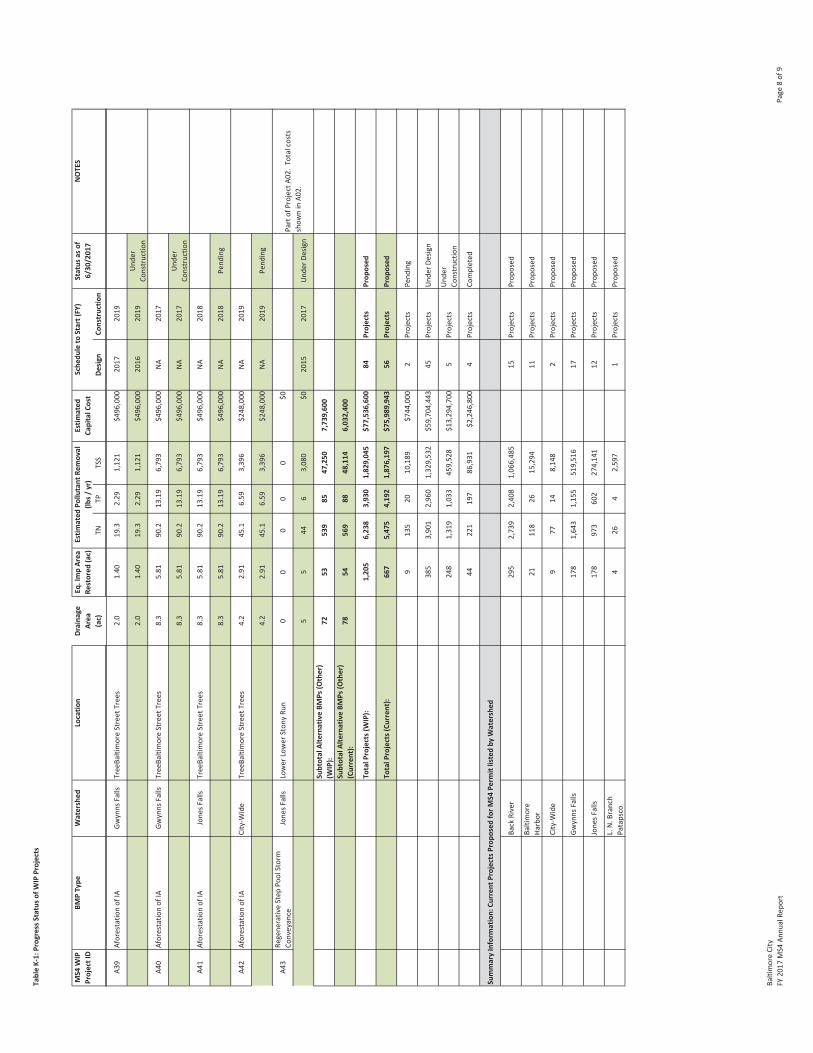
TableK1:Progress
Status
ofWIP
Projects
Draina
geArea
Status
asof
6/30
/201
7NOTES
(ac)
TNTP
TSS
Design
Constructio
n
MS4
WIP
ProjectID
BMPType
Sche
duleto
Start(FY)
Estim
ated
CapitalCost
Watershed
Locatio
nEstim
ated
Pollu
tant
Removal
(lbs/
yr)
Eq.ImpArea
Restored
(ac)
A39
Aforestatio
nof
IAGw
ynns
Falls
TreeBa
ltimoreStreet
Trees
2.0
1.40
19.3
2.29
1,12
1$4
96,000
2017
2019
Aforestatio
nof
IAGw
ynns
Falls
12.0
1.40
19.3
2.29
1,12
1$4
96,000
2016
2019
Und
erCo
nstructio
n
A40
Aforestatio
nof
IAGw
ynns
Falls
TreeBa
ltimoreStreet
Trees
8.3
5.81
90.2
13.19
6,79
3$4
96,000
NA
2017
Aforestatio
nof
IAGw
ynns
Falls
18.3
5.81
90.2
13.19
6,79
3$4
96,000
NA
2017
Und
erCo
nstructio
n
A41
Aforestatio
nof
IAJone
sFalls
TreeBa
ltimoreStreet
Trees
8.3
5.81
90.2
13.19
6,79
3$4
96,000
NA
2018
Aforestatio
nof
IAJone
sFalls
18.3
5.81
90.2
13.19
6,79
3$4
96,000
NA
2018
Pend
ing
A42
Aforestatio
nof
IACity
Wide
TreeBa
ltimoreStreet
Trees
4.2
2.91
45.1
6.59
3,39
6$2
48,000
NA
2019
Aforestatio
nof
IACity
wide
14.2
2.91
45.1
6.59
3,39
6$2
48,000
NA
2019
Pend
ing
A43
Regene
rativ
eStep
PoolStorm
Conveyance
Jone
sFalls
Lower
Lower
Ston
yRu
n0
00
00
$0
Regene
rativ
eStep
PoolStorm
Conveya
Jone
sFalls
15
544
63,08
0$0
2015
2017
Und
erDe
sign
SubtotalAlternativeBM
Ps(Other)
(WIP):
7253
539
8547
,250
7,73
9,60
0
SubtotalAlternativeBM
Ps(Other)
(Current):
7854
569
8848
,114
6,03
2,40
0
TotalProjects(WIP):
1,20
56,23
83,93
01,82
9,04
5$7
7,53
6,60
084
Projects
Prop
osed
TotalProjects(Cu
rren
t):
667
5,47
54,19
21,87
6,19
7$7
5,98
9,94
356
Projects
Prop
osed
913
520
10,189
$744
,000
2Projects
Pend
ing
385
3,90
12,96
01,32
9,53
2$5
9,70
4,44
345
Projects
Und
erDe
sign
248
1,31
91,03
345
9,52
8$1
3,29
4,70
05
Projects
Und
erCo
nstructio
n
4422
119
786
,931
$2,246
,800
4Projects
Completed
SummaryInform
ation:
Curren
tProjectsP
ropo
sedforM
S4Pe
rmitlistedby
Watershed
Back
River
295
2,73
92,40
81,06
6,48
515
Projects
Prop
osed
Baltimore
Harbor
2111
826
15,294
11Projects
Prop
osed
City
Wide
977
148,14
82
Projects
Prop
osed
Gwynns
Falls
178
1,64
31,15
551
9,51
617
Projects
Prop
osed
Jone
sFalls
178
973
602
274,14
112
Projects
Prop
osed
L.N.B
ranch
Patapsco
426
42,59
71
Projects
Prop
osed
Partof
ProjectA
02.To
talcosts
show
ninA0
2.
BaltimoreCity
FY20
17MS4
Annu
alRe
port
Page
8of
9
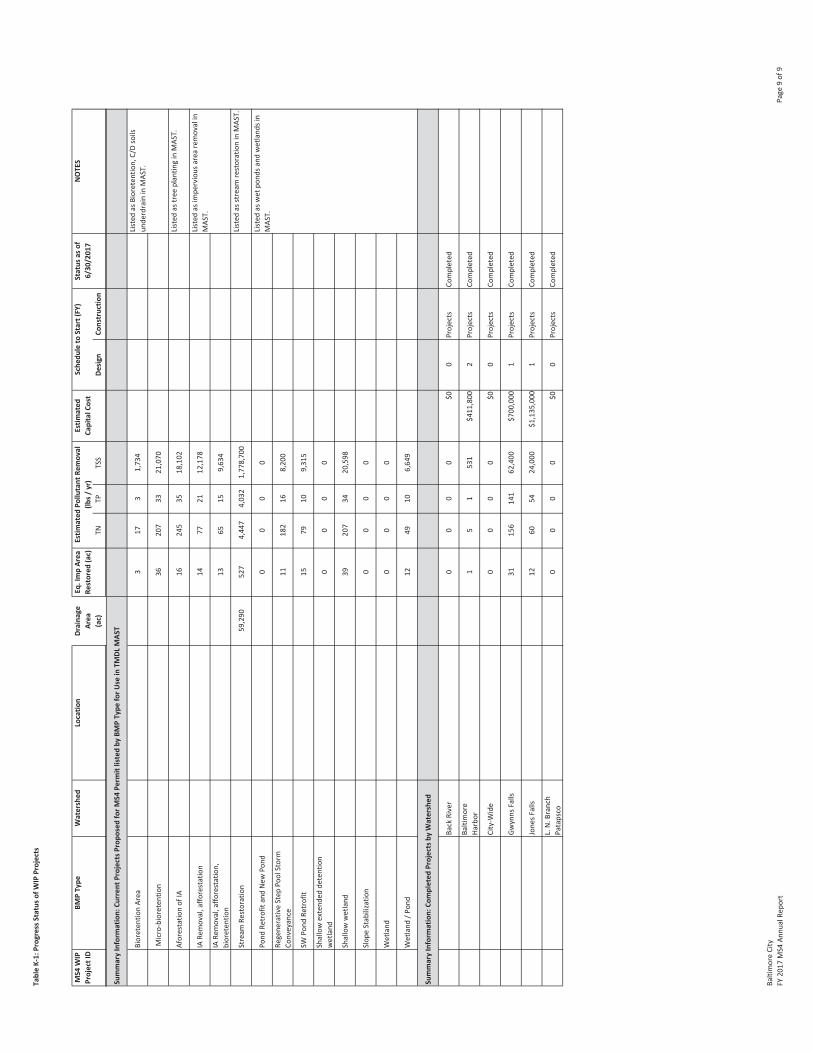
TableK1:Progress
Status
ofWIP
Projects
Draina
geArea
Status
asof
6/30
/201
7NOTES
(ac)
TNTP
TSS
Design
Constructio
n
MS4
WIP
ProjectID
BMPType
Sche
duleto
Start(FY)
Estim
ated
CapitalCost
Watershed
Locatio
nEstim
ated
Pollu
tant
Removal
(lbs/
yr)
Eq.ImpArea
Restored
(ac)
SummaryInform
ation:
Curren
tProjectsP
ropo
sedforM
S4Pe
rmitlistedby
BMPType
forU
seinTM
DLMAS
T
Bioreten
tionArea
317
31,73
4
Micro
bioreten
tion
3620
733
21,070
Aforestatio
nof
IA16
245
3518
,102
Listed
astree
plantin
ginMAS
T.
IARe
moval,affo
restation
1477
2112
,178
IARe
moval,affo
restation,
bioreten
tion
1365
159,63
4
Stream
Restoration
59,290
527
4,44
74,03
21,77
8,70
0Listed
asstream
restorationinMAS
T.
Pond
RetrofitandNew
Pond
00
00
Regene
rativ
eStep
PoolStorm
Conveyance
1118
216
8,20
0
SWPo
ndRe
trofit
1579
109,31
5
Shallowextend
edde
tention
wetland
00
00
Shallowwetland
3920
734
20,598
Slop
eStabilizatio
n0
00
0
Wetland
00
00
Wetland
/Pon
d12
4910
6,64
9
SummaryInform
ation:
Completed
Projectsby
Watershed
Back
River
00
00
$00
Projects
Completed
Baltimore
Harbor
15
153
1$4
11,800
2Projects
Completed
City
Wide
00
00
$00
Projects
Completed
Gwynns
Falls
3115
614
162
,400
$700
,000
1Projects
Completed
Jone
sFalls
1260
5424
,000
$1,135
,000
1Projects
Completed
L.N.B
ranch
Patapsco
00
00
$00
Projects
Completed
Listed
asim
pervious
area
removalin
MAS
T.
Listed
aswet
pond
sand
wetland
sin
MAS
T.
Listed
asBioreten
tion,C/Dsoils
unde
rdraininMAS
T.
BaltimoreCity
FY20
17MS4
Annu
alRe
port
Page
9of
9
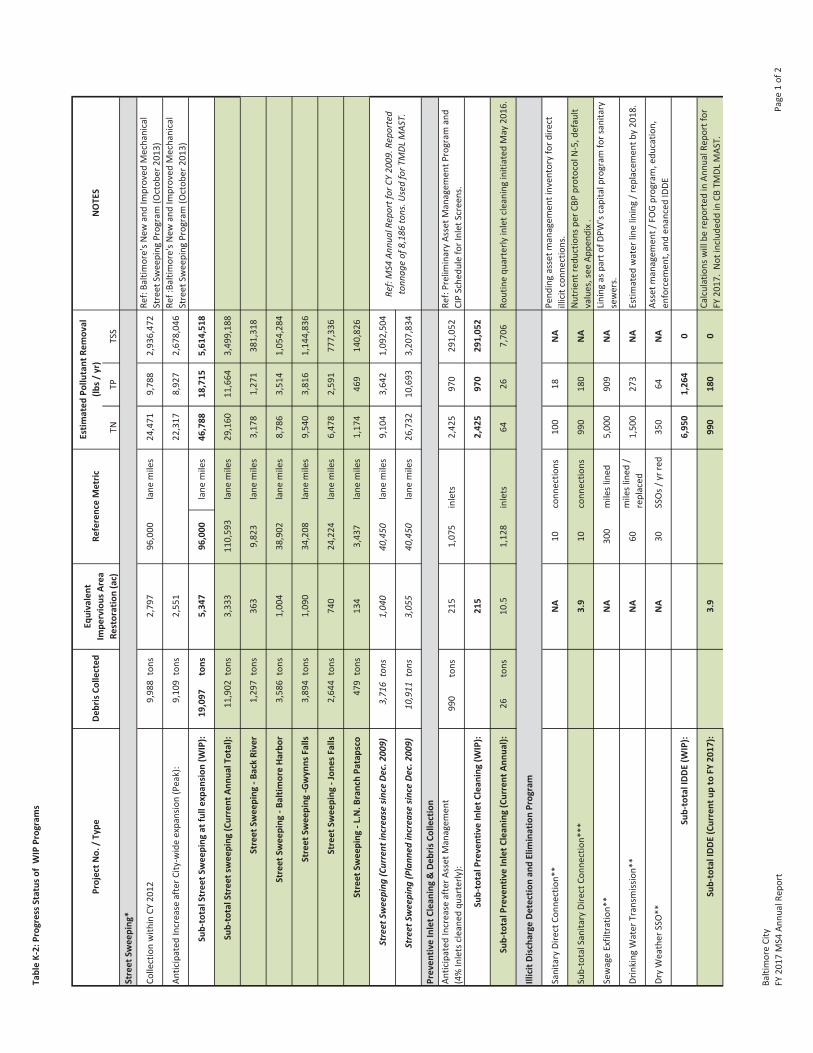
TableK2:Progress
Status
ofWIP
Programs
TNTP
TSS
Street
Sweeping*
Collectionwith
inCY
2012
9,98
8tons
2,79
796
,000
lane
miles
24,471
9,78
82,93
6,47
2Re
f:Ba
ltimore'sN
ewandIm
proved
Mechanical
Street
Sweeping
Program
(Octob
er20
13)
Anticipated
Increase
afterC
itywideexpansion(Peak):
9,10
9tons
2,55
122
,317
8,92
72,67
8,04
6Re
f:Ba
ltimore'sN
ewandIm
proved
Mechanical
Street
Sweeping
Program
(Octob
er20
13)
SubtotalStreetS
weeping
atfullexpa
nsion(W
IP):
19,097
tons
5,34
796
,000
lane
miles
46,788
18,715
5,61
4,51
8
SubtotalStreetsweeping
(Current
Annu
alTo
tal):
11,902
tons
3,33
311
0,59
3lane
miles
29,160
11,664
3,49
9,18
8
Street
Sweeping
Back
River
1,29
7tons
363
9,82
3lane
miles
3,17
81,27
138
1,31
8
Street
Sweeping
BaltimoreHa
rbor
3,58
6tons
1,00
438
,902
lane
miles
8,78
63,51
41,05
4,28
4
Street
Sweeping
Gwynns
Falls
3,89
4tons
1,09
034
,208
lane
miles
9,54
03,81
61,14
4,83
6
Street
Sweeping
Jone
sFalls
2,64
4tons
740
24,224
lane
miles
6,47
82,59
177
7,33
6
Street
Sweeping
L.N.B
ranchPa
tapsco
479
tons
134
3,43
7lane
miles
1,17
446
914
0,82
6
Street
Sweeping
(Current
increa
sesinceDe
c.20
09)
3,71
6tons
1,04
040
,450
lane
miles
9,10
43,64
21,09
2,50
4
Street
Sweeping
(Plann
edincrea
sesinceDe
c.20
09)
10,911
tons
3,05
540
,450
lane
miles
26,732
10,693
3,20
7,83
4
Preven
tiveInletC
lean
ing&De
brisCo
llection
Anticipated
Increase
afterA
sset
Managem
ent
(4%Inletscleane
dqu
arterly
):99
0tons
215
1,07
5inlets
2,42
597
029
1,05
2Re
f:Prelim
inaryAssetM
anagem
entP
rogram
and
CIPSche
duleforInlet
Screen
s.
SubtotalPreventiveInletC
lean
ing(W
IP):
215
2,42
597
029
1,05
2
SubtotalPreventiveInletC
lean
ing(Current
Annu
al):
26tons
10.5
1,12
8inlets
6426
7,70
6Ro
utinequ
arterly
inletcleaninginitiated
May
2016
.
IllicitDischa
rgeDe
tectionan
dElim
inationProgram
Sanitary
DirectCo
nnectio
n**
NA
10conn
ectio
ns10
018
NA
Pend
ingassetm
anagem
ent inven
tory
ford
irect
illicitconn
ectio
ns.
SubtotalSanita
ryDirectCo
nnectio
n***
3.9
10conn
ectio
ns99
018
0NA
Nutrie
ntredu
ctions
perC
BPprotocolN5,de
fault
values,see
Appe
ndix.
SewageExfiltration*
*NA
300
mileslined
5,00
090
9NA
Lining
aspartof
DPW'scapitalprogram
forsanita
rysewers.
Drinking
Water
Transm
ission*
*NA
60mileslined
/replaced
1,50
027
3NA
Estim
ated
water
linelining/ rep
lacemen
tby20
18.
DryWeather
SSO**
NA
30SSOs/
yrred
350
64NA
Assetm
anagem
ent/
FOGprogram,edu
catio
n,en
forcem
ent,anden
ancedIDDE
SubtotalIDD
E(W
IP):
6,95
01,26
40
SubtotalIDD
E(Current
upto
FY20
17):
3.9
990
180
0Calculations
willbe
repo
rted
inAn
nualRe
portfor
FY20
17.Not
includ
eddinCB
TMDL
MAS
T.
Ref:MS4
Annu
alRe
portfor C
Y20
09.R
eported
tonn
ageof
8,18
6tons.U
sedforT
MDL
MAS
T.
NOTES
ProjectN
o./Type
Equivalent
Impe
rvious
Area
Restoration(ac)
Estim
ated
Pollu
tant
Removal
(lbs/
yr)
DebrisCo
llected
ReferenceMetric
BaltimoreCity
FY20
17MS4
Annu
alRe
port
Page
1of
2
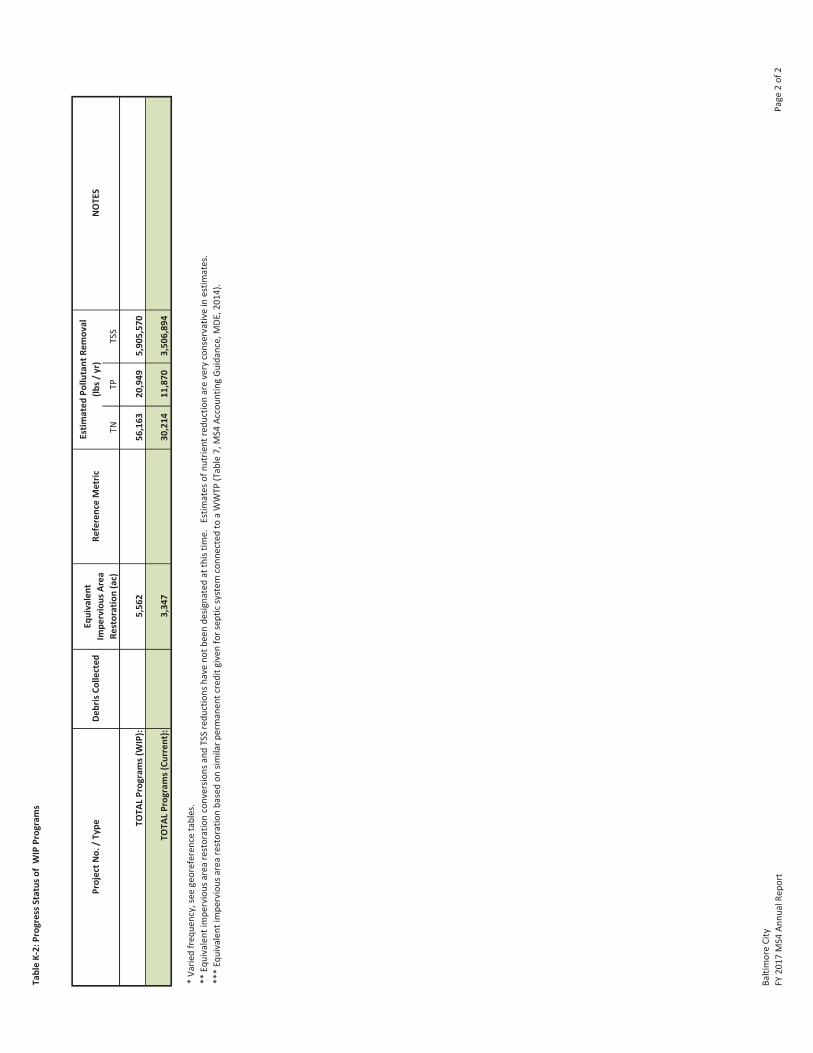
TableK2:Progress
Status
ofWIP
Programs
TNTP
TSS
NOTES
ProjectN
o./Type
Equivalent
Impe
rvious
Area
Restoration(ac)
Estim
ated
Pollu
tant
Removal
(lbs/
yr)
DebrisCo
llected
ReferenceMetric
TOTA
LPrograms(WIP):
5,56
256
,163
20,949
5,90
5,57
0
TOTA
LPrograms(Cu
rren
t):
3,34
730
,214
11,870
3,50
6,89
4
*Va
riedfreq
uency,seegeoreferen
cetables.
**Equivalent
impe
rvious
area
restorationconversio
nsandTSSredu
ctions
have
notb
eende
signatedat
thistim
e.Estim
ates
ofnu
trient
redu
ctionarevery
conservativ
einestim
ates.
***Equivalent
impe
rvious
area
restorationbasedon
similarp
ermanen
tcreditg
iven
forsep
ticsystem
conn
ectedto
aWWTP
(Table7,MS4
Accoun
tingGu
idance,M
DE,201
4).
BaltimoreCity
FY20
17MS4
Annu
alRe
port
Page
2of
2
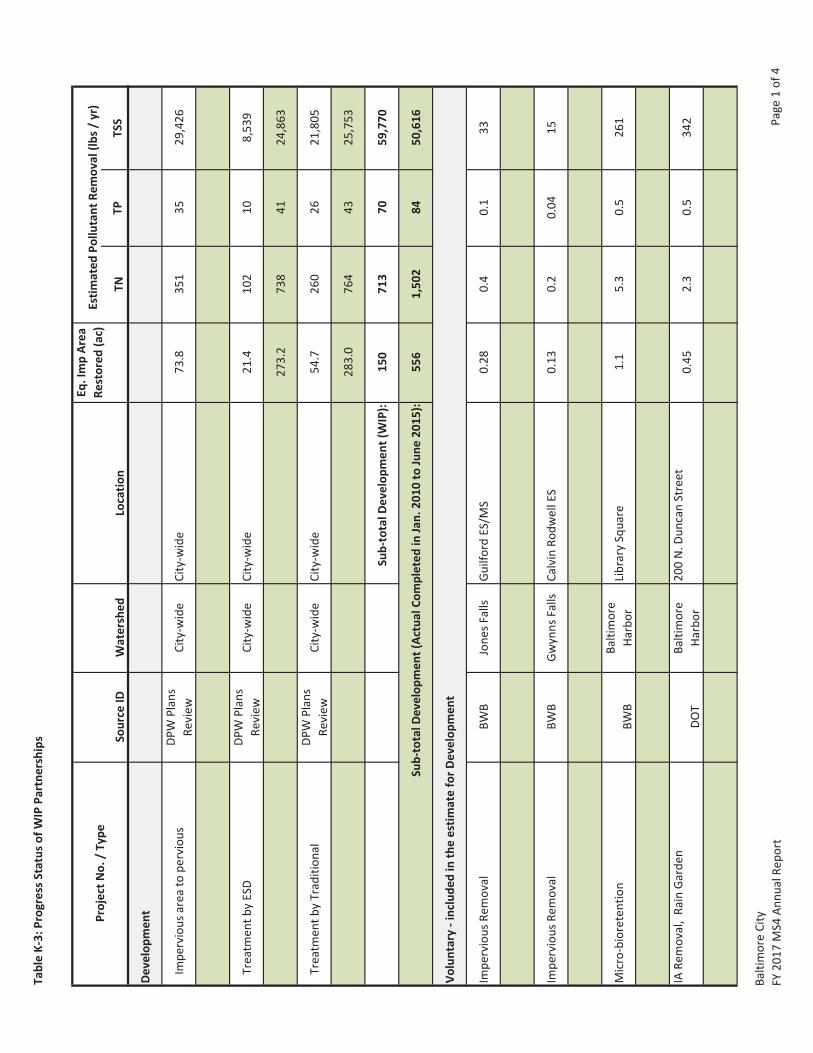
TableK3:Progress
Status
ofWIP
Partne
rships
Estim
ated
Pollu
tant
Removal(lb
s/yr)
TNTP
TSS
Developm
ent
Impe
rvious
area
tope
rvious
DPW
Plans
Review
City
wide
City
wide
73.8
351
3529
,426
Treatm
entb
yESD
DPW
Plans
Review
City
wide
City
wide
21.4
102
108,53
9
273.2
738
4124
,863
Treatm
entb
yTradition
alDP
WPlans
Review
City
wide
City
wide
54.7
260
2621
,805
283.0
764
4325
,753
SubtotalD
evelop
men
t(WIP):
150
713
7059
,770
SubtotalD
evelop
men
t(Ac
tualCo
mpleted
inJan.
2010
toJune
2015
):55
61,50
284
50,616
Voluntary
includ
edintheestim
ateforD
evelop
men
t
Impe
rvious
Removal
BWB
Jone
sFalls
GuilfordES/M
S0.28
0.4
0.1
33
Impe
rvious
Removal
BWB
Gwynns
Falls
CalvinRo
dwellES
0.13
0.2
0.04
15
Micro
bioreten
tion
BWB
Baltimore
Harbor
LibrarySquare
1.1
5.3
0.5
261
IARe
moval,Ra
inGa
rden
DOT
Baltimore
Harbor
200N.D
uncanStreet
0.45
2.3
0.5
342
Eq.ImpArea
Restored
(ac)
ProjectN
o./Type
Source
IDWatershed
Locatio
n
BaltimoreCity
FY20
17MS4
Annu
alRe
port
Page
1of
4
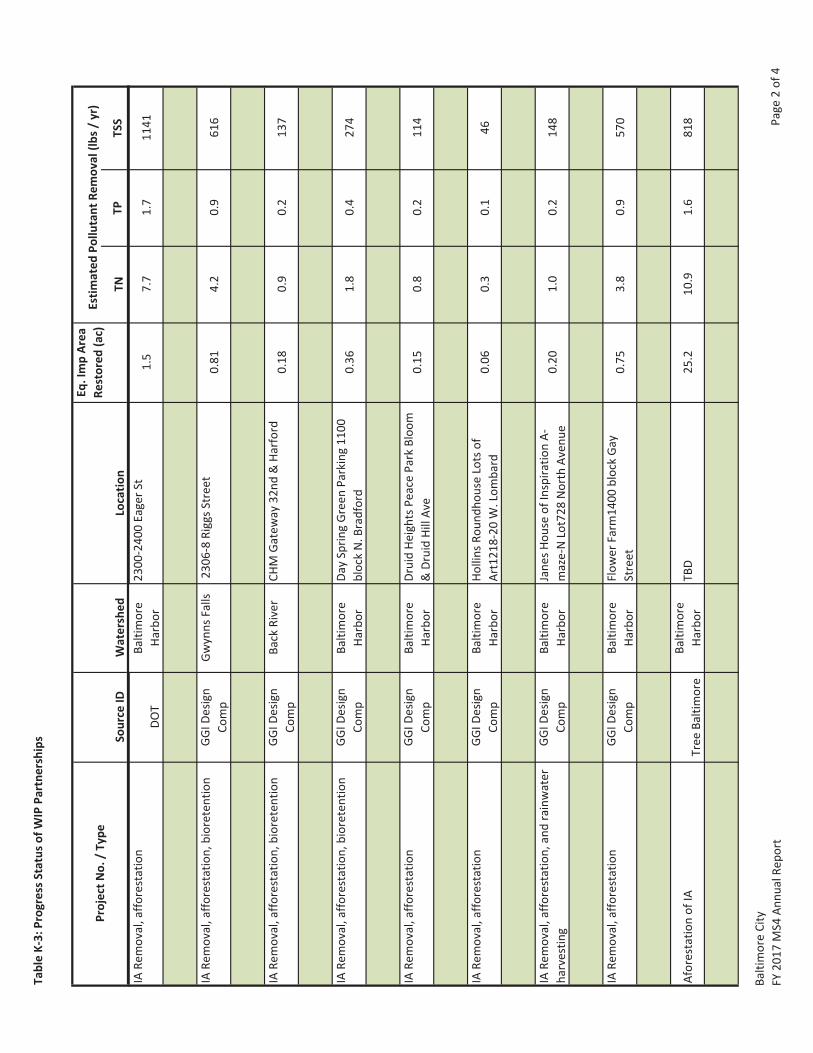
TableK3:Progress
Status
ofWIP
Partne
rships
Estim
ated
Pollu
tant
Removal(lb
s/yr)
TNTP
TSS
Eq.ImpArea
Restored
(ac)
ProjectN
o./Type
Source
IDWatershed
Locatio
nIA
Removal,affo
restation
DOT
Baltimore
Harbor
2300
2400
EagerS
t1.5
7.7
1.7
1141
IARe
moval,affo
restation,bioreten
tion
GGID
esign
Comp
Gwynns
Falls
2306
8RiggsS
treet
0.81
4.2
0.9
616
IARe
moval,affo
restation,bioreten
tion
GGID
esign
Comp
Back
River
CHM
Gateway
32nd
&Ha
rford
0.18
0.9
0.2
137
IARe
moval,affo
restation,bioreten
tion
GGID
esign
Comp
Baltimore
Harbor
DaySprin
gGreenParking11
00blockN.B
radford
0.36
1.8
0.4
274
IARe
moval,affo
restation
GGID
esign
Comp
Baltimore
Harbor
DruidHe
ightsP
eace
Park
Bloo
m&DruidHillAv
e0.15
0.8
0.2
114
IARe
moval,affo
restation
GGID
esign
Comp
Baltimore
Harbor
Hollins
Roun
dhou
seLotsof
Art121
820
W.Lom
bard
0.06
0.3
0.1
46
IARe
moval,affo
restation,andrainwater
harvestin
gGG
IDesign
Comp
Baltimore
Harbor
Jane
sHou
seof
Inspira
tionA
mazeNLot728
North
Aven
ue0.20
1.0
0.2
148
IARe
moval,affo
restation
GGI D
esign
Comp
Baltimore
Harbor
Flow
erFarm
1400
blockGa
yStreet
0.75
3.8
0.9
570
Aforestatio
nof
IATree
Baltimore
Baltimore
Harbor
TBD
25.2
10.9
1.6
818
BaltimoreCity
FY20
17MS4
Annu
alRe
port
Page
2of
4
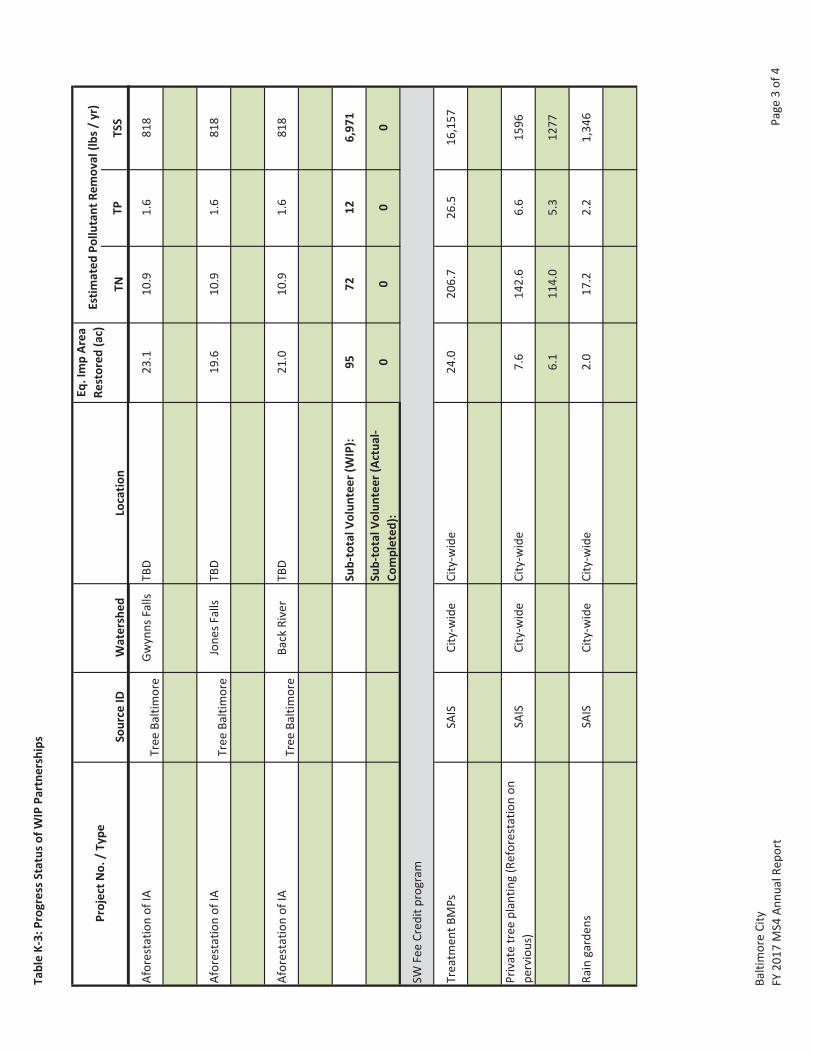
TableK3:Progress
Status
ofWIP
Partne
rships
Estim
ated
Pollu
tant
Removal(lb
s/yr)
TNTP
TSS
Eq.ImpArea
Restored
(ac)
ProjectN
o./Type
Source
IDWatershed
Locatio
n
Aforestatio
nof
IATree
Baltimore
Gwynns
Falls
TBD
23.1
10.9
1.6
818
Aforestatio
nof
IATree
Baltimore
Jone
sFalls
TBD
19.6
10.9
1.6
818
Aforestatio
nof
IATree
Baltimore
Back
River
TBD
21.0
10.9
1.6
818
SubtotalV
olun
teer
(WIP):
9572
126,97
1
SubtotalV
olun
teer
(Actua
lCo
mpleted
):0
00
0
SWFeeCred
itprogram
Treatm
entB
MPs
SAIS
City
wide
City
wide
24.0
206.7
26.5
16,157
Privatetree
plantin
g(Reforestatio
non
pervious)
SAIS
City
wide
City
wide
7.6
142.6
6.6
1596
6.1
114.0
5.3
1277
Raingarden
sSA
ISCity
wide
City
wide
2.0
17.2
2.2
1,34
6
BaltimoreCity
FY20
17MS4
Annu
alRe
port
Page
3of
4
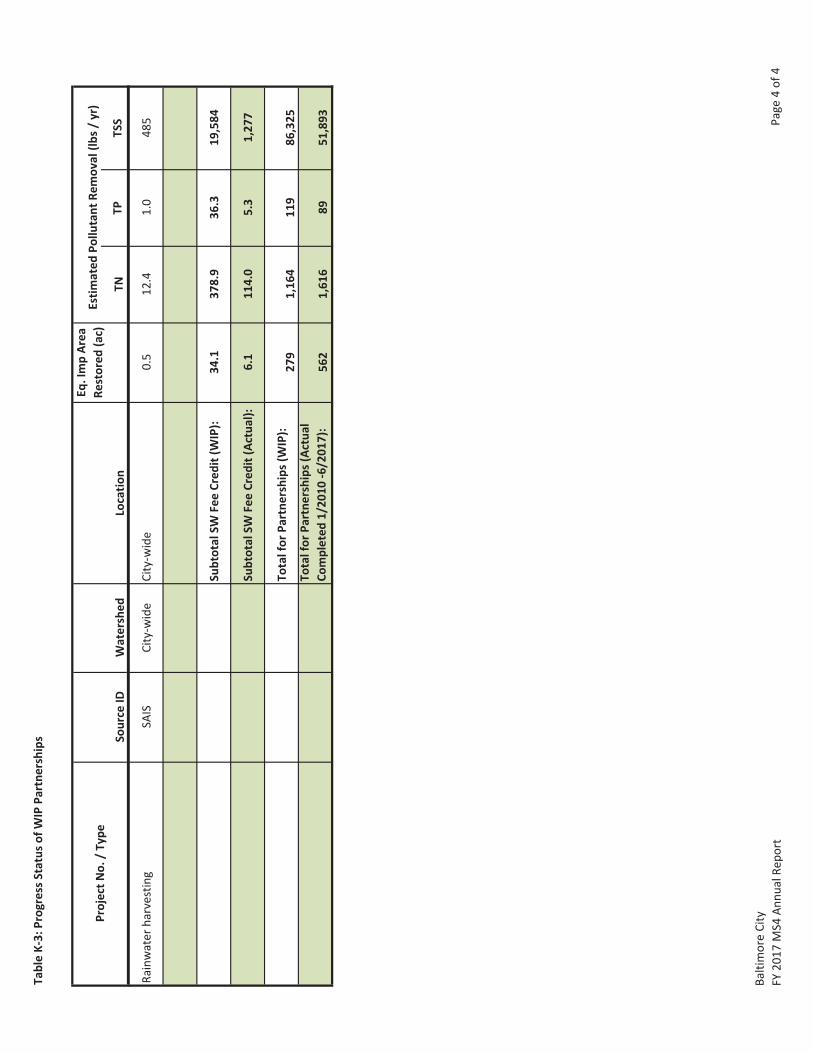
TableK3:Progress
Status
ofWIP
Partne
rships
Estim
ated
Pollu
tant
Removal(lb
s/yr)
TNTP
TSS
Eq.ImpArea
Restored
(ac)
ProjectN
o./Type
Source
IDWatershed
Locatio
n
Rainwater
harvestin
gSA
ISCity
wide
City
wide
0.5
12.4
1.0
485
SubtotalSW
FeeCred
it(W
IP):
34.1
378.9
36.3
19,584
SubtotalSW
FeeCred
it(Actua
l):6.1
114.0
5.3
1,27
7
Totalfor
Partne
rships
(WIP):
279
1,16
411
986
,325
Totalfor
Partne
rships
(Actua
lCo
mpleted
1/20
106/20
17):
562
1,61
689
51,893
BaltimoreCity
FY20
17MS4
Annu
alRe
port
Page
4of
4
Appendix L: Progress of Chesapeake Bay TMDLTable L 1: Progress Status of Chesapeake Bay TMDLMAST Results for Baseline 2010MAST Results for 2017 LoadingsMAST Results for 2018 Loadings
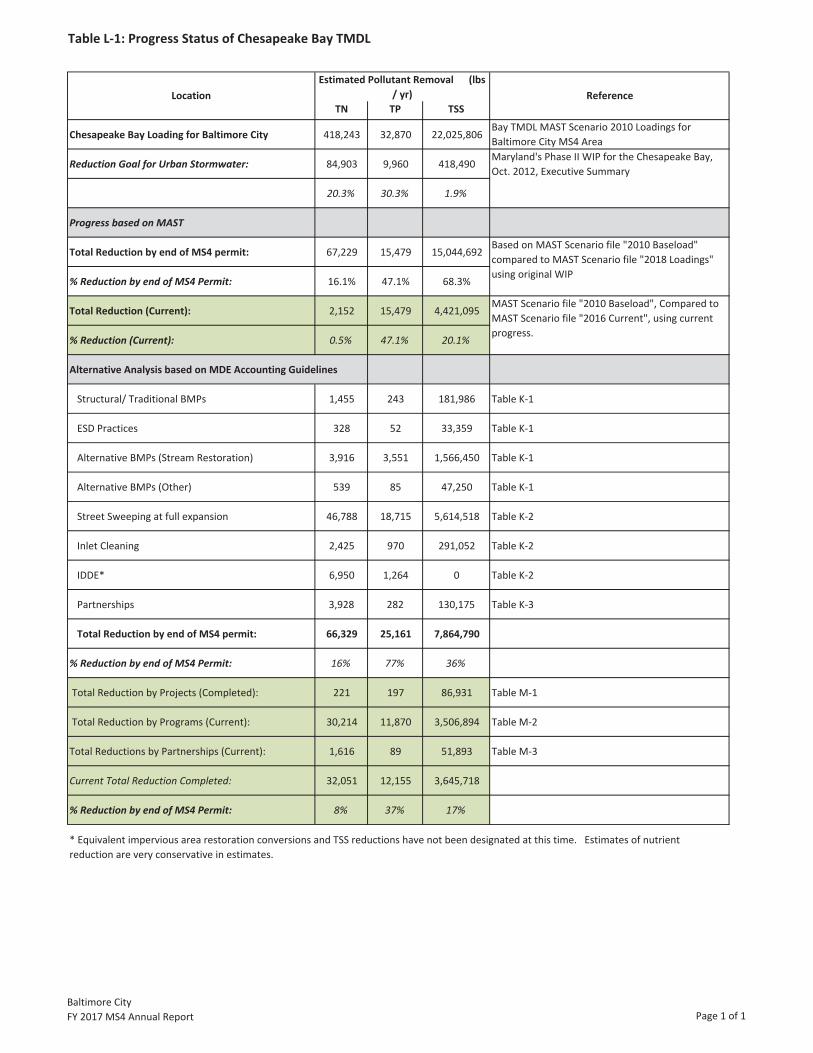
Table L 1: Progress Status of Chesapeake Bay TMDL
TN TP TSS
Chesapeake Bay Loading for Baltimore City 418,243 32,870 22,025,806Bay TMDL MAST Scenario 2010 Loadings forBaltimore City MS4 Area
Reduction Goal for Urban Stormwater: 84,903 9,960 418,490
20.3% 30.3% 1.9%
Progress based on MAST
Total Reduction by end of MS4 permit: 67,229 15,479 15,044,692
% Reduction by end of MS4 Permit: 16.1% 47.1% 68.3%
Total Reduction (Current): 2,152 15,479 4,421,095
% Reduction (Current): 0.5% 47.1% 20.1%
Alternative Analysis based on MDE Accounting Guidelines
Structural/ Traditional BMPs 1,455 243 181,986 Table K 1
ESD Practices 328 52 33,359 Table K 1
Alternative BMPs (Stream Restoration) 3,916 3,551 1,566,450 Table K 1
Alternative BMPs (Other) 539 85 47,250 Table K 1
Street Sweeping at full expansion 46,788 18,715 5,614,518 Table K 2
Inlet Cleaning 2,425 970 291,052 Table K 2
IDDE* 6,950 1,264 0 Table K 2
Partnerships 3,928 282 130,175 Table K 3
Total Reduction by end of MS4 permit: 66,329 25,161 7,864,790
% Reduction by end of MS4 Permit: 16% 77% 36%
Total Reduction by Projects (Completed): 221 197 86,931 Table M 1
Total Reduction by Programs (Current): 30,214 11,870 3,506,894 Table M 2
Total Reductions by Partnerships (Current): 1,616 89 51,893 Table M 3
Current Total Reduction Completed: 32,051 12,155 3,645,718
% Reduction by end of MS4 Permit: 8% 37% 17%
Estimated Pollutant Removal (lbs/ yr)Location Reference
* Equivalent impervious area restoration conversions and TSS reductions have not been designated at this time. Estimates of nutrientreduction are very conservative in estimates.
Maryland's Phase II WIP for the Chesapeake Bay,Oct. 2012, Executive Summary
MAST Scenario file "2010 Baseload", Compared toMAST Scenario file "2016 Current", using currentprogress.
Based on MAST Scenario file "2010 Baseload"compared to MAST Scenario file "2018 Loadings"using original WIP
Baltimore CityFY 2017 MS4 Annual Report Page 1 of 1
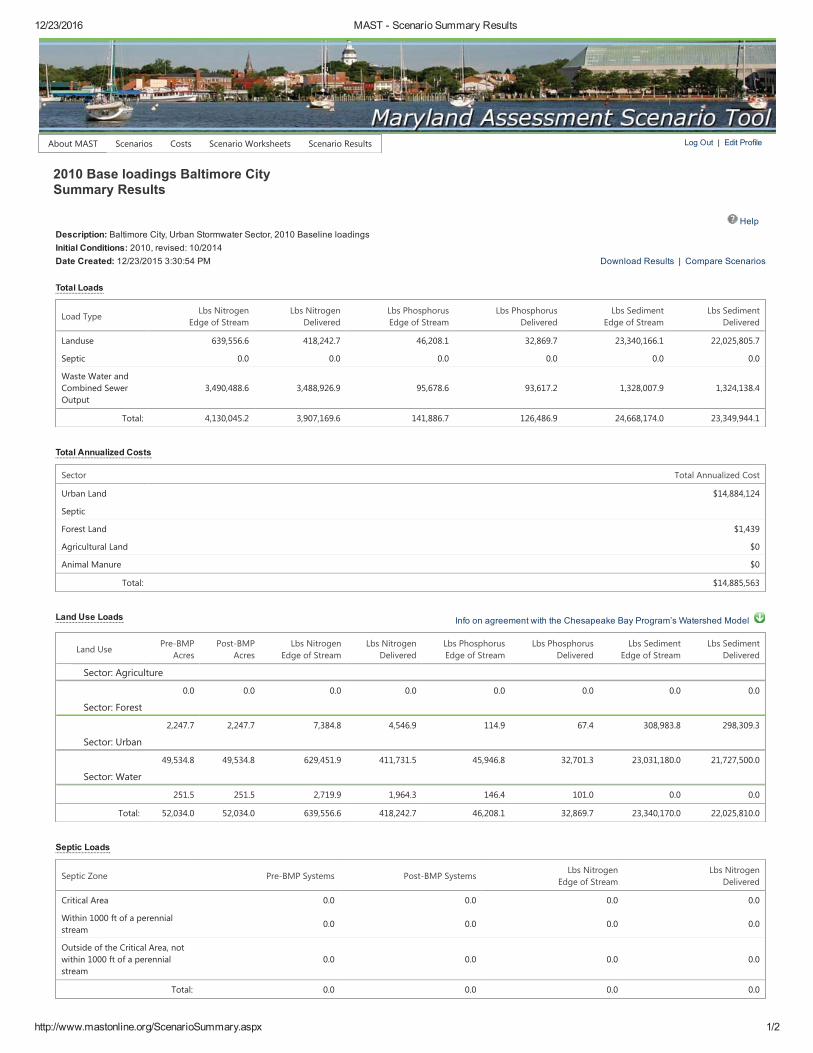
12/23/2016 MAST - Scenario Summary Results
http://www.mastonline.org/ScenarioSummary.aspx 1/2
Help
Download Results | Compare Scenarios
Info on agreement with the Chesapeake Bay Program’s Watershed Model
Log Out | Edit Profile
2010 Base loadings Baltimore CitySummary Results
Description: Baltimore City, Urban Stormwater Sector, 2010 Baseline loadingsInitial Conditions: 2010, revised: 10/2014Date Created: 12/23/2015 3:30:54 PM
Total Loads
Load TypeLbs Nitrogen
Edge of StreamLbs Nitrogen
DeliveredLbs PhosphorusEdge of Stream
Lbs PhosphorusDelivered
Lbs SedimentEdge of Stream
Lbs SedimentDelivered
Total: 4,130,045.2 3,907,169.6 141,886.7 126,486.9 24,668,174.0 23,349,944.1
Landuse 639,556.6 418,242.7 46,208.1 32,869.7 23,340,166.1 22,025,805.7
Septic 0.0 0.0 0.0 0.0 0.0 0.0
Waste Water andCombined SewerOutput
3,490,488.6 3,488,926.9 95,678.6 93,617.2 1,328,007.9 1,324,138.4
Total Annualized Costs
Sector Total Annualized Cost
Total: $14,885,563
Urban Land $14,884,124
Septic
Forest Land $1,439
Agricultural Land $0
Animal Manure $0
Land Use Loads
Land Use
Pre-BMPAcres
Post-BMPAcres
Lbs NitrogenEdge of Stream
Lbs NitrogenDelivered
Lbs PhosphorusEdge of Stream
Lbs PhosphorusDelivered
Lbs SedimentEdge of Stream
Lbs SedimentDelivered
Total: 52,034.0 52,034.0 639,556.6 418,242.7 46,208.1 32,869.7 23,340,170.0 22,025,810.0
Sector: Agriculture
0.0 0.0 0.0 0.0 0.0 0.0 0.0 0.0
Sector: Forest
2,247.7 2,247.7 7,384.8 4,546.9 114.9 67.4 308,983.8 298,309.3
Sector: Urban
49,534.8 49,534.8 629,451.9 411,731.5 45,946.8 32,701.3 23,031,180.0 21,727,500.0
Sector: Water
251.5 251.5 2,719.9 1,964.3 146.4 101.0 0.0 0.0
Septic Loads
Septic Zone Pre-BMP Systems Post-BMP SystemsLbs Nitrogen
Edge of StreamLbs Nitrogen
Delivered
Total: 0.0 0.0 0.0 0.0
Critical Area 0.0 0.0 0.0 0.0
Within 1000 ft of a perennialstream
0.0 0.0 0.0 0.0
Outside of the Critical Area, notwithin 1000 ft of a perennialstream
0.0 0.0 0.0 0.0
About MAST Scenarios Costs Scenario Worksheets Scenario Results
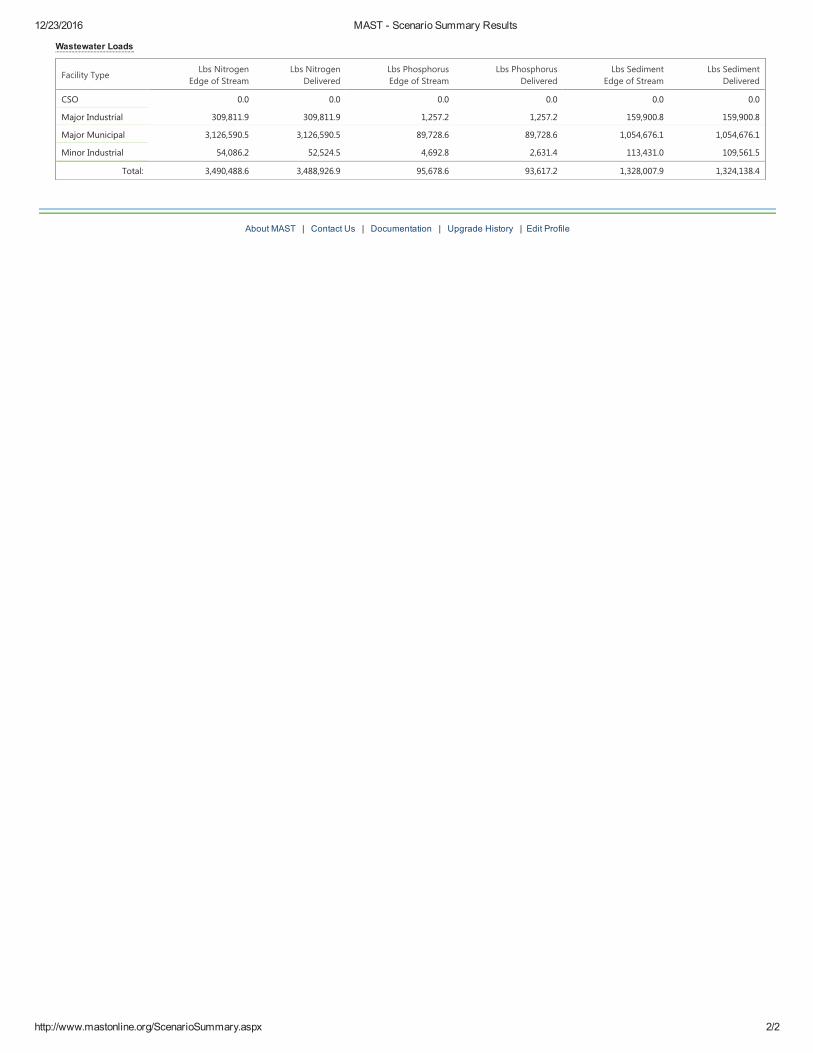
12/23/2016 MAST - Scenario Summary Results
http://www.mastonline.org/ScenarioSummary.aspx 2/2
Wastewater Loads
Facility Type
Lbs NitrogenEdge of Stream
Lbs NitrogenDelivered
Lbs PhosphorusEdge of Stream
Lbs PhosphorusDelivered
Lbs SedimentEdge of Stream
Lbs SedimentDelivered
Total: 3,490,488.6 3,488,926.9 95,678.6 93,617.2 1,328,007.9 1,324,138.4
CSO 0.0 0.0 0.0 0.0 0.0 0.0
Major Industrial 309,811.9 309,811.9 1,257.2 1,257.2 159,900.8 159,900.8
Major Municipal 3,126,590.5 3,126,590.5 89,728.6 89,728.6 1,054,676.1 1,054,676.1
Minor Industrial 54,086.2 52,524.5 4,692.8 2,631.4 113,431.0 109,561.5
About MAST | Contact Us | Documentation | Upgrade History | Edit Profile
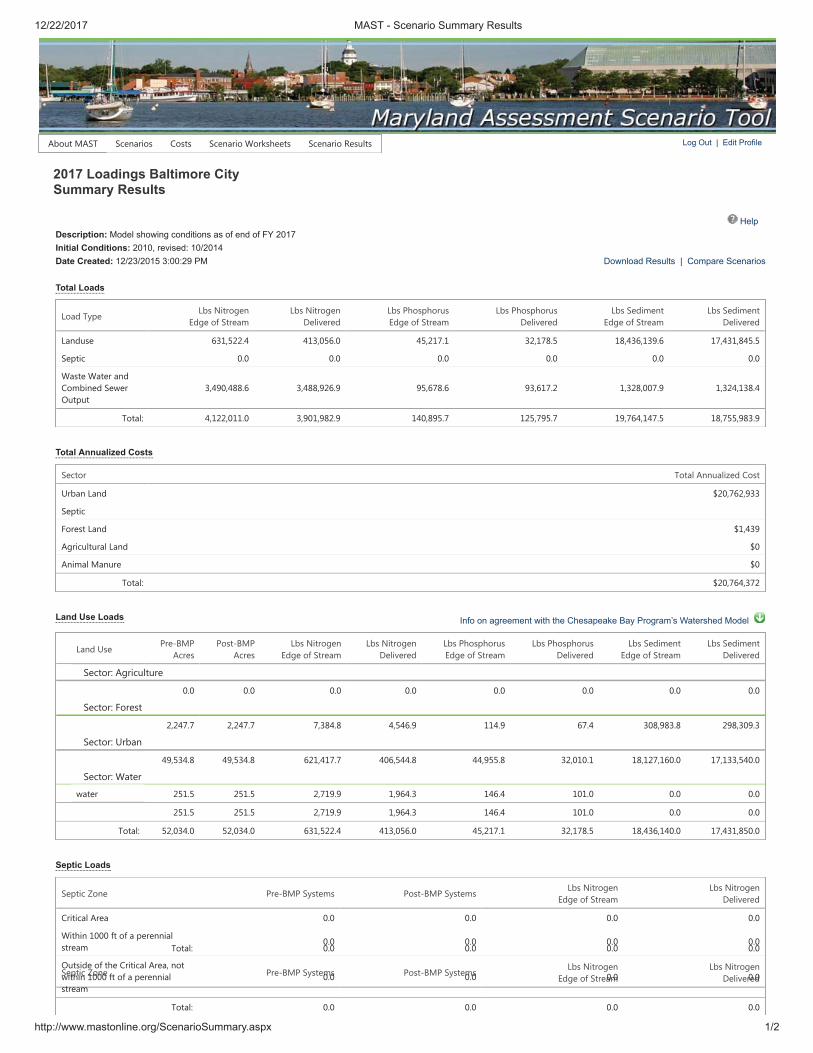
12/22/2017 MAST - Scenario Summary Results
http://www.mastonline.org/ScenarioSummary.aspx 1/2
Help
Download Results | Compare Scenarios
Info on agreement with the Chesapeake Bay Program’s Watershed Model
Log Out | Edit Profile
2017 Loadings Baltimore City Summary Results
Description: Model showing conditions as of end of FY 2017Initial Conditions: 2010, revised: 10/2014Date Created: 12/23/2015 3:00:29 PM
Total Loads
Load TypeLbs Nitrogen
Edge of StreamLbs Nitrogen
DeliveredLbs Phosphorus
Edge of StreamLbs Phosphorus
DeliveredLbs Sediment
Edge of StreamLbs Sediment
Delivered
Total: 4,122,011.0 3,901,982.9 140,895.7 125,795.7 19,764,147.5 18,755,983.9
Landuse 631,522.4 413,056.0 45,217.1 32,178.5 18,436,139.6 17,431,845.5
Septic 0.0 0.0 0.0 0.0 0.0 0.0
Waste Water andCombined SewerOutput
3,490,488.6 3,488,926.9 95,678.6 93,617.2 1,328,007.9 1,324,138.4
Total Annualized Costs
Sector Total Annualized Cost
Total: $20,764,372
Urban Land $20,762,933
Septic
Forest Land $1,439
Agricultural Land $0
Animal Manure $0
Land Use Loads
Land Use
Pre-BMP Acres
Post-BMP Acres
Lbs Nitrogen Edge of Stream
Lbs Nitrogen Delivered
Lbs Phosphorus Edge of Stream
Lbs Phosphorus Delivered
Lbs Sediment Edge of Stream
Lbs Sediment Delivered
Total: 52,034.0 52,034.0 631,522.4 413,056.0 45,217.1 32,178.5 18,436,140.0 17,431,850.0
Sector: Agriculture
0.0 0.0 0.0 0.0 0.0 0.0 0.0 0.0 Sector: Forest
2,247.7 2,247.7 7,384.8 4,546.9 114.9 67.4 308,983.8 298,309.3 Sector: Urban
49,534.8 49,534.8 621,417.7 406,544.8 44,955.8 32,010.1 18,127,160.0 17,133,540.0
Sector: Water
water 251.5 251.5 2,719.9 1,964.3 146.4 101.0 0.0 0.0
251.5 251.5 2,719.9 1,964.3 146.4 101.0 0.0 0.0
Septic Loads
Septic Zone Pre-BMP Systems Post-BMP SystemsLbs Nitrogen
Edge of StreamLbs Nitrogen
Delivered
Septic Zone Pre-BMP Systems Post-BMP SystemsLbs Nitrogen
Edge of StreamLbs Nitrogen
Delivered
Total: 0.0 0.0 0.0 0.0
Total: 0.0 0.0 0.0 0.0
Critical Area 0.0 0.0 0.0 0.0
Within 1000 ft of a perennialstream
0.0 0.0 0.0 0.0
Outside of the Critical Area, notwithin 1000 ft of a perennialstream
0.0 0.0 0.0 0.0
About MAST Scenarios Costs Scenario Worksheets Scenario Results
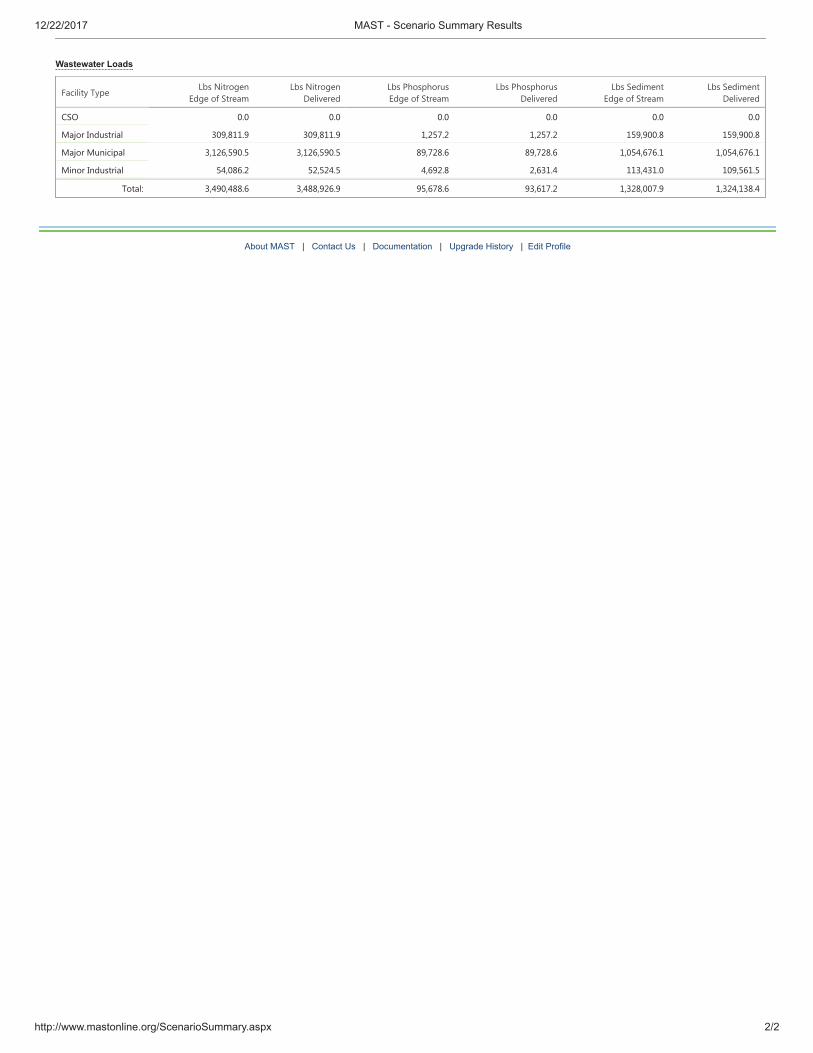
12/22/2017 MAST - Scenario Summary Results
http://www.mastonline.org/ScenarioSummary.aspx 2/2
Wastewater Loads
Facility Type
Lbs Nitrogen Edge of Stream
Lbs Nitrogen Delivered
Lbs Phosphorus Edge of Stream
Lbs Phosphorus Delivered
Lbs Sediment Edge of Stream
Lbs Sediment Delivered
Total: 3,490,488.6 3,488,926.9 95,678.6 93,617.2 1,328,007.9 1,324,138.4
CSO 0.0 0.0 0.0 0.0 0.0 0.0
Major Industrial 309,811.9 309,811.9 1,257.2 1,257.2 159,900.8 159,900.8
Major Municipal 3,126,590.5 3,126,590.5 89,728.6 89,728.6 1,054,676.1 1,054,676.1
Minor Industrial 54,086.2 52,524.5 4,692.8 2,631.4 113,431.0 109,561.5
About MAST | Contact Us | Documentation | Upgrade History | Edit Profile
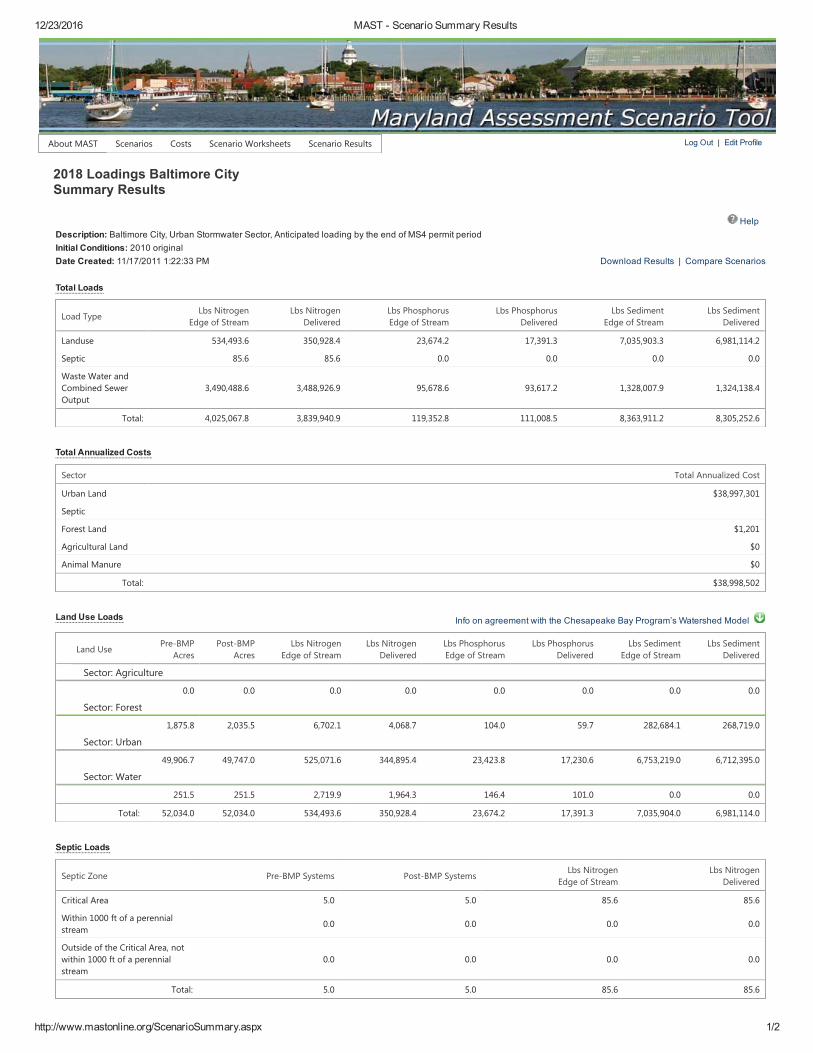
12/23/2016 MAST - Scenario Summary Results
http://www.mastonline.org/ScenarioSummary.aspx 1/2
Help
Download Results | Compare Scenarios
Info on agreement with the Chesapeake Bay Program’s Watershed Model
Log Out | Edit Profile
2018 Loadings Baltimore CitySummary Results
Description: Baltimore City, Urban Stormwater Sector, Anticipated loading by the end of MS4 permit periodInitial Conditions: 2010 originalDate Created: 11/17/2011 1:22:33 PM
Total Loads
Load TypeLbs Nitrogen
Edge of StreamLbs Nitrogen
DeliveredLbs PhosphorusEdge of Stream
Lbs PhosphorusDelivered
Lbs SedimentEdge of Stream
Lbs SedimentDelivered
Total: 4,025,067.8 3,839,940.9 119,352.8 111,008.5 8,363,911.2 8,305,252.6
Landuse 534,493.6 350,928.4 23,674.2 17,391.3 7,035,903.3 6,981,114.2
Septic 85.6 85.6 0.0 0.0 0.0 0.0
Waste Water andCombined SewerOutput
3,490,488.6 3,488,926.9 95,678.6 93,617.2 1,328,007.9 1,324,138.4
Total Annualized Costs
Sector Total Annualized Cost
Total: $38,998,502
Urban Land $38,997,301
Septic
Forest Land $1,201
Agricultural Land $0
Animal Manure $0
Land Use Loads
Land Use
Pre-BMPAcres
Post-BMPAcres
Lbs NitrogenEdge of Stream
Lbs NitrogenDelivered
Lbs PhosphorusEdge of Stream
Lbs PhosphorusDelivered
Lbs SedimentEdge of Stream
Lbs SedimentDelivered
Total: 52,034.0 52,034.0 534,493.6 350,928.4 23,674.2 17,391.3 7,035,904.0 6,981,114.0
Sector: Agriculture
0.0 0.0 0.0 0.0 0.0 0.0 0.0 0.0
Sector: Forest
1,875.8 2,035.5 6,702.1 4,068.7 104.0 59.7 282,684.1 268,719.0
Sector: Urban
49,906.7 49,747.0 525,071.6 344,895.4 23,423.8 17,230.6 6,753,219.0 6,712,395.0
Sector: Water
251.5 251.5 2,719.9 1,964.3 146.4 101.0 0.0 0.0
Septic Loads
Septic Zone Pre-BMP Systems Post-BMP SystemsLbs Nitrogen
Edge of StreamLbs Nitrogen
Delivered
Total: 5.0 5.0 85.6 85.6
Critical Area 5.0 5.0 85.6 85.6
Within 1000 ft of a perennialstream
0.0 0.0 0.0 0.0
Outside of the Critical Area, notwithin 1000 ft of a perennialstream
0.0 0.0 0.0 0.0
About MAST Scenarios Costs Scenario Worksheets Scenario Results

12/23/2016 MAST - Scenario Summary Results
http://www.mastonline.org/ScenarioSummary.aspx 2/2
Wastewater Loads
Facility Type
Lbs NitrogenEdge of Stream
Lbs NitrogenDelivered
Lbs PhosphorusEdge of Stream
Lbs PhosphorusDelivered
Lbs SedimentEdge of Stream
Lbs SedimentDelivered
Total: 3,490,488.6 3,488,926.9 95,678.6 93,617.2 1,328,007.9 1,324,138.4
CSO 0.0 0.0 0.0 0.0 0.0 0.0
Major Industrial 309,811.9 309,811.9 1,257.2 1,257.2 159,900.8 159,900.8
Major Municipal 3,126,590.5 3,126,590.5 89,728.6 89,728.6 1,054,676.1 1,054,676.1
Minor Industrial 54,086.2 52,524.5 4,692.8 2,631.4 113,431.0 109,561.5
About MAST | Contact Us | Documentation | Upgrade History | Edit Profile
Appendix M: Progress of Regional TMDLs for NutrientsTable M 1: Progress Status of Back River Nutrient TMDLTable M 2: Progress Status of Baltimore Harbor Nutrient TMDLTable M 3: Progress Status of Gwynns Falls Sediment TMDLTable M 4: Progress Status of Jones Falls Sediment TMDLTable M 5: Progress Status of Lower N. Patapsco Sediment TMDL
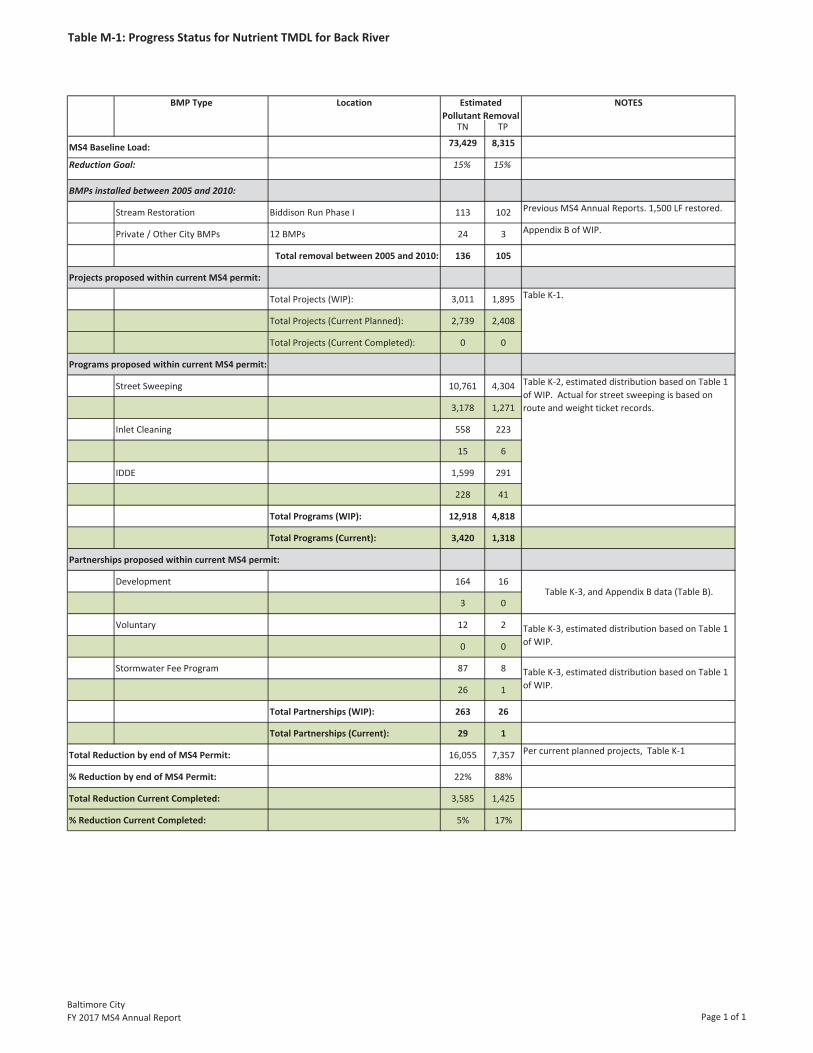
Table M 1: Progress Status for Nutrient TMDL for Back River
NOTES
TN TP
MS4 Baseline Load: 73,429 8,315
Reduction Goal: 15% 15%
BMPs installed between 2005 and 2010:
Stream Restoration Biddison Run Phase I 113 102 Previous MS4 Annual Reports. 1,500 LF restored.
Private / Other City BMPs 12 BMPs 24 3 Appendix B of WIP.
Total removal between 2005 and 2010: 136 105
Projects proposed within current MS4 permit:
Total Projects (WIP): 3,011 1,895
Total Projects (Current Planned): 2,739 2,408
Total Projects (Current Completed): 0 0
Programs proposed within current MS4 permit:
Street Sweeping 10,761 4,304
3,178 1,271
Inlet Cleaning 558 223
15 6
IDDE 1,599 291
228 41
Total Programs (WIP): 12,918 4,818
Total Programs (Current): 3,420 1,318
Partnerships proposed within current MS4 permit:
Development 164 16
3 0
Voluntary 12 2
0 0
Stormwater Fee Program 87 8
26 1
Total Partnerships (WIP): 263 26
Total Partnerships (Current): 29 1
Total Reduction by end of MS4 Permit: 16,055 7,357 Per current planned projects, Table K 1
% Reduction by end of MS4 Permit: 22% 88%
Total Reduction Current Completed: 3,585 1,425
% Reduction Current Completed: 5% 17%
Table K 3, and Appendix B data (Table B).
Table K 3, estimated distribution based on Table 1of WIP.
Table K 3, estimated distribution based on Table 1of WIP.
Table K 1.
Table K 2, estimated distribution based on Table 1of WIP. Actual for street sweeping is based onroute and weight ticket records.
EstimatedPollutant Removal
BMP Type Location
Baltimore CityFY 2017 MS4 Annual Report Page 1 of 1
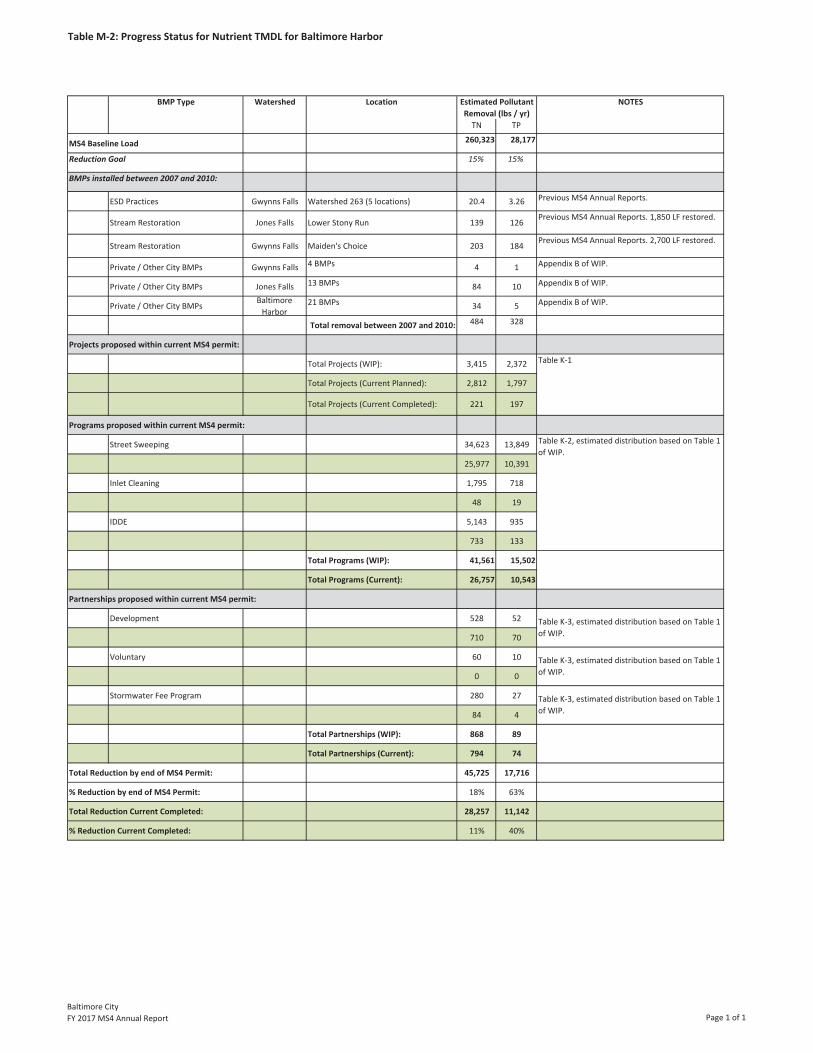
Table M 2: Progress Status for Nutrient TMDL for Baltimore Harbor
NOTES
TN TP
MS4 Baseline Load 260,323 28,177
Reduction Goal 15% 15%
BMPs installed between 2007 and 2010:
ESD Practices Gwynns Falls Watershed 263 (5 locations) 20.4 3.26 Previous MS4 Annual Reports.
Stream Restoration Jones Falls Lower Stony Run 139 126Previous MS4 Annual Reports. 1,850 LF restored.
Stream Restoration Gwynns Falls Maiden's Choice 203 184Previous MS4 Annual Reports. 2,700 LF restored.
Private / Other City BMPs Gwynns Falls 4 BMPs 4 1 Appendix B of WIP.
Private / Other City BMPs Jones Falls 13 BMPs 84 10 Appendix B of WIP.
Private / Other City BMPsBaltimoreHarbor
21 BMPs 34 5 Appendix B of WIP.
Total removal between 2007 and 2010: 484 328
Projects proposed within current MS4 permit:
Total Projects (WIP): 3,415 2,372
Total Projects (Current Planned): 2,812 1,797
Total Projects (Current Completed): 221 197
Programs proposed within current MS4 permit:
Street Sweeping 34,623 13,849
25,977 10,391
Inlet Cleaning 1,795 718
48 19
IDDE 5,143 935
733 133
Total Programs (WIP): 41,561 15,502
Total Programs (Current): 26,757 10,543
Partnerships proposed within current MS4 permit:
Development 528 52
710 70
Voluntary 60 10
0 0
Stormwater Fee Program 280 27
84 4
Total Partnerships (WIP): 868 89
Total Partnerships (Current): 794 74
Total Reduction by end of MS4 Permit: 45,725 17,716
% Reduction by end of MS4 Permit: 18% 63%
Total Reduction Current Completed: 28,257 11,142
% Reduction Current Completed: 11% 40%
Estimated PollutantRemoval (lbs / yr)
BMP Type Watershed Location
Table K 3, estimated distribution based on Table 1of WIP.
Table K 3, estimated distribution based on Table 1of WIP.
Table K 1
Table K 2, estimated distribution based on Table 1of WIP.
Table K 3, estimated distribution based on Table 1of WIP.
Baltimore CityFY 2017 MS4 Annual Report Page 1 of 1
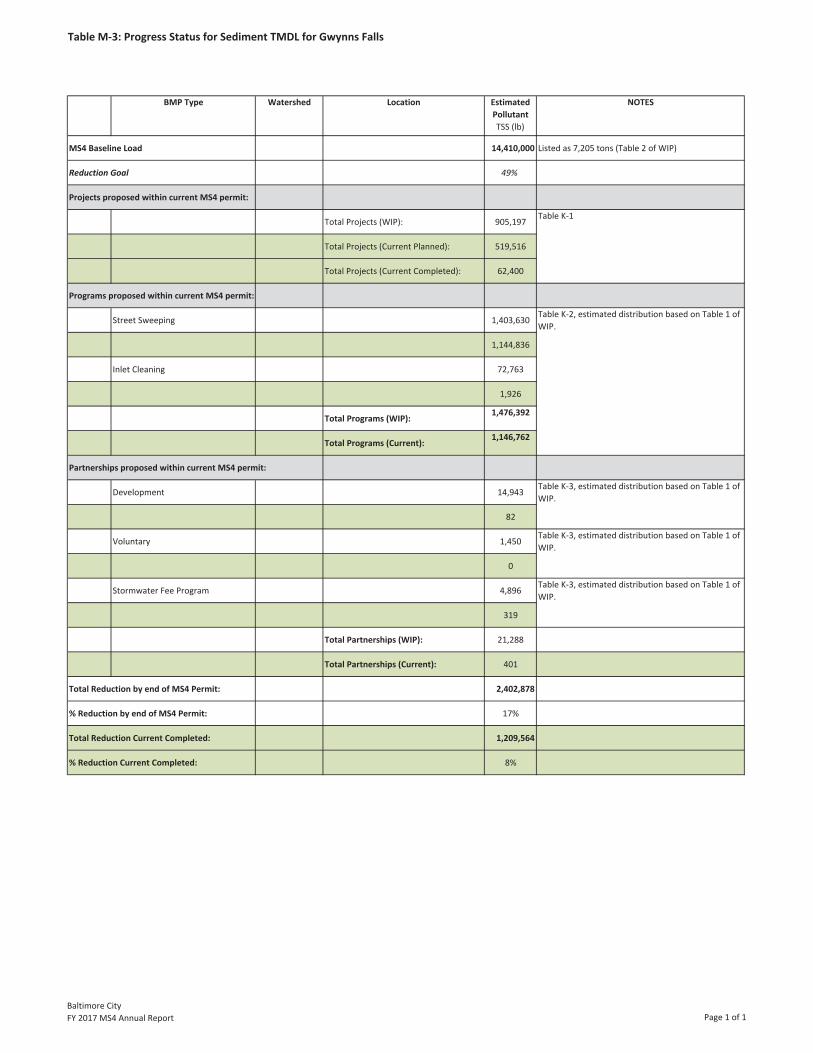
Table M 3: Progress Status for Sediment TMDL for Gwynns Falls
NOTES
TSS (lb)
MS4 Baseline Load 14,410,000 Listed as 7,205 tons (Table 2 of WIP)
Reduction Goal 49%
Projects proposed within current MS4 permit:
Total Projects (WIP): 905,197
Total Projects (Current Planned): 519,516
Total Projects (Current Completed): 62,400
Programs proposed within current MS4 permit:
Street Sweeping 1,403,630
1,144,836
Inlet Cleaning 72,763
1,926
Total Programs (WIP):1,476,392
Total Programs (Current):1,146,762
Partnerships proposed within current MS4 permit:
Development 14,943
82
Voluntary 1,450
0
Stormwater Fee Program 4,896
319
Total Partnerships (WIP): 21,288
Total Partnerships (Current): 401
Total Reduction by end of MS4 Permit: 2,402,878
% Reduction by end of MS4 Permit: 17%
Total Reduction Current Completed: 1,209,564
% Reduction Current Completed: 8%
BMP Type Watershed Location
Table K 1
Table K 3, estimated distribution based on Table 1 ofWIP.
Table K 3, estimated distribution based on Table 1 ofWIP.
Table K 3, estimated distribution based on Table 1 ofWIP.
Table K 2, estimated distribution based on Table 1 ofWIP.
EstimatedPollutant
Baltimore CityFY 2017 MS4 Annual Report Page 1 of 1
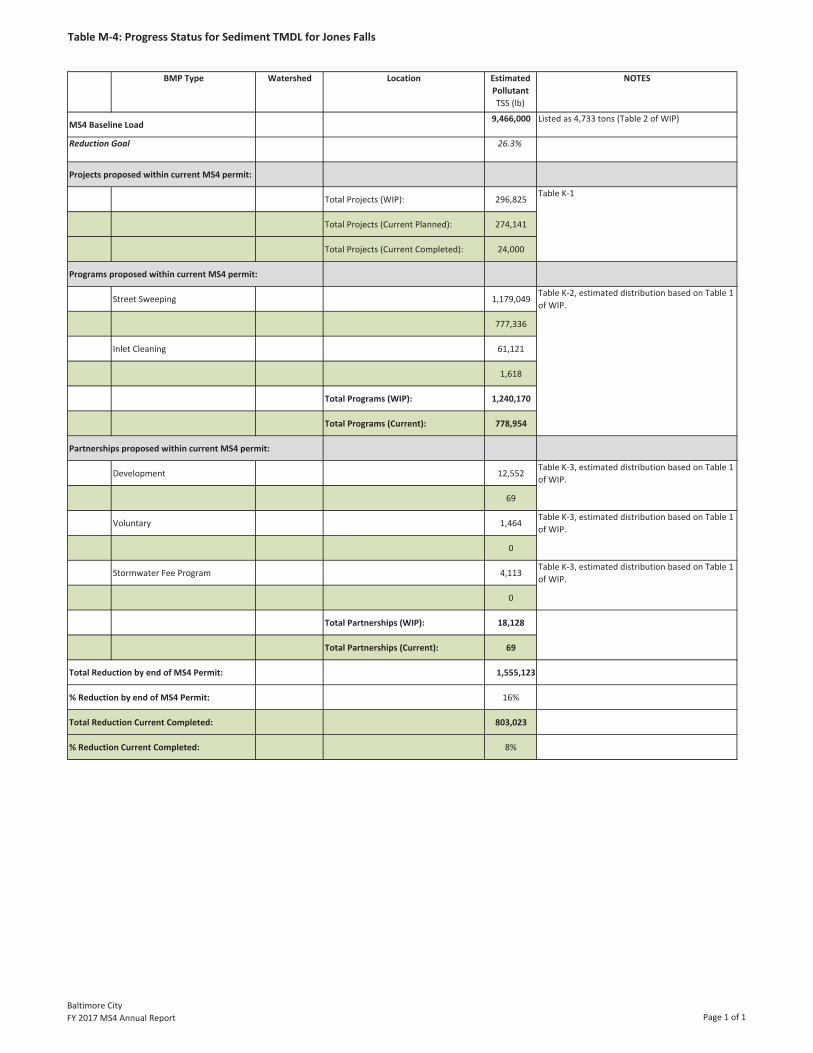
Table M 4: Progress Status for Sediment TMDL for Jones Falls
NOTES
TSS (lb)
MS4 Baseline Load9,466,000 Listed as 4,733 tons (Table 2 of WIP)
Reduction Goal 26.3%
Projects proposed within current MS4 permit:
Total Projects (WIP): 296,825
Total Projects (Current Planned): 274,141
Total Projects (Current Completed): 24,000
Programs proposed within current MS4 permit:
Street Sweeping 1,179,049
777,336
Inlet Cleaning 61,121
1,618
Total Programs (WIP): 1,240,170
Total Programs (Current): 778,954
Partnerships proposed within current MS4 permit:
Development 12,552
69
Voluntary 1,464
0
Stormwater Fee Program 4,113
0
Total Partnerships (WIP): 18,128
Total Partnerships (Current): 69
Total Reduction by end of MS4 Permit: 1,555,123
% Reduction by end of MS4 Permit: 16%
Total Reduction Current Completed: 803,023
% Reduction Current Completed: 8%
EstimatedPollutant
BMP Type Watershed Location
Table K 1
Table K 2, estimated distribution based on Table 1of WIP.
Table K 3, estimated distribution based on Table 1of WIP.
Table K 3, estimated distribution based on Table 1of WIP.
Table K 3, estimated distribution based on Table 1of WIP.
Baltimore CityFY 2017 MS4 Annual Report Page 1 of 1
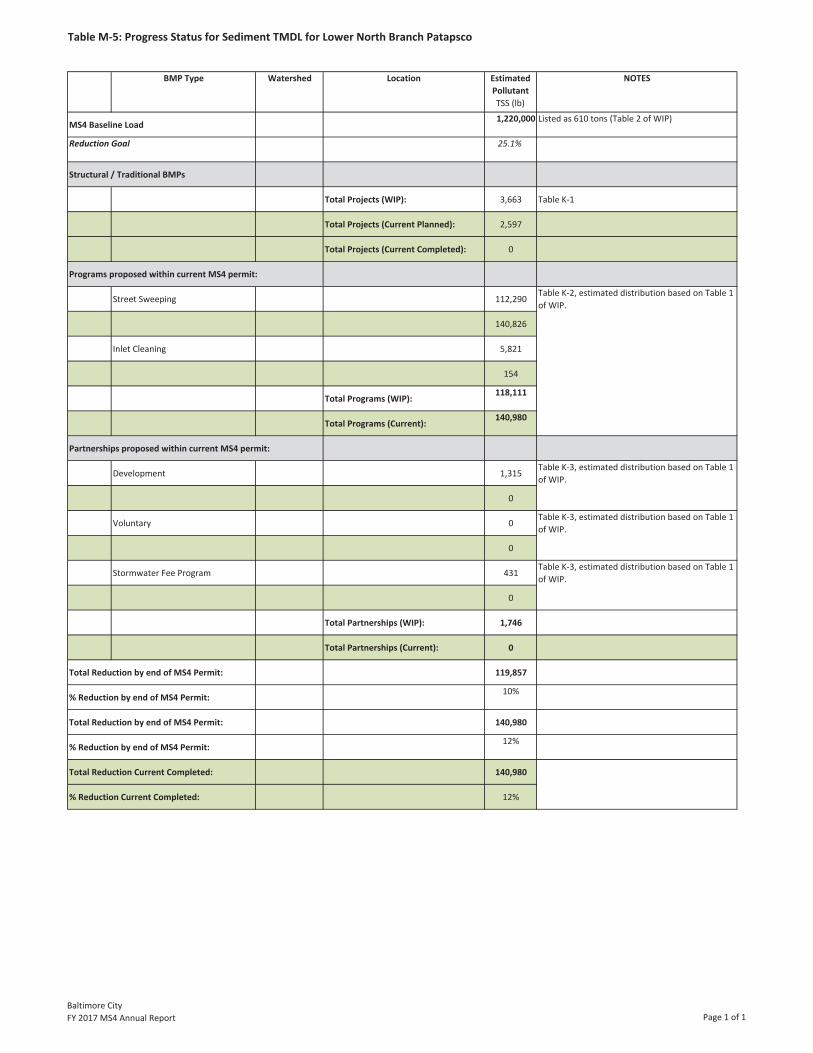
Table M 5: Progress Status for Sediment TMDL for Lower North Branch Patapsco
NOTES
TSS (lb)
MS4 Baseline Load1,220,000 Listed as 610 tons (Table 2 of WIP)
Reduction Goal 25.1%
Structural / Traditional BMPs
Total Projects (WIP): 3,663 Table K 1
Total Projects (Current Planned): 2,597
Total Projects (Current Completed): 0
Programs proposed within current MS4 permit:
Street Sweeping 112,290
140,826
Inlet Cleaning 5,821
154
Total Programs (WIP):118,111
Total Programs (Current):140,980
Partnerships proposed within current MS4 permit:
Development 1,315
0
Voluntary 0
0
Stormwater Fee Program 431
0
Total Partnerships (WIP): 1,746
Total Partnerships (Current): 0
Total Reduction by end of MS4 Permit: 119,857
% Reduction by end of MS4 Permit:10%
Total Reduction by end of MS4 Permit: 140,980
% Reduction by end of MS4 Permit:12%
Total Reduction Current Completed: 140,980
% Reduction Current Completed: 12%
BMP Type Watershed Location
Table K 2, estimated distribution based on Table 1of WIP.
Table K 3, estimated distribution based on Table 1of WIP.
Table K 3, estimated distribution based on Table 1of WIP.
Table K 3, estimated distribution based on Table 1of WIP.
EstimatedPollutant
Baltimore CityFY 2017 MS4 Annual Report Page 1 of 1