Baltimore AMERICAS Market Beat Industrial Q12012 (1)
3
Cushman & Wakefield of Maryland, Inc. 500 East Pratt Street, Suite 500 Baltimore, MD 21202 www.cushmanwakefield.com/knowledge The market terms and definitions in this report are based on NAIOP standards. No warranty or representation, express or implied, is made to the accuracy or completeness of the information contained herein, and same is submitted subject to errors, omissions, change of price, rental or other conditions, withdrawal without notice, and to any special listing conditions imposed by our principals. © 2012 Cushman & Wakefield, Inc. All rights reserved. ECONOMIC OVERVIEW According to the Bureau of Labor Statistics, a total of 120,000 jobs were created in March 2012. The national unemployment rate, at 8.2%, decreased 0.1 percentage points from February 2012. Although recent job growth figures fell short of market expectations, the overall steady improvements in the labor market continued to increase consumer confidence as consumer spending has ticked up in recent months. The preliminary unemployment rate for Maryland was 6.5% in February 2012, flat from January 2012. However, the state has added a total of 47,000 jobs from February 2011 to 2012 and its unemployment rate continued to remain below the national rate. MARKET CONDITIONS AND ACTIVITY STAY STRONG The Baltimore industrial market in the first quarter of 2012 continued to perform strongly as its overall vacancy rate, at 9.8%, decreased 1.2 percentage points and its direct asking rental rate, at $4.99 per square foot (psf), increased 3.7% from the first quarter of 2011. Year-to-date overall net absorption was positive at 1.0 million square feet (msf) with positive absorption concentrated in the Corridor markets. The I-95 North Corridor had a positive year-to-date overall net absorption of 766,017 square feet (sf), which was driven by Restoration Hardware, Inc.’s 600,000 -sf occupancy at 4000 Principio Parkway East (Bldg 1) in Cecil County. Other notable I-95 North Corridor occupancies included: the 98,659-sf Knight Takes King Production, Inc. and the 59,853-sf Bizerba Label Solutions, Inc at 1804 Fashion Court in Harford County . The Baltimore-Washington Corridor also remained active as its year-to-date overall net absorption was positive at 249,197 sf primarily due to Zust Bachmeier’s 129,232-sf occupancy at 1349 Charwood Road in Anne Arundel County and Elite Spice’s 158,400 -sf occupancy at 7751 Waterloo Road in Howard County. INVESTOR SALES IN THE CORRIDOR MARKETS A total of 1.1 msf of investor sales transactions were closed in the first quarter, with warehouse/distribution product accounting for 95.7% of the investor sales activity. Portfolio sale offerings remained active in the market as two major portfolio sales transactions were closed in the q uarter: AEW Capital Management LP’s fifteen building portfolio sale for $290 million, which included 7630 Gambrills Cove Road and 4622 Mercedes Drive, and Harwood Business Center, LLC’s portfolio sale of 6350 and 6360 South Hanover Road for $4.0 million, or $84.85 psf. Aside fr om portfolio sales, another notable investor sale transaction was Preston Scheffenacker Properties, Inc.’s purchase of 8000 Telegraph Drive for $7.1 million. OUTLOOK Activity levels in the Baltimore industrial market are expected to largely hold in the first half of 2012 as supply will stay constant and a tightening of prime warehouse/distribution space continues. Two construction projects, 521 A Chelsea Road and 4000 Principio Parkway East (Bldg 2), in the I-95 North Corridor are expected to deliver during the second half of 2012. Tenant occupancies in the second quarter of 2012, such as the 227,976-sf M&D Logistics occupancy at 8901 Snowden Parkway, are expected to yield positive absorption for the market and modestly decrease its vacancy rates. STATS ON THE GO 1Q11 1Q12 Y-O-Y CHANGE 12 MONTH FORECAST Overall Vacancy 11.0% 9.8% -1.2pp Direct Asking Rents (psf/yr) $4.81 $4.99 3.7% YTD Leasing Activity (sf) 1,115,980 1,307,503 17.2% OVERALL RENTAL VS. VACANCY RATES OVERALL ACTIVITY 9.0% 9.5% 10.0% 10.5% 11.0% 11.5% $4.70 $4.80 $4.90 $5.00 $5.10 $5.20 1Q11 2Q11 3Q11 4Q11 1Q12 p s f / y r OVERALL NET RENTAL RATE OVERALL VACANCY RATE 5 . 9 5 . 4 6 . 6 5 . 9 1 . 3 4 . 0 2 . 3 3 . 2 4 . 8 1 . 3 0.0 1.5 3.0 4.5 6.0 7.5 2008 2009 2010 2011 2012 YTD m s f LEASING ACTIVITY SALES ACTIVITY Q1 2012 BALTIMORE, MD INDUSTRIAL SNAPSHOT MARKETBEAT A Cushman & Wakefield Research Publication
Transcript of Baltimore AMERICAS Market Beat Industrial Q12012 (1)
8/2/2019 Baltimore AMERICAS Market Beat Industrial Q12012 (1)
http://slidepdf.com/reader/full/baltimore-americas-market-beat-industrial-q12012-1 1/2
Cushman & Wakefield of Maryland, Inc.500 East Pratt Street, Suite 500
Baltimore, MD 21202www.cushmanwakefield.com/knowledge
The market terms and definitions in this report are based on NAIOP standards. No warranty or representation, express or implied, is made to the accuracy orcompleteness of the information contained herein, and same is submitted subject to errors, omissions, change of price, rental or other conditions, withdrawalwithout notice, and to any special listing conditions imposed by our principals.
© 2012 Cushman & Wakefield, Inc. All rights reserved.
ECONOMIC OVERVIEW
According to the Bureau of Labor Statistics, a
total of 120,000 jobs were created in March
2012. The national unemployment rate, at 8.2%,
decreased 0.1 percentage points from February
2012. Although recent job growth figures fell
short of market expectations, the overall steady improvements in the
labor market continued to increase consumer confidence as
consumer spending has ticked up in recent months. The preliminary
unemployment rate for Maryland was 6.5% in February 2012, flat
from January 2012. However, the state has added a total of 47,000 jobs from February 2011 to 2012 and its unemployment rate
continued to remain below the national rate.
MARKET CONDITIONS AND ACTIVITY STAY STRONG
The Baltimore industrial market in the first quarter of 2012 continued
to perform strongly as its overall vacancy rate, at 9.8%, decreased 1.2
percentage points and its direct asking rental rate, at $4.99 per square
foot (psf), increased 3.7% from the first quarter of 2011. Year-to-date
overall net absorption was positive at 1.0 million square feet (msf)
with positive absorption concentrated in the Corridor markets. The
I-95 North Corridor had a positive year-to-date overall net
absorption of 766,017 square feet (sf), which was driven by
Restoration Hardware, Inc.’s 600,000-sf occupancy at 4000 PrincipioParkway East (Bldg 1) in Cecil County. Other notable I-95 North
Corridor occupancies included: the 98,659-sf Knight Takes King
Production, Inc. and the 59,853-sf Bizerba Label Solutions, Inc at 1804
Fashion Court in Harford County. The Baltimore-Washington
Corridor also remained active as its year-to-date overall net
absorption was positive at 249,197 sf primarily due to Zust
Bachmeier’s 129,232-sf occupancy at 1349 Charwood Road in Anne
Arundel County and Elite Spice’s 158,400-sf occupancy at 7751
Waterloo Road in Howard County.
INVESTOR SALES IN THE CORRIDOR MARKETS
A total of 1.1 msf of investor sales transactions were closed in the
first quarter, with warehouse/distribution product accounting for
95.7% of the investor sales activity. Portfolio sale offerings remained
active in the market as two major portfolio sales transactions were
closed in the quarter: AEW Capital Management LP’s fifteen building
portfolio sale for $290 million, which included 7630 Gambrills Cove
Road and 4622 Mercedes Drive, and Harwood Business Center,
LLC’s portfolio sale of 6350 and 6360 South Hanover Road for $4.0
million, or $84.85 psf. Aside from portfolio sales, another notable
investor sale transaction was Preston Scheffenacker Properties, Inc.’s
purchase of 8000 Telegraph Drive for $7.1 million.
OUTLOOK
Activity levels in the Baltimore industrial market are expected to
largely hold in the first half of 2012 as supply will stay constant and a
tightening of prime warehouse/distribution space continues. Two
construction projects, 521 A Chelsea Road and 4000 Principio
Parkway East (Bldg 2), in the I-95 North Corridor are expected to
deliver during the second half of 2012. Tenant occupancies in the
second quarter of 2012, such as the 227,976-sf M&D Logistics
occupancy at 8901 Snowden Parkway, are expected to yield positive
absorption for the market and modestly decrease its vacancy rates.
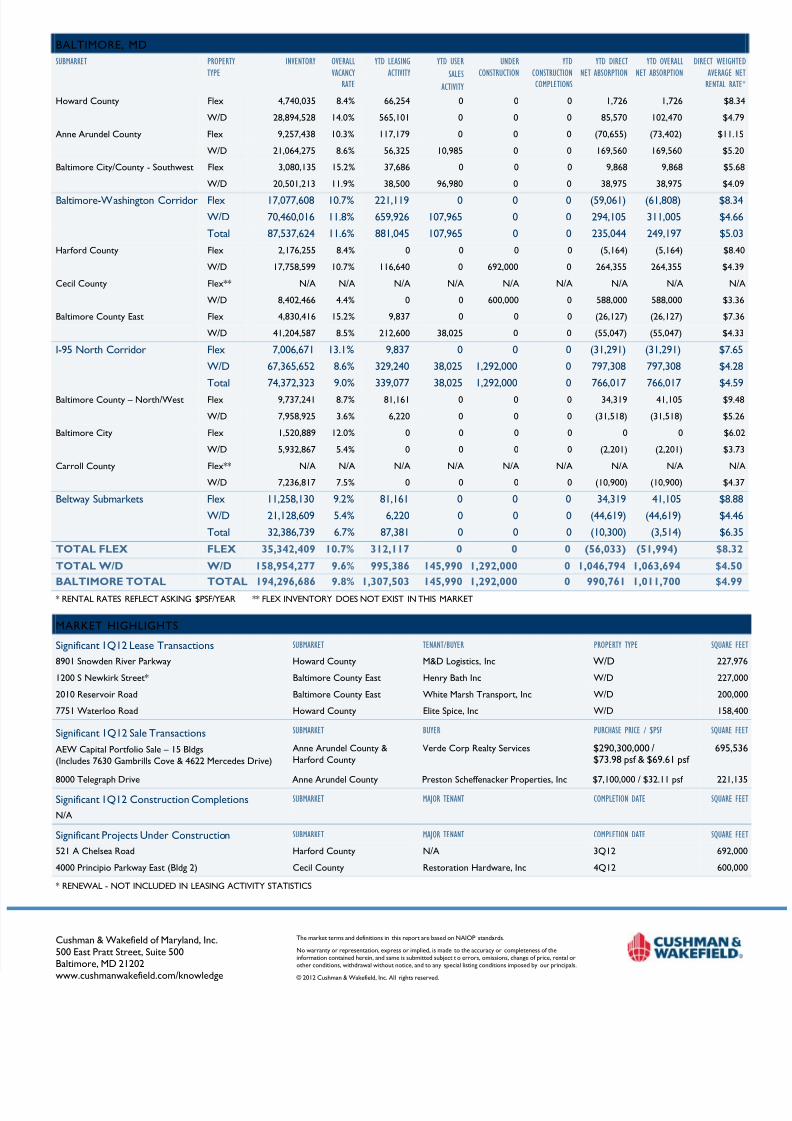
STATS ON THE GO
1Q11 1Q12 Y-O-Y
CHANGE
12 MONTH
FORECAST
Overall Vacancy 11.0% 9.8% -1.2pp
Direct Asking Rents (psf/yr) $4.81 $4.99 3.7%
YTD Leasing Activity (sf) 1,115,980 1,307,503 17.2%
OVERALL RENTAL VS. VACANCY RATES
OVERALL ACTIVITY
9.0%
9.5%
10.0%
10.5%
11.0%
11.5%
$4.70
$4.80
$4.90
$5.00
$5.10
$5.20
1Q11 2Q11 3Q11 4Q11 1Q12
p s f / y r
OVERALL NET RENTAL RATE OVERALL VACANCY RATE
5 . 9
5 . 4
6 . 6
5 . 9
1 . 3 4
. 0 2 . 3
3 . 2
4 . 8
1 . 3
0.0
1.5
3.0
4.5
6.0
7.5
2008 2009 2010 2011 2012 YTD
m s f
LEASING ACTIVITY SALES ACTIVITY
Q1 2012BALTIMORE, MD
INDUSTRIAL SNAPSHOT MARKETBEAT
A Cushman & Wakefield Research Publication
8/2/2019 Baltimore AMERICAS Market Beat Industrial Q12012 (1)
http://slidepdf.com/reader/full/baltimore-americas-market-beat-industrial-q12012-1 2/2
Cushman & Wakefield of Maryland, Inc.500 East Pratt Street, Suite 500Baltimore, MD 21202
www.cushmanwakefield.com/knowledge
The market terms and definitions in this report are based on NAIOP standards.
No warranty or representation, express or implied, is made to the accuracy or completeness of theinformation contained herein, and same is submitted subject t o errors, omissions, change of price, rental orother conditions, withdrawal without notice, and to any special listing conditions imposed by our principals.
© 2012 Cushman & Wakefield, Inc. All rights reserved.
BALTIMORE, MD
SUBMARKET PROPERTY
TYPE
INVENTORY OVERALL
VACANCY
RATE
YTD LEASING
ACTIVITY
YTD USER
SALES
ACTIVITY
UNDER
CONSTRUCTION
YTD
CONSTRUCTION
COMPLETIONS
YTD DIRECT
NET ABSORPTION
YTD OVERALL
NET ABSORPTION
DIRECT WEIGHT
AVERAGE N
RENTAL RAT
Howard County Flex 4,740,035 8.4% 66,254 0 0 0 1,726 1,726 $8.
W/D 28,894,528 14.0% 565,101 0 0 0 85,570 102,470 $4.7
Anne Arundel County Flex 9,257,438 10.3% 117,179 0 0 0 (70,655) (73,402) $11.
W/D 21,064,275 8.6% 56,325 10,985 0 0 169,560 169,560 $5.2
Baltimore City/County - Southwest Flex 3,080,135 15.2% 37,686 0 0 0 9,868 9,868 $5.6
W/D 20,501,213 11.9% 38,500 96,980 0 0 38,975 38,975 $4.0
Baltimore-Washington Corridor Flex 17,077,608 10.7% 221,119 0 0 0 (59,061) (61,808) $8.3
W/D 70,460,016 11.8% 659,926 107,965 0 0 294,105 311,005 $4.6
Total 87,537,624 11.6% 881,045 107,965 0 0 235,044 249,197 $5.0
Harford County Flex 2,176,255 8.4% 0 0 0 0 (5,164) (5,164) $8.4
W/D 17,758,599 10.7% 116,640 0 692,000 0 264,355 264,355 $4.
Cecil County Flex** N/A N/A N/A N/A N/A N/A N/A N/A N/
W/D 8,402,466 4.4% 0 0 600,000 0 588,000 588,000 $3.
Baltimore County East Flex 4,830,416 15.2% 9,837 0 0 0 (26,127) (26,127) $7.
W/D 41,204,587 8.5% 212,600 38,025 0 0 (55,047) (55,047) $4.
I-95 North Corridor Flex 7,006,671 13.1% 9,837 0 0 0 (31,291) (31,291) $7.6
W/D 67,365,652 8.6% 329,240 38,025 1,292,000 0 797,308 797,308 $4.2
Total 74,372,323 9.0% 339,077 38,025 1,292,000 0 766,017 766,017 $4.5
Baltimore County – North/West Flex 9,737,241 8.7% 81,161 0 0 0 34,319 41,105 $9.4
W/D 7,958,925 3.6% 6,220 0 0 0 (31,518) (31,518) $5.2
Baltimore City Flex 1,520,889 12.0% 0 0 0 0 0 0 $6.0
W/D 5,932,867 5.4% 0 0 0 0 (2,201) (2,201) $3.7
Carroll County Flex** N/A N/A N/A N/A N/A N/A N/A N/A N/
W/D 7,236,817 7.5% 0 0 0 0 (10,900) (10,900) $4.
Beltway Submarkets Flex 11,258,130 9.2% 81,161 0 0 0 34,319 41,105 $8.8
W/D 21,128,609 5.4% 6,220 0 0 0 (44,619) (44,619) $4.4
Total 32,386,739 6.7% 87,381 0 0 0 (10,300) (3,514) $6.3
TOTAL FLEX FLEX 35,342,409 10.7% 312,117 0 0 0 (56,033) (51,994) $8.3
TOTAL W/D W/D 158,954,277 9.6% 995,386 145,990 1,292,000 0 1,046,794 1,063,694 $4.5
BALTIMORE TOTAL TOTAL 194,296,686 9.8% 1,307,503 145,990 1,292,000 0 990,761 1,011,700 $4.9* RENTAL RATES REFLECT ASKING $PSF/YEAR ** FLEX INVENTORY DOES NOT EXIST IN THIS MARKET
MARKET HIGHLIGHTS
Significant 1Q12 Lease Transactions SUBMARKET TENANT/BUYER PROPERTY TYPE SQUARE F
8901 Snowden River Parkway Howard County M&D Logistics, Inc W/D 227,9
1200 S Newkirk Street* Baltimore County East Henry Bath Inc W/D 227,0
2010 Reservoir Road Baltimore County East White Marsh Transport, Inc W/D 200,0
7751 Waterloo Road Howard County Elite Spice, Inc W/D 158,4
Significant 1Q12 Sale Transactions SUBMARKET BUYER PURCHASE PRICE / $PSF SQUARE F
AEW Capital Portfolio Sale – 15 Bldgs
(Includes 7630 Gambrills Cove & 4622 Mercedes Drive)
Anne Arundel County &
Harford County
Verde Corp Realty Services $290,300,000 /$73.98 psf & $69.61 psf
695,5
8000 Telegraph Drive Anne Arundel County Preston Scheffenacker Properties, Inc $7,100,000 / $32.11 psf 221,1
Significant 1Q12 Construction Completions SUBMARKET MAJOR TENANT COMPLETION DATE SQUARE F
N/A
Significant Projects Under Construction SUBMARKET MAJOR TENANT COMPLETION DATE SQUARE F
521 A Chelsea Road Harford County N/A 3Q12 692,0
4000 Principio Parkway East (Bldg 2) Cecil County Restoration Hardware, Inc 4Q12 600,0
* RENEWAL - NOT INCLUDED IN LEASING ACTIVITY STATISTICS