Balancing Incentive Program - National Council on Aging · 2019-02-04 · Balancing Incentive...
77
Improving the lives of older Americans October 7, 2011 Balancing Incentive Program
Transcript of Balancing Incentive Program - National Council on Aging · 2019-02-04 · Balancing Incentive...

Improving the lives of older Americans
October 7, 2011
Balancing Incentive Program
© 2011. National Council on Aging A nonprofit service and advocacy organization
Friday Morning Collaborative
With support from The SCAN Foundation, NCOA leads a coalition of national aging and disability organizations working to protect and strengthen Home and Community-Based Services.
For more information about The SCAN Foundation visit:
www.TheSCANFoundation.org

© 2011. National Council on Aging A nonprofit service and advocacy organization
Friday Morning Collaborative
AARP
Alliance for Retired Americans
American Network of Community Options
and Resources
Association of University Centers on
Disabilities
Alzheimer’s Association
Balezon Center for Mental Health Law
Easter Seals
Families USA
Jewish Federations of North America
Leading Age
Lutheran Services in America
National Alliance for Caregiving
National Association of Area Agencies on
Aging
National Association for Home Care and
Hospice
National Committee to Preserve Social
Security and Medicare
National Council on Aging
National Council on Independent Living
National Consumer Voice for Quality Long-
Term Care
National Disability Rights Network
National Senior Citizens Law Center
Paralyzed Veterans of America
Paraprofessional Healthcare Institute
Service Employees International Union
The Arc/United Cerebral Palsy
United Spinal Association
Volunteers of America

© 2011. National Council on Aging A nonprofit service and advocacy organization
Webinar Overview
Introduction
• Joe Caldwell, National Council on Aging
Speakers
• Anne Montgomery (Senator Kohl)
• Janel George (Senator Cantwell)
• Effie George (CMS Disabled and Elderly Health Programs)
• David Braddock (Coleman Institute for Cognitive Disabilities,
University of Colorado)
• Enid Kassner (AARP Public Policy Institute)
Questions and Answers
• 15 - 20 minutes
Closing Remarks
© 2009. National Council on Aging A nonprofit service and advocacy organization
All Lines Will Be Muted During the Call To Ask A Question Use the Chat Feature

E F F I E R . G E O R G E , P H . D .
D I S A B L E D & E L D E R L Y H E A L T H P R O G R A M S G R O U P , C M C S
Balancing Incentive Program Section 10202
of the Affordable Care Act

Balancing Incentive Program
Goal – increase access to non-institutionally based Medicaid Services and implement key structural reforms
States must reach benchmarks of either 2 or 5% by the end of the program
CMS is accepting applications from States immediately through August 1, 2014
Enhanced FMAP available until September 30, 2015 or until total program funding of $3 billion dollars is expended
State Medicaid Agencies must apply

Balancing Incentive Program
Eligibility – States who submit an application and spend less than 50 % on HCBS
States may submit expenditure data on total Medicaid expenditures on LTSS as of FY 2009 to be reviewed on case by case basis
States may not apply based on expenditures by target population(s)
Funding available for community-based LTSS

Balancing Incentive Program
Financial Incentives – 2 or 5 % on eligible HCBS provided under the following Medicaid program authorities:
HCBS under 1915 (c) or (d) or under an 1115 Waiver; State plan home health; State plan personal care services; The Program of All-Inclusive Care for the Elderly (PACE); Home and community care services defined under Section 1929(a);
and Self-directed personal assistance services in 1915 (j), services provided under 1915(i), private duty nursing authorized under Section 1905 (a)(8) (provided
in home and community-based settings only) Affordable Care Act, Section 2703, State Option to Provide Health
Homes for Enrollees with Chronic Conditions Affordable Care Act, Section 2401, 1915(k) - Community First Choice
(CFC) Option.
Balancing Incentive Program
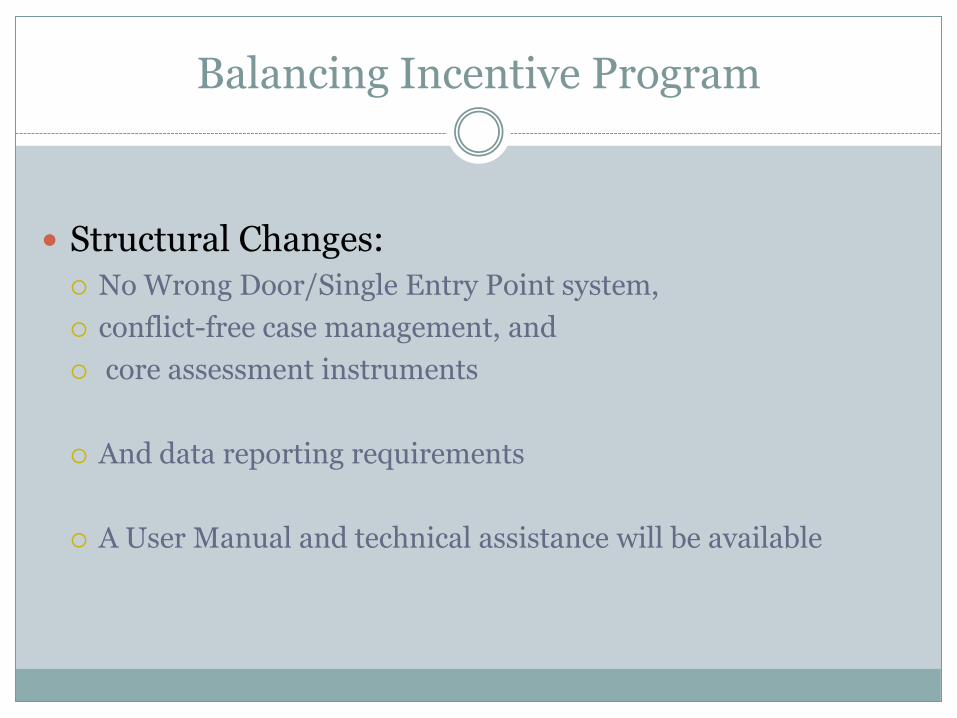
Structural Changes:
No Wrong Door/Single Entry Point system,
conflict-free case management, and
core assessment instruments
And data reporting requirements
A User Manual and technical assistance will be available

Balancing Incentive Program
Opportunities for collaboration and coordination
Community First Choice (CFC),
Health Home,
Money Follows the Person (MFP), and
Aging and Disability Resource Centers (ADRCs)

Resources
Balancing Incentive Program Guidance:
http://www.cms.gov/SMDL/SMD/itemdetail.asp?filterType=none&filterByDID=0&sort
ByDID=1&sortOrder=descending&itemID=CMS1252041&intNumPerPage=10
Questions or comments:

BALANCING INCENTIVES: DISABILITY
LONG-TERM CARE SYSTEMS
David Braddock, Ph.D.,
Associate Vice President, University of Colorado
Professor and Executive Director,
Coleman Institute for Cognitive Disabilities
Balancing Incentives Payments Webinar
Washington, DC October 7, 2011
Presentation © 2011 David Braddock

15
PRESENTATION
I. CURRENT TRENDS IN SERVICES
TO PEOPLE WITH DISABILITIES
IN THE U.S.
II. CHARACTERISTICS OF
ECONOMIC UNCERTAINTY IN
THE STATES

16
Source: Braddock, D., Coleman Institute, University of Colorado, 2010; estimated from U.S. Census Bureau,
American Community Survey (2010).
59%
41%
TOTAL: 56.05 MILLION PERSONS
Physical
and Sensory
Disabilities
Cognitive
Disabilities
Developmental,
Mental Health,
Alzheimer’s,
Brain Injury,
Stroke
I. OVERVIEW OF DISABILITY
IN THE U.S.: 2010
17
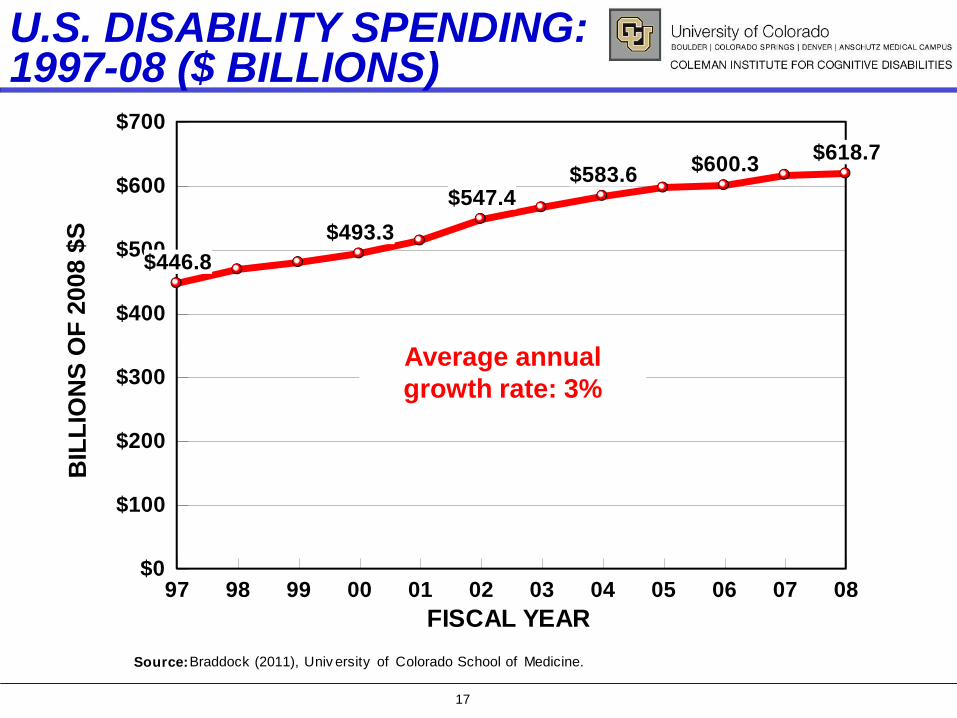
U.S. DISABILITY SPENDING: 1997-08 ($ BILLIONS)
Source: Braddock (2011), Univ ersity of Colorado School of Medicine.
97 98 99 00 01 02 03 04 05 06 07 08
FISCAL YEAR
$0
$100
$200
$300
$400
$500
$600
$700
BIL
LIO
NS
OF
2008 $
S
$446.8
$493.3
$547.4$583.6
$600.3$618.7
Average annual
growth rate: 3%

18
U.S. DISABILITY SPENDING IN 2008
30%
14%
26%
31%
Special Education$86.7 Billion
Health Care$158.3 Billion
Long Term Care$190.2 Billion
Income Maintenance$183.5 Billion
Figure 1Public Spending for Disability in 2008
Total: $618.7 Billion
Source: Braddock (2011), Univ ersity of Colorado School of Medicine, Department of Psy chiatry .

19
Source: Braddock, D., Coleman Institute, University of Colorado, 2010.
21% 29%
27%3%
20%
TOTAL: 23.1 MILLION PERSONS
Brain Injury6.18 Million
Severe, PersistentMental Illness
6.58 Million
Intellectual Disability
4.88 Million
Alzheimer's
4.63 Million
Stroke.80 Million
COGNITIVE/MH DISABILITY IN THE U.S.: 2010

20
2008 LONG-TERM CARE DISABILITY
SPENDING: % COMMUNITY BY STATE
1 Alaska 81% 18 North Carolina 52% 35 Nebraska 42%
2 New Mexico 71% 19 Washington 52% 36 Indiana 42%
3 Arizona 70% 20 District of Columbia 50% 37 Arkansas 41%
4 Vermont 66% 21 Iowa 50% 38 New Jersey 41%
5 California 64% 22 Michigan 50% 39 Tennessee 40%
6 Minnesota 63% 23 South Carolina 49% 40 Virginia 40%
7 Wyoming 62% 24 New Hampshire 48% 41 South Dakota 39%
8 Maine 61% 25 West Virginia 48% 42 Delaware 39%
9 Hawaii 61% 26 Pennsylvania 48% 43 Alabama 39%
10 Oregon 60% 27 Wisconsin 48% 44 Georgia 38%
11 Montana 59% 28 Rhode Island 46% 45 Missouri 38%
12 New York 57% 29 North Dakota 46% 46 Texas 38%
13 Utah 56% 30 Louisiana 45% 47 Ohio 37%
14 Colorado 55% 31 Maryland 44% 48 Illinois 36%
15 Nevada 55% 32 Connecticut 44% 49 Kentucky 34%
16 Idaho 54% 33 Massachusetts 44% 50 Mississippi 31%
17 Kansas 53% 34 Oklahoma 43% 51 Florida 30%
UNITED STATES 49%Source : Braddock, D., University of Colorado School of Medicine,
Department of Psychiatry, 2011.

21
I/DD LEADS PHYSICAL DISABILITY AND MENTAL HEALTH IN HCBS WAIVER $S
UNITED STATES
97 98 99 00 01 02 03 04 05 06 07 08
Fiscal Year
$0
$5
$10
$15
$20
$25
$30
Billio
ns o
f 2008 D
ollars
(F
ed
era
l-S
tate
)
$0.1$1.4 $1.5 $1.9 $2.1 $2.3 $2.4 $2.6 $2.9 $3.0 $3.2 $3.4 $3.7
$9.5$10.9
$13.1$14.1
$15.3
$17.5$18.6
$20.0$20.9
$21.9$23.1
$23.8
Intellectual DisabilityPhysical DisabilityMental Health
Source: Braddock (2011), Univ ersity of Colorado School of Medicine.
22
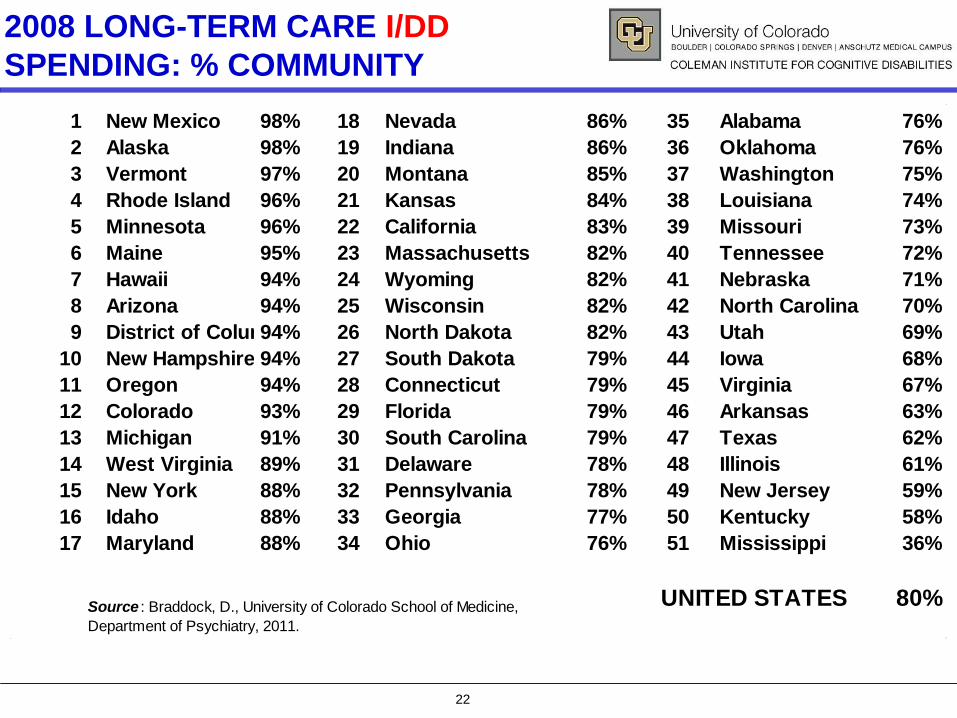
2008 LONG-TERM CARE I/DD
SPENDING: % COMMUNITY
1 New Mexico 98% 18 Nevada 86% 35 Alabama 76%
2 Alaska 98% 19 Indiana 86% 36 Oklahoma 76%
3 Vermont 97% 20 Montana 85% 37 Washington 75%
4 Rhode Island 96% 21 Kansas 84% 38 Louisiana 74%
5 Minnesota 96% 22 California 83% 39 Missouri 73%
6 Maine 95% 23 Massachusetts 82% 40 Tennessee 72%
7 Hawaii 94% 24 Wyoming 82% 41 Nebraska 71%
8 Arizona 94% 25 Wisconsin 82% 42 North Carolina 70%
9 District of Columbia94% 26 North Dakota 82% 43 Utah 69%
10 New Hampshire 94% 27 South Dakota 79% 44 Iowa 68%
11 Oregon 94% 28 Connecticut 79% 45 Virginia 67%
12 Colorado 93% 29 Florida 79% 46 Arkansas 63%
13 Michigan 91% 30 South Carolina 79% 47 Texas 62%
14 West Virginia 89% 31 Delaware 78% 48 Illinois 61%
15 New York 88% 32 Pennsylvania 78% 49 New Jersey 59%
16 Idaho 88% 33 Georgia 77% 50 Kentucky 58%
17 Maryland 88% 34 Ohio 76% 51 Mississippi 36%
UNITED STATES 80%Source : Braddock, D., University of Colorado School of Medicine,
Department of Psychiatry, 2011.

23
2008 LONG-TERM CARE MENTAL
HEALTH SPENDING: % COMMUNITY
1 Alaska 82% 18 Nevada 60% 35 Tennessee 40%
2 Arizona 82% 19 Minnesota 60% 36 Arkansas 40%
3 New Mexico 74% 20 Washington 56% 37 North Dakota 39%
4 Hawaii 74% 21 New Jersey 56% 38 Nebraska 38%
5 Vermont 72% 22 Maryland 55% 39 Virginia 37%
6 California 70% 23 Idaho 55% 40 Delaware 37%
7 Maine 69% 24 Wisconsin 53% 41 Missouri 36%
8 Montana 68% 25 New Hampshire 53% 42 Illinois 35%
9 North Carolina 67% 26 Massachusetts 52% 43 Georgia 33%
10 Iowa 65% 27 District of Columbia 52% 44 West Virginia 32%
11 Utah 64% 28 Kansas 49% 45 Mississippi 32%
12 Wyoming 64% 29 South Carolina 49% 46 Alabama 31%
13 Pennsylvania 63% 30 Connecticut 46% 47 Kentucky 30%
14 Michigan 62% 31 Rhode Island 46% 48 South Dakota 27%
15 New York 61% 32 Indiana 44% 49 Ohio 26%
16 Oregon 61% 33 Texas 44% 50 Louisiana 25%
17 Colorado 61% 34 Oklahoma 41% 51 Florida 25%
UNITED STATES 54%Source : Braddock, D., University of Colorado School of Medicine,
Department of Psychiatry, 2011.

24
2008 LONG-TERM CARE PHYSICAL
DISABILITY SPENDING: % COMMUNITY
1 Alaska 72% 18 North Carolina 28% 35 Oklahoma 19%
2 New Mexico 42% 19 Mississippi 27% 36 Wisconsin 18%
3 Vermont 39% 20 Louisiana 27% 37 Iowa 16%
4 California 38% 21 District of Columbia 26% 38 Indiana 15%
5 Utah 37% 22 Virginia 26% 39 North Dakota 15%
6 Montana 35% 23 Oregon 26% 40 Tennessee 15%
7 Wyoming 35% 24 Nebraska 26% 41 Idaho 15%
8 Minnesota 34% 25 New York 24% 42 Connecticut 14%
9 Kansas 32% 26 Kentucky 24% 43 New Jersey 13%
10 West Virginia 32% 27 Hawaii 23% 44 Ohio 13%
11 Washington 31% 28 Texas 23% 45 Pennsylvania 13%
12 South Carolina 30% 29 Illinois 22% 46 Maryland 12%
13 Arizona 30% 30 Georgia 20% 47 Delaware 12%
14 Nevada 29% 31 Missouri 20% 48 Michigan 12%
15 Alabama 28% 32 Maine 20% 49 Massachusetts 11%
16 Arkansas 28% 33 New Hampshire 19% 50 Florida 10%
17 Colorado 28% 34 South Dakota 19% 51 Rhode Island 8%
UNITED STATES 22%Source : Braddock, D., University of Colorado School of Medicine,
Department of Psychiatry, 2011.

25
• STRUCTURE AND
FINANCING OF I/DD
SERVICES IN THE
UNITED STATES

26
DAILY CENSUS OF STATE I/DD INSTITUTIONS IN THE U.S., 1848-2006
Source: Braddock, D., State of the States in Developmental Disabilities, 2008.
18481853
18581863
18681873
18781883
18881893
18981903
19081913
19181923
19281933
19381943
19481953
19581963
19681973
19781983
19881993
19982003
0
50,000
100,000
150,000
200,000
250,000
Daily C
en
su
s
10
194,650
38,630
33,732
2006
2009
20062009

27
STATES WITHOUT STATE-OPERATED
I/DD INSTITUTIONS
1. DISTRICT OF COLUMBIA (1991)
2. NEW HAMPSHIRE (1991)
3. VERMONT (1993)
4. RHODE ISLAND (1994)
5. ALASKA (1997)
6. NEW MEXICO (1997)
7. WEST VIRGINIA (1998)
8. HAWAII (1999)
9. MAINE (1999)
10.MICHIGAN (2009)
11.OREGON (2009)
12.ALABAMA (2012)
13.MINNESOTA (2000)* 14. INDIANA (2007)*
Source: Braddock, D., State of the States in Developmental Disabilities, 2011. *Denotes ICF/ID
units in mental health institutions.

28
Utilization Rate: 194 per 100,000
INDIVIDUALS WITH I/DD IN OUT-OF-
HOME PLACEMENTS IN THE U.S., 2009
Source: Braddock, D., State of the States in Developmental Disabilities, 2011.
33%
10%
Total: 593,483 Persons
7-15 Persons58,136
United States
Group, foster,
host homes,
apartments
196,211 Persons
Supported Living
246,822 Persons
6/Fewer Persons75%
Public-Private 16+Institutions
92,314
42%
15%

29
0 10 20 30 40 50 60 70 80 90 100
Percent of Total Out-of-Home Placements
VermontAlaskaHawaii
OregonNew Hampshire
ArizonaNew Mexico
MinnesotaKansas
MarylandNevada
District of ColumbiaColorado
WashingtonMaine
Rhode IslandWyomingMichiganCalifornia
IdahoDelaware
MassachusettsWest VirginiaPennsylvania
ConnecticutNorth Carolina
TexasNebraska
WisconsinUNITED STATES
TennesseeFlorida
MontanaVirginiaGeorgia
UtahOhio
KentuckySouth Carolina
North DakotaSouth Dakota
New JerseyIndiana
MissouriNew York
IowaAlabama
LouisianaOklahomaArkansas
IllinoisMississippi
98%98%
96%95%95%
94%93%93%93%
92%91%91%
90%90%90%
89%89%89%
86%85%
83%83%
81%80%80%80%
78%78%
77%75%
73%73%
70%70%70%
68%67%67%
66%66%
65%64%64%
63%63%63%
61%54%
53%50%
38%33%
PERCENT OF TOTAL
OUT-OF-HOME I/DD
PLACEMENTS IN
SETTINGS FOR 6 OR
FEWER PERSONS, 2009
Source: Braddock, D., State of the States in
Developmental Disabilities, 2011.

30
I/DD MEDICAID MONEY IN THE STATES? 20% IS IN NEW YORK
NY Times,
August 2, 2011

31
ESTIMATED PERCENT OF
I/DD CAREGIVING
FAMILIES RECEIVING
STATE I/DD AGENCY
SUPPORT, 2009
• THE HCBS WAIVER
FINANCES 58% OF
FAMILY SUPPORT
SPENDING IN THE
U.S.
0 20 40 60 80 100
Percent of All Caregiving Families
WisconsinNew Mexico
New YorkNew Hampshire
South DakotaMontanaArizona
VermontCaliforniaLouisiana
ConnecticutMassachusetts
DelawareSouth Carolina
AlaskaWyoming
PennsylvaniaNew Jersey
OhioMinnesota
UNITED STATESWest Virginia
MichiganKansas
MarylandMissouri
MississippiOklahoma
Rhode IslandTennessee
WashingtonTexas
North DakotaNorth Carolina
NevadaFlorida
IowaKentuckyColorado
HawaiiDistrict of Columbia
IllinoisGeorgiaIndianaOregon
UtahIdahoMaine
VirginiaNebraskaAlabamaArkansas
34%33%33%
32%31%31%31%
29%28%
26%25%
24%23%23%
22%22%
21%20%
19%18%
17%16%
15%15%15%15%15%
14%13%13%
12%12%12%
10%10%10%
8%8%8%8%8%8%
7%7%7%
6%5%5%5%
4%3%
2%
Source: Braddock, D., State of the States in
Developmental Disabilities, 2011.

32
• ECONOMIC
UNCERTAINTY IN
THE STATES

33
STATE OF THE STATES IN I/DD
• DURING 2006, 2008 AND 2009, AGGREGATE
PUBLIC NATIONWIDE I/DD SPENDING GREW
BY THE SMALLEST AMOUNTS WE HAVE
OBSERVED IN 32 YEARS.
Source: Braddock, D., State of the States in Developmental Disabilities, 2011.

34
ANNUAL % CHANGE IN INFLATION- ADJUSTED SPENDING: 1978-09
7879
8081
8283
8485
8687
8889
9091
9293
9495
9697
9899
0001
0203
0405
0607
0809
Fiscal Year
0.0%
2.0%
4.0%
6.0%
8.0%
10.0%
12.0%
Perc
en
t R
eal C
ha
ng
e
7.0%
3.3%
11.2%
7.1%
2.5%
6.6%
1.6%
1.0%
1.9%
0.4%
1.1%
3.8%
Source: Braddock, D., State of the States in Developmental Disabilities, 2011.
U.S. I/DD
SPENDING

35
INFLATION-ADJUSTED CHANGE IN I/DD SPENDING IN THE STATES, 2008-09:
Source: Braddock, D., State of the States in Developmental Disabilities, 2011.
State % Change State % Change State % ChangeOregon 12% Illinois 2% Kentucky -1%District of Columbia 11% Delaware 2% Michigan -2%Louisiana 10% West Virginia 2% Missouri -2%North Dakota 10% Utah 2% Alabama -2%Nevada 9% Mississippi 2% Indiana -3%Alaska 8% New Mexico 2% Maryland -4%Washington State 7% Virginia 1% Iowa -4%North Carolina 6% Massachusetts 1% New Jersey -4%Arkansas 5% Maine 1% Hawaii -5%Arizona 4% Kansas 1% Montana -6%California 4% South Dakota 0% Georgia -6%New York 4% Minnesota -0.3% Texas -7%Connecticut 4% Nebraska -1% Florida -8%New Hampshire 3% Wyoming -1% Idaho -9%Colorado 3% Ohio -1% Rhode Island -10%Pennsylvania 3% Wisconsin -1% South Carolina -11%Vermont 3% Tennessee -1% Oklahoma -12%
UNITED STATES 1.1%
23 REDUCTIONS

36
WHICH STATES ARE CONFIDENT ABOUT THE U.S. ECONOMY TODAY?
11-13-16-17-17-19-19-20-20-20-22-24-25-26-26-26-27-27-27-28-28-28-29-29-29-30-30-30-31-31-31-31-31-31-33-33-33-33-33-33-34-34-34-35-35-35-36-37-37-39-44
-45 -40 -35 -30 -25 -20 -15 -10 -5 0 5 10 15
DISTRICT OF COLUMBIANebraska
North DakotaSouth Dakota
MarylandMassachusetts
UtahIowa
MinnesotaVirginiaAlaska
ColoradoWisconsin
TexasCalifornia
HawaiiSouth Carolina
GeorgiaKansas
New YorkIllinois
New HampshireNew Jersey
Pennsylv aniaNorth Carolina
WashingtonNew MexicoConnecticut
VermontIndiana
AlabamaMissouriMichigan
OklahomaArizona
MontanaWyomingArkansas
OregonTennessee
Rhode IslandFlorida
OhioDelawareKentucky
Nev adaMississippi
LouisianaIdahoMaine
West Virginia
Least Pessimistic
Most Pessimistic
Gallup Poll, in C. Rampell, "Why Washington Likes Itself," NY Times, 8/28/11
37
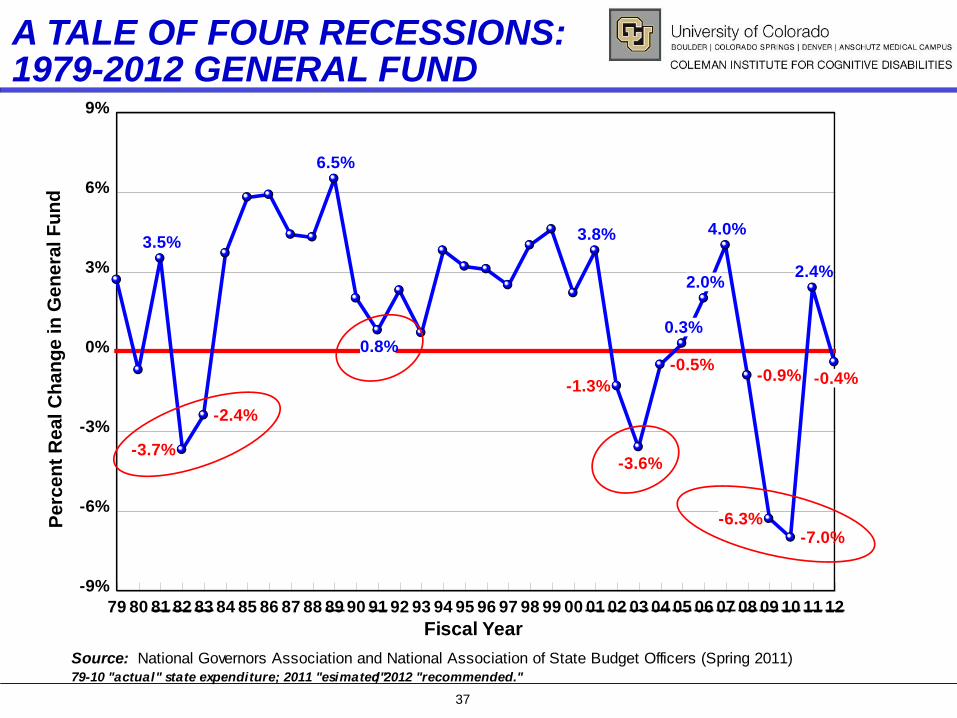
A TALE OF FOUR RECESSIONS: 1979-2012 GENERAL FUND
79 80 81 82 83 84 85 86 87 88 89 90 91 92 93 94 95 96 97 98 99 00 01 02 03 04 05 06 07 08 09 10 11 12
Fiscal Year
-9%
-6%
-3%
0%
3%
6%
9%
Perc
en
t R
eal C
ha
ng
e in
Ge
ne
ral F
un
d
3.5%
-3.7%
-2.4%
6.5%
0.8%
3.8%
-1.3%
-3.6%
-0.5%
0.3%
2.0%
4.0%
-0.9%
-6.3%-7.0%
2.4%
-0.4%
Source: National Governors Association and National Association of State Budget Officers (Spring 2011)79-10 "actual" state expenditure; 2011 "esimated"; 2012 "recommended."

38
DECADE OF STATE BUDGET SHORTFALLS
2002 2003 2004 2005 2006 2007 2008 2009 2010 2011 2012
Fiscal Year
($300)
($250)
($200)
($150)
($100)
($50)
$0
$50
Billio
ns o
f D
ollars
($40)
($75) ($80)
($45)
$1
($6)
($29)
($110)
($191)
($130)
($103)
Last RecessionMarch-Nov. 2001
"Great Recession"Dec. 2007- June 2009
Source: Center on Budget and Policy Priorities (June 2011); National Bureau of Economic Research (2010).

39
STATE BUDGET SHORTFALLS
State
Percent of 2012
State Budget State
Percent of 2012
State Budget State
Percent of 2012
State Budget
Nevada 37.4% Pennsylvania 13.4% Rhode Island 6.9%
New Jersey 36.0% Virginia 12.3% Colorado 6.2%
California 27.2% North Carolina 12.1% Massachusetts 5.6%
Oregon 25.5% Florida 11.5% District of Columbia 5.1%
Texas 20.5% South Carolina 11.5% Nebraska 4.8%
Minnesota 20.3% Wisconsin 11.5% Idaho 3.6%
Louisiana 19.4% Ohio 11.1% Michigan 3.6%
New Hampshire 18.4% South Dakota 11.0% Iowa 2.4%
New York 17.6% Hawaii 9.8% Alaska na
Arizona 17.0% Maryland 9.5% Arkansas na
Illinois 16.0% Oklahoma 9.0% Delaware na
Washington 15.3% Missouri 8.9% Indiana na
Connecticut 14.7% Kentucky 8.3% Montana na
Vermont 14.3% New Mexico 8.3% North Dakota na
Maine 13.8% Kansas 8.1% Tennessee na
Mississippi 13.8% Utah 8.0% West Virginia na
Alabama 13.4% Georgia 7.6% Wyoming na
TOTAL 15.9%
42 STATES PROJECT BUDGET GAPS FOR FY 2012
Source : McNichol, Oliff, & Johnson, Center on Budget and Policy Priorities , June 17, 2011.

40
STATE TAX REVENUE FELL 2008 Q2 –
2009 Q2—REBOUNDED 2009 Q3 -- 2011 Q2
Source: The Nelson A. Rockefeller Institute
of Government, September 2011.
2007 2008 2009 2010 2011
YEAR
-20%
-15%
-10%
-5%
0%
5%
10%
15%A
dju
ste
d P
erc
en
t C
han
ge 5.4%
-16.3%
3.3%
1.9%
11.4%
2011: Q 2

41
Source: The Nelson A.
Rockefeller Institute of
Government, September 2011.
% CHANGE IN STATE
TAX REVENUE
JANUARY-MARCH
QUARTER, 2010 TO
2011 (Revised)
Delaware 49.5% Utah 7.0%
North Dakota 39.7% Maine 6.6%
Wyoming 19.4% Kansas 6.5%
New Mexico 17.2% Tennessee 6.3%
Illinois 12.2% Mississippi 5.9%
Arizona 12.1% Kentucky 5.7%
New York 11.6% South Carolina 5.7%
Minnesota 10.8% Washington 5.7%
Idaho 10.4% Arkansas 5.5%
Oregon 10.3% New Jersey 5.4%
West Virginia 9.7% Rhode Island 5.4%
Colorado 9.2% Nebraska 5.0%
Vermont 8.9% Missouri 4.9%
California 8.6% Alabama 4.6%
Connecticut 8.6% Virginia 4.6%
Massachusetts 8.6% New Hampshire 4.0%
Ohio 8.3% South Dakota 3.8%
Oklahoma 8.3% Michigan 3.5%
Pennsylvania 8.3% Florida 2.8%
Georgia 7.7% North Carolina 2.0%
Texas 7.6% Maryland 1.5%
Wisconsin 7.6% Nevada -0.2%
Montana 7.5% Louisiana -3.9%
Indiana 7.3% Hawaii -4.5%
Iowa 7.1% Alaska -12.0%
U.S. 7.4%
BOUNCING BACK? SALES TAX REVENUE INCREASES IN 47 STATES

42
PETER BLANCK, PhD, JD, Chairman, Burton Blatt Institute, Syracuse University
DAVID BRADDOCK, PhD, Chair of Conference, Associate VP, University of Colorado
ANN CALDWELL, PhD, Chief Research and Innovations Officer, The Arc of the US
HENRY CLAYPOOL, Director, Office on Disability, US DHHS
BILL COLEMAN, founding donor, partner, Alsop-Louie Partners, San Francisco
DIANE COYLE, PhD, economist, internationally acclaimed author of The Economics of
Enough: How to Run an Economy as if the Future Matters, Princeton Univ. Press
MARK EMERY, CEO, Imagine! Colorado
JIM GARDNER, PhD, President and CEO, The Council on Quality and Leadership
SHARON LEWIS, Commissioner, Administration on Developmental Disabilities, US
Department of Health and Human Services (USDHHS)
WILLIAM POUND, Executive Director, National Conference of State Legislatures
JO ANN SIMMONS, Board Chair, National Down Syndrome Society
SUE SWENSON, Deputy Assist. Secretary for Special Education and Rehabilitation
NANCY THALER, Executive Director, National Association of State Directors of
Developmental Disabilities Services (NASDDDS)
COLEMAN INSTITUTE CONFERENCE,
OCTOBER 13, 2011, WESTMINSTER, CO
STATE OF THE STATES, STATE OF THE NATION: 2011
ColemanInstitute.org
43
CONTACT INFORMATION
David Braddock, Ph.D.
Coleman-Turner Professor of Psychiatry
& Executive Director
Coleman Institute for Cognitive Disabilities
University of Colorado System (SYS 586)
3825 Iris Avenue, Suite 200
Boulder, CO 80301
E-mail: [email protected]
Phone: 303-492-0639
http://ColemanInstitute.org

Raising Expectations
Enid Kassner
Director, Independent Living/Long-Term Services and Supports
AARP Public Policy Institute
A State Scorecard on Long-Term Services and Supports for Older Adults,
People with Physical Disabilities, and Family Caregivers
October 7, 2011
Presentation to the Friday Morning Collaborative

Background
• Concise performance tool to put LTSS policies
and programs in context and prompt dialogue.
• First attempt to use a multidimensional approach
to comprehensively measure state LTSS system
performance overall and across diverse areas of
performance.
• Differs from analyses that examine a single
aspect of states’ LTSS systems.
• Developed over two years: feasibility, vision,
measures.
45

Expert Advisors • Lisa Alecxih
• Brian Burwell
• Penny Feldman
• Lynn Friss Feinberg
• Melissa Hulbert
• Rosalie Kane
• Ruth Katz
• James Knickman
• Harriet Komisar
• Joseph Lugo
• William Scanlon
o Lisa Alecxih
o Robert Applebaum
o Brian Burwell
o Charlene Harrington
o Lauren Harris-Kojetin
o Carol Irvin
o Kathy Leitch
o Chuck Milligan
o Terry Moore
o Vince Mor
o D.E.B. Potter
o Jean Accius
Kathy Apple
Melanie Bella
Dina Belloff
Carrie Blakeway
Jennifer Burnett
Henry Claypool
Mindy Cohen
Pam Doty
Barbara Edwards
Steve Eiken
Jennifer Farnham
Sara Galantowicz
Sabrina How
Gail Hunt
Bob Kafka
Kathy Kelly
Thomas Lawless
Kevin Mahoney
Suzanne Mintz
Herb Sanderson
Mark Sciegaj
Nancy Spector
Shawn Terrell
Nancy Thaler
Heather Young
46

Goals
• Raise the national level of performance for LTSS.
• Help states:
• Assess their systems of long-term services and
supports (LTSS);
• Target areas for improvement;
• Provide a foundational set of baseline indicators to
measure progress; and
• Engage public and private sectors.
47
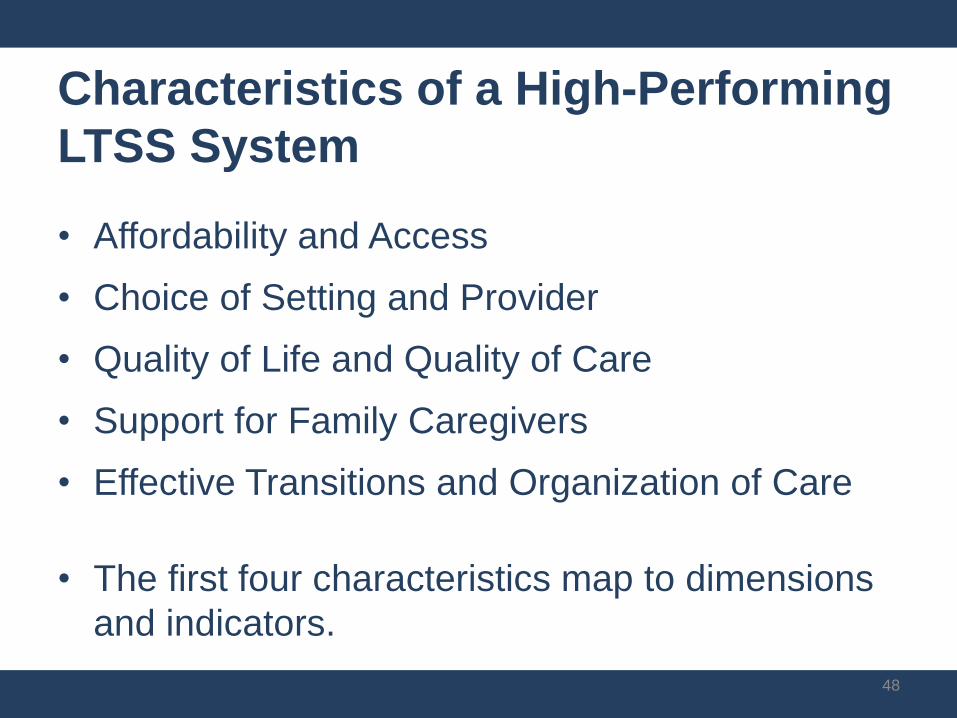
Characteristics of a High-Performing
LTSS System
• Affordability and Access
• Choice of Setting and Provider
• Quality of Life and Quality of Care
• Support for Family Caregivers
• Effective Transitions and Organization of Care
• The first four characteristics map to dimensions
and indicators.
48

49

Dimension: Affordability and Access
In a high-performing LTSS system, consumers are able to easily
find and afford the services they need and there is a safety net for
those who cannot afford services.
Affordability and Access include:
• The relative affordability of private-pay LTSS;
• The proportion of individuals with private long-term care
insurance;
• The reach of the Medicaid safety net and the Medicaid LTSS
safety net to people with disabilities who have modest incomes;
and
• The ease of navigating the LTSS system.
50
50
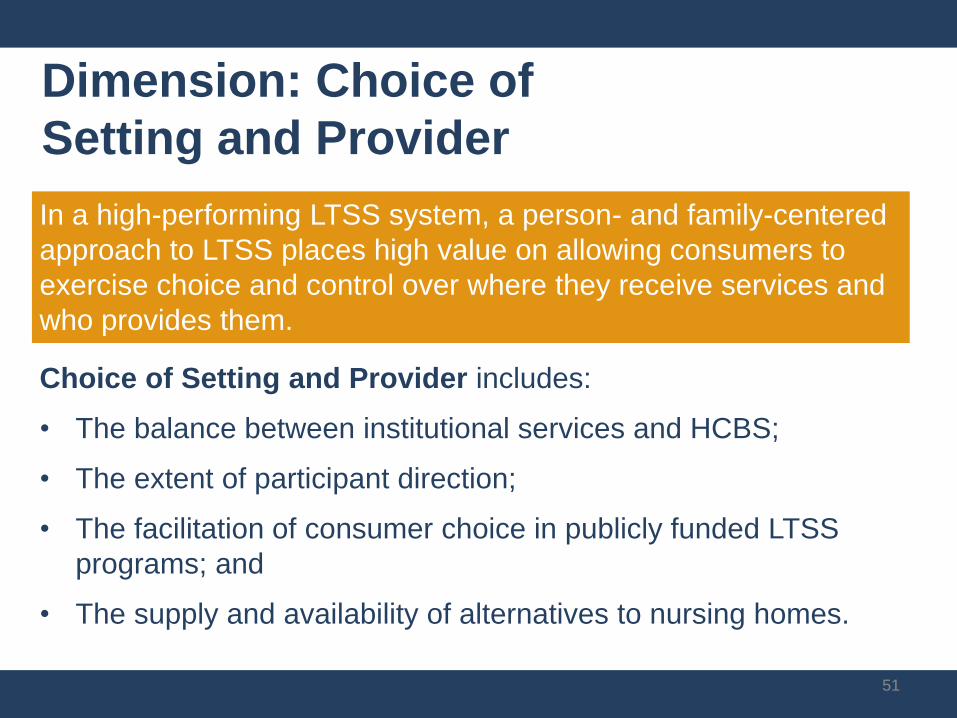
Dimension: Choice of
Setting and Provider
In a high-performing LTSS system, a person- and family-centered
approach to LTSS places high value on allowing consumers to
exercise choice and control over where they receive services and
who provides them.
Choice of Setting and Provider includes:
• The balance between institutional services and HCBS;
• The extent of participant direction;
• The facilitation of consumer choice in publicly funded LTSS
programs; and
• The supply and availability of alternatives to nursing homes.
51 51

Dimension: Quality of Life and
Quality of Care
In a high-performing LTSS system, services maximize positive
outcomes and consumers are treated with respect. Personal
preferences are honored when possible.
Quality of Life and Quality of Care include:
• Level of support, life satisfaction, and employment of people
with disabilities living in the community; and
• Indicators of quality in nursing homes and in home health
services.
52
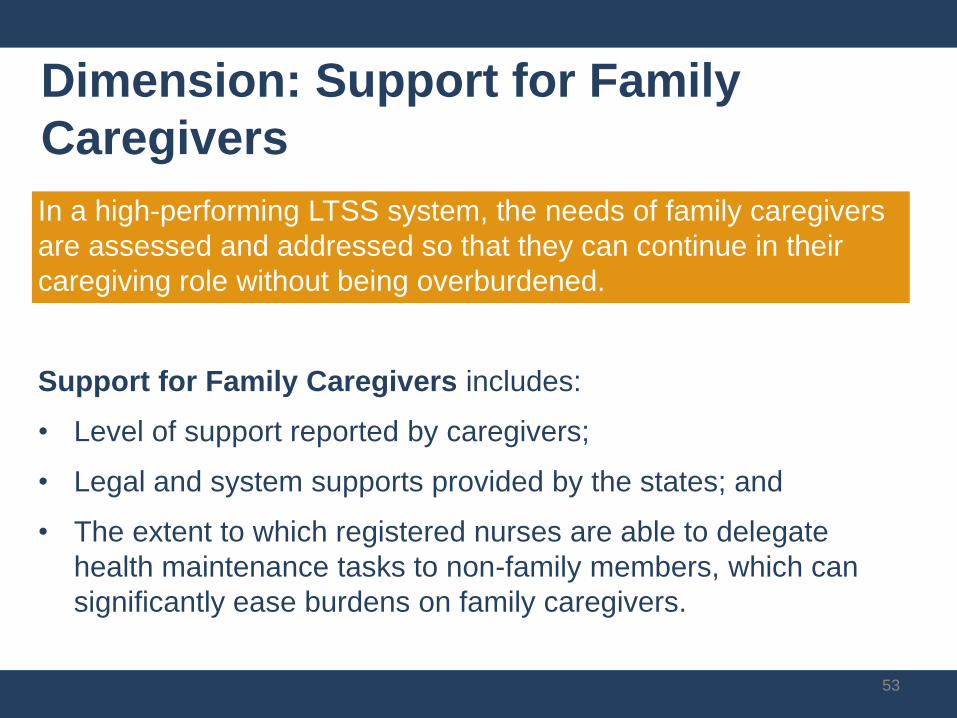
Dimension: Support for Family
Caregivers
In a high-performing LTSS system, the needs of family caregivers
are assessed and addressed so that they can continue in their
caregiving role without being overburdened.
Support for Family Caregivers includes:
• Level of support reported by caregivers;
• Legal and system supports provided by the states; and
• The extent to which registered nurses are able to delegate
health maintenance tasks to non-family members, which can
significantly ease burdens on family caregivers.
53
53

Dimensions & Indicators
• Four dimensions are represented in the Scorecard.
• Each dimension is comprised of 3-9 indicators for a
total of 25 foundational indicators (existing and new).
• Criteria for indicators:
• Important and meaningful, conceptually valid,
easy to interpret with clear directionality; and
• Must be available for all states and updated
regularly.
54

55

56

Two Ways to Use the Scorecard
Printed Report Website
57

www.longtermscorecard.org
• Content:
• Full Report
• Executive Summary
• Chart Pack
• State Fact Sheets
• State-by-State
Interactive
Comparisons
• Podcast
• Methodology
• Archived Webcast
58

Data Challenges
• Data are not always available to measure the
characteristics of a high-performing system.
– Data may be missing entirely
– Available but defined or collected differently across states
– May not have clear directionality or scale
– May require additional resources to analyze
• Strategies to address data gaps.
– Process measures when outcomes not available
– Original data collection
– Combining multiple data sources
– Composite indicators
59

Data Gaps
• Effective Transitions and Organization of Care
• Coordination with Medical Services, Supportive Housing,
and Transportation
• Consumer-Based Measure of Availability of Services
• Performance Metrics for ADRC/SEP/Tools and Programs
• Degree of Consumer Direction
• HCBS Quality Measures
• LTSS Consumer Experience Measures
• Caregiver Respite
60

Innovative Approaches
61
• Safety Net Coverage
– (used) Medicaid coverage for low-income pop. with disabilities
– (used) Medicaid LTSS utilization for low-income PWD
– (not used) Percent of population at risk for needing LTSS
theoretically meeting functional/financial eligibility
• Consumer Direction
– NRCPDS survey of consumer direction programs
• Written form and follow-up phone interview
– (used) percentage of PWD consumer-directing services
– (not used) degree of consumer direction allowed

Innovative Approaches
62
• Composite Indicators
– (used) ADRC/single entry point functionality
– (used) Tools and programs to facilitate consumer choice
– (used) System supports for caregivers
– (not used) Quality monitoring
• Nurse Delegation
– Original data collection with NCSBN
– Data obtained for 46 states
– Identification of 16 critical health maintenance tasks that could
be performed (with training) by direct-care workers

Tools and Programs to Facilitate
Consumer Choice (Composite Indicator)
63
States were scored from 0 (no use of tool or program) to 1
(full use of tool or program) on each of 4 categories:
• Presumptive Eligibility;
• Uniform Assessment;
• Money Follows the Person and other nursing facility
transition programs; and
• Options counseling.

High-Level Findings
• Leading states often do well in multiple dimensions—but
all have far to go to achieve the vision.
• Rankings compare states to each other, not to the ideal.
• No state scored in the top quartile across all 25 indicators.
• Wide variation exists within dimensions and indicators.
• States can target opportunities to improve and look to
other states for paths to higher performance.
• Poverty and high rates of disability present challenges.
• Even with these challenges, the lowest ranking states scored in
the top quartile for at least one indicator.
64

High-Level Findings
• The cost of LTSS is unaffordable for middle-income
families.
• State Medicaid policies dramatically affect consumer
choice and affordability.
• Support for family caregivers goes hand in hand with
other dimensions of high performance.
• Better data are needed to assess state LTSS system
performance.
65

Role of Public Policy
Public policy plays in important role in LTSS
systems by establishing:
• Who is eligible for assistance;
• What services are provided;
• How quality is monitored; and
• The ways in which family caregivers are
supported.
66 66

Examples of Public Policy Actions
67
States can improve their performance by enacting
public policies that:
• Assess and address family caregiver needs;
• Improve Medicaid balancing by adopting key provisions of the
Affordable Care Act;
• Enhance consumer choice through administrative tools and
structures such as streamlined eligibility and system
navigation;
• Reduce reliance on nursing homes by taking advantage of
programs such as Money Follows the Person; and
• Expand nurse delegation of health maintenance tasks.

68

69
How the Affordable
Care Act Can Help
States Move
Toward A High-
Performing System
Of Long-Term
Services and
Supports

Impact of Improved Performance
70

Raising Expectations
Enid Kassner
Director, Independent Living/Long-Term Services and Supports
AARP Public Policy Institute
A State Scorecard on Long-Term Services and Supports for Older Adults,
People with Physical Disabilities, and Family Caregivers

© 2011. National Council on Aging A nonprofit service and advocacy organization
Balancing Incentive Program
A Win-Win for States and Advocates

© 2011. National Council on Aging A nonprofit service and advocacy organization
Eligibility for Balancing Incentive Program
State % HCBS State % HCBS State % HCBSNew Mexico 83.2% Idaho 46.2% South Carolina 38.4%Oregon 72.3% Rhode Island 46.0% Georgia 37.4%Minnesota 67.9% Massachusetts 44.8% Maryland 36.8%Arizona 69.3% Connecticut 44.1% Louisiana 36.4%Vermont 64.9% Utah 43.9% Delaware 35.2%Alaska 62.7% North Carolina 42.9% Florida 34.2%Washington State 62.1% Hawaii 42.7% Michigan 33.0%Colorado 58.1% Virginia 42.5% Pennsylvania 33.0%California 55.2% Tennessee 42.4% Ohio 32.5%Kansas 54.7% Nevada 41.6% Kentucky 31.1%Wisconsin 52.1% Oklahoma 41.5% Indiana 30.6%Wyoming 50.8% New Hampshire 40.7% Arkansas 29.8%Washington DC 50.3% Missouri 40.7% Alabama 29.7%Maine 49.1% South Dakota 40.5% North Dakota 28.9%Montana 47.2% West Virginia 40.0% Illinois 27.8%Texas 46.9% Iowa 39.8% New Jersey 26.0%New York 46.7% Nebraska 38.4% Mississippi 14.4%
Based on Appendix C of CMS Application
Yellow = 2% FMAP Red = 5% FMAP

© 2011. National Council on Aging A nonprofit service and advocacy organization
State
FMAP Increase for
HCBS
Additional FMAP
$ (2011-2015)
New York 2% $815 million
Pennsylvania 2% $179 million
Ohio 2% $144 million
Virginia 2% $70 million
Oklahoma 2% $43 million
Mississippi 5% $36 million
Rough Estimates

© 2009. National Council on Aging A nonprofit service and advocacy organization
To Ask A Question Please Use the Chat Function

© 2011. National Council on Aging A nonprofit service and advocacy organization
Continue the Conversation Online
Join to discuss what you learned today!
www.NCOACrossroads.org/HCBS
New online community!
Join advocates nationwide to protect HCBS
Easily share ideas and resources
Access additional information and materials on block grants
and spending caps.
Access archives of previous webinars on state budgets and
cost-effectiveness of HCBS.

© 2011. National Council on Aging A nonprofit service and advocacy organization
Thank You
You will receive a follow up e-mail next week with links to
the archived recording of the webinar and additional
resources.
Please share with other advocates in your state.
Please complete a short survey to give us feedback and
suggestions for future webinars.