Balanced & Diversified Mutual Funds
12
BALANCED & DIVERSIFIED MUTUAL FUNDS Submitted by: Aparana Mittal FORE School of Management
-
Upload
aparana-mittal -
Category
Economy & Finance
-
view
157 -
download
0
Transcript of Balanced & Diversified Mutual Funds

BALANCED & DIVERSIFIED
MUTUAL FUNDS
Submitted by:
Aparana Mittal
FORE School of
Management
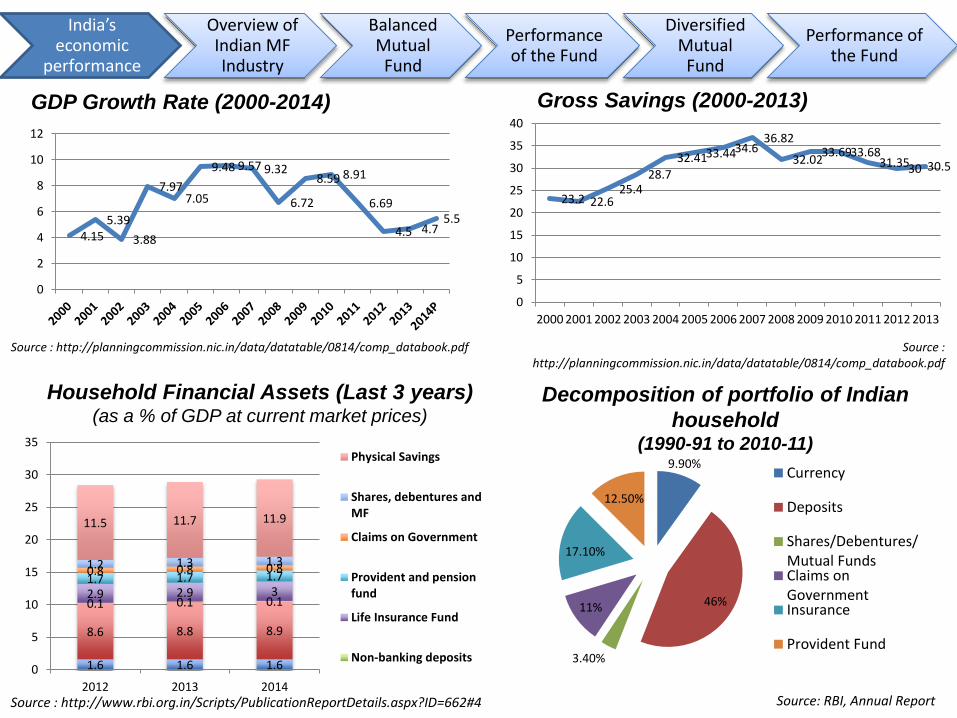
Gross Savings (2000-2013)
Household Financial Assets (Last 3 years)(as a % of GDP at current market prices)
GDP Growth Rate (2000-2014)
India’s economic
performance
Overview of Indian MF Industry
Balanced Mutual
Fund
Performance of the Fund
Diversified Mutual
Fund
Performance of the Fund
4.155.39
3.88
7.977.05
9.48 9.57 9.32
6.72
8.59 8.91
6.69
4.5 4.75.5
0
2
4
6
8
10
12
23.2 22.625.4
28.7
32.4133.4434.636.82
32.0233.6933.68
31.3530 30.5
0
5
10
15
20
25
30
35
40
2000 2001 2002 2003 2004 2005 2006 2007 2008 2009 2010 2011 2012 2013
1.6 1.6 1.6
8.6 8.8 8.9
0.1 0.1 0.12.9 2.9 31.7 1.7 1.70.8 0.8 0.81.2 1.3 1.3
11.5 11.7 11.9
0
5
10
15
20
25
30
35
2012 2013 2014
Physical Savings
Shares, debentures andMF
Claims on Government
Provident and pensionfund
Life Insurance Fund
Non-banking deposits
Source : http://planningcommission.nic.in/data/datatable/0814/comp_databook.pdf Source : http://planningcommission.nic.in/data/datatable/0814/comp_databook.pdf
Source : http://www.rbi.org.in/Scripts/PublicationReportDetails.aspx?ID=662#4
9.90%
46%
3.40%
11%
17.10%
12.50%
Currency
Deposits
Shares/Debentures/Mutual FundsClaims onGovernmentInsurance
Provident Fund
Decomposition of portfolio of Indian
household (1990-91 to 2010-11)
Source: RBI, Annual Report

India’s economic
performance
Overview of Indian MF Industry
Balanced Mutual
Fund
Performance of the Fund
Diversified Mutual
Fund
Performance of the Fund
74867037 6709
9051
10597
0
2000
4000
6000
8000
10000
12000
FY10 FY11 FY12 FY13 Sep-14
I
N
R
B
n
CAGR 4.86%
Growth in the AUM
Source: The Association of Mutual Funds in India (AMFI); Data as of September 2014Note: Figures from FY11 - FY13 corresponds to average AUM for the quarter Jan - Mar (Q4)
Growth in the Market – Sensex &
NIFTY
Source: BSE Sensex and NSE Nifty data as on December 2014
The Indian mutual fund industry has shownrelatively slow growth in the period FY 10-13growing at a CAGR of approximately 4.86%.Average AUM stood at INR 9051 billion in FY13.However, AUM increased to ~ INR 10,597 billion asof September 2014.
Lackluster stock market performance, risinginflation and anticipation of a rise in interestrates has led to a tapering of growth in theIndian mutual fund industry in the recent years.
0
5000
10000
15000
20000
25000
30000
0
2000
4000
6000
8000
10000
CAGR 19.48%
SENSEX
NIFTY
CAGR 17.69%

Penetration (as a % of GDP) vis-à-vis other
countries and world average
7.00%
70%
61%
37%
37%
India
US
France
Brazil
World Average
Despite the relatively low penetration of mutualfunds in India, the market is highly concentrated.Though, there are 46 AMCs operating in the sector,approximately 79 per cent of the AUM isconcentrated with 10 of the leading players in themarket.There have been recent instances of consolidation inthe market and market concentration is expected to
remain in the near-term.
Birla Sun Life Mutual Fund,
10%
DSP BlackRock Mutual Fund, 4%
Franklin Templeton
Mutual Fund, 5%
HDFC Mutual Fund, 13%
ICICI Prudential Mutual Fund,
12%
IDFC Mutual Fund, 4%
Kotak Mahindra Mutual Fund, 4%
Reliance Mutual Fund, 12%
SBI Mutual Fund, 7%
UTI Mutual Fund, 8%
Others, 21%
Market Share of leading Mutual
Funds (basis AUM)
Source : AMFI data (September 2014)
India’s economic
performance
Overview of Indian MF Industry
Balanced Mutual
Fund
Performance of the Fund
Diversified Mutual
Fund
Performance of the Fund

AUM Composition by Product Category
20% 16% 19%
0%1%
1%
49% 57%47%
26%22%
29%
2% 2% 2%3% 2% 2%
0%
10%
20%
30%
40%
50%
60%
70%
80%
90%
100%
2012 2013 2014
Gold ETF
Balanced
Equity Oriented
Debt Oriented
Gilt
AUMs in debt and liquid money market funds have seenan increase in FY14. Reasons being : Anticipation of RBI rate cuts Desire for investors to seek a fixed return
Debt oriented products (investing in debt instrumentswith maturity > 3 months) have gained most traction.
Clear shift in investor interest from equity. Gold ETF’s have grown at an extremely fast pace
(popularity of gold as an investment)
AUM Composition by Investor
Category
47%
2%
1%
28%
22%
Corporates
Banks/FIs
FIIs
High NetworthIndividuals
Retail
Source : AMFI data (September 2014)
Industry composition of AUM is driven primarily bythe corporate segment
Corporate Investment focus on debt/money marketfunds to earn short term returns and liquiditymanagement
Retail share is expected to rise. Growth drivers : Increased investor awareness Product penetration Greater distribution reach
HNIs -> fastest growing investor segment
AUM growth restricted to top 5 cities of India (Mumbai, Delhi, Bangalore, Chennai and Kolkata) – 74% of AUM
India’s economic
performance
Overview of Indian MF Industry
Balanced Mutual
Fund
Performance of the Fund
Diversified Mutual
Fund
Performance of the Fund
Source : AMFI data (September 2014)

Key challenges
Limited incentives for distributors for MFproducts as compared to other financialproducts
Lack of product differentiation and abilityto communicate value to investors
Low MF penetration and relatively loweraddition of retail investors
Lack of investor awareness about MFindustry
Evolving nature of industry regulations
How to combat ?
Wider distribution reach Improve overall investor awareness Investor education drives
What lies ahead ?
Investorso Penetration and awareness
(through on-ground investorengagement campaigns by AMFI,AMCs and distributors) in Tier II,Tier III (B-15 cities) and ruralmarkets is expected to increase
Productso Traditional debt and equity
oriented products could continueto dominate the market.
Channelso Structural shift from “transaction-
led” pricing model to an “advisory-led” pricing model has beeninitiated by the regulator
Competitiono Wave of consolidationo Retain and strengthen asset base
India’s economic
performance
Overview of Indian MF Industry
Balanced Mutual
Fund
Performance of the Fund
Diversified Mutual
Fund
Performance of the Fund

Balanced Mutual Fund
Investment Objective
To generate long-term capital appreciationand current income by creating a portfolioinvested in equity-equity related securitiesas well as fixed income and money marketsecurities.
Suitable for investors seeking :
• Capital growth and income over a long-terminvestment horizon
• Investment primarily in equity/equity-relatedsecurities, with balance exposure in moneymarket and debt securities
• High Risk
Rank 1 Rank 2 Rank 3 Rank 4 Rank 5
• ICICIPrudentialBalancedFund
• HDFC BalancedFund
• HDFC PrudenceFund
• Tata BalancedFund
• Birla Sun Life 95 Fund• Canara Robeco Balance• ICICI Prudential Balanced
Advantage Fund• Reliance Regular Savings
Fund – Balanced• SBI Magnum Balanced
Fund
• DSP BlackRockBalanced Fund
• Franklin IndiaBalanced Fund
• UTI Balanced Fund
Kotak Balance
Top 5 Balanced Funds – Consistent
Performers (as per CRISIL, Sep-14)
India’s economic
performance
Overview of Indian MF Industry
Balanced Mutual
Fund
Performance of the Fund
Diversified Mutual
Fund
Performance of the Fund
Source : http://www.crisil.com/capital-markets/crisil-mf-ranking-list.html
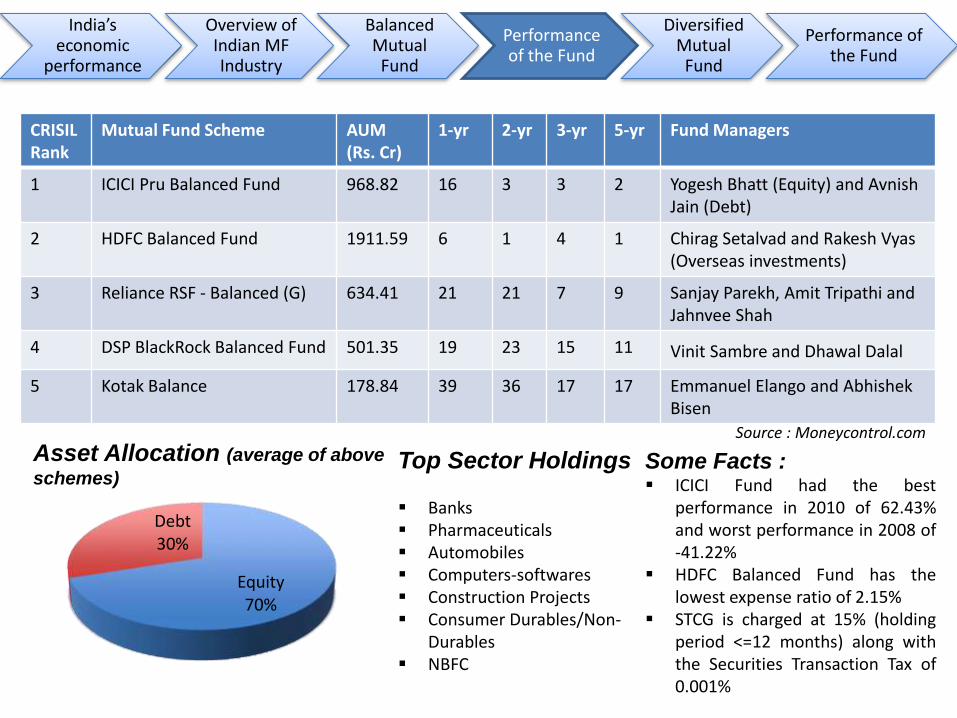
CRISIL Rank
Mutual Fund Scheme AUM (Rs. Cr)
1-yr 2-yr 3-yr 5-yr Fund Managers
1 ICICI Pru Balanced Fund 968.82 16 3 3 2 Yogesh Bhatt (Equity) and AvnishJain (Debt)
2 HDFC Balanced Fund 1911.59 6 1 4 1 Chirag Setalvad and Rakesh Vyas(Overseas investments)
3 Reliance RSF - Balanced (G) 634.41 21 21 7 9 Sanjay Parekh, Amit Tripathi andJahnvee Shah
4 DSP BlackRock Balanced Fund 501.35 19 23 15 11 Vinit Sambre and Dhawal Dalal
5 Kotak Balance 178.84 39 36 17 17 Emmanuel Elango and AbhishekBisen
Source : Moneycontrol.com
Asset Allocation (average of above
schemes)
Equity70%
Debt30%
Top Sector Holdings
Banks Pharmaceuticals Automobiles Computers-softwares Construction Projects Consumer Durables/Non-
Durables NBFC
Some Facts : ICICI Fund had the best
performance in 2010 of 62.43%and worst performance in 2008 of-41.22%
HDFC Balanced Fund has thelowest expense ratio of 2.15%
STCG is charged at 15% (holdingperiod <=12 months) along withthe Securities Transaction Tax of0.001%
India’s economic
performance
Overview of Indian MF Industry
Balanced Mutual
Fund
Performance of the Fund
Diversified Mutual
Fund
Performance of the Fund

India’s economic
performance
Overview of Indian MF Industry
Balanced Mutual
Fund
Performance of the Fund
Diversified Mutual
Fund
Performance of the Fund
Diversified Mutual FundInvestment Objective
To generate long term capital appreciation andsecondary objective being income generation anddistribution of dividend from a portfolioconstituted of equity and equity related securities
Suitable for investors seeking :
• Long-term capital growth• Investment in equity and equity-related
securities to form a diversified portfolio• High Risk
Top 5 Diversified Funds – Consistent Performers (as per CRISIL, Sep-14)
Rank 1 Rank 2 Rank 3 Rank 4 Rank 5
Franklin India High Growth Companies FundICICI Prudential Exports and Other Services FundPrincipal Growth FundTata Ethical FundUTI MNC Fund
Birla Sun Life EquityFundBirla Sun Life LongTerm Advantage FundFranklin India Prima PlusHSBC India Opportunities FundKotak Classic Equity FundKotak Select Focus FundTata Equity PE Fund
Birla Sun Life Advantage FundBirla Sun Life India GenNextFundBirla Sun Life Special Situations FundDSP BlackRock Opportunities FundDWS Investment Opportunity FundFranklin India Flexi Cap FundHDFC Capital Builder FundHDFC Equity Fund
Birla Sun Life DividendYield PlusDSP BlackRock Equity FundDSP BlackRock Focus 25 FundHDFC Core and Satellite FundHDFC Premier MultiCapFundIDFC Classic Equity FundReliance Vision FundSBI Contra Fund
HDFC Growth FundHDFC Large Cap FundReligareInvesco PSU Equity FundSBI PSU FundSundaramSelect Thematic Funds PSU Opportunities
Source : http://www.crisil.com/capital-markets/crisil-mf-ranking-list.html

India’s economic
performance
Overview of Indian MF Industry
Balanced Mutual
Fund
Performance of the Fund
Diversified Mutual
Fund
Performance of the Fund
CRISIL Rank
Mutual Fund Scheme AUM (Rs. Cr)
1-yr 2-yr 3-yr 5-yr Fund Managers
1 Franklin India High Growth Companies Fund
799.94 75.8 39 39.3 18.9 Neeraj Gaurh and Roshi Jain
2 Tata Equity P/E Fund 475.63 66.7 30.5 28.9 14.4 Atul Bhole
3 Reliance RSF – Equity (G) 2462.69 54.3 21.5 28.1 12.5 Om Prakash Kuckian and JahnveeShah
4 DSP-BR Equity Fund 1898.07 50.3 22.8 24.8 12.9 Apoorva Shah
5 HDFC Growth Fund 1140.48 41.4 18.2 20.1 12.3 Srinivas Rao Ravuri and RakeshVyas (Overseas Investments)
Equity96%
Debt4%
Asset Allocation (average of
above schemes)
Top Sector Holdings
Banks Automobiles Technology Healthcare Chemicals Diversified Energy Services Textiles Communication
Some Facts :• Franklin MF had the best
performance in 2010 of 154.27%and worst performance in 2009 of -61.91%
• Reliance RSF – Equity and DSP-BREquity Fund have the lowestexpense ratio of 2.3%
• STCG is charged at 15% (holdingperiod <=12 months) along withthe Securities Transaction Tax of0.001%
Source : Moneycontrol.com

Why invest in a Mutual Fund?
Diversification
• Diversification across sectors, stocks and asset classes (debt, equity, gold etc.)
• Reduced risk, higher return potential
Beat Inflation
• Generate inflation adjusted returns (when compared to bank deposits)
Tax efficient instruments
• Mutual fund investment in all asset class for a period of more than one year is considered as long term for the tax purpose.
Convenience and Economical
• Low investment amount (begins from Rs. 500)
• Ability to buy or sell on any business day
• Choice based on individual’s goal and investment needs
Expert Managers
• Dedicated research team
• Experienced fund manager
Liquidity
• Open-ended : Investors have the advantage of getting their money back promptly based on the NAV
• Close-ended : Can be traded on stock exchange
Safety and Transparency
• Regular information about current value of investment
• Well-regulated market by SEBI gives investors an assurance that their investment is in safe hands

What will
be the role
of an
Investment
Advisor?
Discover investor’s personal financial
objectives
Provide education and guidance to investors
Assess an investor’s
entire financial situation
Monitors the portfolio and recommends adjustments
Design a customized investment
plan
Screens industry best service provider to complement investor’s goals
Works with the
providers to
implement investment
plan
Monitors and tracks the providers
Source : http://www.bw-adv.com/Articles/Role-of-Investment-Advisor.pdf