BALANCE SHEET CONSOLIDATED AS AT MARCH · PDF fileShare application money pending allotment 8...
75
IDFC ANNUAL REPORT 2011–12 56 IN TERMS OF OUR REPORT ATTACHED. FOR DELOITTE HASKINS & SELLS FOR AND ON BEHALF OF THE BOARD OF DIRECTORS OF Chartered Accountants INFRASTRUCTURE DEVELOPMENT FINANCE COMPANY LIMITED P. R. RAMESH DEEPAK S. PAREKH RAJIV B. LALL Partner Chairman Managing Director & CEO SUNIL KAKAR MAHENDRA N. SHAH Mumbai | May 8, 2012 Chief Financial Officer Company Secretary (` in crore) NOTES AS AT MARCH 31, 2012 AS AT MARCH 31, 2012 AS AT MARCH 31, 2011 EQUITY AND LIABILITIES Shareholders’ funds (a) Share capital 6 1,512.36 2,300.95 (b) Reserves and surplus 7 10,772.68 8,943.35 12,285.04 11,244.30 Share application money pending allotment 8 0.60 4.14 Minority interest 17.78 0.17 Non-current liabilities (a) Long-term borrowings 9 29,837.20 26,786.08 (b) Other long-term liabilities 10 141.62 53.86 (c) Deferred tax liabilities (net) 17 2.18 1.53 (d) Long-term provisions 11 128.93 100.26 30,109.93 26,941.73 Current liabilities (a) Short-term borrowings 12 7,351.01 1,686.99 (b) Trade payables 38 223.16 283.43 (c) Other current liabilities 13 10,548.21 8,784.21 (d) Short-term provisions 14 443.41 402.20 18,565.79 11,156.83 TOTAL 60,979.14 49,347.17 ASSETS Non-current assets (a) Fixed assets (i) Tangible assets 15(a) 374.57 403.55 (ii) Intangible assets 15(b) 5.26 8.97 (iii) Capital work-in-progress 36.65 34.24 (iv) Intangible assets under development - 0.13 416.48 446.89 (b) Goodwill on consolidation 966.75 1,163.80 (c) Non-current investments 16 2,433.11 2,631.29 (d) Deferred tax assets (net) 17 320.22 249.56 (e) Long-term loans and advances (i) Loans 18 42,083.86 33,042.78 (ii) Others 19 472.39 922.56 42,556.25 33,965.34 (f) Other non-current assets 20 368.14 950.94 47,060.95 39,407.82 Current assets (a) Current investments 21 5,100.75 4,329.85 (b) Trade receivables 22 383.48 57.56 (c) Cash and bank balances 23 698.11 562.24 (d) Short-term loans and advances (i) Loans 18 6,100.72 4,604.84 (ii) Others 19 1,024.38 75.39 7,125.10 4,680.23 (e) Other current assets 20 610.75 309.47 13,918.19 9,939.35 TOTAL 60,979.14 49,347.17 See accompanying notes forming part of the consolidated financial statements. BALANCE SHEET CONSOLIDATED AS AT MARCH 31,2012
Transcript of BALANCE SHEET CONSOLIDATED AS AT MARCH · PDF fileShare application money pending allotment 8...

I D F C A N N U A L R E P O R T 2 0 1 1 – 1 256
IN TERMS OF OUR REPORT ATTACHED.
FOR DELOITTE HASKINS & SELLS FOR AND ON BEHALF OF THE BOARD OF DIRECTORS OF
Chartered Accountants INFRASTRUCTURE DEVELOPMENT FINANCE COMPANY LIMITED
P. R. RAMESH DEEPAK S. PAREKH RAJIV B. LALL
Partner Chairman Managing Director & CEO
SUNIL KAKAR MAHENDR A N. SH AH
Mumbai | May 8, 2012 Chief Financial Officer Company Secretary
(` in crore)
NOTES AS AT MARCH 31, 2012 AS AT MARCH 31, 2012 AS AT MARCH 31, 2011 E Q U I TY A N D L I A B I L I T I E SShareholders’ funds
(a) Share capital 6 1,512.36 2,300.95
(b) Reserves and surplus 7 10,772.68 8,943.35
12,285.04 11,244.30
Share application money pending allotment 8 0.60 4.14
Minority interest 17.78 0.17
Non-current liabilities
(a) Long-term borrowings 9 29,837.20 26,786.08
(b) Other long-term liabilities 10 141.62 53.86
(c) Deferred tax liabilities (net) 17 2.18 1.53
(d) Long-term provisions 11 128.93 100.26
30,109.93 26,941.73
Current liabilities
(a) Short-term borrowings 12 7,351.01 1,686.99
(b) Trade payables 38 223.16 283.43
(c) Other current liabilities 13 10,548.21 8,784.21
(d) Short-term provisions 14 443.41 402.20
18,565.79 11,156.83
TOTAL 60,979.14 49,347.17 A S S E T SNon-current assets
(a) Fixed assets
(i) Tangible assets 15(a) 374.57 403.55
(ii) Intangible assets 15(b) 5.26 8.97
(iii) Capital work-in-progress 36.65 34.24
(iv) Intangible assets under development - 0.13
416.48 446.89
(b) Goodwill on consolidation 966.75 1,163.80
(c) Non-current investments 16 2,433.11 2,631.29
(d) Deferred tax assets (net) 17 320.22 249.56
(e) Long-term loans and advances
(i) Loans 18 42,083.86 33,042.78
(ii) Others 19 472.39 922.56
42,556.25 33,965.34
(f) Other non-current assets 20 368.14 950.94
47,060.95 39,407.82
Current assets
(a) Current investments 21 5,100.75 4,329.85
(b) Trade receivables 22 383.48 57.56
(c) Cash and bank balances 23 698.11 562.24
(d) Short-term loans and advances
(i) Loans 18 6,100.72 4,604.84
(ii) Others 19 1,024.38 75.39
7,125.10 4,680.23
(e) Other current assets 20 610.75 309.47
13,918.19 9,939.35
TOTAL 60,979.14 49,347.17 See accompanying notes forming part of the consolidated financial statements.
B A L A N C E S H E E T CONSOLIDATED AS AT MARCH 31,2012

57C O N S O L I D A T E D A C C O U N T S
IN TERMS OF OUR REPORT ATTACHED.
FOR DELOITTE HASKINS & SELLS FOR AND ON BEHALF OF THE BOARD OF DIRECTORS OF
Chartered Accountants INFRASTRUCTURE DEVELOPMENT FINANCE COMPANY LIMITED
P. R. RAMESH DEEPAK S. PAREKH RAJIV B. LALL
Partner Chairman Managing Director & CEO
SUNIL KAKAR MAHENDR A N. SH AH
Mumbai | May 8, 2012 Chief Financial Officer Company Secretary
(` in crore)
NOTES FOR THE YEAR ENDED MARCH 31, 2012
FOR THE YEAR ENDED MARCH 31, 2011
I I N C O M E
Revenue from operations 24 6,336.45 4,915.98
Other income 25 98.55 17.05
TOTAL INCOME (I) 6,435.00 4,933.03
I I E X P E N S E S
Employee benefits expense 26 304.71 295.93
Finance costs 27 3,456.16 2,387.53
Provisions and contingencies 28 284.58 234.61
Other expenses 29 178.44 195.95
Depreciation and amortisation expense 15 (a) & (b) 38.44 40.17
TOTAL EXPENSES (II) 4,262.33 3,154.19
I I I P R O F I T B E F O R E T A X ( I - I I ) 2,172.67 1,778.84
I V T A X E X P E N S E
Current tax 692.38 572.42
Current tax expense relating to prior years (0.21) -
Deferred tax 17 (70.00) (72.67)
Minimum alternate tax credit (0.31) -
TOTAL TAX EXPENSE (IV) 621.86 499.75
V P R O F I T A FT E R T A X (before share of profit from associates and adjustment for minority interest) (III-IV)
1,550.81 1,279.09
V I S H A R E O F N E T P R O F I T F R O M A S S O C I AT E S 1.87 2.23
V I I S H A R E O F L O S S O F M I N O R I TY I N T E R E ST 1.33 0.34
VIII P R O F I T F O R T H E Y E A R ( V + V I + V I I ) 1,554.01 1,281.66
I X E A R N I N G S P E R E Q U I TY S H A R E (nominal value of share ̀ 10 each) 34
Basic (`) 10.24 8.77
Diluted (`) 10.20 8.71
See accompanying notes forming part of the consolidated financial statements.
S TAT E M E N T O F P R O F I T A N D L O S S CONSOLIDATED FOR THE YEAR ENDED MARCH 31, 2012

I D F C A N N U A L R E P O R T 2 0 1 1 – 1 258
(` in crore)
NOTES FOR THE YEAR ENDED MARCH 31, 2012
FOR THE YEAR ENDED MARCH 31, 2012
FOR THE YEAR ENDED MARCH 31, 2011
A . C A S H F L OW F R O M O P E R AT I N G A CT I V I T I E S
Profit before tax 2,172.67 1,778.84
ADJUSTMENTS FOR:
Depreciation and amortisation expense 15(a) & (b) 38.44 40.17
Provision for employee benefits 1.49 (1.91)
Expense under the ESOS 26 4.31 16.75
Provisions and contingencies 28 284.58 234.61
(Gain) / loss on foreign currency revaluation 31.82 (7.42)
Profit on sale of investments in group companies
25 (83.82) (0.76)
Profit on sale of other investments (net) 24 (412.35) (254.78)
Utilisation of securities premium account (gross of tax)
(132.19) (243.44)
Amortisation of premium on investments 3.32 3.01
Foreign currency translation reserve 7.22 (1.27)
Profit on sale of fixed assets (net) 25 (4.30) (6.88)
(261.48) (221.92)
OPERATING PROFIT BEFORE WORKING CAPITAL CHANGES 1,911.19 1,556.92
CHANGES IN WORKING CAPITAL:
Adjustments for increase in operating assets (181.51) (320.93)
Adjustments for increase in operating liabilities
354.64 243.22
173.13 (77.71)
Direct taxes paid (660.64) (481.51)
CASH GENERATED FROM OPERATIONS 1,423.68 997.70
Loans disbursed (net of repayments) (10,679.47) (12,669.28)
NET CASH USED IN OPERATING ACTIVITIES (9,255.79) (11,671.58)
B . C A S H F L OW F R O M I N V E ST I N G A CT I V I T I E S
Purchase of fixed assets (including capital work-in-progress and
intangible assets under development)
(9.04) (52.46)
Sale of fixed assets 5.30 13.78
Bank deposits matured / (placed) (net) 208.91 (726.00)
Investments in associates (101.29) -
Investment in a subsidiary (8.00) (0.05)
Purchase of other investments (180,266.63) (187,441.32)
Sale proceeds of other investments 179,815.49 186,893.88
Sale proceeds of investments in subsidiaries and jointly controlled entities
297.79 45.45
Goodwill on acquisitions - (4.17)
Capital reserve due to change in shareholding in group companies
ß ß
Opening adjustment 0.33 0.03
NET CASH USED IN INVESTING ACTIVITIES (57.14) (1,270.86)
C A S H F L O W S TAT E M E N T CONSOLIDATED FOR THE YEAR ENDED MARCH 31, 2012

59C O N S O L I D A T E D A C C O U N T S
IN TERMS OF OUR REPORT ATTACHED.
FOR DELOITTE HASKINS & SELLS FOR AND ON BEHALF OF THE BOARD OF DIRECTORS OF
Chartered Accountants INFRASTRUCTURE DEVELOPMENT FINANCE COMPANY LIMITED
P. R. RAMESH DEEPAK S. PAREKH RAJIV B. LALL
Partner Chairman Managing Director & CEO
SUNIL KAKAR MAHENDR A N. SH AH
Mumbai | May 8, 2012 Chief Financial Officer Company Secretary
(` in crore)
NOTES FOR THE YEAR ENDED MARCH 31, 2012
FOR THE YEAR ENDED MARCH 31, 2012
FOR THE YEAR ENDED MARCH 31, 2011
C . C A S H F L OW F R O M F I N A N C I N G A CT I V I T I E S
Proceeds from fresh issue of shares (net of issue expenses)
15.63 3,505.24
Securities premium on issue of shares by a subsidiary company
2.25 -
Proceeds from borrowings (net of repayments) 9,494.41 9,779.10
Dividend paid (including dividend distribution tax) (422.20) (225.08)
Increase / (decrease) in minority interest 17.68 (5.81)
NET CASH FROM FINANCING ACTIVITIES 9,107.77 13,053.45
Net increase / (decrease) in cash and cash equivalents (A+B+C)
(205.16) 111.01
Cash and cash equivalents as at the beginning of the year
23 309.28 198.27
Cash and cash equivalents as at the end of the year 23 104.12 309.28
(205.16) 111.01
See accompanying notes forming part of the consolidated financial statements.
C A S H F L O W S TAT E M E N T CONSOLIDATED FOR THE YEAR ENDED MARCH 31, 2012

I D F C A N N U A L R E P O R T 2 0 1 1 – 1 260
1 G R O U P I N F O R M AT I O N
Infrastructure Development Finance Company Limited (‘the Holding Company’) is a public company, incorporated in India and regulated by the Reserve Bank of India (RBI) as an Infrastructure Finance Company-Non Banking Finance Company (IFC-NBFC). The Holding Company and its twenty four subsidiary companies, three entities over which the Holding Company has direct or indirect significant influence and three jointly controlled entities constitute the Group. The Group also has three associate companies. The Group is engaged in financing by way of loans, asset management and investment banking.
2 B A S I S O F P R E PA R AT I O N
The consolidated financial statements of the Group have been prepared in accordance with the Generally Accepted Accounting Principles in India (Indian GAAP). The Holding Company has prepared these financial statements to comply in all material respects with the Accounting Standards notified under the Companies (Accounting Standards) Rules, 2006, (as amended), the relevant provisions of the Companies Act, 1956 and the applicable guidelines issued by the RBI. The financial statements have been prepared on the accrual basis under the historical cost convention. The accounting policies adopted in the preparation of the financial statements are consistent with those followed in the previous year.
3 B A S I S O F C O N S O L I D AT I O N
(a) The Consolidated Financial Statements comprise the individual financial statements of the Holding Company, its subsidiaries as on March 31, 2012 and for the year ended on that date. The consolidated financial statements have been prepared on the following basis:
i. The financial statements of the Holding Company and its subsidiaries have been consolidated on a line by line basis by adding together the book values of like items of assets, liabilities, income and expenses, after eliminating intra-group balances and intra-group transactions resulting in unrealised profits or losses as per Accounting Standard 21 on ‘Consolidated Financial Statements’ as notified under the Companies (Accounting Standards) Rules, 2006.
ii. Investments in associates by the Holding Company and its subsidiaries are accounted under the equity method and its share of pre-acquisition profits / losses is reflected as capital reserve / goodwill in the carrying value of investments in accordance with Accounting Standard 23 on ‘Accounting for Investments in Associates in Consolidated Financial Statements’ as notified under the Companies (Accounting Standards) Rules, 2006.
iii. The financial statements of the subsidiaries and the associates used in the consolidation are drawn up to the same Balance Sheet date as that of the Holding Company, i.e. March 31, 2012.
iv. The excess of the cost to the Holding Company of its investment in the subsidiaries and the associates over the Holding Company’s portion of equity is recognised in the financial statements as goodwill and is tested for impairment on an annual basis.
v. The excess of the Holding Company’s portion of equity of the subsidiaries and the associates on the acquisition date over its cost of investment is treated as capital reserve.
vi. Minority interest in the net assets of the subsidiaries consists of the amount of equity attributable to minorities at the date on which investment in a subsidiary is made. Net profit / loss for the year of the subsidiaries attributable to minorities is identified and adjusted against the profit after tax of the Group.
vii. In case of foreign subsidiaries, being non-integral operations, revenue items are consolidated at the average rate prevailing during the year. All assets and liabilities are converted at the rates prevailing at the end of the year. Any exchange difference arising on consolidation is recognised in the foreign currency translation reserve.
(b) The financial statements of the following subsidiaries have been consolidated as per Accounting Standard 21 on 'Consolidated Financial Statements' as notified under the Companies (Accounting Standard) Rules, 2006:
MARCH 31, 2012 MARCH 31, 2011
NAME OF SUBSIDIARY PROPORTION OF OWNERSHIP INTEREST (%)
PROPORTION OF OWNERSHIP INTEREST (%)
Dheeru Powergen Limited (Subsidiary of IDFC Projects Limited)
51.00 51.00
Emerging Markets Private Equity Fund, L.P. (Subsidiary of IDFC Fund of Funds Limited up to January 26, 2012 ) [see note 4(a)]
- 100.00
IDFC Asset Management Company Limited (75% with effect from December 7, 2011) [see note 4(b)]
75.00 100.00
IDFC AMC Trustee Company Limited (75% with effect from December 7, 2011) [see note 4(b)]
75.00 100.00
IDFC Capital Limited (Subsidiary of IDFC Securities Limited)
100.00 100.00
N O T E S T O F I N A N C I A L S TAT E M E N T S CONSOLIDATED FOR THE YEAR ENDED MARCH 31, 2012

61C O N S O L I D A T E D A C C O U N T S
MARCH 31, 2012 MARCH 31, 2011
NAME OF SUBSIDIARY PROPORTION OF OWNERSHIP INTEREST (%)
PROPORTION OF OWNERSHIP INTEREST (%)
IDFC Capital (Singapore) Pte. Ltd. (Subsidiary of IDFC Capital Limited) [see note 4(a)]
100.00 100.00
IDFC Capital (USA) Inc. (Subsidiary of IDFC Securities Limited)
100.00 100.00
IDFC Distribution Company Limited (Subsidiary of IDFC Securities Limited)
100.00 100.00
IDFC Finance Limited 100.00 100.00
IDFC Fund of Funds Limited (Subsidiary of IDFC Capital Limited)
100.00 100.00
IDFC General Partners Limited (Subsidiary of IDFC Capital Limited) [see note 4(a)]
100.00 100.00
IDFC Investment Advisors Limited (Subsidiary of IDFC Asset Management Company Limited) (75% with effect from December 7, 2011) [see note 4(b)]
75.00 100.00
IDFC Investment Managers (Mauritius) Limited (Subsidiary of IDFC Asset Management Company Limited) (75% with effect from December 7, 2011) [see note 4(b)]
75.00 100.00
IDFC Pension Fund Management Company Limited (Subsidiary of IDFC Asset Management Company Limited) (87.50% with effect from December 7, 2011) [see note 4(b)]
87.50 100.00
IDFC Project Equity Company Limited 100.00 100.00
IDFC Projects Limited 100.00 100.00
IDFC PPP Trusteeship Company Limited (up to March 22, 2012) [see note 4(c)]
- 100.00
IDFC Primary Dealership Company Limited (with effect from March 17, 2012) [see note 4(d)]
100.00 -
IDFC Private Equity Company Limited 100.00 100.00
IDFC Securities Limited 100.00 100.00
IDFC Trustee Company Limited 100.00 100.00
Jetpur Somnath Highway Limited (Subsidiary of IDFC Projects Limited up to August 10, 2011) [see note 4(e)]
- 100.00
Jetpur Somnath Tollways Limited (with effect from January 11, 2011 up to August 11, 2011) [see note 4(f)]
- 100.00
Uniquest Infra Ventures Private Limited (with effect from February 3, 2011 up to June 3, 2011) [see note 4(g)]
- 100.00
All the subsidiaries are incorporated in India, except:
IDFC Capital (Singapore) Pte. Ltd., a Company incorporated in Singapore.
IDFC General Partners Limited, a Company incorporated in Guernsey.
IDFC Fund of Funds Limited, a Company incorporated in Guernsey.
Emerging Markets Private Equity Fund L.P., a Limited Partnership registered in Guernsey.
IDFC Investment Managers (Mauritius) Limited, a Company incorporated in Mauritius.
IDFC Capital (USA) Inc., a Company incorporated in USA.
(c) The Holding Company has made an investment in IDFC Foundation, a Section 25 Company under Companies Act, 1956, wherein the profits will be applied for promoting its objects. Accordingly, the consolidated accounts of IDFC Foundation are not consolidated in these financial statements, since the Holding Company will not derive any economic benefits from its investments in IDFC Foundation.
N O T E S T O F I N A N C I A L S TAT E M E N T S CONSOLIDATED FOR THE YEAR ENDED MARCH 31, 2012

I D F C A N N U A L R E P O R T 2 0 1 1 – 1 262
(d) The Holding Company and its subsidiary company has investment in three associates, of which two are accounted for on the Equity Method in accordance with Accounting Standard 23 on ‘Accounting for Investments in Associates in Consolidated Financial Statements’ as notified under the Companies (Accounting Standards) Rules, 2006:
MARCH 31, 2012 MARCH 31, 2011
NAME OF ASSOCIATE PROPORTION OF OWNERSHIP INTEREST (%)
PROPORTION OF OWNERSHIP INTEREST (%)
Jetpur Somnath Tollways Limited (Associate of IDFC Projects Limited) (with effect from August 12, 2011) [see note 4(f)]
26.00 -
Feedback Infrastructure Services Private Limited 24.61 24.61
Galaxy Mercantiles Limited (with effect from December 2, 2011) [see note 4(h)]
43.44 -
4 D U R I N G T H E Y E A R
(a) IDFC Capital (Singapore) Pte. Ltd. has assigned its rights as a manager of Emerging Markets Private Equity Fund, L.P. with effect from January 26, 2012. Consequently, Emerging Markets Private Equity Fund, L.P. has ceased to be an entity over which control is exercised by the Holding Company. Further, IDFC General Partners Limited has also assigned its rights and discontinued managing the Emerging Market Private Equity Fund, L.P. in its capacity as general partner of the fund and is under liquidation.
(b) The Holding Company has sold 25% stake in IDFC Asset Management Company Limited and IDFC AMC Trustee Company Limited to Natixis Global Asset Management. Consequent to sale, the proportion of ownership interest in IDFC Asset Management Company Limited and IDFC AMC Trustee Company Limited has reduced from 100% to 75% and the proportion of effective ownership in IDFC Investment Advisors Limited, IDFC Investment Managers (Mauritius) Limited is reduced from 100% to 75%. Further, the proportion of effective ownership in IDFC Pension Fund Management Company Limited is reduced from 100% to 87.50%.
(c) The Holding Company has sold 50,000 shares of IDFC PPP Trusteeship Company Limited to IDFC Foundation on March 22, 2012.
(d) IDFC Primary Dealership Company Limited was incorporated as a wholly owned subsidiary.
(e) Jetpur Somnath Highway Limited, a subsidiary was wound up on August 10, 2011 pursuant to approvals from the Registrar of Companies.
(f) Jetpur Somnath Tollways Limited has ceased to be a subsidiary with effect from August 11, 2011 on account of fresh capital infusion by new investors. Consequently, the ownership interest has reduced from 100% to 26%.
(g) Uniquest Infra Ventures Private Limited has ceased to be a subsidiary with effect from June 3, 2011 on account of fresh capital infusion by new investor.
(h) The Holding Company has acquired 43.44% of equity shares in Galaxy Mercantiles Limited. However, the same has not been consolidated as an associate since the shares are held exclusively with a view to dispose of in the near future.
5 S I G N I F I C A N T A C C O U N T I N G P O L I C I E S
a . C A S H A N D C A S H E Q U I VA L E N T S
Cash and cash equivalents for the purpose of the Cash Flow Statement comprises cash on hand, cash in bank, fixed deposits and other short-term highly liquid investments with an original maturity of three months or less, that are readily convertible into known amount of cash and which are subject to an insignificant risk of change in value.
b . C A S H F L OW ST AT E M E N T
Cash flows are reported using the indirect method whereby cash flows from operating, investing and financing activities of the Group are segregated and profit before tax is adjusted for the effects of transactions of non-cash nature and any deferrals or accruals of past or future cash receipts or payments.
c . I N V E ST M E N T S
NBFC
Investments which are readily realisable and intended to be held for not more than one year from the date on which such investments are made are classified as current investments in accordance with the RBI guidelines and Accounting Standard 13 on ‘Accounting for Investments’ as notified under the Companies (Accounting Standards) Rules, 2006. Current investments also include current maturities of long-term investments. All other investments are classified as long-term investments.
N O T E S T O F I N A N C I A L S TAT E M E N T S CONSOLIDATED FOR THE YEAR ENDED MARCH 31, 2012

63C O N S O L I D A T E D A C C O U N T S
All investments are initially recorded at cost. The cost of an investment includes purchase price, directly attributable acquisition charges and reduced by recovery of costs, if any. On disposal of an investment, the difference between its carrying amount and the net disposal proceeds is charged or credited to the Statement of Profit and Loss.
Current investments are individually carried at the lower of cost and fair value / market value. Commercial papers, certificate of deposits and treasury bills are valued at carrying cost. Long-term investments are carried at acquisition cost. A provision is made for diminution other than temporary on an individual basis against long-term investment. Premium paid over the face value of long-term investment is amortised over the life of the investment.
Inter-class transfer of investments from one category to the other, if any, is done in accordance with the RBI guidelines at lower of book value and fair value / market value on the date of transfer.
Other than NBFC
Long-term Investments are valued at cost except where there is a diminution in value other than temporary in which case the carrying value is reduced to recognise the decline. Current Investments are valued at lower of cost and market value.
d . L O A N S
In accordance with the RBI guidelines, all loans are classified under any of four categories i.e. (i) standard assets (ii) sub-standard assets (iii) doubtful assets and (iv) loss assets.
e . T A N G I B L E F I X E D A S S E T S
Fixed assets are stated at cost of acquisition, including any cost attributable for bringing the asset to its working condition, less accumulated depreciation. Profit or loss arising from derecognition of fixed assets are measured as difference between the net disposal proceeds and the cost of the assets less accumulated depreciation up to the date of disposal and are recognised in the Statement of Profit and Loss.
f . D E P R E C I AT I O N O N T A N G I B L E F I X E D A S S E T S
Depreciation on tangible fixed assets, excluding certain electronic items and leasehold improvements, is provided on the written down value method, at the rates prescribed in Schedule XIV to the Companies Act, 1956. Certain electronic items are depreciated over a period of two years on a straight-line method based on the Management’s estimate of the useful life of these assets. Depreciation on additions during the year is provided on a pro-rata basis. Assets costing less than ` 5,000 each are fully depreciated in the year of capitalisation. Depreciation in respect of leasehold improvements is provided on a straight-line method over the primary period of the lease, except in case of a subsidiary where leasehold improvements are amortised on a straight-line method over period of extended lease or five years whichever is shorter.
g . I N T A N G I B L E A S S E T S A N D A M O R T I S AT I O N
Intangible assets comprising of computer software are stated at cost of acquisition, including any cost attributable for bringing the asset to its working condition, less accumulated amortisation. Any technology support cost or annual maintenance cost for such software is charged annually to the Statement of Profit and Loss. Intangible assets are being amortised over a period of three years on a straight-line method. Tenancy rights are amortised over a period of ten years on a straight-line method. Website development cost is charged to Statement of Profit and Loss in the year in which such cost is incurred.
h . I M PA I R M E N T O F A S S E T S
The carrying amount of assets at each Balance Sheet date are reviewed for impairment. If any indication of impairment based on internal / external factors exists, the recoverable amount of such assets is estimated and impairment is recognised wherever the carrying amount of an asset exceeds its recoverable amount. The recoverable amount is the greater of the net selling price and its value in use, which is arrived at by discounting the future cash flows to their present value based on an appropriate discounting factor. If at the Balance Sheet date, there is an indication that previously recognised impairment loss no longer exists, the recoverable amount is reassessed and the asset is reflected at the recoverable amount, subject to a maximum of the depreciable historical cost and reversal of such impairment loss is recognised in the Statement of Profit and Loss, except in case of revalued assets.
i . E X P E N S E U N D E R E M P L O Y E E ST O C K O PT I O N S C H E M E S
The Holding Company has formulated Employee Stock Option Schemes (‘the ESOS’) in accordance with the SEBI (Employee Stock Option Scheme and Employee Stock Purchase Scheme) Guidelines, 1999 (‘the Guidelines’). The ESOS provides for grant of stock options to employees (including employees of subsidiary companies) to acquire equity shares of the Holding Company that vest in a graded manner and that are to be exercised within a specified period. In accordance with the Guidelines and the guidance note on ‘Accounting for Employees Share-based Payments’ issued by the Institute of Chartered Accountants of India, the excess, if any, of the closing market price on the day prior to the grant of the stock options under the ESOS over the exercise price is amortised on a straight-line method over the vesting period and is charged to the Statement of Profit and Loss as employee benefits expense.
N O T E S T O F I N A N C I A L S TAT E M E N T S CONSOLIDATED FOR THE YEAR ENDED MARCH 31, 2012

I D F C A N N U A L R E P O R T 2 0 1 1 – 1 264
j . E M P L O Y E E B E N E F I T S
�¬ Defined contribution plan
The contribution to provident fund, superannuation fund and pension fund are considered as defined contribution plans and are charged to the Statement of Profit and Loss as they fall due, based on the amount of contribution required to be made.
�¬ Defined benefit plan
The net present value of obligation towards gratuity to employees is actuarially determined as at the Balance Sheet date based on the projected unit credit method. Actuarial gains and losses are recognised in the Statement of Profit and Loss for the year.
�¬ Compensated absences
Based on the leave rules of the group companies, employees are not permitted to accumulate leave. Any unavailed privilege leave to the extent encashable is paid to the employees and charged to the Statement of Profit and Loss for the year.
k . B O R R OW I N G C O ST S
Borrowing costs include interest, amortisation of ancillary costs incurred and exchange differences arising from foreign currency borrowings to the extent they are regarded as an adjustment to the interest cost. Interest cost in connection with the borrowing of funds to the extent not directly related to the acquisition of qualifying assets are charged to the Statement of Profit and Loss over the tenure of the loan. Ancillary costs in connection with long-term external commercial borrowings are amortised to the Statement of Profit and Loss over the tenure of the loan. Issue expenses of certain securities are charged to the securities premium account as stated in note 5(s).
l . R E V E N U E R E C O G N I T I O N
Revenue is recognised to the extent that it is probable that the economic benefits will flow and the revenue can be reliably measured. In addition, the following criteria must also be met before revenue is recognised:
�¬ Interest and other dues are accounted on accrual basis except in the case of non-performing loans where it is recognised upon realisation, as per the income recognition and asset classification norms prescribed by the RBI.
�¬ Income on discounted instruments is recognised over the tenure of the instrument on a straight-line method.
�¬ Dividend is accounted when the right to receive is established.
�¬ Front end fees on processing of loans are recognised upfront as income. .
�¬ Brokerage is recognised on trade date basis and is net of statutory payments.
�¬ Assets management fees is recognised on accrual basis.
�¬ Underwriting commission earned to the extent not reduced from the cost of acquisition of securities is recognised as fees on closure of issue.
�¬ All other fees are recognised when reasonable right of recovery is established, revenue can be reliably measured and as and when they become due except commission income on guarantees which is recognised pro-rata over the period of the guarantee.
�¬ Premium on interest rate reduction is accounted on accrual basis over the residual life of the loan.
�¬ Profit / loss earned on sale of investments is recognised on trade date basis. Profit / loss on sale of investments is determined based on the ‘first in first out’ cost for current investments and weighted average cost for long-term investments.
�¬ Profit / loss on sale of loan assets through direct assignment, without any recourse obligation, is recognised at the time of sale. Profit on securitisation is recognised over the residual life of the pass through certificate in terms of the RBI guidelines. Net loss arising on account of securitisation is recognised at the time of sale.
�¬ Revenue from power supply is accounted on accrual basis.
�¬ Income from trading in derivatives is recognised on final settlement or squaring-up of the contracts.
m . L E A S E S
Where the assets are taken on lease
Leases under which all the risks and benefits of ownership are effectively retained by the lessor are classified as operating leases. Amount due under the operating leases are charged to the Statement of Profit and Loss, on a straight-line method, over the lease term in accordance with Accounting Standard 19 on ‘Leases’ as notified under the Companies (Accounting Standards) Rules, 2006. Initial direct costs incurred specifically for operating leases are recognised as expense in the year in which they are incurred.
N O T E S T O F I N A N C I A L S TAT E M E N T S CONSOLIDATED FOR THE YEAR ENDED MARCH 31, 2012

65C O N S O L I D A T E D A C C O U N T S
Where the assets are given on lease
Leases under which risks and benefits of ownership of the asset are not substantially transferred are classified as operating leases. Assets subject to operating leases are included in fixed assets. Lease income in respect of operating leases is recognised in the Statement of Profit and Loss on a straight-line method over the lease term in accordance with Accounting Standard 19 on ‘Leases’ as notified under the Companies (Accounting Standards) Rules, 2006. Maintenance costs including depreciation are recognised as an expense in the Statement of Profit and Loss.
n . E A R N I N G S P E R S H A R E
Basic earnings per share is computed by dividing the profit after tax by the weighted average number of equity shares outstanding during the year. Diluted earnings per share is computed by dividing the profit after tax as adjusted for dividend, interest and other charges to expense or income relating to the dilutive potential equity shares, by the weighted average number of equity shares considered for deriving basic earnings per share and the weighted average number of equity shares which could have been issued on the conversion of all dilutive potential equity shares. Potential equity shares are deemed to be dilutive only if their conversion to equity shares would decrease the net profit per share from continuing ordinary operations. Potential dilutive equity shares are deemed to be converted as at the beginning of the year, unless they have been issued at a later date. The dilutive potential equity shares are adjusted for the proceeds receivable had the shares been actually issued at fair value (i.e. average market value of the outstanding shares). Dilutive potential equity shares are determined independently for each year.
o . T A X E S O N I N C O M E
Current tax is the amount of tax payable on the taxable income for the year as determined in accordance with the provisions of the Income-tax Act, 1961.
Deferred tax is recognised on timing differences, being the differences between the taxable income and the accounting income that originate in one period and are capable of reversal in one or more subsequent periods. Deferred tax is measured using the tax rates and the tax laws enacted or substantially enacted as at the Balance Sheet date. Deferred tax liabilities are recognised for all timing differences. Deferred tax assets in respect of unabsorbed depreciation and carry forward of losses are recognised only if there is virtual certainty that there will be sufficient future taxable income available to realise such assets. Deferred tax assets are recognised for timing differences of other items only to the extent that reasonable certainty exists that sufficient future taxable income will be available against which these can be realised. Deferred tax assets and liabilities are offset if such items relate to taxes on income levied by the same governing tax laws and right for such set off are legally enforceable. Deferred tax assets are reviewed at each Balance Sheet date for their realisability. Current and deferred tax relating to items directly recognised in reserves are recognised in reserves and not in the Statement of Profit and Loss.
Minimum alternate tax paid in accordance with the tax laws, which gives future economic benefits in the form of adjustment to future income tax liability, is considered as an asset if there is convincing evidence that normal income tax will be payable. Accordingly, it is recognised as an asset in the Balance Sheet when it is probable that future economic benefits associated with it will flow.
p . D E R I VAT I V E C O N T R A CT S
�¬ Interest rate swaps
Interest rate swaps are booked with the objective of managing the interest rate risk on liabilities. Interest rate swaps in the nature of hedge are recorded on accrual basis and these transactions are not marked-to-market. Any resultant profit or loss on termination of the hedge swaps is amortised over the life of the swap or underlying asset / liability, whichever is shorter.
�¬ Currency Interest rate swaps
Currency interest rate swaps in the nature of hedge, booked with the objective of managing the currency and interest rate risk on foreign currency liabilities are recorded on accrual basis and these transactions are not marked-to-market. Any resultant profit or loss on termination of hedge swaps is amortised over the life of swap or underlying asset / liability, whichever is shorter. The foreign currency balances on account of principal of currency interest rate swaps outstanding as at the Balance Sheet date are revalued using the closing rate.
�¬ Stock Futures
Stock Futures are marked-to-market on a daily basis. The debit or credit balance in the ‘Mark-to-market margin – stock futures account’ disclosed under loans and advances or current liabilities represents the net amount paid or received on the basis of the movement in the prices of stock futures till the Balance Sheet date.
Credit balance in the ‘Mark-to-market margin – stock futures account’ in the nature of anticipated profit, is ignored and no credit is taken to the Statement of Profit and Loss. However, the debit balance in the ‘Mark-to-market margin – stock futures account’ in the nature of anticipated loss is recognised in the Statement of Profit and Loss.
N O T E S T O F I N A N C I A L S TAT E M E N T S CONSOLIDATED FOR THE YEAR ENDED MARCH 31, 2012

I D F C A N N U A L R E P O R T 2 0 1 1 – 1 266
On final settlement or squaring-up of contracts for stock futures, the profit or loss is calculated as the difference between the settlement / squaring-up price and the contract price. Accordingly, debit or credit balance pertaining to the settled / squared-up contract in ‘Mark-to-market margin – stock futures account’ is recognised in the Statement of Profit and Loss upon expiry of the contracts. When more than one contract in respect of the relevant series of stock futures contract, to which the squared-up contract pertains, is outstanding at the time of the squaring-up of the contract, the contract price of such contract is determined using the weighted average method for calculating profit / loss on squaring-up.
‘Initial margin account – stock futures’, representing initial margin paid, is disclosed under loans and advances.
q . F O R E I G N C U R R E N C Y T R A N S A CT I O N S A N D T R A N S L AT I O N S
Foreign currency transactions are accounted at the exchange rate prevailing on the date of the transaction. Foreign currency monetary items outstanding as at the Balance Sheet date are reported using the closing rate. Gain or loss resulting from the settlement of such transactions and translation of monetary assets and liabilities denominated in foreign currencies are recognised in the Statement of Profit and Loss. Premium in respect of forward contracts is accounted over the period of the contract. Forward contracts outstanding as at the Balance Sheet date are revalued at the closing rate.
r . P R O V I S I O N S A N D C O N T I N G E N C I E S
Provision against loans
�¬ Provision is made in accordance with the RBI guidelines applicable to non-performing loans. In addition, provision is made in accordance with the provisioning policy of the Holding Company against non-performing loans.
�¬ Provision on restructured loans is computed in accordance with the RBI guidelines.
�¬ Provision for contingencies is made as per the provisioning policy of the Holding Company which includes provision under Section 36(1)(viia) of the Income-tax Act, 1961.
�¬ A general provision is made at 0.25% of the outstanding standard assets in accordance with the RBI guidelines.
Other provisions
�¬ A provision is recognised for a present obligation as a result of past events and it is probable that an outflow of resources will be required to settle the obligation in respect of which a reliable estimate can be made. Provisions (excluding retirement benefits) are not discounted to their present value and are determined based on the best estimate required to settle the obligation as at the Balance Sheet date. These are reviewed at each Balance Sheet date and adjusted to reflect the current best estimates. Contingent liabilities are disclosed separately.
s . S E C U R I T I E S I S S U E E X P E N S E S
Securities issue expenses and redemption premium are adjusted against the securities premium account as permissible under Section 78(2) of the Companies Act, 1956, to the extent balance is available for utilisation in the securities premium account.
t . B R O K E R A G E E X P E N S E S
Brokerage paid to the brokers on closed ended funds and commitments in portfolio management schemes are amortised over the tenure of the product or commitment period.
u . M I S D E A L ST O C K
Misdeal stock comprises of stock that devolves due to erroneous execution of trades in the normal course of business. These securities are valued at lower of cost or market value on an individual basis. Any profit or loss on such deals is recognised in the Statement of Profit and Loss.
v . E X P E N D I T U R E I N C U R R E D D U R I N G P R O J E CT D E V E L O P M E N T
�¬ Expenditure incurred during pre-project development stage is charged to the Statement of Profit and Loss as and when incurred.
�¬ Expenditure incurred in respect of acquisitions are charged to the Statement of Profit and Loss as and when incurred.
�¬ Expenditure incurred during project development stage are capitalised and transferred to project companies, in case the bid is successful, else the same is charged to the Statement of Profit and Loss.
w . S E R V I C E T A X I N P UT C R E D I T
Service tax input credit is accounted in the period in which the underlying services are received and when there is no uncertainty in availing / utilising the credit.
N O T E S T O F I N A N C I A L S TAT E M E N T S CONSOLIDATED FOR THE YEAR ENDED MARCH 31, 2012

67C O N S O L I D A T E D A C C O U N T S
6 S H A R E C A P I TA L
AS AT MARCH 31, 2012 AS AT MARCH 31, 2011
NUMBER (` in crore) NUMBER (` in crore)
AUTHO RI SED
Equity shares of `10 each 4,000,000,000 4,000.00 4,000,000,000 4,000.00
Preference shares of `100 each 100,000,000 1,000.00 100,000,000 1,000.00
5,000.00 5,000.00
I SSUED, SUBSCRI BED & FU LLY PAID-U P
Equity shares of `10 each 1,512,362,768 1,512.36 1,460,947,548 1,460.95
6% Compulsorily convertible cumulative preference shares (CCCPS) of `100 each - - 84,000,000 840.00
TOTAL I SSUED, SUBSCRIBE D AND FU LLY PAID-U P SHARE CA PITA L 1,512.36 2,300.95
(a) RECONCILIATION OF THE NUMBER OF SHARES AND AMOUNT OUTSTANDING AS AT THE BEGINNING AND AT THE END OF THE YEAR
AS AT MARCH 31, 2012 AS AT MARCH 31, 2011
EQUITY SHARES NUMBER (` in crore) NUMBER (` in crore)
Outstanding as at the beginning of the year 1,460,947,548 1,460.95 1,300,612,393 1,300.61
Issued during the year – stock options exercised under the ESOS 3,687,948 3.69 2,583,065 2.59
Issued during the year – conversion of CCCPS into equity shares [see note (c)] 47,727,272 47.72 - -
Issued during the year – Qualified Institutional Placement - - 157,752,090 157.75
Outstanding as at the end of the year 1,512,362,768 1,512.36 1,460,947,548 1,460.95
AS AT MARCH 31, 2012 AS AT MARCH 31, 2011
PREFERENCE SHARES NUMBER (` in crore) NUMBER (` in crore)
Outstanding as at the beginning of the year 84,000,000 840.00 - -
Issued during the year [see note (c)] - - 84,000,000 840.00
Converted to equity shares during the year [see note (c)] 84,000,000 840.00 - -
Outstanding as at the end of the year - - 84,000,000 840.00
(b) TERMS / RIGHTS ATTACHED TO EQUITY SHARES
The Holding Company has only one class of equity shares having a par value of ` 10 per share. Each holder of equity shares is entitled to one vote per
share and ranks pari passu. The dividend proposed by the Board of Directors is subject to approval of the shareholders at the ensuing Annual General
Meeting. During the year ended March 31, 2012, dividend of ` 2.30 per share (Previous Year ` 2.00 per share) is recognised as amount distributable to
equity shareholders.
In the event of liquidation of the Holding Company, the holders of equity shares will be entitled to receive any of the remaining assets of the Holding
Company, after distribution of all preferential amounts. The distribution will be in proportion to the number of equity shares held by the shareholders.
(c) TERMS / RIGHTS ATTACHED TO PREFERENCE SHARES
The Holding Company had raised ` 840.00 crore through the issue of CCCPS during the year ended March 31, 2011. The preference shares were
convertible at any time into equity shares of face value of ` 10 each until the date falling 18 months from the date of issuance of the preference
shares, at the option of the holders, at ` 176 per equity share and carry dividend @ 6% p.a. During the year ended March 31, 2012, the preference
shares were converted into 47,727,272 equity shares of ` 10 each at a premium of ` 166 per equity share.
(d) MOVEMENT IN STOCK OPTIONS GRANTED UNDER THE ESOS IS AS UNDER:
FOR THE YEAR ENDED MARCH 31, 2012
FOR THE YEAR ENDED MARCH 31, 2011
NUMBER NUMBER
Outstanding as at the beginning of the year 20,750,721 16,548,268
Add: Granted during the year 22,248,000 7,459,308
Less: Exercised during the year 3,687,948 2,583,065
Less: Lapsed / forfeited during the year 1,340,668 673,790
Outstanding as at the end of the year 37,970,105 20,750,721
N O T E S T O F I N A N C I A L S TAT E M E N T S CONSOLIDATED FOR THE YEAR ENDED MARCH 31, 2012

I D F C A N N U A L R E P O R T 2 0 1 1 – 1 268
7 R E S E R V E S A N D S U R P L U S
AS AT MARCH 31, 2012 AS AT MARCH 31, 2011
(` in crore) (` in crore)
(a ) SECURI TI ES PRE MIU M ACCOUNT
Opening balance 4,515.93 2,191.43
Add: Premium on issue of equity shares by the Holding Company - 2,510.12
Add: Premium on issue of equity shares by a subsidiary company 2.25 -
Add: Premium on conversion of CCCPS into equity shares [see note 6(c)] 792.27 -
Add: Premium on exercise of stock options under the ESOS 17.18 5.82
Less: Premium utilised during the year [see note 5(s)] 94.19 191.44
[net of current tax of ` 38.00 crore (Previous Year ` 61.10 crore)]
Less: Minority interest in a subsidiary company 0.56 -
Closing balance 5,232.88 4,515.93
(b) STOCK OPTI ONS OUTSTANDING [see note 6(d)]
Opening balance 31.29 20.36
Add: Net charge for the year (see note 26) 4.31 16.75
Less: Stock options exercised 1.70 5.82
Closing balance 33.90 31.29
(c) DEBENTURE RE DE MPTION RE SE RVE
Opening balance 72.60 -
Add: Transfer from surplus in the Statement of Profit and Loss 142.00 72.60
Closing balance 214.60 72.60
Debenture redemption reserve has been created in accordance with Section 117C of the Companies Act, 1956 in respect of public issue of long-term
Infrastructure Bonds.
(d) SPECI AL RESERVE U /S. 3 6 (1)(viii) OF THE INCOME -TAX ACT, 1961
Opening balance 1,160.68 914.68
Add: Transfer from surplus in the Statement of Profit and Loss 390.00 246.00
Less: Transfer to general reserve 0.43 -
Closing balance 1,550.25 1,160.68
(e) SPECI AL RESERVE U /S. 4 5 -IC OF THE RBI ACT, 1 9 3 4
Opening balance 1,197.15 941.06
Add: Transfer from surplus in the Statement of Profit and Loss 321.58 256.09
Less: Transfer to general reserve 2.26 -
Closing balance 1,516.47 1,197.15
(f) GENERAL RESE RVE
Opening balance 311.67 208.67
Add: Transfer from surplus in the Statement of Profit and Loss 164.81 103.00
Add: Transfer from special reserve u/s. 36(1)(viii) 0.43 -
Add: Transfer from special reserve u/s. 45-IC 2.26 -
Less: Share of minority interest 0.26 -
Closing balance 478.91 311.67
(g) CAPI TAL RESE RVE ON CONSOLIDATION
Opening balance 1.25 1.25
Add: Changes due to change in shareholding in group companies ß ß
Closing balance 1.25 1.25
(h) FO REI GN CURRE NCY TRANSLATION RE SE RVE [see note 3(vii)]
Opening balance (1.76) (0.48)
Add / (Less): Foreign exchange translation in relation to non-integral
foreign operations
7.24 (1.28)
Less: Share of minority interest 0.02 -
Closing balance 5.46 (1.76)
N O T E S T O F I N A N C I A L S TAT E M E N T S CONSOLIDATED FOR THE YEAR ENDED MARCH 31, 2012

69C O N S O L I D A T E D A C C O U N T S
AS AT MARCH 31, 2012 AS AT MARCH 31, 2011
(` in crore) (` in crore)
(i) SURPLUS I N THE STATE ME NT OF PROFIT AND LOSS
Opening balance 1,654.54 1,432.48
Profit for the year 1,554.01 1,281.66
Add: Opening adjustment (see note 46) 0.33 0.03
Less: Impact of amount written off by an associate against
securities premium account
0.58 -
LESS: APPROPRIATIONS
TRANSF ER TO RE SE RVE S:
Special reserve u/s. 36(1)(viii) of the Income-tax Act, 1961 390.00 246.00
Debenture redemption reserve 142.00 72.60
Special reserve u/s. 45-IC of the RBI Act, 1934 321.58 256.09
General reserve 164.81 103.00
DI VI DEND & DIVIDE ND DISTRIBUTION TAX:
Proposed dividend on equity shares 347.87 292.36
[` 2.30 per share (Previous Year ` 2.00 per share)]
Dividend paid on preference shares 43.63 -
[` 5.19 per share (Previous Year ` Nil per share)]
Proposed dividend on preference shares - 32.17
[` Nil per share (Previous Year ` 3.83 per share)]
Dividend on equity shares pertaining to previous year 0.24 0.15
[see note (i)]
Tax on proposed equity dividend [see note (ii)] 53.39 57.24
Tax on equity dividend for previous year [see note (i)] 0.04 0.02
Tax on preference dividend [see note (ii)] 5.78 -
TOTAL APPRO PRIATIONS 1,469.34 1,059.63
Closing balance 1,738.96 1,654.54
TOTAL RESERVE S AND SU RPLUS 10,772.68 8,943.35
(i) In respect of equity shares issued pursuant to exercise of stock options under the ESOS, the Holding Company paid dividend of ` 0.24 crore for the
year 2010-11 (Previous Year ` 0.15 crore for the year 2009-10) and tax on dividend of ` 0.04 crore (Previous Year ` 0.02 crore) as approved by the
shareholders at the respective Annual General Meetings.
(ii) Tax on proposed dividend for the year is net of dividend distribution tax of ` 11.24 crore (Previous Year ` 7.60 crore) paid by the subsidiary companies
under Section 115-O of the Income-tax Act, 1961.
8 S H A R E A P P L I C AT I O N M O N E Y P E N D I N G A L L O T M E N T
Share application money pending allotment represents applications received from employees on exercise of stock options granted and vested under the
ESOS by the Holding Company.
AS AT MARCH 31, 2012 AS AT MARCH 31, 2011
NUMBER (` in crore) NUMBER (` in crore)
Equity shares of face value ` 10 each proposed to be issued 103,682 0.10 865,692 0.86
Total amount of securities premium 0.50 3.28
0.60 4.14
The equity shares are expected to be allotted against the share application money within a reasonable period, not later than three months from the
Balance Sheet date.
N O T E S T O F I N A N C I A L S TAT E M E N T S CONSOLIDATED FOR THE YEAR ENDED MARCH 31, 2012

I D F C A N N U A L R E P O R T 2 0 1 1 – 1 270
9 L O N G -T E R M B O R R O W I N G S
AS AT MARCH 31, 2012 AS AT MARCH 31, 2011
(` in crore) (` in crore)
NON-CURRENT PORTION
CURRENT MATURITIES
NON-CURRENT PORTION
CURRENT MATURITIES
DEBENTURES (NON CONVE RTIBLE ) (SE CU RE D) [see note (a) & 39]
Face value 23,297.92 7,844.00 18,978.46 5,804.00
Less: Unexpired discount on zero percent debentures [see note (b)] 191.57 17.26 202.38 78.78
23,106.35 7,826.74 18,776.08 5,725.22
DEBENTURES (CONVE RTIBLE ) (U NSE CU RE D) (see note 40) 6.67 - 6.67 -
TERM LOANS (SECURE D) [see note (a)]
From banks (see note 41) 4,237.62 785.57 6,049.04 1,998.16
From others (see note 42) 1,836.56 634.93 1,304.29 107.49
6,074.18 1,420.50 7,353.33 2,105.65
SUBORDI NATED DEBT FROM THE GOVE RNME NT OF INDIA (U NS ECURED)(see note 43)
650.00 - 650.00 -
Amount disclosed under ‘Other current liabilities’ (see note 13) - (9,247.24) - (7,830.87)
TOTAL LO NG-TERM BORROWINGS 29,837.20 - 26,786.08 -THE ABOVE AM OUNT INC LU DE S
Secured borrowings 29,180.53 9,247.24 26,129.41 7,830.87
Unsecured borrowings 656.67 - 656.67 -
TOTAL 29,837.20 9,247.24 26,786.08 7,830.87
(a) Borrowings of ` 38,427.77 crore (Previous Year ` 33,960.28 crore) are secured by way of a first floating pari passu charge over investments, current assets and loans and advances excluding investments in and other receivables from subsidiaries and affiliates.
(b) Unexpired discount is net of ` 117.72 crore (Previous Year ` 227.96 crore) towards interest accrued but not due.
1 0 O T H E R L O N G -T E R M L I A B I L I T I E S
AS AT MARCH 31, 2012 AS AT MARCH 31, 2011
(` in crore) (` in crore)
Trade payables (see note 38) - 23.76
Lease equalisation (see note 33) 6.71 5.71
Interest accrued but not due on borrowings 126.67 14.83
Income received in advance (unearned revenue) 4.83 6.46
Security deposit 0.64 0.64
Retention money 2.77 2.46
TOTAL 141.62 53.86
1 1 L O N G -T E R M P R O V I S I O N S
AS AT MARCH 31, 2012 AS AT MARCH 31, 2011
(` in crore) (` in crore)
Provision for employee benefits 4.53 3.51
Contingent provision against standard assets [see note (a) & (b)] 124.40 96.75
TOTAL 128.93 100.26
(a) A contingent provision against standard assets has been created at 0.25% of the outstanding standard assets in terms of the RBI circular
Ref. No. DNBS (PD) CC No. 225 / 03.02.001 / 2011-12 dated July 1, 2011.
(b) Movement in contingent provision against standard assets during the year is as under:
AS AT MARCH 31, 2012 AS AT MARCH 31, 2011
(` in crore) (` in crore)
Opening balance 96.75 -
Additions during the year 27.65 96.75
Closing balance 124.40 96.75
N O T E S T O F I N A N C I A L S TAT E M E N T S CONSOLIDATED FOR THE YEAR ENDED MARCH 31, 2012

71C O N S O L I D A T E D A C C O U N T S
1 2 S H O R T-T E R M B O R R O W I N G S
AS AT MARCH 31, 2012 AS AT MARCH 31, 2011
(` in crore) (` in crore)
TERM LOANS (SECURE D) [see note (a)]
From banks 3,606.09 1,225.00
COLLATERALI SED BORROWINGS AND LE NDING OBLIGATIONS ( C B LO) [see note (b)]
499.38 249.73
COM M ERCI AL PAPERS (U NSE CU RE D)
Face value 3,132.00 210.00
Less: Unexpired discount [see note (c)] 136.44 3.65
2,995.56 206.35
CASH CREDI T / BANK OVE RDRAFT (SE CU RE D) [see note (a)] 249.98 -
CASH CREDI T / BANK OVE RDRAFT (U NSE CU RE D) - 5.91
TOTAL SHORT-TERM BORROWINGS 7,351.01 1,686.99 THE ABOVE AM OUNT INCLU DE S
Secured borrowings 4,355.45 1,474.73
Unsecured borrowings 2,995.56 212.26
TOTAL 7,351.01 1,686.99
(a) Borrowings of ` 3,856.07 crore (Previous Year ` 1,225.00 crore) are secured by way of a first floating pari passu charge over investments, current assets
and loans and advances excluding investments in and other receivables from subsidiaries and affiliates.
(b) Borrowings under CBLO is secured against investments in Government securities.
(c) Unexpired discount on commercial papers is net of ` 100.27 crore (Previous Year ` 7.74 crore) towards interest accrued but not due.
1 3 O T H E R C U R R E N T L I A B I L I T I E S
AS AT MARCH 31, 2012 AS AT MARCH 31, 2011
(` in crore) (` in crore)
Current maturities of long-term borrowings (see note 9) 9,247.24 7,830.87
Interest accrued but not due on borrowings 1,217.56 878.30
Income and other amounts received in advance 49.44 24.12
Unclaimed dividend 1.22 0.96
Unclaimed interest 5.22 -
Security deposit 8.33 -
Other payables
Statutory dues 12.13 15.61
Payable to gratuity fund 2.31 0.52
Advance against sale - 2.42
Other amounts received in advance 2.67 31.41
17.11 49.96
Other Liabilities 2.09 -
TOTAL 10,548.21 8,784.21
N O T E S T O F I N A N C I A L S TAT E M E N T S CONSOLIDATED FOR THE YEAR ENDED MARCH 31, 2012

I D F C A N N U A L R E P O R T 2 0 1 1 – 1 272
1 4 S H O R T-T E R M P R O V I S I O N S
AS AT MARCH 31, 2012 AS AT MARCH 31, 2011
(` in crore) (` in crore)
Provision for employee benefits 0.98 0.51
Other provisions
Provision for income tax (net of advance payment of tax) 38.91 26.80
Provision for wealth tax (net of advance payment of tax) 0.27 0.28
Provision for fringe benefit tax (net of advance payment of tax) 0.24 0.43
Proposed equity dividend [see note 6 (b)] 347.87 292.36
Proposed preference dividend - 32.17
Tax on proposed equity dividend 55.14 44.43
Tax on proposed preference dividend - 5.22
TOTAL 443.41 402.20
1 5 ( a ) TA N G I B L E A S S E T S
GROSS BLOCK ACCUMULATED DEPRECIATION NET BLOCK
(` in crore) (` in crore) (` in crore)
Bala
nce
as a
t A
pril
1, 2
011
Tran
slat
ion
exch
ange
di
ffer
ence
Add
itio
ns
Dis
posa
ls
Bala
nce
as a
t M
arch
31,
201
2
Bala
nce
as a
t A
pril
1, 2
011
Tran
slat
ion
exch
ange
di
ffer
ence
Dep
reci
atio
n ch
arge
for t
he
year
On d
ispo
sals
Bala
nce
as a
t M
arch
31,
201
2
Bala
nce
as a
t M
arch
31,
201
2
Bala
nce
as a
t M
arch
31,
201
1
Freehold Land 5.07 - - - 5.07 - - - - - 5.07 5.07
Leasehold Land 4.51 - - - 4.51 - - - - - 4.51 4.51
Buildings
Own use 327.93 - 0.19 1.48 326.64 36.30 - 14.56 0.70 50.16 276.48 291.63
Under operating lease [see note 33(iii)] 18.81 - - - 18.81 9.19 - 0.48 - 9.67 9.14 9.62
Leasehold improvements 13.80 0.10 0.88 - 14.78 5.26 0.10 3.12 - 8.48 6.30 8.54
Furniture and fixtures
Own use 11.77 0.04 0.37 0.04 12.14 4.88 0.02 1.24 0.05 6.09 6.05 6.89
Under operating lease [see note 33(iii)] 0.42 - - - 0.42 0.11 - 0.02 - 0.13 0.29 0.31
Vehicles 1.03 - 0.47 0.42 1.08 0.65 - 0.17 0.36 0.46 0.62 0.38
Office equipment
Own use 13.85 0.03 1.02 0.55 14.35 4.74 - 1.72 0.45 6.01 8.34 9.11
Under operating lease [see note 33(iii)] 0.02 - - - 0.02 0.02 - - - 0.02 - -
Computers 17.80 0.05 2.66 0.49 20.02 12.13 0.03 2.85 0.42 14.59 5.43 5.67
Windmills 101.25 - - - 101.25 39.43 - 9.48 - 48.91 52.34 61.82
TOTAL 516.26 0.22 5.59 2.98 519.09 112.71 0.15 33.64 1.98 144.52 374.57 403.55
Previous Year 502.94 (0.01) 24.08 10.75 516.26 83.01 (0.01) 35.96 6.25 112.71 403.55
1 5 ( b ) I N TA N G I B L E A S S E T S
GROSS BLOCK ACCUMULATED AMORTISATION NET BLOCK
(` in crore) (` in crore) (` in crore)
Bala
nce
as a
t A
pril
1, 2
011
Tran
slat
ion
exch
ange
di
ffer
ence
Add
itio
ns
Dis
posa
ls
Bala
nce
as a
t M
arch
31,
201
2
Bala
nce
as a
t A
pril
1, 2
011
Tran
slat
ion
exch
ange
di
ffer
ence
Am
orti
sati
on
char
ge fo
r the
ye
ar
On d
ispo
sals
Bala
nce
as a
t M
arch
31,
201
2
Bala
nce
as a
t M
arch
31,
201
2
Bala
nce
as a
t M
arch
31,
201
1
Tenancy rights 0.11 - - - 0.11 0.03 - - - 0.03 0.08 0.08
Computer software 16.58 0.01 1.09 - 17.68 7.69 0.01 4.80 - 12.50 5.18 8.89
TOTAL 16.69 0.01 1.09 - 17.79 7.72 0.01 4.80 - 12.53 5.26 8.97
Previous Year 11.64 - 7.84 2.79 16.69 6.19 - 4.21 2.68 7.72 8.97
TOTAL TANGI BLE AND INTANGI BLE ASSETS
532.95 0.23 6.68 2.98 536.88 120.43 0.16 38.44 1.98 157.05 379.83 412.52
Previous Year 514.58 (0.01) 31.92 13.54 532.95 89.20 (0.01) 40.17 8.93 120.43 412.52
N O T E S T O F I N A N C I A L S TAT E M E N T S CONSOLIDATED FOR THE YEAR ENDED MARCH 31, 2012

73C O N S O L I D A T E D A C C O U N T S
1 6 N O N - C U R R E N T I N V E S T M E N T S ( AT C O S T )
AS AT MARCH 31, 2012 AS AT MARCH 31, 2011
(` in crore) (` in crore)
I NVESTM ENT I N ASSOCIATES
Equity shares 27.78 10.29
Add: Goodwill on acquisition 9.80 9.80
Add: Adjustment for post acquisition share of profit and reserve for associates
10.66 10.29
48.24 30.38
I NVESTM ENT I N A SU BSIDIARY
Equity shares 8.05 0.05
OTHER I NVESTM ENTS
Equity shares [see note (c) & (d)] 765.20 756.83
Preference shares 544.18 668.72
Venture capital units [see note (d)] 618.48 466.69
Bonds 563.14 734.85
Government securities 49.99 49.99
Security receipts 21.38 21.71
TOTAL NON-CURRENT INVE STME NTS 2,618.66 2,729.22
Less: Provision for diminution in value of investments 178.24 93.57
Less: Premium amortised on bonds and Government securities 7.31 4.36
NET NON-CURRENT INVE STME NTS 2,433.11 2,631.29
(a) Aggregate amount of quoted investments
Cost 308.81 286.04
Market value 243.96 293.27
(b) Aggregate amount of unquoted investments - cost 2,309.85 2,443.18
(c) Investments include ` Nil (Previous Year ` 47.69 crore) in respect of equity shares which are subject to a lock-in-period.
(d) Investments include ` 0.47 crore (Previous Year ` 0.47 crore) in respect of equity shares and ` 618.48 crore (Previous Year ` 466.69 crore) in respect of venture capital units which are subject to restrictive covenants.
1 7 D E F E R R E D TA X
AS AT MARCH 31, 2012 AS AT MARCH 31, 2011
(` in crore) (` in crore)
ASSETS LIABILITIES ASSETS LIABILITIES
(a) Provisions 339.14 0.50 265.13 0.62
(b) Others 1.40 - 8.18 -
(c) Fixed assets: Impact of difference between tax depreciation and depreciation / amortisation charged to the Statement of Profit and Loss
(20.32) (2.68) (23.75) (2.15)
DEF ERRED TAX (NE T) 320.22 (2.18) 249.56 (1.53)
In compliance with Accounting Standard 22 relating to ‘Accounting for Taxes on Income’ as notified under the Companies (Accounting Standards) Rules, 2006, ` 70.00 crore (Previous Year ` 72.67 crore) has been credited to the Statement of Profit and Loss towards deferred tax (net) on account of timing differences.
N O T E S T O F I N A N C I A L S TAT E M E N T S CONSOLIDATED FOR THE YEAR ENDED MARCH 31, 2012

I D F C A N N U A L R E P O R T 2 0 1 1 – 1 274
1 8 L O A N S
AS AT MARCH 31, 2012 AS AT MARCH 31, 2011
(` in crore) (` in crore)
NON-CURRENT PORTION
CURRENT MATURITIES
NON-CURRENT PORTION
CURRENT MATURITIES
Rupee loans [see note (a), (c) & (d)] 41,654.01 6,147.05 32,977.53 4,399.54
Debentures [see note (a) & (d)] 1,086.34 0.83 594.00 239.23
42,740.35 6,147.88 33,571.53 4,638.77
Less: Provision against non-performing loans [see note (c)] 29.73 47.16 6.90 33.93
Less: Provision for contingencies 626.76 - 521.85 -
TOTAL 42,083.86 6,100.72 33,042.78 4,604.84
(a) The above amount includes
Secured [see note (b) & (c)] 38,021.08 5,865.38 32,887.53 4,548.77
Unsecured 4,719.27 282.50 684.00 90.00
42,740.35 6,147.88 33,571.53 4,638.77
(b) Loans to the extent of ` 43,886.46 crore (Previous Year ` 37,436.30 crore) are secured by:
(i) Hypothecation of assets and / or
(ii) Mortgage of property and / or
(iii) Trust and retention account and / or
(iv) Bank guarantees, company guarantee, sponsor guarantee or personal guarantee and / or
(v) Assignment of receivables or rights and / or
(vi) Pledge of shares and / or
(vii) Negative lien and / or
(viii) Undertaking to create a security
(c) Rupee loans – secured includes non-performing loans of ` 148.32 crore (Previous Year ` 79.73 crore) against which provisions of ` 76.89 crore (Previous Year ` 40.83 crore) has been made in accordance with the RBI circular (Ref. No. DNBS (PD) CC No. 225 / 03.02.001 / 2011-12 dated July 1, 2011) [see note (d)].
(d) The classification of loans under the RBI guidelines is as under:
AS AT MARCH 31, 2012 AS AT MARCH 31, 2011
(` in crore) (` in crore)
(i) Standard assets 48,739.91 38,130.57
(ii) Sub-standard assets 70.78 6.25
(iii) Doubtful assets 50.04 45.98
(iv) Loss assets 27.50 27.50
48,888.23 38,210.30
N O T E S T O F I N A N C I A L S TAT E M E N T S CONSOLIDATED FOR THE YEAR ENDED MARCH 31, 2012

75C O N S O L I D A T E D A C C O U N T S
1 9 L O A N S A N D A D VA N C E S – O T H E R S ( C O N S I D E R E D G O O D , U N L E S S S TAT E D O T H E R W I S E )
AS AT MARCH 31, 2012 AS AT MARCH 31, 2011
(` in crore) (` in crore)
NON-CURRENT PORTION
CURRENT MATURITIES
NON-CURRENT PORTION
CURRENT MATURITIES
SECURED
Lending in CBLO - 49.95 - -
U NSECURED
Inter corporate deposits - 412.65 577.65 -
Loans and advances to related parties (see note 31) - 41.52 44.73 0.79
Loan to a financial institution - 30.00 30.00 -
Receivables against derivative contracts 196.29 173.57 24.13 2.30
Receivable against retail infrastructure bonds - 179.17 - -
Loans and advances to employees 1.00 0.97 1.00 0.20
Advance against investments 18.61 100.00 7.35 50.00
Security deposits 36.46 12.37 36.29 5.50
Other deposits 0.07 6.00 3.16 0.07
Capital advance 1.67 - 0.13 1.00
Other loans and advances
Advance payment of income tax (net of provision) 210.21 - 191.82 -
Prepaid expenses 3.08 10.37 1.10 4.09
Supplier advances - 2.21 0.27 1.61
Balance with defined benefit plan - 1.32 - 0.54
Insurance claim receivable - 2.89 - 0.73
Stamp paper on hand - 0.12 - -
Initial margin account - stock futures 5.00 - 4.00 -
Minimum alternate tax credit - 0.31 - -
Miscellaneous - 0.04 0.93 -
Balances with Government authorities - cenvat credit available - 1.56 - 9.20
[includes ` 0.64 crore (Previous Year ` 0.64 crore) considered
doubtful]
Less: Provision against doubtful balances - 0.64 - 0.64
TOTAL 472.39 1,024.38 922.56 75.39
2 0 O T H E R A S S E T S ( C O N S I D E R E D G O O D , U N L E S S S TAT E D O T H E R W I S E )
AS AT MARCH 31, 2012 AS AT MARCH 31, 2011
(` in crore) (` in crore)
NON-CURRENT PORTION
CURRENT MATURITIES
NON-CURRENT PORTION
CURRENT MATURITIES
Other receivables - 5.69 - 5.02
[includes ` 0.53 crore (Previous Year ` 0.36 crore), considered doubtful]
Less: Provision against doubtful receivables - 0.53 - 0.36
- 5.16 - 4.66
Bank deposits [see note (a)] 2.08 - 542.69 -
Interest accrued on deposits & loan to financial institution 0.16 70.56 14.56 10.31
Income accrued on investments - 67.28 - 68.96
Interest accrued on loans [see note (b)] 334.97 453.61 373.93 170.19
Mark-to-market margin – stock futures account - - - 0.16
Less: Provision for loss – stock futures account - - - 0.16
Unamortised expenses
Premium on forward contracts - 5.30 0.47 50.95
Ancillary borrowing costs 30.93 8.84 19.29 4.40
TOTAL 368.14 610.75 950.94 309.47
(a) Balances with banks include deposits under lien of ` 1.09 crore (Previous Year ` 41.58 crore) against bank guarantees.
(b) Current maturities of interest accrued on loans is net of provision of ` 20.71 crore (Previous Year ` 3.75 crore).
N O T E S T O F I N A N C I A L S TAT E M E N T S CONSOLIDATED FOR THE YEAR ENDED MARCH 31, 2012

I D F C A N N U A L R E P O R T 2 0 1 1 – 1 276
2 1 C U R R E N T I N V E S T M E N T S ( L O W E R O F C O S T A N D FA I R VA L U E / M A R K E T VA L U E , U N L E S S S TAT E D O T H E R W I S E )
AS AT MARCH 31, 2012 AS AT MARCH 31, 2011
(` in crore) (` in crore)
I NVESTM ENT I N ASSOCIATES
Equity shares 73.81 -
Preference shares 9.99 -
OTHER I NVESTM ENTS
Equity shares [see note (c)] 90.46 81.83
Bonds 1,596.98 1,168.96
Pass through certificates 0.84 1.28
Certificate of deposits 1,147.90 1,889.89
Commercial papers 1,324.68 821.47
Convertible warrants ß ß
Government securities 181.51 165.47
Treasury bills 354.66 96.27
Mutual funds 264.79 150.51
CURRENT M ATURI TIE S OF LONG-TE RM INVE STME NTS – BONDS ( at cost) 116.37 -
TOTAL CURRENT I NVE STME NTS 5,161.99 4,375.68
Less: Provision for diminution in value of investments 60.86 45.83
Less: Premium amortised on current maturities of long-term bonds 0.38 -
NET CURRENT I NVESTME NTS 5,100.75 4,329.85
(a) Aggregate amount of quoted investments
Cost 81.83 81.83
Market value 40.38 50.40
(b) (i) Aggregate amount of investments in unquoted mutual funds
Cost 264.79 150.51
Market value 275.35 151.37
Market value of investments in unquoted mutual funds represents the repurchase price of the units issued by the mutual funds
(ii) Aggregate amount of other unquoted investments - cost 4,815.37 4,143.34
(c) Investments include ` 8.63 crore (Previous Year ` Nil) in respect of equity shares which are subject to a lock-in period.
2 2 T R A D E R E C E I VA B L E S ( U N S E C U R E D ) ( C O N S I D E R E D G O O D , U N L E S S S TAT E D O T H E R W I S E )
AS AT MARCH 31, 2012 AS AT MARCH 31, 2011
(` in crore) (` in crore)
Outstanding for a period less than six months from the date they are due for payment
377.07 47.19
Outstanding for a period exceeding six months from the date they are due for payment
6.41 10.37
Considered doubtful
Outstanding for a period exceeding six months from the date they are due for payment
2.23 3.97
Less: Provision against doubtful receivables 2.23 3.97
- -
TOTAL 383.48 57.56
N O T E S T O F I N A N C I A L S TAT E M E N T S CONSOLIDATED FOR THE YEAR ENDED MARCH 31, 2012

77C O N S O L I D A T E D A C C O U N T S
2 3 C A S H A N D B A N K B A L A N C E S
AS AT MARCH 31, 2012 AS AT MARCH 31, 2011
(` in crore) (` in crore)
CASH AND CASH EQU IVALE NTS
Cash on hand 0.02 0.02
Cheques on hand 2.29 0.91
Balances with banks:
In current accounts [see note (a)] 25.57 247.56
In deposit accounts 76.24 60.79
104.12 309.28
OTHERS
Balances with banks:
In earmarked accounts
- unclaimed dividend 1.22 0.96
- unclaimed interest 5.22 -
In deposit accounts [see note (b), (c) & (d)] 587.55 252.00
593.99 252.96
TOTAL 698.11 562.24
(a) Balances with banks in current accounts include ` Nil (Previous Year ` 223.43 crore) being amount raised by the Holding Company on issue of
long-term Infrastructure Bonds - Tranche III, that remained unutilised as at the Balance Sheet date, pending regulatory approvals.
(b) Balances with banks include deposits under lien of ` 50.44 crore (Previous Year ` 10.10 crore) against bank guarantees.
(c) Balances with banks in deposit accounts include deposits under lien of ` 21.00 crore (Previous Year ` 17.00 crore) to the National Securities Clearing
Corporation Limited for meeting margin requirements.
(d) Balances with banks include deposits of ` 501.00 crore (Previous Year ` 25.00 crore) having original maturity of more than 12 months.
N O T E S T O F I N A N C I A L S TAT E M E N T S CONSOLIDATED FOR THE YEAR ENDED MARCH 31, 2012

I D F C A N N U A L R E P O R T 2 0 1 1 – 1 278
2 4 R E V E N U E F R O M O P E R AT I O N S
FOR THE YEAR ENDED MARCH 31, 2012
FOR THE YEAR ENDED MARCH 31, 2011
(` in crore) (` in crore)
Interest [see note (a)] 5,434.45 3,947.91
Other financial services [see note (b)] 415.83 593.96
Dividend income [see note (c)] 24.92 44.92
Net profit on sale of investments [see note (d)] 412.35 254.78
Brokerage 37.18 53.16
Other operating income [see note (e)] 11.72 21.25
TOTAL 6,336.45 4,915.98
(a ) DETAI LS OF I NTE RE ST INCOME
Interest on loans [see note (i) & (ii)] 4,793.71 3,446.17
Interest on deposits and loan to financial institution 175.38 108.21
Interest on investments
Current investments 402.46 328.35
Long-term investments 62.90 65.18 TOTAL 5,434.45 3,947.91
(i) Interest on loans includes interest on debentures of ` 182.05 crore (Previous Year ` 105.77 crore)
(ii) Interest on loans includes exchange gain of ` 10.33 crore (Previous Year ` 48.41 crore)
(b) DETAI LS OF I NCOME FROM OTHE R FINANC IAL SE RVIC ES
Fees (net) [see note (i)] 412.36 588.10
Profit on assignment / sale of loans 3.47 5.86 TOTAL 415.83 593.96
(i) Fees income is net of fees shared on sell down of loans of ` 7.87 crore (Previous Year ` 31.64 crore)
(c) DETAI LS O F DIVIDE ND INCOME
Current investments 8.98 32.39
Long-term investments 15.94 12.53 TOTAL 24.92 44.92
(d) DETAI LS O F NE T PROFIT ON SALE OF INVE STME NTS
Current investments 82.58 48.43
Long-term investments 329.77 206.35 TOTAL 412.35 254.78
(e) DETAI LS O F OTHE R OPE RATING INCOME
Sale of power 11.72 10.06
Income from trading in stock futures - 2.81
Income on renunciation of rights - 8.38 TOTAL 11.72 21.25
N O T E S T O F I N A N C I A L S TAT E M E N T S CONSOLIDATED FOR THE YEAR ENDED MARCH 31, 2012
79C O N S O L I D A T E D A C C O U N T S
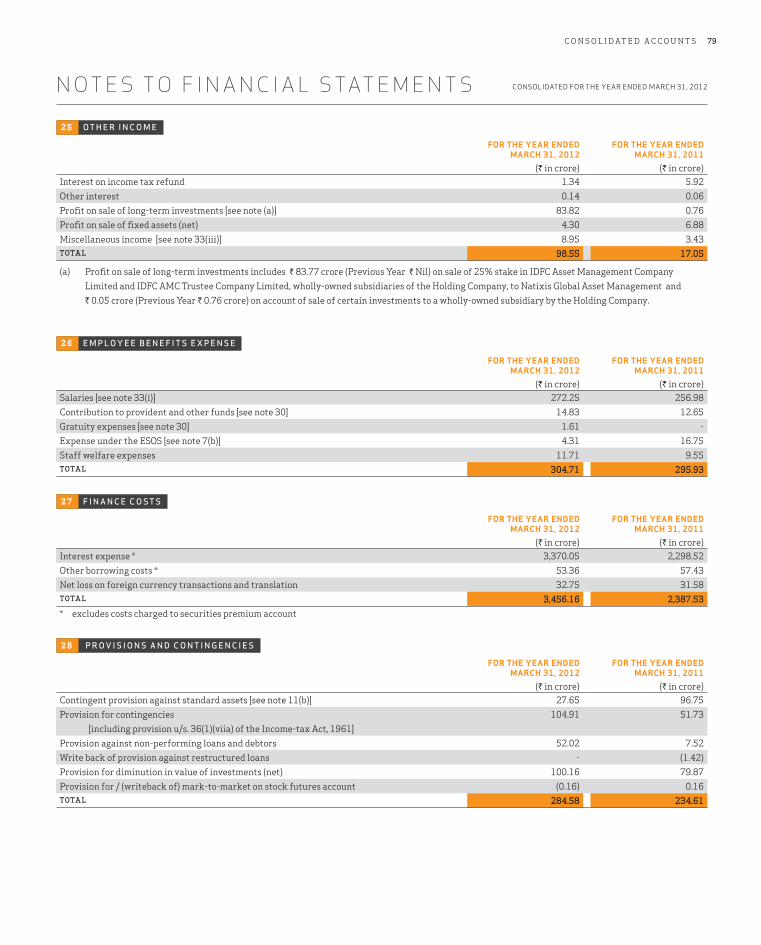
2 5 O T H E R I N C O M E
FOR THE YEAR ENDED MARCH 31, 2012
FOR THE YEAR ENDED MARCH 31, 2011
(` in crore) (` in crore)
Interest on income tax refund 1.34 5.92
Other interest 0.14 0.06
Profit on sale of long-term investments [see note (a)] 83.82 0.76
Profit on sale of fixed assets (net) 4.30 6.88
Miscellaneous income [see note 33(iii)] 8.95 3.43
TOTAL 98.55 17.05
(a) Profit on sale of long-term investments includes ` 83.77 crore (Previous Year ` Nil) on sale of 25% stake in IDFC Asset Management Company
Limited and IDFC AMC Trustee Company Limited, wholly-owned subsidiaries of the Holding Company, to Natixis Global Asset Management and
` 0.05 crore (Previous Year ` 0.76 crore) on account of sale of certain investments to a wholly-owned subsidiary by the Holding Company.
2 6 E M P L O Y E E B E N E F I T S E X P E N S E
FOR THE YEAR ENDED MARCH 31, 2012
FOR THE YEAR ENDED MARCH 31, 2011
(` in crore) (` in crore)
Salaries [see note 33(i)] 272.25 256.98
Contribution to provident and other funds [see note 30] 14.83 12.65
Gratuity expenses [see note 30] 1.61 -
Expense under the ESOS [see note 7(b)] 4.31 16.75
Staff welfare expenses 11.71 9.55
TOTAL 304.71 295.93
2 7 F I N A N C E C O S T S
FOR THE YEAR ENDED MARCH 31, 2012
FOR THE YEAR ENDED MARCH 31, 2011
(` in crore) (` in crore)
Interest expense * 3,370.05 2,298.52
Other borrowing costs * 53.36 57.43
Net loss on foreign currency transactions and translation 32.75 31.58
TOTAL 3,456.16 2,387.53
* excludes costs charged to securities premium account
2 8 P R O V I S I O N S A N D C O N T I N G E N C I E S
FOR THE YEAR ENDED MARCH 31, 2012
FOR THE YEAR ENDED MARCH 31, 2011
(` in crore) (` in crore)
Contingent provision against standard assets [see note 11(b)] 27.65 96.75
Provision for contingencies
[including provision u/s. 36(1)(viia) of the Income-tax Act, 1961]
104.91 51.73
Provision against non-performing loans and debtors 52.02 7.52
Write back of provision against restructured loans - (1.42)
Provision for diminution in value of investments (net) 100.16 79.87
Provision for / (writeback of) mark-to-market on stock futures account (0.16) 0.16
TOTAL 284.58 234.61
N O T E S T O F I N A N C I A L S TAT E M E N T S CONSOLIDATED FOR THE YEAR ENDED MARCH 31, 2012

I D F C A N N U A L R E P O R T 2 0 1 1 – 1 280
2 9 O T H E R E X P E N S E S
FOR THE YEAR ENDED MARCH 31, 2012
FOR THE YEAR ENDED MARCH 31, 2011
(` in crore) (` in crore)
Rent [see note 33(ii)] 25.39 23.16
Rates and taxes 4.13 4.41
Electricity 3.34 3.48
Repairs and maintenance
Buildings 1.60 2.06
Equipments 2.66 2.06
Others 2.54 1.98
Insurance charges 0.92 0.86
Travelling and conveyance 18.51 18.35
Printing and stationery 1.37 4.29
Communication costs 7.01 8.48
Advertising and publicity 5.66 6.50
Professional fees 39.74 58.35
Loss on trading in stock futures 2.63 -
Loss on foreign exchange fluctuation (net) 0.30 -
Directors’ sitting fees 0.55 0.55
Commission to directors 1.04 1.11
Bad debts written off 1.43 5.38
Miscellaneous expenses 39.27 23.49
Auditors’ remuneration [see note (a)] 3.29 2.96
Shared service costs recovered [see note (b)] (0.83) -
Other operating expenses 17.89 28.48
TOTAL 178.44 195.95
(a) Break up of auditors’ remuneration:
FOR THE YEAR ENDED MARCH 31, 2012
FOR THE YEAR ENDED MARCH 31, 2011
(` in crore) (` in crore)
Audit fee 1.36 1.39
Tax audit fee 0.29 0.30
Taxation matters 0.43 0.23
Other services 1.07 1.01
Out of pocket expenses 0.01 0.02
Service tax 0.37 0.25
3.53 3.20
Less: Service tax set off claimed 0.24 0.24
TOTAL 3.29 2.96
The above amounts exclude professional fees of ` 0.19 crore (Previous Year ` 0.67 crore) debited to other accounts.
(b) Shared service costs recovery of ` 0.83 crore (Previous Year ` Nil) represents recovery from an associate company and others under a shared service agreement.
N O T E S T O F I N A N C I A L S TAT E M E N T S CONSOLIDATED FOR THE YEAR ENDED MARCH 31, 2012

81C O N S O L I D A T E D A C C O U N T S
FOR THE YEAR ENDED MARCH 31, 2012
FOR THE YEAR ENDED MARCH 31, 2011
(` in crore) (` in crore)
FUNDED NON FUNDED FUNDED NON FUNDEDProvident fund 4.86 2.32 4.31 2.07
Pension fund 0.59 - - -
Superannuation fund 0.85 0.44 0.62 0.36
ii. The details of the Group’s post-retirement benefit plans for gratuity for its employees are given below which are certified by the actuary and relied upon by the auditors:
FOR THE YEAR ENDED MARCH 31, 2012
FOR THE YEAR ENDED MARCH 31, 2011
(` in crore) (` in crore)
FUNDED NON FUNDED FUNDED NON FUNDEDCHANGE I N THE DE FINE D BE NE FIT OBLIGATIONS:
Liability at the beginning of the year 12.59 4.16 8.43 2.12
Current service cost 2.93 1.39 2.53 1.10
Interest cost 1.25 0.44 0.84 0.24
Liabilities settled on divestiture - - (0.32) (0.02)
Benefits paid (1.07) (0.55) (0.68) (0.42)
Actuarial loss 1.38 0.09 0.95 0.79
Past service cost - - 0.84 0.35
Liability at the end of the year 17.08 5.53 12.59 4.16
FAI R VALUE O F PLAN ASSE TS:
Fair value of plan assets at the beginning of the year 11.96 - 8.09 -
Expected return on plan assets 0.96 - 0.77 -
Contributions 3.40 - 4.03 -
Benefits paid (1.07) - (0.68) -
Actuarial loss on plan assets 0.48 - 0.25 -
Fair value of plan assets at the end of the year 14.77 - 11.96 -
Total actuarial loss to be recognised 1.86 0.09 1.20 0.79
ACTUAL RETURN ON PLAN ASSE TS:
Expected return on plan assets 0.96 - 0.77 -
Actuarial loss on plan assets 0.48 - 0.25 -
Actual return on plan assets 0.48 - 0.52 -
AM OUNT RECOGNISE D IN THE BALANCE SHE E T:
Liability at the end of the year 17.08 5.53 12.59 4.16
Fair value of plan assets at the end of the year 14.77 - 11.96 -
Unrecognised past service cost 0.09 0.18 0.19 0.30
Amount recognised in the Balance Sheet under ‘Provision for employee benefits’
2.32 5.35 0.52 3.86
EXPENSE RECOGNISE D IN THE STATE ME NT OF PROFIT A ND LOSS:
Current service cost 2.93 1.39 2.53 1.10
Interest cost 1.25 0.44 0.84 0.24
Expected return on plan assets (0.96) - (0.77) -
Net actuarial loss to be recognised 1.86 0.09 1.20 0.79
Recovery of past service cost 0.10 0.12 0.65 0.06
Liabilities settled on divestiture - - (0.32) (0.02)
Expense recognised in the Statement of Profit and Loss under ‘Employee benefits expense’
5.18 2.04 4.13 2.17
RECO NCI LI ATION OF THE LIABILITY RE COGNISE D IN THE B A LANCE SHEET:
Opening net liaibility 0.62 3.88 0.33 2.12
Expense recognised 5.18 2.04 4.13 2.17
Contribution by the Group (3.40) (0.50) (4.03) (0.42)
Amount recognised in the Balance Sheet under ‘Provision for employee benefits’
2.32 5.35 0.52 3.86
Expected employer’s contribution next year 1.70 0.36 2.30 0.23
30 In accordance with Accounting Standard 15 on ‘Employee Benefits’ as notified under the Companies (Accounting Standards) Rules, 2006 the following disclosures have been made:
i. The Group has recognised the following amounts in the Statement of Profit and Loss towards contribution to defined contribution plans which are included under contribution to provident and other funds:
N O T E S T O F I N A N C I A L S TAT E M E N T S CONSOLIDATED FOR THE YEAR ENDED MARCH 31, 2012

I D F C A N N U A L R E P O R T 2 0 1 1 – 1 282
FOR THE YEAR ENDEDMARCH 31, 2012 MARCH 31, 2011 MARCH 31, 2010 MARCH 31, 2009 MARCH 31, 2008
(` in crore)
E XPERI ENCE ADJUSTME NTS:
Defined benefit obligation 22.61 16.75 10.71 8.84 4.88
Plan assets 14.77 11.96 8.29 6.68 3.45
Unrecognised past service cost - 0.19 - - -
Deficit 7.58 4.17 2.42 2.17 1.43
Experience adjustments on plan liabilities 1.04 2.74 (0.27) 2.24 0.80
Experience adjustments on plan assets (0.48) (0.13) 1.30 (0.74) (0.02)
AS AT MARCH 31, 2012
AS AT MARCH 31, 2011
(%) (%)
INVESTM ENT PATTE RN:
Insurer managed funds 100.00 100.00
Government securities 18.64 23.40
Deposit and money market securities 33.53 13.51
Debentures / bonds 31.98 41.68
Equity shares 15.85 21.41
PRI NCI PAL ASSUM PTIONS:
Discount rate (p.a.) 8.38 8.30
Expected rate of return on assets (p.a.) 8.00 8.00
Salary escalation rate (p.a.) 8.00 8.00
The estimate of future salary increase, considered in the actuarial valuation takes account of inflation, seniority, promotion and other relevant factors.
31 As per Accounting Standard 18 on ‘Related Party Disclosures’ as notified under the Companies (Accounting Standards) Rules, 2006, the related parties of
the Group are as follows:
I . SUBSI DI ARI ES:
(a) Direct:
IDFC Foundation [see note 3(c)]
(b) Through subsidiary:
IDFC PPP Trusteeship Company Limited [see note 4(c)]
II . JO I NTLY CONTROLLE D E NTITIE S OF IDFC FOU NDATION
(a) Delhi Integrated Multi-Modal Transit System Limited (with effect from March 24, 2011)
(b) Infrastructure Development Corporation (Karnataka) Limited (with effect from March 24, 2011)
(c) Uttarakhand Infrastructure Development Company Limited (with effect from March 24, 2011)
II I . ASSOCIATES:
(a) Direct
Galaxy Mercantiles Limited (with effect from December 2, 2011)
Feedback Infrastructure Services Private Limited (Formerly Feedback Ventures Private Limited)
(b) Through subsidiary
Jetpur Somnath Tollways Limited (with effect from August 12, 2011)
IV. ENTI TI ES OVER WHIC H CONTROL IS E XE RCISE D BY IDFC FOUNDATION:
(a) India Infrastructure Initiative Trust (with effect from March 24, 2011)
(b) India PPP Capacity Building Trust (with effect from March 24, 2011)
V. KEY M ANAGEME NT PE RSONNE L OF THE HOLDING COM PA NY :
(a) Dr. Rajiv B. Lall – Managing Director & CEO
(b) Mr. Vikram Limaye – Whole-time Director
The nature and volume of transactions carried out with the above related parties in the ordinary course of business are as follows:
FOR THE YEAR ENDED MARCH 31, 2012
FOR THE YEAR ENDED MARCH 31, 2011
NAME OF RELATED PARTY AND NATURE OF RELATIONSHIP (` in crore) (` in crore)
(a) SUBSI DI ARI ES:
IDFC Foundation Fees paid 3.63 -
Advances recovered during the year 4.00 -
Sale of investments 0.05 45.45
Advances recoverable – balance outstanding 41.50 45.50
Share subscription 8.00 -
Amount payable 0.52 -
N O T E S T O F I N A N C I A L S TAT E M E N T S CONSOLIDATED FOR THE YEAR ENDED MARCH 31, 2012

83C O N S O L I D A T E D A C C O U N T S
FOR THE YEAR ENDED MARCH 31, 2012
FOR THE YEAR ENDED MARCH 31, 2011
NAME OF RELATED PARTY AND NATURE OF RELATIONSHIP (` in crore) (` in crore)
IDFC PPP Trusteeship Company Limited Advances given 0.02 -
Advances – balance outstanding 0.02 -
(b) JO I NTLY CONTROLLE D E NTITIE S:
Uttarakhand Infrastructure Development Company Limited
Fees paid 0.09 -
Infrastructure Development Corporation (Karnataka) Limited
Fees paid 0.04 -
Rent paid 0.02 -
Deputation charges recovered - -
Trade payables – balance outstanding 0.16 0.37
(c) ASSOCIATES:
Feedback Infrastructure Services Private Limited
Dividend received 0.81 0.73
Miscellaneous Income ß ß
Fees paid 0.25 -
Subscription to redeemable debentures 28.00 -
Interest on redeemable debentures 1.41 -
Interest accrued on loans – balance outstanding 1.41 -
Galaxy Mercantiles Limited Interest on optionally convertible debentures (OCDs)
6.21 -
Subscription to equity shares 73.81 -
Subscription to cumulative preference shares 9.99 -
Interest accrued on loans – balance outstanding 0.08 -
Investment in OCDs 136.12 -
Loan given and balance outstanding 1.65 -
(d) ENTI TI ES OVER WHICH CONTROL IS E XE RCISE D:
India PPP Capacity Building Trust Fees paid 6.83 2.39
Trade payables – balance outstanding 0.79 2.23
(e) KEY M ANAGEME NT PE RSONNE L OF THE HOLDING COM PA NY :
Dr. Rajiv B. Lall Remuneration paid 5.99 6.26*
Mr. Vikram Limaye Remuneration paid 4.93 6.78*
Dr. Rajiv B. Lall 80CCF bonds ß ß
Mr. Vikram Limaye 80CCF bonds ß ß
* includes perquisites on exercise of employee stock options under the ESOS.
32 The Group is engaged in financing by way of loans, asset management and investment banking. The Group does not have any reportable geographic segment. Since the revenues, profit or assets of the asset management segment and investment banking segment individually do not exceed 10% of the Group’s revenues, profit or assets, the Group has one reportable segment i.e. Financing in terms of Accounting Standard 17 on ‘Segment Reporting’ as notified by the Companies (Accounting Standards) Rules, 2006.
FOR THE YEAR ENDED MARCH 31, 2012
FOR THE YEAR ENDED MARCH 31, 2011
(` in crore) (` in crore)
I SEGM ENT OPE RATING RE VE NU E
(a) Financing 6,092.45 4,522.53
(b) Others 333.44 454.08
TOTAL 6,425.89 4,976.61
Less: Inter segment revenue 89.44 60.63
TOTAL O PERATING INCOME 6,336.45 4,915.98 I I SEGM ENT RESU LTS
(a) Financing 2,113.43 1,658.26
(b) Others 57.90 114.66
(c) Unallocated 1.34 5.92
Profit before tax 2,172.67 1,778.84
Less: Provision for tax 621.86 499.75
Profit after tax (before share of profit from associates and adjustment for minority interest)
1,550.81 1,279.09
N O T E S T O F I N A N C I A L S TAT E M E N T S CONSOLIDATED FOR THE YEAR ENDED MARCH 31, 2012

I D F C A N N U A L R E P O R T 2 0 1 1 – 1 284
AS AT MARCH 31, 2012 AS AT MARCH 31, 2011
(` in crore) (` in crore)
I I I SEGM ENT ASSE TS
(a) Financing 59,111.86 47,316.42
(b) Others 1,336.85 1,616.19
(c) Unallocated 530.43 414.56
TOTAL 60,979.14 49,347.17I V SEGM ENT LI ABILITIE S
(a) Financing 48,518.57 37,933.99
(b) Others 115.55 162.33
(c) Unallocated 41.60 2.24
TOTAL 48,675.72 38,098.56V CAPI TAL EM PLOYE D
(a) Financing 10,593.29 9,382.43
(b) Others 1,221.30 1,453.86
(c) Unallocated 488.83 412.32
TOTAL 12,303.42 11,248.61
FOR THE YEAR ENDED MARCH 31, 2012
FOR THE YEAR ENDED MARCH 31, 2011
(` in crore) (` in crore)
VI CAPI TAL EXPE NDITU RE (INC LU DING CAPITAL WORK-I N- PROGRESS)
(a) Financing 6.65 44.58
(b) Others 2.32 5.60
TOTAL 8.97 50.18 VI I DEPRECI ATI O N AND AMORTISATION
(a) Financing 31.36 32.81
(b) Others 7.08 7.36
TOTAL 38.44 40.17 VI I I SI GNI F I CANT NON CASH E XPE NSE S OTHE R THAN DE PREC IATION AND AMORTISATION
(a) Financing 323.41 245.31
(b) Others 9.35 (1.55)
TOTAL 332.76 243.76
33 In accordance with Accounting Standard 19 on ‘Leases’ as notified under the Companies (Accounting Standards) Rules, 2006, the following disclosures in respect of operating leases are made:
i. The Group companies have taken vehicles for certain employees under Operating Leases, which expire between April 2012 to March 2016 (Previous Year August 2011 to March 2015). Salaries include gross rental expenses of ` 1.40 crore (Previous Year ` 0.54 crore). The committed lease rentals in the future are:
AS AT MARCH 31, 2012 AS AT MARCH 31, 2011
(` in crore) (` in crore)
Not later than one year 1.43 0.99
Later than one year and not later than five years 2.14 1.96
ii. The Group companies have taken office premises under operating leases, which expire between June 2015 to September 2018 (Previous Year April 2013 to September 2018). Rent includes gross rental expenses of ` 20.92 crore (Previous Year ` 16.51 crore). The committed lease rentals in the future are:
AS AT MARCH 31, 2012 AS AT MARCH 31, 2011
(` in crore) (` in crore)
Not later than one year 13.98 18.37
Later than one year and not later than five years 36.37 42.84
Later than five years 1.89 7.74
iii. The Holding Company has given office premises under non-cancellable operating lease, which expires in October 2012 (Previous Year October 2012). Miscellaneous income includes income from such leases of ` 2.26 crore (Previous Year ` 2.08 crore). The future minimum lease rentals is as follows:
AS AT MARCH 31, 2012 AS AT MARCH 31, 2011
(` in crore) (` in crore)
Not later than one year 1.32 2.26
Later than one year and not later than five years - 1.32
N O T E S T O F I N A N C I A L S TAT E M E N T S CONSOLIDATED FOR THE YEAR ENDED MARCH 31, 2012

85C O N S O L I D A T E D A C C O U N T S
34 In accordance with Accounting Standard 20 on ‘Earnings Per Share’ as notified under the Companies (Accounting Standards) Rules, 2006:
i. The basic earnings per share has been calculated based on the following:
FOR THE YEAR ENDED MARCH 31, 2012
FOR THE YEAR ENDED MARCH 31, 2011
(` in crore) (` in crore)
Net profit after tax 1,554.01 1,281.66
Less: Adjustment for dividend and dividend distribution tax on CCCPS 49.41 37.39
Net amount available for equity shareholders 1,504.60 1,244.27
Weighted average number of equity shares 1,469,679,676 1,418,087,937
ii. The reconciliation between the basic and the diluted earnings per share is as follows:
FOR THE YEAR ENDED MARCH 31, 2012
FOR THE YEAR ENDED MARCH 31, 2011
(`) (`)
Basic earnings per share 10.24 8.77
Effect of outstanding stock options (0.04) (0.06)
Diluted earnings per share 10.20 8.71
iii. The basic earnings per share has been computed by dividing the net profit after tax for the year available for equity shareholders by the weighted average number of equity shares for the respective years, whereas the diluted earnings per share has been computed by dividing the net profit after tax for the year available for equity shareholders by the weighted average number of equity shares, after giving dilutive effect of the outstanding stock options for the respective periods. Since, the effect of the conversion of CCCPS was anti-dilutive in the previous year, it has been ignored in the previous year. The relevant details as described above are as follows:
AS AT MARCH 31, 2012 AS AT MARCH 31, 2011
Weighted average number of shares for computation of basic earnings per share 1,469,679,676 1,418,087,937
Dilutive effect of outstanding stock options 4,741,438 10,165,050
Weighted average number of shares for computation of diluted earnings per share 1,474,421,114 1,428,252,987
35 Contingent liabilities and commitments (to the extent not provided for)
AS AT MARCH 31, 2012 AS AT MARCH 31, 2011(` in crore) (` in crore)
(a ) CONTI NGENT LIABILITIE S
(i) Claims not acknowledged as debts in respect of:
Income-tax demands under appeal 111.66 120.90
(ii) Guarantees issued:
As a part of project assistance, the following guarantees have been issued:
Financial guarantees 2,255.98 1,234.45
Performance guarantees [including ` 10.76 crore (Previous Year ` Nil) on account of proportionate share in an associate company]
237.77 259.00
Risk participation facility - 5.31
Sponsors undertaking 25.08 -
Other financial guarantees [including ` 9.08 crore (Previous Year ` 5.92 crore) on account of proportionate share in an associate company]
87.49 41.77
(b ) CAPI TAL CO M MITME NTS
(i) Uncalled liability on shares and other investments partly paid [including ` 214.52 crore (Previous Year ` 5.49 crore) on account of proportionate share in associate companies]
1,227.76 730.16
(ii) Estimated amount of contracts remaining to be executed on capital account (net of advances)
1.56 6.87
36 The Holding Company has entered into interest rate swaps in the nature of “fixed / floating” or “floating / fixed” for notional principal of ` 3,066.00 crore outstanding as on March 31, 2012 (Previous Year ` 2,391.00 crore) for varying maturities linked to various benchmarks for asset liability management and hedging. The Holding Company has foreign currency borrowings of USD 81.18 crore (Previous Year USD 62.56 crore), against which the Company has undertaken currency interest rate swaps and forward contracts of USD 81.18 crore (Previous Year USD 60.91 crore) to hedge foreign currency risk. One of the subsidiaries had un-hedged foreign currency exposure of USD 0.08 crore in previous year. The Holding Company has also entered into coupon only currency swaps for notional principal of USD 8.41 crore (Previous Year USD 11.11 crore) to hedge the foreign currency risk towards interest on the foreign currency borrowings.
N O T E S T O F I N A N C I A L S TAT E M E N T S CONSOLIDATED FOR THE YEAR ENDED MARCH 31, 2012

I D F C A N N U A L R E P O R T 2 0 1 1 – 1 286
37 There were no open interest in stock futures as at March 31, 2012. The details of open interest in stock futures as at March 31, 2011 are as under:
LO NG POSI TI ON:
NAME OF FUTURE SERIES OF FUTURE NUMBER OF CONTRACTS NUMBER OF UNITS
Rural Electrification Corporation Limited 28-Apr-11 2 250,000
SHORT POSI TI ON:
NAME OF FUTURE SERIES OF FUTURE NUMBER OF CONTRACTS NUMBER OF UNITS
Larsen & Tubro Limited 28-Apr-11 1 35,000
Shree Renuka Sugars Limited 28-Apr-11 2 700,000
38 No interest has been paid / payable by the group companies during the year to the ‘Suppliers’ covered under the Micro, Small and Medium Enterprises Development Act, 2006. Current liabilities - Trade payable include ` ß (Previous Year ` ß) payable to ‘Suppliers’ registered under the Micro, Small and Medium Enterprises Development Act, 2006 by one of the subsidiary companies. The above information takes into account only those suppliers who have responded to inquiries made by the group companies for this purpose.
3 9 I N T E R E S T A N D R E PAY M E N T T E R M S O F L O N G -T E R M B O R R O W I N G S - D E B E N T U R E S ( N O N C O N V E R T I B L E ) ( S E C U R E D )
AS AT MARCH 31, 2012 AS AT MARCH 31, 2011
(` in crore) (` in crore)
RESIDUAL MATURITY BALANCE OUTSTANDING
INTEREST RATE (%)
BALANCE OUTSTANDING
INTEREST RATE (%)
F I XED RATE
Above 5 years 12,402.92 7.50 to 9.91 10,615.46 7.50 to 9.35
3-5 years 1,880.00 7.45 to 9.40 2,275.00 7.25 to 8.20
1-3 years 8,975.00 6.00 to 11.66 5,928.00 6.00 to 11.66
F LOATI NG RATE
Above 5 years 40.00 MIBOR+150bps 40.00 MIBOR+150bps
1-3 years - NA 120.00 MIBOR+170bps
to 183 bps
TOTAL 23,297.92 18,978.46
4 0 I N T E R E S T A N D R E PAY M E N T T E R M S O F L O N G -T E R M B O R R O W I N G S - D E B E N T U R E S ( C O N V E R T I B L E ) ( U N S E C U R E D )
AS AT MARCH 31, 2012 AS AT MARCH 31, 2011
(` in crore) (` in crore)
RESIDUAL MATURITY BALANCE OUTSTANDING
INTEREST RATE (%)
BALANCE OUTSTANDING
INTEREST RATE (%)
3-5 years - NA 6.67 Zero coupon
1-3 years 6.67 Zero coupon - NA
TOTAL 6.67 6.67
4 1 I N T E R E S T A N D R E PAY M E N T T E R M S O F L O N G -T E R M L O A N S - F R O M B A N K S ( S E C U R E D )
AS AT MARCH 31, 2012 AS AT MARCH 31, 2011
(` in crore) (` in crore)
RESIDUAL MATURITY BALANCE OUTSTANDING
INTEREST RATE (%)
BALANCE OUTSTANDING
INTEREST RATE (%)
F I XED RATE
3-5 years 255.74 7.41 555.74 7.25 to 7.50
1-3 years 1,441.67 8.35 to 10.65 3,977.24 7.00 to 9.89
F LOATI NG RATE
3-5 years 1,790.60 6M LIBOR +
175 bps to 275 bps
891.80 6M LIBOR+
175 bps
1-3 years 749.61 6M LIBOR +
300 bps to 345 bps
624.26 6M LIBOR+
300 bps
TOTAL 4,237.62 6,049.04
N O T E S T O F I N A N C I A L S TAT E M E N T S CONSOLIDATED FOR THE YEAR ENDED MARCH 31, 2012

87C O N S O L I D A T E D A C C O U N T S
4 2 I N T E R E S T A N D R E PAY M E N T T E R M S O F L O N G -T E R M L O A N S - F R O M O T H E R S ( S E C U R E D )
AS AT MARCH 31, 2012 AS AT MARCH 31, 2011
(` in crore) (` in crore)
RESIDUAL MATURITY BALANCE OUTSTANDING
INTEREST RATE (%)
BALANCE OUTSTANDING
INTEREST RATE (%)
F I XED RATE
1-3 years 668.00 10.10 - NA
F LOATI NG RATE
Above 5 years 346.80 INBMK + 184 bps 346.80 INBMK + 184 bps
Above 5 years 522.56 6M LIBOR
+ 60 bps to 235 bps
175.18 6M LIBOR+
60 bps
3-5 years 299.20 6M LIBOR
+ 70 bps to 115 bps
97.54 6M LIBOR+
115 bps
1-3 years - NA 684.77 6M LIBOR+
45 bps to 70 bps
TOTAL 1,836.56 1,304.29
4 3 I N T E R E S T A N D R E PAY M E N T T E R M S O F S U B O R D I N AT E D D E B T F R O M T H E G O V E R N M E N T O F I N D I A ( U N S E C U R E D )
AS AT MARCH 31, 2012 AS AT MARCH 31, 2011
(` in crore) (` in crore)
RESIDUAL MATURITY BALANCE OUTSTANDING
INTEREST RATE (%)
BALANCE OUTSTANDING
INTEREST RATE (%)
29-Sep-47 350.00 5 Year G-Sec+
25 bps
350.00 5 Year G-Sec+
25 bps
17-Mar-47 300.00 5 Year G-Sec+
25 bps
300.00 5 Year G-Sec+
25 bps
TOTAL 650.00 650.00
N O T E S T O F I N A N C I A L S TAT E M E N T S CONSOLIDATED FOR THE YEAR ENDED MARCH 31, 2012
44 Statement of information of Subsidiaries# in compliance with Section 212 of the Companies Act, 1956 as on March 31, 2012
(` in crore)
NAME OF SUBSIDIARY COMPANIES CAPITAL RESERVES TOTAL ASSETS
TOTAL LIABILITIES
DETAILS OF INVESTMENT (excluding investment in subsidiary companies)
TURNOVER PROFIT BEFORE
TAX
PROVISION FOR TAX
PROFIT AFTER
TAX
PROPOSED DIVIDEND
EQUITY MUTUAL FUND
TRUST UNITS
VENTURE CAPITAL UNITS
Dheeru Powergen Limited 1.97 (2.08) 57.73 57.83 - - - - - (0.20) ß (0.20) -
(Previous Year) 1.97 (1.87) 54.96 54.86 - - - - - (0.47) - (0.47) -
IDFC AMC Trustee Company Limited 0.05 0.02 0.08 0.01 - - - - 0.06 (0.02) - (0.02) -
(Previous Year) 0.05 0.04 0.10 0.01 - - - - 0.04 (0.01) - (0.01) -
IDFC Asset Management Company Limited 2.68 61.33 92.59 28.59 - 26.22 - - 110.00 15.72 5.35 10.37 75%
(Previous Year) 2.67 51.04 84.87 31.15 - 17.57 - - 93.09 (3.26) (0.45) (2.81) -
IDFC Capital (Singapore) Pte. Ltd.* 39.25 (37.07) 5.73 3.43 - - - - 7.16 (3.44) 0.54 (3.98) -
(Previous Year) 36.74 (33.22) 7.95 4.44 - - - - 7.41 (12.05) - (12.05) -
IDFC Capital Limited 6.04 109.17 148.64 33.43 2.06 0.08 - - 27.77 1.19 0.35 0.85 -
(Previous Year) 6.04 108.32 150.85 36.49 2.06 7.77 - - 103.06 44.91 14.32 30.59 -
IDFC Capital (USA) Inc.* 4.62 (0.64) 4.66 0.67 - - - - 2.78 (0.49) (0.14) (0.35) -
(Previous Year) 4.62 (0.77) 4.01 0.16 - - - - - (0.62) - (0.62) -
IDFC Distribution Company Limited 1.50 0.35 1.97 0.12 - 0.79 - - 0.23 0.10 0.02 0.08 -
(Previous Year) 1.50 0.27 2.00 0.23 - 0.64 - - 0.30 0.11 0.02 0.09 -
IDFC Finance Limited 21.00 9.36 30.99 0.62 - 30.20 - - 2.62 2.58 0.17 2.41 -
(Previous Year) 21.00 6.96 28.58 0.62 - 27.76 - - 0.51 0.46 0.01 0.45 -
IDFC Foundation (unaudited) 8.05 2.28 52.98 42.65 30.66 - 11.80 - 3.95 3.10 0.80 2.30 -
(Previous Year) (unaudited) 0.05 (0.02) 45.53 45.51 30.68 - 14.85 - ß (0.02) - (0.02) -
IDFC Fund of Funds Limited * 77.18 (11.57) 65.71 0.10 - - - - - (16.02) - (16.02) -
(Previous Year) 53.68 (2.48) 51.33 0.12 - - - - - (0.32) - (0.32) -
IDFC General Partners Limited * 0.08 0.01 0.08 - - - - - - - - - -
(Previous Year) 0.08 ß 0.07 - - - - - - - - - -

I D F C A N N U A L R E P O R T 2 0 1 1 – 1 288
(` in crore)
NAME OF SUBSIDIARY COMPANIES CAPITAL RESERVES TOTAL ASSETS
TOTAL LIABILITIES
DETAILS OF INVESTMENT (excluding investment in subsidiary companies)
TURNOVER PROFIT BEFORE
TAX
PROVISION FOR TAX
PROFIT AFTER
TAX
PROPOSED DIVIDEND
EQUITY MUTUAL FUND
TRUST UNITS
VENTURE CAPITAL UNITS
IDFC Investment Advisors Limited 10.00 4.26 26.75 12.48 - 18.38 - ß 11.57 3.99 1.29 2.70 -
(Previous Year) 10.00 1.56 14.80 3.24 - 9.83 - - 16.53 1.46 0.80 0.67 -
IDFC Investment Managers (Mauritius) Limited *
0.26 0.63 0.99 0.10 - - - - 2.00 0.57 0.02 0.55 -
(Previous Year) 0.26 ß 0.32 0.06 - - - - 0.16 0.01 ß ß -
IDFC Pension Fund Management Company Limited
12.00 0.31 12.67 0.36 - 12.51 - - ß 0.17 0.02 0.15 -
(Previous Year) 12.00 0.16 12.18 0.02 - 11.70 - - ß 0.30 0.01 0.28 -
IDFC Primary Dealership Company Limited
5.00 (1.42) 5.00 1.42 - - - - - (1.42) - (1.42) -
(Previous Year) NA NA NA NA NA NA NA NA NA NA NA NA NA
IDFC PPP Trusteeship Company Limited 0.05 (0.07) ß 0.03 - - - - ß (0.02) - (0.02) -
(Previous Year) 0.05 (0.05) ß 0.01 - - - - ß (0.01) - (0.01) -
IDFC Private Equity Company Limited 0.05 53.52 82.81 29.24 - - - 1.29 62.02 31.54 9.91 21.63 -
(Previous Year) 0.05 55.14 84.06 28.87 - - - 0.90 81.26 57.13 18.65 38.48 -
IDFC Project Equity Company Limited 0.05 3.72 29.28 25.51 - - - - 57.55 18.75 5.61 13.14 -
(Previous Year) 0.05 14.99 40.89 25.85 - - - - 57.55 26.97 8.29 18.68 -
IDFC Projects Limited 34.05 (30.13) 80.14 76.22 17.49 - - - 1.87 (5.04) - (5.04) -
(Previous Year) 34.05 (25.09) 58.10 49.13 - - - - 3.62 (7.17) 0.01 (7.18) -
IDFC Securities Limited 14.14 99.56 127.03 13.33 ß - - - 40.85 1.11 0.17 0.94 -
(Previous Year) 14.14 98.63 179.63 66.87 ß 72.64 - - 78.93 19.54 4.63 14.91 -
IDFC Trustee Company Limited 0.05 1.79 1.85 0.01 - 1.69 - - 0.55 0.56 0.16 0.40 -
(Previous Year) 0.05 1.39 1.48 0.03 - 1.23 - - 0.56 0.58 0.16 0.42 -
Jetpur Somnath Highway Limited NA NA NA NA NA NA NA NA NA NA NA NA NA
(Previous Year) 0.10 (0.10) 0.01 0.01 - - - - - 0.02 ß 0.02 -
Jetpur Somnath Tollways Limited NA NA NA NA NA NA NA NA NA NA NA NA NA
(Previous Year) 0.10 (0.45) 0.10 0.45 - - - - - (0.45) - (0.45) -
Uniquest Infra Ventures Private Limited NA NA NA NA NA NA NA NA NA NA NA NA NA
(Previous Year) 0.01 (0.02) 0.01 0.02 - - - - - (0.02) - (0.02) -
# Subsidiary as defined under Section 4 of the Companies Act, 1956* Exchange Rate:Closing Rate: 1 USD = ` 51.16Average Rate: 1 USD = ` 47.92
45 The Revised Schedule VI to the Companies Act, 1956 has become effective from April 1, 2011 for preparation and presentation of financial statements. This has significantly impacted the disclosure and presentation made in the financial statements. Accordingly, the figures for the previous year have been reclassified, wherever necessary to conform with the current year’s classification.
46 Consequent to the change in the control in some entities, certain opening balances have been considered based on current ownership and accordingly the differences are reflected as ‘Opening Adjustment’.
47 Figures of ` 50,000 or less have been denoted by ß.
FOR AND ON BEHALF OF THE BOARD OF DIRECTORS OF
INFRASTRUCTURE DEVELOPMENT FINANCE COMPANY LIMITED
DEEPAK S. PAREKH RAJIV B. LALL
Chairman Managing Director & CEO
SUNIL KAKAR MAHENDR A N. SH AH
Mumbai | May 8, 2012 Chief Financial Officer Company Secretary
N O T E S T O F I N A N C I A L S TAT E M E N T S CONSOLIDATED FOR THE YEAR ENDED MARCH 31, 2012

89S T A N D A L O N E A C C O U N T S
T O T H E M E M B E R S O F I N F R A ST R U CT U R E D E V E L O P M E N T F I N A N C E C O M PA N Y L I M I T E D
1. We have audited the attached Balance Sheet of INFRASTRUCTURE DEVELOPMENT FINANCE COMPANY LIMITED (“the Company”) as at March 31, 2012, the Statement of Profit and Loss and the Cash Flow Statement of the Company for the year ended on that date, both annexed thereto. These financial statements are the responsibility of the Company’s Management. Our responsibility is to express an opinion on these financial statements based on our audit.
2. We conducted our audit in accordance with the auditing standards generally accepted in India. Those Standards require that we plan and perform the audit to obtain reasonable assurance about whether the financial statements are free of material misstatement. An audit includes examining, on a test basis, evidence supporting the amounts and the disclosures in the financial statements. An audit also includes assessing the accounting principles used and the significant estimates made by the Management, as well as evaluating the overall financial statement presentation. We believe that our audit provides a reasonable basis for our opinion.
3. As required by the Companies (Auditor’s Report) Order, 2003 (CARO) issued by the Central Government in terms of Section 227(4A) of the Companies Act, 1956, we enclose in the Annexure a statement on the matters specified in paragraphs 4 and 5 of the said Order.
4. Further to our comments in the Annexure referred to in paragraph 3 above, we report as follows:
(a) we have obtained all the information and explanations which to the best of our knowledge and belief were necessary for the purposes of our audit;
(b) in our opinion, proper books of account as required by law have been kept by the Company so far as it appears from our examination of those books;
(c) the Balance Sheet, the Statement of Profit and Loss and the Cash Flow Statement dealt with by this report are in agreement with the books of account;
(d) as required by Article 215(4)(f) of the Articles of Association of the Company, we report that in our opinion, the transactions of the Company which have come to our notice have been within the powers of the Company;
(e) in our opinion, the Balance Sheet, the Statement of Profit and Loss and the Cash Flow Statement dealt with by this report are in compliance with the Accounting Standards referred to in Section 211(3C) of the Companies Act, 1956;
(f) in our opinion and to the best of our information and according to the explanations given to us, the said accounts give the information required by the Companies Act, 1956, in the manner so required and give a true and fair view in conformity with the accounting principles generally accepted in India:
(i) in the case of the Balance Sheet, of the state of affairs of the Company as at March 31, 2012;
(ii) in the case of the Statement of Profit and Loss, of the profit of the Company for the year ended on that date, and
(iii) in the case of the Cash Flow Statement, of the cash flows of the Company for the year ended on that date.
5. On the basis of the written representations received from the Directors as on March 31, 2012 taken on record by the Board of Directors, none of the Directors is disqualified as on March 31, 2012 from being appointed as a director in terms of Section 274(1)(g) of the Companies Act, 1956.
FOR DELOITTE HASKINS & SELLS
Chartered Accountants
(Registration No. 117366W)
P. R. RAMESH
Partner
Membership No. 70928
Mumbai
May 8, 2012
A U D I T O R S ’ R E P O R T

I D F C A N N U A L R E P O R T 2 0 1 1 – 1 290
(Referred to in paragraph 3 of our report of even date)
(i) Having regard to the nature of the Company’s business / activities / result / transactions, etc., clauses (ii), (viii), (x) and (xiii) of CARO are not applicable.
(ii) In respect of its fixed assets:
(a) The Company has maintained proper records showing full particulars, including quantitative details and situation of the fixed assets.
(b) The fixed assets were physically verified during the year by the Management in accordance with a regular programme of verification which, in our opinion, provides for physical verification of all the fixed assets at reasonable intervals. According to the information and explanations given to us, no material discrepancies were noticed on such verification.
(c) The fixed assets disposed of during the year, in our opinion, do not constitute a substantial part of the fixed assets of the Company and such disposal has, in our opinion, not affected the going concern status of the Company.
(iii) In respect of loans, secured or unsecured, granted by the Company to companies, firms or other parties covered in the Register maintained under Section 301 of the Companies Act, 1956, according to the information and explanations given to us:
(a) The Company has granted short term loans aggregating ` 350.00 crore to one party during the year. At the year-end, the outstanding balances of such loans aggregated ` Nil and the maximum amount involved during the year was ` 350.00 crore.
(b) The rate of interest and other terms and conditions of such loans are, in our opinion, prima facie not prejudicial to the interests of the Company.
(c) The receipts of principal amounts and interest have been regular.
(iv) In case of loans, secured or unsecured, taken by the Company from companies, firms or other parties listed in the Register maintained under Section 301 of the Companies Act, 1956, according to the information and explanations given to us:
(a) Five parties have subscribed to the public issue of Infrastructure Bonds during the year. At the year-end, the outstanding balance of such bonds aggregated ` 0.05 crore (number of parties fourteen) and the maximum amount involved during the year was ` 0.05 crore.
(b) The rate of interest and other terms and conditions of such loans are, in our opinion, prima facie not prejudicial to the interests of the Company.
(c) The payments of principal amounts and interest have been regular / as per stipulations.
(v) In our opinion and according to the information and explanations given to us, there is an adequate internal control system commensurate with the size of the Company and the nature of its business with regard to purchases of fixed assets and the sale of services. During the course of our audit, we have not observed any major weakness in such internal control system.
(vi) In respect of contracts or arrangements entered in the Register maintained in pursuance of Section 301 of the Companies Act, 1956, to the best of our knowledge and belief and according to the information and explanations given to us:
(a) The particulars of contracts or arrangements referred to in Section 301 that needed to be entered in the Register maintained under the said Section have been so entered.
(b) Where each of such transactions (excluding loans reported under paragraph (iii) and (iv) above) is in excess of ` 5 lakh in respect of any party, the transactions have been made at prices which are prima facie reasonable having regard to the prevailing market prices wherever applicable, at the relevant time.
(vii) The Company has not accepted any deposit from the public within the meaning of Sections 58A & 58AA of the Companies Act, 1956.
(viii) In our opinion, the internal audit functions carried out during the year by a firm appointed by the Management have been commensurate with the size of the Company and the nature of its business.
(ix) According to the information and explanations given to us in respect of statutory dues:
(a) The Company has been regular in depositing undisputed dues, including Provident Fund, Investor Education and Protection Fund, Income-tax, Sales Tax, Wealth Tax, Service Tax, Cess and other material statutory dues applicable to it with the appropriate authorities.
(b) There were no undisputed amounts payable in respect of Provident Fund, Investor Education and Protection Fund, Income-tax, Sales Tax, Wealth Tax, Service Tax, Cess and other material statutory dues in arrears as at March 31, 2012 for a period of more than six months from the date they became payable.
(c) Details of dues of Income-tax which have not been deposited as on March 31, 2012 on account of disputes are given below:
A N N E X U R E TO THE AUDITORS’ REPORT

91S T A N D A L O N E A C C O U N T S
STATUTE NATURE OF DUES FORUM WHERE DISPUTE IS PENDING PERIOD TO WHICH THE AMOUNT RELATES AMOUNT INVOLVED
(` in crore)
Income- tax Act, 1961 Income Tax Income Tax Appellate Tribunal A.Y. 2007-08 8.07
Income- tax Act, 1961 Income Tax Commissioner of Income Tax (Appeals) A.Y. 2008-09 0.80
Income- tax Act, 1961 Income Tax Commissioner of Income Tax (Appeals) A.Y. 2009-10 33.33
(x) In our opinion and according to the information and explanations given to us, the Company has not defaulted in the repayment of dues to banks, financial institutions and debenture holders.
(xi) In our opinion, the Company has maintained adequate records where it has granted loans and advances on the basis of security by way of pledge of shares, debentures and other securities.
(xii) Based on our examination of the records and evaluation of the related internal controls, the Company has maintained proper records of the transactions and contracts in respect of its dealing in shares, securities, debentures and other investments and timely entries have been made therein. The aforesaid securities have been held by the Company in its own name, except to the extent of the exemption granted under Section 49 of the Companies Act, 1956.
(xiii) In our opinion and according to the information and explanations given to us, the terms and conditions of the guarantees given by the Company for loans taken by others from banks and financial institutions are not prima facie prejudicial to the interests of the Company.
(xiv) In our opinion and according to the information and explanations given to us, the term loans have been applied for the purposes for which they were obtained, other than temporary deployment pending application.
(xv) According to the information and explanations given to us and on the basis of the maturity profile of assets and liabilities with a maturity profile of one year as given in the Asset Liability Management Report, liabilities maturing in the next one year are in excess of the assets of similar maturity by ` 6,309.46 crore.
(xvi) According to the information and explanations given to us, the Company has made preferential allotment of shares to parties covered in the Register maintained under Section 301 of the Companies Act, 1956 at a price which is prima facie not prejudicial to the interests of the Company.
(xvii) According to the information and explanations given to us and the records examined by us, securities / charges have been created in respect of all debentures issued during the year except in respect of debentures aggregating ` 2,934.17 crore for which securities / charges have been created subsequently.
(xviii) We have verified the end use of money raised by public issue of Infrastructure Bonds during the year as disclosed in Note 45 to the Accounts.
(xix) To the best of our knowledge and according to the information and explanations given to us, no fraud by or on the Company has been noticed or reported during the year.
FOR DELOITTE HASKINS & SELLS
Chartered Accountants
(Registration No. 117366W)
P. R. RAMESH
Partner
Membership No. 70928
Mumbai
May 8, 2012
A N N E X U R E TO THE AUDITORS’ REPORT

I D F C A N N U A L R E P O R T 2 0 1 1 – 1 292
(` in crore)
NOTES AS AT MARCH 31, 2012 AS AT MARCH 31, 2012 AS AT MARCH 31, 2011E Q U I TY A N D L I A B I L I T I E S
Shareholders’ funds
(a) Share capital 4 1,512.36 2,300.95
(b) Reserves and surplus 5 10,627.61 8,765.05
12,139.97 11,066.00
Share application money pending allotment 6 0.60 4.14
Non-current liabilities
(a) Long-term borrowings 7 29,830.53 26,779.41
(b) Other long-term liabilities 8 136.12 49.08
(c) Long-term provisions 9 124.40 96.75
30,091.05 26,925.24
Current liabilities
(a) Short-term borrowings 10 7,351.01 1,686.99
(b) Trade payables 39 176.62 172.62
(c) Other current liabilities 11 10,505.54 8,746.51
(d) Short-term provisions 12 441.18 396.16
18,474.35 11,002.28
TOTAL 60,705.97 48,997.66 A S S E T S
Non-current assets
(a) Fixed assets
(i) Tangible assets 13(a) 309.93 334.58
(ii) Intangible assets 13(b) 4.26 7.39
(iii) Capital work-in-progress 0.16 0.51
(iv) Intangible assets under development - 0.13
314.35 342.61
(b) Non-current investments 14 3,474.75 3,717.97
(c) Deferred tax assets (net) 15 314.90 244.90
(d) Long-term loans and advances
(i) Loans 16 42,083.86 33,042.78
(ii) Others 17 396.12 895.84
42,479.98 33,938.62
(e) Other non-current assets 18 365.90 906.65
46,949.88 39,150.75
Current assets
(a) Current investments 19 5,010.96 4,389.45
(b) Trade receivables 20 371.46 11.09
(c) Cash and bank balances 21 589.82 467.54
(d) Short-term loans and advances
(i) Loans 16 6,100.72 4,604.84
(ii) Others 17 1,078.60 65.84
7,179.32 4,670.68
(e) Other current assets 18 604.53 308.15
13,756.09 9,846.91
TOTAL 60,705.97 48,997.66 See accompanying notes forming part of the financial statements.
B A L A N C E S H E E T AS AT MARCH 31,2012
IN TERMS OF OUR REPORT ATTACHED.
FOR DELOITTE HASKINS & SELLS FOR AND ON BEHALF OF THE BOARD OF DIRECTORS OF
Chartered Accountants INFRASTRUCTURE DEVELOPMENT FINANCE COMPANY LIMITED
P. R. RAMESH DEEPAK S. PAREKH RAJIV B. LALL
Partner Chairman Managing Director & CEO
SUNIL KAKAR MAHENDR A N. SH AH
Mumbai | May 8, 2012 Chief Financial Officer Company Secretary

93S T A N D A L O N E A C C O U N T S
(` in crore)
NOTES FOR THE YEAR ENDED MARCH 31, 2012
FOR THE YEAR ENDED MARCH 31, 2011
I I N C O M E
Revenue from operations 22 6,094.32 4,524.00
Other income 23 101.69 36.35
TOTAL I NCOM E (I) 6,196.01 4,560.35
I I E X P E N S E S
Employee benefits expense 24 152.39 106.62
Finance costs 25 3,455.23 2,386.52
Provisions and contingencies 26 283.85 234.94
Other expenses 27 71.90 69.13
Depreciation and amortisation expense 13(a) & (b) 31.28 32.70
TOTAL EXPENSE S (II) 3,994.65 2,829.91
I I I P R O F I T B E F O R E T A X ( I - I I ) 2,201.36 1,730.44
I V T A X E X P E N S E
Current tax 668.70 523.90
Current tax expense relating to prior years (0.30) -
Deferred tax 15 (70.00) (70.60)
TOTAL TAX EXPE NSE (IV) 598.40 453.30
V P R O F I T F O R T H E Y E A R ( I I I - I V ) 1,602.96 1,277.14
V I E A R N I N G S P E R E Q U I TY S H A R E (nominal value of share ̀ 10 each) 35
Basic (`) 10.57 8.74
Diluted (`) 10.54 8.68
See accompanying notes forming part of the financial statements.
S TAT E M E N T O F P R O F I T A N D L O S S FOR THE YEAR ENDED MARCH 31, 2012
IN TERMS OF OUR REPORT ATTACHED.
FOR DELOITTE HASKINS & SELLS FOR AND ON BEHALF OF THE BOARD OF DIRECTORS OF
Chartered Accountants INFRASTRUCTURE DEVELOPMENT FINANCE COMPANY LIMITED
P. R. RAMESH DEEPAK S. PAREKH RAJIV B. LALL
Partner Chairman Managing Director & CEO
SUNIL KAKAR MAHENDR A N. SH AH
Mumbai | May 8, 2012 Chief Financial Officer Company Secretary

I D F C A N N U A L R E P O R T 2 0 1 1 – 1 294
(` in crore)
NOTES FOR THE YEAR ENDED MARCH 31, 2012
FOR THE YEAR ENDED MARCH 31, 2012
FOR THE YEAR ENDED MARCH 31, 2011
A . C A S H F L OW F R O M O P E R AT I N G A CT I V I T I E S
Profit before tax 2,201.36 1,730.44
ADJUSTMENTS FOR:
Depreciation and amortisation expense 13(a) & (b) 31.28 32.70
Provision for employee benefits - (2.31)
Expense under the ESOS 24 4.31 16.75
Provisions and contingencies 26 283.85 234.94
(Gain) / loss on foreign currency revaluation 31.82 (7.42)
Profit on sale of investments in group companies
23 (89.00) (21.95)
Profit on sale of other investments (net) 22 (408.41) (252.18)
Utilisation of securities premium account (gross of tax)
(146.41) (243.44)
Amortisation of premium on investments 3.32 3.01
Profit on sale of fixed assets (net) 23 (4.38) (7.00)
(293.62) (246.90)
Operating profit before working capital changes 1,907.74 1,483.54
Changes in working capital:
ADJUSTMENTS FOR (INCREASE) / DECREASE IN OPERATING ASSETS
Trade receivables (3.25) 35.06
Long-term loans and advances 125.32 (115.40)
Short-term loans and advances (83.01) 3.96
Other current assets (313.35) (113.64)
Other non-current assets 39.75 (183.79)
ADJUSTMENTS FOR INCREASE / (DECREASE) IN OPERATING LIABILITIES
Trade payable (16.48) 18.81
Other current liabilities 342.66 288.67
Other long-term liabilities 87.04 27.35
178.68 (38.98)
Direct taxes paid (630.26) (422.75)
CASH GENERATE D FROM OPE RATIONS 1,456.16 1,021.81
Loans disbursed (net of repayments) (10,679.47) (12,673.35)
NET CASH USE D IN OPE RATING ACTIVITIE S (9,223.31) (11,651.54)
B . C A S H F L OW F R O M I N V E ST I N G A CT I V I T I E S
Purchase of fixed assets (including capital work-in-progress and intangible assets under development)
(3.88) (17.26)
Sale of fixed assets 5.24 11.40
Bank deposits matured / (placed) 225.00 (726.00)
Investments in subsidiaries (11.57) (34.60)
Investments in associates (83.80) -
Purchase of other investments (179,783.97) (186,786.45)
Sale proceeds of investments in subsidiaries and jointly controlled entities
297.79 65.29
Sale proceeds of other investments 179,316.22 186,251.30
NET CASH USED IN INVE STING ACTIVITIE S (38.97) (1,236.32)
C A S H F L O W S TAT E M E N T FOR THE YEAR ENDED MARCH 31, 2012

95S T A N D A L O N E A C C O U N T S
(` in crore)
NOTES FOR THE YEAR ENDED MARCH 31, 2012
FOR THE YEAR ENDED MARCH 31, 2012
FOR THE YEAR ENDED MARCH 31, 2011
C . C A S H F L OW F R O M F I N A N C I N G A CT I V I T I E S
Proceeds from fresh issue of shares (net of issue expenses)
15.63 3,505.24
Proceeds from borrowings (net of repayments) 9,494.41 9,793.41
Dividend paid (including dividend distribution tax) (410.96) (217.48)
NET CASH F ROM FINANCING ACTIVITIE S 9,099.08 13,081.17
Net increase / (decrease) in cash and cash equivalents (A+B+C)
(163.20) 193.31
Cash and cash equivalents as at the beginning of the year
21 224.58 31.27
Cash and cash equivalents as at the end of the year 21 61.38 224.58
(163.20) 193.31
See accompanying notes forming part of the financial statements.
C A S H F L O W S TAT E M E N T ( c o n t i n u e d ) FOR THE YEAR ENDED MARCH 31, 2012
IN TERMS OF OUR REPORT ATTACHED.
FOR DELOITTE HASKINS & SELLS FOR AND ON BEHALF OF THE BOARD OF DIRECTORS OF
Chartered Accountants INFRASTRUCTURE DEVELOPMENT FINANCE COMPANY LIMITED
P. R. RAMESH DEEPAK S. PAREKH RAJIV B. LALL
Partner Chairman Managing Director & CEO
SUNIL KAKAR MAHENDR A N. SH AH
Mumbai | May 8, 2012 Chief Financial Officer Company Secretary

I D F C A N N U A L R E P O R T 2 0 1 1 – 1 296
1 C O R P O R AT E I N F O R M AT I O N
Infrastructure Development Finance Company Limited ('the Company') is a public company incorporated in India and regulated by the Reserve Bank of India (RBI) as an Infrastructure Finance Company-Non Banking Finance Company (IFC-NBFC) engaged in financing infrastructure projects in sectors like energy, telecommunication, transportation, commercial and industrial projects including hospital, education, tourism and hotels.
2 B A S I S O F P R E PA R AT I O N
The financial statements of the Company have been prepared in accordance with the Generally Accepted Accounting Principles in India (Indian GAAP). The Company has prepared these financial statements to comply in all material respects with the Accounting Standards notified under the Companies (Accounting Standards) Rules, 2006, (as amended), the relevant provisions of the Companies Act, 1956 and the applicable guidelines issued by the RBI. The financial statements have been prepared on the accrual basis under the historical cost convention. The accounting policies adopted in the preparation of the financial statements are consistent with those followed in the previous year.
3 S I G N I F I C A N T A C C O U N T I N G P O L I C I E S
a . U S E O F E ST I M AT E S
The preparation of the financial statements in conformity with Indian GAAP requires the Management to make estimates and assumptions considered in the reported amounts of assets and liabilities (including contingent liabilities) and the reported income and expenses during the year. The Management believes that the estimates used in preparation of the financial statements are prudent and reasonable. Future results could differ due to these estimates and the differences between the actual results and the estimates are recognised in the periods in which the results are known / materialise.
b . C A S H A N D C A S H E Q U I VA L E N T S
Cash and cash equivalents for the purpose of the Cash Flow Statement comprises cash on hand, cash in bank, fixed deposits and other short-term highly liquid investments with an original maturity of three months or less that are readily convertible into known amount of cash and which are subject to an insignificant risk of change in value.
c . C A S H F L OW ST AT E M E N T
Cash flows are reported using the indirect method whereby cash flows from operating, investing and financing activities of the Company are segregated and profit before tax is adjusted for the effects of transactions of non-cash nature and any deferrals or accruals of past or future cash receipts or payments.
d . I N V E ST M E N T S
Investments which are readily realisable and intended to be held for not more than one year from the date on which such investments are made are classified as current investments in accordance with the RBI guidelines and Accounting Standard 13 on ‘Accounting for Investments’ as notified under the Companies (Accounting Standards) Rules, 2006. Current investments also include current maturities of long-term investments. All other investments are classified as long-term investments.
All investments are initially recorded at cost. The cost of an investment includes purchase price, directly attributable acquisition charges and reduced by recovery of costs, if any. On disposal of an investment, the difference between its carrying amount and the net disposal proceeds is charged or credited to the Statement of Profit and Loss.
Current investments are individually carried at the lower of cost and fair value / market value. Commercial papers, certificate of deposits and treasury bills are valued at carrying cost. Long-term investments are carried at acquisition cost. A provision is made for diminution other than temporary on an individual basis against long-term investments. Premium paid over the face value of a long-term investment is amortised over the life of the investment.
Inter-class transfer of investments from one category to the other, if any, is done in accordance with the RBI guidelines at the lower of book value and fair value / market value on the date of transfer.
e . L O A N S
In accordance with the RBI guidelines, all loans are classified under any of four categories i.e. (i) standard assets (ii) sub-standard assets (iii) doubtful assets and (iv) loss assets.
f . T A N G I B L E F I X E D A S S E T S
Fixed assets are stated at cost of acquisition, including any cost attributable for bringing the asset to its working condition, less accumulated depreciation. Profit or loss arising from derecognition of fixed assets are measured as difference between the net disposal proceeds and the cost of the assets less accumulated depreciation upto the date of disposal and are recognised in the Statement of Profit and Loss.
N O T E S T O F I N A N C I A L S TAT E M E N T S FOR THE YEAR ENDED MARCH 31, 2012

97S T A N D A L O N E A C C O U N T S
g . D E P R E C I AT I O N O N T A N G I B L E F I X E D A S S E T S
Depreciation on tangible fixed assets, excluding certain electronic items and leasehold improvements, is provided on the written down value method, at the rates prescribed in Schedule XIV to the Companies Act, 1956. Certain electronic items are depreciated over a period of two years on a straight-line method based on the Management’s estimate of the useful life of these assets. Depreciation on additions during the year is provided on a pro-rata basis. Assets costing less than ` 5,000 each are fully depreciated in the year of capitalisation. Depreciation in respect of leasehold improvements is provided on a straight-line method over the primary period of the lease.
h . I N T A N G I B L E A S S E T S A N D A M O R T I S AT I O N
Intangible assets comprising of computer software are stated at cost of acquisition, including any cost attributable for bringing the asset to its working condition, less accumulated amortisation. Any technology support cost or annual maintenance cost for such software is charged annually to the Statement of Profit and Loss. Intangible assets are being amortised over a period of three years on a straight-line method.
i . I M PA I R M E N T O F A S S E T S
The carrying amount of assets at each Balance Sheet date are reviewed for impairment. If any indication of impairment based on internal / external factors exists, the recoverable amount of such assets is estimated and impairment is recognised wherever the carrying amount of an asset exceeds its recoverable amount. The recoverable amount is the greater of the net selling price and its value in use, which is arrived at by discounting the future cash flows to their present value, based on an appropriate discounting factor. If at the Balance Sheet date, there is an indication that previously recognised impairment loss no longer exists, the recoverable amount is reassessed and the asset is reflected at the recoverable amount subject to a maximum of the depreciable historical cost and reversal of such impairment loss is recognised in the Statement of Profit and Loss, except in case of revalued assets.
j . E X P E N S E U N D E R E M P L O Y E E ST O C K O PT I O N S C H E M E S
The Company has formulated Employee Stock Option Schemes (‘the ESOS’) in accordance with the SEBI (Employee Stock Option Scheme and Employee Stock Purchase Scheme) Guidelines, 1999 (‘the Guidelines’). The ESOS provides for grant of stock options to employees (including employees of subsidiary companies) to acquire equity shares of the Company that vest in a graded manner and that are to be exercised within a specified period. In accordance with the Guidelines and the Guidance Note on ‘Accounting for Employees Share-based Payments’ issued by the Institute of Chartered Accountants of India, the excess, if any, of the closing market price on the day prior to the date of grant of the stock options under the ESOS over the exercise price is amortised on a straight-line method over the vesting period and is charged to the Statement of Profit and Loss as employee benefits expense.
k . E M P L O Y E E B E N E F I T S
�¬ Defined contribution plans
The Company’s contribution to provident fund, superannuation fund and pension fund are considered as defined contribution plans and are charged to the Statement of Profit and Loss as they fall due, based on the amount of contribution required to be made.
�¬ Defined benefit plan
The net present value of the Company’s obligation towards gratuity to employees is funded and actuarially determined as at the Balance Sheet date based on the projected unit credit method. Actuarial gains and losses are recognised in the Statement of Profit and Loss for the year.
�¬ Compensated absences
Based on the leave rules of the Company, employees are not permitted to accumulate leave. Any unavailed privilege leave to the extent encashable is paid to the employees and charged to the Statement of Profit and Loss for the year.
l . B O R R OW I N G C O ST S
Borrowing costs include interest, amortisation of ancillary costs incurred and exchange differences arising from foreign currency borrowings to the extent they are regarded as an adjustment to the interest cost. Interest cost in connection with the borrowing of funds to the extent not directly related to the acquisition of qualifying assets are charged to the Statement of Profit and Loss over the tenure of the loan. Ancillary costs in connection with long-term external commercial borrowings are amortised to the Statement of Profit and Loss over the tenure of the loan. Issue expenses of certain securities are charged to the securities premium account as stated in note 3(t).
m . R E V E N U E R E C O G N I T I O N
Revenue is recognised to the extent that it is probable that the economic benefits will flow to the Company and the revenue can be reliably measured. In addition, the following criteria must also be met before revenue is recognised:
�¬ Interest and other dues are accounted on accrual basis except in the case of non-performing loans where it is recognised upon realisation, as per the income recognition and asset classification norms prescribed by the RBI.
N O T E S T O F I N A N C I A L S TAT E M E N T S FOR THE YEAR ENDED MARCH 31, 2012

I D F C A N N U A L R E P O R T 2 0 1 1 – 1 298
�¬ Income on discounted instruments is recognised over the tenure of the instrument on a straight-line method.
�¬ Dividend is accounted when the right to receive is established.
�¬ Front end fees on processing of loans are recognised upfront as income.
�¬ Underwriting commission earned to the extent not reduced from the cost of acquisition of securities is recognised as fees on closure of issue.
�¬ All other fees are recognised when reasonable right of recovery is established, revenue can be reliably measured and as and when they become due except commission income on guarantees which is recognised pro-rata over the period of the guarantee.
�¬ Premium on interest rate reduction is accounted on accrual basis over the residual life of the loan.
�¬ Profit / loss on sale of investments is recognised on trade date basis. Profit / loss on sale of investments is determined based on the ‘first in first out’ cost for current investments and weighted average cost for long-term investments.
�¬ Profit / loss on sale of loan assets through direct assignment, without any recourse obligation, is recognised at the time of sale. Profit on securitisation is recognised over the residual life of the pass through certificate in terms of the RBI guidelines. Loss arising on account of securitisation is recognised at the time of sale.
�¬ Revenue from power supply is accounted on accrual basis.
�¬ Income from trading in derivatives is recognised on final settlement or squaring-up of the contracts.
n . L E A S E S
Where the Company is lessee
Leases under which all the risks and benefits of ownership are effectively retained by the lessor are classified as operating leases. Amount due under the operating leases are charged to the Statement of Profit and Loss, on a straight-line method over the lease term in accordance with Accounting Standard 19 on ‘Leases’ as notified under the Companies (Accounting Standards) Rules, 2006. Initial direct costs incurred specifically for operating leases are recognised as expense in the year in which they are incurred.
Where the Company is lessor
Leases under which the Company does not transfer substantially all the risks and benefits of ownership of the asset are classified as operating leases. Assets subject to operating leases are included in fixed assets. Lease income in respect of operating leases is recognised in the Statement of Profit and Loss on a straight-line method over the lease term in accordance with Accounting Standard 19 on ‘Leases’ as notified under the Companies (Accounting Standards) Rules, 2006. Maintenance costs including depreciation are recognised as an expense in the Statement of Profit and Loss.
o . E A R N I N G S P E R S H A R E
Basic earnings per share is computed by dividing the profit after tax by the weighted average number of equity shares outstanding during the year. Diluted earnings per share is computed by dividing the profit after tax as adjusted for dividend, interest and other charges to expense or income relating to the dilutive potential equity shares, by the weighted average number of equity shares considered for deriving basic earnings per share and the weighted average number of equity shares which could have been issued on the conversion of all dilutive potential equity shares. Potential equity shares are deemed to be dilutive only if their conversion to equity shares would decrease the net profit per share from continuing ordinary operations. Potential dilutive equity shares are deemed to be converted as at the beginning of the year, unless they have been issued at a later date. The dilutive potential equity shares are adjusted for the proceeds receivable had the shares been actually issued at fair value (i.e. average market value of the outstanding shares). Dilutive potential equity shares are determined independently for each year.
p . T A X E S O N I N C O M E
Current tax is the amount of tax payable on the taxable income for the year as determined in accordance with the provisions of the Income-tax Act, 1961.
Deferred tax is recognised on timing differences, being the differences between the taxable income and the accounting income that originate in one period and are capable of reversal in one or more subsequent periods. Deferred tax is measured using the tax rates and the tax laws enacted or substantially enacted as at the Balance Sheet date. Deferred tax liabilities are recognised for all timing differences. Deferred tax assets in respect of unabsorbed depreciation and carry forward of losses are recognised only if there is virtual certainty that there will be sufficient future taxable income available to realise such assets. Deferred tax assets are recognised for timing differences of other items only to the extent that reasonable certainty exists that sufficient future taxable income will be available against which these can be realised. Deferred tax assets and liabilities are offset if such items relate to taxes on income levied by the same governing tax laws and the Company has a legally enforceable right for such set off. Deferred tax assets are reviewed at each Balance Sheet date for their realisability. Current and deferred tax relating to items directly recognised in reserves are recognised in reserves and not in the Statement of Profit and Loss.
N O T E S T O F I N A N C I A L S TAT E M E N T S FOR THE YEAR ENDED MARCH 31, 2012

99S T A N D A L O N E A C C O U N T S
q . D E R I VAT I V E C O N T R A CT S
�¬ Interest rate swaps
Interest rate swaps are booked with the objective of managing the interest rate risk on liabilities. Interest rate swaps in the nature of hedge are recorded on accrual basis and these transactions are not marked-to-market. Any resultant profit or loss on termination of the hedge swaps is amortised over the life of the swap or underlying asset / liability, whichever is shorter.
�¬ Currency Interest rate swaps
Currency interest rate swaps in the nature of hedge, booked with the objective of managing the currency and interest rate risk on foreign currency liabilities are recorded on accrual basis and these transactions are not marked-to-market. Any resultant profit or loss on termination of hedge swaps is amortised over the life of swap or underlying asset / liability, whichever is shorter. The foreign currency balances on account of principal of currency interest rate swaps outstanding as at the Balance Sheet date are revalued using the closing rate.
�¬ Stock Futures
Stock Futures are marked-to-market on a daily basis. The debit or credit balance in the ‘Mark-to-market margin – stock futures account’ disclosed under loans and advances or current liabilities represents the net amount paid or received on the basis of the movement in the prices of stock futures till the Balance Sheet date.
Credit balance in the ‘Mark-to-market margin – stock futures account’ in the nature of anticipated profit is ignored and no credit is taken to the Statement of Profit and Loss. However, the debit balance in the ‘Mark-to-market margin – stock futures account’ in the nature of anticipated loss is recognised in the Statement of Profit and Loss.
On final settlement or squaring-up of contracts for stock futures, the profit or loss is calculated as the difference between the settlement / squaring-up price and the contract price. Accordingly, debit or credit balance pertaining to the settled / squared-up contract in ‘Mark-to-market margin – stock futures account’ is recognised in the Statement of Profit and Loss upon expiry of the contracts. When more than one contract in respect of the relevant series of stock futures contract, to which the squared-up contract pertains is outstanding at the time of the squaring-up of the contract, the contract price of such contract is determined using the weighted average method for calculating profit / loss on squaring-up.
‘Initial margin account – stock futures’ representing initial margin paid is disclosed under loans and advances.
r . F O R E I G N C U R R E N C Y T R A N S A CT I O N S A N D T R A N S L AT I O N S
Foreign currency transactions are accounted at the exchange rates prevailing on the date of the transaction. Foreign currency monetary items outstanding as at the Balance Sheet date are reported using the closing rate. Gain or loss resulting from the settlement of such transactions and translation of monetary assets and liabilities denominated in foreign currencies are recognised in the Statement of Profit and Loss. Premium in respect of forward contracts is accounted over the period of the contract. Forward contracts outstanding as at the Balance Sheet date are revalued at the closing rate.
s . P R O V I S I O N S A N D C O N T I N G E N C I E S
Provision against loans�¬ Provision is made in accordance with the RBI guidelines applicable to non-performing loans. In addition, provision is made in accordance with the
provisioning policy of the Company against non-performing loans.�¬ Provision on restructured loans is computed in accordance with the RBI guidelines.�¬ Provision for contingencies is made as per the provisioning policy of the Company which includes provision under Section 36(1)(viia) of the
Income-tax Act, 1961.�¬ A general provision is made at 0.25% of the outstanding standard assets in accordance with the RBI guidelines.
Other provisions�¬ A provision is recognised when the Company has a present obligation as a result of past events and it is probable that an outflow of resources
will be required to settle the obligation in respect of which a reliable estimate can be made. Provisions (excluding retirement benefits) are not discounted to their present value and are determined based on the best estimate required to settle the obligation as at the Balance Sheet date. These are reviewed at each Balance Sheet date and adjusted to reflect the current best estimates. Contingent liabilities are disclosed separately.
t . S E C U R I T I E S I S S U E E X P E N S E S
Issue expenses of certain securities and redemption premium are adjusted against the securities premium account as permissible under Section 78(2) of the Companies Act, 1956, to the extent balance is available for utilisation in the securities premium account.
u . S E R V I C E T A X I N P UT C R E D I T
Service tax input credit is accounted in the period in which the underlying services are received and when there is no uncertainty in availing / utilising the credits.
N O T E S T O F I N A N C I A L S TAT E M E N T S FOR THE YEAR ENDED MARCH 31, 2012

I D F C A N N U A L R E P O R T 2 0 1 1 – 1 2100
4 S H A R E C A P I TA L
AS AT MARCH 31, 2012 AS AT MARCH 31, 2011
NUMBER (` in crore) NUMBER (` in crore)
AUTHO RI SED
Equity shares of `10 each 4,000,000,000 4,000.00 4,000,000,000 4,000.00
Preference shares of `100 each 100,000,000 1,000.00 100,000,000 1,000.00
5,000.00 5,000.00
I SSUED, SUBSCRI BED & FU LLY PAID-U P
Equity shares of `10 each 1,512,362,768 1,512.36 1,460,947,548 1,460.95
6.00% Compulsorily convertible cumulative preference shares (CCCPS) of `100 each - - 84,000,000 840.00
TOTAL I SSUED, SUBSCRIBE D AND FU LLY PAID-U P SHARE CA PITA L 1,512.36 2,300.95
(a) RECONCILIATION OF THE NUMBER OF SHARES AND AMOUNT OUTSTANDING AS AT THE BEGINNING AND AT THE END OF THE YEAR
AS AT MARCH 31, 2012 AS AT MARCH 31, 2011
EQUITY SHARES NUMBER (` in crore) NUMBER (` in crore)
Outstanding as at the beginning of the year 1,460,947,548 1,460.95 1,300,612,393 1,300.61
Issued during the year – stock options exercised under the ESOS 3,687,948 3.69 2,583,065 2.59
Issued during the year – conversion of CCCPS into equity shares [see note (c)] 47,727,272 47.72 - -
Issued during the year – Qualified Institutional Placement - - 157,752,090 157.75
Outstanding as at the end of the year 1,512,362,768 1,512.36 1,460,947,548 1,460.95
AS AT MARCH 31, 2012 AS AT MARCH 31, 2011
PREFERENCE SHARES NUMBER (` in crore) NUMBER (` in crore)
Outstanding as at the beginning of the year 84,000,000 840.00 - -
Issued during the year [see note (c)] - - 84,000,000 840.00
Converted to equity shares during the year [see note (c)] 84,000,000 840.00 - -
Outstanding as at the end of the year - - 84,000,000 840.00
(b) TERMS / RIGHTS ATTACHED TO EQUITY SHARES
The Company has only one class of equity shares having a par value of ` 10 per share. Each holder of equity shares is entitled to one vote per share and
ranks pari passu. The dividend proposed by the Board of Directors is subject to approval of the shareholders at the ensuing Annual General Meeting.
During the year ended March 31, 2012, dividend of ` 2.30 per share (Previous Year ` 2.00 per share) is recognised as amount distributable to equity
shareholders.
In the event of liquidation of the Company, the holders of equity shares will be entitled to receive any of the remaining assets of the Company after
distribution of all preferential amounts. The distribution will be in proportion to the number of equity shares held by the shareholders.
(c) TERMS / RIGHTS ATTACHED TO PREFERENCE SHARES
The Company had raised ` 840.00 crore through the issue of CCCPS during the year ended March 31, 2011. The preference shares were convertible at
any time into equity shares of face value of ` 10 each until the date falling 18 months from the date of issuance of the preference shares, at the option
of the holders, at ` 176 per equity share and carry dividend @ 6% p.a. During the year ended March 31, 2012, the preference shares were converted
into 47,727,272 equity shares of ` 10 each at a premium of ` 166 per equity share.
(d) DETAILS OF SHAREHOLDERS HOLDING MORE THAN 5% OF THE SHARES IN THE COMPANY
AS AT MARCH 31, 2012 AS AT MARCH 31, 2011
EQUITY SHARES NUMBER % OF HOLDING NUMBER % OF HOLDING
President of India 261,400,000 17.28 261,400,000 17.89
Sipadan Investments (Mauritius) Limited 151,145,989 9.99 116,755,080 7.99
AS AT MARCH 31, 2012 AS AT MARCH 31, 2011
PREFERENCE SHARES NUMBER % OF HOLDING NUMBER % OF HOLDING
Actis Hawk Limited - - 46,000,000 54.76
Sipadan Investments (Mauritius) Limited - - 38,000,000 45.24
N O T E S T O F I N A N C I A L S TAT E M E N T S FOR THE YEAR ENDED MARCH 31, 2012

101S T A N D A L O N E A C C O U N T S
(e) SHARES RESERVED FOR ISSUE UNDER STOCK OPTIONS
Refer to note (f) for details of shares reserved for issue under the ESOS of the Company and refer to note (c) for details regarding the terms of
conversion of CCCPS.
(f) MOVEMENT IN STOCK OPTIONS GRANTED UNDER THE ESOS IS AS UNDER:
FOR THE YEAR ENDED MARCH 31, 2012
FOR THE YEAR ENDED MARCH 31, 2011
NUMBER NUMBER
Outstanding as at the beginning of the year 20,750,721 16,548,268
Add: Granted during the year 22,248,000 7,459,308
Less: Exercised during the year 3,687,948 2,583,065
Less: Lapsed / forfeited during the year 1,340,668 673,790
Outstanding as at the end of the year 37,970,105 20,750,721
5 R E S E R V E S A N D S U R P L U S
AS AT MARCH 31, 2012 AS AT MARCH 31, 2011
(` in crore) (` in crore)
(a) SECURI TI ES PRE MIU M ACCOUNT
Opening balance 4,515.93 2,191.43
Add: Premium on issue of equity shares - 2,496.43
Add: Premium on conversion of CCCPS into equity shares [see note 4(c)] 792.27 -
Add: Premium on exercise of stock options under the ESOS 17.18 19.51
Less: Premium utilised during the year [see note 3(t)]
[net of current tax of ` 38.00 crore (Previous Year ` 61.10 crore)]
108.41 191.44
Closing balance 5,216.97 4,515.93
(b ) STOCK OPTI ONS OUTSTANDING [see note 4(f)]
Opening balance 31.29 20.36
Add: Net charge for the year (see note 24) 4.31 16.75
Less: Stock options exercised 1.70 5.82
Closing balance 33.90 31.29
(c) DEBENTURE REDE MPTION RE SE RVE
Opening balance 72.60 -
Add: Transfer from surplus in the Statement of Profit and Loss 142.00 72.60
Closing balance 214.60 72.60
Debenture redemption reserve has been created in accordance with Section 117C of the Companies Act, 1956 in respect of the public issues of
long-term Infrastructure Bonds.
(d) SPECI AL RESERVE U /S. 3 6 (1)(viii) OF THE INCOME -TAX ACT, 1961
Opening balance 1,160.25 914.25
Add: Transfer from surplus in the Statement of Profit and Loss 390.00 246.00
Closing balance 1,550.25 1,160.25
(e) SPECI AL RESERVE U /S. 4 5 -IC OF THE RBI ACT, 1 9 3 4
Opening balance 1,193.50 937.50
Add: Transfer from surplus in the Statement of Profit and Loss 321.10 256.00
Closing balance 1,514.60 1,193.50
(f) GENERAL RESERVE
Opening balance 291.37 195.58
Add: Transfer from surplus in the Statement of Profit and Loss 160.30 95.79
Closing balance 451.67 291.37
N O T E S T O F I N A N C I A L S TAT E M E N T S FOR THE YEAR ENDED MARCH 31, 2012

I D F C A N N U A L R E P O R T 2 0 1 1 – 1 2102
AS AT MARCH 31, 2012 AS AT MARCH 31, 2011
(` in crore) (` in crore)
(g) SURPLUS I N THE STATE ME NT OF PROFIT AND LOSS
Opening balance 1,500.11 1,263.12
Profit for the year 1,602.96 1,277.14
LESS: APPRO PRIATIONS
TRANSF ERS TO RE SE RVE S:
Debenture redemption reserve 142.00 72.60
Special reserve u/s. 36(1)(viii) of the Income-tax Act, 1961 390.00 246.00
Special reserve u/s. 45-IC of the RBI Act, 1934 321.10 256.00
General reserve 160.30 95.79
DI VI DEND & DIVIDE ND DISTRIBUTION TAX:
Proposed dividend on equity shares 347.87 292.36
[` 2.30 per share (Previous Year ` 2.00 per share)]
Dividend paid on preference shares 43.63 -
[` 5.19 per share (Previous Year ` Nil per share)]
Proposed dividend on preference shares - 32.17
[` Nil per share (Previous Year ` 3.83 per share)]
Dividend on equity shares pertaining to previous year [see note (i)] 0.24 0.15
Tax on proposed equity dividend [see note (ii)] 46.49 39.84
Tax on equity dividend for previous year [see note (i)] 0.04 0.02
Tax on preference dividend [see note (ii)] 5.78 5.22
TOTAL APPRO PRIATIONS 1,457.45 1,040.15
Closing balance 1,645.62 1,500.11
TOTAL RESERVE S AND SU RPLUS 10,627.61 8,765.05
(i) In respect of equity shares issued pursuant to exercise of stock options under the ESOS, the Company paid dividend of ` 0.24 crore for the year
2010-11 (Previous Year ` 0.15 crore for the year 2009-10) and tax on dividend of ` 0.04 crore (Previous Year ` 0.02 crore) as approved by the
shareholders at the respective Annual General Meetings.
(ii) Tax on proposed dividend for the year is net of dividend distribution tax of ` 11.24 crore (Previous Year ` 7.60 crore) paid by the subsidiary companies
under Section 115-O of the Income-tax Act, 1961.
6 S H A R E A P P L I C AT I O N M O N E Y P E N D I N G A L L O T M E N T
Share application money pending allotment represents applications received from employees on exercise of stock options granted and vested under the
ESOS.
AS AT MARCH 31, 2012 AS AT MARCH 31, 2011
NUMBER (` in crore) NUMBER (` in crore)
Equity shares of face value ` 10 each proposed to be issued 103,682 0.10 865,692 0.86
Total amount of securities premium - 0.50 - 3.28
0.60 4.14
The equity shares are expected to be allotted against the share application money within a reasonable period, not later than three months from the Balance
Sheet date.
N O T E S T O F I N A N C I A L S TAT E M E N T S FOR THE YEAR ENDED MARCH 31, 2012

103S T A N D A L O N E A C C O U N T S
7 L O N G -T E R M B O R R O W I N G S
AS AT MARCH 31, 2012 AS AT MARCH 31, 2011
(` in crore) (` in crore)
NON-CURRENT PORTION
CURRENT MATURITIES
NON-CURRENT PORTION
CURRENT MATURITIES
DEBENTURES (NON CONVE RTIBLE ) (SE CU RE D) [see note (a) & 41]
Face value 23,297.92 7,844.00 18,978.46 5,804.00
Less: Unexpired discount on zero per cent debentures [see note (c)] 191.57 17.26 202.38 78.78
23,106.35 7,826.74 18,776.08 5,725.22
TERM LOANS (SECURE D) [see note (a) ]
From banks (see note 42) 4,237.62 785.57 6,049.04 1,998.16
From others (see note 43) 1,836.56 634.93 1,304.29 107.49
6,074.18 1,420.50 7,353.33 2,105.65
SUBORDI NATED DEBT FROM THE GOVE RNME NT OF INDIA (UNSECURED) (see note 44)
650.00 - 650.00 -
AM OUNT DI SCLOSED U NDE R ‘OTHE R CU RRE NT LIABILITIE S’ (see note 11) - (9,247.24) - (7,830.87)
TOTAL LO NG-TERM BORROWINGS 29,830.53 - 26,779.41 -
The above amount includes
Secured borrowings 29,180.53 9,247.24 26,129.41 7,830.87
Unsecured borrowings 650.00 - 650.00 -
TOTAL 29,830.53 9,247.24 26,779.41 7,830.87
(a) Borrowings of ` 38,427.77 crore (Previous Year ` 33,960.28 crore) are secured by way of a first floating pari passu charge over investments, current
assets and loans and advances excluding investments in and other receivables from subsidiaries and affiliates.
(b) In terms of the RBI circular (Ref. No. DNBS (PD) CC No. 225 / 03.02.001 / 2011-12 dated July 1, 2011) no borrowings remained overdue as on March 31,
2012 (Previous Year ` Nil).
(c) Unexpired discount is net of ` 117.72 crore (Previous Year ` 227.96 crore) towards interest accrued but not due.
8 O T H E R L O N G -T E R M L I A B I L I T I E S
AS AT MARCH 31, 2012 AS AT MARCH 31, 2011
(` in crore) (` in crore)
Trade payables (see note 39) - 23.47
Lease equalisation (see note 34) 3.98 3.68
Interest accrued but not due on borrowings 126.67 14.83
Income received in advance (unearned revenue) 4.83 6.46
Security deposit 0.64 0.64
TOTAL 136.12 49.08
N O T E S T O F I N A N C I A L S TAT E M E N T S FOR THE YEAR ENDED MARCH 31, 2012

I D F C A N N U A L R E P O R T 2 0 1 1 – 1 2104
1 0 S H O R T-T E R M B O R R O W I N G S
AS AT MARCH 31, 2012 AS AT MARCH 31, 2011
(` in crore) (` in crore)
TERM LOANS (SECURE D) [see note (a)]
From banks 3,606.09 1,225.00
COLLATERALI SED BORROWINGS AND LE NDING OBLIGATIONS ( C BLO) [see note (b)] 499.38 249.73
COM M ERCI AL PAPERS (U NSE CU RE D)
Face value 3,132.00 210.00
Less: Unexpired discount [see note (c)] 136.44 3.65
2,995.56 206.35
CASH CREDI T / BANK OVE RDRAFT (SE CU RE D) [see note (a)] 249.98 -
CASH CREDI T / BANK OVE RDRAFT (U NSE CU RE D) - 5.91
TOTAL SHORT-TERM BORROWINGS 7,351.01 1,686.99
The above amount includes
Secured borrowings 4,355.45 1,474.73
Unsecured borrowings 2,995.56 212.26
TOTAL 7,351.01 1,686.99
(a) Borrowings of ` 3,856.07 crore (Previous Year ` 1,225.00 crore) are secured by way of a first floating pari passu charge over investments, current assets
and loans & advances excluding investments in and other receivables from subsidiaries and affiliates.
(b) Borrowings under CBLO is secured against investments in Government securities.
(c) Unexpired discount on commercial papers is net of ` 100.27 crore (Previous Year ` 7.74 crore) towards interest accrued but not due.
(d) In terms of the RBI circular (Ref. No. DNBS (PD) CC No. 225 / 03.02.001 / 2011-12 dated July 1, 2011) no borrowings remained overdue as on March 31,
2012 (Previous Year ` Nil).
N O T E S T O F I N A N C I A L S TAT E M E N T S FOR THE YEAR ENDED MARCH 31, 2012
9 L O N G -T E R M P R O V I S I O N S
AS AT MARCH 31, 2012 AS AT MARCH 31, 2011
(` in crore) (` in crore)
Contingent provision against standard assets [see note (a) & (b)] 124.40 96.75
TOTAL 124.40 96.75
(a) A contingent provision against standard assets has been created at 0.25% of the outstanding standard assets in terms of the RBI circular (Ref. No.
DNBS (PD) CC No. 225 / 03.02.001 / 2011-12 dated July 1, 2011).
(b) Movement in contingent provision against standard assets during the year is as under:
Opening balance 96.75 -
Additions during the year 27.65 96.75
Closing balance 124.40 96.75

105S T A N D A L O N E A C C O U N T S
1 2 S H O R T-T E R M P R O V I S I O N S
AS AT MARCH 31, 2012 AS AT MARCH 31, 2011
(` in crore) (` in crore)
Provision for income tax 38.03 25.90
[Net of advance payment of tax of ` 1,148.53 crore
(Previous Year ` 530.54 crore)]
Provision for wealth tax 0.27 0.28
[Net of advance payment of tax of ` 1.57 crore
(Previous Year ` 1.43 crore)]
Provision for fringe benefit tax 0.20 0.39
[Net of advance payment of tax of ` 11.10 crore
(Previous Year ` 16.59 crore)]
Proposed equity dividend [see note 4(b)] 347.87 292.36
Proposed preference dividend - 32.17
Tax on proposed equity dividend 54.81 39.84
Tax on proposed preference dividend - 5.22
TOTAL 441.18 396.16
N O T E S T O F I N A N C I A L S TAT E M E N T S FOR THE YEAR ENDED MARCH 31, 2012
1 1 O T H E R C U R R E N T L I A B I L I T I E S
AS AT MARCH 31, 2012 AS AT MARCH 31, 2011
(` in crore) (` in crore)
Current maturities of long-term borrowings (see note 7) 9,247.24 7,830.87
Interest accrued but not due on borrowings 1,217.56 878.30
Income and other amounts received in advance 19.09 24.12
Unclaimed dividend [see note (a)] 1.22 0.96
Unclaimed interest [see note (a)] 5.22 -
Security deposit 8.33 -
Other payables
Statutory dues 4.21 5.48
Advance against sale - 2.42
Other amounts received in advance 2.67 4.36
6.88 12.26
TOTAL 10,505.54 8,746.51
(a) No amount of unclaimed dividend and unclaimed interest was due for transfer to the Investor Education and Protection Fund under Section 205C of
the Companies Act, 1956 as at the Balance Sheet date.

I D F C A N N U A L R E P O R T 2 0 1 1 – 1 2106
N O T E S T O F I N A N C I A L S TAT E M E N T S FOR THE YEAR ENDED MARCH 31, 2012
1 3 ( a ) TA N G I B L E A S S E T S
GROSS BLOCK ACCUMULATED DEPRECIATION NET BLOCK
(` in crore) (` in crore) (` in crore)
Bal
ance
as
at
Apr
il 1
, 201
1
Add
itio
ns
Dis
posa
ls
Bal
ance
as
at
Mar
ch 3
1, 2
012
Bal
ance
as
at
Apr
il 1
, 201
1
Dep
reci
atio
n
char
ge fo
r
the
year
On
dis
posa
ls
Bal
ance
as
at
Mar
ch 3
1, 2
012
Bal
ance
as
at
Mar
ch 3
1, 2
012
Bal
ance
as
at
Mar
ch 3
1, 2
011
Buildings
Own use 275.57 0.19 1.48 274.28 31.10 12.20 0.70 42.60 231.68 244.47
Under operating lease [see note 34(iii)] 18.81 - - 18.81 9.19 0.48 - 9.67 9.14 9.62
Leasehold improvements 5.72 0.77 - 6.49 2.28 1.49 - 3.77 2.72 3.44
Furniture and fixtures
Own use 9.34 0.33 0.03 9.64 3.99 0.95 0.03 4.91 4.73 5.35
Under operating lease [see note 34(iii)] 0.42 - - 0.42 0.11 0.02 - 0.13 0.29 0.31
Vehicles 0.88 0.47 0.42 0.93 0.59 0.15 0.36 0.38 0.55 0.29
Office equipment
Own use 8.35 0.62 0.02 8.95 2.58 1.06 0.01 3.63 5.32 5.77
Under operating lease [see note 34(iii)] 0.02 - - 0.02 0.02 ß - 0.02 - -
Computers 9.69 1.36 0.05 11.00 6.18 1.70 0.04 7.84 3.16 3.51
Windmills 101.25 - - 101.25 39.43 9.48 - 48.91 52.34 61.82
TOTAL 430.05 3.74 2.00 431.79 95.47 27.53 1.14 121.86 309.93 334.58
Previous Year 425.97 14.14 10.06 430.05 71.56 29.66 5.75 95.47 334.58
Buildings include ` 500 (Previous Year ` 500) being the cost of unquoted fully paid shares held in co-operative housing societies.
1 3 ( b ) I N TA N G I B L E A S S E T S
GROSS BLOCK ACCUMULATED AMORTISATION NET BLOCK
(` in crore) (` in crore) (` in crore)
Bal
ance
as
at
Apr
il 1
, 201
1
Add
itio
ns
Dis
posa
ls
Bal
ance
as
at
Mar
ch 3
1, 2
012
Bal
ance
as
at
Apr
il 1
, 201
1
Am
orti
sati
on
char
ge fo
r
the
year
On
dis
posa
ls
Bal
ance
as
at
Mar
ch 3
1, 2
012
Bal
ance
as
at
Mar
ch 3
1, 2
012
Bal
ance
as
at
Mar
ch 3
1, 2
011
Computer software 11.63 0.62 - 12.25 4.24 3.75 - 7.99 4.26 7.39
TOTAL 11.63 0.62 - 12.25 4.24 3.75 - 7.99 4.26 7.39
Previous Year 7.29 7.12 2.78 11.63 3.88 3.04 2.68 4.24 7.39
TOTAL TANGIBLE AND INTANGIBLE ASSETS 441.68 4.36 2.00 444.04 99.71 31.28 1.14 129.85 314.19 341.97
Previous Year 433.26 21.26 12.84 441.68 75.44 32.70 8.43 99.71 341.97

107S T A N D A L O N E A C C O U N T S
1 4 N O N - C U R R E N T I N V E S T M E N T S ( AT C O S T )
AS AT MARCH 31, 2012 AS AT MARCH 31, 2011 FACE
VALUE (`)QUANTITY (` in crore) QUANTITY (` in crore)
TRADE I NVESTM ENTS
E QUI TY SHARES (FU LLY PAID) [see note (c) & (d)]
INVESTM ENT I N SUBSIDIARIE S (U NQUOTE D)
IDFC Asset Management Company Limited 10 2,009,283 629.49 2,009,283 630.92
IDFC AMC Trustee Company Limited 10 37,499 0.05 37,499 0.05
IDFC Finance Limited 10 21,000,200 21.00 21,000,200 21.00
IDFC Foundation 10 8,050,000 8.05 50,000 0.05
IDFC Pension Fund Management Company Limited 10 5,999,999 6.00 5,999,999 6.00
IDFC PPP Trusteeship Company Limited 10 - - 50,000 0.05
IDFC Primary Dealership Company Limited 10 5,000,000 5.00 - -
IDFC Private Equity Company Limited 10 50,000 0.05 50,000 0.05
IDFC Project Equity Company Limited 10 50,000 0.05 50,000 0.05
IDFC Projects Limited 10 34,050,000 34.07 34,050,000 34.07
IDFC Securities Limited 10 14,137,200 440.10 14,137,200 440.10
IDFC Trustee Company Limited 10 50,000 0.05 50,000 0.05
Uniquest Infra Ventures Private Limited 10 - - 10,000 0.01 INVESTM ENT I N ASSOCIATE S (U NQUOTE D)
Feedback Infrastructure Services Private Limited 10 4,026,689 20.09 4,026,689 20.09
(formerly Feedback Ventures Private Limited)
1,164.00 1,152.49 NO N-TRADE I NVESTME NTSINVESTM ENT I N EQU ITY SHARE S (QUOTE D) (FU LLY PAID)
Adani Port and Special Economic Zone Limited (formerly Mundra Port and Special Economic Zone Limited)
2 86,014 1.21 - -
Andhra Cements Limited 10 28,784,722 55.03 15,760,611 40.24
Bharti Airtel Limited 5 466,800 1.05 466,800 1.05
DQ Entertainment (International) Limited 10 258,097 1.76 258,097 1.76
Gateway Distriparks Limited 10 46,519 0.70 - -
Godrej Properties Limited 10 - - 423,791 20.76
IRB Infrastructure Developers Limited 10 82,683 1.33 - -
Jaypee Infratech Limited 10 3,791,842 38.68 3,791,842 38.68
JSW Energy Limited 10 2,394,595 23.94 2,394,595 23.94
KSK Energy Ventures Limited 10 3,125,000 75.00 3,125,000 75.00
Lanco Infratech Limited 1 4,600,000 9.92 - -
Larsen & Toubro Limited 2 84,678 10.29 - -
Nava Bharat Ventures Limited 2 61,838 1.20 - -
PTC India Limited 10 470,000 2.49 - -
Sanghvi Movers Limited 2 76,695 0.81 - -
Sarda Energy & Minerals Limited 10 1,842,105 35.00 1,842,105 35.00
SJVN Limited 10 6,447,279 16.76 6,447,279 16.76
Tata Consultancy Services Limited 1 - - 62,055 0.04
Torrent Power Limited 10 3,900,000 28.08 3,900,000 28.08
Tulip Telecom Limited 2 56,075 0.83 - -
VA Tech Wabag Limited 2 95,975 4.73 38,390 4.73
(face value changed from ` 5 to ` 2 per share during the year)
308.81 286.04 I NVESTM ENT I N EQU ITY SHARE S (U NQUOTE D) (FU LLY PAID)
Asset Reconstruction Company (India) Limited 10 27,197,743 113.77 27,197,743 113.77
Asia Bio Energy (India) Limited 10 2,500,000 2.50 2,500,000 2.50
Athena Energy Ventures Private Limited 10 50,000,000 50.00 50,000,000 50.00
Avantika Gas Limited 10 3,500 ß 3,500 ß
BSCPL Infrastructure Limited 10 436,300 25.00 436,300 25.00
Delhi Mumbai Industrial Corridor Development Corporation Limited
10 - - 1,000,000 1.00
Ennore SEZ Company Limited 10 25,000 0.03 25,000 0.03
GMR Kamalanga Energy Limited 10 31,060,180 31.06 17,730,000 17.73
GR Infraprojects Limited 10 132,304 2.71 111,256 1.98
Green Gas Limited 10 10,000 0.01 10,000 0.01
Indian Commodity Exchange Limited 5 10,000,000 5.00 10,000,000 5.00
Indian Energy Exchange Limited 10 1,250,000 1.25 1,250,000 1.25
Indu Projects Limited 10 2,053,480 26.70 2,053,480 26.70
Intarvo Technologies Limited 10 71,105 1.41 69,800 1.40
Carried forward 259.44 246.36
N O T E S T O F I N A N C I A L S TAT E M E N T S FOR THE YEAR ENDED MARCH 31, 2012

I D F C A N N U A L R E P O R T 2 0 1 1 – 1 2108
AS AT MARCH 31, 2012 AS AT MARCH 31, 2011 FACE
VALUE (`)QUANTITY (` in crore) QUANTITY (` in crore)
I NVESTM ENT I N EQU ITY SHARE S (U NQUOTE D) (FU LLY PAID) (Continued)
Brought forward 259.44 246.36
KMC Constructions Limited 10 542,977 23.90 542,977 23.90
MVR Infrastructure and Tollways Private Limited 100 1,200,000 12.00 1,200,000 12.00
National Stock Exchange of India Limited 10 2,947,990 73.88 3,547,990 88.91
One 97 Communication Limited 10 121,388 3.02 119,867 2.96
Orbis Capital Limited 10 - - 7,500,000 8.63
Petronet CCK Limited 10 19,973,332 19.97 19,973,332 19.97
Pipal Tree Ventures Private Limited 10 192,885 2.25 192,885 2.25
Quickjet Cargo Airlines Private Limited 10 - - 90,909 0.10
Rohan Rajdeep Toll Roads Limited 10 - - 4,070,000 4.07
Securities Trading Corporation of India Limited 10 3,530,136 54.04 3,530,136 54.04
SSIPL Retail Private Limited 10 304,599 5.00 304,599 5.00
Uniquest Infra Ventures Private Limited 10 298,500 0.30 - -
453.80 468.20
INVESTM ENT I N PRE FE RE NCE SHARE S (U NQUOTE D) (FULLY PAI D)
Others (Non-trade)0.10% GMR Energy Limited (convertible) 1,000 541,033 54.12 540,088 54.01
0% Human Value Developers Private Limited (convertible)
10 23,749,200 23.75 23,749,200 23.75
0% Intarvo Technologies Limited (convertible) 10 26,515 0.18 - -
0% Moser Baer Solar Limited (optionally convertible) 10 61,290,000 61.29 61,290,000 61.29
0% Quickjet Cargo Airlines Private Limited (convertible) 11 - - 15,181,818 16.70
0% Regen Powertech Private Limited (convertible) 10 61,974 4.37 - -
0% TRIL Infopark Limited (convertible) 100 15,000,000 150.00 26,250,000 262.50
13.50% Viom Networks Limited (optionally partially convertible)
10 250,000,000 250.00 250,000,000 250.00
0.02% Ziqitza Healthcare Limited (convertible) 10 2,209 0.47 2,209 0.47
544.18 668.72
INVESTM ENT I N GOVE RNME NT SE CU RITIE S (U NQUOTE D) 49.99 49.99
INVESTM ENT I N BO NDS (U NQUOTE D) (FU LLY PAID)
10.05% Axis Bank Limited 1,000,000 - - 250 25.00
8.25% Corporation Bank Limited 1,000,000 250 24.97 250 24.97
10.25% Future Capital Holdings Limited 1,000,000 500 49.49 500 49.49
9.92% HDFC Bank Limited 1,000,000 - - 59 5.90
9.98% ICICI Bank Limited 1,000,000 - - 200 20.00
6.25% ING Vysya Bank Limited 100,000 - - 500 4.39
8.95% Infotel Broadband Services Private Limited 1,000,000 500 48.24 500 48.24
8.91% L&T Infrastructure Finance Company Limited 1,000,000 250 24.51 250 24.51
8.60% Power Finance Corporation Limited 1,000,000 250 25.00 250 25.00
11.00% Power Finance Corporation Limited 1,000,000 700 78.59 700 78.59
10.90% Power Grid Corporation Limited (partly redeemed)
400,000 90 2.88 90 3.83
[Previous Year face value of ` 500,000]
10.90% Reliance Gas Transportation Infrastructure Limited
1,000,000 100 10.75 100 10.75
10.95% Reliance Gas Transportation Infrastructure Limited
1,000,000 1,324 147.51 1,324 147.51
9.20% Reliance Utilities and Power Private Limited 1,000,000 500 50.96 500 50.96
7.15% Rural Electrification Corporation Limited 1,000,000 - - 500 50.00
7.90% Rural Electrification Corporation Limited 1,000,000 - - 650 65.47
0% Sharekhan Limited (convertible) 145.35 3,435,527 49.94 3,435,527 49.94
0% Sharekhan Limited (convertible) 264.27 567,601 15.00 567,601 15.00
10.60% Shriram Transport Finance Company Limited 1,000,000 100 10.00 100 10.00
11.00% Shriram Transport Finance Company Limited 1,000,000 250 25.30 250 25.30
563.14 734.85
N O T E S T O F I N A N C I A L S TAT E M E N T S FOR THE YEAR ENDED MARCH 31, 2012
N O N - C U R R E N T I N V E S T M E N T S ( C o n t i n u e d )

109S T A N D A L O N E A C C O U N T S
AS AT MARCH 31, 2012 AS AT MARCH 31, 2011 FACE
VALUE (`)QUANTITY (` in crore) QUANTITY (` in crore)
INVESTM ENT I N VENTU RE CAPITAL U NITS (U NQUOTE D) [see note (d)]
Faering Capital India Evolving Fund (fully paid) 1,000 72,000 7.20 45,000 4.50
India Development Fund - Class A (` 99.79 paid) 100 10,000,000 0.10 10,000,000 0.10
India Development Fund - Class B (fully paid) 100 700 0.01 700 0.01
India Infrastructure Fund - Class B (fully paid) 1 4,070 ß 4,070 ß
IDFC Project Equity Domestic Investors Trust I (fully paid) 100 23,415,280 234.15 15,628,280 156.28
IDFC Project Equity Domestic Investors Trust II (fully paid) 100 371,411 3.71 - -
IDFC Private Equity Fund II - Class A (` 9.15 paid) 10 135,000,000 92.18 135,000,000 95.22
(Previous Year ` 8.90 paid)
IDFC Private Equity Fund II - Class C (fully paid) 10 6,621 0.01 6,621 0.01
IDFC Private Equity Fund III - Class A (` 5.46 paid) 10 280,000,000 152.85 280,000,000 134.24
(Previous Year ` 4.79 paid) (commitment restricted to ` 7.14 per unit)
IDFC Private Equity Fund III - Class B (fully paid) 10 3,571 ß - -
IDFC Private Equity Fund III - Class C (` 4.94 paid) 10 1,350,000 0.67 1,350,000 0.57
(Previous Year ` 4.23 paid)(commitment restricted to ` 7.14 per unit)
IDFC Private Equity Fund III - Class D (` 3.81 paid) 10 79,996,000 30.49 79,996,000 13.99
(Previous Year ` 1.75 paid)
IDFC Private Equity Fund III - Class E (fully paid) 10 1,429 ß - -
IDFC Private Equity Fund III - Class F (` 3.74 paid) 10 385,695 0.14 385,695 0.07
(Previous Year ` 1.72 paid)
IDFC Spice Fund (fully paid) 1 68,676,350 6.87 - -
Urban Infrastructure Opportunities Fund - Class A (fully paid)
100,000 2,700 25.11 2,700 27.40
553.49 432.39
INVESTM ENT I N SECU RITY RE C E IPTS (U NQUOTE D)
Asset Reconstruction Company (India) Limited 21.38 21.71
TOTAL NON-CURRENT INVE STME NTS 3,658.79 3,814.39 Less: Provision for diminution in value of investments 176.73 92.06
Less: Premium amortised on bonds and Government securities
7.31 4.36
NET NO N-CURRENT INVE STME NTS 3,474.75 3,717.97 (a) Aggregate amount of quoted investments
Cost 308.81 286.04
Market value 243.96 293.27
(b) Aggregate amount of unquoted investments - cost 3,349.98 3,528.35
(c) Investments include ` Nil (Previous Year ` 47.69 crore) in respect of equity shares which are subject to a lock-in-period.
(d) Investments include ` 0.47 crore (Previous Year ` 0.47 crore) in respect of equity shares and ` 553.49 crore (Previous Year ` 432.39 crore) in respect of venture capital units which are subject to restrictive covenants.
(e) Investments exclude equity shares held by the Company having face value ` 13.58 crore (Previous Year ` 13.58 crore), where the Company has no beneficial interest.
1 5 D E F E R R E D TA X A S S E T S ( N E T )
AS AT MARCH 31, 2012 AS AT MARCH 31, 2011
(` in crore) (` in crore)
DEF ERRED TAX ASSE TS
(a) Provisions 336.58 262.56
(b) Others 0.29 7.18
336.87 269.74
DEF ERRED TAX LI AB ILITY
(a) Fixed assets: Impact of difference between tax depreciation and depreciation / amortisation charged to the Statement of Profit and Loss 21.97 24.84
DEF ERRED TAX ASSE TS (NE T) 314.90 244.90
In compliance with Accounting Standard 22 on ‘Accounting for Taxes on Income’ as notified under the Companies (Accounting Standards) Rules, 2006, the Company has taken credit of ` 70.00 crore (Previous Year ` 70.60 crore) in the Statement of Profit and Loss towards deferred tax assets (net) on account of timing differences.
N O T E S T O F I N A N C I A L S TAT E M E N T S FOR THE YEAR ENDED MARCH 31, 2012
N O N - C U R R E N T I N V E S T M E N T S ( C o n t i n u e d )

I D F C A N N U A L R E P O R T 2 0 1 1 – 1 2110
1 6 L O A N S
AS AT MARCH 31, 2012 AS AT MARCH 31, 2011 (` in crore) (` in crore)
NON-CURRENT PORTION
CURRENT MATURITIES
NON-CURRENT PORTION
CURRENT MATURITIES
Rupee loans [see note (a), (d) & (e)] 41,654.01 6,147.05 32,977.53 4,399.54
Debentures [see note (a), (c) & (e)] 1,086.34 0.83 594.00 239.23
42,740.35 6,147.88 33,571.53 4,638.77
Less: Provision against non-performing loans [see note (d)] 29.73 47.16 6.90 33.93
Less: Provision for contingencies 626.76 - 521.85 - TOTAL 42,083.86 6,100.72 33,042.78 4,604.84 (a) The above amount includes
Secured [see note (b) & (d)] 38,021.08 5,865.38 32,887.53 4,548.77
Unsecured 4,719.27 282.50 684.00 90.00
42,740.35 6,147.88 33,571.53 4,638.77 (b) Loans to the extent of ` 43,886.46 crore (Previous Year ` 37,436.30 crore) are secured by:
(i) Hypothecation of assets and / or
(ii) Mortgage of property and / or
(iii) Trust and retention account and / or
(iv) Bank guarantees, company guarantee, sponsor guarantee or personal guarantee and / or
(v) Assignment of receivables or rights and / or
(vi) Pledge of shares and / or
(vii) Negative lien and / or
(viii) Undertaking to create a security
(c) Loans includes debentures of ` 1,087.17 crore (Previous Year ` 833.23 crore) as detailed below:
AS AT MARCH 31, 2012 AS AT MARCH 31, 2011FACE
VALUE (`)QUANTITY (` in crore) QUANTITY (` in crore)
DEBENTURES (REDE E MABLE )
ASSOCIATE
Feedback Infrastructure Services Private Limited
1,000 280,000 28.00 - -
OTHERS
Andhra Cements Limited 100 500,000 5.00 500,000 5.00
Arkay Energy (Rameswarm) Limited 10 - - 99,622,885 42.70
Asianet Satellite Communications Limited 1,000,000 148 14.80 260 26.00
Asianet Satellite Communications Limited 312,500 - - 1 0.03
GVK Airport Developers Private Limited 1,000,000 - - 2,250 225.00
DEBENTURES (CONVE RTIBLE )
ASSOCIATE
Galaxy Mercantiles Limited 20,000 68,060 136.12 - - OTHERS
Coastal Projects Limited 1,000,000 1,000 100.00 - -
Greenko Energies Private Limited 100 1,875,000 18.75 - -
Mytrah Energy (India) Limited 300 5,000,000 150.00 - -
Regen Powertech Private Limited 100,000 10,000 100.00 - -
Simpson Unitech Wireless Private Limited 10 534,500,000 534.50 534,500,000 534.50 TOTAL 1,087.17 833.23
(d) Rupee loans - secured includes non-performing loans of ` 148.32 crore (Previous Year ` 79.73 crore) against which provisions of ` 76.89 crore (Previous Year ` 40.83 crore) has been made in accordance with the RBI circular (Ref. No. DNBS (PD) CC No. 225 / 03.02.001 / 2011-12 dated July 1, 2011) [see note (e) & 40 (f)].
(e) The classification of loans under the RBI guidelines is as under:
AS AT MARCH 31, 2012 AS AT MARCH 31, 2011
(` in crore) (` in crore)
(i) Standard assets 48,739.91 38,130.57
(ii) Sub-standard assets 70.78 6.25
(iii) Doubtful assets 50.04 45.98
(iv) Loss assets 27.50 27.50
48,888.23 38,210.30
N O T E S T O F I N A N C I A L S TAT E M E N T S FOR THE YEAR ENDED MARCH 31, 2012

111S T A N D A L O N E A C C O U N T S
1 8 O T H E R A S S E T S ( C O N S I D E R E D G O O D , U N L E S S S TAT E D O T H E R W I S E )
AS AT MARCH 31, 2012 AS AT MARCH 31, 2011
(` in crore) (` in crore)
NON-CURRENT PORTION
CURRENT MATURITIES
NON-CURRENT PORTION
CURRENT MATURITIES
Other receivables - 5.03 - 4.72
[includes ` 0.53 crore (Previous Year ` 0.36 crore), considered doubtful]
Less: Provision against doubtful receivables - 0.53 - 0.36
- 4.50 - 4.36
Bank deposits - - 501.00 -
Interest accrued on deposits & loan to financial institution - 65.00 11.96 9.38
Interest accrued on investments - 67.28 - 68.87
Interest accrued on loans [see note (a)] 334.97 453.61 373.93 170.19
Mark-to-market margin – stock futures account - - - 0.16
Less: Provision for loss – stock futures account - - - 0.16
Unamortised expenses
Premium on forward contracts - 5.30 0.47 50.95
Ancillary borrowing costs 30.93 8.84 19.29 4.40
TOTAL 365.90 604.53 906.65 308.15
(a) Current maturities of interest accrued on loans is net of provision of ` 20.71 crore (Previous Year ` 3.75 crore).
1 7 L O A N S A N D A D VA N C E S - O T H E R S ( C O N S I D E R E D G O O D )
AS AT MARCH 31, 2012 AS AT MARCH 31, 2011
(` in crore) (` in crore)
NON-CURRENT PORTION
CURRENT MATURITIES
NON-CURRENT PORTION
CURRENT MATURITIES
SECURED
Lending in CBLO - 49.95 - -
U NSECURED
Inter corporate deposits - 412.65 577.65 -
Loans and advances to related parties (see note 33) - 117.36 91.60 0.02
Loan to a financial institution - 30.00 30.00 -
Receivables against derivative contracts 196.29 173.57 24.13 2.30
Receivable against retail infrastructure bonds - 179.17 - -
Loans and advances to employees 1.00 0.21 1.00 0.09
Advance against investments 18.61 100.00 7.35 50.00
Security deposits 22.04 4.38 15.73 4.46
Other deposits 0.03 6.00 3.01 0.02
Other loans and advances
Advance payment of income tax 153.15 - 141.36 -
[(net of provision of ` 1,147.57 crore (Previous Year ` 1,147.57
crore)]
Prepaid expenses - 1.95 0.01 0.50
Supplier advances - 2.20 - 0.90
Balances with Government authorities - Cenvat credit available - 0.93 - 6.46
Balance with defined benefit plan - 0.11 - 0.36
Insurance claim receivable - - - 0.73
Stamp paper on hand - 0.12 - -
Initial margin account – stock futures 5.00 - 4.00 -
TOTAL 396.12 1,078.60 895.84 65.84
N O T E S T O F I N A N C I A L S TAT E M E N T S FOR THE YEAR ENDED MARCH 31, 2012

I D F C A N N U A L R E P O R T 2 0 1 1 – 1 2112
1 9 C U R R E N T I N V E S T M E N T S
AS AT MARCH 31, 2012 AS AT MARCH 31, 2011 FACE
VALUE (`)QUANTITY (` in crore) QUANTITY (` in crore)
CURRENT PO RTION OF LONG-TE RM INVE STME NTS (AT COST)
I NVESTM ENT I N BONDS (U NQUOTE D) (FU LLY PAID) (CU R RENT M ATURI TI ES)
10.90% Power Grid Corporation Limited (part redemption) - 0.90 - 0.90
7.15% Rural Electrification Corporation Limited 1,000,000 500 50.00 - -
7.90% Rural Electrification Corporation Limited 1,000,000 650 65.47 - - I NVESTM ENT I N BONDS (U NQUOTE D) (FU LLY PAID)
10.05% Axis Bank Limited 1,000,000 250 25.00 - -
9.92% HDFC Bank Limited 1,000,000 59 5.90 - -
9.98% ICICI Bank Limited 1,000,000 200 20.00 - -
6.25% ING Vysya Bank Limited 100,000 500 4.39 - - I NVESTM ENT I N E QU ITY SHARE S (TRADE ) (U NQUOTE D) (FULLY PAI D)I NVESTM ENT I N SU BSIDIARIE S [see note (c)]
IDFC Asset Management Company Limited 10 - - 664,719 208.72
IDFC AMC Trustee Company Limited 10 - - 12,501 0.02 I NVESTM ENT I N E QU ITY SHARE S (NON-TRADE ) (UNQUOTED) (FU LLY PAID) [see note (d)]
Orbis Capital Limited 10 7,500,000 8.63 - -
180.29 209.64 CURRENT I NVESTME NTS (LOWE R OF COST AND FAIR VALUE /M ARKET VALUE)I NVESTM ENT I N E QU ITY SHARE S (QUOTE D) (FU LLY PAID )
Hathway Cable & Datacom Limited 10 416,650 10.00 416,650 10.00
Indiabulls Power Limited 10 3,423,184 15.40 3,423,184 15.40
NHPC Limited 10 10,555,729 38.00 10,555,729 38.00
Vascon Engineers Limited 10 864,225 14.26 864,225 14.26
Engineers India Limited 5 143,961 4.17 143,961 4.17
81.83 81.83
I NVESTM ENT I N E QU ITY SHARE S (U NQUOTE D) (FU LLY PA ID)
I NVESTM ENT I N AN ASSOCIATE
Galaxy Mercantiles Limited - Class A 100 35,048 73.60 - -
Galaxy Mercantiles Limited - Class C 100 100 0.21 - -
73.81 - I NVESTM ENT I N PRE FE RE NCE SHARE S (U NQUOTE D) (FUL LY PAI D)I NVESTM ENT I N AN ASSOCIATE
0.01% Galaxy Mercantiles Limited (redeemable) 100 999,426 9.99 - -
9.99 - I NVESTM ENT I N CONVE RTIBLE WARRANTS (QUOTE D)
Housing Development Finance Corporation Limited 55 850 ß 850 ß
I NVESTM ENT I N BONDS (U NQUOTE D) (FU LLY PAID)
Floating Rate Bond Advanta India Limited 1,000,000 1,540 148.23 - -
9.25% Deccan Chronicle Holdings Limited 1,000,000 - - 500 50.00
12.00% Deccan Chronicle Holdings Limited 1,000,000 - - 1,000 100.00
10.10% First Blue Home Finance Limited 1,000,000 150 15.00 150 15.00
(formerly Deutsche Post Bank Home Finance Limited)
0% Dewan Housing Finance Limited 10,000,000 - - 100 100.00
10.75% Dishergarh Power Supply Company Limited 200,000 - - 2,350 47.00
9.25% Fullerton India Credit Company Limited 1,000,000 850 85.08 850 85.07
9.60% Great Eastern Shipping Company Limited 1,000,000 100 10.09 100 10.09
8.10% Housing and Urban Development Corporation Limited 1,000 247,814 24.78 - -
8.20% Housing and Urban Development Corporation Limited 1,000 83,851 8.39 - -
0% Housing Development Finance Corporation Limited 1,000,000 - - 500 50.00
6.84% Housing Development Finance Corporation Limited 1,000,000 - - 200 20.19
8.35% Housing Development Finance Corporation Limited 1,000,000 - - 200 20.00
9.29% ICICI Home Finance Limited 1,000,000 88 8.80 88 8.80
10.24% L&T Finance Limited 1,000 821,491 82.15 821,491 82.15
9.56% LIC Housing Finance Limited 1,000,000 350 35.00 - -
12.20% Manappuram Finance Limited 1,000 250,000 25.06 - -
12.50% Manappuram Finance Limited 1,000,000 1,000 99.35 - -
Carried forward 541.93 588.30
N O T E S T O F I N A N C I A L S TAT E M E N T S FOR THE YEAR ENDED MARCH 31, 2012

113S T A N D A L O N E A C C O U N T S
19 CURRENT INVESTMENTS ( C o n t i n u e d )
AS AT MARCH 31, 2012 AS AT MARCH 31, 2011
FACE VALUE (`)
QUANTITY (` in crore) QUANTITY (` in crore)
I NVESTM ENT I N BONDS (U NQUOTE D) (FU LLY PAID) (continued)
Brought forward 541.93 588.30
13.25% MGM Consulting Services Private Limited 10,000,000 150 150.00 - -
6.55% National Housing Bank 1,000,000 - - 450 44.59
8.20% National Highway Authority of India 1,000 941,714 94.64 - -
9.18% National Bank for Agriculture and Rural Development 1,000,000 350 35.00 - -
7.00% Power Finance Corporation Limited 1,000,000 - - 250 25.06
8.20% Power Finance Corporation Limited 1,000 848,051 86.24 - -
8.49% Power Finance Corporation Limited 1,000,000 - - 300 30.73
8.80% Power Finance Corporation Limited 1,000,000 400 40.00 400 40.00
9.33% Power Finance Corporation Limited 1,000,000 500 49.98 - -
11.15% Power Finance Corporation Limited 1,000,000 - - 25 2.65
8.64% Power Grid Corporation of India Limited 1,250,000 80 10.00 80 10.00
8.84% Power Grid Corporation of India Limited 1,250,000 560 70.00 640 80.00
9.22% Reliance Capital Limited 1,000,000 250 25.28 250 25.28
9.25% Reliance Capital Limited 1,000,000 450 45.49 450 45.49
10.90% Reliance Gas Transportation Infrastructure Limited 1,000,000 650 69.20 650 69.20
10.95% Reliance Gas Transportation Infrastructure Limited 1,000,000 500 55.48 500 55.49
7.60% Rural Electrification Corporation Limited 1,000,000 - - 350 35.35
10.90% Shriram Transport Finance Company Limited 1,000,000 195 19.52 200 20.02
9.05% State Bank of India 1,000,000 190 19.00 190 19.00
9.95% State Bank of India 10,000 - - 45,000 46.90
10.00% Sundaram Finance Limited 1,000,000 250 25.00 250 25.00
10.30% Tata Sons Limited 1,000,000 50 5.00 50 5.00
9.20% United Bank of India 1,000,000 2,000 199.93 - -
1,541.69 1,168.06
I NVESTM ENT I N PASS THROUGH CE RTIFICATE S (U NQUOTED)
India MBS 2002 Certificates Series I D 0.84 1.06
Loan Securitisation Trust (Series XVII) - 0.22
0.84 1.28
I NVESTM ENT I N C E RTIFICATE OF DE POSITS WITH SCHEDULED BANKS (U NQUOTE D)
1,147.90 1,889.89
I NVESTM ENT I N COMME RC IAL PAPE RS (U NQUOTE D) 1,324.68 821.47
I NVESTM ENT I N GOVE RNME NT SE CU RITIE S (U NQUOTE D) 181.51 165.47
I NVESTM ENT I N TRE ASU RY BILLS (U NQUOTE D) 354.66 96.27
I NVESTM ENT I N MUTUAL FU NDS (U NQUOTE D)
IDFC SSIF Short Term Plan C - Growth 10 149,757,970.586 175.00 - -
IDFC Money Manager Fund - Daily Dividend 10 - - 1,355,620.214 1.37
175.00 1.37
TOTAL CURRENT INVE STME NTS 5,072.20 4,435.28
Less: Provision for diminution in value of investments 60.86 45.83
Less: Premium amortised on current maturities of long-term bonds 0.38 -
NET CURRENT INVE STME NTS 5,010.96 4,389.45
N O T E S T O F I N A N C I A L S TAT E M E N T S FOR THE YEAR ENDED MARCH 31, 2012

I D F C A N N U A L R E P O R T 2 0 1 1 – 1 2114
20 T R A D E R E C E I VA B L E S ( U N S E C U R E D ) ( C O N S I D E R E D G O O D , U N L E S S S TAT E D O T H E R W I S E )
AS AT MARCH 31, 2012 AS AT MARCH 31, 2011 (` in crore) (` in crore)
Outstanding for a period less than six months from the date they are due for payment [see note (a)]
371.46 11.09
Considered doubtful Outstanding for a period exceeding six months from the
date they are due for payment
1.86 3.30
Less: Provision against doubtful receivables 1.86 3.30
- -
TOTAL 371.46 11.09
(a) Trade receivables include debts of ` 0.28 crore (Previous Year ` Nil) due from private company in which a director is a director.
21 C A S H A N D B A N K B A L A N C E S
AS AT MARCH 31, 2012 AS AT MARCH 31, 2011 (` in crore) (` in crore)
CASH AND CASH E QU IVALE NTS
Cash on hand 0.01 0.01
Cheques on hand 1.90 0.90
Balances with banks:
In current accounts [see note (a)] 9.47 223.67
In deposit accounts 50.00 -
61.38 224.58
OTHERS
Balances with banks:
In earmarked accounts
- unclaimed dividend 1.22 0.96
- unclaimed interest 5.22 -
In deposit accounts [see note (b) & (c)] 522.00 242.00
528.44 242.96
589.82 467.54
(a) Balances with banks in current accounts include ` Nil (Previous Year ` 223.43 crore) being amount raised on issue of long-term Infrastructure
Bonds – Tranche III, that remained unutilised as at the Balance Sheet date pending regulatory approvals.
(b) Balances with banks in deposit accounts include deposits under lien of ` 21.00 crore (Previous Year ` 17.00 crore) to the National Securities
Clearing Corporation Limited for meeting margin requirements.
(c) Balances with banks include deposits of ` 501.00 crore (Previous Year ` 25.00 crore) having original maturity of more than 12 months.
AS AT MARCH 31, 2012 AS AT MARCH 31, 2011
(` in crore) (` in crore)
(a) Aggregate amount of quoted investments
Cost 81.83 81.83
Market value 40.38 50.40
(b) (i) Aggregate amount of investments in unquoted mutual funds
Cost 175.00 1.37
Market value Market value of investments in unquoted mutual funds
represents the repurchase price of the units issued by the mutual funds
184.74 1.37
(ii) Aggregate amount of other unquoted investments - cost 4,815.37 4,352.08
(c) In the previous year, the Company had entered into an agreement with Natixis Global Asset Management to sell 25% stake in IDFC Asset Management Company Limited and IDFC AMC Trustee Company Limited, subject to regulatory approvals. In view of this agreement, the Company did not have intention to hold 25% of the investment for more than 12 months as at March 31, 2011. Hence the Company has disclosed its investments in these equity shares as current investments. However, for valuation purposes, the investments continue to be treated as long-term investments.
(d) Investments include ` 8.63 crore (Previous Year ` Nil) in respect of equity shares which are subject to a lock-in-period.
N O T E S T O F I N A N C I A L S TAT E M E N T S FOR THE YEAR ENDED MARCH 31, 2012

115S T A N D A L O N E A C C O U N T S
22 R E V E N U E F R O M O P E R AT I O N S
FOR THE YEAR ENDED MARCH 31, 2012
FOR THE YEAR ENDED MARCH 31, 2011
(` in crore) (` in crore)
Interest [see note (a)] 5,428.87 3,941.60
Other financial services [see note (b)] 157.53 227.10
Dividend income [see note (c)] 87.79 81.88
Net profit on sale of investments [see note (d)] 408.41 252.18
Other operating income [see note (e)] 11.72 21.24
TOTAL 6,094.32 4,524.00
(a ) DETAI LS OF INTE RE ST INCOME
Interest on loans [see note (i) & (ii)] 4,793.71 3,446.19
Interest on deposits and loan to a financial institution 169.80 101.88
Interest on investments
Current investments 402.46 328.35
Long-term investments 62.90 65.18
TOTAL 5,428.87 3,941.60
(i) Interest on loans includes interest on debentures of ` 182.05 crore (Previous Year ` 105.77 crore).
(ii) Interest on loans includes exchange gain of ` 10.33 crore (Previous Year ` 48.41 crore).
(b ) DETAI LS OF INCOME FROM OTHE R FINANC IAL SE RV IC ES
Fees (net) [see note (i)] 154.06 221.24
Profit on assignment / sale of loans 3.47 5.86
TOTAL 157.53 227.10
(i) Fees income is net of fees shared on sell down of loans of ` 7.87 crore (Previous
Year ` 31.64 crore).
(c) DETAI LS OF DIVIDE ND INCOME
Current investments 1.82 22.91
Long-term investments
Subsidiary companies 69.27 45.75
Associate company 0.81 0.73
Others 15.89 12.49
TOTAL 87.79 81.88
(d) DETAI LS OF NE T PROFIT ON SALE OF INVE STME NTS
Current investments 78.70 47.85
Long-term investments 329.71 204.33
TOTAL 408.41 252.18
(e) DETAI LS OF OTHE R OPE RATING INCOME
Sale of power 11.72 10.05
Income from trading in stock futures - 2.81
Income on renunciation of rights - 8.38
TOTAL 11.72 21.24
N O T E S T O F I N A N C I A L S TAT E M E N T S FOR THE YEAR ENDED MARCH 31, 2012

I D F C A N N U A L R E P O R T 2 0 1 1 – 1 2116
23 O T H E R I N C O M E
FOR THE YEAR ENDED MARCH 31, 2012
FOR THE YEAR ENDED MARCH 31, 2011
(` in crore) (` in crore)
Interest on income tax refund - 5.06
Other interest 0.13 0.06
Profit on sale of long-term investments [see note (a)] 89.00 21.95
Profit on sale of fixed assets (net) 4.38 7.00
Miscellaneous income [see note 34(iii)] 8.18 2.28
TOTAL 101.69 36.35
(a) Profit on sale of long-term investments includes ` 89.00 crore (Previous Year ` Nil) on sale of 25% stake in IDFC Asset Management Company
Limited and IDFC AMC Trustee Company Limited, wholly-owned subsidiaries of the Company, to Natixis Global Asset Management and ` Nil
(Previous Year ` 21.95 crore) on account of sale of certain investments to a wholly-owned subsidiary.
24 E M P L O Y E E B E N E F I T S E X P E N S E
FOR THE YEAR ENDED MARCH 31, 2012
FOR THE YEAR ENDED MARCH 31, 2011
(` in crore) (` in crore)
Salaries [see note (a) & 34(i)] 134.23 78.97
Contribution to provident and other funds [see note 31] 7.46 5.22
Expense under the ESOS [see note 5(b)] 4.31 16.75
Staff welfare expenses 6.39 5.68
TOTAL 152.39 106.62
(a) Expenditure on account of salaries is after adjusting ` Nil (Previous Year ` 5.24 crore) recovered from subsidiary companies and a jointly
controlled entity.
25 F I N A N C E C O S T S
FOR THE YEAR ENDED MARCH 31, 2012
FOR THE YEAR ENDED MARCH 31, 2011
(` in crore) (` in crore)
Interest expense * 3,370.00 2,298.47
Other borrowing costs * 52.48 56.47
Net loss on foreign currency transactions and translation 32.75 31.58
TOTAL 3,455.23 2,386.52
* excludes costs charged to securities premium account.
26 P R O V I S I O N S A N D C O N T I N G E N C I E S
FOR THE YEAR ENDED MARCH 31, 2012
FOR THE YEAR ENDED MARCH 31, 2011
(` in crore) (` in crore)
Contingent provision against standard assets [see note 9(b)] 27.65 96.75
Provision for contingencies [including provision u/s. 36(1)(viia) of the Income-tax Act, 1961] 104.91 51.73
Provision against non-performing loans and debtors 51.76 7.85
Write back of provision against restructured loans - (1.42)
Provision for diminution in value of investments (net) 99.69 79.87
Provision for / (writeback of) mark-to-market on stock futures account (0.16) 0.16
283.85 234.94
N O T E S T O F I N A N C I A L S TAT E M E N T S FOR THE YEAR ENDED MARCH 31, 2012

117S T A N D A L O N E A C C O U N T S
27 O T H E R E X P E N S E S
FOR THE YEAR ENDED MARCH 31, 2012
FOR THE YEAR ENDED MARCH 31, 2011
(` in crore) (` in crore)
Rent [see note 34(ii)] 11.81 9.66
Rates & taxes [see note (a)] 3.15 3.61
Electricity 2.24 2.61
Repairs and maintenance
Buildings 1.59 2.02
Equipments 2.17 1.58
Others 0.04 0.03
Insurance charges 0.55 0.45
Travelling and conveyance 7.68 5.10
Printing and stationery 0.77 1.22
Communication costs 3.69 3.67
Advertising and publicity 1.65 2.03
Professional fees 25.36 29.75
Loss on foreign exchange fluctuation (net) 0.11 ß
Loss on trading in stock futures 2.63 -
Directors’ sitting fees 0.28 0.27
Commission to directors 1.04 1.11
Bad debts written off 0.78 2.93
Miscellaneous expenses 19.16 13.10
Auditors’ remuneration [see note (b)] 1.81 1.37
Shared service costs recovered [see note (c)] (14.61) (11.38)
TOTAL 71.90 69.13
(a) Rates and taxes include provision for wealth tax amounting to ` 0.13 crore (Previous Year ` 0.14 crore) and securities transaction tax amounting
to ` 1.01 crore (Previous Year ` 0.86 crore).
(b) Break up of auditors’ remuneration:
FOR THE YEAR ENDED MARCH 31, 2012
FOR THE YEAR ENDED MARCH 31, 2011
(` in crore) (` in crore)
Audit fees 0.40 0.40
Tax audit fees 0.12 0.12
Taxation matters 0.40 0.20
Other services 0.75 0.64
Out-of-pocket expenses 0.01 0.01
Service tax 0.26 0.12
1.94 1.49
Less: Service tax set off claimed 0.13 0.12
TOTAL 1.81 1.37
The above amounts exclude professional fees of ` 0.19 crore (Previous Year ` 0.67 crore) debited to other accounts.
(c) Shared service costs recovery includes ` 13.78 crore (Previous Year ` 11.38 crore) recovered from subsidiary companies under a shared service
agreement.
N O T E S T O F I N A N C I A L S TAT E M E N T S FOR THE YEAR ENDED MARCH 31, 2012
28 E X P E N D I T U R E I N F O R E I G N C U R R E N C I E S
FOR THE YEAR ENDED MARCH 31, 2012
FOR THE YEAR ENDED MARCH 31, 2011
(` in crore) (` in crore)
Interest expense 24.34 -
Other borrowing costs 7.11 0.73
Travelling expenses 0.25 0.09
Professional fees 2.04 1.83
Others 8.12 2.40

I D F C A N N U A L R E P O R T 2 0 1 1 – 1 2118
29 E A R N I N G S I N F O R E I G N C U R R E N C I E S
FOR THE YEAR ENDED MARCH 31, 2012
FOR THE YEAR ENDED MARCH 31, 2011
(` in crore) (` in crore)
Fees 0.15 0.11
Others 0.03 0.84
30 R E M I T TA N C E I N F O R E I G N C U R R E N C I E S F O R D I V I D E N D S
The Company has not remitted any amount in foreign currencies on account of dividends during the year and does not have information as to the extent to which remittances, if any, in foreign currencies on account of dividends have been made by / on behalf of non-resident shareholders. The particulars of dividends payable to non-resident shareholders which were declared during the year, are as under:
FOR THE YEAR ENDED MARCH 31, 2012
FOR THE YEAR ENDED MARCH 31, 2011
Number of non-resident shareholders 4,913 3,973
Number of equity shares held by them 713,105,443 589,863,715
Gross amount of dividend (` in crore) 142.62 88.48
Dividend relating to the year 2010-11 2009-10
31 In accordance with Accounting Standard 15 on ‘Employee Benefits’ as notified under the Companies (Accounting Standards) Rules, 2006 the following disclosures have been made:
i. The Company has recognised the following amounts in the Statement of Profit and Loss towards contribution to defined contribution plans which are included under contribution to provident and other funds:
FOR THE YEAR ENDED MARCH 31, 2012
FOR THE YEAR ENDED MARCH 31, 2011
(` in crore) (` in crore)
Provident fund 2.91 2.28
Superannuation fund 0.74 0.57
Pension fund 0.39 -
ii. The details of the Company’s post-retirement benefit plans for gratuity for its employees are given below which are certified by the actuary and relied upon by the auditors:
FOR THE YEAR ENDED MARCH 31, 2012
FOR THE YEAR ENDED MARCH 31, 2011
(` in crore) (` in crore)
CHANGE I N THE DE FINE D BE NE FIT OBLIGATIONS:
Liability at the beginning of the year 8.96 6.72
Current service cost 1.57 1.15
Interest cost 0.85 0.60
Liabilities settled on divestiture - (0.32)
Benefits paid 1.07 0.68
Actuarial loss 1.34 1.50
Liability at the end of the year 11.65 8.96
FAI R VALUE O F PLAN ASSE TS:
Fair value of plan assets at the beginning of the year 9.06 7.23
Expected return on plan assets 0.68 0.66
Contributions 3.40 2.01
Benefits paid 1.07 0.68
Actuarial loss on plan assets 0.32 0.16
Fair value of plan assets at the end of the year 11.75 9.06
Total actuarial loss to be recognised 1.66 1.66
ACTUAL RETURN ON PLAN ASSE TS:
Expected return on plan assets 0.68 0.66
Actuarial loss on plan assets 0.32 0.16
Actual return on plan assets 0.36 0.50
N O T E S T O F I N A N C I A L S TAT E M E N T S FOR THE YEAR ENDED MARCH 31, 2012

119S T A N D A L O N E A C C O U N T S
AM OUNT RECOGNISE D IN THE BALANC E SHE E T:
Liability at the end of the year 11.65 8.96
Fair value of plan assets at the end of the year 11.75 9.06
Amount recognised in the Balance Sheet under ‘Provision for employee benefits’ - -
EXPENSE RECOGNISE D IN THE STATE ME NT OF PROFIT AND LOSS:
Current service cost 1.57 1.15
Interest cost 0.85 0.60
Expected return on plan assets 0.68 0.66
Net actuarial loss to be recognised 1.66 1.66
Liabilities settled on divestiture - (0.32)
Expense recognised in the Statement of Profit and Loss under ‘Employee benefits expense’ 3.40 2.43
RECONCI LI ATI ON OF THE LIABILITY RE COGNISE D IN THE BA LANCE SHEET:
Opening net asset 0.10 0.51
Expense recognised 3.40 2.43
Contribution by the Company 3.40 2.01
Expected employer’s contribution next year 1.50 1.00
N O T E S T O F I N A N C I A L S TAT E M E N T S FOR THE YEAR ENDED MARCH 31, 2012
FOR THE YEAR ENDED
MARCH 31, 2012 MARCH 31, 2011 MARCH 31, 2010 MARCH 31, 2009 MARCH 31, 2008
(` in crore)
EXPERI ENCE ADJUSTME NTS:
Defined benefit obligation 11.65 8.96 6.72 5.83 3.85
Plan assets 11.75 9.06 7.23 5.85 3.10
Surplus / (deficit) 0.10 0.10 0.51 0.02 (0.75)
Experience adjustments on
plan liabilities 1.38 1.71 (0.54) 1.45 0.80
Experience adjustments on
plan assets (0.32) (0.16) 1.29 (0.74) (0.02)
AS AT MARCH 31, 2012 AS AT MARCH 31, 2011
(%) (%)
I NVESTM ENT PATTE RN:
Insurer managed funds 100.00 100.00
Government securities 8.99 12.92
Deposit and money market securities 41.67 17.21
Debentures / bonds 30.94 43.50
Equity shares 18.40 26.37
PRI NCI PAL ASSU MPTIONS:
Discount rate (p.a.) 8.38 8.30
Expected rate of return on assets (p.a.) 8.00 8.00
Salary escalation rate (p.a.) 8.00 8.00
The estimate of future salary increase, considered in the actuarial valuation takes account of inflation, seniority, promotion and other relevant factors.
32 The Company’s main business is financing by way of loans. All other activities revolve around the main business. The Company does not have any
geographic segments. As such, there are no separate reportable segments as per Accounting Standard 17 on ‘Segment Reporting’ as notified under the
Companies (Accounting Standards) Rules, 2006.
FOR THE YEAR ENDED MARCH 31, 2012
FOR THE YEAR ENDED MARCH 31, 2011
(` in crore) (` in crore)

I D F C A N N U A L R E P O R T 2 0 1 1 – 1 2120
(b) Through subsidiaries
Dheeru Powergen Limited
IDFC Capital Limited
IDFC Capital (USA) Inc. (with effect from August 4, 2010)
IDFC Capital (Singapore) Pte. Ltd.
IDFC Distribution Company Limited
IDFC Fund of Funds Limited
IDFC General Partners Limited
IDFC Investment Advisors Limited
IDFC Investment Managers (Mauritius) Limited (with effect from September 13, 2010)
IDFC Pension Fund Management Company Limited
IDFC PPP Trusteeship Company Limited (with effect from March 23, 2012)
Jetpur Somnath Highway Limited (with effect from November 15, 2010 up to August 10, 2011)
Jetpur Somnath Tollways Limited (with effect from January 11, 2011 up to August 11, 2011)
I I . JO I NTLY CONTROLLE D E NTITIE S:
(a) DirectDelhi Integrated Multi-Modal Transit System Limited (up to March 23, 2011)
Infrastructure Development Corporation (Karnataka) Limited (up to March 23, 2011)
Uttarakhand Infrastructure Development Company Limited (up to March 23, 2011)
(b) Through subsidiariesDelhi Integrated Multi-Modal Transit System Limited (with effect from March 24, 2011)
Infrastructure Development Corporation (Karnataka) Limited (with effect from March 24, 2011)
Uttarakhand Infrastructure Development Company Limited (with effect from March 24, 2011)
I I I . ASSOCIATES:
(a) DirectGalaxy Mercantiles Limited (with effect from December 2, 2011)
Feedback Infrastructure Services Private Limited (formerly Feedback Ventures Private Limited)
(b) Through subsidiariesJetpur Somnath Tollways Limited (with effect from August 12, 2011)
I V. ENTI TI ES OVER WHIC H CONTROL IS E XE RCISE D:
(a) DirectIndia Infrastructure Initiative Trust (up to March 23, 2011)
India PPP Capacity Building Trust (up to March 23, 2011)
(b) Through subsidiariesEmerging Markets Private Equity Fund, L.P. (up to January 26, 2012)
India Infrastructure Initiative Trust (with effect from March 24, 2011)
India PPP Capacity Building Trust (with effect from March 24, 2011)V. KEY M ANAGEME NT PE RSONNE L:
(a) Dr. Rajiv B. Lall - Managing Director & CEO
(b) Mr. Vikram Limaye - Whole-time Director
33 As per Accounting Standard 18 on ‘Related Party Disclosures’ as notified under the Companies (Accounting Standards) Rules, 2006, the related parties of the Company are as follows:
I . SUBSI DI ARI ES:
(a) Direct
IDFC Asset Management Company Limited
IDFC AMC Trustee Company Limited
IDFC Finance Limited
IDFC Foundation (with effect from March 4, 2011)
IDFC PPP Trusteeship Company Limited (up to March 22, 2012)
IDFC Primary Dealership Company Limited (with effect from March 17, 2012)
IDFC Private Equity Company Limited
IDFC Project Equity Company Limited
IDFC Projects Limited
IDFC Securities Limited
IDFC Trustee Company Limited
Jetpur Somnath Highway Limited (up to November 14, 2010)
Uniquest Infra Ventures Private Limited (with effect from February 3, 2011 up to June 3, 2011)
N O T E S T O F I N A N C I A L S TAT E M E N T S FOR THE YEAR ENDED MARCH 31, 2012

121S T A N D A L O N E A C C O U N T S
The nature and volume of transactions carried out with the above related parties in the ordinary course of business are as follows:
MARCH 31, 2012 MARCH 31, 2011NAME OF RELATED PARTY AND NATURE OF RELATIONSHIP (` in crore) (` in crore)(a ) SUBSI DI ARIE S:
Dheeru Powergen Limited Trade receivables - balance outstanding 0.02 -
IDFC Asset Management
Company Limited Acquisition of equity shares - 20.00
Inter corporate deposits placed and repaid - 15.00
Redemption of preference shares - 19.79
Shared service cost recovered 1.84 0.90
IDFC Capital Limited Fees paid 16.51 17.87
Purchase of fixed assets 0.05 -
Shared service cost recovered 1.75 2.53
Trade payables - balance outstanding 13.09 -
IDFC Capital (Singapore) Pte. Ltd. Shared service fees 5.80 5.01
Trade payable - balance outstanding 3.73 3.84
IDFC Finance Limited Advance given and recovered - 9.01
Purchase of investments - 9.05
IDFC Foundation Fees paid 3.63 -
Advances recovered during the year 4.00 -
Sale of investments 0.05 45.45
Advances recoverable - balance outstanding 41.50 45.50
Share subscription 8.00 -
Amount payable 0.52 -
IDFC Investment Advisors Limited Deputation charges recovered - 5.74
Management fees paid 0.56 0.71
IDFC Private Equity Company Limited Dividend received 20.00 32.00
Shared service costs recovered 2.99 0.50
IDFC Projects Limited Advance given (net of repayments) 30.95 31.85
Bank guarantees outstanding 76.30 66.89
Fees received 1.21 0.97
Shared service costs recovered 1.55 1.84
Sale of investments - 0.05
Advances - balance outstanding 74.54 46.10
IDFC Project Equity Company Limited Advances given and recovered - 2.69
Dividend received 21.00 13.75
Shared service costs recovered 2.69 2.28
IDFC PPP Trusteeship Company Limited Advances given 0.02 -
Advances - balance outstanding 0.02 -
N O T E S T O F I N A N C I A L S TAT E M E N T S FOR THE YEAR ENDED MARCH 31, 2012

I D F C A N N U A L R E P O R T 2 0 1 1 – 1 2122
MARCH 31, 2012 MARCH 31, 2011NAME OF RELATED PARTY AND NATURE OF RELATIONSHIP (` in crore) (` in crore)
IDFC Securities Limited Brokerage paid 0.07 0.10
Dividend received 28.27 -
Inter corporate deposits given and repaid - 79.00
Interest received on inter corporate deposits - 0.02
Shared service costs recovered 4.37 4.55
Sale of fixed assets - 0.05
Advances - balance outstanding 1.30 -
Jetpur Somnath Tollways Limited Shared service costs recovered 0.29 -
Advances - balance outstanding 0.11 -
(b) JOI NTLY CONTROLLE D E NTITIE S:
Uttarakhand Infrastructure
Development Company Limited Fees paid 0.09 -
Infrastructure Development
Corporation (Karnataka) Limited Fees paid 0.04 0.59
Rent paid 0.02 0.02
Deputation charges recovered - 0.04
Trade payables - balance outstanding 0.16 0.37
Delhi Integrated Multi-Modal Transit
System Limited
Miscellaneous income - ß
(c) ASSOCIATE S:
Feedback Infrastructure Services
Private Limited Dividend received 0.81 0.73
Miscellaneous income ß ß
Fees paid 0.25 -
Subscription to redeemable debentures 28.00 -
Interest on redeemable debentures 1.41 -
Interest accrued on loans - balance outstanding 1.41 -
Galaxy Mercantiles Limited Interest on optionally convertible debentures (OCDs) 6.21 -
Subscription to equity shares 73.81 -
Subscription to cumulative preference shares 9.99 -
Interest accrued on loans - balance outstanding 0.08 -
Investment in OCDs 136.12 -
Loan given and balance outstanding 1.65 -
(d) ENTI TI ES OVE R WHIC H CONTROL IS E XE RCISE D:
India PPP Capacity Building Trust Fees paid 6.83 2.39
Trade payables - balance outstanding 0.79 2.23
(e) KEY M ANAGE ME NT PE RSONNE L:
Dr. Rajiv B. Lall Remuneration paid 5.99 6.26 *
Mr. Vikram Limaye Remuneration paid 4.93 6.78 *
Dr. Rajiv B. Lall 80CCF bonds ß ß
Mr. Vikram Limaye 80CCF bonds ß ß
* includes perquisites on exercise of employee stock options under the ESOS
N O T E S T O F I N A N C I A L S TAT E M E N T S FOR THE YEAR ENDED MARCH 31, 2012

123S T A N D A L O N E A C C O U N T S
34 In accordance with Accounting Standard 19 on ‘Leases’ as notified under the Companies (Accounting Standards) Rules, 2006, the following disclosures
in respect of operating leases are made:
i. The Company has taken vehicles for certain employees under operating leases, which expire between April 2012 and March 2016 (Previous Year
August 2011 and March 2015). Salaries include gross rental expenses of ` 0.80 crore (Previous Year ` 0.37 crore). The committed lease rentals in
the future are:
AS AT MARCH 31, 2012 AS AT MARCH 31, 2011(` in crore) (` in crore)
Not later than one year 0.89 0.93
Later than one year and not later than five years 1.23 1.94
ii. The Company has taken office premises under operating leases, which expire between December 2015 and September 2018 (Previous Year
December 2015 and September 2018). Rent includes gross rental expenses of ` 8.54 crore (Previous Year ` 7.79 crore). The committed lease
rentals in the future are:
AS AT MARCH 31, 2012 AS AT MARCH 31, 2011(` in crore) (` in crore)
Not later than one year 8.63 8.54
Later than one year and not later than five years 35.20 37.99
Later than five years 1.89 7.74
iii. The Company has given office premises under non-cancellable operating lease, which expires in October 2012 (Previous Year October 2012).
Miscellaneous income includes income from such leases of ` 2.26 crore (Previous Year ` 2.08 crore). The future minimum lease rental is as
follows:
AS AT MARCH 31, 2012 AS AT MARCH 31, 2011(` in crore) (` in crore)
Not later than one year 1.32 2.26
Later than one year and not later than five years - 1.32
35 In accordance with Accounting Standard 20 on ‘Earnings Per Share’ as notified under the Companies (Accounting Standards) Rules, 2006:
i. The basic earnings per share has been calculated based on the following:
FOR THE YEAR ENDED MARCH 31, 2012
FOR THE YEAR ENDED MARCH 31, 2011
(` in crore) (` in crore)
Net profit after tax 1,602.96 1,277.14
Less: adjustment for dividend and dividend distribution tax on CCCPS 49.41 37.39
Net amount available for equity shareholders 1,553.55 1,239.76
Weighted average number of equity shares 1,469,679,676 1,418,087,937
ii. The reconciliation between the basic and the diluted earnings per share is as follows:
FOR THE YEAR ENDED MARCH 31, 2012
FOR THE YEAR ENDED MARCH 31, 2011
(`) (`)
Basic earnings per share 10.57 8.74
Effect of outstanding stock options (0.03) (0.06)
Diluted earnings per share 10.54 8.68
iii. The basic earnings per share has been computed by dividing the net profit after tax for the year available for equity shareholders by the
weighted average number of equity shares for the respective years, whereas the diluted earnings per share has been computed by dividing the
net profit after tax for the year available for equity shareholders by the weighted average number of equity shares, after giving dilutive effect
of the outstanding stock options for the respective periods. Since, the effect of the conversion of CCCPS was anti-dilutive in the previous year, it
has been ignored in the previous year. The relevant details as described above are as follows:
AS AT MARCH 31, 2012 AS AT MARCH 31, 2011
Weighted average number of shares for computation of basic earnings per share 1,469,679,676 1,418,087,937
Dilutive effect of outstanding stock options 4,741,438 10,165,050
Weighted average number of shares for computation of diluted earnings per share 1,474,421,114 1,428,252,987
N O T E S T O F I N A N C I A L S TAT E M E N T S FOR THE YEAR ENDED MARCH 31, 2012

I D F C A N N U A L R E P O R T 2 0 1 1 – 1 2124
36 C O N T I N G E N T L I A B I L I T I E S A N D C O M M I T M E N T S ( T O T H E E X T E N T N O T P R O V I D E D F O R )
AS AT MARCH 31, 2012 AS AT MARCH 31, 2011(` in crore) (` in crore)
(a) CO NTI NGENT LIABILITIE S
(i) Claims not acknowledged as debts in respect of :
Income-tax demands disputed by the Company (net of amounts provided).
The matters in dispute are under appeal. The demands have been paid / ad-
justed and will be received as refund if the matters are decided in favour of the
Company
94.99 109.50
(ii) Guarantees issued:
As a part of project assistance, the Company has also provided the following
guarantees:
Financial guarantees 2,245.27 1,301.34
Performance guarantees 227.01 259.00
Risk participation facility - 5.31
Other financial guarantees 78.31 35.75
(b) CAPI TAL COMMITME NTS
(i) Uncalled liability on shares and other investments partly paid 854.06 506.38
(ii) Estimated amount of contracts remaining to be executed on capital account
(net of advances)
0.16 1.38
37 The Company has entered into interest rate swaps in the nature of “fixed / floating” or “floating / fixed” for notional principal of ` 3,066.00
crore outstanding as on March 31, 2012 (Previous Year ` 2,391.00 crore) for varying maturities linked to various benchmarks for asset liability
management and hedging.
The Company has foreign currency borrowings of USD 81.18 crore (Previous Year USD 62.56 crore), against which the Company has undertaken
currency interest rate swaps and forward contracts of USD 81.18 crore (Previous Year USD 60.91 crore) to hedge foreign currency risk.
The Company has also entered in to coupon only currency swaps for notional principal of USD 8.41 crore (Previous Year USD 11.11 crore) to hedge the
foreign currency risk towards interest on the foreign currency borrowings.
38 There were no open interest in stock futures as at March 31, 2012. The details of open interest in stock futures as at March 31, 2011 are as under:
LONG POS ITION:
NAME OF FUTURE SERIES OF FUTURE NUMBER OF CONTRACTS NUMBER OF UNITS
Rural Electrification Corporation Limited 28-Apr-11 2 250,000
S HORT POS ITION:
NAME OF FUTURE SERIES OF FUTURE NUMBER OF CONTRACTS NUMBER OF UNITS
Larsen & Toubro Limited 28-Apr-11 1 35,000
Shree Renuka Sugars Limited 28-Apr-11 2 700,000
39 No amount is payable to ‘Suppliers’ registered under the Micro, Small and Medium Enterprises Development Act, 2006. No interest has been
paid / payable by the Company during the year to the ‘Suppliers’ covered under the Micro, Small and Medium Enterprises Development Act, 2006. The
above information takes into account only those suppliers who have responded to inquiries made by the Company for this purpose.
N O T E S T O F I N A N C I A L S TAT E M E N T S FOR THE YEAR ENDED MARCH 31, 2012

125S T A N D A L O N E A C C O U N T S
(c) M ATURI TY PATTE RN OF CE RTAIN ITE MS OF ASSE TS A ND LIABILITIES (` in crore)
1 DAY TO 30/31
DAYS (ONE
MONTH)
OVER ONE MONTH
TO TWO MONTHS
OVER TWO MONTHS
TO THREE MONTHS
OVER THREE
MONTHS TO SIX
MONTHS
OVER SIX MONTHS
TO ONE YEAR
OVER ONE YEAR TO
THREE YEARS
OVER THREE YEARS TO
FIVE YEARS
OVER FIVE YEARS
TOTAL
LI ABI LI TI E S
Borrowing from Banks 449.98 302.24 783.33 1,706.09 1,400.00 2,191.28 2,046.34 - 8,879.26
Market Borrowing 1,910.11 1,447.30 405.48 2,118.04 6,075.68 9,579.87 2,234.01 13,779.03 37,549.52
ASSETS
Advances 1,284.51 515.78 649.49 1,023.84 2,627.10 10,652.84 9,728.95 22,328.83 48,811.34
Investments 3,111.87 0.02 11.22 571.49 493.47 217.09 215.42 4,110.41 8,730.99
PREVI OUS YE AR (` in crore)
1 DAY TO 30/31
DAYS (ONE
MONTH)
OVER ONE MONTH
TO TWO MONTHS
OVER TWO MONTHS
TO THREE MONTHS
OVER THREE
MONTHS TO SIX
MONTHS
OVER SIX MONTHS
TO ONE YEAR
OVER ONE YEAR TO
THREE YEARS
OVER THREE YEARS TO
FIVE YEARS
OVER FIVE YEARS
TOTAL
LI ABI LI TI E S
Borrowing from Banks 308.13 208.68 765.00 610.00 1,337.26 4,601.50 1,447.54 - 9,278.11
Market Borrowing 1,512.68 262.37 594.08 662.19 3,257.47 6,640.09 2,476.05 11,614.23 27,019.16
ASSETS
Advances 981.23 187.60 293.42 797.09 2,345.50 8,235.02 6,198.74 19,130.87 38,169.47
Investments 3,198.17 229.54 94.71 148.12 17.05 350.10 90.13 4,121.85 8,249.67
40 The following additional information is disclosed in terms of the RBI circular (Ref. No. DNBS (PD) CC No. 225 / 03.02.001 / 2011-12 dated July 1, 2011):
(a ) CAPI TAL TO RISK ASSE TS RATIO (CRAR):
AS AT MARCH 31, 2012 AS AT MARCH 31, 2011
CRAR (%) 20.79 24.48
CRAR - Tier I Capital (%) 18.52 21.86
CRAR - Tier II Capital (%) 2.27 2.62
(b) EXPOSURE S TO RE AL E STATE SE CTOR* :
AS AT MARCH 31, 2012 AS AT MARCH 31, 2011
(` in crore) (` in crore)
DI RECT EXPOSURE
(i) Commercial Real Estate 3,159.22 2,670.40
Lending fully secured by mortgage (including securities in the process of being created) on commercial real estates (office building, retail space, multi-purpose commercial premises, multi-family residential buildings, multi-tenanted commercial premises, industrial or warehouse space, hotels, land acquisition, development and construction, etc.). Exposure would also include non-fund based (NFB) limits.
(ii) Investments in Mortgage Backed Securities (MBS) and other securitised exposures
a. Residential 0.84 1.06
b. Commercial Real Estate - -
I NDI RECT E XPOSURE
Fund based and non-fund based exposures on National Housing Bank (NHB) and Housing Finance Companies (HFCs). 173.44 258.58
* based on amounts sanctioned.
N O T E S T O F I N A N C I A L S TAT E M E N T S FOR THE YEAR ENDED MARCH 31, 2012

I D F C A N N U A L R E P O R T 2 0 1 1 – 1 2126
(d) BORROWE R GROU P-WISE CLASSIFICATION OF ASSETS F INANCED:
AS AT MARCH 31, 2012 AS AT MARCH 31, 2011
(` in crore) (` in crore)
AMOUNT NET OF PROVISION *
AMOUNT NET OF PROVISION *
1. RELATED PARTIE S
(a) Subsidiaries - -
(b) Companies in the same group - -
(c) Other related parties 165.77 -
2. OTHER THAN RE LATE D PARTIE S 48,645.57 38,169.47
TOTAL 48,811.34 38,169.47
* excludes provision for contingencies.
(e) I NVESTOR GROU P-WISE C LASSIFICATION OF ALL I NV ESTMENTS (CURRENT AND NON-CURRENT) IN SHARES AND SECURITIES (BOT H QUOTE D AND UNQUOTE D):
AS AT MARCH 31, 2012 AS AT MARCH 31, 2011
(` in crore) (` in crore)
MARKET VALUE /
BREAK UP VALUE / FAIR VALUE / NAV
BOOK VALUE NET OF
PROVISION
MARKET VALUE /
BREAK UP VALUE / FAIR VALUE / NAV
BOOK VALUE NET OF
PROVISION
1. RELATED PARTIE S
(a) Subsidiaries 468.08 1,143.91 515.92 1,341.14
(b) Companies in the same group - - - -
(c) Other Related Parties 79.29 103.89 19.78 20.09
2. OTHER THAN RE LATE D PARTIE S 7,962.33 7,237.91 6,890.39 6,746.19
TOTAL 8,509.70 8,485.71 7,426.09 8,107.42
(f) OTHER I NFORMATION:
AS AT MARCH 31, 2012 AS AT MARCH 31, 2011
(` in crore) (` in crore)
1. GROSS NO N-PE RFORMING ASSE TS
(a) Related parties - -
(b) Other than Related parties 148.32 79.73
2. NET NON-PE RFORMING ASSE TS
(a) Related parties - -
(b) Other than Related parties 71.43 38.90
3. ASSETS ACQU IRE D IN SATISFACTION OF DE BT - -
N O T E S T O F I N A N C I A L S TAT E M E N T S FOR THE YEAR ENDED MARCH 31, 2012

127S T A N D A L O N E A C C O U N T S
N O T E S T O F I N A N C I A L S TAT E M E N T S FOR THE YEAR ENDED MARCH 31, 2012
41 I N T E R E S T A N D R E PAY M E N T T E R M S O F L O N G -T E R M B O R R O W I N G S - D E B E N T U R E S ( N O N C O N V E R T I B L E ) ( S E C U R E D )
AS AT MARCH 31, 2012 AS AT MARCH 31, 2011 (` in crore) (` in crore)
RESIDUAL MATURITY BALANCE OUTSTANDING
INTEREST RATE (%)
BALANCE OUTSTANDING
INTEREST RATE (%)
F I XED RATE
Above 5 years 12,402.92 7.50 to 9.91 10,615.46 7.50 to 9.35
3-5 years 1,880.00 7.45 to 9.40 2,275.00 7.25 to 8.20
1-3 years 8,975.00 6.00 to 11.66 5,928.00 6.00 to 11.66
F LOATI NG RATE
Above 5 years 40.00 MIBOR+150 bps 40.00 MIBOR+150 bps
1-3 years - NA 120.00 MIBOR+170 bps to
183 bps
TOTAL 23,297.92 18,978.46
42 I N T E R E S T A N D R E PAY M E N T T E R M S O F L O N G -T E R M L O A N S - F R O M B A N K S ( S E C U R E D )
AS AT MARCH 31, 2012 AS AT MARCH 31, 2011 (` in crore) (` in crore)
RESIDUAL MATURITY BALANCE OUTSTANDING
INTEREST RATE (%)
BALANCE OUTSTANDING
INTEREST RATE (%)
F I XED RATE
3-5 years 255.74 7.41 555.74 7.25 to 7.50
1-3 years 1,441.67 8.35 to 10.65 3,977.24 7.00 to 9.89
F LOATI NG RATE
3-5 years 1,790.60 6M LIBOR +
175 bps to 275 bps
891.80 6M LIBOR
+ 175 bps
1-3 years 749.61 6M LIBOR +
300 bps to 345 bps
624.26 6M LIBOR
+ 300 bps
TOTAL 4,237.62 6,049.04
43 I N T E R E S T A N D R E PAY M E N T T E R M S O F L O N G -T E R M L O A N S - F R O M O T H E R ( S E C U R E D )
AS AT MARCH 31, 2012 AS AT MARCH 31, 2011 (` in crore) (` in crore)
RESIDUAL MATURITY BALANCE OUTSTANDING
INTEREST RATE (%)
BALANCE OUTSTANDING
INTEREST RATE (%)
F I XED RATE
1-3 years 668.00 10.10 - NA
F LOATI NG RATE
Above 5 years 346.80 INBMK + 184 bps 346.80 INBMK + 184 bps
Above 5 years 522.56 6M LIBOR +
60 bps to 235 bps
175.18 6M LIBOR + 60 bps
3-5 years 299.20 6M LIBOR +
70 bps to 115 bps
97.54 6M LIBOR+115 bps
1-3 years - NA 684.77 6M LIBOR +
45 bps to 70 bps
TOTAL 1,836.56 1,304.29

I D F C A N N U A L R E P O R T 2 0 1 1 – 1 2128
44 I N T E R E S T A N D R E PAY M E N T T E R M S O F S U B O R D I N AT E D D E B T F R O M T H E G O V E R N M E N T O F I N D I A ( U N S E C U R E D )
AS AT MARCH 31, 2012 AS AT MARCH 31, 2011
(` in crore) (` in crore)
RESIDUAL MATURITY BALANCE OUTSTANDING
INTEREST RATE (%)
BALANCE OUTSTANDING
INTEREST RATE (%)
29-Sep-47 350.00 5 Year G-Sec + 25
bps
350.00 5 Year G-Sec +
25 bps
17-Mar-47 300.00 5 Year G-Sec + 25
bps
300.00 5 Year G-Sec +
25 bps
TOTAL 650.00 650.00
45 U T I L I S AT I O N O F M O N E Y R A I S E D T H R O U G H P U B L I C I S S U E S
During the year, the Company raised ` 1,387.46 crore (Previous Year ` 1,451.76 crore) through public issue of long-term Infrastructure Bonds eligible
for deduction under Section 80CCF of the Income-tax Act, 1961 of which ` 1,208.29 crore (Previous Year ` 1,228.33 crore) has been utilised towards
lending to infrastructure projects. ` 179.17 crore (Previous Year ` 223.43 crore) remained unutilised as on the Balance Sheet date pending regulatory
approvals.
During the previous year, the Company had issued and allotted 157,752,090 equity shares of ` 10 each at a premium of ` 158.25 per share and
84,000,000 CCCPS of ` 100 each at par pursuant to a qualified institutional placement. The proceeds of the issue were utilised for general business
purposes.
46 The Revised Schedule VI to the Companies Act, 1956 has become effective from April 1, 2011 for preparation and presentation of financial
statements. This has significantly impacted the disclosure and presentation made in the financial statements. Accordingly, the figures for the
previous year have been reclassified, wherever necessary to conform with the current year’s classification.
47 Figures of ` 50,000 or less have been denoted by ß.
FOR AND ON BEHALF OF THE BOARD OF DIRECTORS OF
INFRASTRUCTURE DEVELOPMENT FINANCE COMPANY LIMITED
DEEPAK S. PAREKH RAJIV B. LALL
Chairman Managing Director & CEO
SU NIL KAKAR MAH ENDR A N. SHAH
Mumbai | May 8, 2012 Chief Financial Officer Company Secretary
N O T E S T O F I N A N C I A L S TAT E M E N T S FOR THE YEAR ENDED MARCH 31, 2012

DesignItu Chaudhuri Design | www.icdindia.com
Printed atRepro India Ltd.
This Annual Report is printed onECO-FRIENDLY Paper

INFRASTRUCTURE DEVELOPMENT FINANCE COMPANY LIMITED
Registered Office
KRM Tower, 8th floorNo.1, Harrington RoadChetpetChennai 600 031
TEL +91 (44) 4564 4000FAX +91 (44) 4564 4022
Corporate Office
Naman Chambers, C-32, G-BlockBandra-Kurla ComplexBandra (East)Mumbai 400 051
TEL +91 (22) 4222 2000FAX +91 (22) 2654 0354
www.idfc.com [email protected]


![[Www.fisierulmeu.ro] 111603855 Fileshare Ro Book Des Ecn Complet Ocr](https://static.fdocuments.us/doc/165x107/55cfe3dd5503467d968b6a7a/wwwfisierulmeuro-111603855-fileshare-ro-book-des-ecn-complet-ocr.jpg)