Balance of Payments Outputs of the Balance of Payments Division CSO 23/2/2012 Stephen Treacy &...
32
Balance of Payments Outputs of the Balance of Payments Division CSO 23/2/2012 Stephen Treacy & Stephen McDonagh Balance of Payments Analysis & Dissemination
-
Upload
jasmin-mccoy -
Category
Documents
-
view
215 -
download
0
Transcript of Balance of Payments Outputs of the Balance of Payments Division CSO 23/2/2012 Stephen Treacy &...
Balance of PaymentsOutputs of the Balance of Payments Division
CSO 23/2/2012
Stephen Treacy & Stephen McDonagh
Balance of Payments Analysis & Dissemination
What this presentation will cover
Balance of Payments (BoP) statistics – ST
International Investment Position (IIP) and related statistics – ST
Resident holdings of foreign Portfolio Securities – ST
International Trade in Services – SMcD
Foreign Direct Investment – SMcD
Central Statistics Office, Ireland 2
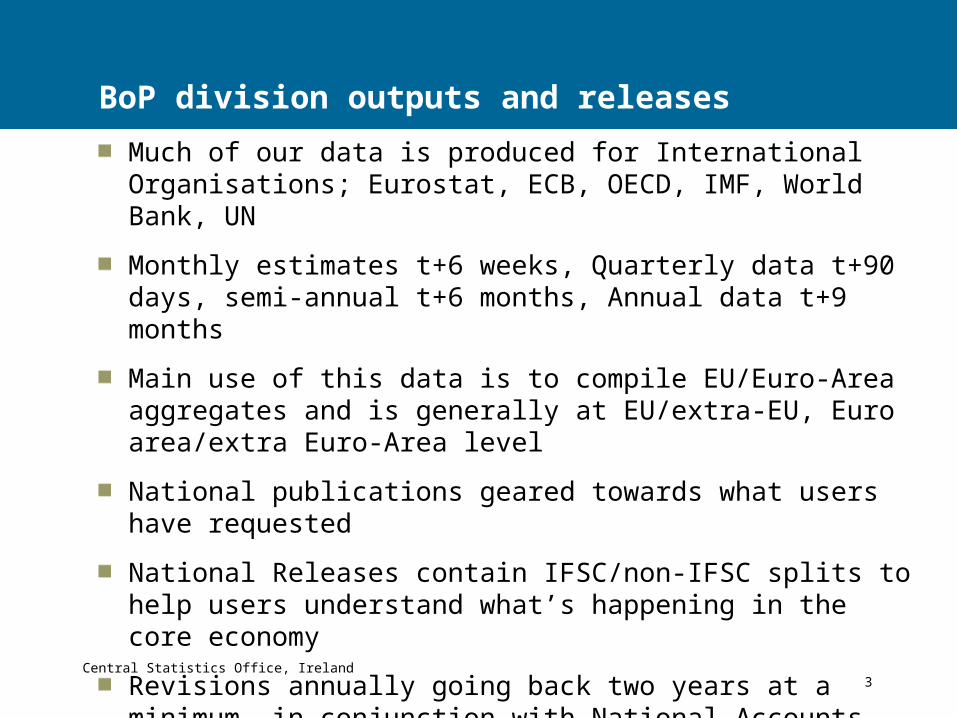
BoP division outputs and releases
Much of our data is produced for International Organisations; Eurostat, ECB, OECD, IMF, World Bank, UN
Monthly estimates t+6 weeks, Quarterly data t+90 days, semi-annual t+6 months, Annual data t+9 months
Main use of this data is to compile EU/Euro-Area aggregates and is generally at EU/extra-EU, Euro area/extra Euro-Area level
National publications geared towards what users have requested
National Releases contain IFSC/non-IFSC splits to help users understand what’s happening in the core economy
Revisions annually going back two years at a minimum, in conjunction with National Accounts (Financial, non-Financial, Sector Accounts)
Revisions include corrections, annual data and new data sources
Central Statistics Office, Ireland 3
Central Statistics Office, Ireland 4
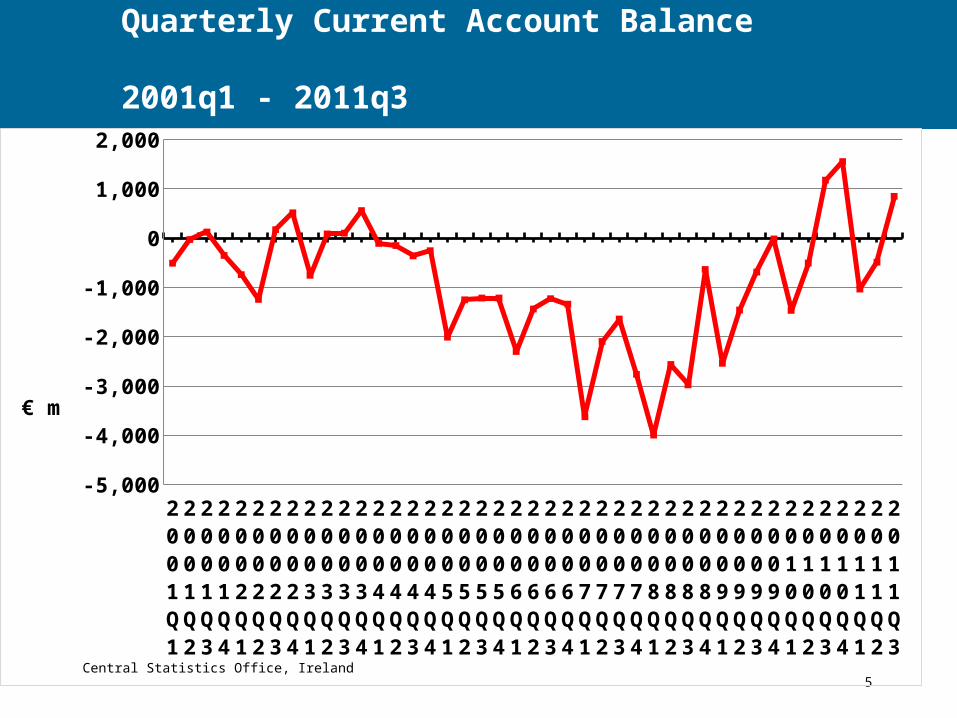
Quarterly Current Account Balance 2001q1 - 2011q3
Central Statistics Office, Ireland 5
2001 Q1
2001 Q2
2001 Q3
2001 Q4
2002 Q1
2002 Q2
2002 Q3
2002 Q4
2003 Q1
2003 Q2
2003 Q3
2003 Q4
2004 Q1
2004 Q2
2004 Q3
2004 Q4
2005 Q1
2005 Q2
2005 Q3
2005 Q4
2006 Q1
2006 Q2
2006 Q3
2006 Q4
2007 Q1
2007 Q2
2007 Q3
2007 Q4
2008 Q1
2008 Q2
2008 Q3
2008 Q4
2009 Q1
2009 Q2
2009 Q3
2009 Q4
2010 Q1
2010 Q2
2010 Q3
2010 Q4
2011 Q1
2011 Q2
2011 Q3
-5,000
-4,000
-3,000
-2,000
-1,000
0
1,000
2,000
€ m
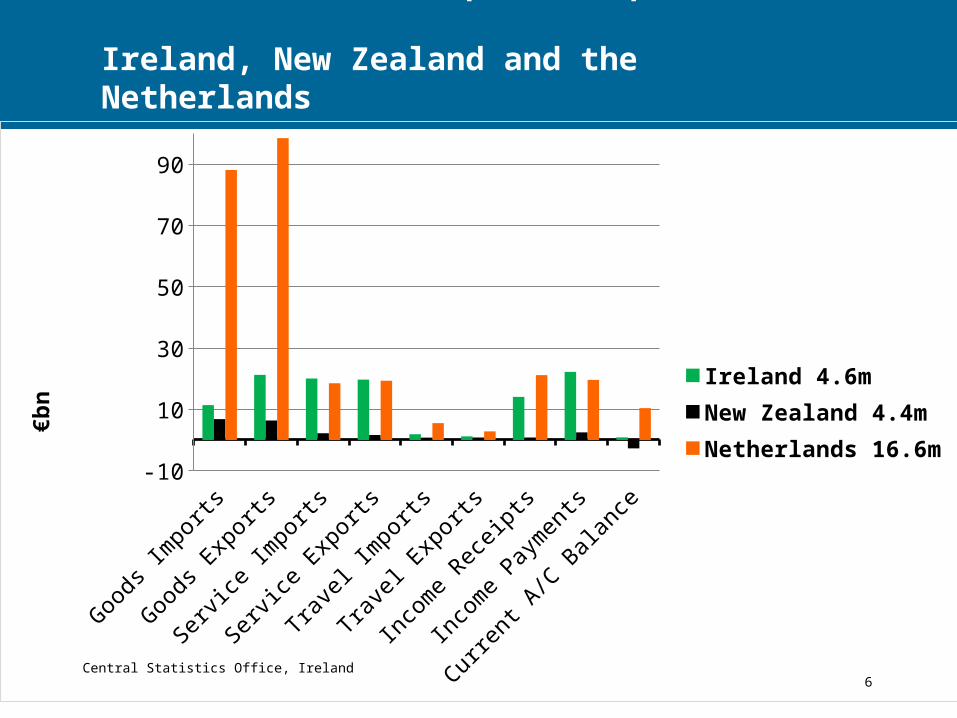
Current Account comparison q3 2011: Ireland, New Zealand and the Netherlands
Central Statistics Office, Ireland 6
Goo
ds Im
ports
Goo
ds E
xpor
ts
Servic
e Im
ports
Servic
e Exp
orts
Trave
l Impo
rts
Trave
l Exp
orts
Inco
me
Recei
pts
Inco
me
Paym
ents
Curre
nt A
/C B
alan
ce-10
10
30
50
70
90
Ireland 4.6mNew Zealand 4.4mNetherlands 16.6m
€b
n
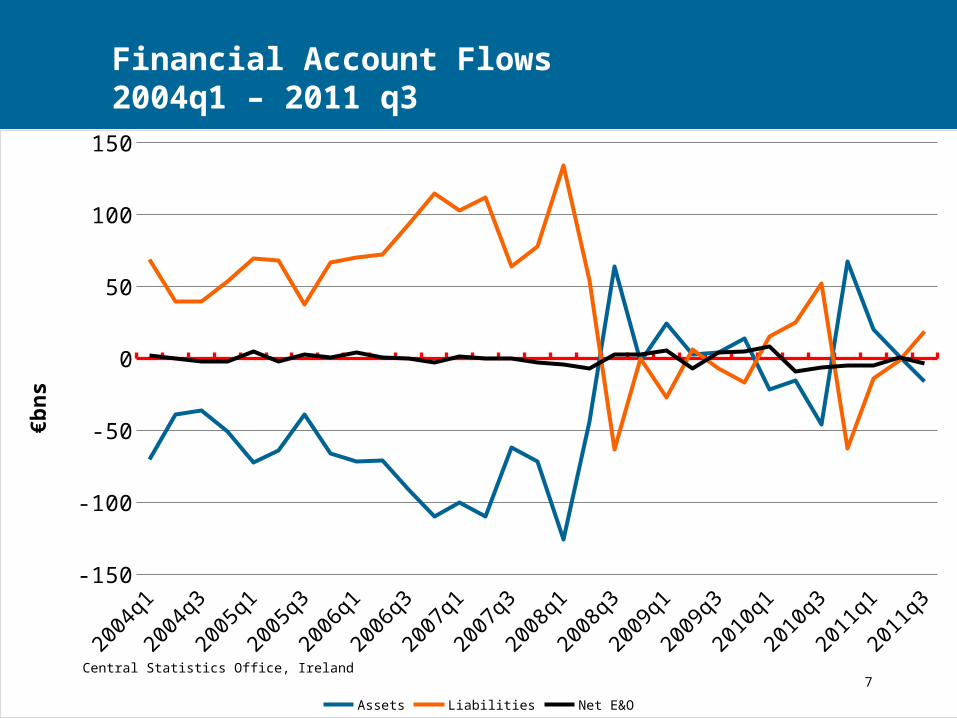
Financial Account Flows 2004q1 – 2011 q3
Central Statistics Office, Ireland 720
04q1
2004
q3
2005
q1
2005
q3
2006
q1
2006
q3
2007
q1
2007
q3
2008
q1
2008
q3
2009
q1
2009
q3
2010
q1
2010
q3
2011
q1
2011
q3-150
-100
-50
0
50
100
150
Assets Liabilities Net E&O
€b
ns
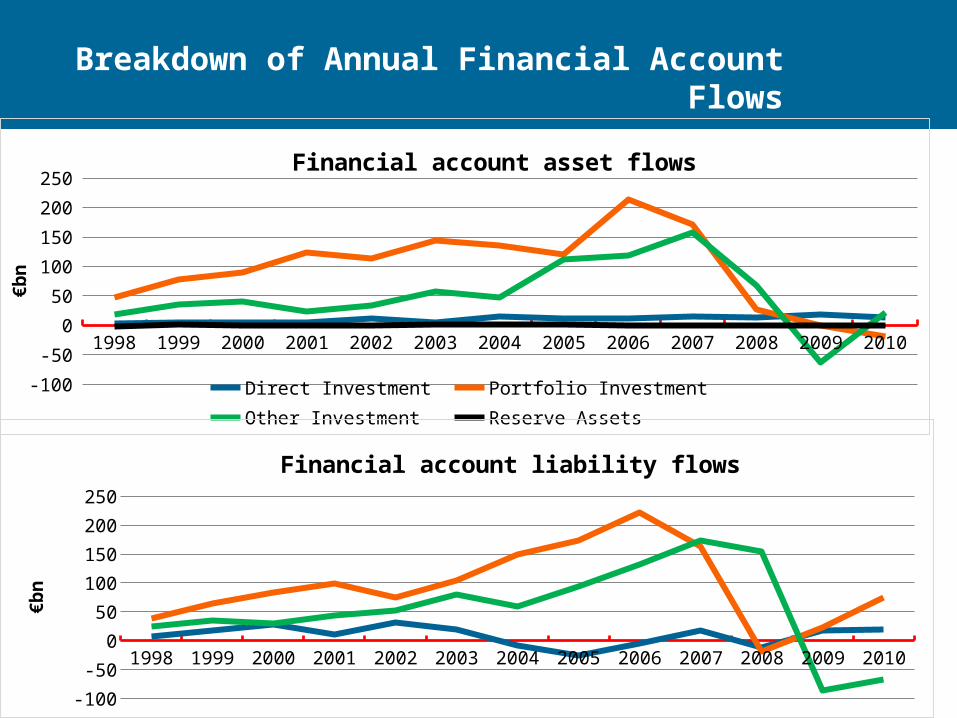
Breakdown of Annual Financial Account Flows
1998 1999 2000 2001 2002 2003 2004 2005 2006 2007 2008 2009 2010
-100
-50
0
50
100
150
200
250Financial account asset flows
Direct Investment Portfolio Investment Other Investment Reserve Assets
€b
n
1998 1999 2000 2001 2002 2003 2004 2005 2006 2007 2008 2009 2010
-100
-50
0
50
100
150
200
250Financial account liability flows
€b
n
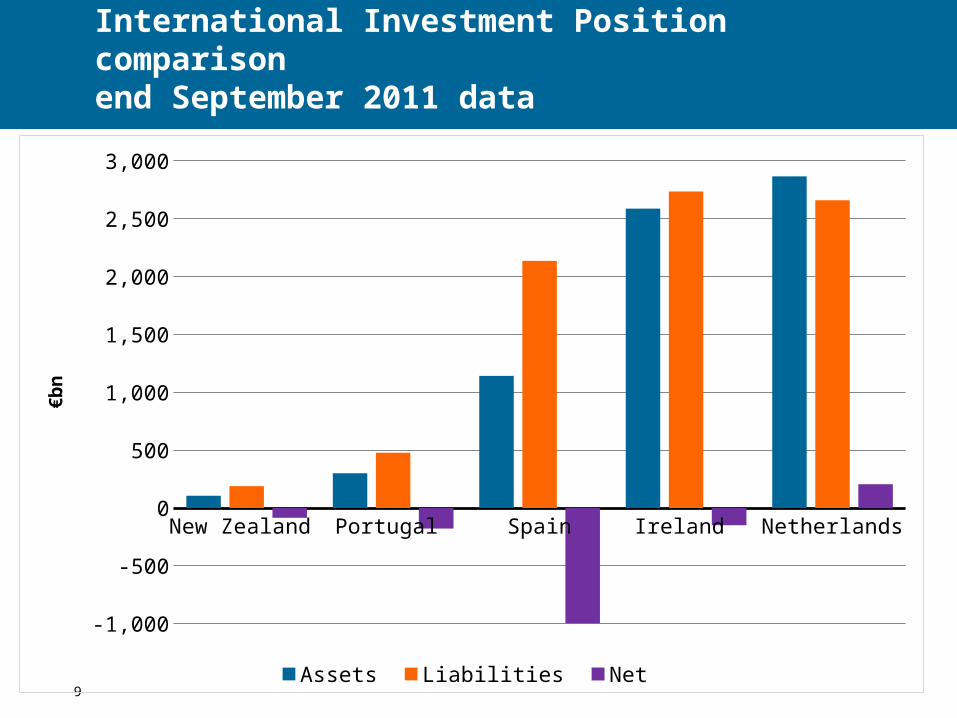
International Investment Position comparisonend September 2011 data
9
€ Millions
New Zealand Portugal Spain Ireland Netherlands
-1,000
-500
0
500
1,000
1,500
2,000
2,500
3,000
Assets Liabilities Net
€b
n

Net International Investment Position2000 – quarter 3 2011
Central Statistics Office, Ireland 10
2000
2001
2002
2003
2004
2005
2006
2007
2008
2009
2010
2011
q3-200
-150
-100
-50
0
50
100
Net IFSC Non-IFSC
€bn
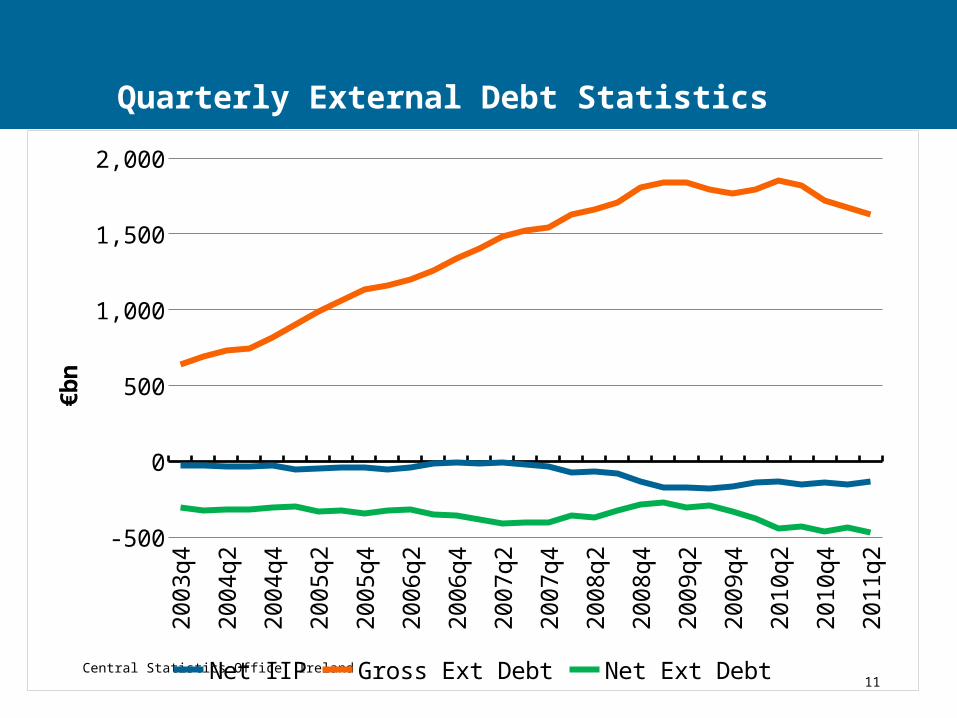
Quarterly External Debt Statistics
Central Statistics Office, Ireland 11
2003
q4
2004
q2
2004
q4
2005
q2
2005
q4
2006
q2
2006
q4
2007
q2
2007
q4
2008
q2
2008
q4
2009
q2
2009
q4
2010
q2
2010
q4
2011
q2
-500
0
500
1,000
1,500
2,000
Net IIP Gross Ext Debt Net Ext Debt
€bn
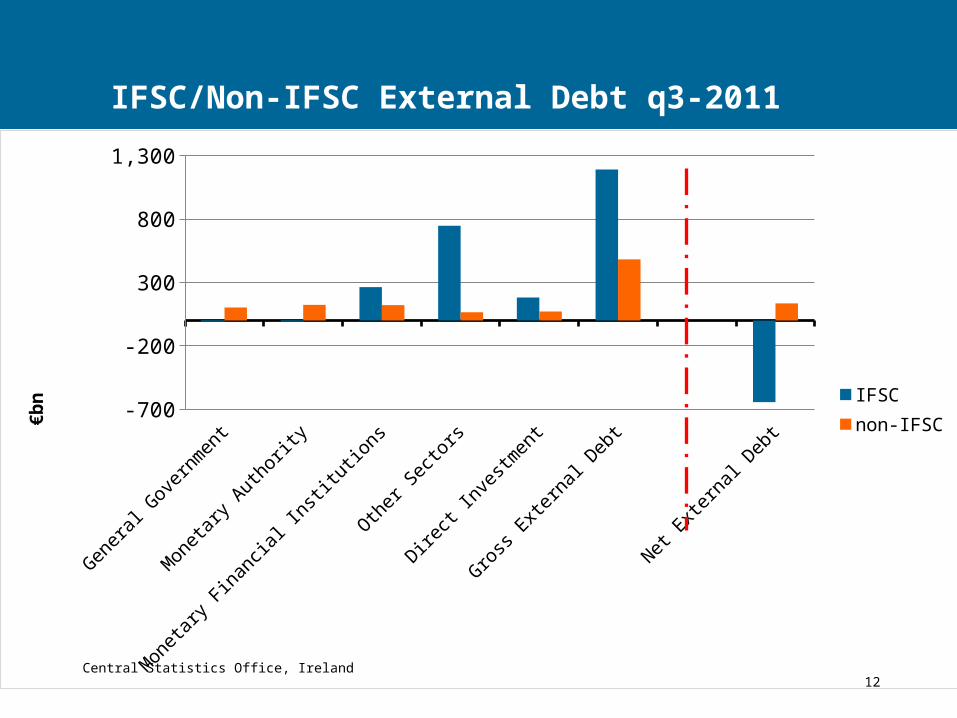
IFSC/Non-IFSC External Debt q3-2011
Central Statistics Office, Ireland 12
Genera
l Gove
rnm
ent
Moneta
ry A
uthorit
y
Moneta
ry F
inancia
l Inst
itutio
ns
Oth
er Sect
ors
Direct
Inve
stm
ent
Gro
ss E
xtern
al Debt
Net Ext
ernal D
ebt-700
-500
-300
-100
100
300
500
700
900
1,100
1,300
IFSCnon-IFSC€
bn
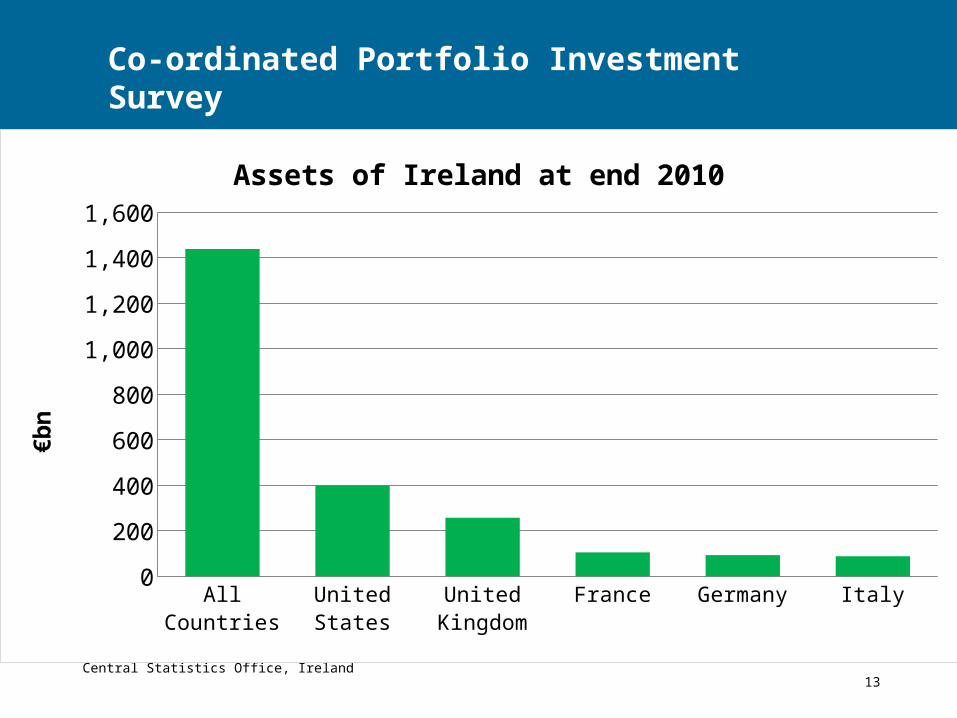
Co-ordinated Portfolio Investment Survey
Central Statistics Office, Ireland 13
All Countries United States
United Kingdom
France Germany Italy0
200
400
600
800
1,000
1,200
1,400
1,600
Assets of Ireland at end 2010
€bn
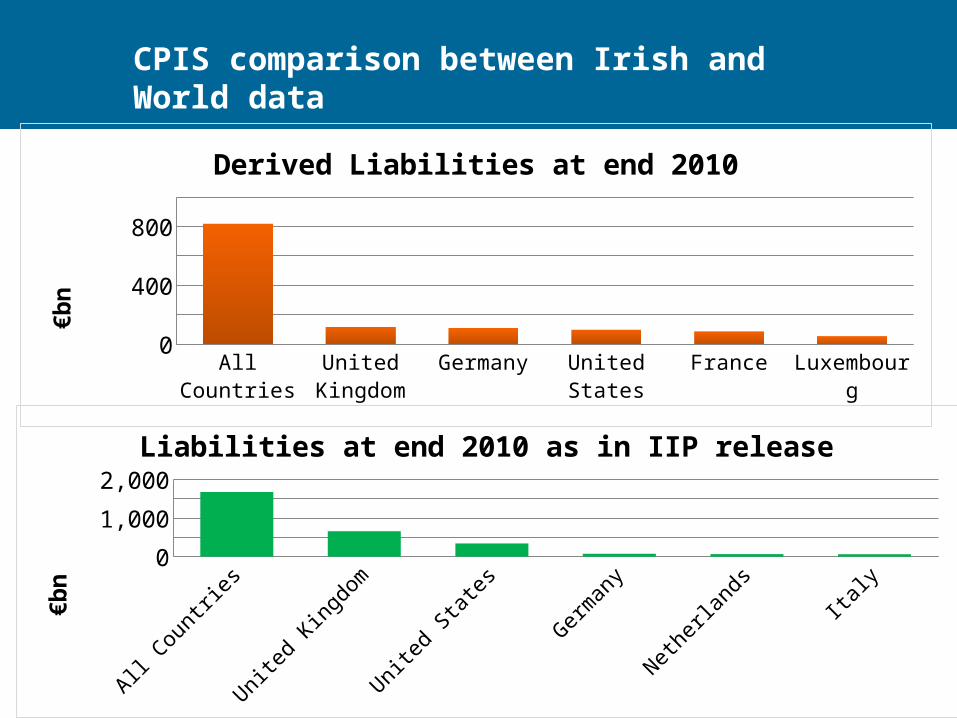
CPIS comparison between Irish and World data
All Coun-tries
United Kingdom
Germany United States
France Luxembourg0
200
400
600
800
1,000
Derived Liabilities at end 2010
€bn
All Countries United Kingdom
United States
Germany Netherlands Italy0
500
1,000
1,500
2,000
Liabilities at end 2010 as in IIP release
€bn
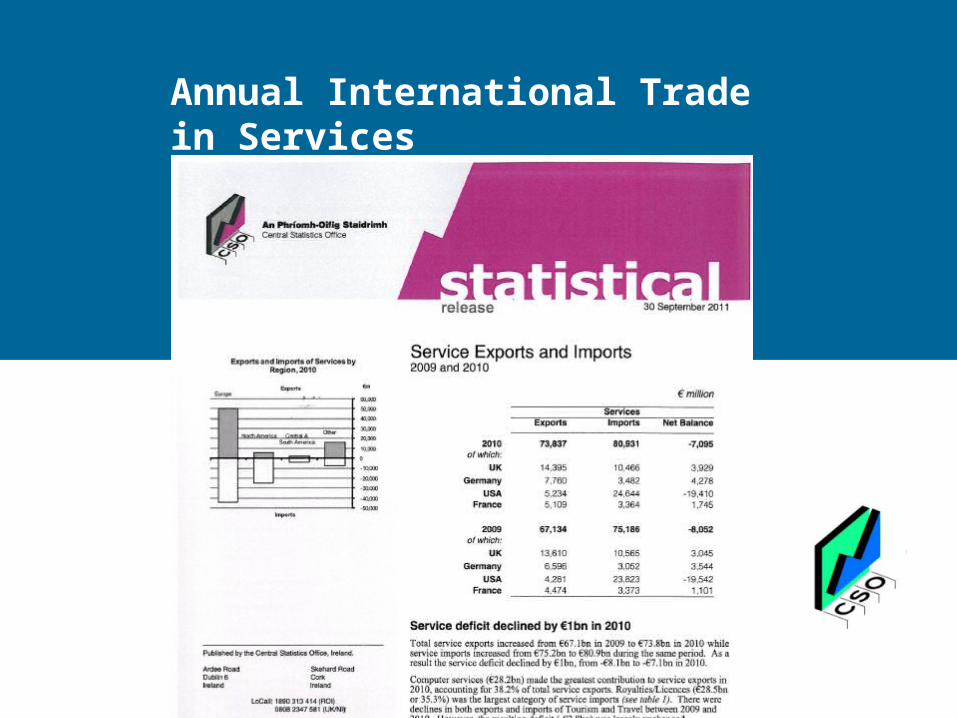
Annual International Trade in Services
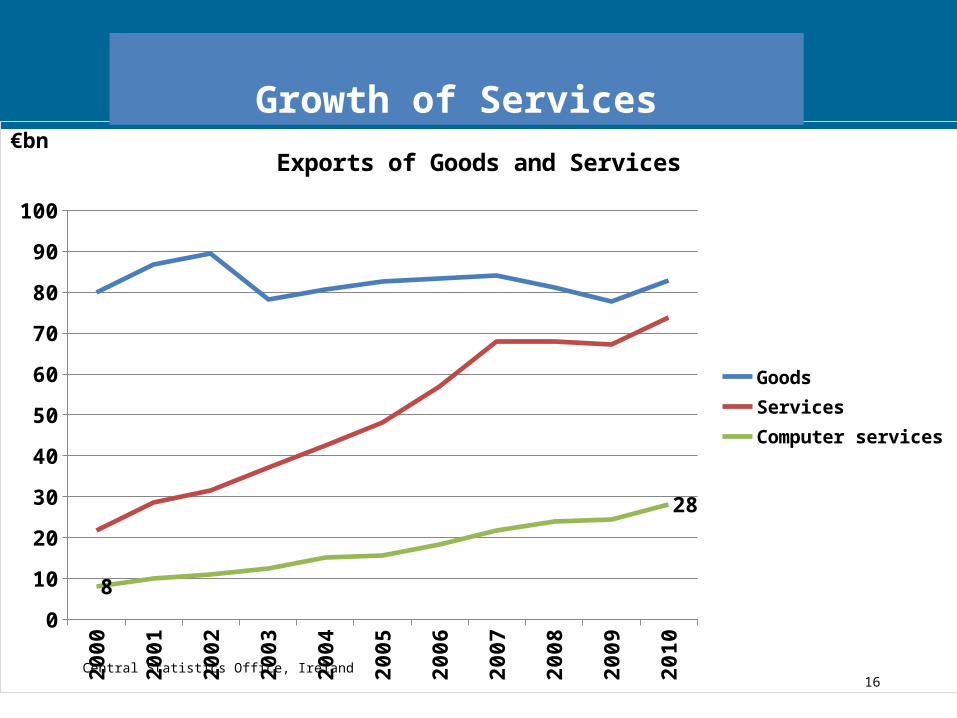
Growth of Services
Central Statistics Office, Ireland 162000
2001
2002
2003
2004
2005
2006
2007
2008
2009
2010
0
10
20
30
40
50
60
70
80
90
100
8
28
Exports of Goods and Services
GoodsServicesComputer services
€bn
Growth of Services
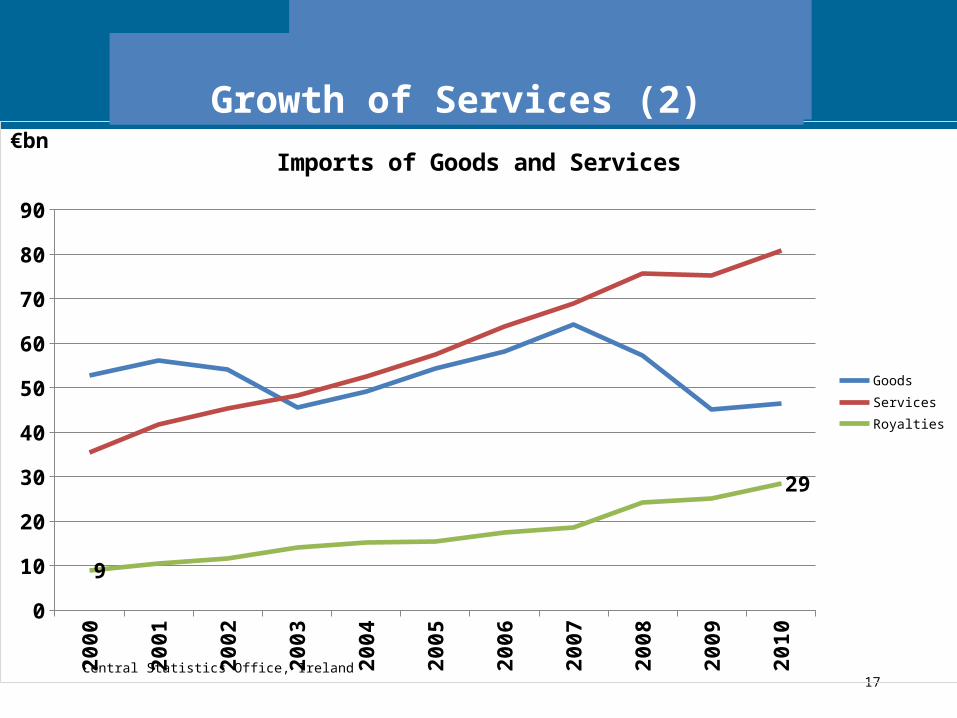
Alternative
Central Statistics Office, Ireland 17
2000
2001
2002
2003
2004
2005
2006
2007
2008
2009
2010
0
10
20
30
40
50
60
70
80
90
9
29
Imports of Goods and Services
GoodsServicesRoyalties
€bn
Growth of Services (2)
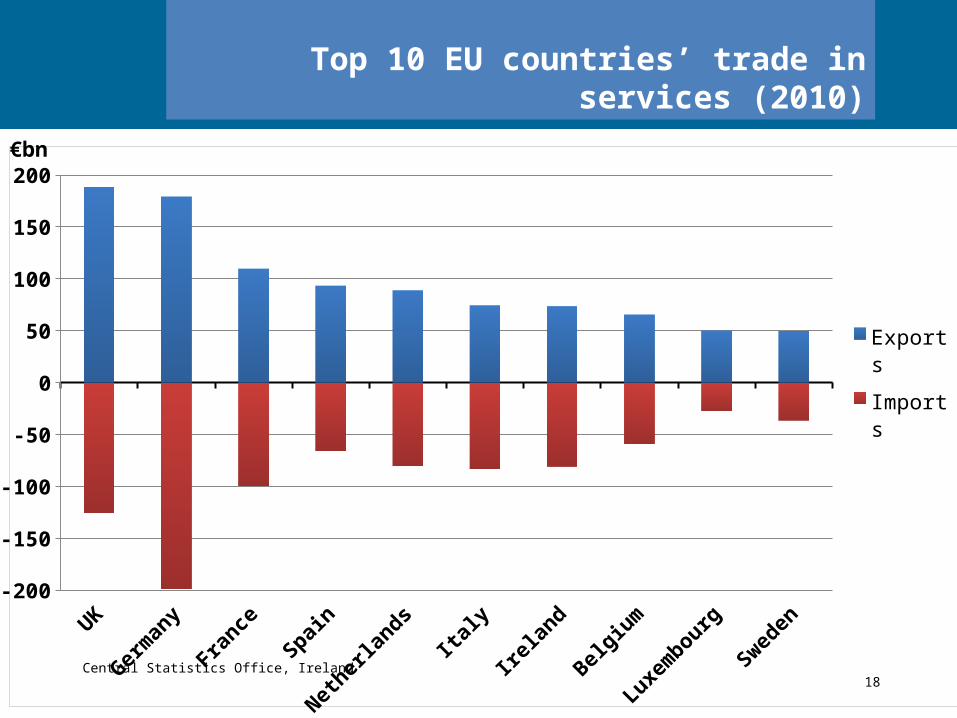
Top 10 EU countries’ trade in services (2010)
Central Statistics Office, Ireland 18
UK
German
y
France
Spain
Netherlands
Italy
Irelan
d
Belgium
Luxe
mbourg
Sweden
-200
-150
-100
-50
0
50
100
150
200
Exports
Imports
€bn
Central Statistics Office, Ireland 19
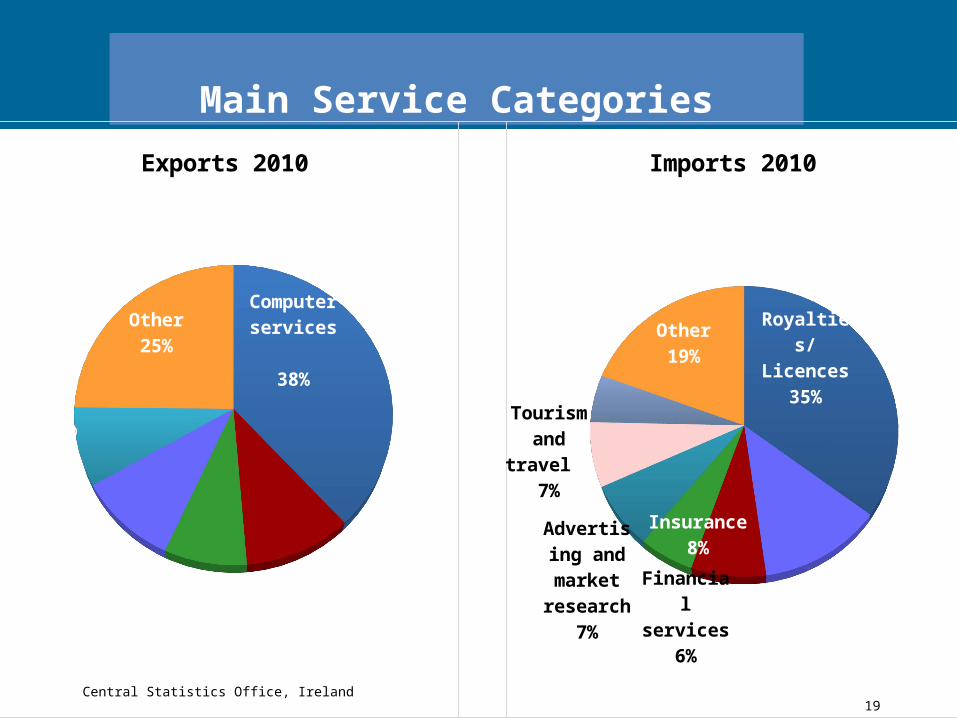
Main Service Categories
Computer services
38%
Insurance11%Financial services
8%
Merchant-ing 10%
Opera-tional
Leasing8%
Other25%
Exports 2010
Royalties/ Licences
35%
Other trade re-
lated services
13%
Insurance8%
Financial services
6%
Advertis-ing and market
research7%
Tourism and travel
7%
R&D5%
Other19%
Imports 2010
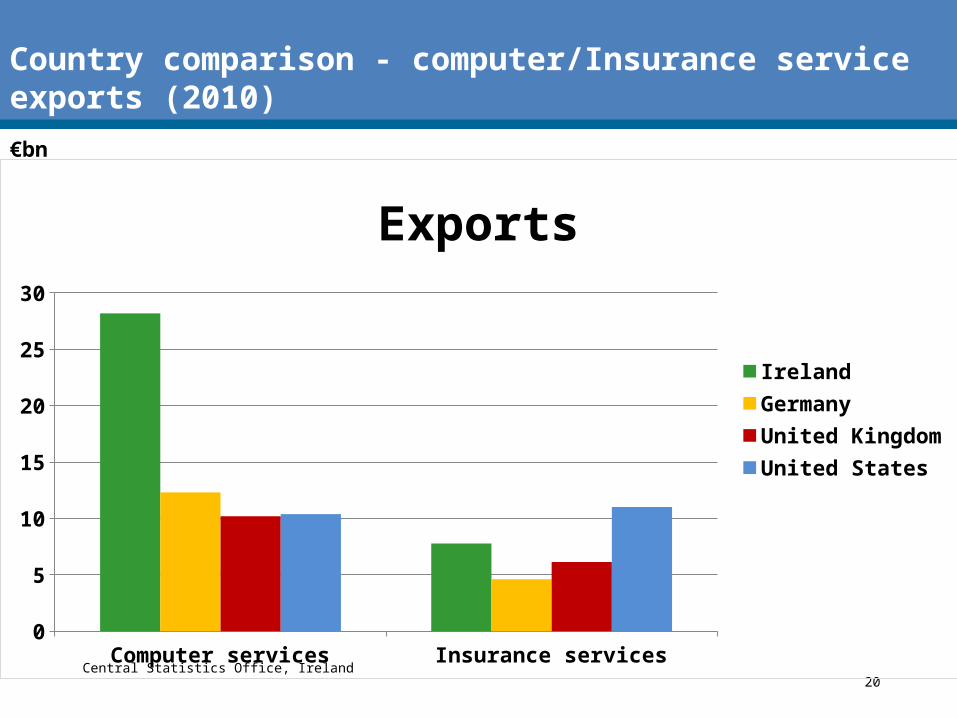
Country comparison - computer/Insurance service exports (2010)
Central Statistics Office, Ireland 20
Computer services Insurance services0
5
10
15
20
25
30
Exports
IrelandGermanyUnited KingdomUnited States
€bn
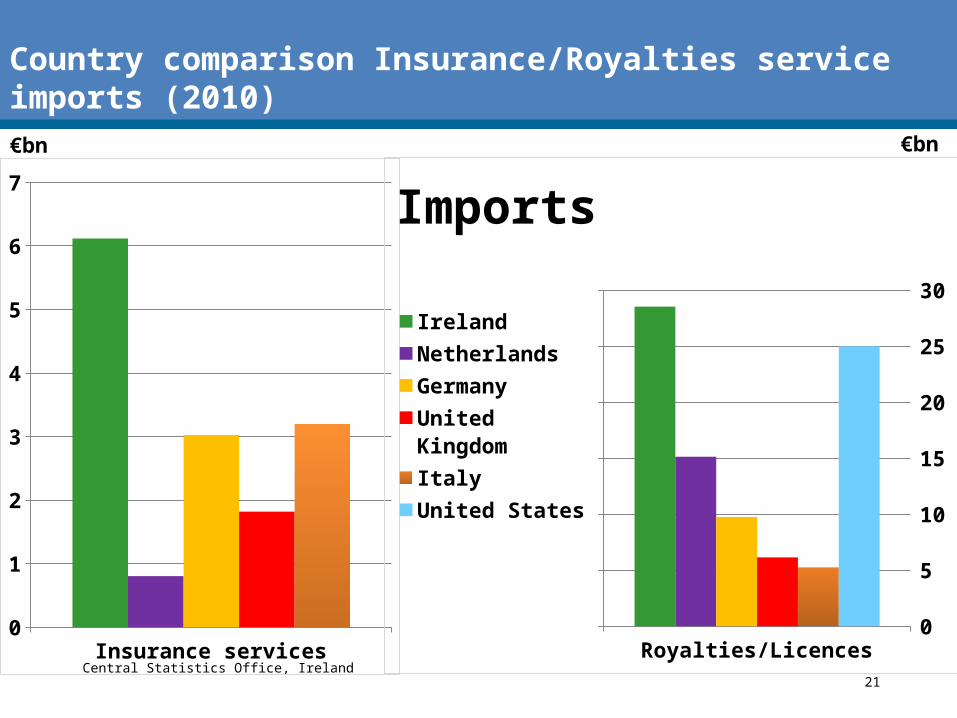
Country comparison Insurance/Royalties service imports (2010)
Central Statistics Office, Ireland 21
Insurance services0
1
2
3
4
5
6
7
Royalties/Licences0
5
10
15
20
25
30
Imports
IrelandNetherlandsGermanyUnited KingdomItalyUnited States
€bn €bn
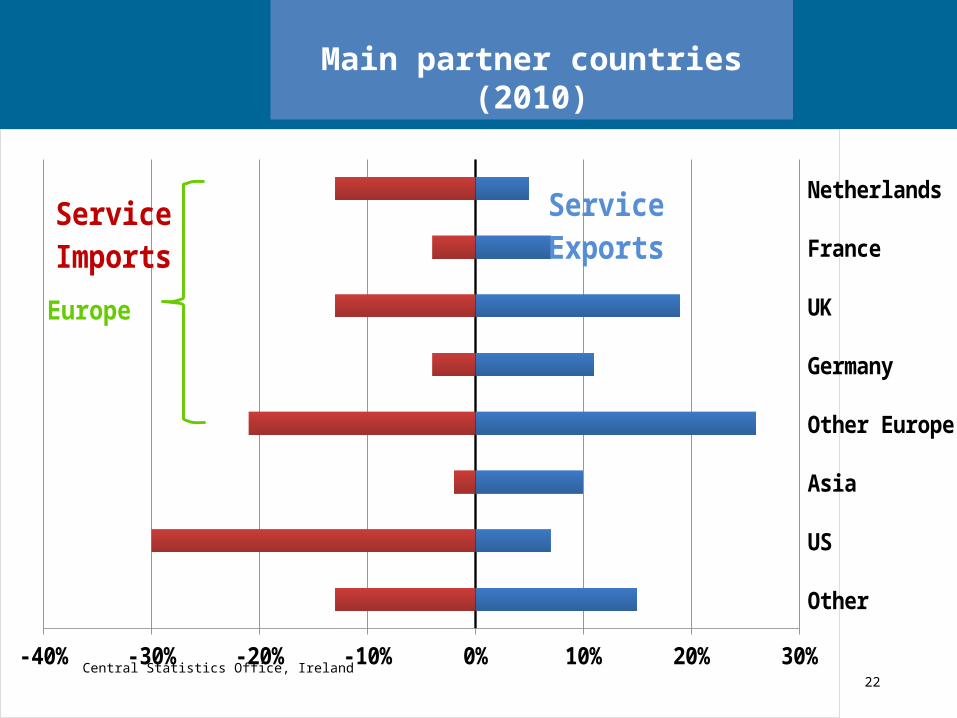
Main partner countries (2010)
Central Statistics Office, Ireland 22
Other
US
Asia
Other Europe
Germany
UK
France
Netherlands
-40% -30% -20% -10% 0% 10% 20% 30%
Service Exports
Service Im-ports
Europe

Annual Foreign Direct Investment
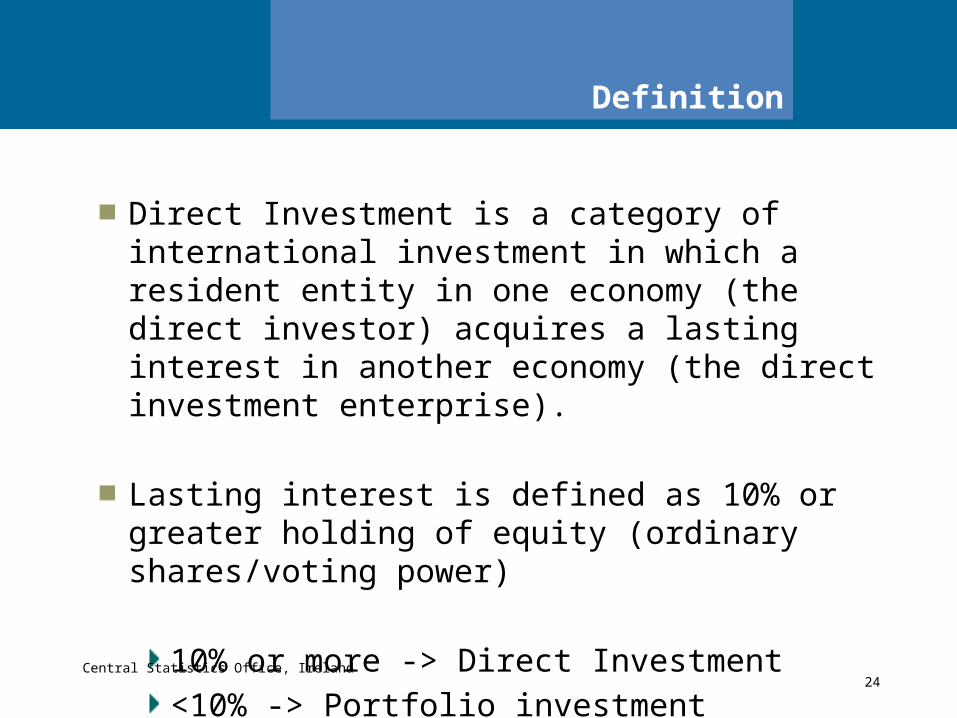
Definition
Direct Investment is a category of international investment in which a resident entity in one economy (the direct investor) acquires a lasting interest in another economy (the direct investment enterprise).
Lasting interest is defined as 10% or greater holding of equity (ordinary shares/voting power)
10% or more -> Direct Investment
<10% -> Portfolio investment
Central Statistics Office, Ireland 24
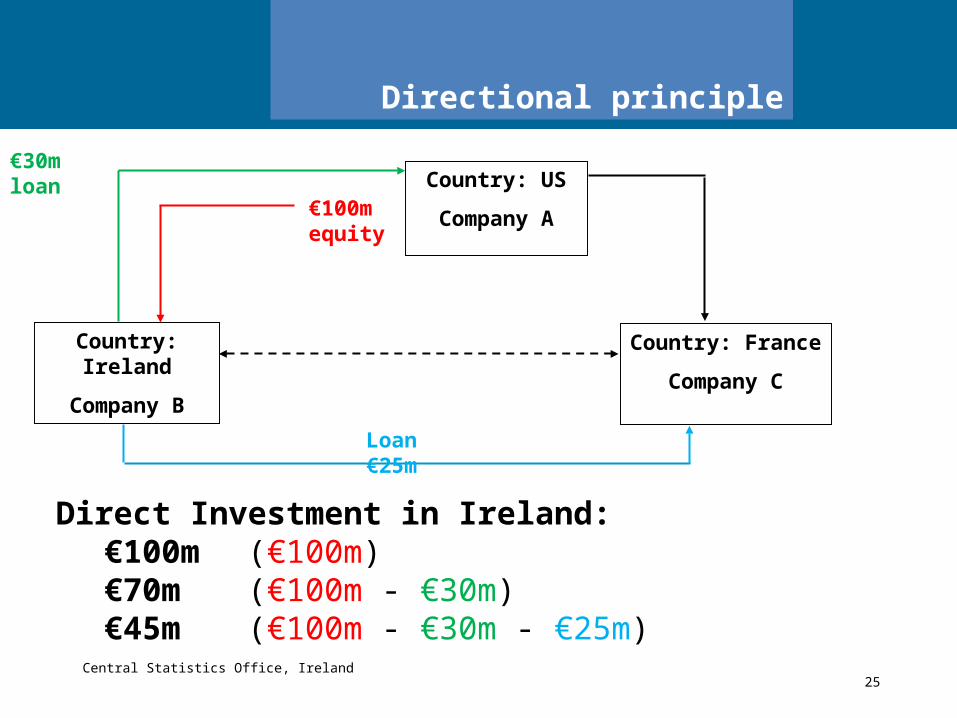
Directional principle
Central Statistics Office, Ireland 25
Country: US
Company A
Country: Ireland
Company B
Country: France
Company C
€100m equity
€30m loan
Loan €25m
Direct Investment in Ireland:€100m (€100m)€70m (€100m - €30m)€45m (€100m - €30m - €25m)
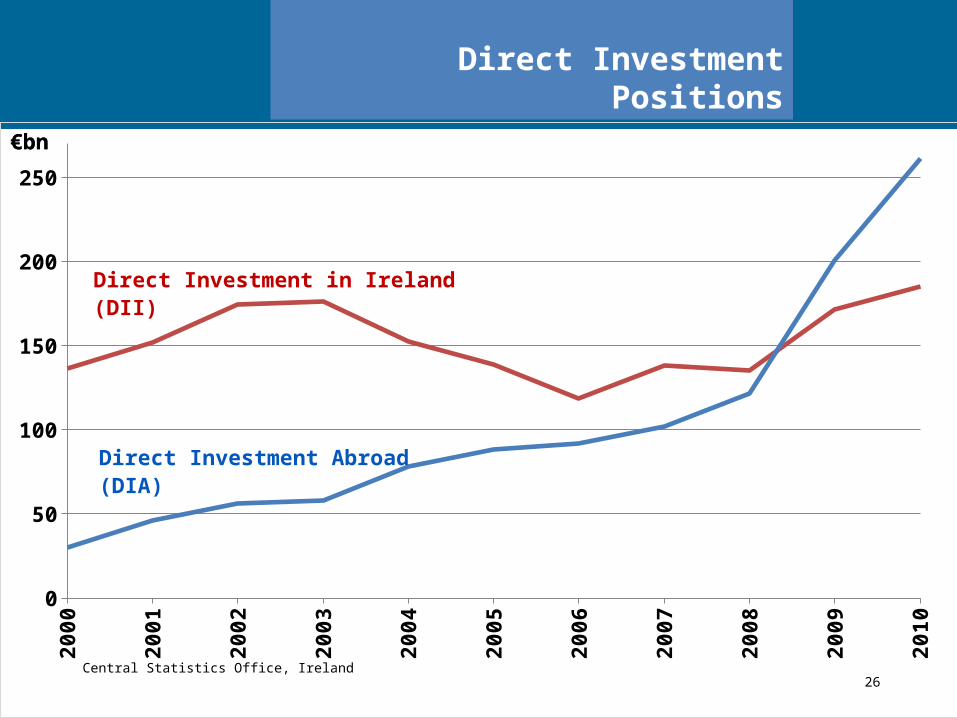
Direct Investment Positions
Central Statistics Office, Ireland 26
2000
2001
2002
2003
2004
2005
2006
2007
2008
2009
2010
0
50
100
150
200
250
€bn€bn
Direct Investment in Ireland (DII)
Direct Investment Abroad (DIA)
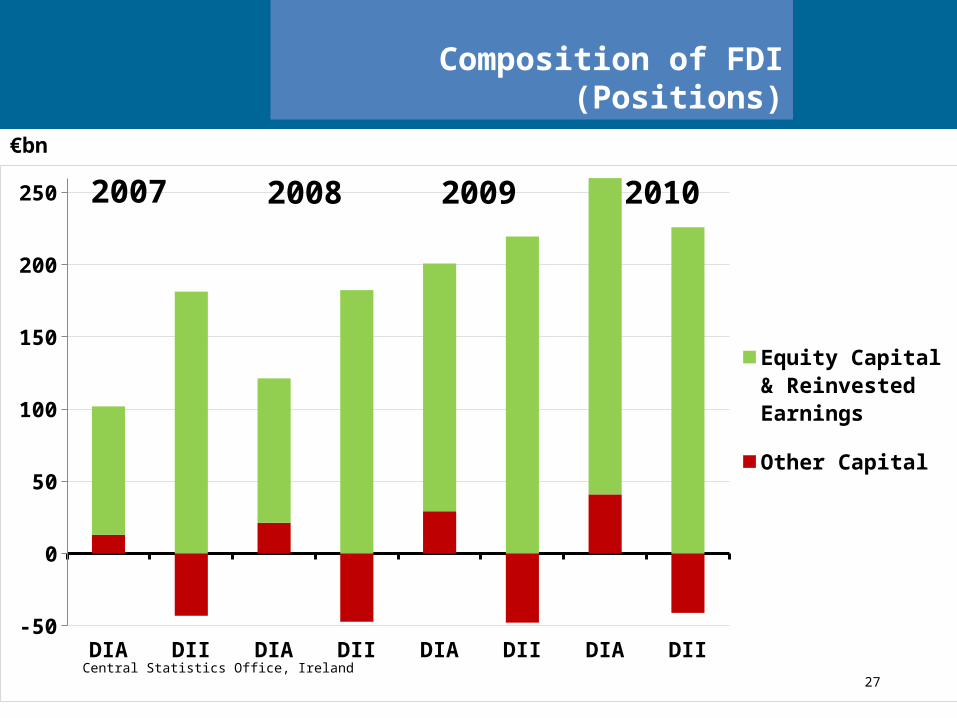
Composition of FDI (Positions)
Central Statistics Office, Ireland 27
€bn
DIA DII DIA DII DIA DII DIA DII-50
0
50
100
150
200
250
Equity Capital & Reinvested Earnings
Other Capital
2008 2009 20102007
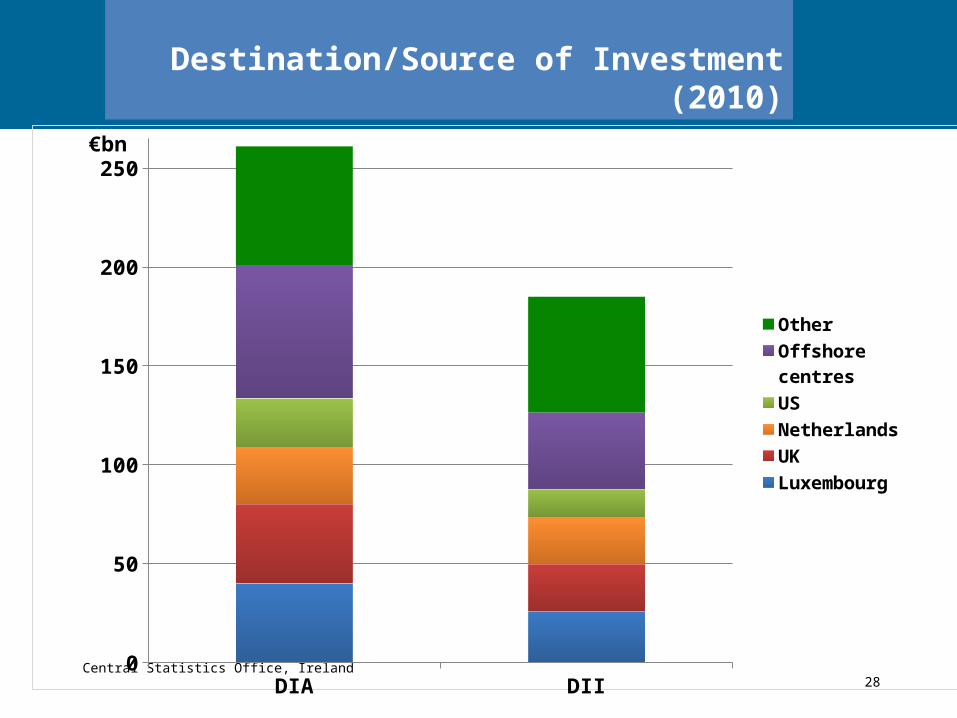
Destination/Source of Investment (2010)
Central Statistics Office, Ireland 28DIA DII0
50
100
150
200
250
Other
Offshore centres
US
Netherlands
UK
Luxembourg
€bn
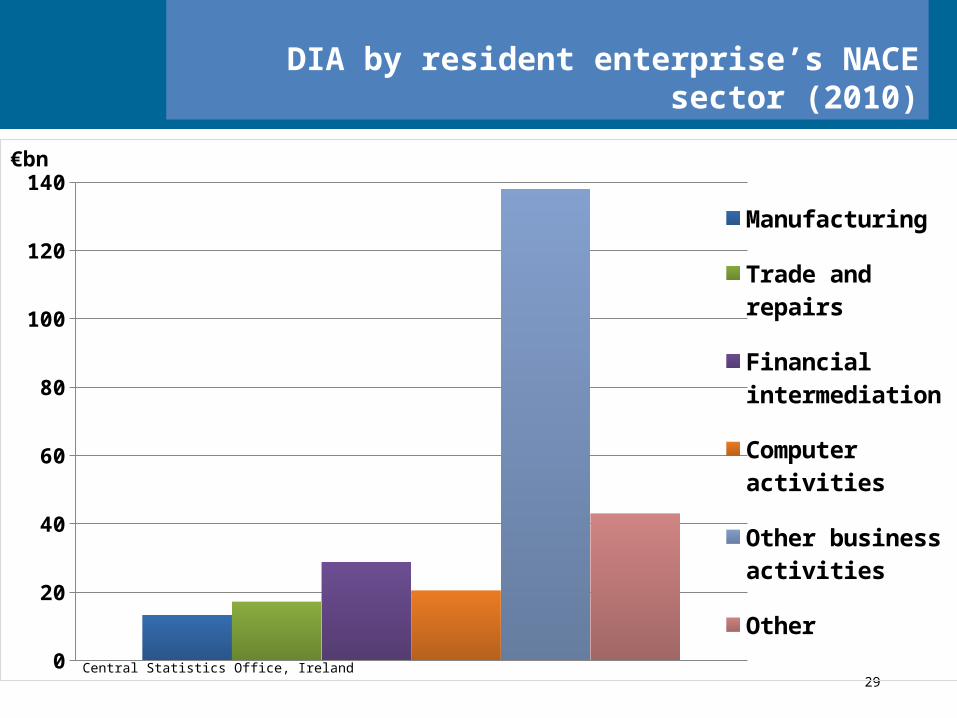
DIA by resident enterprise’s NACE sector (2010)
Central Statistics Office, Ireland 29
0
20
40
60
80
100
120
140
Manufacturing
Trade and repairs
Financial inter-mediation
Computer activities
Other business ac-tivities
Other
€bn
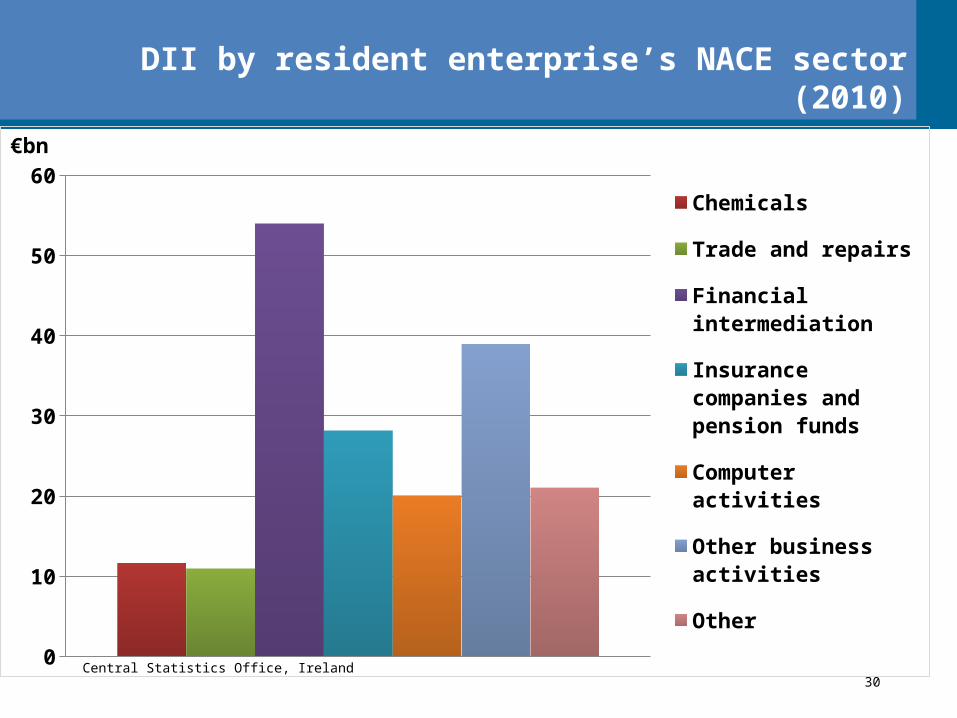
DII by resident enterprise’s NACE sector (2010)
Central Statistics Office, Ireland 30
0
10
20
30
40
50
60
Chemicals
Trade and repairs
Financial intermediation
Insurance companies and pension funds
Computer activities
Other business activities
Other
€bn
What is an Irish company?
Irish owned?
Head-quartered in Ireland?
Listed on the Irish Stock Exchange?
Combination of the above?
Other?
Central Statistics Office, Ireland 31

Thank you for
your attention