balance - Morningstar, Inc.
61
balance ROCKWELL COLLINS, INC. ANNUAL REPORT 2002 balance
Transcript of balance - Morningstar, Inc.

balanceROCKWELL COLLINS, INC. ANNUAL REPORT 2002
balance

balance is the key to stability and performance in a volatile marketplace,and Rockwell Collins has built a well balanced business.
Our customer base is evenly distributedacross the commercial and governmentsectors. Our business model strikes an optimum balance between centralizedfunctions and specialized market focus.Our pursuit of innovation has remainedintense, dually centered on enhancingexisting products and creating newones. Rockwell Collins’ Lean ElectronicsSM
initiative goes beyond manufacturing,touching nearly every aspect of the waywe do business. And our financial strengthprovides both the stability to weatherchallenges and the flexibility to pursuegrowth opportunities.
ROCKWELL COLLINS IS A LEADER IN AVIATION ELECTRONICS AND
COMMUNICATIONS SYSTEMS FOR COMMERCIAL AND GOVERNMENT
CUSTOMERS WORLDWIDE, TRADING UNDER THE SYMBOL COL
ON THE NYSE.
TABLE OF CONTENTS
p 2 Narrative Section
p 12 Letter to Shareowners
p 18 Commercial Systems
p 20 Government Systems
p 22 Financial Section

balanced
Rockwell Collins serves a highly diverse and balanced mix of customers through
two business units, Government Systems and Commercial Systems. In both
businesses, we are a key supplier to domestic and international original equipment
manufacturers (OEMs) and aftermarket customers. Within our commercial unit,
our customers include operators of large airlines, regional carriers and business
aircraft and the manufacturers that serve them worldwide. Our government
business spans all branches of the U.S. military—as well as many foreign militaries—
and virtually every major contractor that requires aviation electronics and
communications solutions.
Our diversified business mix provides
stability and flexibility in a dynamic environment,
with a well-balanced customer base spanning the
government and commercial markets.
< Boeing’s new 747s feature the latest Rockwell Collins flight deck displays.
Rockwell Collins serves a highly diverse and balanced mix of customers through
two business units, Government Systems and Commercial Systems. In both
businesses, we are a key supplier to domestic and international original equipment
manufacturers (OEMs) and aftermarket customers. Within our commercial unit,
our customers include operators of large airlines, regional carriers and business
aircraft and the manufacturers that serve them worldwide. Our government
business spans all branches of the U.S. military—as well as many foreign militaries—
and virtually every major contractor that requires aviation electronics and
communications solutions.
Balance means stability, and stability is certainly a positive attribute in today’s
volatile marketplace. Rockwell Collins’ stability and balance brings to mind a
well-tuned athlete in motion—fluid and dynamic, with the agility to adapt to the
cyclical ebb and flow of individual markets. Over the past 18 months, as the
U.S. air transport industry has experienced a downturn, demand has accelerated
among government customers. Our unique business structure enables us to
rapidly move resources to meet customer needs as they change, and benefit
from market opportunities as they evolve. This gives us maximum ability to
offset cyclical declines in one business with growth in another.
portfolio
< Boeing’s new 747s feature the latest Rockwell Collins flight deck displays. In FY2002, Rockwell Collins displays were chosen for use in the U.S. Army’s fleet of Black Hawk UH-60M aircraft.
>
integratedintegrated business
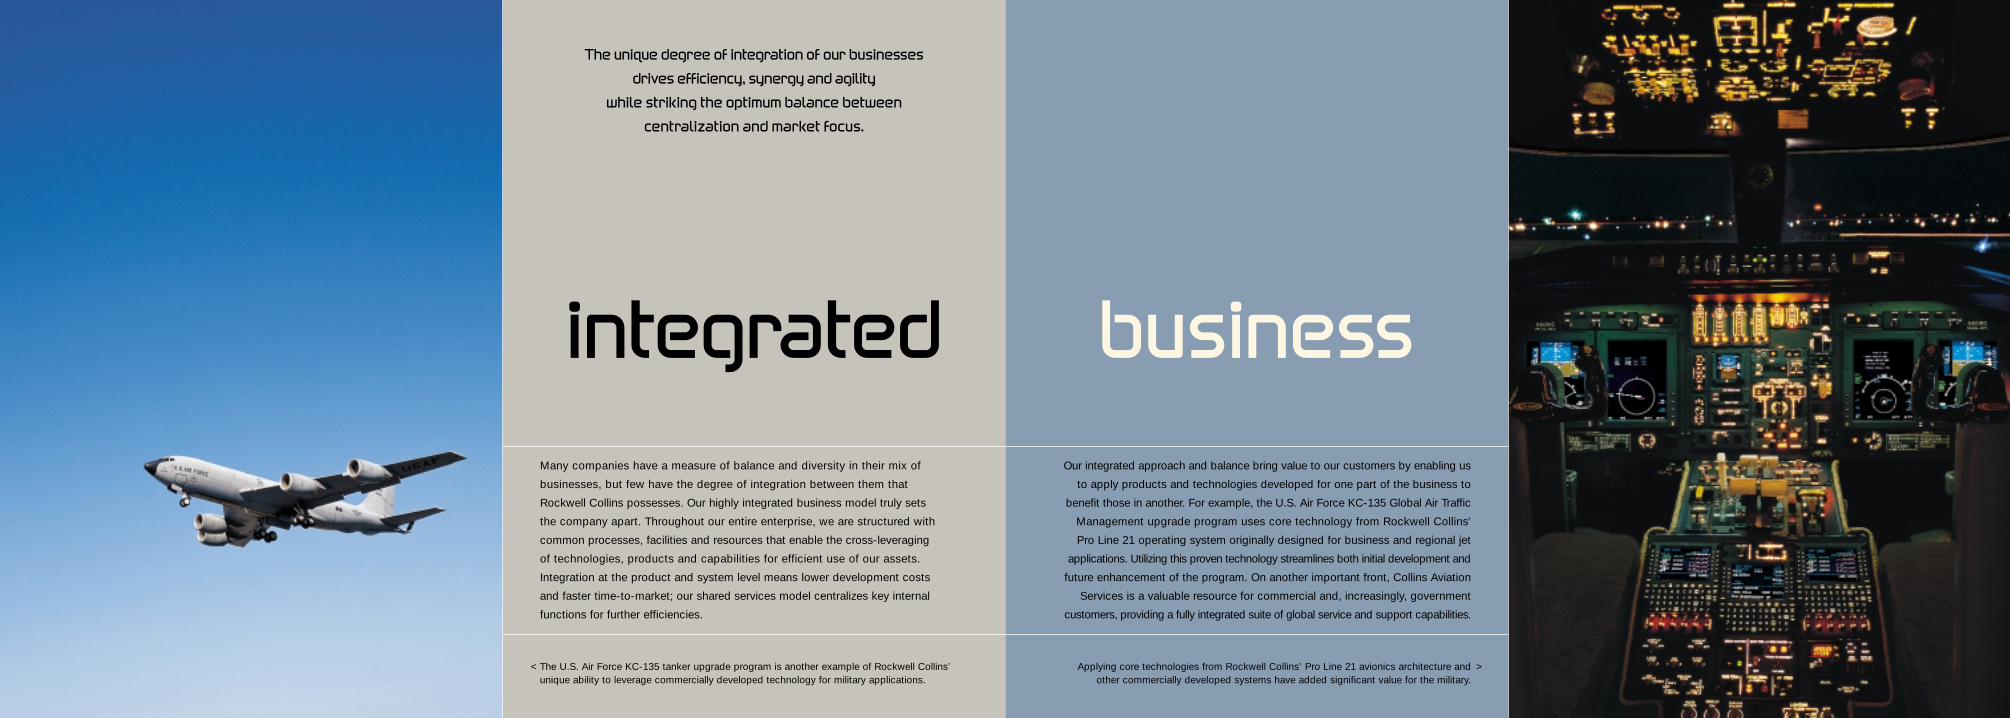
The unique degree of integration of our businesses
drives efficiency, synergy and agility
while striking the optimum balance between
centralization and market focus.
Many companies have a measure of balance and diversity in their mix of
businesses, but few have the degree of integration between them that
Rockwell Collins possesses. Our highly integrated business model truly sets
the company apart. Throughout our entire enterprise, we are structured with
common processes, facilities and resources that enable the cross-leveraging
of technologies, products and capabilities for efficient use of our assets.
Integration at the product and system level means lower development costs
and faster time-to-market; our shared services model centralizes key internal
functions for further efficiencies.
Our integrated approach and balance bring value to our customers by enabling us
to apply products and technologies developed for one part of the business to
benefit those in another. For example, the U.S. Air Force KC-135 Global Air Traffic
Management upgrade program uses core technology from Rockwell Collins’
Pro Line 21 operating system originally designed for business and regional jet
applications. Utilizing this proven technology streamlines both initial development and
future enhancement of the program. On another important front, Collins Aviation
Services is a valuable resource for commercial and, increasingly, government
customers, providing a fully integrated suite of global service and support capabilities.
< The U.S. Air Force KC-135 tanker upgrade program is another example of Rockwell Collins’ unique ability to leverage commercially developed technology for military applications.
Applying core technologies from Rockwell Collins’ Pro Line 21 avionics architecture andother commercially developed systems have added significant value for the military.
>

continuouscontinuous innovation
As a percentage of sales, our R&D investments
have remained among the highest in the industry,
with a balanced focus on enhancing
existing solutions and creating new ones.
Constantly pushing the barriers of what’s possible. Continuously searching for
ways to upgrade current products. Always looking farther and farther out to
new horizons. In our government and commercial business units—across the
entire company—this is what we do at Rockwell Collins to serve our customers
better, build competitive advantage and help encourage growth in the future.
Highly focused research and development is a fundamental here; it always has
been a top priority at Rockwell Collins, and it always will be. In FY2002, in spite of
lower total sales, we spent nearly 20 percent of that total on R&D—among the
highest percentages in our industry.
Integration is an advantage here as well. In addition to leveraging commercially
developed technologies for military customers, the high proportion of customer-
funded R&D in our government business often results in technology that eventually
benefits commercial customers. We balance our focus on a company-wide
basis between innovating to improve existing products and discovering entirely
new technologies. For instance, our Displays Center of Excellence is continually
developing enhancements to improve systems in use by commercial and military
customers alike. Meanwhile, our Advanced Technology Center and Rockwell
Scientific Company pursue leading-edge technologies to drive growth in the future.
< The technology behind this leading-edge synthetic vision display was born in Rockwell Collins’ Advanced Technology Center.
The U.S. Army uses advanced helmet mounted display technology developed by Rockwell Collins. >

operational excellenceexcellence
Our balanced and broad application of
lean principles extends across the entire business,
reaching beyond manufacturing processes to touch
nearly every part of the company.
Operational excellence is a fundamental objective at Rockwell Collins. To achieve it,
we’ve extended Lean Electronics initiatives beyond the factory floor to virtually
every aspect of our business, including the office environment. We have nearly
completed implementation of advanced enterprise resource planning technology
that consolidates hundreds of separate operating systems and processes and
five data centers into a single, integrated system. We have adopted common
processes to align sales with operations planning. And we’ve created a master
product data management platform out of five disparate ones to enhance our
performance and efficiency. These are just a few examples.
To optimize manufacturing, we created what we call a “virtual factory” model,
centered on implementing common tools, processes and procedures designed
to make all locations capable of producing a given Rockwell Collins product.
This enables us to shift work between plants, quickly and economically—
maximizing our ability to manage capacity and costs, and minimizing the impact
of fluctuating demand among our commercial and government customers.
The Rockwell Collins virtual factory approach is supported by a common training
format and a highly flexible work cell concept that have contributed to significant
improvements in efficiency, quality and responsiveness.
< Combined with lean manufacturing techniques, automated circuit testing technology helps ensure optimized quality and productivity.
Collins Aviation Services is increasingly bringing industry-leading service and support capabilities to both commercial and government customers.
>

financial strength
Rockwell Collins’ high margins, strong cash flow,
low debt and other solid fundamentals
give the company an enviable balance of
financial stability and strategic flexibility.
A solid financial management and corporate governance philosophy—conservative,
transparent practices, overseen by a highly qualified and independent board.
Industry-leading margins—the result of a balanced, integrated and highly
efficient business model. A strong balance sheet with low debt—a debt to
total capital ratio of 12 percent. Strong free cash flow performance—performance
that in FY2002 far surpassed our goals. These are the underpinnings of
Rockwell Collins’ financial strength, an excellent platform that provides the
company an enviable mix of stability and flexibility for pursuing opportunities
to deliver shareowner value.
Rockwell Collins’ low debt and strong cash position maximize its ability to
build its business through strategic acquisitions. Two such acquisitions—
Airshow, Inc. and Communication Solutions, Inc.—incrementally strengthened
our capabilities this year. Airshow, an industry leader in integrated cabin
management systems for business aircraft, significantly advances our strategy
to expand Rockwell Collins content in commercial aircraft from nose to tail.
Communication Solutions is a provider of signals intelligence and surveillance
solutions in defense and security applications—a strategically important
capability in today’s military market.
< Rockwell Collins’ acquisition of Airshow, Inc. extends the company’s presence from the flight deck to the cabin of business aircraft and strengthens our position in air transport cabins.
The Joint Tactical Radio System (JTRS), a significant win for Rockwell Collins’ Government Systems business, should contribute to the company’s financial strength for years to come.
>
Clayton M. JonesChairman, President and Chief Executive Officer
In FY2002, our first full year as anindependent, publicly held company,the market environment provided a vigorous test of our new company andits balanced business model. I believewe came through with flying colors.
DEAR SHAREOWNERS:
Right out of the gate, it hit us. It was the perfect storm—a rare confluence of
management and market challenges, each a formidable test in its own right. First, we
were learning to be an independent public company, with new stakeholders and
greater accountability. Then ten weeks later, we were dealing with a fundamentally
changed world, post 9/11, with a precipitous drop in the commercial aviation market.
It was a trial by fire. And I am extremely pleased to report that this company and
its management team showed a strong capacity for quick and decisive action.
Given the conditions, we performed very well in fiscal year 2002.
As we began the year, there was an extraordinary amount of uncertainty, both in the
commercial and government markets. We made some early decisions—before
many in our industry—based on what we thought the market would yield. Then we
acted quickly to size our company and shift our resources to better align with the
new situation. We made the moves necessary to optimize performance while
continuing to invest in future growth, resisting the impulse to make major cuts in
new product research and development.
Our predictions were amazingly close to the mark. We knew that our commercial
business would be severely affected by events and expected sales in this
area to be down about 20 percent. We predicted that our government business
would be up around 5 percent as the impact of increased U.S. Defense Department
spending began to flow through the system. Overall, we were expecting an
11 percent drop in total sales. A look at our financials for FY2002 will show results
that were nearly spot-on to the figures we used as a basis for our planning.
Rockwell Collins 2002 Annual Report 13
As a result, we were able to deliver solid and predictable performance in an
extremely challenging environment.
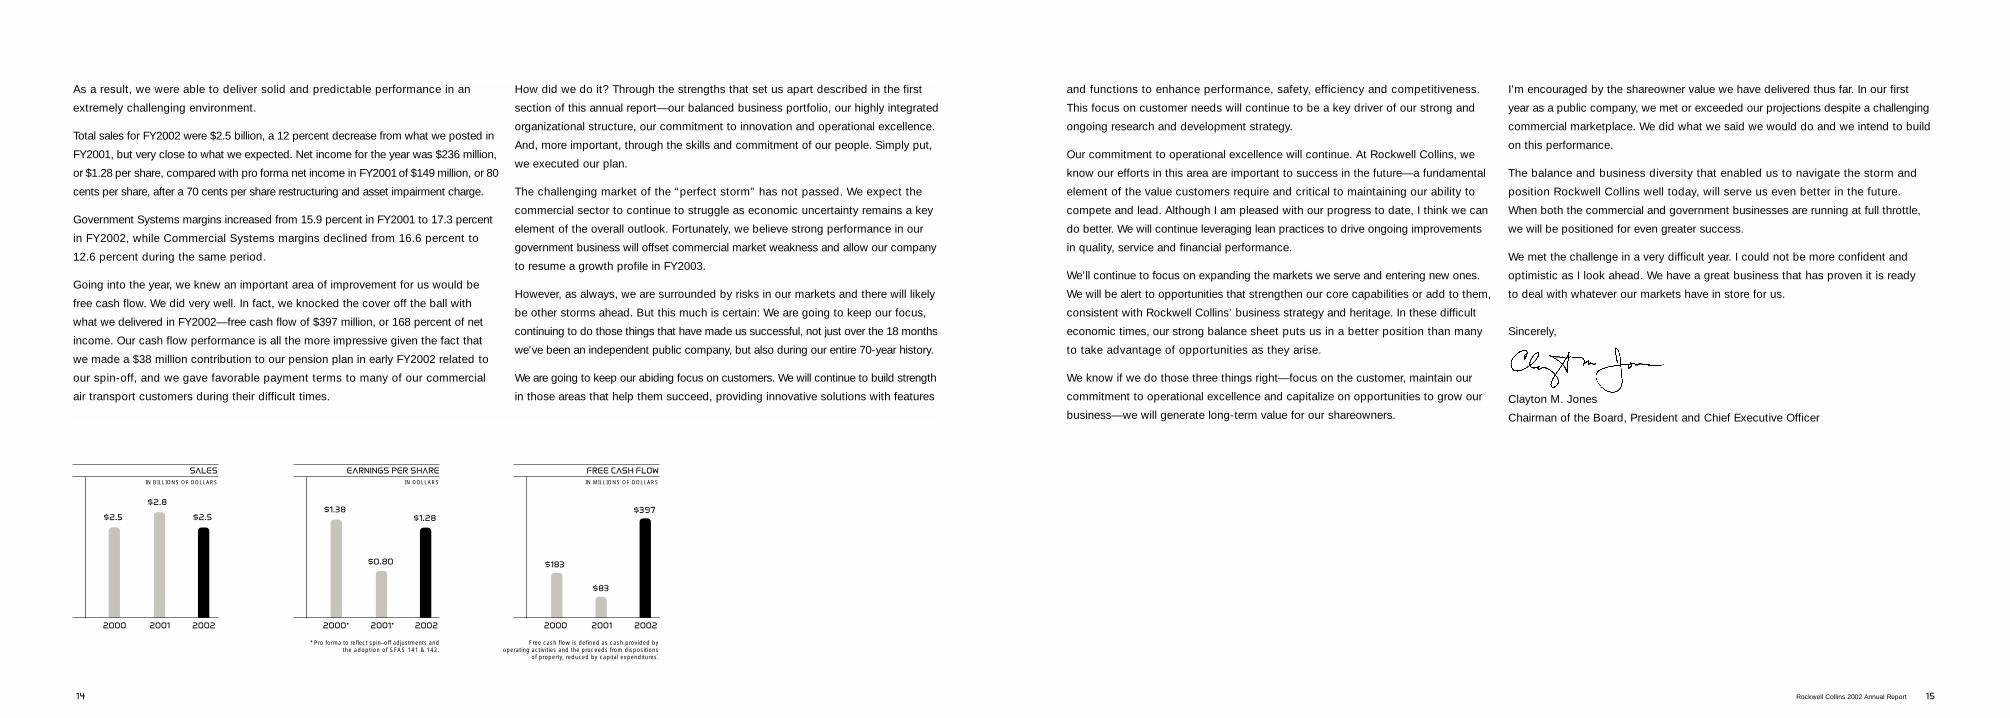
Total sales for FY2002 were $2.5 billion, a 12 percent decrease from what we posted in
FY2001, but very close to what we expected. Net income for the year was $236 million,
or $1.28 per share, compared with pro forma net income in FY2001 of $149 million, or 80
cents per share, after a 70 cents per share restructuring and asset impairment charge.
Government Systems margins increased from 15.9 percent in FY2001 to 17.3 percent
in FY2002, while Commercial Systems margins declined from 16.6 percent to
12.6 percent during the same period.
Going into the year, we knew an important area of improvement for us would be
free cash flow. We did very well. In fact, we knocked the cover off the ball with
what we delivered in FY2002—free cash flow of $397 million, or 168 percent of net
income. Our cash flow performance is all the more impressive given the fact that
we made a $38 million contribution to our pension plan in early FY2002 related to
our spin-off, and we gave favorable payment terms to many of our commercial
air transport customers during their difficult times.
How did we do it? Through the strengths that set us apart described in the first
section of this annual report—our balanced business portfolio, our highly integrated
organizational structure, our commitment to innovation and operational excellence.
And, more important, through the skills and commitment of our people. Simply put,
we executed our plan.
The challenging market of the “perfect storm” has not passed. We expect the
commercial sector to continue to struggle as economic uncertainty remains a key
element of the overall outlook. Fortunately, we believe strong performance in our
government business will offset commercial market weakness and allow our company
to resume a growth profile in FY2003.
However, as always, we are surrounded by risks in our markets and there will likely
be other storms ahead. But this much is certain: We are going to keep our focus,
continuing to do those things that have made us successful, not just over the 18 months
we've been an independent public company, but also during our entire 70-year history.
We are going to keep our abiding focus on customers. We will continue to build strength
in those areas that help them succeed, providing innovative solutions with features
and functions to enhance performance, safety, efficiency and competitiveness.
This focus on customer needs will continue to be a key driver of our strong and
ongoing research and development strategy.
Our commitment to operational excellence will continue. At Rockwell Collins, we
know our efforts in this area are important to success in the future—a fundamental
element of the value customers require and critical to maintaining our ability to
compete and lead. Although I am pleased with our progress to date, I think we can
do better. We will continue leveraging lean practices to drive ongoing improvements
in quality, service and financial performance.
We’ll continue to focus on expanding the markets we serve and entering new ones.
We will be alert to opportunities that strengthen our core capabilities or add to them,
consistent with Rockwell Collins’ business strategy and heritage. In these difficult
economic times, our strong balance sheet puts us in a better position than many
to take advantage of opportunities as they arise.
We know if we do those three things right—focus on the customer, maintain our
commitment to operational excellence and capitalize on opportunities to grow our
business—we will generate long-term value for our shareowners.
I’m encouraged by the shareowner value we have delivered thus far. In our first
year as a public company, we met or exceeded our projections despite a challenging
commercial marketplace. We did what we said we would do and we intend to build
on this performance.
The balance and business diversity that enabled us to navigate the storm and
position Rockwell Collins well today, will serve us even better in the future.
When both the commercial and government businesses are running at full throttle,
we will be positioned for even greater success.
We met the challenge in a very difficult year. I could not be more confident and
optimistic as I look ahead. We have a great business that has proven it is ready
to deal with whatever our markets have in store for us.
Sincerely,
Clayton M. Jones
Chairman of the Board, President and Chief Executive Officer
Rockwell Collins 2002 Annual Report 1514
$2.8
$2.5 $2.5$1.38
$1.28
$0.80
$397
$183
$83
SALES
2000 2001 2002
IN BILLIONS OF DOLLARS
EARNINGS PER SHARE
2000* 2001* 2002
IN DOLLARS
* Pro forma to reflect spin–off adjustments andthe adoption of SFAS 141 & 142.
FREE CASH FLOW
2000 2001 2002
IN MILLIONS OF DOLLARS
Free cash flow is defined as cash provided byoperating activities and the proceeds from dispositions
of property, reduced by capital expenditures.
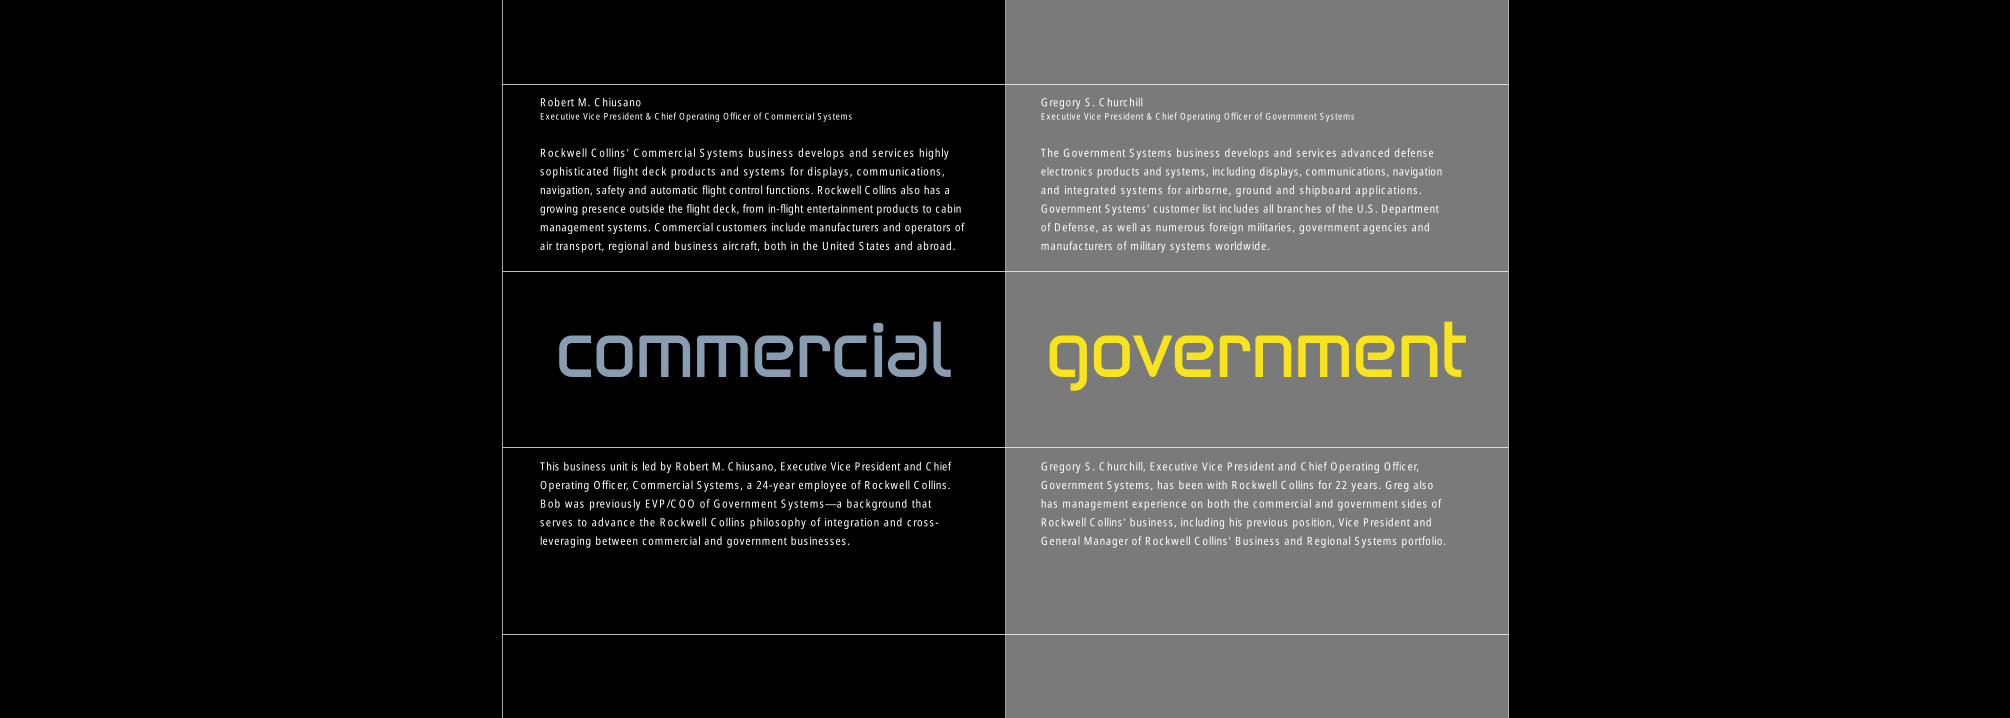
commercial government
Robert M. ChiusanoExecutive Vice President & Chief Operating Officer of Commercial Systems
Rockwell Collins’ Commercial Systems business develops and services highly
sophisticated flight deck products and systems for displays, communications,
navigation, safety and automatic flight control functions. Rockwell Collins also has a
growing presence outside the flight deck, from in-flight entertainment products to cabin
management systems. Commercial customers include manufacturers and operators of
air transport, regional and business aircraft, both in the United States and abroad.
This business unit is led by Robert M. Chiusano, Executive Vice President and Chief
Operating Officer, Commercial Systems, a 24-year employee of Rockwell Collins.
Bob was previously EVP/COO of Government Systems—a background that
serves to advance the Rockwell Collins philosophy of integration and cross-
leveraging between commercial and government businesses.
Gregory S. ChurchillExecutive Vice President & Chief Operating Officer of Government Systems
The Government Systems business develops and services advanced defense
electronics products and systems, including displays, communications, navigation
and integrated systems for airborne, ground and shipboard applications.
Government Systems’ customer list includes all branches of the U.S. Department
of Defense, as well as numerous foreign militaries, government agencies and
manufacturers of military systems worldwide.
Gregory S. Churchill, Executive Vice President and Chief Operating Officer,
Government Systems, has been with Rockwell Collins for 22 years. Greg also
has management experience on both the commercial and government sides of
Rockwell Collins’ business, including his previous position, Vice President and
General Manager of Rockwell Collins’ Business and Regional Systems portfolio.

COMMERCIAL SYSTEMS
Balance and Breadth
Rockwell Collins is well balanced from a number of standpoints within the
commercial aviation sector. For instance, sales to OEMs represented roughly
60 percent of our commercial business in FY2002; aftermarket sales accounted
for the remaining 40 percent.
Commercial Systems covers a broad mix of portfolios, including air transport,
business and regional systems, as well as in-flight entertainment and cabin
systems. Our commercial business is well balanced between domestic and
international customers.
OEM and aftermarket; air transport, and business and regional; domestic and
international—our balance and breadth enable us to participate where markets
are strong while positioning us to benefit when markets rebound.
Well Positioned in a Changing Market
Our large installed customer base, our established capabilities and relationships
in the regional aircraft market, our strength in aftermarket services, and our
international presence in air transport all align well to the current environment.
The commercial aviation marketplace has always been highly cyclical. In the
current down cycle, Star Alliance, the world’s largest airline network, has
recognized the value of leveraging its collective buying power to manage costs
primary customers
> Aircraft OEMs
> Major Airlines
> Regional Airlines
> Corporate and Business Jet Operators
> Leasing Companies
> Cargo Carriers
55%
without compromising quality. In FY2002, Star Alliance selected Rockwell Collins as
a strategic sourcing partner for aviation electronics products and support. Our
expertise in servicing avionics and in-flight entertainment systems will help
member carriers more easily meet efficiency and maintenance standards and
enhance their offerings. We are also creating common systems and procurement
requirements to help members streamline the purchasing process and reduce
costs. For our part, the new relationship positions us to further extend our cabin
and flight deck electronics presence among the world’s top airlines.
While current economic conditions have slowed production of business aircraft,
Rockwell Collins still posted a number of significant new business wins in FY2002,
including the selection of Pro Line 21 integrated flight deck avionics on the Cessna
Citation CJ3 and the Gulfstream G150. And with the acquisition of Airshow, Inc., we
extended our system development and integration leadership from the flight deck
to the cabin. Airshow 21, a complete line of cabin electronics for business aircraft,
enables Rockwell Collins to provide a comprehensive, integrated suite of cabin
electronics systems that encompasses passenger information and entertainment,
business support systems and information networks, and cabin environmental
controls. In September 2002, Bombardier Aerospace selected Airshow 21 for the
Global 5000 intercontinental business jet.
Changing market conditions have seen the emergence of a number of strong
low-cost and regional carriers over the last few years. These carriers, with their
emphasis on faster turnaround time and lower costs, place high demands on their
suppliers to deliver maximum responsiveness and value. With our extensive
service and support capabilities in Collins Aviation Services and our emphasis on
operational excellence, these high demands represent a significant opportunity—
exemplified in new business wins such as the 5-year service and support agreement
with Southwest Airlines we announced in the fourth quarter of FY2002.
Outlook
We expect our domestic air transport-related portfolio to benefit as the sector
follows a gradual recovery path over the next several years, occurring in three
phases. We expect the first phase to manifest itself in increased activity in our
service and support business as growing traffic drives demand for maintenance and
spare parts. The second phase is expected to come in the aftermarket segment,
as deferred improvements come back into play—driven by the inevitable need
for technology upgrades to maintain reliability and safety in existing fleets.
We think the third phase of recovery will occur as new airplane orders and deliveries
regain momentum.
Outside the United States, air transport carriers are performing well, led by those serving
Asia and Europe. Airlines in these markets are profitable, and carriers are buying
new aircraft. In addition, we have seen a strong correlation between profitability
and retrofit activity, which should favorably impact our aftermarket business.
The bright spots are in the continued profitability of players in the regional market
that is driving strong demand for highly flexible and economical regional jets, and
in the expanded capabilities afforded by our Airshow acquisition. As the economy
improves, we expect a significant growth opportunity in business jets, where we
now have the unique ability to provide comprehensive, turnkey customization and
installation of cabin electronics features and systems for OEMs.
of FY2002 sales
Rockwell Collins 2002 Annual Report 19

primary customers
> U.S. Department of Defense:
U.S. Air Force
U.S. Army
U.S. Navy
> U.S. Coast Guard
> Civil Agencies
> Defense Contractors
> Foreign Ministries of Defense
GOVERNMENT SYSTEMS
Balance and Breadth
Rockwell Collins is a proven performer for government customers, with a strong and
balanced product portfolio and generations of experience. From communication,
navigation and avionics, to advanced display products and systems, we are among
the leaders in providing solutions for seamless interoperability and enhanced
situational awareness.
In communications, we have broad capabilities to connect multiple points
across all environments—on the ground and over the ocean; under the sea, in the
air and up in space. We are leading developers of communications software for
interoperability, security and portability; our products carry voice and data across
all bandwidths.
In the navigation area, Rockwell Collins offers Global Positioning System (GPS)
technology and products in four markets: airborne, handheld, surface mobility and
precision weapons guidance. We also are among the leading providers of digital
anti-jam solutions to ensure maximum GPS effectiveness and reliability.
We bring market-leading expertise and capabilities to displays for integrated
human/machine interface. Our products and systems span helmet mounted and
head up displays, liquid crystal and advanced projection systems, for everything
from a helicopter to the most advanced tactical fighter.
Well Positioned in a Changing Market
Procurement reform in the U.S. military has opened the government market
to commercial-off-the-shelf technology, shifting emphasis away from rigid
specifications to give vendors freer reign to deliver desired features and functions.
Meanwhile, government customers increasingly are demanding open architecture
solutions that are readily integrated with legacy components and can be easily,
quickly and economically updated in the future. These trends play to Rockwell Collins’
strengths—our experience, and the high degree of integration between our government
and commercial businesses, provide real competitive advantages and enable us to
bring maximum value to our customers.
In FY2002, proof of this came with a host of new orders representing more than
$1.4 billion in new business over the life of the programs. One significant win was
the U.S. Army Special Operations selection of Rockwell Collins to provide avionics
hardware for its Common Avionics Architecture System (CAAS) upgrade program.
CAAS is designed to provide Special Forces helicopter fleets with an open, common
avionics architecture with reusable components—the Rockwell Collins solution
integrates technology originally developed in our commercial business and modified
to meet military requirements. Our ability to deliver the right technology also
contributed to our being selected to provide displays for the U.S. Army fleet of
1,200 UH-60M aircraft.
Our biggest win during the year—in fact, potentially the biggest in Rockwell Collins’
history—came when we were selected, as part of the Boeing team, to be one of
two producers of the industry’s first Joint Tactical Radio System (JTRS)-compliant
communications system for the U.S. Army. This software-based, reprogrammable,
open-architecture technology represents the next generation of military radio
communications. It provides the armed forces with voice, data and video capability,
enables interoperability with other U.S. and allied forces and simplifies future
upgrades. The initial contract is for Cluster 1, which encompasses ground vehicles
and rotary wing aircraft. We expect to compete for future clusters of the JTRS
program, which will cover maritime, airborne, fixed-station, ground-mobile, man-pack
and hand-held platforms.
The CAAS and JTRS programs are major wins for Rockwell Collins, positioning us as
a player in the transformation of the U.S. military into a fully integrated fighting force.
Outlook
The first JTRS cluster represents more than $2 billion in potential revenue for
Rockwell Collins over the life of the program. Having played a prominent role in
all stages of JTRS architecture development, and with our involvement in Cluster 1,
we are in a strong position to be selected for future clusters in the JTRS program
over the next 2–3 years.
Going forward, our balanced presence and established capabilities position us
well in the government marketplace worldwide, particularly in the United States,
where the war on terrorism is accelerating the pace of upgrades or replacement
of aging equipment. The U.S. Department of Defense is increasing its emphasis
on areas where Rockwell Collins is strongest, including communications, situational
awareness, signals intelligence, surveillance and precision munitions guidance.
Areas where we expect to be strong competitors include data links and ground
communication systems, as well as navigation and communication technology
for force projection weapons systems (for fighters, bombers and tankers).
In addition, we have strong avionics and display positions on all of the
U.S. military’s next-generation aircraft programs, including the F-15, F-18, F-22
and Joint Strike Fighter.
Another significant area of opportunity for Rockwell Collins is the increasing use
of outside resources in the government sector for service and support. With its
expertise, breadth of capabilities and global reach, Collins Aviation Services is in
a position to add value for military customers.
20
45%of FY2002 sales

TABLE OF CONTENTS
p 23 Management’s Discussion and Analysis of Financial Condition and Results of Operations
p 38 Management’s Responsibility for Financial Statements
p 39 Independent Auditors’ Report
p 40 Consolidated Statement of Financial Position
p 41 Consolidated Statement of Operations
p 42 Consolidated Statement of Cash Flows
p 43 Consolidated Statement of Shareowners’ Equity and Comprehensive Income
p 44 Notes to Consolidated Financial Statements
p 66 Selected Financial Data
financials
The following discussion and analysis should be read in conjunction with our consolidated
financial statements and notes thereto as well as our Annual Report on Form 10-K for the
year ended September 30, 2002 filed with the Securities and Exchange Commission (SEC).
The following discussion and analysis contains forward–looking statements and estimates
that involve risks and uncertainties. Actual results could differ materially from these estimates.
Factors that could cause or contribute to the differences in estimates include those discussed
under “Cautionary Statement” below and under “Certain Business Risks” in our Annual
Report on Form 10-K for the year ended September 30, 2002.
Our fiscal year ends on September 30. For discussion purposes, all date references to years
contained herein relate to our fiscal year ending September 30 unless otherwise stated.
Overview
For many years, Rockwell Collins benefited from having a diversified and balanced business,
serving both commercial and government markets. During our first full year as a public
company, this balance was tested like never before. Following September 11, 2001,
our Commercial Systems and Government Systems businesses diverged radically. The
Commercial Systems marketplace reacted with a sudden and severe decline in demand.
Our Government Systems business saw a surge in near term demand and a longer term
outlook of continued growth. We acted quickly to address these changing market conditions
by redeploying resources where possible and by making difficult decisions where necessary,
which helped to preserve the financial strength and growth prospects of our company. The
actions included a comprehensive restructuring program, along with other cost saving and
strategic initiatives, to better align our resources and cost structure with this new environment.
Our company and employees responded well to the challenges of this new environment
and delivered financial results that met the goals outlined to shareowners at the beginning
of 2002:
> We achieved sales of $2.5 billion in 2002. Weakness in the commercial aerospace market
in the wake of September 11, 2001 drove a 21 percent decline in sales in our Commercial
Systems business. Despite the weak market conditions in our largest business, our overall
sales decreased only 12 percent in 2002 due to our balanced mix of products that includes
a well-positioned defense business. Strong performance by our Government Systems
business helped to lessen the impact of these events with sales for this business increasing
4 percent in 2002, resulting from acquisition-related volume and higher defense spending.
> We delivered earnings per share of $1.28 in 2002. Pre-tax cost savings of approximately
$200 million related to our comprehensive restructuring program and other cost reduction
initiatives helped to partially offset the decrease in operating earnings and related margins
in our Commercial Systems business resulting from the significant decline in sales volume.
> We generated free cash flow of $397 million in 2002. Our focus on working capital
management yielded a company record for free cash flow. Our ability to generate cash flow,
combined with our low debt-to-total capital ratio of 12 percent, affords us the flexibility
to make strategic investments, and to return value to our shareowners through dividends
and share repurchases. We made approximately $200 million of strategic acquisitions
and investments in 2002, including Airshow, Inc. (Airshow) and Communications Solutions,
Inc. (ComSol).
> We continued to invest in research and development in 2002. We believe that investments in
research and development are key to positioning the company for future growth. We remained
committed to these investments in 2002 through company and customer-funded research and
development expenditures of $484 million, or 19.4 percent of sales.
We believe Rockwell Collins has emerged from the challenges of 2002 as a stronger, leaner
company that has proven its ability to both react quickly to changing business conditions
and to execute its business plans. In addition, we believe our strategy of balance between
commercial and government business was validated in 2002, yielding stability in an unstable
business environment.
Business Conditions
Commercial Systems
Our Commercial Systems business is a supplier of aviation electronics to customers located
throughout the world. The customer base is comprised of manufacturers of commercial air
transport aircraft, manufacturers of business and regional aircraft, commercial airlines, and
owners of business and regional jets. Key indicators of the near and long-term performance
of our Commercial Systems business include commercial airline traffic as measured by
revenue passenger miles and load factors, the financial condition of airlines worldwide, as
well as corporate profits.
MANAGEMENT’S DISCUSSION AND ANALYSIS OF FINANCIAL CONDITION AND RESULTS OF OPERATIONS
23Rockwell Collins 2002 Annual Report

During 2002, the commercial aerospace industry in the United States experienced a dramatic
downturn, exacerbated by the events of September 11, 2001. The air transport market was
affected directly as passenger traffic declined significantly over the past year. Demand for
our products decreased as airlines’ flight schedules were reduced, the production of new
aircraft declined, the number of idle aircraft increased, and the financial condition of many
of the U.S. commercial airlines deteriorated. The demand for in-flight entertainment products,
particularly from our U.S. customers, was hardest hit due to the discretionary nature of these
products. In addition, the weakness in the general economy resulted in reduced corporate
profits and demand for business aircraft. The commercial air transport markets outside the
U.S. were less affected by these events, with commercial airlines in other countries performing
relatively well, particularly in Asia and Europe.
Looking forward, we believe that the air transport market will recover gradually over the next
several years. Air travel has been the transportation mode of choice over the past few decades,
and this trend will inevitably continue over the longer term. Increasing flight schedules and
the number of active aircraft will drive higher activity for aircraft maintenance and spare parts.
The financial condition of commercial airlines in the U.S. should improve as air travel increases
and capacity utilization and yields improve. This will first lead to higher retrofit activity in the
aftermarket for technology upgrades driven by the need to improve reliability and safety.
Further strengthening of the commercial aerospace market and the economy as a whole will
drive orders for new aircraft and demand for in-flight entertainment products.
Government Systems
Our Government Systems business supplies defense electronic equipment to all branches
of the U.S. Department of Defense (DoD), the U.S. Coast Guard, Ministries of Defense
throughout the world and manufacturers of military aircraft and helicopters. Key indicators
of near and long-term performance of our Government Systems business include the
amount and prioritization of defense spending by the U.S. and other foreign governments
which are generally based upon the underlying political landscape, security environment,
and budgetary considerations.
During the 1990’s, defense budgets, both in the U.S. and abroad, were relatively flat. While
international defense spending is not anticipated to grow substantially over the next three
to five years, expenditures by the DoD are forecasted to increase significantly in the wake of
September 11, 2001, as the U.S. wages its war on terrorism, upgrades its aging equipment,
and invests in homeland security. In addition, an increasing amount of the U.S. defense
budget is being allocated to increase capabilities in such areas as precision guided munitions,
situational awareness, signals intelligence, surveillance, and other communications equipment
which play to the strengths of Rockwell Collins. The product offerings of our Government
Systems business are well positioned to meet these emerging needs of the U.S. and foreign
governments. Recent contract wins for Cluster One of the Joint Tactical Radio Systems (JTRS)
and the Defense Advanced GPS Receiver (DAGR) first article phase, as well as continuing
programs such as the KC-135 Global Air Traffic Management (GATM) upgrade, validate
the strength of our product offerings and position Rockwell Collins favorably in subsequent
phases of these programs. In addition, we have strong positions on all of the next generation
aircraft programs, including the F-15, F-18, F-22 and Joint Strike Fighter. As a result of these
and other contract wins, we believe our Government Systems business is positioned for
continued growth.
Outlook for 2003
Based upon the assumptions outlined below, we currently anticipate the following financial
results for 2003:
> Sales of approximately $2.6 billion. Sales in our Commercial Systems business are expected
to decline approximately 2 percent and represent 51 percent of total sales. Our Commercial
Systems sales projection assumes new aircraft production at Boeing and Airbus will be
approximately 550 in the aggregate. Aftermarket sales in our air transport avionics product
line are expected to increase 10 percent due to strengthening service and support as
well as retrofit activity. Continued weakness in the in-flight entertainment (IFE) market is
expected to result in a decline of 25 percent in IFE sales. Sales to business and regional
jet manufacturers are forecasted to increase 10 percent as higher regional jet build rates
and our recent Airshow acquisition more than offset anticipated declines in business jet
build rates. Aftermarket sales in the business and regional jet market are also expected to
increase 10 percent as a result of the Airshow acquisition and higher service and support
activity. Sales in our Government Systems business are forecasted to increase 13 percent
and represent 49 percent of total sales. We anticipate significant growth in our integrated
applications product line due to the KC-135 retrofit program entering into initial production
along with several C-130 and helicopter programs. We also expect continued sales growth
for our communication, navigation, and display product lines in several next generation
aircraft programs such as the Joint Strike Fighter, F-22 and F-18.
MANAGEMENT’S DISCUSSION AND ANALYSIS (CONTINUED)
24

MANAGEMENT’S DISCUSSION AND ANALYSIS (CONTINUED)
> Earnings per share of $1.33 to $1.38. Our earnings per share estimate is based upon our
projected sales, anticipated savings resulting from our comprehensive restructuring program
carried out in 2002, and our continued focus on streamlining business processes within
our organization. Our projection assumes operating margins in our Commercial Systems
business will improve to approximately 14 to 15 percent. In addition, we anticipate continued
strong operating margin performance in our Government Systems business in the range
of 16 to 17 percent.
> Free Cash Flow of $225 to $275 million. Our projection is dependent on achieving our
earnings target as well as maintaining current levels of working capital and achieving
our capital spending projections. We define free cash flow as cash provided by operating
activities and dispositions of property, reduced by capital expenditures. Our strong free
cash flow generation, combined with our borrowing capacity, is expected to meet future
operating cash flow needs, capital expenditures, dividend payments, acquisitions and
share repurchases for the foreseeable future.
> Company and customer-funded research and development as a percentage of sales
approximating 21 percent. We remain committed to our research and development
investment activity, which is based on a strategy of technology and design solutions
that serve multiple markets. Our internally funded research and development efforts
continue to be leveraged and complemented by customer-funded engineering.
Results of Operations
The following management discussion and analysis of results of operations is based upon
reported financial results for 2002 and pro forma financial results for 2001 and 2000 and
should be read in conjunction with our consolidated financial statements and the notes
thereto. Pro forma financial information for 2001 and 2000 includes adjustments necessary
to present our results of operations as if the spin-off transaction and the adoption of Statement
of Financial Accounting Standards (SFAS) No. 141, Business Combinations (SFAS 141), and
SFAS No. 142, Goodwill and Other Intangible Assets (SFAS 142), had occurred on October 1,
1999. The financial information for periods prior to the spin-off are not necessarily indicative
of what our financial condition, results of operations or cash flows would have been if we
had been an independent public company during each of the periods presented.
Pro forma adjustments related to the spin-off transaction include interest expense on
$300 million of commercial paper borrowings used to fund the pre-distribution dividend to
Rockwell and income and costs related to retirement benefit assets and obligations related
to former Rockwell employees that were assumed by us in connection with the spin-off. Pro
forma adjustments related to our adoption of SFAS 141 and SFAS 142 include adjustments
to eliminate amortization expense related to goodwill, trademarks and tradenames with indefinite
lives, as well as adjustments to eliminate amortization related to assembled workforce as
this intangible asset has been reclassified to goodwill and is no longer being amortized.
Consolidated Financial Results
The following table presents reported consolidated results of operations for the years ended
September 30, 2002, 2001, and 2000 and pro forma consolidated results of operations for
the years ended September 30, 2001 and 2000:
YEAR ENDED SEPTEMBER 30
REPORTED PRO FORMA
(IN MILLIONS, EXCEPT PER SHARE AMOUNTS) 2002 2001 2000 2001 2000
Product sales $ 2,238 $ 2,562 $ 2,280 $ 2,562 $ 2,280Service sales 254 258 230 258 230
Total sales 2,492 2,820 2,510 2,820 2,510
Costs, expenses and other:Product cost of sales 1,678 1,922 1,677 1,901 1,670 Service cost of sales 185 186 168 186 168Selling, general, and
administrative expenses 307 351 274 351 274Goodwill and asset impairment charges – 149 – 149 –Interest expense 6 3 – 17 20Other income (25) (15) (8) (20) (10)
Total costs, expenses and other 2,151 2,596 2,111 2,584 2,122
Income before income taxes 341 224 399 236 388Income tax provision (105) (85) (130) (87) (126)
Net income $ 236 $ 139 $ 269 $ 149 $ 262
Earnings per share:Basic $ 1.29 $ 0.81 $ 1.40Diluted $ 1.28 $ 0.80 $ 1.38
Weighted average common shares:Basic 183.1 182.9 187.8Diluted 184.1 185.5 190.6
Rockwell Collins 2002 Annual Report 25

Consolidated Financial Results for 2002 Compared to Consolidated Pro Forma
Financial Results for 2001
Total sales declined $328 million, or 12 percent, to $2,492 million in 2002 compared to total
sales of $2,820 million in 2001. Our Commercial Systems sales were down 21 percent from
the prior year resulting primarily from weakness in the commercial aerospace market, partially
offset by sales growth of 4 percent in our Government Systems business.
Service sales were $254 million in 2002 compared with $258 million in 2001. Service sales
increased to 10 percent of our total sales in 2002 as we maintained our service volume levels
while overall sales were declining from the prior year. Service sales were 9 percent of our
total sales in 2001. International sales, including U.S. export sales, were $890 million in 2002
compared to $948 million in 2001. The international commercial markets were impacted
less severely by the commercial aircraft industry downturn than the U.S. commercial market.
Overall, international sales were 36 percent of total sales in 2002 compared with 34 percent
of total sales in 2001.
Product cost of sales were $1,678 million in 2002, or 75.0 percent of product sales, compared
with product cost of sales of $1,901 million in 2001, or 74.2 percent of product sales. Excluding
2001 restructuring charges of $27 million, product cost of sales were $1,874 million in 2001,
or 73.1 percent of product sales. The increase in cost of sales as a percentage of sales in
2002 results primarily from less favorable sales mix based on volume declines in traditionally
strong margin commercial avionics product lines. Service cost of sales were $185 million in
2002, or 72.8 percent of service sales, compared to service cost of sales of $186 million in
2001, or 72.1 percent of service sales.
Selling, general and administrative costs were $307 million, or 12.3 percent of sales, in
2002 compared to $351 million, or 12.4 percent of sales, in 2001. Selling, general and
administrative costs in 2001 contained $7 million of restructuring charges and $7 million of
additional provisions for bad debts as a result of increased collection risks associated with
the commercial airline industry. Excluding these items, selling, general and administrative
costs were $337 million in 2001, or 11.9 percent of sales.
Interest expense was $6 million in 2002 compared to $17 million in 2001. The lower interest
expense in 2002 is the result of lower interest rates as well as a reduction in our short-term debt.
Other income generally includes royalty income, earnings and losses from corporate-level equity
affiliates, gains and losses on the sale of property and businesses, and other miscellaneous
income and expenses. Other income was $25 million in 2002 compared with $20 million in
2001. Other income in 2002 includes $12 million of net gains related to the favorable resolution
of legal matters related to our in-flight entertainment acquisition in 1998 and the sale of a
business several years ago, partially offset by reserves recorded for certain other legal matters.
Other income also includes pension and other retirement benefit expenses associated with
obligations related to certain former employees of Rockwell that were assumed in connection
with the spin-off. Pension and other retirement benefit expense associated with these obligations
increased $9 million in 2002.
Net income in 2002 was $236 million, or 9.5 percent of sales, compared with net income
of $149 million, or 5.3 percent of sales, in 2001. Net income in 2002 includes a net gain of
$12 million ($7 million after taxes) related to certain legal matters and a favorable restructuring
adjustment of $4 million ($2 million after taxes) related to lower severance costs resulting
from higher than expected employee attrition. Net income in 2001 includes restructuring,
goodwill and asset impairment charges of $183 million ($130 million after taxes). Excluding
these items, net income in 2002 was $227 million, or 9.1 percent of sales compared with
$279 million, or 9.9 percent of sales, in 2001. The decline in net income in 2002, excluding the
special items, resulted from the lower sales volume and less favorable mix in our Commercial
Systems business, partially offset by higher earnings in our Government Systems business,
savings from our restructuring and other cost saving initiatives, lower interest expense, and
a lower effective income tax rate.
Earnings per share in 2002 was $1.28 compared to $0.80 in 2001. Excluding the effects of
the special items, earnings per share in 2002 was $1.23 compared to $1.50 in 2001.
On an as reported basis, net income in 2001 was $139 million after giving effect to $183 million
($130 million after taxes) of restructuring, goodwill and asset impairment charges. Excluding
these items, net income on an as reported basis was $269 million in 2001.
MANAGEMENT’S DISCUSSION AND ANALYSIS (CONTINUED)
26

MANAGEMENT’S DISCUSSION AND ANALYSIS (CONTINUED)
Consolidated Pro Forma Financial Results for 2001 Compared to 2000
Total sales increased $310 million, or 12 percent, to $2,820 million in 2001 compared to
sales of $2,510 million in 2000. This increase resulted primarily from our acquisitions of the
Sony Trans Com in-flight entertainment business in the fourth quarter of 2000 and Kaiser
Aerospace & Electronics Corporation (Kaiser) in the first quarter of 2001. Excluding these
acquisitions, sales in 2001 increased slightly to $2,517 million.
In 2001, our service sales increased to $258 million from $230 million in 2000. The increase
resulted primarily from the acquisition of Sony Trans Com, and the increasing installed
base of in-flight entertainment systems. International sales, which include U.S. export sales,
declined 7 percent to $948 million in 2001 compared to $1,015 million in 2000. The sales
decline resulted primarily from lower sales of commercial avionics and in-flight entertainment
equipment to Asian and European customers and the completion of certain European
government mandated retrofit programs. This decline was partially offset by increased sales
to a Canadian manufacturer of business and regional jets.
Product cost of sales were $1,901 million in 2001, including $27 million of restructuring
charges. Excluding restructuring charges, product cost of sales of $1,874 million were 73.1
percent of product sales in 2001, compared to $1,670 million, or 73.2 percent of product
sales in 2000. Service cost of sales were $186 million in 2001, or 72.1 percent of service
sales, compared to $168 million, or 73.0 percent of service sales, in 2000.
Selling, general and administrative costs were $351 million in 2001, including $7 million
of restructuring charges and $7 million of additional provisions for bad debts as a result of
increased collection risks associated with the commercial airline industry. Excluding these
items, selling, general and administrative costs were $337 million, or 11.9 percent of sales
in 2001, compared to $274 million, or 10.9 percent of sales in 2000. This increase was
driven primarily by higher marketing costs of recently acquired businesses and expenses
associated with the spin-off from Rockwell.
Interest expense of $17 million in 2001 is based upon pro forma interest expense for the
first nine months of 2001 associated with the $300 million of short-term debt incurred to
fund the pre-distribution dividend to Rockwell in connection with the spin-off and actual
interest expense for the last three months of 2001. Interest expense of $20 million in 2000
is entirely pro forma interest associated with the $300 million of short-term debt. The lower
interest expense in 2001 is the result of lower interest rates as well as a reduction in our
short-term debt during the last three months of 2001.
Other income generally includes royalty income, earnings and losses from corporate-level
equity affiliates, gains and losses on the sale of property and businesses, pension and other
retirement benefit expenses associated with obligations related to certain former employees
of Rockwell that were assumed in connection with the spin-off, and other miscellaneous
income and expenses. Other income increased to $20 million in 2001 from $10 million in
2000 primarily as a result of higher pension income associated with pension assets and
obligations assumed in connection with the spin-off.
Net income in 2001 was $149 million after giving effect to $183 million ($130 million after
taxes) of restructuring and asset impairment charges. Excluding these items, net income
in 2001 was $279 million compared to $262 million in 2000. Net income as a percentage
of sales in 2001, excluding the restructuring and asset impairment charges, decreased to
9.9 percent from 10.4 percent in 2000. This decrease resulted from higher warranty and
product development costs primarily related to our in-flight entertainment product line, and
a higher effective income tax rate.
Earnings per share in 2001 was $0.80 compared to $1.38 in 2000. Excluding the restructuring
and asset impairment charges, earnings per share in 2001 was $1.50 compared to $1.38 in
2000. Earnings per share in 2001 reflect the benefits of lower shares outstanding.
On an as reported basis, net income for 2001 was $139 million after giving effect to $183 million
($130 million after taxes) of restructuring and asset impairment charges. Excluding these
items, net income on an as reported basis was $269 million in 2001, equal to the $269 million
of as reported net income in 2000.
Rockwell Collins 2002 Annual Report 27

Segment Performance
The following table presents reported and pro forma segment sales and operating earnings
information:
YEAR ENDED SEPTEMBER 30
REPORTED PRO FORMA
(IN MILLIONS) 2002 2001 2000 2001 2000
Sales (1):Commercial Systems $ 1,377 $ 1,752 $ 1,586 $ 1,752 $ 1,586Government Systems 1,115 1,068 924 1,068 924
Total sales $ 2,492 $ 2,820 $ 2,510 $ 2,820 $ 2,510
Segment operating earnings (1) (2):Commercial Systems $ 174 $ 275 $ 281 $ 291 $ 288Government Systems 193 165 144 170 144
Total segment operating earnings 367 440 425 461 432Interest expense (6) (3) - (17) (20)Earnings (losses) from corporate-level
equity affiliates 2 1 (3) 1 (3)Restructuring, goodwill and asset
impairment charges 4 (183) - (183) -General corporate, net (26) (31) (23) (26) (21)
Income before income taxes 341 224 399 236 388Income tax provision (105) (85) (130) (87) (126)
Net income $ 236 $ 139 $ 269 $ 149 $ 262
(1) Effective October 1, 2001 management changed its method of evaluating segment performance and
changed the composition of the Commercial Systems segment to include a business acquired as part
of the Kaiser acquisition, which was previously reported as part of Government Systems. Prior period
amounts have been reclassified to conform to the current year presentation.
(2) Segment operating earnings, an internal performance measure, excludes income taxes; unallocated general
corporate expenses; interest expense; gains and losses from the disposition of businesses; non-recurring
charges resulting from purchase accounting such as purchased in-process research and development
charges; earnings and losses from corporate-level equity affiliates; special charges related to comprehensive
restructuring actions; and other special items as identified by management from time to time. Our definition of
segment operating earnings may be different from definitions used by other companies.
Segment Financial Results for 2002 Compared to Pro Forma Financial Results for 2001
Commercial Systems sales of $1,377 million in 2002 declined $375 million, or 21 percent,
from sales of $1,752 million in 2001. This decrease resulted primarily from the downturn in
the commercial aerospace industry following the events of September 11, 2001. Commercial
avionics sales of $1,036 million in 2002 declined $294 million, or 22 percent, compared to
commercial avionics sales of $1,330 million in 2001. Sales of in-flight entertainment products
declined $81 million, or 19 percent, to $341 million in 2002 compared with $422 million in
2001. Our Airshow acquisition, completed in August of 2002, added $8 million of sales in
2002. Commercial Systems segment operating earnings were $174 million in 2002 compared
with $291 million in 2001. Commercial Systems segment operating earnings as a percentage
of sales in 2002 were 12.6 percent compared with 16.6 percent in 2001. This decrease was
primarily due to the lower sales volume, a less favorable commercial avionics sales mix,
higher development costs related to our in-flight entertainment and integrated information
systems, and higher warranty costs related to our in-flight entertainment product line, partially
offset by savings from our comprehensive restructuring plan and other cost savings initiatives.
Government Systems sales were $1,115 million in 2002, an increase of $47 million, or 4
percent, compared to sales of $1,068 million in 2001. Increased sales from data links, global
positioning products, and integrated applications solutions related to several C-130 and
helicopter programs more than offset a $78 million decline in sales on the KC-135 aircraft
retrofit program that was completed in the third quarter of 2001. In addition, our Kaiser
acquisition, which was completed in December 2000 accounted for a $25 million increase in
2002 sales compared to the previous year. Government Systems segment operating earnings
were $193 million in 2002 compared with $170 million in 2001. Segment operating earnings
as a percentage of sales in 2002 increased to 17.3 percent from 15.9 percent in 2001. This
increase was primarily due to a favorable sales mix and favorable engineering performance
in 2002.
General corporate, net was $26 million in both 2002 and 2001. General corporate, net in 2002
includes a $12 million net gain related to the favorable resolution of certain legal matters related
to our in-flight entertainment acquisition in 1998 and the sale of a business several years
ago, partially offset by reserves recorded for certain other legal matters. General corporate,
net also includes pension and other retirement benefit expenses related to certain former
employees of Rockwell that were assumed in connection with the spin-off. Pension and
retirement benefit expense associated with these obligations increased $9 million in 2002.
MANAGEMENT’S DISCUSSION AND ANALYSIS (CONTINUED)
28

MANAGEMENT’S DISCUSSION AND ANALYSIS (CONTINUED)
Segment Pro Forma Financial Results for 2001 Compared to 2000
In 2001, Commercial Systems sales were $1,752 million, an increase of $166 million, or
10 percent, compared to $1,586 million of sales in 2000. Our Sony Trans Com and Kaiser
acquisitions contributed $96 million and $56 million to the sales increase in 2001, respectively.
Excluding these acquisitions, sales in 2001 increased $14 million over the prior year. Sales
of commercial avionics and other products were up 8 percent during this period resulting
from continued demand in the air transport market, increased regional jet production, and the
Kaiser acquisition, but were partially offset by lower sales of wide-body in-flight entertainment
products. Segment operating earnings for Commercial Systems were $291 million in 2001
compared with $288 million in 2000. Commercial Systems segment operating earnings as
a percentage of sales in 2001 were 16.6 percent compared with 18.2 percent in 2000. This
decrease was due to higher warranty and product development costs related primarily to
our in-flight entertainment product line and higher provisions for bad debts as a result of
increased collection risks associated with the commercial airline industry.
Government Systems reported sales of $1,068 million in 2001 compared with $924 million
in 2000, an increase of $144 million or 16 percent. Kaiser, which was acquired in the first
quarter of 2001, accounted for $151 million of sales in 2001. Excluding this acquisition, sales
in 2001 were $7 million lower than in the prior year primarily due to the completion of the
KC-135 flight deck retrofit program in 2001, which was substantially offset by increased
sales from global positioning system and data link programs. Government Systems segment
operating earnings were $170 million in 2001 compared with $144 million in the prior year.
Segment operating earnings as a percentage of sales in 2001 increased to 15.9 percent
from 15.6 percent in 2000. This increase was primarily due to the favorable resolution of a
U.S. government contract matter.
Restructuring and asset impairment charges relating to Commercial Systems and Government
Systems were $177 million and $6 million, respectively, in 2001.
General corporate, net increased to $26 million in 2001 compared with $21 million in 2000,
primarily resulting from costs associated with the spin-off from Rockwell. General corporate,
net in 2001 includes an allocation from Rockwell for the first nine months of 2001 prior to
the spin-off and three months of actual costs after the spin-off. General corporate, net also
includes income related to pension assets and obligations from certain former employees
of Rockwell that were assumed in connection with the spin-off.
Income Taxes
Our effective income tax rate for 2002 was 31.0 percent, compared to pro forma effective
income tax rates of 36.9 percent in 2001 and 32.5 percent in 2000. Excluding the effects of
the asset impairment charges in 2001, the pro forma effective income tax rate in 2001 was
33.4 percent. The lower effective tax rate in 2002 is due primarily to the benefits resulting
from a research and development tax credit study.
The Extraterritorial Income Exclusion (“ETI”) provides a tax benefit that is an important
component of our overall tax rate. In August 2001, the World Trade Organization (“WTO”)
determined that the ETI provisions of the Foreign Sales Corporation Repeal and Extraterritorial
Income Exclusion Act of 2000 constitute an export subsidy prohibited by the WTO. The U.S.
Government appealed this decision, but lost its appeal, and on January 29, 2002 the WTO
Dispute Settlement Body finalized the original determination. In July 2002, the American
Competitiveness and Corporate Accountability Act of 2002 was introduced into Congress,
which if enacted, would bring the United States into compliance with the WTO ruling by
repealing the ETI regime and creating broad-based reform of U.S. taxation of international
transactions. If the ETI regime is repealed, the loss of the tax benefit to our company could
significantly increase our effective income tax rate.
Pension Benefits
We provide pension benefits to most of our employees in the form of defined benefit pension
plans. In addition, we assumed assets and obligations for pension benefits in connection
with the spin-off transaction for certain former employees of Rockwell. Over the past few
years, the combination of the weak economy and weak financial markets have resulted in
falling discount rates and lower actual returns on pension plan assets. As a result, the funded
status of our pension plans has declined from an overfunded position two years ago to a
deficit of $482 million at September 30, 2002, of which $400 million relates to our qualified
pension plans. The funded status of our plans includes the effect of a tax-deductible
cash contribution to the pension plan of $38 million in 2002 in order to satisfy certain U.S.
Government requirements resulting from the spin-off transaction. We are not required to make
additional contributions to our pension plans in 2003; however, we are currently evaluating
the merits of a discretionary contribution based upon the outlook for the funded status of
our pension plans and other strategic considerations. We believe our strong financial position
provides us the opportunity to make discretionary contributions to our pension fund without
inhibiting our ability to pursue other strategic investments.
Rockwell Collins 2002 Annual Report 29

In connection with the decline in the funded status of our qualified plans, our minimum pension
liability increased $189 million in 2002 to $265 million at September 30, 2002, compared to
$76 million at September 30, 2001. The reduction in shareowners’ equity resulting from the
minimum pension liability, net of deferred taxes, was $240 million at September 30, 2002
compared to $11 million at September 30, 2001. The minimum liability represents the unfunded
accumulated benefit obligation of our plans.
Pension expense in 2002 was $6 million, compared to pro forma pension income of $11 million
in 2001, and pro forma pension expense of $3 million in 2000. This increase is primarily the
result of a reduction in the discount rate and our decision to lower the expected rate of
return assumption on pension plan assets to 9.00 percent in 2002 from 9.75 percent in 2001
based upon the current investment mix and market outlook.
We expect pension expense to increase to $20 million in 2003, which reflects the impact
of the decline in the funded status of our plans. Unless investment performance improves
or discount rates rise, we will likely experience increased pension expense and possible
non-discretionary pension plan contributions in years beyond 2003.
Retiree Medical Benefits
We provide retiree medical benefits to substantially all of our employees and retirees. In
addition, we assumed assets and obligations for retiree medical benefits in connection with
the spin-off transaction for certain former employees of Rockwell. After several years of
modest increases in health care costs in the mid-to-late 1990s, these costs have begun to
rise again at significant rates, with many experts expecting annual increases approaching
15 percent over the next few years. As a result of this trend, retiree medical expense increased
to $19 million in 2002, excluding a curtailment gain of $14 million related to the workforce
reductions associated with our 2001 comprehensive restructuring program. Pro forma retiree
medical expense in both 2001 and 2000 was $6 million.
As a result of these and expected future cost increases, we amended our retiree medical
plans in 2002 to, among other plan design changes, establish a fixed company contribution
equal to our portion of estimated per capita health care costs in calendar year 2003.
Additional contributions will be required from participants for all costs in excess of our fixed
contribution amount. This amendment has effectively eliminated the risk related to health
care cost trend rates for retiree medical benefits going forward and we expect retiree medical
expense in 2003 to be approximately $19 million.
2001 Restructuring, Goodwill and Asset Impairment Charges
Restructuring
In September 2001, we announced a comprehensive restructuring plan to reduce our
workforce and streamline certain operations. These actions were undertaken in response
to the sudden and severe decline in anticipated sales volumes in the commercial aerospace
market resulting from the September 11, 2001 terrorist attacks. The restructuring plan
anticipated involuntary separations of approximately 2,800 employees, or 16 percent of our
workforce. These employee separations were broad based and affected all business groups,
with the largest number of reductions in the Commercial Systems business and organizations
that support commercial product lines. The restructuring plan also included the consolidation
of the in-flight entertainment business into one facility in Pomona, California; the closure of
certain service centers, sales and other offices in California, Illinois, and Southeast Asia; and
the consolidation of certain manufacturing operations. As a result of this plan, we recorded
a restructuring charge of $34 million ($22 million after taxes, or 12 cents per share) in the
fourth quarter of 2001. This charge was comprised of $28 million of employee separation
costs, $4 million of facility exit costs, and $2 million of asset write-downs.
In the second quarter of 2002, we determined that the cost of these restructuring actions was
expected to be $4 million ($2 million after taxes, or 1 cent per share) lower than originally
planned, and recorded favorable adjustments of $3 million to Cost of Sales and $1 million to
Selling, General and Administrative Expenses. The primary reason for the reduction in cost
related to lower than expected severance costs resulting from employee attrition.
All of the employee separations have been completed and $19 million of employee separation
costs have been paid in 2002, with the remaining employee separations costs expected to
be paid in early 2003. Facility exit actions are complete. Exit costs associated with these
facility actions of $2 million have been paid as of September 30, 2002, and payments will
continue through the term of the lease periods for these facilities. We funded the restructuring
plan using cash generated by operations.
Our restructuring plan, combined with other cost saving initiatives, resulted in pre-tax savings
of approximately $200 million in 2002. These savings partially offset the operating earnings
impact of the sharp decline in sales volume in our Commercial Systems business in 2002.
MANAGEMENT’S DISCUSSION AND ANALYSIS (CONTINUED)
30
MANAGEMENT’S DISCUSSION AND ANALYSIS (CONTINUED)
Goodwill and Asset Impairment Charges
In connection with our assessment of the business impact of the unexpected decline in the
commercial aerospace market as a result of the September 11, 2001 terrorist attacks, we
performed reviews of the carrying values of long-lived assets, including related goodwill, to
be held and used that were associated with the Commercial Systems business and recorded
a total of $149 million ($108 million after taxes, or 58 cents per share) of non-cash asset
impairment charges in the fourth quarter of 2001, primarily related to our in-flight entertainment
product line.
These reviews focused on the long-lived assets recorded in connection with the Sony Trans
Com and Hughes-Avicom acquisitions, which now comprise the in-flight entertainment product
line. The financial instability of commercial airlines combined with the discretionary nature of
expenditures on in-flight entertainment equipment resulted in significantly lower demand for
these products. As a result of our review, we recorded asset impairment charges of $136 million
related to the goodwill, intangible assets, and property of the in-flight entertainment product
line. In addition, we recorded $13 million of charges related to software license agreements
used in certain other product lines serving the commercial aerospace market. Sales of these
products were adversely affected by the downturn in the commercial aerospace market with
technological obsolescence expected to outpace any recovery in demand.
Financial Condition and Liquidity
Cash Flow Summary
Cash provided by operations was $453 million in 2002, $193 million in 2001 and $281 million
in 2000. Free cash flow was $397 million in 2002, $83 million in 2001 and $183 million in 2000.
We define free cash flow, an internal performance measure, as cash provided by operating
activities and proceeds from dispositions of property, reduced by capital expenditures. Our
definition of free cash flow may be different from definitions used by other companies. Cash
provided by operations and free cash flow were significantly higher in 2002 due to improved
working capital performance, primarily from strong cash collections, improved inventory
management, and the successful deployment of our enterprise resource planning system
at two of our businesses. Reductions in capital expenditures also had a favorable impact to
free cash flow in 2002. Cash provided by operations and free cash flow were lower in 2001
compared to 2000 primarily as a result of working capital growth in receivables and inventories.
Receivables increased in 2001 primarily due to the timing of sales as we posted record sales
in the fourth quarter of 2001. Inventories increased in 2001 primarily as a result of higher
sales volumes combined with planned inventory builds associated with the implementation
of our enterprise resource planning system.
Cash used for investing activities was $239 million in 2002, compared to $405 million in 2001,
and $221 million in 2000. Capital expenditures were $62 million in 2002, $110 million in 2001,
and $98 million in 2000. The decrease in capital expenditures in 2002 was in response to
the downturn in the commercial aerospace markets. We expect capital expenditures to be
approximately $110 million in 2003. Cash investments for acquisitions were $193 million in
2002, $292 million in 2001, and $123 million in 2000. Acquisitions over the past three years
included the purchase of Airshow and ComSol in 2002, Kaiser in 2001, and Sony Trans
Com in 2000. We continuously evaluate acquisition opportunities and expect to continue to
acquire businesses and capabilities as an integral component of our overall growth strategy.
We expect to finance future acquisitions using cash generated from operations, issuance of
debt, issuance of common stock or other securities, or a combination thereof.
Cash used for financing activities was $221 million in 2002. Strong free cash flow generation
not only provided a source of funding for our acquisitions in 2002, but also provided funds
to repurchase $102 million, or 4.5 million shares, of Rockwell Collins common stock at an
average price of $22.74 per share under our share repurchase program and enabled us to
reduce our outstanding commercial paper borrowings by $70 million. In addition, we declared
and paid cash dividends of $0.36 per share, totaling $66 million, in 2002. We expect annual
dividends to be $0.36 per share in 2003 and expect to fund these dividends using cash
generated by operations. The declaration and payment of dividends, however, will be at the
sole discretion of the Board of Directors.
Cash provided by financing activities in 2001 was $251 million and included the issuance
of $300 million in commercial paper used to fund a pre-distribution dividend to Rockwell
in connection with the spin-off transaction. Cash used for financing activities in 2000 was
$52 million.
Liquidity
Our primary source of liquidity is through short-term borrowings in the commercial paper
market. Our access to that market is facilitated by the strength of our credit ratings and
$1 billion of committed credit facilities with several banks (Revolving Credit Facilities). Our
current ratings as provided by Moody’s Investors Service, Standard & Poor’s and Fitch, Inc.
Rockwell Collins 2002 Annual Report 31

are A-2 / A / A, respectively, for long-term debt and P-1 / A-1 / F-1, respectively, for short-
term debt. Moody’s and Standard & Poor’s placed a “negative outlook” on our credit ratings
shortly after September 11, 2001 due to the adverse impact of this event on the commercial
aerospace industry. The “negative outlook” ratings have not impaired our access to the
commercial paper markets. Our ratings with Fitch, Inc. continue to have a “stable outlook.”
Under our commercial paper program, we may sell up to $1 billion face amount of unsecured
short-term promissory notes in the commercial paper market. The commercial paper notes
may bear interest or may be sold at a discount and have a maturity of not more than 364 days
from time of issuance. Borrowings under the commercial paper program are available for
working capital needs and other general corporate purposes. Commercial paper borrowings
outstanding were $132 million at September 30, 2002.
Our Revolving Credit Facilities consist of a five-year $500 million portion expiring in May
2006 and a 364-day $500 million portion which expires May 28, 2003. The Revolving Credit
Facilities exist primarily to support our commercial paper program, but are available to the
Company in the event our access to the commercial paper market is impaired or eliminated.
Our only financial covenant under the Revolving Credit Facilities requires that our company
maintain a consolidated debt to total capitalization ratio of not greater than 60 percent. Our
debt to total capital ratio at September 30, 2002 was 12 percent. At our election, the 364-
day portion of the Revolving Credit Facilities can be converted to a one-year term loan.
Our credit facilities do not contain any rating downgrade triggers that would accelerate the
maturity of our indebtedness. There were no borrowings outstanding under our Revolving
Credit Facilities as of September 30, 2002.
In addition to our Revolving Credit Facilities and commercial paper program, we have a
shelf registration statement filed with the Securities and Exchange Commission covering up
to $750 million in debt securities, common stock, preferred stock or warrants that may be
offered in one or more offerings on terms to be determined at the time of sale. Net proceeds
of any offering will be used for general corporate purposes, with possible uses including
repayment of existing indebtedness, capital expenditures, acquisitions and share repurchases.
If our credit ratings were to be adjusted downward by the rating agencies, the implications
of such actions could include elimination of access to the commercial paper market and an
increase in the cost of borrowing. In the event that we do not have access to the commercial
paper market, alternative sources of funding could include borrowings under the Revolving
Credit Facilities, funds available from the issuance of securities under our shelf registration,
and potential asset securitization strategies.
Contractual Obligations and Other Commitments
The following table reflects certain of our contractual obligations and other commitments as
of September 30, 2002:
PAYMENTS DUE BY PERIOD
LESS THAN 1 - 3(IN MILLIONS) TOTAL 1 YEAR YEARS THEREAFTER
Non-cancelable operating leases $ 51 $ 17 $ 26 $ 8Research and development arrangement 18 9 9 –Commercial paper borrowings 132 132 – –
Total $ 201 $ 158 $ 35 $ 8
We lease certain office and manufacturing facilities as well as certain machinery and equipment
under various lease contracts with terms that meet the accounting definition of operating
leases. Our commitments under these operating leases, in the form of non-cancelable future
lease payments, are not reflected as a liability on our Statement of Financial Position. In
connection with our 50 percent equity investment in Rockwell Scientific, we have guaranteed
the lease obligation of a Rockwell Scientific facility in the amount of $4 million that expires
ratably through December 2011. We have no other material outstanding guarantees of debt
relating to our customers, suppliers, joint venture affiliates, or any other party.
As of September 30, 2002, we had outstanding letters of credit totaling $92 million issued
by banks to support certain contractual obligations to our customers. If we fail to meet
these contractual obligations, these letters of credit may become a liability of our company.
Environmental
We are subject to federal, state and local regulations relating to the discharge of substances
into the environment, the disposal of hazardous wastes, and other activities affecting the
environment that have had and will continue to have an impact on our manufacturing operations.
These environmental protection regulations may require the investigation and remediation of
environmental impairments at current and previously owned or leased properties. In addition,
lawsuits, claims and proceedings have been asserted on occasion against us alleging violations
of environmental protection regulations, or seeking remediation of alleged environmental
MANAGEMENT’S DISCUSSION AND ANALYSIS (CONTINUED)
32

MANAGEMENT’S DISCUSSION AND ANALYSIS (CONTINUED)
impairments, principally at previously owned or leased properties. We are currently involved
in the investigation or remediation of seven sites under these regulations or pursuant to
lawsuits asserted by third parties. As of September 30, 2002, management estimates that
the total reasonably possible cost we could incur from these matters to be about $12 million.
We have recorded $3 million of environmental reserves for these matters as of September 30,
2002, which represents management’s estimate of the probable future cost for these matters.
In addition, we assumed liabilities for certain environmental matters relating to properties
acquired in connection with our purchase of Kaiser. We have rights to indemnification for these
matters from the escrow funds set aside at the time of acquisition. At September 30, 2002,
we have filed claims against the escrow fund for these matters in the amount of $2 million.
In addition, we may be liable for environmental matters related to certain other properties
previously owned or leased by Kaiser. Liability for these matters is subordinated to third parties;
however, failure of these third parties to satisfy their obligations related to these properties
could cause these liabilities to revert to us. We have rights to indemnification for these matters
from the escrow funds in the amount of $8 million set aside at the time of acquisition. We
believe the amount of these escrow funds are sufficient to address these matters.
To date, compliance with environmental regulations and resolution of environmental claims have
been accomplished without material effect on our liquidity and capital resources, competitive
position or financial condition. Management believes that expenditures for environmental
capital investment and remediation necessary to comply with present regulations governing
environmental protection and other expenditures for the resolution of environmental claims
will not have a material adverse effect on our business or financial condition, but could possibly
be material to the results of operations of any one period. We cannot assess the possible
effect of compliance with future environmental regulations.
Recently Issued Accounting Standards
In June 2001, the Financial Accounting Standards Board issued SFAS No. 143, Accounting
for Asset Retirement Obligations (SFAS 143). SFAS 143 requires the recording of the fair
value of liabilities associated with the retirement of long-lived assets when there is a legal
or contractual requirement to incur such costs. We will adopt SFAS 143 effective October 1,
2002, and this adoption is not expected to have a material effect on our results of operations
or financial position.
In August 2001, the Financial Accounting Standards Board issued SFAS No. 144, Accounting
for the Impairment or Disposal of Long-Lived Assets (SFAS 144). SFAS 144 provides new
guidance on the recognition of impairment losses on long-lived assets to be held and used or
to be disposed of and replaces SFAS No. 121, Accounting for the Impairment of Long-Lived
Assets and for Long-Lived Assets to be Disposed of. SFAS 144 also broadens the definition
of what constitutes a discontinued operation and how the results of a discontinued operation
are to be measured and presented. We will adopt SFAS 144 effective October 1, 2002.
SFAS 144 is not expected to materially change the methods used to measure impairment
losses on long-lived assets, but may result in more matters being reported as discontinued
operations than is permitted under current accounting principles.
In June 2002, the Financial Accounting Standards Board issued SFAS No. 146, Accounting
for Costs Associated with Exit or Disposal Activities (SFAS 146). SFAS 146 requires liabilities
associated with exit or disposal activities to be recognized at the time they are incurred
rather than at the date of a commitment by management to an exit or disposal plan.
SFAS 146 is required to be applied prospectively to any exit or disposal activities initiated
subsequent to December 31, 2002, and may change the timing of when certain charges
are recorded in connection with future exit, disposal, or restructuring activities.
Critical Accounting Policies
The preparation of financial statements in accordance with accounting principles generally
accepted in the United States of America requires management of Rockwell Collins to make
estimates, judgements, and assumptions that affect our financial condition and results of
operations that are reported in the accompanying consolidated financial statements as well
as the related disclosure of assets and liabilities contingent upon future events.
Understanding of the critical accounting policies discussed below and risks associated
therewith are important in evaluating the financial condition and results of operations of
Rockwell Collins. Management believes the following accounting policies used in the preparation
of the consolidated financial statements are critical to the portrayal of our financial condition
and results of operations as they involve a significant use of management judgement on
matters that are inherently uncertain. If actual results differ significantly from management’s
estimates, there could be a material effect on our financial condition, results of operations
and cash flows. Management has discussed the identification and development of these
critical accounting policies with the Audit Committee of the Board of Directors.
Rockwell Collins 2002 Annual Report 33
Allowance for Doubtful Accounts
Allowances are established in order to report receivables at net realizable value on our
Statement of Financial Position. The determination of these allowances requires management
to make estimates and judgements as to the collectibility of customer account balances.
These allowances are estimated by reviewing the financial condition and collection experience
with our customers, and by considering both current and projected economic and market
conditions. Receivables from customers who file bankruptcy are generally reserved for at
100 percent with the uncollectible portion written off upon resolution from the bankruptcy
court. Management currently believes that our commercial customers, especially those in
the commercial airline industry, are the primary source of risk for uncollectible receivables.
Commercial Systems receivables at September 30, 2002 were $254 million, of which
approximately $116 million was associated with commercial airlines.
At September 30, 2002, we have $16 million in allowances for doubtful accounts recorded
on a total accounts receivable balance of $540 million. Although management believes
this allowance to be adequate, we are not able to predict with certainty the changes in the
financial stability of our customers. Any material change in the financial status of any one or
group of customers could have a material adverse effect on our results of operations in the
period in which additional allowances are required.
Inventory Valuation Reserves
Inventory valuation reserves are recorded in order to report inventories at the lower of cost
or market on our Statement of Financial Position. The determination of valuation reserves
requires management to make estimates and judgements on the future salability of inventories.
Valuation reserves for excess, obsolete, and slow moving inventory are estimated by comparing
the inventory levels of individual parts to both future sales forecasts or production requirements
and historical usage rates in order to identify inventory that is unlikely to be sold above cost.
Other factors that management considers in determining these reserves include overall market
conditions and other inventory management initiatives. Management can generally react
to reduce the likelihood of severe excess and slow-moving inventory issues by changing
purchasing behavior and practices provided there are no abrupt changes in market conditions.
Sudden and prolonged changes in market conditions, however, can result in levels of
inventories that exceed future production requirements or sales forecasts requiring the need
for additional valuation reserves.
Management believes its primary source of risk for excess and obsolete inventory stems
from our in-flight entertainment product line that tends to experience quicker technological
obsolescence than our other products. In addition, higher risk is also associated with the
purchase of “life-time buy” inventory, which is inventory that is typically no longer being
produced by our vendors but for which we purchase multiple years of supply in order to
meet production and service requirements over the life span of a product. Life-time buy
inventory on hand at September 30, 2002 is approximately $86 million.
At September 30, 2002, we have $102 million of inventory valuation reserves recorded on
$755 million of total inventory on hand. Although management believes these reserves are
adequate, any abrupt changes in market conditions may require us to record additional
inventory valuation reserves which could have a material adverse effect on our results of
operations in the period in which these additional reserves are required.
Accounting for Long-Term Contracts
A substantial portion of our sales to government related customers and certain of our sales
to commercial customers are made pursuant to long-term contracts requiring development
and delivery of products over several years and often contain fixed-price purchase options
for additional products. Certain of these contracts are accounted for under the percentage-of-
completion method of accounting under the American Institute of Certified Public Accountants’
Statement of Position 81-1 Accounting for Performance of Construction-Type and Certain
Production-Type Contracts (SOP 81-1). Sales and earnings under these contracts are
recorded either as products are shipped under the units-of-delivery method (for production
effort), or based on the ratio of actual costs incurred to total estimated costs expected to
be incurred related to the contract under the cost-to-cost method (for development effort).
The percentage-of-completion method of accounting requires management to estimate
the profit margin for each individual contract and to apply that profit margin on a uniform
basis as sales are recorded under the contract. The estimation of profit margins requires
management to make projections of the total sales to be generated and the total costs that
will be incurred under a contract. These projections require management to make numerous
assumptions and estimates relating to such items as the complexity of design and related
development costs, performance of subcontractors, availability and cost of materials,
labor productivity and cost, overhead and capital costs, and manufacturing efficiency.
MANAGEMENT’S DISCUSSION AND ANALYSIS (CONTINUED)
34
MANAGEMENT’S DISCUSSION AND ANALYSIS (CONTINUED)
Other variables include purchase options for additional quantities and the recoverability of
costs associated with customer change orders for additional or revised product functionality.
Sales and costs related to profitable purchase options are included in our estimates only
when the options are exercised while sales and costs related to unprofitable purchase options
are included in our estimates when exercise is determined to be probable. Change orders
are accounted for either as an integral part of the original contract or separately depending
upon the nature and value of the item. Sales related to change orders are included in profit
estimates only if they can be reliably estimated and collectibility is reasonably assured.
Anticipated losses on contracts are recognized in full in the period in which losses become
probable and estimable. We combine or segment contracts only when the criteria under
SOP 81-1 are met.
Estimates of profit margins for contracts are typically reviewed by management on a quarterly
basis. Assuming the initial estimates of sales and costs under a contract are accurate, the
percentage-of-completion method results in the profit margin being recorded evenly over
the term of the contract. Changes in these underlying estimates due to revisions in sales and
cost estimates, the combining of contracts, or the exercise of contract options may result
in profit margins being recognized unevenly over a contract as such changes are accounted
for using the cumulative catch-up method. Significant changes in estimate related to accounting
for long-term contracts may have a material adverse effect on our results of operations in
the period in which the revised estimate is made.
Warranty
Reserves are recorded on our Statement of Financial Position to reflect our contractual
liabilities relating to warranty commitments to our customers. We provide warranty coverage
of various lengths and terms to our customers depending on standard offerings and negotiated
contractual agreements. We record an estimate for warranty expense at the time of sale based
on historical warranty return rates and repair costs. We believe our primary source of risk related
to warranty obligations relates to our in-flight entertainment products and extended warranty
terms across all businesses. At September 30, 2002 we have recorded $141 million of warranty
reserves that were determined based upon historical warranty return rates and repair costs.
Should future experience differ materially from our historical experience, we may be required
to record additional warranty reserves which could have a material adverse effect on our
results of operations in the period in which these additional reserves are required.
Retiree Benefits
We provide retirement benefits to most of our employees in the form of defined benefit pension
plans (Pension Benefits) and retiree medical and other insurance plans (Other Retirement
Benefits). Accounting standards require the cost of providing these benefit programs be
measured on an actuarial basis. These accounting standards will generally reduce the
volatility of the reported benefit obligations and related benefit expense as actuarial gains
and losses resulting from both normal year-to-year changes in valuation assumptions and
the differences from actual experience are deferred and amortized. The application of these
accounting standards requires management to make numerous assumptions and judgments
that can significantly affect these measurements. Critical assumptions made by management
in performing these actuarial valuations include the selection of discount rates, expectations
on the future rate of return on pension plan assets, and estimates of future health care cost
trend rates.
Discount rates are used to determine the present values of our benefit obligations and also
affect the amount of benefit expense recorded in any given period. We estimate this discount
rate based on the rates of return of high quality, fixed-income investment indexes with
maturity dates that reflect the expected time horizon that benefits will be paid. Changes in
the discount rate could have a material effect on our reported benefit obligations and related
benefit expense. Over the past three years, discount rates have decreased from 8.0 percent
to 7.0 percent, which has significantly increased our reported benefit obligations and have
contributed to an increase in our benefit expense for both Pension Benefit and Other
Retirement Benefits.
The expected rate of return is our estimate of the long-term earnings rate on our pension
plan assets. Our current expected long-term rate of return assumption is 9.0 percent and
we believe this rate of return is appropriate given our investment mix, the expected time
horizon that benefits will be paid, and our historical investment performance. Our actual
average return on pension plan assets over the past ten, fifteen and twenty-year periods
has approximated this expected rate of return. Over the past three years, our actual rate
of return on pension plan assets has been less than our expected rate of return which has
contributed to an increase in our benefit expense for Pension Benefits. Should our actual
rate of return continue to remain below our expected return rate of 9.0 percent, our benefit
expense for Pension Benefits will likely continue to increase.
Rockwell Collins 2002 Annual Report 35

Health care cost trend rates for retiree medical insurance are a significant driver of our
overall Other Retirement Benefits obligation and related benefit expense. These trend rates
are estimated based upon historical experience and future expectations. In recent years,
we have experienced higher than anticipated trend rates resulting in an increased benefit
obligation and increased benefit expense for Other Retirement Benefits. In the fourth quarter
of 2002 and in addition to other plan design changes, we amended our retiree medical plans
to establish a fixed company contribution equal to our portion of estimated per capita health
care costs in calendar year 2003. This amendment has effectively eliminated the risk related
to health care cost trend rates for retiree medical insurance.
Quantitative and Qualitative Disclosures about Market Risk
We are exposed to market risk during the course of business from changes in interest rates
and foreign currency exchange rates. The exposure to these risks is managed through a
combination of normal operating and financial activities and in the case of risk associated
with foreign currency exchange rates, derivative financial instruments in the form of foreign
currency forward exchange contracts.
Interest Rate Risk
In addition to using cash provided by normal operating activities, we utilize short-term
commercial paper borrowings to finance operations and business acquisitions. At
September 30, 2002, commercial paper borrowings outstanding were $132 million compared
with $202 million at September 30, 2001. Although the interest rates are fixed through
the maturity date, we are exposed to interest rate risk upon maturity of commercial paper
borrowings as we will generally refinance all or a portion of this debt by issuing new commercial
paper at market interest rates that may be higher or lower at that time. If market interest
rates would have averaged 25 percent higher in either 2002 or 2001, the effect on results
of operations would not have been material. Due to the short-term nature of commercial
paper outstanding, the fair value of these obligations approximated its carrying value at
September 30, 2002.
Foreign Currency Risk
We are exposed to foreign currency risks that arise from normal business operations.
These risks include the translation of local currency balances of our foreign subsidiaries,
intercompany loans with foreign subsidiaries and transactions denominated in foreign
currencies. Our objective is to minimize our exposure to these risks through a combination
of normal operating activities (by requiring, where possible, export sales to be denominated
in United States dollars) and utilizing foreign currency forward exchange contracts to manage
our exposure on transactions denominated in currencies other than the applicable functional
currency. For the year ended September 30, 2002, approximately 36 percent of our total
sales consisted of sales outside of the United States, with less than 10 percent of total sales
denominated in currencies other than the United States dollar. Foreign currency forward
exchange contracts are executed with creditworthy banks and are denominated in currencies
of major industrial countries. It is our policy not to enter into derivative financial instruments
for speculative purposes. We do not hedge our exposure to the translation of reported results
of our foreign subsidiaries from the local currency to the United States dollar.
At September 30, 2002, we had outstanding foreign currency forward exchange contracts
with notional amounts of $141 million compared with $156 million at September 30, 2001,
primarily consisting of contracts to exchange the euro and pound sterling. Notional amounts
are stated in the U.S. dollar equivalents at spot exchange rates at the respective dates.
The use of these contracts allows us to manage transactional exposure to exchange rate
fluctuations as the gains and losses incurred on the foreign currency forward exchange
contracts will offset, in whole or in part, losses or gains on the underlying foreign currency
exposure. As of September 30, 2002 and 2001, the foreign currency forward exchange
contracts are recorded at fair value in Other Current Assets in the amounts of $4 million
and $4 million, respectively, and Other Current Liabilities in the amounts of $2 million and
$4 million, respectively. A hypothetical 10 percent adverse change in underlying foreign
currency exchange rates associated with these contracts would not be material to our
financial condition, results of operations, or cash flows.
MANAGEMENT’S DISCUSSION AND ANALYSIS (CONTINUED)
36
MANAGEMENT’S DISCUSSION AND ANALYSIS (CONTINUED)
Cautionary Statement
This Annual Report to Shareowners, and documents that are incorporated by reference to
our Annual Report on Form 10-K filed with the SEC, contain statements, including certain
projections and business trends, accompanied by such phrases as “believes”, “estimates”,
“expects”, “could”, “likely”, “anticipates”, “will”, “intends”, and other similar expressions,
that are forward-looking statements as defined in the Private Securities Litigation Reform
Act of 1995. Actual results may differ materially from those projected as a result of certain
risks and uncertainties, including but not limited to the consequence of past and future
terrorist attacks; political turmoil in the Middle East; the timing related to restoring consumer
confidence in air travel; the health of the global economy as well as the commercial aerospace
industry; domestic and foreign government spending, budgetary and trade policies; economic
and political changes in international markets where we compete; demand for and market
acceptance of new and existing products; potential cancellation or delay of orders by
commercial customers; customer bankruptcy; labor work stoppages; market performance of
our pension assets; medical plan expenses; recruitment and retention of qualified personnel;
our ability to successfully execute to our internal performance plans; favorable outcomes
of certain customer procurements; changes to government policies and regulations; new
aircraft build rates; product reliability and cost of repairs; the cyclical nature of our businesses;
factors that result in significant disruption to air travel or reduction to airline profitability; our
customers’ willingness to outsource avionics maintenance and service; successful execution
of our acquisition, strategic and integration plans; our ability to remain competitive in a highly
competitive and rapidly changing marketplace; award of production contracts at the current
projected quantities; our ability to handle production rate increases and decreases; and the
uncertainties of the outcome of litigation, as well as other risks and uncertainties, including
but not limited to those detailed herein and from time to time in our other SEC filings. These
forward-looking statements are made only as of the date hereof.
Rockwell Collins 2002 Annual Report 37

We, the management team of Rockwell Collins, are responsible for the preparation, integrity
and objectivity of the financial statements and other financial information we have presented
in this report. The financial statements were prepared in accordance with accounting principles
generally accepted in the United States of America, applying our estimates and judgments.
Our internal controls are designed to provide reasonable assurance as to the integrity
and reliability of the financial statements and to adequately safeguard, verify and maintain
accountability of assets. These controls are based on established written policies and
procedures, are implemented by trained, skilled personnel with an appropriate segregation
of duties and are monitored through a comprehensive internal audit program. Rockwell
Collins is committed to maintaining the highest ethical standards and business practices
throughout the world.
Deloitte & Touche LLP, our independent auditors, are retained to audit our financial
statements. Their accompanying report is based on audits conducted in accordance with
auditing standards generally accepted in the United States of America, which include the
consideration of our internal controls to establish a basis for reliance in determining the
nature, timing and extent of audit tests to be applied.
Our Board of Directors exercises its responsibility for these financial statements through its
Audit Committee, which consists entirely of independent, non-management, Board members.
The Audit Committee meets regularly with the independent auditors and with the Company’s
internal auditors, both privately and with management present, to review accounting, auditing,
internal controls and financial reporting matters.
Clayton M. Jones Lawrence A. Erickson
Chairman, President and Senior Vice President and
Chief Executive Officer Chief Financial Officer
MANAGEMENT’S RESPONSIBILITY FOR FINANCIAL STATEMENTS
38

INDEPENDENT AUDITORS’ REPORT
To the Board of Directors and Shareowners of Rockwell Collins, Inc.
We have audited the accompanying consolidated statement of financial position of
Rockwell Collins, Inc. and subsidiaries (the “Company”) (formerly the avionics and
communications business of Rockwell Automation, Inc. – see Note 1) as of September 30,
2002 and 2001, and the related consolidated statements of operations, of cash flows,
and of shareowners’ equity and comprehensive income for each of the three years in the
period ended September 30, 2002. These financial statements are the responsibility of the
Company’s management. Our responsibility is to express an opinion on these financial
statements based on our audits.
We conducted our audits in accordance with auditing standards generally accepted in the
United States of America. Those standards require that we plan and perform the audit to
obtain reasonable assurance about whether the financial statements are free of material
misstatement. An audit includes examining, on a test basis, evidence supporting the amounts
and disclosures in the financial statements. An audit also includes assessing the accounting
principles used and significant estimates made by management, as well as evaluating the
overall financial statement presentation. We believe that our audits provide a reasonable
basis for our opinion.
The accompanying consolidated financial statements for the years ended September 30,
2001 and 2000 were prepared to present the results of operations and cash flows of the
Company, as described in Note 1 to the consolidated financial statements, and may not
necessarily be indicative of the results of operations and cash flows if the Company had
been operated as a stand-alone entity during such periods.
In our opinion, such consolidated financial statements present fairly, in all material respects,
the consolidated financial position of the Company as of September 30, 2002 and 2001,
and the consolidated results of its operations and its cash flows for each of the three years
in the period ended September 30, 2002, in conformity with accounting principles generally
accepted in the United States of America.
As discussed in Notes 8 and 23 to the consolidated financial statements, the Company
changed its method of accounting for goodwill and certain other intangible assets effective
October 1, 2001.
Chicago, Illinois
October 29, 2002Rockwell Collins 2002 Annual Report 39
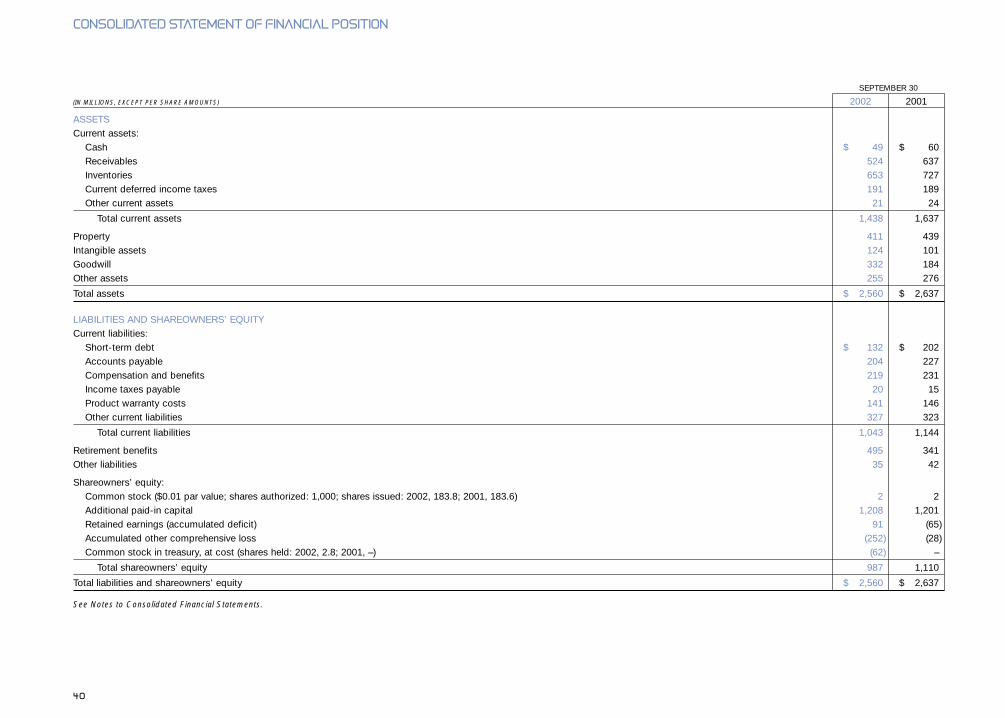
SEPTEMBER 30
(IN MILLIONS, EXCEPT PER SHARE AMOUNTS) 2002 2001
ASSETSCurrent assets:
Cash $ 49 $ 60Receivables 524 637Inventories 653 727Current deferred income taxes 191 189Other current assets 21 24
Total current assets 1,438 1,637
Property 411 439Intangible assets 124 101Goodwill 332 184Other assets 255 276
Total assets $ 2,560 $ 2,637
LIABILITIES AND SHAREOWNERS’ EQUITYCurrent liabilities:
Short-term debt $ 132 $ 202Accounts payable 204 227Compensation and benefits 219 231Income taxes payable 20 15Product warranty costs 141 146Other current liabilities 327 323
Total current liabilities 1,043 1,144
Retirement benefits 495 341Other liabilities 35 42
Shareowners’ equity:Common stock ($0.01 par value; shares authorized: 1,000; shares issued: 2002, 183.8; 2001, 183.6) 2 2Additional paid-in capital 1,208 1,201Retained earnings (accumulated deficit) 91 (65)Accumulated other comprehensive loss (252) (28)Common stock in treasury, at cost (shares held: 2002, 2.8; 2001, –) (62) –
Total shareowners’ equity 987 1,110
Total liabilities and shareowners’ equity $ 2,560 $ 2,637
See Notes to Consolidated Financial Statements.
CONSOLIDATED STATEMENT OF FINANCIAL POSITION
40
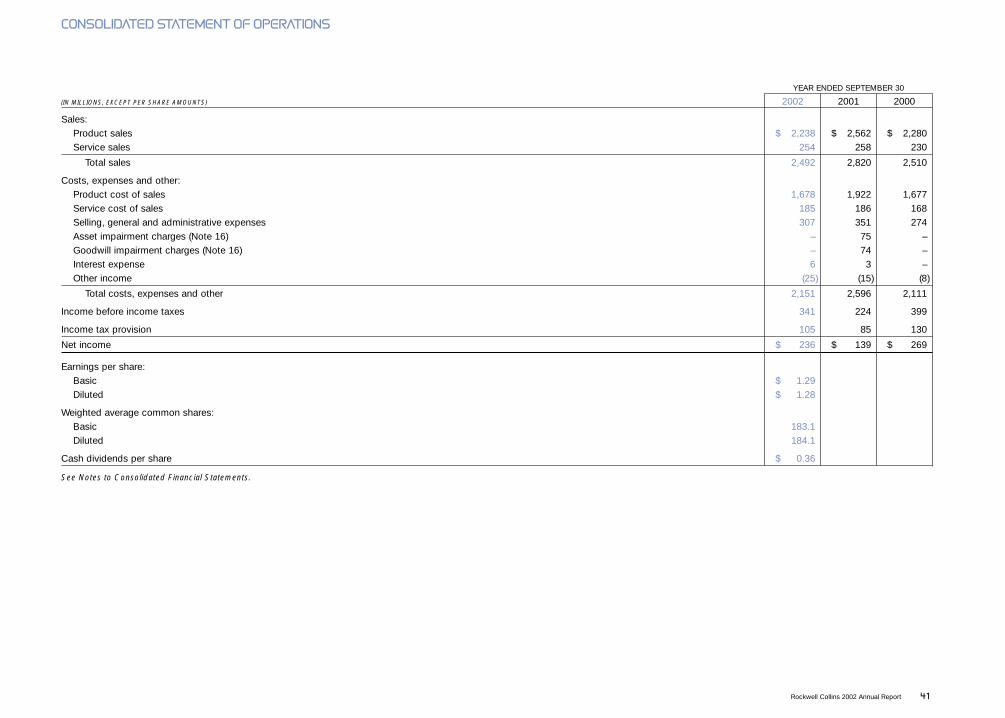
CONSOLIDATED STATEMENT OF OPERATIONS
YEAR ENDED SEPTEMBER 30
(IN MILLIONS, EXCEPT PER SHARE AMOUNTS) 2002 2001 2000
Sales:Product sales $ 2,238 $ 2,562 $ 2,280Service sales 254 258 230
Total sales 2,492 2,820 2,510
Costs, expenses and other:Product cost of sales 1,678 1,922 1,677Service cost of sales 185 186 168Selling, general and administrative expenses 307 351 274Asset impairment charges (Note 16) – 75 –Goodwill impairment charges (Note 16) – 74 –Interest expense 6 3 –Other income (25) (15) (8)
Total costs, expenses and other 2,151 2,596 2,111
Income before income taxes 341 224 399
Income tax provision 105 85 130
Net income $ 236 $ 139 $ 269
Earnings per share:Basic $ 1.29Diluted $ 1.28
Weighted average common shares:Basic 183.1Diluted 184.1
Cash dividends per share $ 0.36
See Notes to Consolidated Financial Statements.
Rockwell Collins 2002 Annual Report 41

YEAR ENDED SEPTEMBER 30
(IN MILLIONS) 2002 2001 2000
OPERATING ACTIVITIES:Net income $ 236 $ 139 $ 269Adjustments to arrive at cash provided by operating activities:
Depreciation 98 98 90Amortization of intangible assets 7 40 16Pension plan contributions (46) (7) (6)Deferred income taxes 50 (26) 24Asset impairment charges (Note 16) – 75 –Goodwill impairment charges (Note 16) – 74 –Tax benefit from exercise of stock options 4 – –Changes in assets and liabilities, excluding effects of acquisitions, divestitures, and foreign currency adjustments:
Receivables 122 (104) 34Inventories 78 (49) 17Accounts payable (32) 19 (46)Income taxes payable 5 8 (2)Compensation and benefits (3) 9 (16)Other assets and liabilities (66) (83) (99)
Cash Provided by Operating Activities 453 193 281
INVESTING ACTIVITIES:Property additions (62) (110) (98)Acquisition of businesses, net of cash acquired (193) (292) (123)Investment in equity affiliates (5) (3) –Proceeds from the disposition of businesses 15 – –Proceeds from the disposition of property 6 – –
Cash Used for Investing Activities (239) (405) (221)
FINANCING ACTIVITIES:Increase (decrease) in short-term borrowings, net (70) 202 –Purchase of treasury stock (102) – –Cash dividends (66) (17) –Pre-Distribution dividend to Rockwell International (Note 1) – (300) –Proceeds from exercise of stock options 17 – –Net transfers from (to) Rockwell International – 366 (52)
Cash (Used for) Provided by Financing Activities (221) 251 (52)
Effect of exchange rate changes on cash (4) 1 (8)
Net Change in Cash (11) 40 –Cash at Beginning of Year 60 20 20
Cash at End of Year $ 49 $ 60 $ 20
See Notes to Consolidated Financial Statements.
CONSOLIDATED STATEMENT OF CASH FLOWS
42
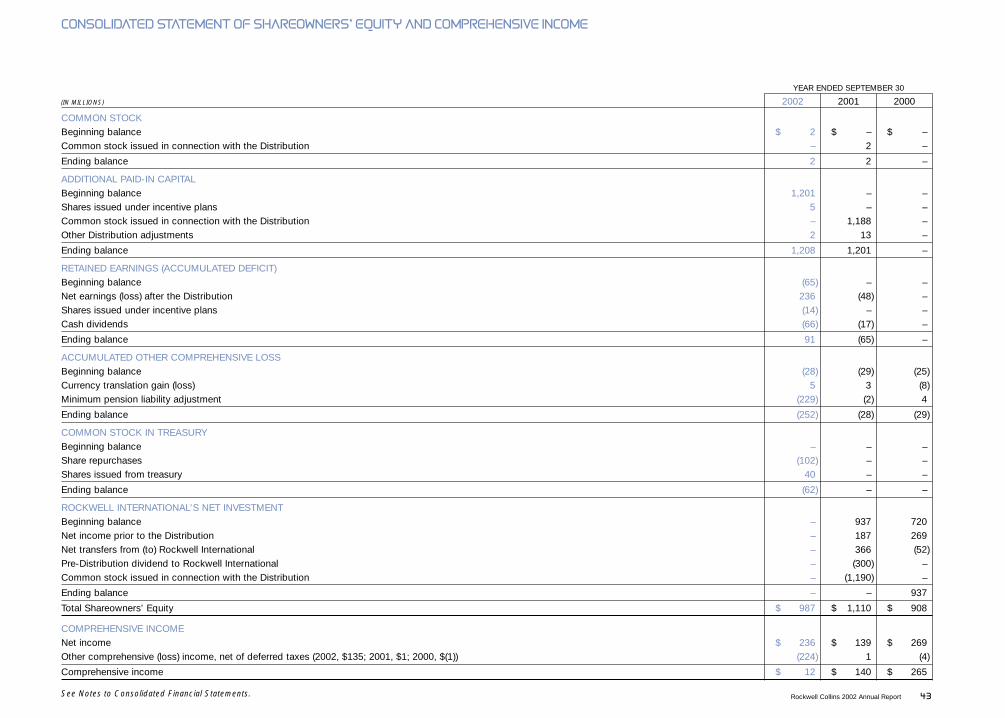
CONSOLIDATED STATEMENT OF SHAREOWNERS’ EQUITY AND COMPREHENSIVE INCOME
YEAR ENDED SEPTEMBER 30
(IN MILLIONS) 2002 2001 2000
COMMON STOCKBeginning balance $ 2 $ – $ –Common stock issued in connection with the Distribution – 2 –
Ending balance 2 2 –
ADDITIONAL PAID-IN CAPITALBeginning balance 1,201 – –Shares issued under incentive plans 5 – –Common stock issued in connection with the Distribution – 1,188 –Other Distribution adjustments 2 13 –
Ending balance 1,208 1,201 –
RETAINED EARNINGS (ACCUMULATED DEFICIT)Beginning balance (65) – –Net earnings (loss) after the Distribution 236 (48) –Shares issued under incentive plans (14) – –Cash dividends (66) (17) –
Ending balance 91 (65) –
ACCUMULATED OTHER COMPREHENSIVE LOSSBeginning balance (28) (29) (25)Currency translation gain (loss) 5 3 (8)Minimum pension liability adjustment (229) (2) 4
Ending balance (252) (28) (29)
COMMON STOCK IN TREASURYBeginning balance – – –Share repurchases (102) – –Shares issued from treasury 40 – –
Ending balance (62) – –
ROCKWELL INTERNATIONAL’S NET INVESTMENTBeginning balance – 937 720Net income prior to the Distribution – 187 269Net transfers from (to) Rockwell International – 366 (52)Pre-Distribution dividend to Rockwell International – (300) –Common stock issued in connection with the Distribution – (1,190) –
Ending balance – – 937
Total Shareowners’ Equity $ 987 $ 1,110 $ 908
COMPREHENSIVE INCOMENet income $ 236 $ 139 $ 269Other comprehensive (loss) income, net of deferred taxes (2002, $135; 2001, $1; 2000, $(1)) (224) 1 (4)
Comprehensive income $ 12 $ 140 $ 265
See Notes to Consolidated Financial Statements. Rockwell Collins 2002 Annual Report 43

1. Basis of Presentation
Rockwell Collins, Inc. (the Company or Rockwell Collins) provides aviation electronics
and airborne and mobile communications products and systems for commercial and
military applications. Rockwell Collins became an independent, publicly held company on
June 29, 2001, when Rockwell International Corporation, renamed Rockwell Automation,
Inc. (Rockwell), spun off its former avionics and communications business (Avionics and
Communications) and certain other assets and liabilities of Rockwell by means of a
distribution (the Distribution) of all the outstanding shares of common stock of the Company
to the shareowners of Rockwell in a tax-free spin-off. In connection with the Distribution, the
Company paid a pre-Distribution dividend of $300 million to Rockwell, which was funded
through the issuance of commercial paper.
The financial statements as of, and for the periods subsequent to, the Distribution reflect the
financial position, results of operations and cash flows of the Company and its consolidated
subsidiaries on a basis that reflects the historical assets, liabilities, and operations of the
business contributed to the Company by Rockwell.
The financial statements for periods prior to the Distribution reflect the financial position,
results of operations and cash flows of Avionics and Communications as operated by
Rockwell prior to the Distribution, as well as the Company’s share of earnings and losses
from its 50 percent ownership interest in Rockwell Scientific Company, LLC (Rockwell
Scientific) that was transferred to the Company in connection with the Distribution. These
financial statements also include an allocation for management and other services provided
by Rockwell to the Company including, but not limited to, corporate oversight, financial,
legal, tax, payroll, and employee benefits administration services. Total costs allocated
to the Company for these services were $27 million and $36 million for the years ended
September 30, 2001 and 2000, respectively. Management believes that the method used
to allocate these costs to the Company was reasonable and the amounts approximate the
costs that would have been incurred by the Company on a stand-alone basis. The financial
statements for periods prior to the Distribution are not necessarily indicative of what the
financial position, results of operations and cash flows would have been if Rockwell Collins
had been an independent public company during such periods.
Certain prior year amounts have been reclassified to conform to the current year presentation.
2. Significant Accounting Policies
Consolidation
The consolidated financial statements include the accounts of the Company and
all majority-owned subsidiaries in which the Company has control. The Company’s
investments in non-controlled entities in which it has the ability to exercise significant
influence over operating and financial policies are accounted for under the equity method
and are classified as Other Assets in the Statement of Financial Position. All significant
intercompany transactions have been eliminated.
Revenue Recognition
Sales related to certain long-term contracts requiring development and delivery of products
over several years are accounted for under the percentage-of-completion method of accounting
under the American Institute of Certified Public Accountants’ Statement of Position 81-1
Accounting for Performance of Construction-Type and Certain Production-Type Contracts
(SOP 81-1). Sales and earnings under these contracts are recorded either as products are
shipped under the units-of-delivery method (for production effort), or based on the ratio of
actual costs incurred to total estimated costs expected to be incurred related to the contract
under the cost-to-cost method (for development effort). Sales and costs related to profitable
purchase options are included in estimates only when the options are exercised while sales
and costs related to unprofitable purchase options are included in estimates when exercise
is determined to be probable. Change orders are accounted for either as an integral part of
the original contract or separately depending upon the nature and value of the item. Sales
related to change orders are included in profit estimates only if they can be reliably estimated
and collectibility is reasonably assured. Anticipated losses on contracts are recognized in
full in the period in which losses become probable and estimable. Changes in estimates of
profit or loss on contracts are included in earnings under the cumulative catch-up method.
The Company recognizes sales for products or services not meeting the criteria of SOP 81-1
when all of the following criteria are met: an agreement of sale exists, product delivery and
acceptance has occurred or services have been rendered, pricing is fixed or determinable,
and collection is reasonably assured.
The Company provides maintenance, logistics support, and other services to certain
customers under long-term contracts. Certain contracts are fixed price contracts with sales
recognized ratably over the contractual life, while other contracts have a fixed hourly rate
with sales recognized based upon actual labor or flight hours incurred.
NOTES TO CONSOLIDATED FINANCIAL STATEMENTS
44

NOTES TO CONSOLIDATED FINANCIAL STATEMENTS
Research and Development
Research and development expenditures under Company-initiated programs are expensed
as incurred. Customer-funded research and development expenditures include activities
relating to the development of new products and the improvement of existing products which
are accounted for as contract costs, and the reimbursement is accounted for as a sale.
Foreign Currency Translation
Assets and liabilities of subsidiaries operating outside of the United States with a functional
currency other than the U.S. dollar are translated into U.S. dollars using exchange rates
at the end of the respective period. Sales, costs and expenses are translated at average
exchange rates effective during the respective period. Foreign currency translation gains
and losses are included as a component of Accumulated Other Comprehensive Loss. Foreign
currency transaction gains and losses are included in the Statement of Operations in the
period incurred.
Earnings Per Share Information
Earnings per share information for 2001 and 2000 has not been presented in the Statement
of Operations, as the Company was not an independent company during each of these
years. Earnings per share information has been presented on a pro forma basis in Note 23
for 2001 and 2000 as if the Distribution had taken place on October 1, 1999 and giving
effect to new accounting standards recently adopted.
Cash
Cash includes time deposits and certificates of deposit with original maturity dates of three
months or less.
Inventories
Inventories are stated at the lower of cost or market using standard costs which approximate
the first-in, first-out method, less related progress payments received. Market is determined
on the basis of estimated realizable values on a part level basis in order to establish inventory
valuation reserves. Inventoried costs include direct costs of manufacturing, engineering and
tooling, and allocable overhead costs.
Property
Property is stated at acquisition cost. Depreciation of property is generally provided using
accelerated and straight-line methods over the following estimated useful lives: buildings and
improvements, fifteen to forty years; machinery and equipment, eight years; and information
systems software and hardware, three to ten years. Significant renewals and betterments are
capitalized and replaced units are written off. Maintenance and repairs, as well as renewals
of minor amounts, are charged to expense in the period incurred.
Goodwill and Intangible Assets
Goodwill and other intangible assets generally result from business acquisitions. Effective
October 1, 2001, the Company accounts for goodwill and purchased intangible assets
under Statement of Financial Accounting Standards (SFAS) No. 141, Business Combinations
(SFAS 141), and SFAS No. 142, Goodwill and Other Intangible Assets (SFAS 142). Business
acquisitions are accounted for under the purchase method by assigning the purchase price
to tangible and intangible assets acquired and liabilities assumed, including research and
development projects which have not yet reached technological feasibility and have no
alternative future use (purchased research and development). Assets acquired and liabilities
assumed are recorded at their fair values; the appraised value of purchased research and
development is immediately charged to expense; and the excess of the purchase price over
the amounts assigned is recorded as goodwill. Assets acquired and liabilities assumed are
allocated to the Company’s “reportable units” based upon the Company’s integration plans
and internal reporting structure. Purchased intangible assets with finite lives are amortized
over the estimated useful lives. Goodwill and intangible assets with indefinite lives are not
amortized, but reviewed at least annually for impairment. Prior to the adoption of SFAS 141
and SFAS 142, all goodwill and intangible assets were amortized over their estimated useful
lives ranging from three to forty years.
Impairment of Long-Lived Assets
The Company assesses the impairment of long-lived assets, excluding goodwill and indefinite-
lived intangible assets, in accordance with SFAS No. 121, Accounting for the Impairment of
Long-Lived Assets and Long-Lived Assets to be Disposed of (SFAS 121). Under SFAS 121,
long-lived assets are reviewed for impairment when events or circumstances indicate that
the carrying amount of a long-lived asset may not be recoverable and for all assets to be
disposed. Long-lived assets held for use are reviewed for impairment by comparing the
carrying amount of an asset to the undiscounted future cash flows expected to be generated
Rockwell Collins 2002 Annual Report 45
by the asset over its remaining useful life. If an asset is considered to be impaired, the
impairment to be recognized is measured as the amount by which the carrying amount of
the asset exceeds its fair value. Assets to be disposed of are reported at the lower of the
carrying amount or fair value less cost to sell. Management determines fair value using
discounted future cash flow analysis or other accepted valuation techniques. In September
2001, the Company recorded asset impairment charges of $136 million related to its in-flight
entertainment product line and $13 million related to certain software license agreements
(see Note 16).
Effective October 1, 2001, the Company assesses the impairment of goodwill and intangible
assets with indefinite lives under the provisions of SFAS 142, which requires goodwill and
indefinite lived intangible assets to be tested annually for impairment with more frequent
tests required if indications of impairment exist. Under SFAS 142, impairment for intangible
assets with indefinite lives exists if the carrying value of the intangible asset exceeds its
fair value. Goodwill is considered to be impaired under SFAS 142 if the carrying value of a
“reporting unit” exceeds its estimated fair value. Management determines fair value using
discounted future cash flow analysis or other accepted valuation techniques.
Customer Incentives
Rockwell Collins provides sales incentives to certain commercial customers in connection
with sales contracts. These incentives are recognized as a reduction of the sales price for
customer account credits or charged to cost of sales for products or services to be provided.
The liability for these incentives is included in Other Current Liabilities in the Statement of
Financial Position.
Environmental
Liabilities for environmental matters are recorded in the period in which it is probable that an
obligation has been incurred and the cost can be reasonably estimated. At environmental
sites in which more than one potentially responsible party has been identified, the Company
records a liability for its estimated allocable share of costs related to its involvement with
the site as well as an estimated allocable share of costs related to the involvement of insolvent
or unidentified parties. At environmental sites in which the Company is the only responsible
party, the Company records a liability for the total estimated costs of remediation. Costs
of future expenditures for environmental remediation obligations do not consider inflation
and are not discounted to present values. If recovery from insurers or other third parties is
determined to be probable, the Company records a receivable for the estimated recovery.
Revisions to the estimate of liabilities incurred are made in the periods in which the estimated
costs of remediation change.
Stock-Based Compensation
The Company accounts for employee stock-based compensation in accordance with
Accounting Principles Board Opinion (APB) No. 25, Accounting for Stock Issued to Employees
(APB 25). As the Company’s various incentive plans require stock options to be granted at
prices equal to or above the fair market value of the Company’s common stock on the grant
dates, no compensation expense is recognized in connection with stock options granted
to employees. Additionally, the Company sponsors an Employee Stock Purchase Plan that
is considered a non-compensatory plan under APB 25 and no compensation expense is
recorded in connection with this benefit.
Derivative Financial Instruments
The Company uses derivative financial instruments in the form of foreign currency forward
exchange contracts to manage foreign currency risks. Foreign currency forward exchange
contracts are used to offset changes in the fair value of certain assets and liabilities resulting
from intercompany loans and transactions with third parties denominated in foreign currencies.
Company policy is to execute such instruments with creditworthy banks and not to enter
into derivative financial instruments for speculative purposes. All foreign currency forward
exchange contracts are denominated in currencies of major industrial countries. All of the
foreign currency forward exchange contracts entered into by the Company, although effective
hedges from an economic perspective, have not been designated as hedges for accounting
purposes. These contracts are recognized in the Statement of Financial Position at fair value
with the changes in the fair value recognized in earnings as a component of Cost of Sales.
Use of Estimates
The financial statements of Rockwell Collins have been prepared in accordance with
accounting principles generally accepted in the United States of America, which require
management to make estimates and assumptions that affect the amounts reported in the
financial statements. Actual results could differ from those estimates. Estimates are used in
accounting for, among other items, long-term contracts, allowances for doubtful accounts,
inventory obsolescence, product warranty costs, customer incentives, retirement benefits,
NOTES TO CONSOLIDATED FINANCIAL STATEMENTS
46
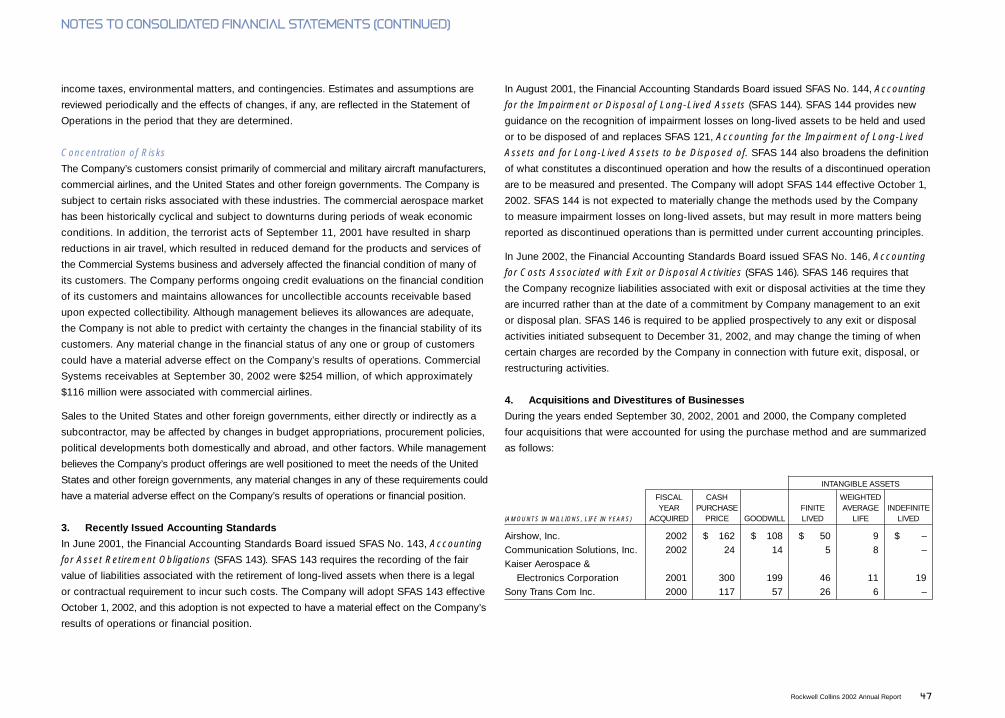
NOTES TO CONSOLIDATED FINANCIAL STATEMENTS (CONTINUED)
income taxes, environmental matters, and contingencies. Estimates and assumptions are
reviewed periodically and the effects of changes, if any, are reflected in the Statement of
Operations in the period that they are determined.
Concentration of Risks
The Company’s customers consist primarily of commercial and military aircraft manufacturers,
commercial airlines, and the United States and other foreign governments. The Company is
subject to certain risks associated with these industries. The commercial aerospace market
has been historically cyclical and subject to downturns during periods of weak economic
conditions. In addition, the terrorist acts of September 11, 2001 have resulted in sharp
reductions in air travel, which resulted in reduced demand for the products and services of
the Commercial Systems business and adversely affected the financial condition of many of
its customers. The Company performs ongoing credit evaluations on the financial condition
of its customers and maintains allowances for uncollectible accounts receivable based
upon expected collectibility. Although management believes its allowances are adequate,
the Company is not able to predict with certainty the changes in the financial stability of its
customers. Any material change in the financial status of any one or group of customers
could have a material adverse effect on the Company’s results of operations. Commercial
Systems receivables at September 30, 2002 were $254 million, of which approximately
$116 million were associated with commercial airlines.
Sales to the United States and other foreign governments, either directly or indirectly as a
subcontractor, may be affected by changes in budget appropriations, procurement policies,
political developments both domestically and abroad, and other factors. While management
believes the Company’s product offerings are well positioned to meet the needs of the United
States and other foreign governments, any material changes in any of these requirements could
have a material adverse effect on the Company’s results of operations or financial position.
3. Recently Issued Accounting Standards
In June 2001, the Financial Accounting Standards Board issued SFAS No. 143, Accounting
for Asset Retirement Obligations (SFAS 143). SFAS 143 requires the recording of the fair
value of liabilities associated with the retirement of long-lived assets when there is a legal
or contractual requirement to incur such costs. The Company will adopt SFAS 143 effective
October 1, 2002, and this adoption is not expected to have a material effect on the Company’s
results of operations or financial position.
In August 2001, the Financial Accounting Standards Board issued SFAS No. 144, Accounting
for the Impairment or Disposal of Long-Lived Assets (SFAS 144). SFAS 144 provides new
guidance on the recognition of impairment losses on long-lived assets to be held and used
or to be disposed of and replaces SFAS 121, Accounting for the Impairment of Long-Lived
Assets and for Long-Lived Assets to be Disposed of. SFAS 144 also broadens the definition
of what constitutes a discontinued operation and how the results of a discontinued operation
are to be measured and presented. The Company will adopt SFAS 144 effective October 1,
2002. SFAS 144 is not expected to materially change the methods used by the Company
to measure impairment losses on long-lived assets, but may result in more matters being
reported as discontinued operations than is permitted under current accounting principles.
In June 2002, the Financial Accounting Standards Board issued SFAS No. 146, Accounting
for Costs Associated with Exit or Disposal Activities (SFAS 146). SFAS 146 requires that
the Company recognize liabilities associated with exit or disposal activities at the time they
are incurred rather than at the date of a commitment by Company management to an exit
or disposal plan. SFAS 146 is required to be applied prospectively to any exit or disposal
activities initiated subsequent to December 31, 2002, and may change the timing of when
certain charges are recorded by the Company in connection with future exit, disposal, or
restructuring activities.
4. Acquisitions and Divestitures of Businesses
During the years ended September 30, 2002, 2001 and 2000, the Company completed
four acquisitions that were accounted for using the purchase method and are summarized
as follows:
INTANGIBLE ASSETS
FISCAL CASH WEIGHTEDYEAR PURCHASE FINITE AVERAGE INDEFINITE
(AMOUNTS IN MILLIONS, LIFE IN YEARS) ACQUIRED PRICE GOODWILL LIVED LIFE LIVED
Airshow, Inc. 2002 $ 162 $ 108 $ 50 9 $ –Communication Solutions, Inc. 2002 24 14 5 8 –Kaiser Aerospace &
Electronics Corporation 2001 300 199 46 11 19Sony Trans Com Inc. 2000 117 57 26 6 –
Rockwell Collins 2002 Annual Report 47
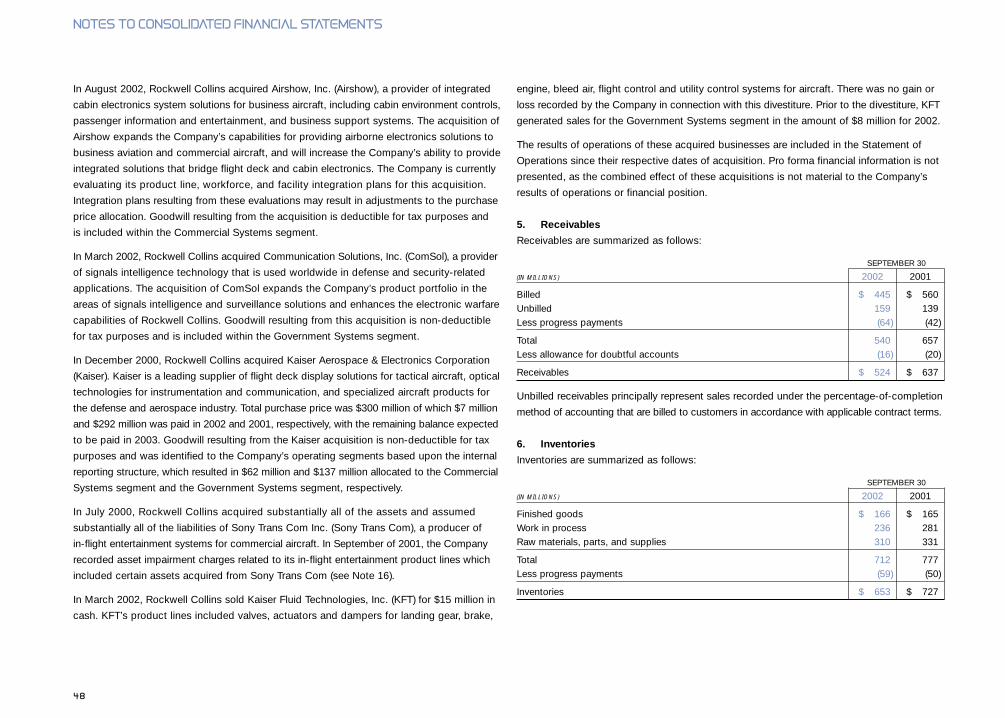
In August 2002, Rockwell Collins acquired Airshow, Inc. (Airshow), a provider of integrated
cabin electronics system solutions for business aircraft, including cabin environment controls,
passenger information and entertainment, and business support systems. The acquisition of
Airshow expands the Company’s capabilities for providing airborne electronics solutions to
business aviation and commercial aircraft, and will increase the Company’s ability to provide
integrated solutions that bridge flight deck and cabin electronics. The Company is currently
evaluating its product line, workforce, and facility integration plans for this acquisition.
Integration plans resulting from these evaluations may result in adjustments to the purchase
price allocation. Goodwill resulting from the acquisition is deductible for tax purposes and
is included within the Commercial Systems segment.
In March 2002, Rockwell Collins acquired Communication Solutions, Inc. (ComSol), a provider
of signals intelligence technology that is used worldwide in defense and security-related
applications. The acquisition of ComSol expands the Company’s product portfolio in the
areas of signals intelligence and surveillance solutions and enhances the electronic warfare
capabilities of Rockwell Collins. Goodwill resulting from this acquisition is non-deductible
for tax purposes and is included within the Government Systems segment.
In December 2000, Rockwell Collins acquired Kaiser Aerospace & Electronics Corporation
(Kaiser). Kaiser is a leading supplier of flight deck display solutions for tactical aircraft, optical
technologies for instrumentation and communication, and specialized aircraft products for
the defense and aerospace industry. Total purchase price was $300 million of which $7 million
and $292 million was paid in 2002 and 2001, respectively, with the remaining balance expected
to be paid in 2003. Goodwill resulting from the Kaiser acquisition is non-deductible for tax
purposes and was identified to the Company’s operating segments based upon the internal
reporting structure, which resulted in $62 million and $137 million allocated to the Commercial
Systems segment and the Government Systems segment, respectively.
In July 2000, Rockwell Collins acquired substantially all of the assets and assumed
substantially all of the liabilities of Sony Trans Com Inc. (Sony Trans Com), a producer of
in-flight entertainment systems for commercial aircraft. In September of 2001, the Company
recorded asset impairment charges related to its in-flight entertainment product lines which
included certain assets acquired from Sony Trans Com (see Note 16).
In March 2002, Rockwell Collins sold Kaiser Fluid Technologies, Inc. (KFT) for $15 million in
cash. KFT’s product lines included valves, actuators and dampers for landing gear, brake,
engine, bleed air, flight control and utility control systems for aircraft. There was no gain or
loss recorded by the Company in connection with this divestiture. Prior to the divestiture, KFT
generated sales for the Government Systems segment in the amount of $8 million for 2002.
The results of operations of these acquired businesses are included in the Statement of
Operations since their respective dates of acquisition. Pro forma financial information is not
presented, as the combined effect of these acquisitions is not material to the Company’s
results of operations or financial position.
5. Receivables
Receivables are summarized as follows:
SEPTEMBER 30
(IN MILLIONS) 2002 2001
Billed $ 445 $ 560Unbilled 159 139Less progress payments (64) (42)
Total 540 657Less allowance for doubtful accounts (16) (20)
Receivables $ 524 $ 637
Unbilled receivables principally represent sales recorded under the percentage-of-completion
method of accounting that are billed to customers in accordance with applicable contract terms.
6. Inventories
Inventories are summarized as follows:
SEPTEMBER 30
(IN MILLIONS) 2002 2001
Finished goods $ 166 $ 165Work in process 236 281Raw materials, parts, and supplies 310 331
Total 712 777Less progress payments (59) (50)
Inventories $ 653 $ 727
NOTES TO CONSOLIDATED FINANCIAL STATEMENTS
48

NOTES TO CONSOLIDATED FINANCIAL STATEMENTS
In accordance with industry practice, inventories include amounts which are not expected
to be realized within one year. These amounts primarily relate to life-time buy inventory,
which is inventory that is typically no longer being produced by the Company’s vendors but
for which multiple years of supply are purchased in order to meet production and service
requirements over the life span of a product. Life-time buy inventory was $86 million and
$66 million at September 30, 2002 and 2001, respectively.
7. Property
Property is summarized as follows:
SEPTEMBER 30
(IN MILLIONS) 2002 2001
Land $ 26 $ 27Buildings and improvements 214 208Machinery and equipment 531 503Information systems software and hardware 241 250Construction in progress 24 51
Total 1,036 1,039Less accumulated depreciation (625) (600)
Property $ 411 $ 439
8. Goodwill and Intangible Assets
The Company adopted SFAS 141 and SFAS 142 on October 1, 2001. SFAS 141 requires all
acquisitions to be accounted for under the purchase method and requires all assets acquired
and liabilities assumed to be assigned to a “reportable unit”. In addition, SFAS 141 further
clarifies the criteria to recognize identifiable intangible assets separately from goodwill.
SFAS 142 provides that goodwill and intangible assets with indefinite lives will no longer be
amortized, but reviewed at least annually for impairment.
In connection with the adoption of the new accounting standards, the Company reclassified
an intangible asset for assembled workforce with a carrying value of $18 million ($12 million
net of deferred taxes) to goodwill as assembled workforce does not meet the criteria for a
separately identifiable intangible asset. The Company also reviewed the remaining estimated
useful lives of all recorded intangible assets and determined that the trademarks and
tradenames related to the Kaiser acquisition are indefinite lived.
In addition, impairment tests on goodwill and indefinite lived intangible assets were performed
both on the adoption date of October 1, 2001 as well as on the Company’s annual testing date
in the second quarter of 2002. The impairment tests for goodwill were performed by comparing
the current fair values of the Company’s reportable units containing goodwill balances to their
carrying values. The impairment tests for indefinite lived intangible assets were performed by
comparing the fair values of these assets to their carrying values. Fair values were determined
by management utilizing generally accepted valuation techniques and with consideration of
advice from outside valuation experts. These tests yielded no impairments.
Pro forma financial information for the years ended September 30, 2001 and 2000, reflecting
adjustments relating to the adoption of SFAS 141 and SFAS 142, is presented in Note 23.
Changes in the carrying amount of goodwill for the years ended September 30, 2002 and
2001 are summarized as follows:
COMMERCIAL GOVERNMENT(IN MILLIONS) SYSTEMS SYSTEMS TOTAL
Balance at September 30, 2000 $ 55 $ – $ 55Sony Trans Com acquisition adjustments 50 – 50Kaiser acquisition 60 111 171Amortization expense (14) (4) (18)Goodwill impairment charge (Note 16) (74) – (74)
Balance at September 30, 2001 77 107 184
Assembled workforce reclass, net of deferred taxes of $6 million 3 9 12
Kaiser acquisition adjustments 1 17 18ComSol acquisition – 14 14Airshow acquisition 108 – 108KFT divestiture – (4) (4)
Balance at September 30, 2002 $ 189 $ 143 $ 332
Rockwell Collins 2002 Annual Report 49
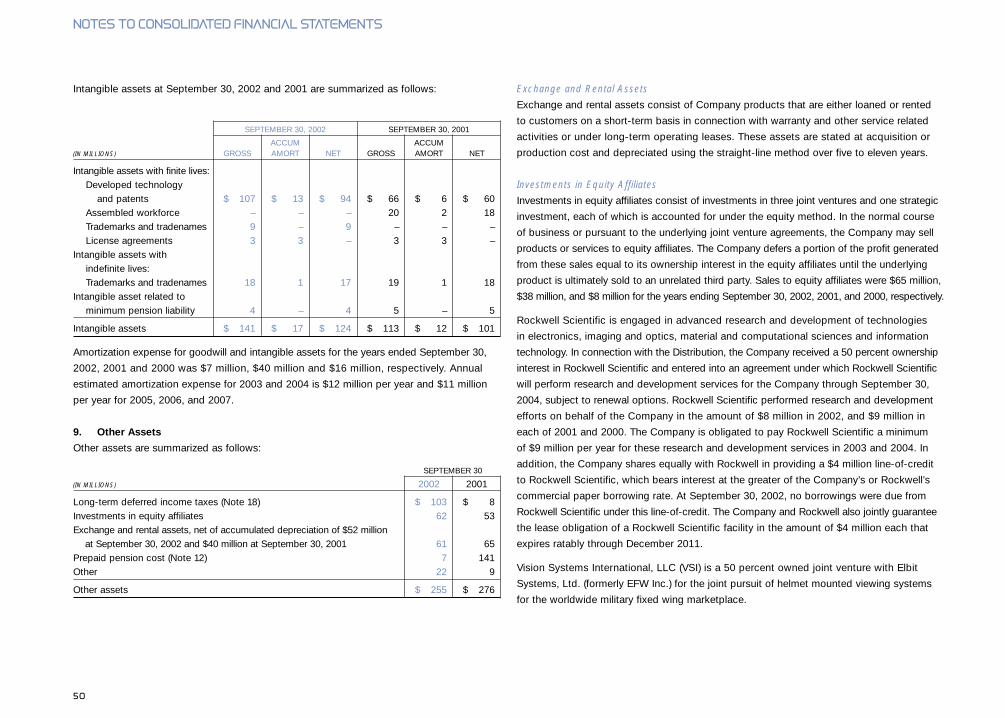
Intangible assets at September 30, 2002 and 2001 are summarized as follows:
SEPTEMBER 30, 2002 SEPTEMBER 30, 2001
ACCUM ACCUM(IN MILLIONS) GROSS AMORT NET GROSS AMORT NET
Intangible assets with finite lives:Developed technology
and patents $ 107 $ 13 $ 94 $ 66 $ 6 $ 60Assembled workforce – – – 20 2 18Trademarks and tradenames 9 – 9 – – –License agreements 3 3 – 3 3 –
Intangible assets with indefinite lives:Trademarks and tradenames 18 1 17 19 1 18
Intangible asset related to minimum pension liability 4 – 4 5 – 5
Intangible assets $ 141 $ 17 $ 124 $ 113 $ 12 $ 101
Amortization expense for goodwill and intangible assets for the years ended September 30,
2002, 2001 and 2000 was $7 million, $40 million and $16 million, respectively. Annual
estimated amortization expense for 2003 and 2004 is $12 million per year and $11 million
per year for 2005, 2006, and 2007.
9. Other Assets
Other assets are summarized as follows:
SEPTEMBER 30
(IN MILLIONS) 2002 2001
Long-term deferred income taxes (Note 18) $ 103 $ 8Investments in equity affiliates 62 53Exchange and rental assets, net of accumulated depreciation of $52 million
at September 30, 2002 and $40 million at September 30, 2001 61 65Prepaid pension cost (Note 12) 7 141Other 22 9
Other assets $ 255 $ 276
Exchange and Rental Assets
Exchange and rental assets consist of Company products that are either loaned or rented
to customers on a short-term basis in connection with warranty and other service related
activities or under long-term operating leases. These assets are stated at acquisition or
production cost and depreciated using the straight-line method over five to eleven years.
Investments in Equity Affiliates
Investments in equity affiliates consist of investments in three joint ventures and one strategic
investment, each of which is accounted for under the equity method. In the normal course
of business or pursuant to the underlying joint venture agreements, the Company may sell
products or services to equity affiliates. The Company defers a portion of the profit generated
from these sales equal to its ownership interest in the equity affiliates until the underlying
product is ultimately sold to an unrelated third party. Sales to equity affiliates were $65 million,
$38 million, and $8 million for the years ending September 30, 2002, 2001, and 2000, respectively.
Rockwell Scientific is engaged in advanced research and development of technologies
in electronics, imaging and optics, material and computational sciences and information
technology. In connection with the Distribution, the Company received a 50 percent ownership
interest in Rockwell Scientific and entered into an agreement under which Rockwell Scientific
will perform research and development services for the Company through September 30,
2004, subject to renewal options. Rockwell Scientific performed research and development
efforts on behalf of the Company in the amount of $8 million in 2002, and $9 million in
each of 2001 and 2000. The Company is obligated to pay Rockwell Scientific a minimum
of $9 million per year for these research and development services in 2003 and 2004. In
addition, the Company shares equally with Rockwell in providing a $4 million line-of-credit
to Rockwell Scientific, which bears interest at the greater of the Company’s or Rockwell’s
commercial paper borrowing rate. At September 30, 2002, no borrowings were due from
Rockwell Scientific under this line-of-credit. The Company and Rockwell also jointly guarantee
the lease obligation of a Rockwell Scientific facility in the amount of $4 million each that
expires ratably through December 2011.
Vision Systems International, LLC (VSI) is a 50 percent owned joint venture with Elbit
Systems, Ltd. (formerly EFW Inc.) for the joint pursuit of helmet mounted viewing systems
for the worldwide military fixed wing marketplace.
NOTES TO CONSOLIDATED FINANCIAL STATEMENTS
50

NOTES TO CONSOLIDATED FINANCIAL STATEMENTS
BAE Systems/Rockwell Collins Data Link Solutions, LLC (Data Links Solutions) is a 50 percent
owned joint venture with BAE Systems, pcl (formerly Marconi Electronic Systems) for the
joint pursuit of the worldwide military data link market.
In July 2002, Rockwell Collins made an investment in Tenzing Communications, Inc. (Tenzing),
a developer of next-generation passenger connectivity solutions for commercial aircraft.
The investment agreement with Tenzing included an initial $5 million investment by Rockwell
Collins in Tenzing with an additional $5 million investment expected in 2003, subject to certain
conditions. At September 30, 2002, the Company’s ownership interest in Tenzing was 9 percent,
with the potential to increase with the additional investment scheduled in 2003. The Company
accounts for its investment in Tenzing using the equity method as it has the ability to exercise
significant influence over the operating and financial policies of Tenzing.
Under the equity method of accounting for investments, Rockwell Collins’ proportionate
share of the earnings or losses of its equity affiliates are included in net income and classified
as Other Income in the Statement of Operations. For segment performance reporting purposes,
Rockwell Collins’ share of earnings or losses of Tenzing are included in the operating results
of the Commercial Systems operating segment while Rockwell Collins’ share of earnings or
losses of VSI and Data Links Solutions are included in the operating results of the Government
Systems operating segment. Rockwell Scientific is considered a corporate-level investment.
10. Debt
The Company has $1 billion of senior unsecured revolving credit facilities with various banks
consisting of a five-year $500 million facility expiring in May of 2006, and a 364-day $500
million facility expiring on May 28, 2003. These credit facilities primarily support the Company’s
commercial paper program, but may be used for other corporate purposes in the event
access to the commercial paper market is impaired or eliminated. These credit facilities
contain customary representations and warranties and events of default for facilities of this
type. These credit facilities include one financial covenant requiring the Company to maintain
a consolidated debt to total capitalization ratio of not greater than 60 percent. Borrowings
under these credit facilities bear interest at the London Interbank Offered Rate (LIBOR)
plus a variable margin based on the Company’s unsecured long-term debt rating or, at the
Company’s option, rates determined by competitive bid. In addition, short-term credit facilities
available to foreign subsidiaries amounted to $30 million as of September 30, 2002. There
were no significant commitment fees or compensating balance requirements under these
facilities. At September 30, 2002, there were no borrowings outstanding under any of the
Company’s credit facilities.
Under the Company’s commercial paper program, the Company may sell up to $1 billion
face amount of unsecured short-term promissory notes in the commercial paper market.
The commercial paper notes may bear interest or may be sold at a discount, and will have a
maturity of not more than 364 days from the time of issuance. Commercial paper borrowings
outstanding were $132 million and $202 million at September 30, 2002 and 2001, respectively.
The weighted average interest rate and maturity period of the commercial paper outstanding
at September 30, 2002 was 1.8 percent and 16 days, respectively, compared with 3.5 percent
and 44 days at September 30, 2001.
In addition to the credit facilities and commercial paper program, the Company has a shelf
registration statement covering up to $750 million in debt securities, common stock, preferred
stock or warrants that may be offered in one or more offerings on terms to be determined
at the time of sale. Net proceeds of any offering will be used for general corporate purposes,
with possible uses including repayment of existing indebtedness, capital expenditures,
acquisitions and share repurchases.
As of September 30, 2002, the Company had outstanding letters of credit totaling $92 million
issued by banks to support certain contractual obligations to customers. Failure to meet these
contractual obligations may cause these letters of credit to become a liability of the Company.
Interest paid for the years ended September 30, 2002, 2001 and 2000 was $6 million, $2 million
and $0 million, respectively.
11. Other Current Liabilities
Other current liabilities are summarized as follows:
SEPTEMBER 30
(IN MILLIONS) 2002 2001
Customer incentives $ 92 $ 101Advance payments from customers 86 66Contract reserves 75 86Other 74 70
Other current liabilities $ 327 $ 323
Rockwell Collins 2002 Annual Report 51

12. Retirement Benefits
The Company sponsors defined benefit pension (Pension Benefits) and other postretirement
(Other Retirement Benefits) plans covering substantially all of its U.S. employees and certain
employees in foreign countries which provide monthly pension and other benefits to eligible
employees upon retirement. In addition, the Company assumed assets and obligations for
Pension Benefits and Other Retirement Benefits in connection with the Distribution related
to certain former Rockwell employees (Non-Rockwell Collins Participants). The accumulated
benefit obligation associated with Non-Rockwell Collins Participants that was assumed by
the Company as of June 29, 2001 in connection with the Distribution was $628 million for
Pension Benefits and $99 million for Other Retirement Benefits. The Company also sponsors
a defined contribution savings plan.
The components of the Company’s expense (income) for Pension Benefits and Other Retirement
Benefits, excluding pro forma adjustments in 2001 and 2000 for assets and liabilities assumed in
connection with the Distribution (Note 23), are summarized as follows:
PENSION BENEFITS OTHER RETIREMENT BENEFITS
(IN MILLIONS) 2002 2001 2000 2002 2001 2000
Service cost $ 38 $ 32 $ 29 $ 5 $ 4 $ 4Interest cost 132 113 96 24 16 14Expected return on plan assets (168) (154) (121) (2) (2) (1)Amortization:
Prior service cost 2 4 4 (18) (13) (9)Net transition asset – – (3) – – –Net actuarial loss 2 – – 10 2 1
Net periodic benefit expense (income) $ 6 $ (5) $ 5 $ 19 $ 7 $ 9
The Company also recognized a curtailment gain of $14 million during the year ended
September 30, 2002 in connection with workforce reductions resulting from the Company’s
2001 comprehensive restructuring plan.
The following table reconciles the benefit obligations, plan assets, funded status, and net asset
(liability) information of the Company’s Pension Benefits and the Other Retirement Benefits:
OTHER PENSION BENEFITS RETIREMENT BENEFITS
(IN MILLIONS) 2002 2001 2002 2001
Benefit obligation at beginning of year $ 1,809 $ 1,499 $ 340 $ 272Service cost 38 32 5 4Interest cost 132 113 24 16Discount rate change 123 105 19 19Actuarial losses 49 42 147 53Acquisitions – 112 – 13Curtailments – (26) 4 –Benefits paid (91) (79) (41) (41)Other (including currency translation) 2 11 (1) 4
Benefit obligation at end of year 2,062 1,809 497 340
Plan assets at beginning of year 1,723 1,704 16 18Actual return on plan assets (100) (51) – (1)Company contributions 46 7 40 39Acquisitions – 142 – –Benefits paid (91) (79) (41) (41)Other (including currency translation) 2 – – 1
Plan assets at end of year 1,580 1,723 15 16
Funded status of plans (482) (86) (482) (324)
Unamortized amounts:Prior service cost 4 5 (101) (138)Net actuarial loss 605 168 318 162
Net asset (liability) in the Statement of Financial Position $ 127 $ 87 $ (265) $ (300)
Net asset (liability) consists of:Prepaid benefit cost $ 7 $ 141 $ – $ –Accrued benefit liability (265) (76) (265) (300)Deferred tax asset 141 6 – –Intangible asset 4 5 – –Accumulated other comprehensive loss 240 11 – –
Net asset (liability) in the Statement of Financial Position $ 127 $ 87 $ (265) $ (300)
NOTES TO CONSOLIDATED FINANCIAL STATEMENTS
52

NOTES TO CONSOLIDATED FINANCIAL STATEMENTS
Plan assets and obligations are measured on an annual basis using a measurement date of
June 30 each year. Significant assumptions used in determining these benefit obligations
are summarized as follows:
OTHER PENSION BENEFITS RETIREMENT BENEFITS
2002 2001 2002 2001
Discount rate 7.00% 7.50% 7.00% 7.50%Compensation increase rate 4.50% 4.50% – –Pre-65 health care cost trend rate* – – 7.80% 8.00%Post-65 health care cost trend rate* – – 9.30% 9.60%
* Decreasing gradually to 5.5 percent after 2016
The Company lowered its expected rate of return on plan assets in 2002 to 9.00 percent
from 9.75 percent in 2001 based upon the current investment mix and market outlook. This
adjustment reduced the expected return on plan assets in 2002 for Pension Benefits by
$14 million and had a minimal effect on Other Retirement Benefits.
Actuarial gains and losses in excess of 10 percent of the greater of the benefit obligation or
market-related value of assets are amortized on a straight-line basis over the average remaining
service period of active participants. Prior service costs resulting from plan amendments are
amortized over the average remaining service period of affected active participants or over
the remaining life expectancy of affected retired participants. The Company uses a five-year,
market-related value asset method of amortizing the difference between actual and expected
returns on plan assets.
Pension Benefits
The Company provides pension benefits to substantially all of its U.S. employees in the form
of non-contributory, defined benefit plans that are considered qualified plans under applicable
laws. The benefits provided under these plans for salaried employees are generally based on
years of service and average compensation. The benefits provided under these plans for
hourly employees are generally based on specified benefit amounts and years of service.
Pension Benefits are funded through a trust in conformity with the funding requirements of
applicable laws and governmental regulations plus any additional amounts that the Company
may consider to be appropriate. In addition, the Company sponsors an unfunded non-qualified
defined benefit plan for certain employees. The Company also maintains two pension plans
in foreign countries, one of which is unfunded.
The Company recorded a minimum pension liability of $265 million for underfunded plans as
of September 30, 2002. This liability represents the amount by which the accumulated benefit
obligation exceeds the fair market value of plan assets for those plans that are underfunded,
offset by an intangible asset of $4 million to the extent of previously unrecognized prior
service cost. The projected benefit obligation, accumulated benefit obligation and the fair value
of plan assets for underfunded plans were $2,056 million, $1,836 million, and $1,571 million,
respectively, as of September 30, 2002, and $104 million, $93 million, and $17 million,
respectively, as of September 30, 2001.
In addition to annual contributions for certain non-qualified and foreign pension plans, the
Company made a tax-deductible cash contribution to its qualified domestic pension plan
of $38 million during the first quarter of 2002 in order to satisfy certain U.S. Government
requirements resulting from the Distribution.
Other Retirement Benefits
The Company provides Other Retirement Benefits primarily in the form of health care and
life insurance benefits to substantially all of its domestic employees and covered dependents.
Employees generally become eligible to receive these benefits if they retire after age 55 with
at least 10 years of service. Most plans are contributory with retiree contributions generally
based upon years of service and adjusted annually by the Company. These plans pay a stated
percentage of expenses reduced by deductibles and other coverage, principally Medicare.
The Company generally funds all the plans to pay covered expenses as costs are incurred.
In the fourth quarter of 2002 and in addition to other plan design changes, the retiree health
care plans were amended to establish a fixed contribution by the Company equal to its portion
of estimated per capita health care costs in calendar year 2003. Additional contributions
will be required from participants for all costs in excess of the Company’s fixed contribution
amount. In addition to the normal annual measurement at June 30, 2002, the Company
remeasured its obligation for Other Retirement Benefits at July 31, 2002 to reflect the effects
of this plan amendment and other plan design changes. The actuarial assumptions used in
performing this remeasurement were the same as those assumptions used at June 30, 2002
except for the health care cost trend rate which was assumed to be zero percent after 2003
as a direct result of the plan amendment. The effect of the remeasurement was to reduce
the benefit plan obligation by $121 million.
Rockwell Collins 2002 Annual Report 53
As a result of the workforce reductions associated with the Company’s 2001 comprehensive
restructuring plan (Note 16), the Company remeasured its liability for Other Retirement
Benefits at November 30, 2001 and recorded a curtailment gain of $14 million during 2002 as
the workforce reductions were completed. The curtailment gain resulted from the accelerated
recognition of a deferred gain related to previous plan amendments. The actuarial assumptions
used in performing this remeasurement were the same as those assumptions used at
the June 30, 2001 measurement date except for the discount rate which was reduced to
7.0 percent.
The actuarial assumption concerning assumed health care cost trend rates has a significant
effect on amounts reported for Other Retirement Benefits. Increasing the rate by one percentage
point would increase the benefit obligation as of September 30, 2002 by $32 million and
increase the total of service and interest cost components of net periodic benefit expense
for Other Retirement Benefits for 2002 by $3 million. Conversely, decreasing the rate by
one percentage point would decrease the benefit obligation as of September 30, 2002 by
$26 million and decrease the total of service and interest cost components of net periodic
benefit expense for Other Retirement Benefits for 2002 by $2 million.
Defined Contribution Savings Plans
The majority of employees participate in Company-sponsored defined contribution savings
plans. The plans allow employees to contribute a portion of their compensation on a pre-
tax and/or after-tax basis in accordance with specified guidelines. The Company matches
a percentage of employee contributions in Company common stock up to certain limits.
Employees may transfer at any time all or a portion of their balance in Company common
stock to any of the alternative investment options offered within the plan. The Company’s
expense related to these savings plans was $30 million, $29 million and $23 million for 2002,
2001, and 2000, respectively.
13. Shareowners’ Equity
Common Stock
The Company is authorized to issue one billion shares of common stock, par value $0.01 per
share, and 25 million shares of preferred stock, without par value, of which 2.5 million shares
are designated as Series A Junior Participating Preferred Stock for issuance in connection
with the exercise of preferred share purchase rights. At September 30, 2002, 17.7 million
shares of common stock were reserved for issuance under various employee incentive plans.
Preferred Share Purchase Rights
Each outstanding share of common stock provides the holder with one Preferred Share
Purchase Right (Right). The Rights will become exercisable only if a person or group acquires,
or offers to acquire, without prior approval of the Board of Directors, 15 percent or more of
the Company’s common stock. However, the Board of Directors is authorized to reduce the
15 percent threshold for triggering the Rights to not less than 10 percent. Upon exercise,
each Right entitles the holder to 1/100th of a share of Series A Junior Participating Preferred
Stock of the Company (Junior Preferred Stock) at a price of $125, subject to adjustment.
Upon acquisition of the Company, each Right (other than Rights held by the acquirer) will
generally be exercisable for $250 worth of either common stock of the Company or common
stock of the acquirer for $125. In certain circumstances, each Right may be exchanged
by the Company for one share of common stock or 1/100th of a share of Junior Preferred
Stock. The Rights will expire on June 30, 2011, unless earlier exchanged or redeemed at
$0.01 per Right. The rights have the effect of substantially increasing the cost of acquiring
the Company in a transaction not approved by the Board of Directors.
Treasury Stock
In December 2001, the Board of Directors approved a resolution authorizing the repurchase
of up to $200 million of the Company’s issued and outstanding common stock (Share
Repurchase Program). During 2002, the Company repurchased 4.5 million shares of common
stock into treasury for $102 million. At September 30, 2002, the Company was authorized
to repurchase an additional $98 million of outstanding common stock under the Share
Repurchase Program.
NOTES TO CONSOLIDATED FINANCIAL STATEMENTS
54

NOTES TO CONSOLIDATED FINANCIAL STATEMENTS
Accumulated Other Comprehensive Loss
Accumulated other comprehensive loss consisted of the following:
SEPTEMBER 30
(IN MILLIONS) 2002 2001
Foreign currency translation adjustments $ (12) $ (17)Minimum pension liability adjustment, net of taxes of $141 million for 2002
and $6 million for 2001 (240) (11)
Accumulated other comprehensive loss $ (252) $ (28)
14. Stock Based Compensation
Stock Options
Options to purchase common stock of the Company have been granted under various
incentive plans to directors, officers and other key employees. All of the Company’s stock-
based incentive plans require options to be granted at prices equal to or above the fair market
value of the common stock on the dates the options are granted. The plans provide that
the option price for certain options granted under the plans may be paid in cash, shares
of common stock utilizing a third-party broker arrangement or a combination thereof. Stock
options generally expire ten years from the date they are granted and vest over three years.
Under the Company’s 2001 Long-Term Incentives Plan and Directors Stock Plan, up to
14.3 million shares of common stock may be issued by the Company as non-qualified
options, incentive stock options, performance units, stock appreciation rights, and restricted
stock. Shares available for future grant or payment under these plans were 9.4 million at
September 30, 2002. Neither of these plans permits options to be granted after June 29,
2011. In connection with the Distribution, the Board of Directors approved the 2001 Stock
Option Plan under which options to purchase 12.9 million shares of the Company’s common
stock were issued upon the conversion of Rockwell options. No further stock options may
be granted under the 2001 Stock Option Plan.
In periods prior to the Distribution, certain employees of the Company were granted options
to purchase common stock under Rockwell’s various stock-based compensation plans. At
the time of the Distribution, Rockwell options held by employees of the Company, as well as
certain other current and former employees of Rockwell, were converted either in whole or
in part to options to purchase common stock of the Company based on a formula designed
to preserve the intrinsic value of the options. The Rockwell Collins stock options issued, as
converted, have the same vesting provisions, option periods, and other terms and conditions
as the Rockwell options and awards they replaced and are substantially similar to options
issued under the Company’s current incentive plans, except certain options have different
vesting provisions. Approximately 2.0 million of these options are performance-vesting options
that vest at the earlier of (a) the date the market price of the Company’s common stock reaches
a specified level for a pre-determined period of time or certain other financial performance
criteria are met, or (b) a period of six to nine years from the date they are granted.
The following summarizes the activity of the Company’s stock options for 2002 and 2001:
2002 2001WEIGHTED WEIGHTEDAVERAGE AVERAGEEXERCISE EXERCISE
(SHARES IN THOUSANDS) SHARES PRICE SHARES PRICE
Number of shares under option:Outstanding at beginning of year 15,787 $ 22.14 – $ –
Converted in connection with the Distribution:Time-vesting – – 10,929 21.89Performance-vesting – – 2,010 23.09
Granted 1,997 20.88 2,990 22.35Exercised (1,142) 15.00 (52) 14.29Canceled or expired (356) 26.33 (90) 25.76
Outstanding at end of year 16,286 22.37 15,787 22.14
Exercisable at end of year 9,952 21.91 9,157 20.63
Rockwell Collins 2002 Annual Report 55

The following table summarizes the status of the Company’s stock options outstanding at
September 30, 2002:
OPTIONS OUTSTANDING OPTIONS EXERCISABLE
WEIGHTEDWEIGHTED AVERAGE AVERAGE
REMAINING EXERCISE EXERCISE(SHARE IN THOUSANDS; REMAINING LIFE IN YEARS) SHARES LIFE PRICE SHARES PRICE
Range of exercise prices:$12.71 to $16.97 3,224 3.6 $ 15.86 3,186 $ 15.86$16.98 to $22.08 5,823 7.4 20.14 2,660 20.28$22.09 to $27.41 3,743 7.8 23.01 1,816 23.63$27.42 to $37.78 3,496 5.8 31.41 2,290 30.84
Total 16,286 6.4 22.37 9,952 21.91
For 2002, dilutive stock options outstanding resulted in an increase in average outstanding
shares of 1.0 million.
Employee Stock Purchase Plan
The Company offers an Employee Stock Purchase Plan (ESPP) which allows employees
to have withheld up to 15 percent of their base compensation toward the purchase of the
Company’s stock. Under the ESPP, shares of the Company’s common stock may be purchased
at six-month intervals at 85 percent of the lower of the fair market value on the first or the
last day of the offering period. There are two offering periods during the year, each lasting
six months, beginning on December 1 and June 1. The Company is authorized to issue
9.0 million shares under the ESPP, of which 8.3 million shares are available for future grant
at September 30, 2002. During 2002, approximately 0.7 million shares were issued under
this plan for aggregate consideration of $10 million. This transaction was treated as a non-
cash transaction and not reflected in the Statement of Cash Flows.
SFAS 123 Pro Forma Disclosures
The Company accounts for stock-based compensation in accordance with APB 25. Accordingly,
no compensation expense has been recognized for either stock options granted to employees
or common shares issued in connection with the ESPP. If the Company accounted for its
stock-based compensation plans using the fair value method provided by SFAS No. 123,
Accounting for Stock Based Compensation, net income and earnings per share in 2002
would have been reduced by approximately $18 million or ten cents per share, respectively,
which includes a reduction to net income of $3 million or two cents per share, respectively,
for the ESPP. In 2001, pro forma net income and pro forma earnings per share (Note 23) would
have been reduced by approximately $14 million and seven cents per share, respectively.
The fair values of converted Rockwell options in 2001 were calculated using the Black-Scholes
pricing model as determined by Rockwell, adjusted for the previously described conversion.
The weighted average fair value of these options, as converted, was $8.73 per option. The
weighted average fair value of options granted by the Company after the Distribution was
$6.69 and $7.27 per option in 2002 and 2001, respectively. The fair value of each option
granted by the Company was estimated using the Black-Scholes pricing model and the
following weighted average assumptions:
2002 2001GRANTS GRANTS
Risk-free interest rate 3.61% 5.32%Expected dividend yield 1.73% 1.77%Expected volatility 0.40 0.35Expected life 6 years 5 years
15. Research and Development
The Company performs research and development for its products and under contracts
with customers. Research and development under contracts with customers is generally
performed by the Government Systems business. Total Company-initiated research and
development expenditures in 2002, 2001, and 2000 were $253 million, $295 million and
$265 million, respectively, and are recorded in Cost of Sales. Total customer-funded research
and development expenditures were $231 million, $217 million, and $203 million in 2002,
2001, and 2000, respectively.
Customer-funded research and development is generally performed under long-term fixed
price contracts with the U.S. Government and includes activities relating to the development
of new products and the improvement of existing products. These contracts generally require
the production of initial prototype units or limited production quantities to the government’s
specifications. The Company accounts for such contracts under the percentage-of-completion
method of accounting using the cost-to-cost method.
NOTES TO CONSOLIDATED FINANCIAL STATEMENTS
56
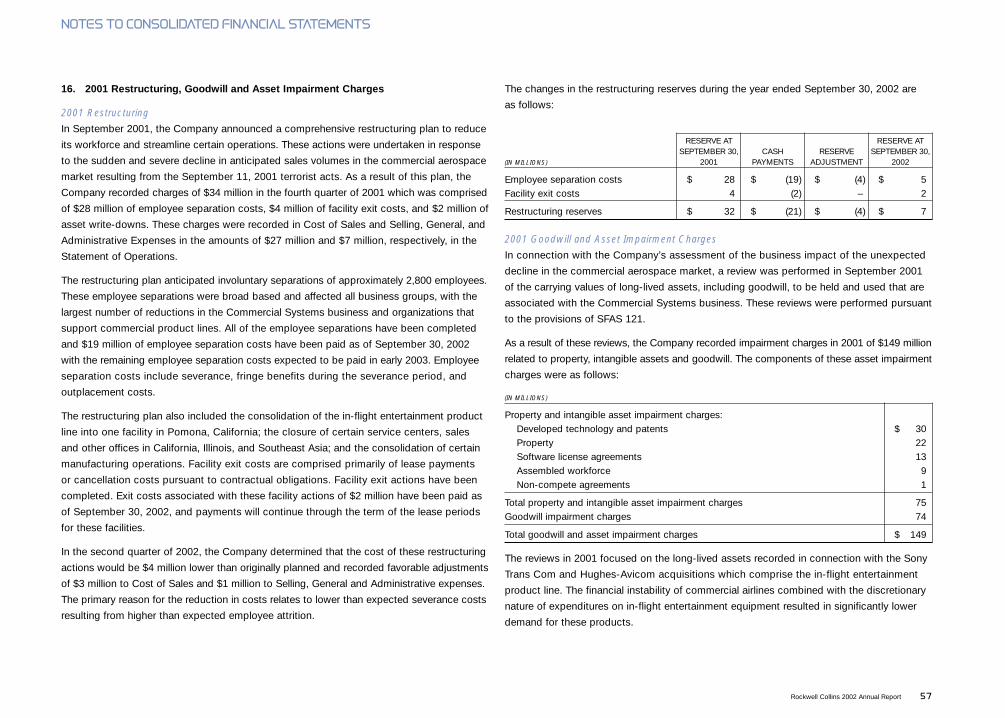
NOTES TO CONSOLIDATED FINANCIAL STATEMENTS
16. 2001 Restructuring, Goodwill and Asset Impairment Charges
2001 Restructuring
In September 2001, the Company announced a comprehensive restructuring plan to reduce
its workforce and streamline certain operations. These actions were undertaken in response
to the sudden and severe decline in anticipated sales volumes in the commercial aerospace
market resulting from the September 11, 2001 terrorist acts. As a result of this plan, the
Company recorded charges of $34 million in the fourth quarter of 2001 which was comprised
of $28 million of employee separation costs, $4 million of facility exit costs, and $2 million of
asset write-downs. These charges were recorded in Cost of Sales and Selling, General, and
Administrative Expenses in the amounts of $27 million and $7 million, respectively, in the
Statement of Operations.
The restructuring plan anticipated involuntary separations of approximately 2,800 employees.
These employee separations were broad based and affected all business groups, with the
largest number of reductions in the Commercial Systems business and organizations that
support commercial product lines. All of the employee separations have been completed
and $19 million of employee separation costs have been paid as of September 30, 2002
with the remaining employee separation costs expected to be paid in early 2003. Employee
separation costs include severance, fringe benefits during the severance period, and
outplacement costs.
The restructuring plan also included the consolidation of the in-flight entertainment product
line into one facility in Pomona, California; the closure of certain service centers, sales
and other offices in California, Illinois, and Southeast Asia; and the consolidation of certain
manufacturing operations. Facility exit costs are comprised primarily of lease payments
or cancellation costs pursuant to contractual obligations. Facility exit actions have been
completed. Exit costs associated with these facility actions of $2 million have been paid as
of September 30, 2002, and payments will continue through the term of the lease periods
for these facilities.
In the second quarter of 2002, the Company determined that the cost of these restructuring
actions would be $4 million lower than originally planned and recorded favorable adjustments
of $3 million to Cost of Sales and $1 million to Selling, General and Administrative expenses.
The primary reason for the reduction in costs relates to lower than expected severance costs
resulting from higher than expected employee attrition.
The changes in the restructuring reserves during the year ended September 30, 2002 are
as follows:
RESERVE AT RESERVE ATSEPTEMBER 30, CASH RESERVE SEPTEMBER 30,
(IN MILLIONS) 2001 PAYMENTS ADJUSTMENT 2002
Employee separation costs $ 28 $ (19) $ (4) $ 5Facility exit costs 4 (2) – 2
Restructuring reserves $ 32 $ (21) $ (4) $ 7
2001 Goodwill and Asset Impairment Charges
In connection with the Company’s assessment of the business impact of the unexpected
decline in the commercial aerospace market, a review was performed in September 2001
of the carrying values of long-lived assets, including goodwill, to be held and used that are
associated with the Commercial Systems business. These reviews were performed pursuant
to the provisions of SFAS 121.
As a result of these reviews, the Company recorded impairment charges in 2001 of $149 million
related to property, intangible assets and goodwill. The components of these asset impairment
charges were as follows:
(IN MILLIONS)
Property and intangible asset impairment charges:Developed technology and patents $ 30Property 22Software license agreements 13Assembled workforce 9Non-compete agreements 1
Total property and intangible asset impairment charges 75Goodwill impairment charges 74
Total goodwill and asset impairment charges $ 149
The reviews in 2001 focused on the long-lived assets recorded in connection with the Sony
Trans Com and Hughes-Avicom acquisitions which comprise the in-flight entertainment
product line. The financial instability of commercial airlines combined with the discretionary
nature of expenditures on in-flight entertainment equipment resulted in significantly lower
demand for these products.
Rockwell Collins 2002 Annual Report 57
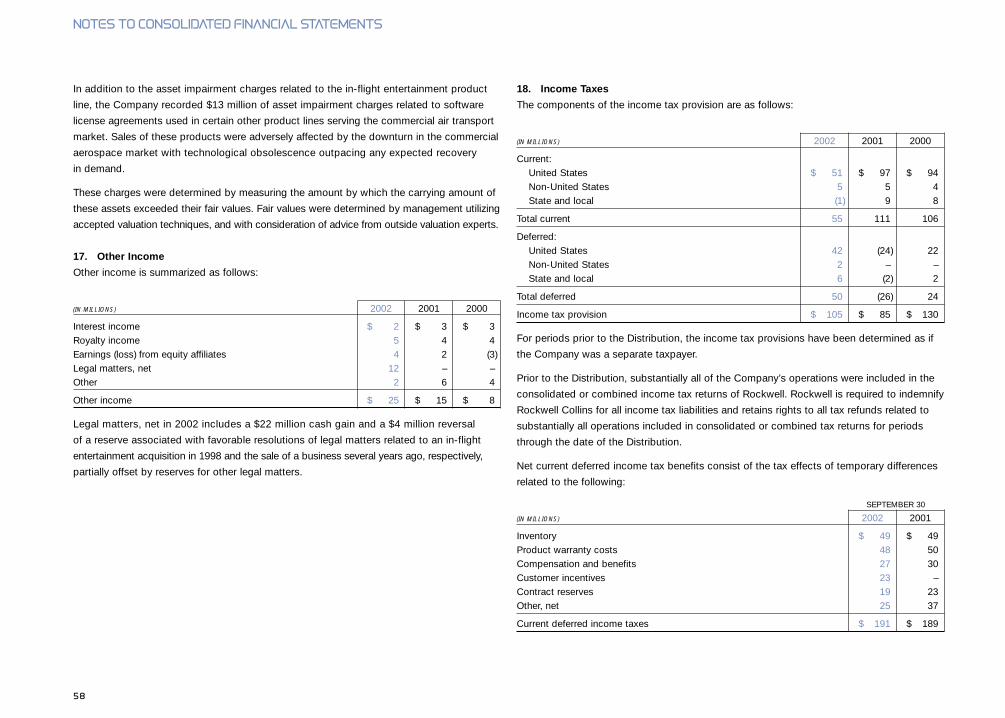
In addition to the asset impairment charges related to the in-flight entertainment product
line, the Company recorded $13 million of asset impairment charges related to software
license agreements used in certain other product lines serving the commercial air transport
market. Sales of these products were adversely affected by the downturn in the commercial
aerospace market with technological obsolescence outpacing any expected recovery
in demand.
These charges were determined by measuring the amount by which the carrying amount of
these assets exceeded their fair values. Fair values were determined by management utilizing
accepted valuation techniques, and with consideration of advice from outside valuation experts.
17. Other Income
Other income is summarized as follows:
(IN MILLIONS) 2002 2001 2000
Interest income $ 2 $ 3 $ 3Royalty income 5 4 4Earnings (loss) from equity affiliates 4 2 (3)Legal matters, net 12 – –Other 2 6 4
Other income $ 25 $ 15 $ 8
Legal matters, net in 2002 includes a $22 million cash gain and a $4 million reversal
of a reserve associated with favorable resolutions of legal matters related to an in-flight
entertainment acquisition in 1998 and the sale of a business several years ago, respectively,
partially offset by reserves for other legal matters.
18. Income Taxes
The components of the income tax provision are as follows:
(IN MILLIONS) 2002 2001 2000
Current:United States $ 51 $ 97 $ 94Non-United States 5 5 4State and local (1) 9 8
Total current 55 111 106
Deferred:United States 42 (24) 22Non-United States 2 – –State and local 6 (2) 2
Total deferred 50 (26) 24
Income tax provision $ 105 $ 85 $ 130
For periods prior to the Distribution, the income tax provisions have been determined as if
the Company was a separate taxpayer.
Prior to the Distribution, substantially all of the Company’s operations were included in the
consolidated or combined income tax returns of Rockwell. Rockwell is required to indemnify
Rockwell Collins for all income tax liabilities and retains rights to all tax refunds related to
substantially all operations included in consolidated or combined tax returns for periods
through the date of the Distribution.
Net current deferred income tax benefits consist of the tax effects of temporary differences
related to the following:
SEPTEMBER 30
(IN MILLIONS) 2002 2001
Inventory $ 49 $ 49Product warranty costs 48 50Compensation and benefits 27 30Customer incentives 23 –Contract reserves 19 23Other, net 25 37
Current deferred income taxes $ 191 $ 189
NOTES TO CONSOLIDATED FINANCIAL STATEMENTS
58
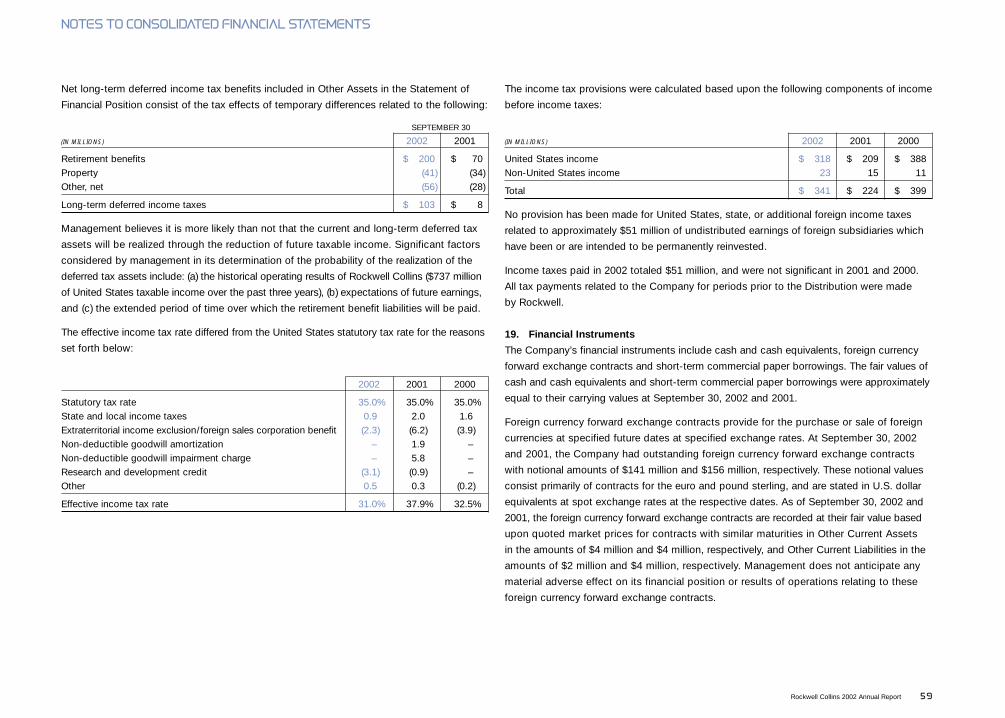
NOTES TO CONSOLIDATED FINANCIAL STATEMENTS
Net long-term deferred income tax benefits included in Other Assets in the Statement of
Financial Position consist of the tax effects of temporary differences related to the following:
SEPTEMBER 30
(IN MILLIONS) 2002 2001
Retirement benefits $ 200 $ 70Property (41) (34)Other, net (56) (28)
Long-term deferred income taxes $ 103 $ 8
Management believes it is more likely than not that the current and long-term deferred tax
assets will be realized through the reduction of future taxable income. Significant factors
considered by management in its determination of the probability of the realization of the
deferred tax assets include: (a) the historical operating results of Rockwell Collins ($737 million
of United States taxable income over the past three years), (b) expectations of future earnings,
and (c) the extended period of time over which the retirement benefit liabilities will be paid.
The effective income tax rate differed from the United States statutory tax rate for the reasons
set forth below:
2002 2001 2000
Statutory tax rate 35.0% 35.0% 35.0%State and local income taxes 0.9 2.0 1.6Extraterritorial income exclusion/foreign sales corporation benefit (2.3) (6.2) (3.9)Non-deductible goodwill amortization – 1.9 –Non-deductible goodwill impairment charge – 5.8 –Research and development credit (3.1) (0.9) –Other 0.5 0.3 (0.2)
Effective income tax rate 31.0% 37.9% 32.5%
The income tax provisions were calculated based upon the following components of income
before income taxes:
(IN MILLIONS) 2002 2001 2000
United States income $ 318 $ 209 $ 388Non-United States income 23 15 11
Total $ 341 $ 224 $ 399
No provision has been made for United States, state, or additional foreign income taxes
related to approximately $51 million of undistributed earnings of foreign subsidiaries which
have been or are intended to be permanently reinvested.
Income taxes paid in 2002 totaled $51 million, and were not significant in 2001 and 2000.
All tax payments related to the Company for periods prior to the Distribution were made
by Rockwell.
19. Financial Instruments
The Company’s financial instruments include cash and cash equivalents, foreign currency
forward exchange contracts and short-term commercial paper borrowings. The fair values of
cash and cash equivalents and short-term commercial paper borrowings were approximately
equal to their carrying values at September 30, 2002 and 2001.
Foreign currency forward exchange contracts provide for the purchase or sale of foreign
currencies at specified future dates at specified exchange rates. At September 30, 2002
and 2001, the Company had outstanding foreign currency forward exchange contracts
with notional amounts of $141 million and $156 million, respectively. These notional values
consist primarily of contracts for the euro and pound sterling, and are stated in U.S. dollar
equivalents at spot exchange rates at the respective dates. As of September 30, 2002 and
2001, the foreign currency forward exchange contracts are recorded at their fair value based
upon quoted market prices for contracts with similar maturities in Other Current Assets
in the amounts of $4 million and $4 million, respectively, and Other Current Liabilities in the
amounts of $2 million and $4 million, respectively. Management does not anticipate any
material adverse effect on its financial position or results of operations relating to these
foreign currency forward exchange contracts.
Rockwell Collins 2002 Annual Report 59
20. Lease Commitments
The Company leases certain office and manufacturing facilities as well as certain machinery
and equipment under various non-cancelable operating lease commitments. Some leases
include renewal options, which permit extensions of the expiration dates at rates approximating
fair market rental rates.
Minimum future rental commitments under operating leases having non-cancelable lease
terms in excess of one year aggregated $51 million at September 30, 2002 and are payable
as follows: 2003, $17 million; 2004, $14 million; 2005, $12 million; 2006, $3 million; 2007,
$2 million; and after 2007, $3 million.
Rent expense for the years ended September 30, 2002, 2001, and 2000 was $24 million,
$22 million, and $18 million, respectively.
21. Contingent Liabilities
Pursuant to the terms of the distribution agreement entered into among Rockwell, the
Company and Rockwell Scientific, the Company assumed responsibility for all current and
future litigation, including environmental proceedings, against Rockwell or its subsidiaries
with respect to the operations of the Company’s business.
Litigation
On January 15, 1997, a civil action was filed against the Company in the United States District
Court for the District of Arizona in Tucson, Universal Avionics Systems Corp. v. Rockwell
International Corp. and Rockwell Collins, Inc., in which Universal, a manufacturer and marketer
of aviation electronics, including Flight Management Systems (FMS), asserted four claims
against the Company arising out of its participation in the FMS business: (1) attempted
monopolization under Section 2 of the Sherman Act; (2) anticompetitive conduct (exclusive
dealing and tying) under Section 1 of the Sherman Act and Section 3 of the Clayton Act;
(3) tortious interference with business relationships and prospective economic business
advantage under the common law of Arizona; and (4) unfair competition under the common
law of Arizona. Universal seeks damages of approximately $35 million before trebling for the
alleged antitrust violations; actual damages of an unspecified amount for the alleged common
law violations; punitive damages; attorneys’ fees and injunctive relief. The Company and
Rockwell have denied the allegations and have asserted counterclaims against Universal for
defamation and unfair competition. On July 17, 2001, the district court granted defendants’
motion for partial summary judgment for failure to allege a relevant market entitling plaintiff
to relief, certified that ruling for appeal, dismissed as moot other motions for summary judgment
filed by defendants challenging plaintiff’s attempted monopolization, exclusive dealing and
tying, and stayed further proceedings, including rulings on motions for summary judgment
filed by defendants as to plaintiff’s other claims, pending appeal. On July 19, 2001, plaintiff
filed a notice of appeal with the Ninth Circuit Court of Appeals. The parties have submitted
written briefs to the appellate court.
On April 3, 2000, a civil action was filed against the Company in the Court of Common
Pleas of Pennsylvania for Allegheny County, Westinghouse Air Brake Technologies Corp. v.
Rockwell Collins, Inc., asserting various claims arising out of the plaintiff’s purchase of the
Company’s former Railroad Electronics Business pursuant to a sale agreement on October 5,
1998. Specifically, the plaintiff alleged that it was entitled under provisions of the sale agreement
to a post-closing adjustment of approximately $7 million in the purchase price, and that it
was entitled to unspecified damages for alleged misrepresentations, breaches of warranty,
mistake of fact, and failure by the Company to turn over certain assets and to provide
certain post-closing support. On December 13, 2000, the trial court ordered that the claim
for a post-closing adjustment in the purchase price be submitted to mandatory arbitration
pursuant to the provisions of the sale agreement, but declined to stay court proceedings
on the other issues during pendency of the arbitration proceeding. On June 18, 2002 the
arbitrator issued a ruling in the Company’s favor and denying in its entirety the plaintiff’s claims
for a post-closing adjustment to the purchase price. With respect to the litigation, the parties
are in the early stages of discovery.
On June 18, 2001, Thales Avionics In-Flight Systems, Inc. (“Thales”) sued a Company
employee, Calvin Fang (“Fang”), for conversion, breach of contract, misappropriation of
trade secrets, interference with prospective economic advantage, fraud and conspiracy
(“Lawsuit”) in Orange County Superior Court, Orange County, California. In the Lawsuit, Thales
alleges that in 2001, Fang left his employment with the Company, obtained employment
at Thales, misappropriated certain alleged trade secrets, left his employment at Thales,
returned to the Company and disclosed the alleged trade secrets to other of its employees.
The Company terminated Fang’s employment in August 2001. On September 6, 2001,
Thales filed a first Amended Complaint (“Amended Complaint”) against Fang and named
as additional defendants Rockwell Collins and eight of the Company’s employees: Greg
Nelson, Chris Jameson, Shawn Kathol, Robert Troxel, James Whitehouse, Kathy Garcia,
NOTES TO CONSOLIDATED FINANCIAL STATEMENTS
60

NOTES TO CONSOLIDATED FINANCIAL STATEMENTS
Wayne Hitchcock and Gregory Piponius (collectively, the “Individual Defendants”). The
Amended Complaint contains six causes of action against the Company and the Individual
Defendants: misappropriation of trade secrets, fraud, unfair competition, conspiracy,
conversion, and interference with prospective economic advantage. In this Lawsuit, Thales
has asked the court to: (a) order the Company and the Individual Defendants to return Thales’
trade secrets allegedly misappropriated by Fang; (b) enjoin the Company and the Individual
Defendants from using, retaining, and disseminating the allegedly misappropriated trade
secrets, (c) assess damages in the amount equal to the alleged unjust enrichment, (d) assess
restitutionary damages, (e) order the Company to pay reasonable royalties if no unjust
enrichment and restitution amounts are provable, (f) assess exemplary and punitive damages
in an amount according to proof, and (g) order the Company and the Individual Defendants
to pay Thales’ attorneys’ fees and costs. On September 11, 2002, Thales filed a motion
seeking permission to file a second Amended Complaint (“Second Amended Complaint”)
which added a new cause of action against the Company and two Individual Defendants for
violation of the Computer Fraud and Abuse Act, a federal statute. Pursuant to the parties’
stipulation, Thales Second Amended Complaint was deemed filed on September 20, 2002.
On September 25, 2002, the case was removed by the Company to the U.S. District Court
for the Central District of California, Southern Division, and were joined in the removal action
by all other defendants, including the Individual Defendants. On October 2, 2002, the
Company filed an answer and affirmative defenses to the Second Amended Complaint in
which the Company denied the allegations set forth therein and asserted various defenses.
The Company also asserted a counterclaim against Thales alleging that Thales’ in-flight
entertainment systems infringe Rockwell Collins’ patent. The Company’s patent counterclaim
seeks an injunction against infringing activity by Thales as well as monetary damages. The
federal court has ordered a scheduling conference for December 16, 2002. There currently
is no trial date set.
In addition, various other lawsuits, claims and proceedings have been or may be instituted or
asserted against the Company relating to the conduct of its business, including those pertaining
to product liability, intellectual property, safety and health, contract and employment matters.
Although the outcome of litigation cannot be predicted with certainty and some lawsuits,
claims, or proceedings may be disposed of unfavorably to the Company, management
believes the disposition of matters which are pending or asserted will not have a material
adverse effect on the Company’s business or financial condition, but could possibly be
material to the results of operations of any one period.
Environmental
The Company is subject to federal, state and local regulations relating to the discharge of
substances into the environment, the disposal of hazardous wastes, and other activities
affecting the environment that have had and will continue to have an impact on the Company’s
manufacturing operations. These environmental protection regulations may require the
investigation and remediation of environmental impairments at current and previously owned
or leased properties. In addition, lawsuits, claims and proceedings have been asserted on
occasion against the Company alleging violations of environmental protection regulations,
or seeking remediation of alleged environmental impairments, principally at previously owned
or leased properties. The Company is currently involved in the investigation or remediation
of seven sites under these regulations or pursuant to lawsuits asserted by third parties.
As of September 30, 2002, management estimates that the total reasonably possible costs
the Company could incur from these matters to be approximately $12 million. The Company
has recorded environmental reserves for these matters of $3 million as of September 30,
2002, which represents management’s estimate of the probable future cost for these matters.
In addition, Rockwell Collins assumed liabilities for certain environmental matters relating
to properties purchased in connection with the acquisition of Kaiser. Rockwell Collins has
rights to indemnification for these matters from the escrow funds set aside at the time of
acquisition. At September 30, 2002, Rockwell Collins has filed claims against the escrow
fund in the amount of $2 million for these matters. In addition, Rockwell Collins may be
contingently liable for environmental matters related to certain other properties previously
owned or leased by Kaiser. Liability for these matters is subordinated to third parties; however,
failure of these third parties to satisfy their obligations related to these properties could cause
these liabilities to revert to Rockwell Collins. Rockwell Collins has rights to indemnification
for these other matters from the escrow funds in the amount of $8 million set aside at the
time of acquisition. We believe the amount of these escrow funds are sufficient to address
these matters.
To date, compliance with environmental regulations and resolution of environmental claims
have been accomplished without material effect on the Company’s liquidity and capital
resources, competitive position or financial condition. Management believes that expenditures
for environmental capital investment and remediation necessary to comply with present
regulations governing environmental protection and other expenditures for the resolution
of environmental claims will not have a material adverse effect on the Company’s business
Rockwell Collins 2002 Annual Report 61
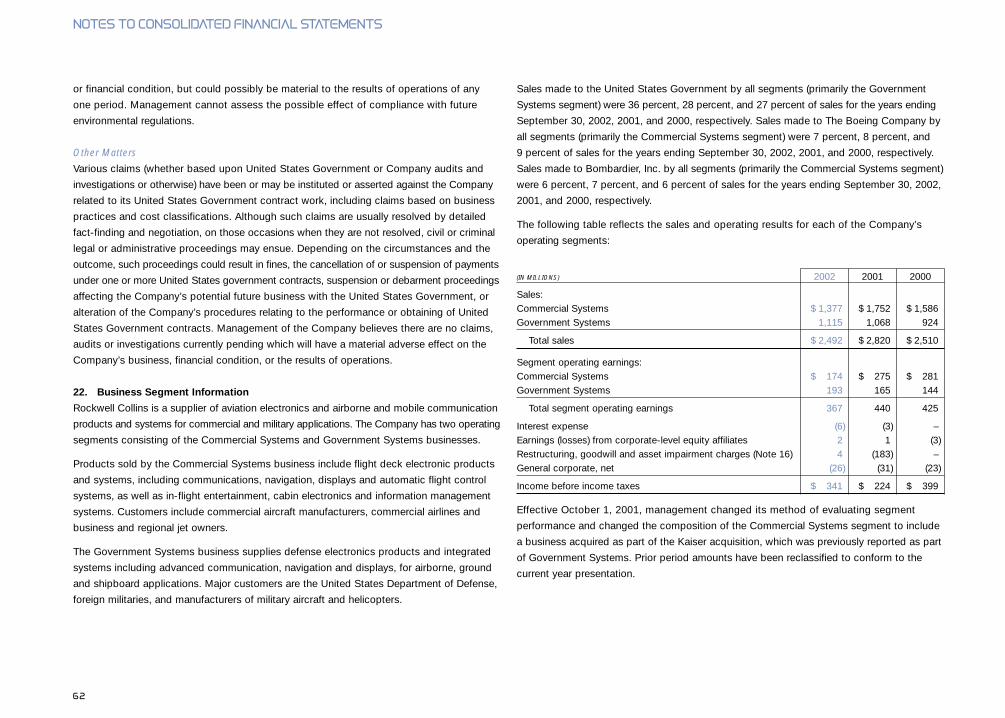
or financial condition, but could possibly be material to the results of operations of any
one period. Management cannot assess the possible effect of compliance with future
environmental regulations.
Other Matters
Various claims (whether based upon United States Government or Company audits and
investigations or otherwise) have been or may be instituted or asserted against the Company
related to its United States Government contract work, including claims based on business
practices and cost classifications. Although such claims are usually resolved by detailed
fact-finding and negotiation, on those occasions when they are not resolved, civil or criminal
legal or administrative proceedings may ensue. Depending on the circumstances and the
outcome, such proceedings could result in fines, the cancellation of or suspension of payments
under one or more United States government contracts, suspension or debarment proceedings
affecting the Company’s potential future business with the United States Government, or
alteration of the Company’s procedures relating to the performance or obtaining of United
States Government contracts. Management of the Company believes there are no claims,
audits or investigations currently pending which will have a material adverse effect on the
Company’s business, financial condition, or the results of operations.
22. Business Segment Information
Rockwell Collins is a supplier of aviation electronics and airborne and mobile communication
products and systems for commercial and military applications. The Company has two operating
segments consisting of the Commercial Systems and Government Systems businesses.
Products sold by the Commercial Systems business include flight deck electronic products
and systems, including communications, navigation, displays and automatic flight control
systems, as well as in-flight entertainment, cabin electronics and information management
systems. Customers include commercial aircraft manufacturers, commercial airlines and
business and regional jet owners.
The Government Systems business supplies defense electronics products and integrated
systems including advanced communication, navigation and displays, for airborne, ground
and shipboard applications. Major customers are the United States Department of Defense,
foreign militaries, and manufacturers of military aircraft and helicopters.
Sales made to the United States Government by all segments (primarily the Government
Systems segment) were 36 percent, 28 percent, and 27 percent of sales for the years ending
September 30, 2002, 2001, and 2000, respectively. Sales made to The Boeing Company by
all segments (primarily the Commercial Systems segment) were 7 percent, 8 percent, and
9 percent of sales for the years ending September 30, 2002, 2001, and 2000, respectively.
Sales made to Bombardier, Inc. by all segments (primarily the Commercial Systems segment)
were 6 percent, 7 percent, and 6 percent of sales for the years ending September 30, 2002,
2001, and 2000, respectively.
The following table reflects the sales and operating results for each of the Company’s
operating segments:
(IN MILLIONS) 2002 2001 2000
Sales:Commercial Systems $ 1,377 $ 1,752 $ 1,586Government Systems 1,115 1,068 924
Total sales $ 2,492 $ 2,820 $ 2,510
Segment operating earnings:Commercial Systems $ 174 $ 275 $ 281Government Systems 193 165 144
Total segment operating earnings 367 440 425
Interest expense (6) (3) –Earnings (losses) from corporate-level equity affiliates 2 1 (3)Restructuring, goodwill and asset impairment charges (Note 16) 4 (183) –General corporate, net (26) (31) (23)
Income before income taxes $ 341 $ 224 $ 399
Effective October 1, 2001, management changed its method of evaluating segment
performance and changed the composition of the Commercial Systems segment to include
a business acquired as part of the Kaiser acquisition, which was previously reported as part
of Government Systems. Prior period amounts have been reclassified to conform to the
current year presentation.
NOTES TO CONSOLIDATED FINANCIAL STATEMENTS
62
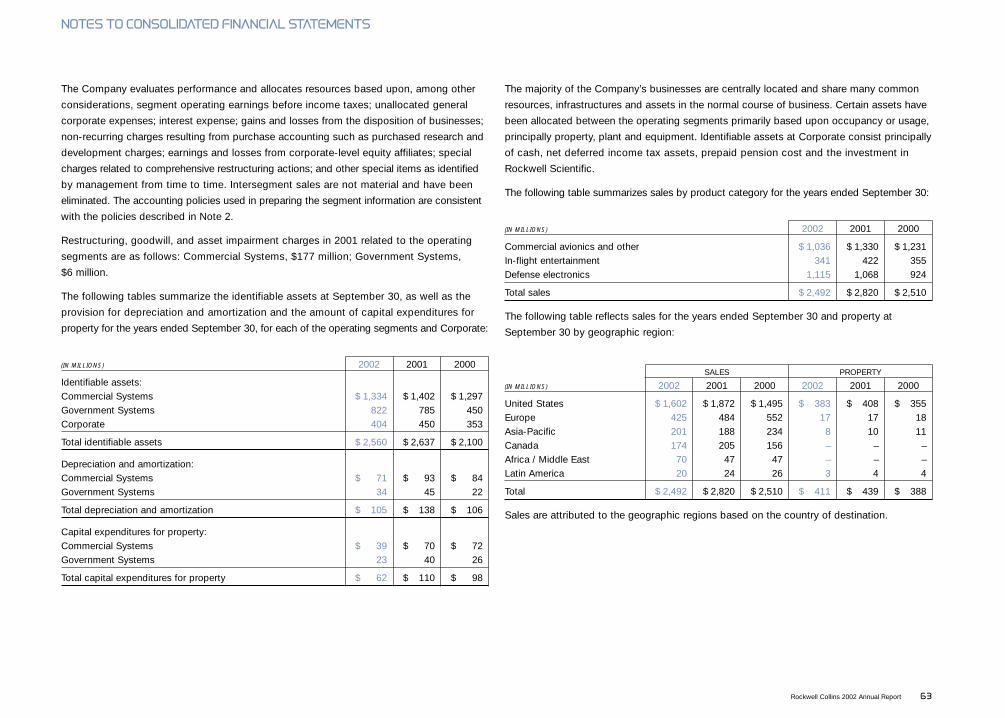
NOTES TO CONSOLIDATED FINANCIAL STATEMENTS
The Company evaluates performance and allocates resources based upon, among other
considerations, segment operating earnings before income taxes; unallocated general
corporate expenses; interest expense; gains and losses from the disposition of businesses;
non-recurring charges resulting from purchase accounting such as purchased research and
development charges; earnings and losses from corporate-level equity affiliates; special
charges related to comprehensive restructuring actions; and other special items as identified
by management from time to time. Intersegment sales are not material and have been
eliminated. The accounting policies used in preparing the segment information are consistent
with the policies described in Note 2.
Restructuring, goodwill, and asset impairment charges in 2001 related to the operating
segments are as follows: Commercial Systems, $177 million; Government Systems,
$6 million.
The following tables summarize the identifiable assets at September 30, as well as the
provision for depreciation and amortization and the amount of capital expenditures for
property for the years ended September 30, for each of the operating segments and Corporate:
(IN MILLIONS) 2002 2001 2000
Identifiable assets:Commercial Systems $ 1,334 $ 1,402 $ 1,297Government Systems 822 785 450Corporate 404 450 353
Total identifiable assets $ 2,560 $ 2,637 $ 2,100
Depreciation and amortization:Commercial Systems $ 71 $ 93 $ 84Government Systems 34 45 22
Total depreciation and amortization $ 105 $ 138 $ 106
Capital expenditures for property:Commercial Systems $ 39 $ 70 $ 72Government Systems 23 40 26
Total capital expenditures for property $ 62 $ 110 $ 98
The majority of the Company’s businesses are centrally located and share many common
resources, infrastructures and assets in the normal course of business. Certain assets have
been allocated between the operating segments primarily based upon occupancy or usage,
principally property, plant and equipment. Identifiable assets at Corporate consist principally
of cash, net deferred income tax assets, prepaid pension cost and the investment in
Rockwell Scientific.
The following table summarizes sales by product category for the years ended September 30:
(IN MILLIONS) 2002 2001 2000
Commercial avionics and other $ 1,036 $ 1,330 $ 1,231In-flight entertainment 341 422 355Defense electronics 1,115 1,068 924
Total sales $ 2,492 $ 2,820 $ 2,510
The following table reflects sales for the years ended September 30 and property at
September 30 by geographic region:
SALES PROPERTY
(IN MILLIONS) 2002 2001 2000 2002 2001 2000
United States $ 1,602 $ 1,872 $ 1,495 $ 383 $ 408 $ 355Europe 425 484 552 17 17 18Asia-Pacific 201 188 234 8 10 11Canada 174 205 156 – – –Africa / Middle East 70 47 47 – – –Latin America 20 24 26 3 4 4
Total $ 2,492 $ 2,820 $ 2,510 $ 411 $ 439 $ 388
Sales are attributed to the geographic regions based on the country of destination.
Rockwell Collins 2002 Annual Report 63
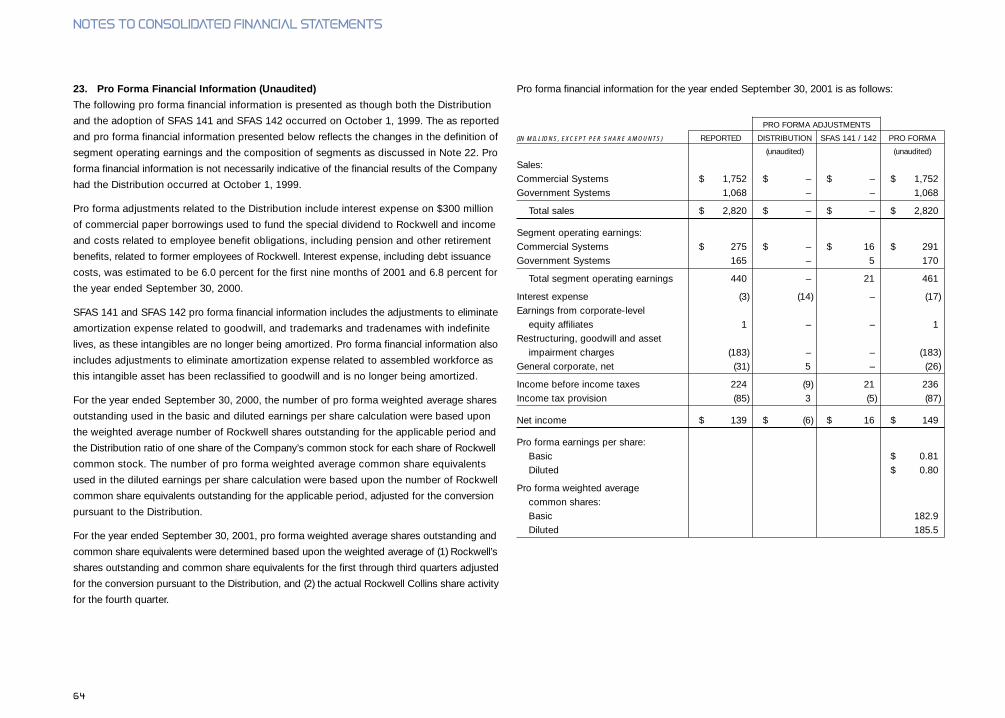
23. Pro Forma Financial Information (Unaudited)
The following pro forma financial information is presented as though both the Distribution
and the adoption of SFAS 141 and SFAS 142 occurred on October 1, 1999. The as reported
and pro forma financial information presented below reflects the changes in the definition of
segment operating earnings and the composition of segments as discussed in Note 22. Pro
forma financial information is not necessarily indicative of the financial results of the Company
had the Distribution occurred at October 1, 1999.
Pro forma adjustments related to the Distribution include interest expense on $300 million
of commercial paper borrowings used to fund the special dividend to Rockwell and income
and costs related to employee benefit obligations, including pension and other retirement
benefits, related to former employees of Rockwell. Interest expense, including debt issuance
costs, was estimated to be 6.0 percent for the first nine months of 2001 and 6.8 percent for
the year ended September 30, 2000.
SFAS 141 and SFAS 142 pro forma financial information includes the adjustments to eliminate
amortization expense related to goodwill, and trademarks and tradenames with indefinite
lives, as these intangibles are no longer being amortized. Pro forma financial information also
includes adjustments to eliminate amortization expense related to assembled workforce as
this intangible asset has been reclassified to goodwill and is no longer being amortized.
For the year ended September 30, 2000, the number of pro forma weighted average shares
outstanding used in the basic and diluted earnings per share calculation were based upon
the weighted average number of Rockwell shares outstanding for the applicable period and
the Distribution ratio of one share of the Company’s common stock for each share of Rockwell
common stock. The number of pro forma weighted average common share equivalents
used in the diluted earnings per share calculation were based upon the number of Rockwell
common share equivalents outstanding for the applicable period, adjusted for the conversion
pursuant to the Distribution.
For the year ended September 30, 2001, pro forma weighted average shares outstanding and
common share equivalents were determined based upon the weighted average of (1) Rockwell’s
shares outstanding and common share equivalents for the first through third quarters adjusted
for the conversion pursuant to the Distribution, and (2) the actual Rockwell Collins share activity
for the fourth quarter.
Pro forma financial information for the year ended September 30, 2001 is as follows:
PRO FORMA ADJUSTMENTS
(IN MILLIONS, EXCEPT PER SHARE AMOUNTS) REPORTED DISTRIBUTION SFAS 141 / 142 PRO FORMA
(unaudited) (unaudited)
Sales:Commercial Systems $ 1,752 $ – $ – $ 1,752Government Systems 1,068 – – 1,068
Total sales $ 2,820 $ – $ – $ 2,820
Segment operating earnings:Commercial Systems $ 275 $ – $ 16 $ 291Government Systems 165 – 5 170
Total segment operating earnings 440 – 21 461
Interest expense (3) (14) – (17)Earnings from corporate-level
equity affiliates 1 – – 1Restructuring, goodwill and asset
impairment charges (183) – – (183)General corporate, net (31) 5 – (26)
Income before income taxes 224 (9) 21 236Income tax provision (85) 3 (5) (87)
Net income $ 139 $ (6) $ 16 $ 149
Pro forma earnings per share:Basic $ 0.81Diluted $ 0.80
Pro forma weighted average common shares:Basic 182.9Diluted 185.5
NOTES TO CONSOLIDATED FINANCIAL STATEMENTS
64

NOTES TO CONSOLIDATED FINANCIAL STATEMENTS
Pro forma financial information for the year ended September 30, 2000 is as follows:
PRO FORMA ADJUSTMENTS
(IN MILLIONS, EXCEPT PER SHARE AMOUNTS) REPORTED DISTRIBUTION SFAS 141 / 142 PRO FORMA
(unaudited) (unaudited)
Sales:Commercial Systems $ 1,586 $ – $ – $ 1,586Government Systems 924 – – 924
Total sales $ 2,510 $ – $ – $ 2,510
Segment operating earnings:Commercial Systems $ 281 $ – $ 7 $ 288Government Systems 144 – – 144
Total segment operating earnings 425 – 7 432
Interest expense – (20) – (20)Losses from corporate-level
equity affiliates (3) – – (3)General corporate, net (23) 2 – (21)
Income before income taxes 399 (18) 7 388Income tax provision (130) 6 (2) (126)
Net income $ 269 $ (12) $ 5 $ 262
Pro forma earnings per share:Basic $ 1.40Diluted $ 1.38
Pro forma weighted average common shares:Basic 187.8Diluted 190.6
24. Quarterly Financial Information (Unaudited)
Quarterly financial information for the years ending September 30, 2002 and 2001 is
summarized as follows:
2002 QUARTERS(IN MILLIONS, EXCEPT PER SHARE AMOUNTS) FIRST SECOND THIRD FOURTH 2002
Sales $ 563 $ 608 $ 623 $ 698 $ 2,492Cost of sales 420 458 460 525 1,863Net income 48 58 60 70 236
Earnings per share:Basic 0.26 0.31 0.33 0.38 1.29Diluted 0.26 0.31 0.33 0.38 1.28
Net income in the second quarter of 2002 includes a $4 million ($2 million after taxes, or 1 cent
per share) reversal of a restructuring reserve. Third quarter net income for 2002 includes a
$4 million ($2 million after taxes, or 1 cent per share) favorable settlement of a legal matter
associated with the sale of a business several years ago. Net income in the fourth quarter of
2002 includes a net gain of $8 million ($5 million after taxes, or 3 cents per share) related to
the resolution of a legal matter, offset by reserves for other legal matters.
2001 QUARTERS(IN MILLIONS, EXCEPT PER SHARE AMOUNTS) FIRST SECOND THIRD FOURTH 2001
Sales $ 587 $ 690 $ 727 $ 816 $ 2,820Cost of sales 429 515 535 629 2,108Net income 58 61 68 (48) 139
Pro forma information:Net income 60 62 71 (44) 149Basic earnings per share 0.33 0.34 0.39 (0.24) 0.81Diluted earnings per share 0.32 0.33 0.38 (0.24) 0.80
Net loss in the fourth quarter of 2001 includes; (a) a $34 million ($22 million after taxes, or
12 cents per share) restructuring charge and (b) a $149 million ($108 million after taxes, or
59 cents per share) charge for goodwill and asset impairments (see Note 16). Stock options
in the fourth quarter are anti-dilutive due to the net loss, resulting in identical basic and
diluted earnings per share amounts.
Per share information is calculated for each quarterly and annual period using average
outstanding shares for that period. Therefore, the sum of the quarterly per share amounts
will not necessarily equal the annual per share amounts presented.
Rockwell Collins 2002 Annual Report 65
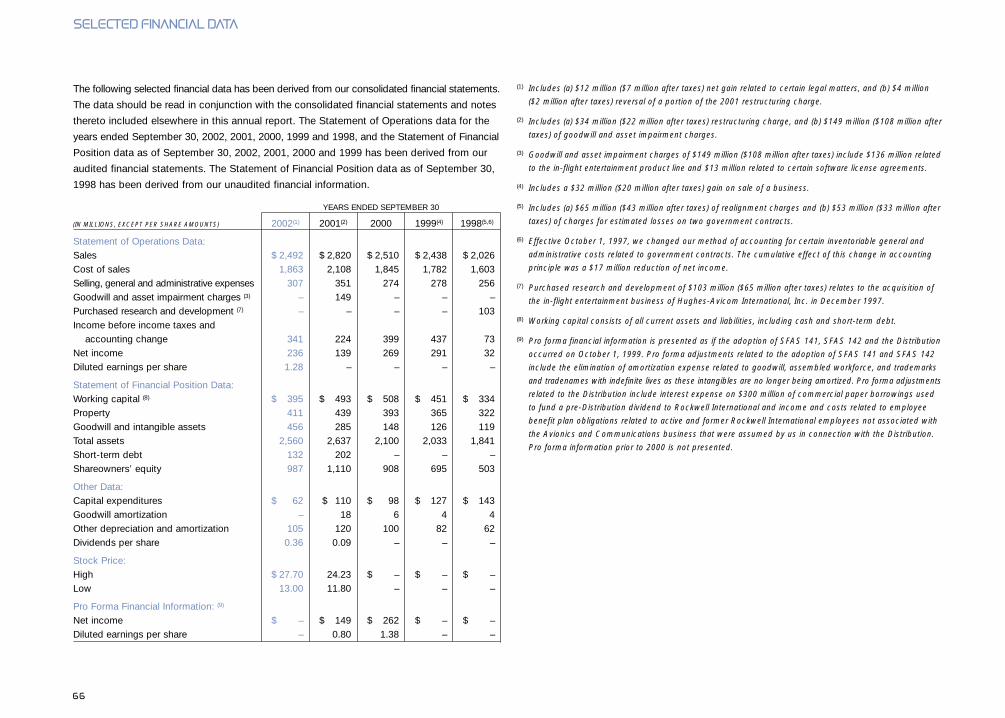
The following selected financial data has been derived from our consolidated financial statements.
The data should be read in conjunction with the consolidated financial statements and notes
thereto included elsewhere in this annual report. The Statement of Operations data for the
years ended September 30, 2002, 2001, 2000, 1999 and 1998, and the Statement of Financial
Position data as of September 30, 2002, 2001, 2000 and 1999 has been derived from our
audited financial statements. The Statement of Financial Position data as of September 30,
1998 has been derived from our unaudited financial information.
YEARS ENDED SEPTEMBER 30
(IN MILLIONS, EXCEPT PER SHARE AMOUNTS) 2002(1) 2001(2) 2000 1999(4) 1998(5,6)
Statement of Operations Data:Sales $ 2,492 $ 2,820 $ 2,510 $ 2,438 $ 2,026Cost of sales 1,863 2,108 1,845 1,782 1,603Selling, general and administrative expenses 307 351 274 278 256Goodwill and asset impairment charges (3) – 149 – – –Purchased research and development (7) – – – – 103Income before income taxes and
accounting change 341 224 399 437 73Net income 236 139 269 291 32Diluted earnings per share 1.28 – – – –
Statement of Financial Position Data:Working capital (8) $ 395 $ 493 $ 508 $ 451 $ 334Property 411 439 393 365 322Goodwill and intangible assets 456 285 148 126 119Total assets 2,560 2,637 2,100 2,033 1,841Short-term debt 132 202 – – –Shareowners’ equity 987 1,110 908 695 503
Other Data:Capital expenditures $ 62 $ 110 $ 98 $ 127 $ 143Goodwill amortization – 18 6 4 4Other depreciation and amortization 105 120 100 82 62Dividends per share 0.36 0.09 – – –
Stock Price:High $ 27.70 24.23 $ – $ – $ –Low 13.00 11.80 – – –
Pro Forma Financial Information: (9)
Net income $ – $ 149 $ 262 $ – $ –Diluted earnings per share – 0.80 1.38 – –
(1) Includes (a) $12 million ($7 million after taxes) net gain related to certain legal matters, and (b) $4 million
($2 million after taxes) reversal of a portion of the 2001 restructuring charge.
(2) Includes (a) $34 million ($22 million after taxes) restructuring charge, and (b) $149 million ($108 million after
taxes) of goodwill and asset impairment charges.
(3) Goodwill and asset impairment charges of $149 million ($108 million after taxes) include $136 million related
to the in-flight entertainment product line and $13 million related to certain software license agreements.
(4) Includes a $32 million ($20 million after taxes) gain on sale of a business.
(5) Includes (a) $65 million ($43 million after taxes) of realignment charges and (b) $53 million ($33 million after
taxes) of charges for estimated losses on two government contracts.
(6) Effective October 1, 1997, we changed our method of accounting for certain inventoriable general and
administrative costs related to government contracts. The cumulative effect of this change in accounting
principle was a $17 million reduction of net income.
(7) Purchased research and development of $103 million ($65 million after taxes) relates to the acquisition of
the in-flight entertainment business of Hughes-Avicom International, Inc. in December 1997.
(8) Working capital consists of all current assets and liabilities, including cash and short-term debt.
(9) Pro forma financial information is presented as if the adoption of SFAS 141, SFAS 142 and the Distribution
occurred on October 1, 1999. Pro forma adjustments related to the adoption of SFAS 141 and SFAS 142
include the elimination of amortization expense related to goodwill, assembled workforce, and trademarks
and tradenames with indefinite lives as these intangibles are no longer being amortized. Pro forma adjustments
related to the Distribution include interest expense on $300 million of commercial paper borrowings used
to fund a pre-Distribution dividend to Rockwell International and income and costs related to employee
benefit plan obligations related to active and former Rockwell International employees not associated with
the Avionics and Communications business that were assumed by us in connection with the Distribution.
Pro forma information prior to 2000 is not presented.
SELECTED FINANCIAL DATA
66

BOARD OF DIRECTORS EXECUTIVE OFFICERS
Clayton M. Jones
Chairman, President and Chief Executive Officer
Rockwell Collins, Inc.
Donald R. Beall
Retired Chairman and Chief Executive Officer
Rockwell International Corporation
Anthony J. Carbone
Vice Chairman of the Board and Senior Consultant
The Dow Chemical Company
Michael P. C. Carns
General, USAF (Retired)
Vice Chairman
Priva Source, Inc.
Chris A. Davis
Chairman and Chief Executive Officer
McLeodUSA Incorporated
Richard J. Ferris
Retired Co-Chairman
Doubletree Corp.
Cheryl L. Shavers
Chairman and Chief Executive Officer
Global Smarts, Inc.
Joseph F. Toot, Jr.
Retired President and Chief Executive Officer
The Timken Company
Clayton M. Jones
Chairman, President and Chief Executive Officer
Barry M. Abzug
Senior Vice President, Corporate Development
Patrick E. Allen
Vice President, Finance and Treasurer
Gary R. Chadick
Senior Vice President, General Counsel and Secretary
Robert M. Chiusano
Executive Vice President and Chief Operating Officer
Commercial Systems
Gregory S. Churchill
Executive Vice President and Chief Operating Officer
Government Systems
Lawrence A. Erickson
Senior Vice President and Chief Financial Officer
Jerome J. Gasper
Senior Vice President, Engineering and Technology
Herman M. Reininga
Senior Vice President, Operations
William J. Richter
Senior Vice President, Human Resources
Alfred J. Spigarelli
Vice President, Benefits and Administrative Services
Derek R. Wimmer
Vice President and General Auditor
Rockwell Collins 2002 Annual Report 67
68
Rockwell Collins, Inc.World Headquarters400 Collins Road NECedar Rapids, Iowa 52498319 295-1000www.rockwellcollins.com
Investor RelationsSecurities analysts should call:David H. BrehmVice President, Investor Relations319 295-7575
Corporate Public RelationsMembers of the news media should call:319 295-2123
Annual MeetingThe company’s annual meeting of shareowners will be held near its World Headquarters at:
Collins Plaza Hotel1200 Collins Road NECedar Rapids, IowaTuesday, February 11, 2003
A notice of the meeting and proxy material will be mailed to shareowners in late December 2002.
Independent AuditorsDeloitte & Touche LLPTwo Prudential Plaza180 North Stetson AvenueChicago, Illinois 60601-6779
Transfer Agent and RegistrarMellon Investor Services LLCPO Box 3315South Hackensack, New Jersey 07606888 253-4522 or 201 329-8660
120 Broadway 33rd FloorNew York, New York 10271888 253-4522 or 201 329-8660
Shareowners ServicesCorrespondence about share ownership, dividend payments, transfer requirements, changes ofaddress, lost stock certificates, and account status may be directed to:
Mellon Investor Services LLCPO Box 3315South Hackensack, New Jersey 07606888 253-4522 or 201 329-8660www.melloninvestor.com
Shareowners wishing to transfer stock should send their written request, stock certificate(s)and other required documents to:
Mellon Investor Services LLCPO Box 3315South Hackensack, New Jersey 07606888 253-4522 or 201 329-8660www.melloninvestor.com
Shareowners needing further assistance should call: 319 295-4045
For copies of the annual report, Forms 10-K and Forms 10-Q, please call:Rockwell Collins Shareholder Direct 800 859-1337
Investors Services ProgramUnder the Mellon Investor Services Program for Rockwell Collins shareowners, shareownersof record may elect to reinvest all or part of their dividends, to have cash dividends directlydeposited in their bank accounts and to deposit share certificates with the agent for safekeeping.These services are provided without charge to the participating shareowner.
In addition, the program allows participating shareowners at their own cost to make optionalcash investments in any amount from $100 to $100,000 per year or to sell all or any part of theshares held in their accounts.
Participation in the program is voluntary, and shareowners of record may participate or terminate their participation at any time. For a brochure and full details of the program,please direct inquiries to:
Mellon Bank, N.A.c/o Mellon Investor Services LLCPO Box 3338South Hackensack, New Jersey 07606888 253-4522 or 201 329-8660
Stock ExchangeCommon Stock (Symbol: COL)New York Stock Exchange
CORPORATE INFORMATION

DOMESTIC
Ann Arbor, MI
Atlanta, GA
Bellevue, IA
Boston, MA
Carlsbad, CA
Cedar Rapids, IA
Charlotte, NC
Chicago, IL
Cincinnati, OH
Coralville, IA
Cypress, CA
Dallas, TX
Decorah, IA
Detroit, MI
Fort Worth, TX
Honolulu, HI
Houston, TX
Irvine, CA
Kansas City, MO
Kirkland, WA
Los Angeles, CA
Manchester, IA
Melbourne, FL
Miami, FL
Midwest City, OK
Minneapolis, MN
New York, NY
Newark, NJ
Philadelphia, PA
Pittsburgh, PA
Pomona, CA
Portland, OR
Raleigh, NC
Renton, WA
Richardson, TX
San Francisco, CA
San Jose, CA
Seattle, WA
St. Louis, MO
Tulsa, OK
Tustin, CA
Warner Robbins, GA
Washington, DC
White Marsh, MD
Wichita, KS
INTERNATIONAL
Amsterdam, Netherlands
Auckland, New Zealand
Bangkok, Thailand
Beijing, China
Brisbane, Australia
Frankfurt, Germany
Hong Kong
Johannesburg, South Africa
Kuala Lumpur, Malaysia
London, England
Lyon, France
Manchester, England
Manila, Philippines
Melbourne, Australia
Mexicali, Mexico
Montreal, Canada
Moscow, Russia
Osaka, Japan
Paris, France
Reading, England
Rome, Italy
Santiago, Chile
São José dos Campos, Brazil
São Paulo, Brazil
Shanghai, China
Singapore
Sydney, Australia
Tokyo, Japan
Toulouse, France
Zurich, Switzerland
GLOBAL LOCATIONS

Rockwell Coll ins, Inc.World Headquarters
400 Coll ins Road NECedar Rapids, Iowa 52498
319 295-1000www.rockwellcoll ins.com
147-0007-000-RC 12/02 145M EDW
© Copyright 2002 Rockwell Coll ins, Inc.
All Rights Reserved Printed in USA