Baird's Energy Technology...
16
Baird’s Energy Technology Monthly December 2015 Robert W. Baird & Co. 1 Equity Market Performance Performance Index LTM YTD Dec-15 S&P 500 (0.7%) (0.7%) (1.8%) Dow Jones (2.2%) (2.2%) (1.7%) NASDAQ 5.7% 5.7% (2.0%) Wilderhill Clean Energy Index (10.7%) (10.7%) 10.7% General Equity Market Update U.S. stocks had their worst annual performance since 2008, closing out a rocky year that tempered investors’ expectations for 2016 ― In the S&P 500, Consumer Discretionary and Healthcare stocks rose 8% and 5%, respectively, while Energy, Materials and Utilities were the biggest laggards declining 24%, 10% and 8%, respectively The FOMC unanimously voted to set the fed funds target rate to 0.25% - 0.5% from 0.0% - 0.25%; the committee expects to make gradual, data-dependent adjustments going forward Brent crude dropped to its lowest level in more than a decade, surpassing lows reached in the depths of the financial crisis IPO activity slowed in 2015 with a total of 150 IPOs, the lowest volume since 2012; total capital raised plummeted to $32.3 billion, down 53% from 2014 (excluding Alibaba) ― Heightened volatility in Q3 dampened investors’ appetite for risk in the latter part of 2015 and a challenging pricing environment pushed many IPOs into 2016 27 follow-on offerings priced in December, raising $11.0 billion, bringing the total for 2015 to 632 offerings, down 5.4% from 2014 Energy Technology Market Update Equity Capital Markets There were three Energy Technology equity offerings in December; notable offerings included: ― BuildingIQ completed an initial public offering of $14 million ― Hydrogenics Corp. completed a follow-on offering of $17 million ― Gevo Inc. completed a follow-on offering of $10 million 2015 activity by number of deals was down compared to 2014, but aggregate deal value was up with 19 priced deals for $3,887 million in 2015 vs. 29 deals for $2,923 million in 2014 Private Placements The number of Energy Technology private placements was up while aggregate deal value was down compared to November, with 41 deals for $507 million in December compared to 39 deals for $887 million in November; notable deals included: ― Cathay Industrial Biotech received $135 million from Shanxi Lu'an Mining Group ― Sungevity received $50 million from Apollo Global Management, Hercules Technology Growth Capital, GE Ventures, EFW Partners, Vision Ridge Partners, Brightpath Capital Partners, Firelake Capital Management, Jetstream Capital, Craton Equity Partners and E.ON Ventures ― Younicos received $50 million from First Solar and Grupo ECOS 2015 investment activity by transaction volume is down and aggregate disclosed value is up compared to 2014, with 446 deals for $5,540 million in 2015 compared to 564 deals for $5,029 million in 2014 M&A Energy Technology M&A volume and aggregate deal value is down compared to November, with 6 deals for $60 million in December compared to 10 announced deals for $135 million in November ― Notable announced deals include Vestas’ $60 million acquisition of Upwind Solutions, General Electric’s acquisition of Blade Dynamics, Tri Global Energy’s acquisition of K12Solar and CleanSpark’s acquisition of Specialised Energy Solutions 2015 transaction volume is down while aggregate disclosed value is up compared to 2014 with 168 transactions for $27,345 million in 2015 compared to 183 transactions for $17,449 million in 2014 Robert W. Baird & Co. (“Baird”) is a leading middle market focused investment bank serving the M&A and equity financing needs of our clients throughout the U.S., Europe and Asia. Since 2010, we have advised on over 415 M&A transactions totaling more than $102 billion and have served as an underwriter on over 534 equity offerings totaling more than $147 billion in raised capital. For more information, contact: Michael Horwitz Managing Director [email protected] 415.627.3284 Jonathan Harrison Managing Director, Baird Europe [email protected] +44.807.667.8414 Satoshi Matsumoto Managing Director, Director of Japan M&A [email protected] 646.557.3201 Anthony Siu Managing Director, Head of China Investment Banking [email protected] +86.21.6182.0980 Mathew Kessler Director [email protected] 415.627.3223 (45.0%) (35.0%) (25.0%) (15.0%) (5.0%) 5.0% 15.0% 25.0% 12/31/14 1/30/15 3/1/15 4/1/15 5/1/15 6/1/15 7/1/15 7/31/15 8/31/15 9/30/15 10/31/15 11/30/15 12/31/15 S&P 500 Dow Jones NASDAQ Wilderhill NEX (2.2%) (0.7%) 5.7% (10.7%)
Transcript of Baird's Energy Technology...

Baird’s Energy Technology Monthly December 2015
Robert W. Baird & Co. 1
Equity Market Performance
Performance
Index LTM YTD Dec-15
S&P 500 (0.7%) (0.7%) (1.8%)
Dow Jones (2.2%) (2.2%) (1.7%)
NASDAQ 5.7% 5.7% (2.0%)
Wilderhill
Clean Energy
Index
(10.7%) (10.7%) 10.7%
General Equity Market Update
U.S. stocks had their worst annual performance since 2008, closing out a rocky year that tempered investors’ expectations for
2016
― In the S&P 500, Consumer Discretionary and Healthcare stocks rose 8% and 5%, respectively, while Energy, Materials and Utilities were the biggest laggards declining 24%, 10% and 8%, respectively
The FOMC unanimously voted to set the fed funds target rate to 0.25% - 0.5% from 0.0% - 0.25%; the committee expects to make gradual, data-dependent adjustments going forward
Brent crude dropped to its lowest level in more than a decade, surpassing lows reached in the depths of the financial crisis
IPO activity slowed in 2015 with a total of 150 IPOs, the lowest volume since 2012; total capital raised plummeted to $32.3 billion, down 53% from 2014 (excluding Alibaba)
― Heightened volatility in Q3 dampened investors’ appetite for risk in the latter part of 2015 and a challenging pricing environment pushed many IPOs into 2016
27 follow-on offerings priced in December, raising $11.0 billion, bringing the total for 2015 to 632 offerings, down 5.4% from 2014
Energy Technology Market Update
Equity Capital Markets
There were three Energy Technology equity offerings in December; notable offerings included:
― BuildingIQ completed an initial public offering of $14 million
― Hydrogenics Corp. completed a follow-on offering of $17 million
― Gevo Inc. completed a follow-on offering of $10 million
2015 activity by number of deals was down compared to 2014, but aggregate deal value was up with 19 priced deals for $3,887 million in 2015 vs. 29 deals for $2,923 million in 2014
Private Placements
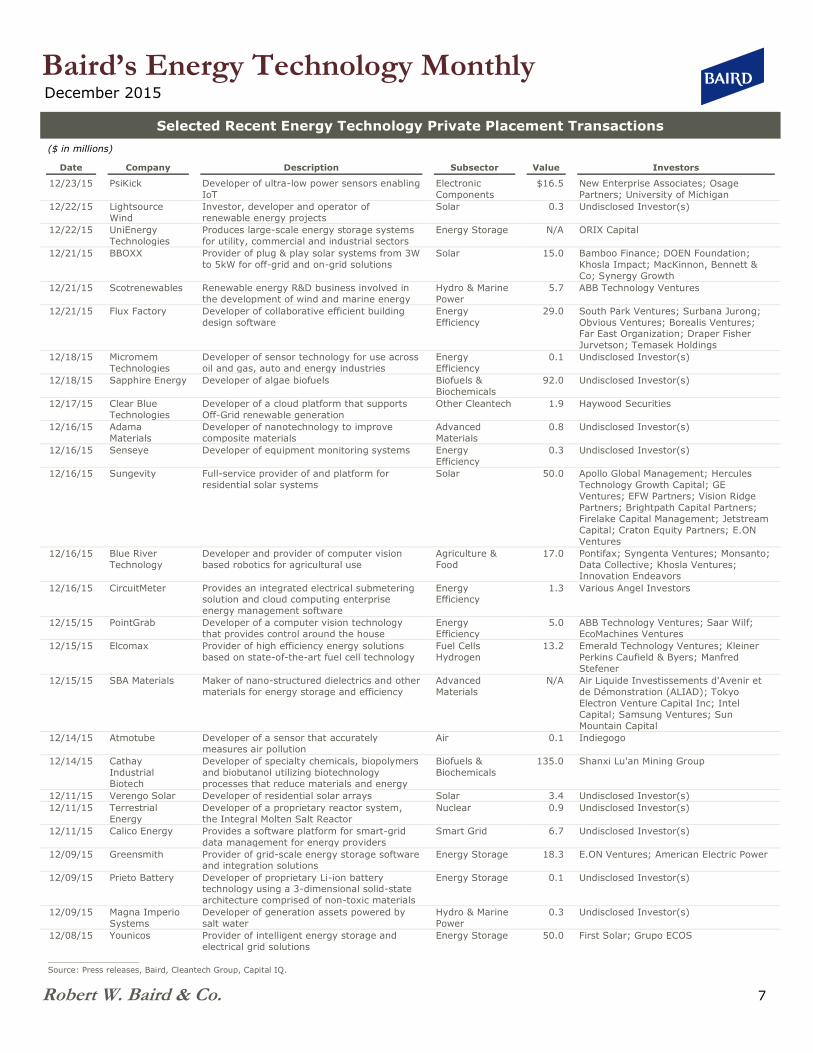
The number of Energy Technology private placements was up while aggregate deal value was down compared to November, with 41 deals for $507 million in December compared to 39 deals for $887 million in November; notable deals included:
― Cathay Industrial Biotech received $135 million from Shanxi Lu'an Mining Group
― Sungevity received $50 million from Apollo Global Management, Hercules Technology Growth Capital, GE Ventures, EFW Partners, Vision Ridge Partners, Brightpath Capital Partners, Firelake Capital Management, Jetstream Capital, Craton Equity Partners and E.ON Ventures
― Younicos received $50 million from First Solar and Grupo ECOS
2015 investment activity by transaction volume is down and aggregate disclosed value is up compared to 2014, with 446 deals for $5,540 million in 2015 compared to 564 deals for $5,029 million in 2014
M&A
Energy Technology M&A volume and aggregate deal value is down compared to November, with 6 deals for $60 million in December compared to 10 announced deals for $135 million in November
― Notable announced deals include Vestas’ $60 million acquisition of Upwind Solutions, General Electric’s acquisition of Blade Dynamics, Tri Global Energy’s acquisition of K12Solar and CleanSpark’s acquisition of Specialised Energy Solutions
2015 transaction volume is down while aggregate disclosed value is up compared to 2014 with 168 transactions for $27,345 million in 2015 compared to 183 transactions for $17,449 million in 2014
Robert W. Baird & Co. (“Baird”) is a leading middle market focused investment bank serving the M&A and equity financing needs of our clients throughout the U.S., Europe and Asia. Since 2010, we have advised on over 415 M&A transactions totaling more than $102 billion and have served as an underwriter on over 534 equity offerings totaling more than $147 billion in raised capital. For more information, contact:
Michael Horwitz
Managing Director [email protected]
415.627.3284
Jonathan Harrison
Managing Director, Baird Europe
+44.807.667.8414
Satoshi Matsumoto
Managing Director, Director of Japan M&A
646.557.3201
Anthony Siu
Managing Director, Head of China Investment
Banking
+86.21.6182.0980
Mathew Kessler
Director [email protected]
415.627.3223
(45.0%)
(35.0%)
(25.0%)
(15.0%)
(5.0%)
5.0%
15.0%
25.0%
12/31/14 1/30/15 3/1/15 4/1/15 5/1/15 6/1/15 7/1/15 7/31/15 8/31/15 9/30/15 10/31/15 11/30/15 12/31/15
S&P 500 Dow Jones NASDAQ Wilderhill NEX
(2.2%)(0.7%)
5.7%
(10.7%)
Baird’s Energy Technology Monthly December 2015
Robert W. Baird & Co. 2
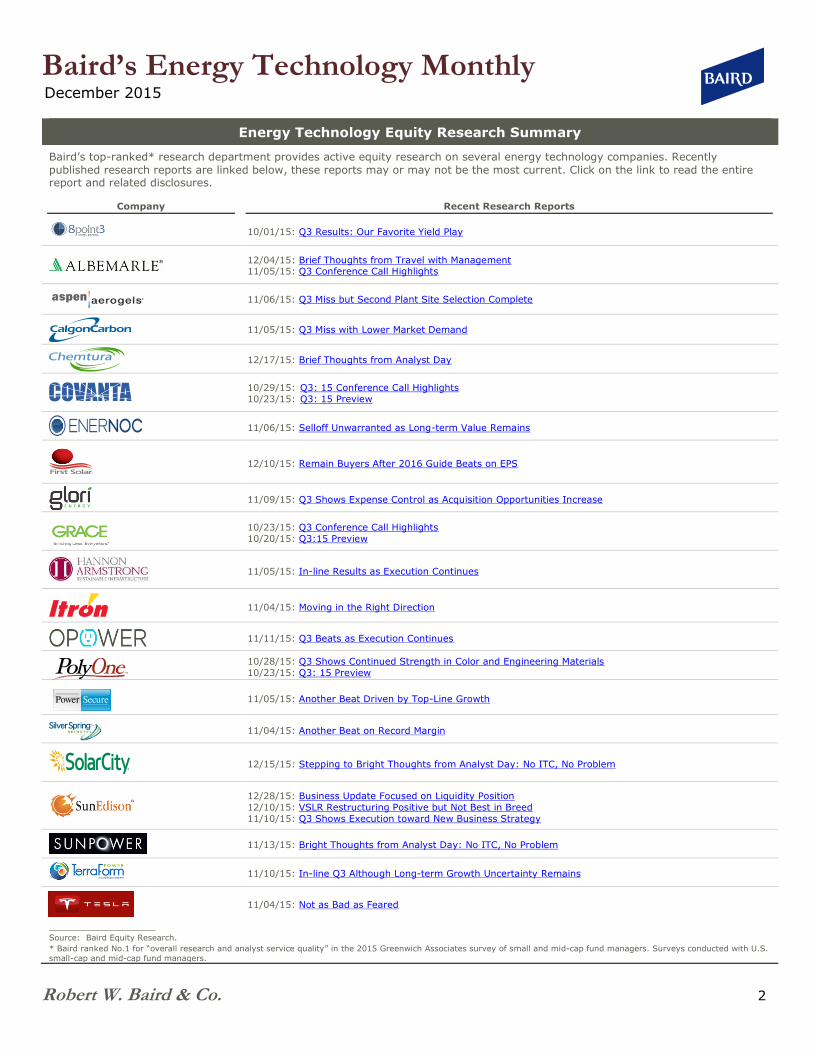
Energy Technology Equity Research Summary
Baird’s top-ranked* research department provides active equity research on several energy technology companies. Recently
published research reports are linked below, these reports may or may not be the most current. Click on the link to read the entire report and related disclosures.
Company Recent Research Reports
10/01/15: Q3 Results: Our Favorite Yield Play
12/04/15: Brief Thoughts from Travel with Management 11/05/15: Q3 Conference Call Highlights
11/06/15: Q3 Miss but Second Plant Site Selection Complete
11/05/15: Q3 Miss with Lower Market Demand
12/17/15: Brief Thoughts from Analyst Day
10/29/15: Q3: 15 Conference Call Highlights
10/23/15: Q3: 15 Preview
11/06/15: Selloff Unwarranted as Long-term Value Remains
12/10/15: Remain Buyers After 2016 Guide Beats on EPS
11/09/15: Q3 Shows Expense Control as Acquisition Opportunities Increase
10/23/15: Q3 Conference Call Highlights
10/20/15: Q3:15 Preview
11/05/15: In-line Results as Execution Continues
11/04/15: Moving in the Right Direction
11/11/15: Q3 Beats as Execution Continues
10/28/15: Q3 Shows Continued Strength in Color and Engineering Materials
10/23/15: Q3: 15 Preview
11/05/15: Another Beat Driven by Top-Line Growth
11/04/15: Another Beat on Record Margin
12/15/15: Stepping to Bright Thoughts from Analyst Day: No ITC, No Problem
12/28/15: Business Update Focused on Liquidity Position
12/10/15: VSLR Restructuring Positive but Not Best in Breed
11/10/15: Q3 Shows Execution toward New Business Strategy
11/13/15: Bright Thoughts from Analyst Day: No ITC, No Problem
11/10/15: In-line Q3 Although Long-term Growth Uncertainty Remains
11/04/15: Not as Bad as Feared
_____________________
Source: Baird Equity Research.
* Baird ranked No.1 for “overall research and analyst service quality” in the 2015 Greenwich Associates survey of small and mid-cap fund managers. Surveys conducted with U.S.
small-cap and mid-cap fund managers.

Baird’s Energy Technology Monthly December 2015
Robert W. Baird & Co. 3
Energy Technology Public Company Trading Trends
Subsector Companies
Monthly Δ
Stock Price 2015E Revenue Multiple
Amyris
Codexis Gevo
GPRE
Marrone Bio Innovations
Metabolix Novozymes
REGI
Rentech Solazyme
(3.2%)
Ameresco
Aspen Aerogels
Digi International
Echelon
EnerNOC
ESCO Technologies
Hannon Armstrong
Sustainable
Infrastructure Capital
Itron
OPower
PowerSecure Silver Spring
Networks
(6.6%)
AeroVironment
Ballard Power Systems
BYD Company
EnerSys
FuelCell Energy
Hydrogenics
Maxwell Technologies
Plug Power
Tesla Motors
1.1%
Acuity Brands
Cree
Hubbell
LSI Industries
Rubicon Technology
Zumtobel Group AG
2.4%
Chart Industries Clean Energy Fuels
Fuel Systems Solutions
Power Solutions International
Westport Innovations
(15.8%)
Casella Waste Systems
Covanta Holding Corporation
Republic Services
US Ecology
Waste Connections
Waste Management
(2.2)%
Advanced Energy
Canadian Solar Daqo New Energy
Enphase
First Solar
GCL-Poly Energy
JA Solar
JinkoSolar
REC Silicon
ReneSola Sky Solar Holdings
SMA Solar Tech
SolarCity
SolarEdge Tech
Solargiga Energy
SolarWorld AG
SunEdison SunPower
SunRun
Trina Solar
Vivint Solar
Yingli Green Energy
12.7%
8point3 Energy Partners LP
Abengoa Yield
NextEra Energy Partners
NRG Yield
Pattern Energy
TerraForm Power
TerraForm Global
16.8%
American Water Works
Aqua America
Badger Meter
Calgon Carbon
Energy Recovery
Nuverra Environmental
Pure Technologies Veolia Environment
Xylem
(2.2)%
American Superconductor
Broadwind Energy
Capstone Turbine
China Ming Yang Wind Power
Gamesa
Nordex
Sinovel Wind Group
Vestas Wind Systems
5.5%
Abengoa Albermarle
Alterra Power
Areva
Chemtura Corporation
Enel Green Power Glori Energy
Iberdrola
McPherson’s Limited
Ormat Technologies
Otter Tail PolyOne
Synthesis Energy
Systems
W.R. Grace
(1.0%)
____________________
Source: Baird Equity Research, Capital IQ. As of December 31, 2015. Estimates are calendarized for comparison purposes.
Biofuels &
Biomaterials
2.4x 2.4x
November December
Efficiency /
Smart Grid
0.9x 0.9x
November December
Energy Storage /
Transportation
2.3x1.9x
November December
Lighting
1.5x1.1x
November December
Natural Gas
Technology
1.0x 0.8x
November December
Recycling &
Waste
2.5x 2.5x
November December
Solar
1.5x1.8x
November December
Yieldco
7.9x9.1x
November December
Water &
Wastewater
2.2x 2.2x
November December
Wind
0.7x0.8x
November December
Other
2.1x 2.0x
November December
Baird’s Energy Technology Monthly December 2015
Robert W. Baird & Co. 4
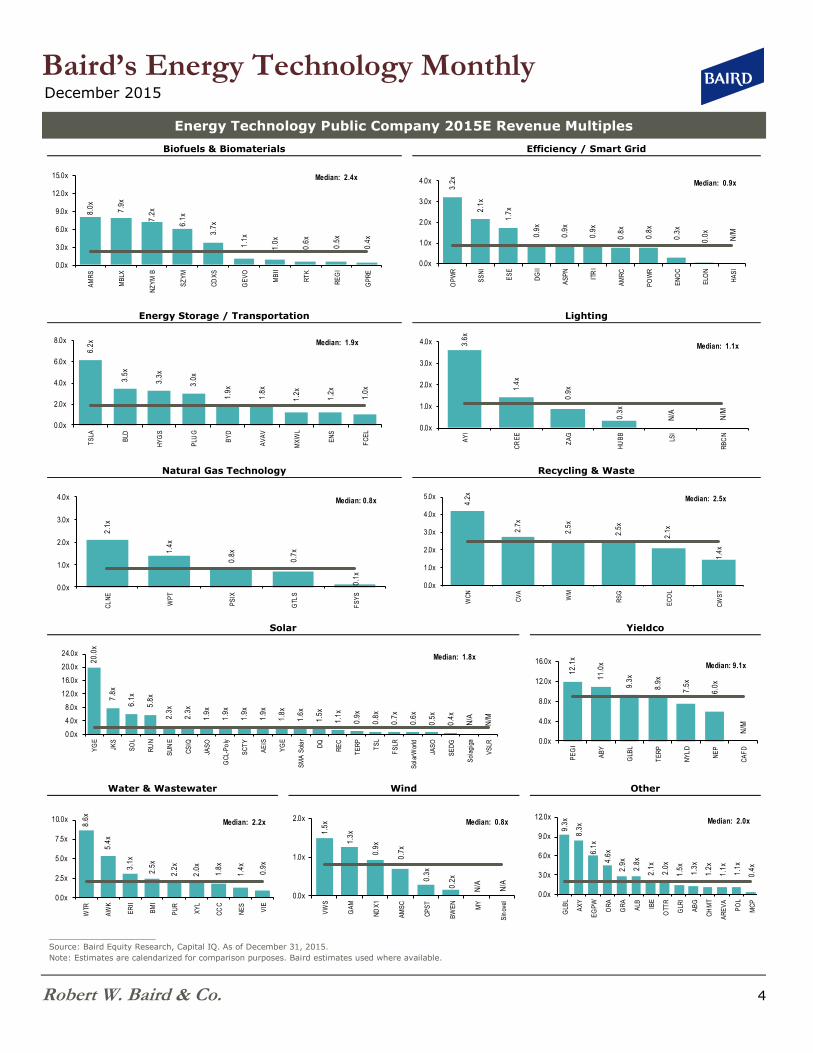
Energy Technology Public Company 2015E Revenue Multiples
Biofuels & Biomaterials Efficiency / Smart Grid
Energy Storage / Transportation Lighting
Natural Gas Technology Recycling & Waste
Solar Yieldco
Water & Wastewater Wind Other
_____________________
Source: Baird Equity Research, Capital IQ. As of December 31, 2015.
Note: Estimates are calendarized for comparison purposes. Baird estimates used where available.
8.0
x
7.9
x
7.2
x
6.1
x
3.7
x
1.1
x
1.0
x
0.6
x
0.5
x
0.4
x
0.0x
3.0x
6.0x
9.0x
12.0x
15.0x
AM
RS
MB
LX
NZ
YM
B
SZ
YM
CD
XS
GE
VO
MB
II
RT
K
RE
GI
GP
RE
Median: 2.4x
3.2
x
2.1
x
1.7
x
0.9
x
0.9
x
0.9
x
0.8
x
0.8
x
0.3
x
0.0
x
N/M
0.0x
1.0x
2.0x
3.0x
4.0x
OP
WR
SS
NI
ES
E
DG
II
AS
PN
ITR
I
AM
RC
PO
WR
EN
OC
ELO
N
HA
SI
Median: 0.9x
6.2
x
3.5
x
3.3
x
3.0
x
1.9
x
1.8
x
1.2
x
1.2
x
1.0
x
0.0x
2.0x
4.0x
6.0x
8.0x
TS
LA
BLD
HY
GS
PLU
G
BY
D
AV
AV
MX
WL
EN
S
FC
EL
Median: 1.9x 3.6
x
1.4
x
0.9
x
0.3
x
N/A
N/M
0.0x
1.0x
2.0x
3.0x
4.0x
AY
I
CR
EE
ZA
G
HU
BB
LSI
RB
CN
Median: 1.1x
2.1
x
1.4
x
0.8
x
0.7
x
0.1
x
0.0x
1.0x
2.0x
3.0x
4.0x
CL
NE
WP
T
PS
IX
GTL
S
FS
YS
Median: 0.8x 4.2
x
2.7
x
2.5
x
2.5
x
2.1
x
1.4
x
0.0x
1.0x
2.0x
3.0x
4.0x
5.0x
WC
N
CV
A
WM
RS
G
EC
OL
CW
ST
Median: 2.5x
20
.0x
7.8
x
6.1
x
5.8
x
2.3
x
2.3
x
1.9
x
1.9
x
1.9
x
1.9
x
1.8
x
1.6
x
1.5
x
1.1
x
0.9
x
0.8
x
0.7
x
0.6
x
0.5
x
0.4
x
N/A
N/M
0.0x
4.0x
8.0x
12.0x
16.0x
20.0x
24.0x
YG
E
JKS
SO
L
RU
N
SU
NE
CS
IQ
JAS
O
GC
L-P
oly
SC
TY
AE
IS
YG
E
SM
A S
ola
r
DQ
RE
C
TE
RP
TS
L
FS
LR
Sol
arW
orld
JAS
O
SE
DG
Sol
agig
a
VS
LR
Median: 1.8x
12
.1x
11
.0x
9.3
x
8.9
x
7.5
x
6.0
x
N/M
0.0x
4.0x
8.0x
12.0x
16.0x
PE
GI
AB
Y
GLB
L
TE
RP
NY
LD
NE
P
CA
FD
Median: 9.1x
8.6
x
5.4
x
3.1
x
2.5
x
2.2
x
2.0
x
1.8
x
1.4
x
0.9
x
0.0x
2.5x
5.0x
7.5x
10.0x
WTR
AW
K
ER
II
BM
I
PU
R
XY
L
CC
C
NE
S
VIE
Median: 2.2x
1.5
x
1.3
x
0.9
x
0.7
x
0.3
x
0.2
x
N/A
N/A
0.0x
1.0x
2.0x
VW
S
GA
M
ND
X1
AM
SC
CP
ST
BW
EN
MY
Sin
ovel
Median: 0.8x
9.3
x
8.3
x
6.1
x
4.6
x
2.9
x
2.8
x
2.1
x
2.0
x
1.5
x
1.3
x
1.2
x
1.1
x
1.1
x
0.4
x
0.0x
3.0x
6.0x
9.0x
12.0x
GLB
L
AX
Y
EG
PW
OR
A
GR
A
ALB IB
E
OTT
R
GLR
I
AB
G
CH
MT
AR
EV
A
PO
L
MC
P
Median: 2.0x

Baird’s Energy Technology Monthly December 2015
Robert W. Baird & Co. 5
Energy Technology Public Equity Offerings (Since December 2014)
Energy Technology Private Placement Transactions (Since December 2014)
Energy Technology M&A Transactions (Since December 2014)
_____________________
Source: Press releases, Baird, Cleantech Group, Capital IQ, Dealogic.
Dec-
14
Jan-
15
Feb-
15
Mar-
15
Apr-
15
May-
15
Jun-
15
Jul-
15
Aug-
15
Sep-
15
Oct-
15
Nov-
15
Dec-
15
Total 1 1 2 1 2 2 3 2 2 - 1 - 3
# o f IPOs - - - 1 - - 2 1 1 - - - 1
# o f Follow-ons 1 1 2 - 2 2 1 1 1 - 1 - 2
Deal Value $36 $405 $49 $145 $109 $52 $1,281 $701 $1,001 $- $104 $- $41
$0
$200
$400
$600
$800
$1,000
$1,200
$1,400
0
1
2
3
4
5
6
Deal V
alue ($M
)
# o
f D
eals
# o f Follow-ons # o f IPOs Deal Value
'14
YTD
'15
YTD
Total 29 19
# o f IPOs 7 6
# o f Follow-ons 22 13
Deal Value $2,923 $3,887
$0
$1,000
$2,000
$3,000
$4,000
0
5
10
15
20
25
30
Deal V
alue ($M
)
# o
f D
eals
Dec-
14
Jan-
15
Feb-
15
Mar-
15
Apr-
15
May-
15
Jun-
15
Jul-
15
Aug-
15
Sept-
15
Oct-
15
Nov-
15
Dec-
15
Total 61 44 45 40 41 36 37 30 40 31 22 39 41
# of Deals – Undisclosed 13 5 9 1 4 3 6 3 6 9 3 5 4
# of Deals – Disclosed 48 39 36 39 37 33 31 27 34 22 19 34 37
Deal Value $470 $353 $172 $278 $245 $280 $438 $345 $696 $440 $899 $887 $507
$0
$200
$400
$600
$800
$1,000
$1,200
0
20
40
60
80
100
Deal V
alue ($M
)
# o
f D
eals
# of Deals – Disclosed # of Deals – Undisclosed Deal Value
'14
YTD
'15
YTD
Total 564 446
# of Deals – Undisclosed 59 58
# of Deals – Disclosed 505 388
Deal Value $5,029 $5,540
$0
$1,000
$2,000
$3,000
$4,000
$5,000
$6,000
0
100
200
300
400
500
600
Deal V
alue ($M
)# o
f D
eals
Dec-
14
Jan-
15
Feb-
15
Mar-
15
Apr-
15
May-
15
Jun-
15
Jul-
15
Aug-
15
Sept-
15
Oct-
15
Nov-
15
Dec-
15
Total 10 14 21 18 14 13 15 20 17 10 10 10 6
# of Deals – VC Backed 1 2 4 2 2 3 1 6 4 2 1 3 2
# o f Deals 9 12 17 16 12 10 14 14 13 8 9 7 4
Deal Value $2,413 $1,283 $3,181 $346 $92 $649 $2,006 $15,855 $375 $2,344 $1,020 $135 $60
$0
$4,000
$8,000
$12,000
$16,000
0
10
20
30
Deal V
alue ($M
)
# o
f D
eals
# o f Deals # of Deals – VC Backed Deal Value
'14
YTD
'15
YTD
Total 183 168
# of Deals – VC Backed 30 32
# o f Deals 153 136
Deal Value $17,449 $27,345
$0
$5,000
$10,000
$15,000
$20,000
$25,000
$30,000
0
25
50
75
100
125
150
175
200
Deal V
alue ($M
)
# o
f D
eals

Baird’s Energy Technology Monthly December 2015
Robert W. Baird & Co. 6
Recent Energy Technology IPO Offerings & Registrations
($ in millions, except per share amounts)
Pricing/
Filing Date Ticker Company Subsector
Offering
Amount (1) Filing Range
Offer
Price
Offer to
Current (2)
12/17/15 BIQ BuildingIQ Energy Efficiency $14.3 N/A $0.73 27.2%
08/04/15 RUN SunRun Inc Solar 250.6 $13.00 - 15.00 14.00 (15.9%)
07/31/15 GLBL TerraForm Global Inc Solar 675.0 19.00 - 21.00 15.00 (62.7%)
06/25/15 GPP Green Plains Partners LP Biofuels 172.5 19.00 - 21.00 15.00 8.3%
06/18/15 CAFD 8point3 Energy Partners LP Solar 420.0 19.00 - 21.00 21.00 (23.1%)
03/25/15 SEDG SolarEdge Technologies Inc Solar 144.9 16.00 - 18.00 18.00 56.5%
11/13/14 SKYS Sky Solar Holdings Ltd Solar 50.8 7.00 - 8.00 8.00 (6.9%)
09/30/14 VSLR Vivint Solar, Inc. Solar 329.6 16.00 - 18.00 16.00 (40.3%)
07/28/14 SPKE Spark Energy Inc Energy 54.0 19.00 - 21.00 18.00 15.1%
07/17/14 TERP TerraForm Power, Inc. Solar 576.9 19.00 - 21.00 25.00 (49.7%)
06/26/14 NEP NextEra Energy Partners LP Energy 467.2 19.00 - 21.00 25.00 19.4%
06/12/14 ASPN Aspen Aerogels Inc. Energy Efficiency 82.5 14.00 - 16.00 11.00 (44.8%)
04/03/14 OPWR Opower Inc. Energy Efficiency 133.3 17.00 - 19.00 20.00 (44.4%)
08/01/13 MBII Marrone Bio Innovations Chemicals 57.0 14.00 - 17.00 12.00 (90.8%)
05/10/13 BIOA BioAmber Inc Biofuels 80.0 15.00 - 17.00 10.00 (38.2%)
04/17/13 HASI Hannon Armstrong Sustainable
Infrastructure Capital Inc
Energy Efficiency 176.9 14.00 - 16.00 12.50 51.4%
Recent Energy Technology Follow-On Offerings
($ in millions)
Pricing
Date Ticker Company Subsector
Offering
Amount (1) File to Offer
Last Trade to
Offer
Offer to
Current (2)
12/11/15 HYGS Hydrogenics Corp Energy Efficiency $16.5 (27.2%) 0.4% 13.2%
12/08/15 GEVO Gevo Inc Biofuels 10.0 (20.0%) 16.3% (38.0%)
10/14/15 HASI Hannon Armstrong Sustainable
Infrastructure Capital
Energy Efficiency 103.4 (4.4%) (4.4%) 5.1%
08/13/15 TSLA Tesla Motors Inc Transportation 750.0 1.6% (0.2%) (0.8%)
07/09/15 ESES Eco-Stim Energy Solutions Inc Energy Efficiency 26.1 (36.5%) (23.4%) (34.1%)
06/18/15 TERP TerraForm Power Inc Solar 688.3 (5.6%) (0.6%) (66.9%)
05/14/15 GEVO Gevo Inc Biofuels 17.2 (10.3%) (10.5%) (84.5%)
05/01/15 BIOA BioAmber Inc Biofuels 35.1 (14.4%) (14.4%) (31.3%)
04/29/15 HASI Hannon Armstrong Sustainable
Infrastructure Capital
Energy Efficiency 85.1 (4.3%) (4.3%) (2.3%)
04/24/15 AMSC American Superconductor Corp Wind 24.0 (39.4%) (40.0%) 6.2%
02/20/15 OESX Orion Energy Systems Inc Energy Efficiency 19.1 (25.7%) (12.7%) (38.0%)
02/05/15 DQ Daqo New Energy Corp Solar 30.0 (10.8%) (10.8%) (14.6%)
01/15/15 TERP TerraForm Power Inc Solar 404.8 (4.0%) 0.0% (57.1%)
12/11/14 HCCI Heritage-Crystal Clean Inc Business Services 35.7 (26.4%) (8.3%) 6.0%
10/27/14 HASI Hannon Armstrong Sustainable
Infrastructure Capital
Energy Efficiency 62.6 (4.8%) (4.8%) 39.1%
09/29/14 TSL Trina Solar Ltd Solar 88.1 (11.0%) (2.7%) (6.2%)
09/18/14 QRHC Quest Resource Holding Corp Energy Efficiency 17.9 (43.1%) (43.1%) (65.2%)
08/14/14 ENPH Enphase Energy Inc Solar 33.8 (9.1%) (9.1%) (66.6%)
07/31/14 GEVO Gevo Inc Biofuels 18.0 (17.1%) (17.1%) 3.3%
07/16/14 BIOA BioAmber Inc Biofuels 38.6 (15.6%) (15.6%) (48.5%)
06/05/14 MBII Marrone Bio Innovations Inc Chemicals 49.2 1.7% (1.0%) (88.4%)
06/05/14 TSL Trina Solar Ltd Solar 96.8 (11.2%) (5.2%) 0.2%
05/14/14 DQ Daqo New Energy Corp Solar 58.0 (23.2%) (0.3%) (42.6%)
05/13/14 HYGS Hydrogenics Corp Energy Efficiency 22.5 (23.4%) (23.4%) (41.5%)
05/01/14 CPST Capstone Turbine Corp Energy Storage 32.0 (17.5%) (17.5%) (17.6%)
_____________________
Source: Press releases, Baird, Cleantech Group, Capital IQ, Dealogic.
Note: Italics indicates registration has been filed but offering has not yet taken place. Shading indicates transactions with Baird involvement.
(1) For deals that have not yet taken place, offering amount is based on deal size listed on S-1 cover and is subject to change.
(2) As of December 31, 2015.
Baird’s Energy Technology Monthly December 2015
Robert W. Baird & Co. 7
Selected Recent Energy Technology Private Placement Transactions
($ in millions)
Date Company Description Subsector Value Investors
12/23/15 PsiKick Developer of ultra-low power sensors enabling
IoT
Electronic
Components
$16.5 New Enterprise Associates; Osage
Partners; University of Michigan
12/22/15 Lightsource
Wind
Investor, developer and operator of
renewable energy projects
Solar 0.3 Undisclosed Investor(s)
12/22/15 UniEnergy
Technologies
Produces large-scale energy storage systems
for utility, commercial and industrial sectors
Energy Storage N/A ORIX Capital
12/21/15 BBOXX Provider of plug & play solar systems from 3W
to 5kW for off-grid and on-grid solutions
Solar 15.0 Bamboo Finance; DOEN Foundation;
Khosla Impact; MacKinnon, Bennett &
Co; Synergy Growth
12/21/15 Scotrenewables Renewable energy R&D business involved in
the development of wind and marine energy
Hydro & Marine
Power
5.7 ABB Technology Ventures
12/21/15 Flux Factory Developer of collaborative efficient building
design software
Energy
Efficiency
29.0 South Park Ventures; Surbana Jurong;
Obvious Ventures; Borealis Ventures; Far East Organization; Draper Fisher
Jurvetson; Temasek Holdings
12/18/15 Micromem
Technologies
Developer of sensor technology for use across
oil and gas, auto and energy industries
Energy
Efficiency
0.1 Undisclosed Investor(s)
12/18/15 Sapphire Energy Developer of algae biofuels Biofuels &
Biochemicals
92.0 Undisclosed Investor(s)
12/17/15 Clear Blue
Technologies
Developer of a cloud platform that supports
Off-Grid renewable generation
Other Cleantech 1.9 Haywood Securities
12/16/15 Adama
Materials
Developer of nanotechnology to improve
composite materials
Advanced
Materials
0.8 Undisclosed Investor(s)
12/16/15 Senseye Developer of equipment monitoring systems Energy
Efficiency
0.3 Undisclosed Investor(s)
12/16/15 Sungevity Full-service provider of and platform for
residential solar systems
Solar 50.0 Apollo Global Management; Hercules
Technology Growth Capital; GE
Ventures; EFW Partners; Vision Ridge
Partners; Brightpath Capital Partners;
Firelake Capital Management; Jetstream
Capital; Craton Equity Partners; E.ON
Ventures
12/16/15 Blue River
Technology
Developer and provider of computer vision
based robotics for agricultural use
Agriculture &
Food
17.0 Pontifax; Syngenta Ventures; Monsanto;
Data Collective; Khosla Ventures; Innovation Endeavors
12/16/15 CircuitMeter Provides an integrated electrical submetering solution and cloud computing enterprise
energy management software
Energy Efficiency
1.3 Various Angel Investors
12/15/15 PointGrab Developer of a computer vision technology
that provides control around the house
Energy
Efficiency
5.0 ABB Technology Ventures; Saar Wilf;
EcoMachines Ventures
12/15/15 Elcomax Provider of high efficiency energy solutions
based on state-of-the-art fuel cell technology
Fuel Cells
Hydrogen
13.2 Emerald Technology Ventures; Kleiner
Perkins Caufield & Byers; Manfred
Stefener
12/15/15 SBA Materials Maker of nano-structured dielectrics and other
materials for energy storage and efficiency
Advanced
Materials
N/A Air Liquide Investissements d'Avenir et
de Démonstration (ALIAD); Tokyo
Electron Venture Capital Inc; Intel
Capital; Samsung Ventures; Sun
Mountain Capital
12/14/15 Atmotube Developer of a sensor that accurately
measures air pollution
Air 0.1 Indiegogo
12/14/15 Cathay
Industrial
Biotech
Developer of specialty chemicals, biopolymers
and biobutanol utilizing biotechnology
processes that reduce materials and energy
Biofuels &
Biochemicals
135.0 Shanxi Lu'an Mining Group
12/11/15 Verengo Solar Developer of residential solar arrays Solar 3.4 Undisclosed Investor(s)
12/11/15 Terrestrial
Energy
Developer of a proprietary reactor system,
the Integral Molten Salt Reactor
Nuclear 0.9 Undisclosed Investor(s)
12/11/15 Calico Energy Provides a software platform for smart-grid
data management for energy providers
Smart Grid 6.7 Undisclosed Investor(s)
12/09/15 Greensmith Provider of grid-scale energy storage software and integration solutions
Energy Storage 18.3 E.ON Ventures; American Electric Power
12/09/15 Prieto Battery Developer of proprietary Li-ion battery technology using a 3-dimensional solid-state
architecture comprised of non-toxic materials
Energy Storage 0.1 Undisclosed Investor(s)
12/09/15 Magna Imperio
Systems
Developer of generation assets powered by
salt water
Hydro & Marine
Power
0.3 Undisclosed Investor(s)
12/08/15 Younicos Provider of intelligent energy storage and
electrical grid solutions
Energy Storage 50.0 First Solar; Grupo ECOS
__________________
Source: Press releases, Baird, Cleantech Group, Capital IQ.

Baird’s Energy Technology Monthly December 2015
Robert W. Baird & Co. 8
Selected Recent Energy Technology M&A Transactions
($ in millions)
Date Target Target Description Subsector Acquiror Value
Revenue
Multiple (1)
12/23/15 Elvi System
Integration Division
Installs hybrid power plants and offers
storage, energy and system integration
services
Electrical
Components and
Equipment
Electro Power
Systems
N/A N/A
12/16/15 Specialised Energy
Solutions
Provides civil infrastructure solutions and
clean energy technologies
Clean Energy CleanSpark N/A N/A
12/09/15 Oxford Technologies Develops remote handling systems for
fission decommissioning and nuclear fusion
Industrial
Machinery
Kurion N/A N/A
12/09/15 Upwind Solutions Provides operations and maintenance
services for utility-scale wind projects
Wind Vestas $60.0 1.1x
12/04/15 Blade Dynamics Designs and manufactures high-performance wind turbine blades and coatings
Wind General Electric N/A N/A
12/02/15 K12Solar Provides solar electricity to schools and homeowners in the United States
Solar Tri Global Energy
N/A N/A
11/27/15 Smart Grid Application Business of Ingenu
Develops smart grid monitoring devices Energy Efficiency Trilliant N/A N/A
11/16/15 Solaire Generation Designs, manufactures and installs solar
parking structures
Solar SunPower N/A N/A
11/12/15 Cogenra Solar Provider of distributed PV and solar hot
water cogeneration solutions
Solar SunPower N/A N/A
11/12/15 Panoramic Power Provider of a cloud-based energy
management software platform
Energy Efficiency Direct Energy 60.0 N/A
11/12/15 Red Rock Biofuels Developer of advanced biofuel refinery
project
Biofuels &
Biochemicals
Joule N/A N/A
11/12/15 GridPoint Provider of smart energy solutions that
maintain sustainable energy management
Energy Efficiency TFC Utilities N/A N/A
11/11/15 dcFusion Provides independent DC power system
consulting services
Other Power Analytics N/A N/A
11/10/15 Dyadic Developer of enzyme and protein products
for the bioenergy
Biofuels &
Biochemicals
DuPont 75.0 N/A
11/09/15 GE Meters Manufacturer of electricity meters Smart Grid Aclara N/A N/A
11/04/15 Sentec Developer of hardware and software
solutions for smart metering
Smart Grid Sensus N/A N/A
10/27/15 Envirogen
Technologies
A provider of solutions for water treatment,
waste reduction and process improvement
Water &
Wastewater
Promethean
Investments
50.0 1.0
10/23/15 Infinis Developer of UK renewable projects Renewable
Energy
Terra Firma
Capital Partners
N/A N/A
10/22/15 Phoenix Energy
Technologies
Provider of enterprise energy management
software and services
Energy Efficiency Duke Energy N/A N/A
10/20/15 GeoLOGIC Systems Provider of data and integrated software
solutions for oil and gas exploration
Conventional
Fuels
BV Investment
Partners
N/A N/A
10/19/15 Hemisphere GPS Developer of precision agriculture
technologies
Agriculture &
Food
Novariant N/A N/A
10/16/15 Ag Connections Develops crop management software
solutions for farmers
Application
Software
Syngenta N/A N/A
10/15/15 Sakti3 Developer of advanced solid state lithium ion
battery technology
Energy Storage Dyson 90.0 N/A
10/14/15 Retroficiency Building efficiency audit software for utilities
and energy service providers
Energy Efficiency Ecova N/A N/A
10/08/15 Nautilus Solar Developer of distributed generation and
utility-scale solar PV systems
Solar Virgo
Investment
Group
N/A N/A
10/04/15 Acciona Windpower Provider of 1500kw and 3000kw rated power
wind turbines
Wind Nordex 880.0 N/A
09/30/15 New Energy Risk Developer of proprietary analytics, data and
computational models for renewables
Other XL Innovate N/A N/A
09/29/15 Akros Silicon Provider of integrated circuits for network-
based energy management
Energy Efficiency Kinetic
Technologies
N/A N/A
09/28/15 Arizona Chemical Provider and refiner of natural pine-based
chemicals using paper products
Biofuels &
Biochemicals
Kraton
Performance Polymers
1,370.0 1.6
09/24/15 Clearlogx Developer of control technology for water
treatment chemical dispensing systems
Water &
Wastewater
H2O Innovation N/A N/A
09/21/15 Pinova Holdings Provider of chemicals manufactured from
natural and renewable feedstocks
Biofuels &
Biochemicals
Symrise 417.0 N/A
____________
Source: Press releases, Baird, Cleantech Group, Capital IQ.
(1) Revenue multiple is LTM.

Baird’s Energy Technology Monthly December 2015
Robert W. Baird & Co. 9
Energy Technology Public Company Trading & Operating Statistics
($ in millions, except per share amounts)
Biofuels & Biomaterials
Efficiency / Smart Grid
Energy Storage / Transportation
_____________________
Source: Baird Equity Research, Capital IQ. As of December 31, 2015. Estimates calendarized for comparison purposes.
Note: Names in bold font are covered by Baird Equity Research. Baird estimates used where available.
Share Share Performance EV / Revenue EV / EBITDA Price / Earnings Revenue Growth Balance Sheet
Company Price Market Cap Net Debt Ent. Value Dec-15 LTM 2015E 2016P 2015E 2016P 2015E 2016P 2015E 2016P
Amy ris, Inc. $1.62 $311.3 $147.7 $458.7 (3.0%) (21.4%) 8.0 x 4.0 x N/M N/M N/M N/M 32.2% 98.4%
Codex is, Inc. 4.23 170.5 (17.0) 153.5 10.7% 67.9% 3.7 3.2 N/M N/M N/M N/M 18.5% 13.5%
Gev o, Inc. 0.62 11.8 21.6 33.4 (57.5%) (87.1%) 1.1 0.8 N/A N/M N/M N/M 9.3% 37.5%
Green Plains Inc. 22.90 867.7 151.8 1,180.8 (3.3%) (7.6%) 0.4 0.4 8.6 x 6.1 x 46.6 x 19.5 x (8.3%) 10.7%
Marrone Bio Innov ations, Inc. 1.10 26.9 30.8 57.7 (40.9%) (69.5%) 1.0 0.5 N/M N/M N/M N/M 556.7% 100.0%
Metabolix , Inc. 1.54 42.1 (17.9) 24.2 (25.6%) (37.6%) 7.9 5.9 N/M N/A N/M N/M 9.3% 34.0%
Nov ozy mes A/S 47.79 14,491.8 31.0 14,524.4 (2.6%) 27.3% 7.2 6.7 20.7 19.6 35.8 31.9 12.7% 6.4%
Renew able Energy Group, Inc. 9.29 430.7 201.6 635.7 3.1% (4.3%) 0.5 0.5 N/M 7.1 N/M 10.6 2.9% 6.7%
Rentech, Inc. 3.52 81.0 129.0 249.9 23.1% (72.1%) 0.6 1.1 N/A N/A N/M N/M (11.8%) (43.1%)
Solazy me, Inc. 2.48 199.7 84.6 284.3 (24.8%) (3.9%) 6.1 3.1 N/M N/M N/M N/M (22.6%) 95.9%
Mean (12.1%) (20.8%) 3.6 x 2.6 x 14.7 x 10.9 x 41.2 x 20.6 x 59.9% 36.0%
Median (3.2%) (14.5%) 2.4 2.1 14.7 7.1 41.2 19.5 9.3% 23.8%
Share Share Performance EV / Revenue EV / EBITDA Price / Earnings Revenue Growth Balance Sheet
Company Price Market Cap Net Debt Ent. Value Dec-15 LTM 2015E 2016P 2015E 2016P 2015E 2016P 2015E 2016P
Ameresco, Inc. $6.25 $290.7 $186.6 $477.3 (8.5%) (10.7%) 0.8 x 0.7 x 10.8 x 8.9 x 41.7 x 21.6 x 7.0% 4.3%
Aspen Aerogels, Inc. 6.07 140.3 (29.8) 110.4 (6.6%) (23.9%) 0.9 0.9 13.0 9.2 N/M N/M 18.2% (0.7%)
Digi International Inc. 11.38 290.9 (92.2) 198.7 (9.0%) 22.5% 0.9 0.9 12.3 9.4 37.2 30.1 10.7% 2.2%
Echelon Corporation 5.64 24.9 (25.1) 0.1 (11.5%) (66.8%) 0.0 N/A N/M N/A N/M N/A (0.9%) N/A
EnerNOC, Inc. 3.85 118.6 0.0 118.8 (9.6%) (75.1%) 0.3 0.3 N/M N/M N/M N/M (16.3%) (9.9%)
ESCO Technologies Inc. 36.14 933.1 10.6 943.7 (7.9%) (2.1%) 1.7 1.6 11.5 9.3 23.4 18.2 3.5% 5.9%
Hannon Armstrong Sustainable Infrastructure Capital, Inc. 18.92 724.1 740.5 1,464.5 8.4% 33.0% N/M N/M N/A N/A N/M 30.0 17.5% 46.4%
Itron, Inc. 36.18 1,371.1 281.7 1,672.2 0.6% (14.4%) 0.9 0.8 12.0 8.6 N/M 24.8 (4.4%) 7.9%
OPOWER, Inc. 10.56 547.2 (69.6) 477.6 12.5% (25.8%) 3.2 2.7 N/M N/M N/M N/M 15.2% 19.2%
PowerSecure International, Inc. 15.05 338.4 (7.0) 331.4 7.7% 29.2% 0.8 0.7 14.5 8.3 N/M 23.2 64.6% 20.3%
Silver Spring Networks, Inc. 14.41 725.4 (121.5) 604.0 8.1% 70.9% 2.1 1.9 N/M 19.6 N/M N/M 2.1% 9.7%
Mean (1.4%) (5.8%) 1.2 x 1.2 x 12.3 x 10.5 x 34.1 x 24.7 x 10.6% 10.5%
Median (6.6%) (10.7%) 0.9 0.9 12.1 9.2 37.2 24.0 7.0% 6.9%
Share Share Performance EV / Revenue EV / EBITDA Price / Earnings Revenue Growth Balance Sheet
Company Price Market Cap Net Debt Ent. Value Dec-15 LTM 2015E 2016P 2015E 2016P 2015E 2016P 2015E 2016P
AeroVironment, Inc. $29.47 $687.1 ($206.0) $481.1 15.2% 8.1% 1.8 x 1.7 x N/M 29.3 x N/M N/M 9.0% 7.7%
Ballard Pow er Sy stems Inc. 1.54 241.1 (40.4) 199.5 29.5% (9.3%) 3.5 2.1 N/M N/M N/M N/M (16.0%) 61.4%
BYD Company Ltd. 5.50 13,623.5 5,254.5 19,596.8 1.8% 40.5% 1.9 1.6 14.7 x 12.5 39.6 x 40.6 x 20.0% 21.5%
EnerSy s 55.93 2,483.1 347.1 2,841.1 (5.0%) (9.4%) 1.2 1.2 8.7 8.4 13.8 13.1 (8.1%) 2.0%
Hy drogenics Corporation 8.77 110.0 5.2 115.2 (20.8%) (34.0%) 3.3 2.0 N/M N/M N/M N/M (22.9%) 62.3%
FuelCell Energy Inc. 4.96 128.8 (36.7) 162.5 (52.2%) (73.2%) 1.0 0.7 N/M N/M N/M N/M (11.8%) 39.3%
Max w ell Technologies, Inc. 7.14 227.0 (24.7) 202.3 1.1% (21.7%) 1.2 1.2 N/M 23.0 N/M N/M (12.1%) (0.8%)
Plug Pow er Inc. 2.11 379.8 (75.4) 305.6 (4.1%) (29.7%) 3.0 2.0 N/M N/M N/M N/M 56.7% 49.7%
Tesla Motors, Inc. 240.01 31,429.5 1,419.7 32,849.3 4.2% 7.9% 6.2 4.0 N/M N/M N/M N/M 47.7% 53.7%
Mean (3.4%) (13.4%) 2.6 x 1.8 x 11.7 x 18.3 x 26.7 x 26.9 x 6.9% 33.0%
Median 1.1% (9.4%) 1.9 1.7 11.7 17.7 26.7 26.9 (8.1%) 39.3%

Baird’s Energy Technology Monthly December 2015
Robert W. Baird & Co. 10
Energy Technology Public Company Trading & Operating Statistics
($ in millions, except per share amounts)
Lighting
Natural Gas Technology
Recycling & Waste
_____________________
Source: Baird Equity Research, Capital IQ. As of December 31, 2015. Estimates calendarized for comparison purposes.
Note: Names in bold font are covered by Baird Equity Research. Baird estimates used where available.
Share Share Performance EV / Revenue EV / EBITDA Price / Earnings Revenue Growth Balance Sheet
Company Price Market Cap Net Debt Ent. Value Dec-15 LTM 2015E 2016P 2015E 2016P 2015E 2016P 2015E 2016P
Acuity Brands, Inc. $233.80 $10,236.2 ($404.4) $9,831.8 1.3% 66.9% 3.6 x 3.0 x 22.5 x 17.6 x 43.4 x 34.1 x 13.1% 20.9%
Cree, Inc. 26.67 2,748.2 (425.1) 2,323.1 (3.5%) (17.2%) 1.4 1.3 10.5 7.8 N/M 23.2 (1.8%) 11.8%
Hubbell Inc. 101.04 918.7 154.6 1,083.0 1.8% (5.4%) 0.3 0.3 2.0 1.8 N/A N/A 1.4% 3.1%
LSI Industries Inc. 12.19 299.4 (28.4) 271.0 3.1% 79.5% N/A N/A N/A N/A N/A N/A N/A N/A
Rubicon Technology , Inc. 1.14 29.9 (34.1) (4.2) 14.0% (75.1%) N/M N/M N/A N/A N/A N/M (48.2%) 10.7%
Zumtobel Group AG 25.11 1,083.5 201.6 1,290.2 12.8% 24.5% 0.9 0.8 9.2 7.4 32.5 14.0 6.6% 4.4%
Mean 4.9% 12.2% 1.6 x 1.4 x 11.0 x 8.7 x 37.9 x 23.8 x (5.8%) 10.2%
Median 2.4% 9.5% 1.1 1.0 9.9 7.6 37.9 23.2 1.4% 10.7%
Share Share Performance EV / Revenue EV / EBITDA Price / Earnings Revenue Growth Balance Sheet
Company Price Market Cap Net Debt Ent. Value Dec-15 LTM 2015E 2016P 2015E 2016P 2015E 2016P 2015E 2016P
Chart Industries Inc. $17.96 $548.6 $136.4 $691.3 (15.8%) (47.5%) 0.7 x 0.8 x 6.8 x 7.3 x 16.9 x 24.9 x (15.6%) (10.8%)
Clean Energy Fuels Corp. 3.60 326.1 408.2 761.1 (23.6%) (27.9%) 2.1 1.9 N/M N/M N/M N/M (14.7%) 10.9%
Fuel Sy stems Solutions, Inc. 4.89 88.5 (60.9) 27.5 (11.1%) (55.3%) 0.1 0.1 5.4 2.1 N/M N/M (22.7%) 9.0%
Pow er Solutions International, Inc. 18.25 196.2 140.5 336.7 (22.5%) (64.6%) 0.8 0.7 16.2 10.6 39.0 18.4 14.1% 13.2%
Westport Innov ations Inc. 1.99 127.7 24.1 150.8 (12.3%) (36.7%) 1.4 1.1 N/M N/M N/M N/M (16.0%) 22.8%
Mean (17.0%) (46.4%) 1.0 x 0.9 x 9.5 x 6.7 x 28.0 x 21.7 x (11.0%) 9.0%
Median (15.8%) (47.5%) 0.8 0.8 6.8 7.3 28.0 21.7 (15.6%) 10.9%
Share Share Performance EV / Revenue EV / EBITDA Price / Earnings Revenue Growth Balance Sheet
Company Price Market Cap Net Debt Ent. Value Dec-15 LTM 2015E 2016P 2015E 2016P 2015E 2016P 2015E 2016P
Casella Waste Sy stems Inc. $5.98 $245.0 $529.7 $774.6 (11.8%) 48.0% 1.4 x 1.4 x 7.3 x 6.8 x N/M N/M (2.7%) 2.9%
Covanta Holding Corporation 15.49 2,062.8 2,381.0 4,445.8 (4.1%) (29.6%) 2.7 2.7 10.6 10.2 N/M N/M (3.7%) 3.0%
Republic Serv ices, Inc. 43.99 15,275.0 7,458.5 22,735.9 0.1% 9.3% 2.5 2.4 8.8 8.5 21.5 x 20.4 x 3.9% 3.3%
US Ecology , Inc. 36.44 792.0 356.8 1,148.8 (3.7%) (9.2%) 2.1 2.2 9.3 9.1 21.3 19.6 22.7% (6.9%)
Waste Connections Inc. 56.32 6,891.8 1,953.9 8,852.0 3.3% 28.0% 4.2 4.0 12.5 11.7 28.7 26.0 1.4% 5.8%
Waste Management, Inc. 53.37 23,829.5 8,937.0 32,788.5 (0.7%) 4.0% 2.5 2.4 9.6 9.1 20.8 19.3 (6.9%) 3.2%
Mean (2.8%) 8.4% 2.6 x 2.5 x 9.7 x 9.2 x 23.1 x 21.3 x 2.4% 1.9%
Median (2.2%) 6.6% 2.5 2.4 9.4 9.1 21.4 20.0 (0.6%) 3.1%

Baird’s Energy Technology Monthly December 2015
Robert W. Baird & Co. 11
Energy Technology Public Company Trading & Operating Statistics
($ in millions, except per share amounts)
Solar
Yieldco
Water & Wastewater
_____________________
Source: Baird Equity Research, Capital IQ. As of December 31, 2015. Estimates calendarized for comparison purposes.
Note: Names in bold font are covered by Baird Equity Research. Baird estimates used where available.
Share Share Performance EV / Revenue EV / EBITDA Price / Earnings Revenue Growth Balance Sheet
Company Price Market Cap Net Debt Ent. Value Dec-15 LTM 2015E 2016P 2015E 2016P 2015E 2016P 2015E 2016P
Adv anced Energy Industries, Inc. $28.23 $1,158.6 ($199.0) $959.6 (3.2%) 19.1% 1.9 x 2.4 x 13.9 x 7.7 x 15.8 x 13.6 x (13.3%) (19.8%)
Canadian Solar Inc. 28.96 1,618.7 460.3 3,013.4 25.7% 19.7% 0.9 0.9 9.7 6.1 11.4 10.1 11.3% 0.2%
Daqo New Energy Corp. 16.65 174.9 231.2 408.6 5.2% (36.8%) 2.3 1.8 7.6 5.1 19.3 6.3 (2.7%) 30.2%
Enphase Energy , Inc. 3.51 159.1 (5.5) 153.6 110.2% (75.4%) 0.4 0.4 N/M N/M N/M N/M 4.1% 6.1%
First Solar, Inc. 65.99 6,659.7 (1,501.0) 5,158.7 16.8% 48.0% 1.5 1.3 7.2 8.9 15.0 15.9 4.5% 12.1%
GCL-Poly Energy Holdings Ltd. 0.15 2,781.6 5,940.7 9,127.0 (21.1%) (35.6%) 1.9 2.0 7.2 6.2 8.8 6.8 (0.8%) (6.0%)
JA Solar Holdings Co., Ltd. 9.70 489.6 459.3 978.4 11.1% 18.5% 0.5 0.4 3.8 3.7 6.2 5.3 18.6% 13.9%
JinkoSolar Holding Co., Ltd. 27.67 863.1 1,436.2 2,589.9 8.5% 40.4% 1.1 1.0 8.8 6.2 7.7 6.7 54.1% 10.4%
REC Silicon ASA 0.20 510.4 90.1 596.5 (10.8%) 0.5% 1.9 1.4 N/M 7.5 N/M N/M (35.7%) 33.1%
ReneSola Ltd. 1.70 173.9 664.0 837.9 31.8% 20.6% 0.7 0.7 8.0 7.0 N/M N/M (18.7%) (1.7%)
Sky Solar Holdings, Ltd. 7.45 363.2 (2.0) 398.3 7.9% (18.6%) 7.8 3.1 18.5 5.8 N/A 10.6 54.5% 157.0%
SMA Solar Technology AG 55.79 1,935.9 (268.6) 1,667.2 9.5% 238.0% 1.6 1.5 14.3 9.3 N/M 25.5 20.6% 2.9%
SolarCity Corporation 51.02 4,979.0 2,032.3 7,818.0 77.4% (4.6%) 20.0 12.5 N/M N/M N/M N/M 53.6% 59.7%
SolarEdge Technologies, Inc. 28.17 1,107.2 (146.7) 960.5 43.5% 56.5% 2.3 1.8 17.7 10.2 22.7 14.8 95.0% 29.7%
Solargiga Energy Holdings Limited 0.02 77.9 291.3 397.3 (4.6%) (32.9%) N/A N/A N/A N/A N/A N/A N/A N/A
SolarWorld AG 9.85 146.7 277.0 505.9 (3.9%) (29.8%) 0.6 0.5 11.8 5.2 N/M 13.3 22.7% 19.1%
SunEdison, Inc. 5.09 1,612.1 9,343.0 14,126.1 59.6% (73.9%) 6.1 4.1 N/M 16.7 N/M N/M (6.2%) 49.3%
SunPower Corporation 30.01 4,099.2 636.1 4,852.2 25.3% 16.2% 1.9 1.4 11.1 10.6 15.4 21.1 (3.6%) 36.2%
Sunrun Inc. 11.77 1,189.7 353.4 1,804.4 77.0% N/A 5.8 4.2 N/M N/M N/M N/M 56.8% 39.5%
Trina Solar Limited 11.02 1,015.7 1,182.1 2,239.6 14.2% 19.0% 0.8 0.7 7.3 5.5 9.9 8.3 27.0% 15.2%
Viv int Solar, Inc. 9.56 1,018.9 186.2 1,455.8 18.2% (40.3%) N/M 11.8 N/M N/M N/M N/M 168.7% 81.3%
Yingli Green Energy Holding Co. Ltd. 4.53 823.4 1,740.1 2,812.1 (30.8%) (80.7%) 1.8 1.7 13.5 9.3 N/M N/M (19.0%) 2.4%
Mean 21.2% 3.2% 3.1 x 2.6 x 10.7 x 7.7 x 13.2 x 12.2 x 23.4% 27.2%
Median 12.7% 0.5% 1.8 1.5 9.7 7.0 13.2 10.6 11.3% 15.2%
Share Share Performance EV / Revenue EV / EBITDA Price / Earnings Revenue Growth Balance Sheet
Company Price Market Cap Net Debt Ent. Value Dec-15 LTM 2015E 2016P 2015E 2016P 2015E 2016P 2015E 2016P
8point3 Energy Partners LP $16.14 $322.8 $259.1 $867.4 (23.1%) (23.1%) N/M 10.1 x N/M 9.1 x N/M 14.7 x 20.0% 494.4%
Abengoa Yield plc 19.29 1,933.2 6,469.4 8,544.4 33.2% (29.4%) 11.0 x 9.2 13.7 x 11.2 18.1 x 10.6 91.0% 18.9%
Nex tEra Energy Partners, LP 29.85 885.6 1,243.0 2,919.6 15.4% (11.6%) 6.0 3.6 7.2 4.5 42.9 23.5 61.7% 66.9%
NRG Yield, Inc. 13.91 1,407.8 4,494.0 6,249.8 2.4% (41.0%) 7.5 6.1 9.2 7.4 25.6 13.2 42.3% 24.2%
Pattern Energy Group Inc. 20.91 1,561.4 1,795.0 4,167.1 16.8% (15.2%) 12.1 8.7 17.1 11.7 N/M N/M 39.1% 38.7%
TerraForm Power, Inc. 12.58 1,006.8 1,910.6 4,235.9 82.3% (49.7%) 8.9 6.1 12.6 7.2 N/M 14.8 276.6% 45.4%
TerraForm Global, Inc. 5.59 652.4 131.4 1,341.7 38.7% (77.6%) 9.3 3.0 12.1 3.9 N/M 10.7 266.2% 213.8%
Mean 23.7% (35.4%) 9.1 x 6.7 x 12.0 x 7.9 x 28.8 x 14.6 x 113.9% 128.9%
Median 16.8% (29.4%) 9.1 6.1 12.4 7.4 25.6 13.9 61.7% 45.4%
Share Share Performance EV / Revenue EV / EBITDA Price / Earnings Revenue Growth Balance Sheet
Company Price Market Cap Net Debt Ent. Value Dec-15 LTM 2015E 2016P 2015E 2016P 2015E 2016P 2015E 2016P
American Water Works Company, Inc. $59.75 $10,723.3 $6,281.6 $17,004.9 3.4% 12.1% 5.4 x 5.1 x 11.1 x 10.5 x 22.5 x 21.3 x 4.6% 5.4%
Aqua America Inc. 29.80 5,257.6 1,752.7 7,010.2 1.5% 11.6% 8.6 8.0 15.4 13.7 23.5 22.1 4.2% 7.6%
Badger Meter Inc. 58.59 850.3 63.3 913.6 (3.7%) (1.3%) 2.5 2.4 14.8 13.4 31.3 27.9 2.0% 4.1%
Calgon Carbon Corporation 17.25 887.6 47.5 935.1 2.0% (17.0%) 1.8 1.6 9.2 7.8 20.8 17.1 (3.9%) 8.2%
Energy Recov ery , Inc. 7.07 387.7 (22.8) 364.9 (3.7%) 34.2% 3.1 4.4 5.1 8.4 6.9 19.4 284.0% (29.0%)
Nuv erra Env ironmental Solutions, Inc. 0.51 14.4 472.4 486.9 (37.7%) (90.8%) 1.4 1.6 11.1 12.1 N/M N/M (33.1%) (13.5%)
Pure Technologies Ltd. 3.34 177.5 (7.0) 170.5 (1.9%) (36.8%) 2.2 1.8 19.4 8.7 N/M 20.1 41.2% 23.9%
Veolia Env ironnement S.A. 23.59 12,936.8 9,811.1 24,027.8 (3.6%) 48.2% 0.9 0.9 7.9 7.4 24.7 20.8 5.4% 2.1%
Xylem Inc. 36.50 6,546.9 664.0 7,210.9 (2.2%) (4.1%) 2.0 1.9 11.9 11.3 19.7 17.6 (6.7%) 3.5%
Mean (5.1%) (4.9%) 3.1 x 3.1 x 11.8 x 10.4 x 21.4 x 20.8 x 33.1% 1.4%
Median (2.2%) (1.3%) 2.2 1.9 11.1 10.5 22.5 20.4 4.2% 4.1%

Baird’s Energy Technology Monthly December 2015
Robert W. Baird & Co. 12
Energy Technology Public Company Trading & Operating Statistics
($ in millions, except per share amounts)
Wind
Other
_____________________
Source: Baird Equity Research, Capital IQ. As of December 31, 2015. Estimates calendarized for comparison purposes.
Note: Names in bold font are covered by Baird Equity Research. Baird estimates used where available.
Share Share Performance EV / Revenue EV / EBITDA Price / Earnings Revenue Growth Balance Sheet
Company Price Market Cap Net Debt Ent. Value Dec-15 LTM 2015E 2016P 2015E 2016P 2015E 2016P 2015E 2016P
American Superconductor Corporation $6.37 $89.2 ($26.7) $62.5 35.2% (14.0%) 0.7 x 0.7 x N/M N/M N/M N/M 47.4% (1.0%)
Broadw ind Energy , Inc. 2.08 30.7 3.4 34.1 7.2% (61.4%) 0.2 0.1 8.4 x 3.6 x N/M N/M (12.9%) 8.7%
Capstone Turbine Corp. 1.40 24.0 4.8 28.8 (11.4%) (90.5%) 0.3 0.3 N/M N/M N/M N/M (19.5%) 14.2%
China Ming Yang Wind Pow er Group Limited 2.32 367.8 (48.0) 332.0 11.0% 5.9% N/A N/A N/A N/A N/A N/A N/A N/A
Gamesa Corporación Tecnológica S.A. 17.06 4,712.3 (80.7) 4,745.1 (4.5%) 109.3% 1.3 1.1 10.0 9.0 25.4 x 20.4 x 23.4% 9.0%
Nordex SE 35.33 2,857.3 (479.1) 2,378.2 3.0% 118.3% 0.9 0.7 11.8 8.0 34.1 23.4 36.6% 31.6%
Sinov el Wind Group Co., Ltd. 0.65 3,940.8 (171.4) 3,769.4 6.0% 37.7% N/A N/A N/A N/A N/A N/A N/A N/A
Vestas Wind Sy stems A/S 69.94 15,262.4 (1,951.4) 13,311.3 5.0% 113.6% 1.5 1.4 10.5 9.9 22.3 21.4 19.1% 4.2%
Mean 6.4% 27.4% 0.8 x 0.7 x 10.2 x 7.6 x 27.2 x 21.7 x 15.7% 11.1%
Median 5.5% 21.8% 0.8 0.7 10.2 8.5 25.4 21.4 21.3% 8.9%
Share Share Performance EV / Revenue EV / EBITDA Price / Earnings Revenue Growth Balance Sheet
Company Price Market Cap Net Debt Ent. Value Dec-15 LTM 2015E 2016P 2015E 2016P 2015E 2016P 2015E 2016P
Abengoa SA $0.44 $214.9 $8,278.9 $10,227.8 (43.8%) (80.7%) 1.3 x 1.3 x 7.6 x 7.4 x 1.3 x 3.2 x (2.7%) 2.4%
Albemarle Corporation 56.01 6,284.5 3,608.8 10,023.4 4.6% (6.9%) 2.8 2.7 10.6 10.6 15.3 15.1 47.5% 1.1%
Alterra Pow er Corp. 0.33 154.2 247.6 464.4 4.5% 41.5% 8.3 7.8 11.9 9.7 N/M 10.6 (21.6%) 7.6%
AREVA SA 5.85 2,236.7 6,594.0 9,246.1 (16.7%) (40.5%) 1.1 1.1 13.5 10.3 N/M 7.9 (2.7%) (6.6%)
Chemtura Corporation 27.27 1,831.8 200.0 2,032.8 (11.2%) 10.3% 1.2 1.2 8.2 6.8 19.8 16.1 (19.8%) (0.8%)
Enel Green Pow er S.p.A. 2.03 10,155.9 8,095.6 19,830.6 (5.8%) 8.6% 6.1 5.7 10.0 9.3 22.8 21.5 40.0% 7.9%
Glori Energy Inc. 0.35 11.2 2.7 13.8 (55.7%) (95.6%) 1.5 0.4 N/M 0.8 N/M 3.5 (41.4%) 271.0%
Iberdrola, S.A. 7.07 44,293.4 27,364.2 71,877.7 (1.2%) 17.0% 2.1 2.0 9.0 8.5 17.6 16.1 7.4% 3.6%
McPherson's Limited 0.53 51.8 56.7 108.5 6.5% (40.3%) 0.4 0.4 6.3 6.2 6.6 6.8 (0.1%) 1.9%
Ormat Technologies Inc. 36.47 1,788.3 780.2 2,663.9 (0.8%) 34.2% 4.6 4.3 9.3 8.9 15.1 20.9 3.6% 6.1%
Otter Tail Corporation 26.63 1,005.1 585.0 1,590.1 0.0% (14.0%) 2.0 1.9 9.5 8.7 16.6 15.7 (15.7%) 6.6%
PolyOne Corporation 31.76 2,740.5 864.1 3,605.7 (11.7%) (16.2%) 1.1 1.0 8.3 8.0 16.0 14.4 (11.0%) 3.1%
Sy nthesis Energy Sy stems, Inc. 0.96 83.3 (15.2) 66.8 7.8% 1.3% N/A N/A N/A N/A N/A N/A N/A N/A
W.R. Grace & Co. 99.59 7,034.8 1,890.9 8,930.1 1.4% 4.4% 2.9 2.8 11.9 11.2 21.4 20.1 (4.2%) 4.1%
Mean (8.7%) (12.6%) 2.7 x 2.5 x 9.7 x 8.2 x 15.3 x 13.2 x (1.6%) 23.7%
Median (1.0%) (2.8%) 2.0 1.9 9.4 8.7 16.3 15.1 (2.7%) 3.6%

Baird Energy Technology Investment Banking Franchise
Robert W. Baird & Co. 13
Baird’s Energy Technology investment banking team has established a track record of providing clients with comprehensive strategic advisory and capital markets services. Our transaction experience, ongoing projects and frequent dialogue with industry participants provide us with unique insight into the industries we serve. In addition to in-depth knowledge of the energy technology sector, Baird offers:
Unique insights on M&A environment and dynamics, company market positioning, M&A process strategy and potential buyers’ areas of interest
Tailored, objective solutions designed to achieve the greatest outcomes
A full-service capital markets team with extensive private and public equity expertise
Selected Baird 2014 - 2015 Transactions
Selected Energy Technology transactions shown. Please visit rwbaird.com/investment-banking for a list of all transactions.
$400,000,000
4.00%
Senior ConvertibleDebentures
Undisclosed Value
Sale of majority stake to$103,500,000
Common Stock
Follow-on Offering Initial Public Offering
$172,500,000
Common Unit
Initial Public Offering
$420,000,000
Common Stock$85,100,000
Common Stock
Follow-on Offering
Sale to$35,650,000
Common Stock
Follow-on Offering
$62,600,000
Common Stock
Follow-on Offering
Sale to
$158,000,000
A Div ision of
Acquisition of
$160,000,000
2.25%
Convertible Senior Secured Notes
$335,000,000
Sale of
to
$54,000,000
Common Stock
Initial Public Offering
$467,187,500
Common Stock
Initial Public Offering
$82,500,000
Common Stock
Initial Public Offering

Investment Banking Contact List
Robert W. Baird & Co. 14
Brian S. Doyal
Co-Head of Global
Investment Banking
+1.312.609.4916
Brian P. McDonagh
Co-Head of Global
Investment Banking
+1.704.553.6611
Rodney L. Jones-Tyson
Managing Director
Chief Operating Officer
+1.312.609.4984
Richard F. Waid
Vice Chairman
+1.404.264.2210
C.H. Randolph Lyon
Vice Chairman
+1.312.609.4931
Technology & Services
Peter S. Kies
Managing Director Head of Technology &
Services Investment
Banking
+1.414.765.7262 [email protected]
Daniel M. Alfe Managing Director
+1.312.609.4922
Stephen B. Guy
Managing Director
+1.414.765.7247
[email protected] Christopher W. Hildreth
Managing Director +1.312.609.4937
Michael Horwitz Managing Director
+1.415.627.3284
John R. Lanza
Managing Director
+1.414.298.7669 [email protected]
Mike Magluilo
Managing Director +1.303.413.3813
Kiran Paruchuru Managing Director
+1.414.298.7642
[email protected] Breton A. Schoch
Managing Director
+1.312.609.4965 [email protected]
Andrew K. Snow
Managing Director +1.312.609.4972
Ross W. Williams Managing Director
+1.414.298.6235
Jordan Klein
Director
+1.312.609.4978 [email protected]
Mathew Kessler Director
+1.415.627.3223
[email protected] Brian Cole
Director
+1.414.298.1702 [email protected]
Tim Shea
Director
+1.414.298.6203 [email protected]
.
Industrial
Paul T. Rogalski
Managing Director Head of Industrial
Investment Banking
+1.312.609.4912
[email protected] Christopher C. McMahon
Managing Director Head of Global M&A
+1.312.609.4983
Adam W. Czaia
Managing Director
+1.414.298.7358
[email protected] Justin T. Albert
Managing Director +1.303.270.6381
Joel A. Cohen Managing Director
+1.312.609.4924
Christopher R. Cooper
Managing Director
+1.704.553.6610 [email protected]
Stephen B. Guy Managing Director
+1.414.765.7247
Jason P. Kliewer
Managing Director
+1.813.273.8242 [email protected]
Thomas E. Lange
Managing Director +1.813.273.8248
Michael Lindemann Managing Director
+1.414.298.7408
[email protected] Joseph T. Packee
Managing Director
+1.414.298.7644
Trisha K. Renner Managing Director
+1.303.270.6347
Christian Colucci
Director
+1.312.609.4475 [email protected]
Alex Ballantine
Director +44.207.667.8242
Jon Fitzsimmons
Director +1.414.298.2460
David Schreiter Director
+44.207.667.8221
David Steinkeler Director
+312.609.7019
Consumer
Brian P. McDonagh
Managing Director Head of Consumer
Investment Banking
+1.704.553.6611
[email protected] Andrew Martin
Managing Director
+1.704.553.6615
Nicholas Pavlidis
Managing Director
+1.312.609.4977
[email protected] Joe Pellegrini
Managing Director
+1.704.553.6612 [email protected]
Robert Rosenfeld
Managing Director
+1.312.609.4971 [email protected]
Kurt Roth Managing Director
+1.312.609.4689
Christopher J. Sciortino
Managing Director +1.312.609.4923
Katie J. Melzer Director
+1.415.627.3272
[email protected] Matt Tingler
Director
+1.312.609.4470 [email protected]
Maria Watts
Director +1.312.609.4743
Matt Karns Director
+1.312.609.7045
Real Estate
Steven Goldberg
Managing Director
+1.703.918.7808 [email protected]
Jim O’Brien
Managing Director +1.703.918.7814
Jeff Rogatz Managing Director
+1.703.918.7823
[email protected] Adam Lefkowitz
Director
+1.703.918.7817 [email protected]
Thomas O’Hare
Director
+1.202.303.1811 [email protected]
Healthcare
Brian S. Doyal
Managing Director Head of Healthcare
Investment Banking
+1.312.609.4916
[email protected] Rob Andrews
Managing Director +1.312.609.5489
David S. Schechner Managing Director
+1.617.426.5424
Bill Suddath
Managing Director
+1.404.264.2222 [email protected]
Benjamin A. Brown
Director +1.414.298.7013
Manish Gupta Director
+1.414.765.3802
[email protected] Ryan Mausehund
Director
+1.650.858.3817 [email protected]
Chad W. Moore, CPA, CFA
Director +1.312.609.5475
James Weck Director
+1.312.609.4675
Energy
Curtis Goot
Managing Director
+1.314.445.6540 [email protected]
Kjell Lundal
Managing Director +1.314.445.6533
Frank Murphy Managing Director
+1.314.445.6532
[email protected] Nicholas Alfermann
Director
+1.314.445.6531 [email protected]
Financial Services
Mark C. Micklem
Managing Director +1.703.821.5787
Paul Egge Director
+1.202.303.1816
Financial Sponsors
C. Christopher Coetzee
Managing Director +1.312.609.4913
Leslie Cheek IV
Managing Director +1.617.426.5789
Vinay Ghai Managing Director
+44.207.667.8225
[email protected] Thomas W. Lacy
Managing Director
+1.414.298.7648 [email protected]
John Moriarty
Managing Director +1.650.424.3811
Jeffrey M. Seaman Managing Director
+1.312.609.4687
David M. Wierman
Managing Director
+1.404.264.2211
[email protected] Mergers & Acquisitions
Christopher C. McMahon
Managing Director Head of Global M&A
+1.312.609.4983
Brian P. McDonagh Managing Director
Co-Head of Global M&A
+1.704.553.6611 [email protected]
Owen L. Hart
Managing Director +1.415.627.3273
Howard P. Lanser
Managing Director +1.312.609.5478
Satoshi Matsumoto Managing Director
Director of Japan M&A
+1.646.557.3201
[email protected] J. David Cumberland, CFA
Director, M&A Research
+1.312.609.5429 [email protected]
Equity Capital Markets
Peter Kies
Managing Director Head of Equity Capital
Markets
+1.414.765.7262 [email protected]
Lance R. Lange
Managing Director
+1.414.765.7079
Gary R. Placek
Managing Director +1.414.765.3611
Debt Advisory
Howard P. Lanser
Managing Director +1.312.609.5478
Paul Bail
Managing Director +44.207.667.8271
Europe
London†
David M. Silver Managing Director
Head of European
Investment Banking +44.207.667.8216
John A. Fordham Chairman of Baird
International
+44.207.667.8438
[email protected] Nicholas R. Sealy
Managing Director
+44.207.667.8370 [email protected]
Paul Bail
Managing Director +44.207.667.8271
Jonathan Harrison
Managing Director +44.207.667.8414
Peter Augar Director
+44.207.667.8263
Martin Luen Director
+44.207.667.8381
John Sun
Director
+44.207.667.8224
Alex Ballantine
Director
+44.207.667.8242 [email protected]
David Schreiter
Director
+44.207.667.8221 [email protected]
Frankfurt
Joachim Beickler
Managing Director
+49.69.13.01.49.51 [email protected]
Michael Wolff
Managing Director
+49.69.13.01.49.49 [email protected]
Sven Harmsen
Managing Director +49.69.13.01.49.56
Asia
Shanghai
Anthony Siu
Managing Director
Head of Asia Investment Banking
+86.21.6182.0980
† Robert W. Baird Limited is authorized and regulated by the Financial Conduct Authority.

Appendix – Disclaimers and Other Disclosures
Robert W. Baird & Co. 15
DISCLAIMERS
This is not a complete analysis of every material fact regarding any company, industry or security. The opinions expressed here reflect our judgment at this date and are subject to change. The information has been obtained from
sources we consider to be reliable, but we cannot guarantee the accuracy.
ADDITIONAL INFORMATION ON COMPANIES MENTIONED HEREIN IS AVAILABLE UPON REQUEST
The Dow Jones Industrial Average, NASDAQ Composite, Russell 2000, S&P 500, S&P 400 and WilderHill NEX are unmanaged common stock indices used to measure and report performance of various sectors of the stock market; direct investment in indices is not available.
Baird is exempt from the requirement to hold an Australian financial services license. Baird is regulated by the United States Securities and Exchange Commission, FINRA, and various other self-regulatory organizations and those laws
and regulations may differ from Australian laws. This report has been prepared in accordance with the laws and regulations governing United States broker-dealers and not Australian laws.
Copyright 2015 Robert W. Baird & Co. Incorporated. No part of this publication may be reproduced or distributed in any form or by any means without our prior written approval. However, you may download one copy of the information for your personal, non-commercial viewing only, provided that you do not remove or alter any trade mark, copyright or other proprietary notice.
OTHER DISCLOSURES
UK disclosure requirements for the purpose of distributing this report into the UK and other countries for which Robert W Baird Limited holds an ISD passport.
This report is for distribution into the United Kingdom only to persons who fall within Article 19 or Article 49(2) of the Financial Services and Markets Act 2000 (financial promotion) order 2001 being persons who are investment
professionals and may not be distributed to private clients. Issued in the United Kingdom by Robert W Baird Limited, which has offices at Finsbury Circus House 15 Finsbury Circus, London, EC2M 7EB, and is a company authorized and regulated by the Financial Conduct Authority.
Robert W Baird Limited ("RWBL") is exempt from the requirement to hold an Australian financial services license. RWBL is regulated by the Financial Conduct Authority ("FCA") under UK laws and those laws may differ from Australian laws. This document has been prepared in accordance with FCA requirements and not Australian laws.

Robert W. Baird & Co. www.rwbaird.com 800.RW.BAIRD
Equity Capital Markets and Private Equity Office Locations
Atlanta
One Buckhead Plaza 3060 Peachtree Road
Suite 1815
Atlanta, GA 30305
Boston
One Post Office Square
Suite 3617
Boston, MA 02109
Boulder
One Boulder Plaza
1301 Canyon Blvd. - Suite 220
Boulder, CO 80302
Charlotte 6000 Fairview Road
Suite 1100
Charlotte, NC 28210
Chicago
227 West Monroe Street
Suite 2100
Chicago, IL 60606
Denver
210 University Boulevard
Suite 700
Denver, CO 80206
Frankfurt*
Neue Mainzer Strasse 28 60311 Frankfurt
Germany
London*
Finsbury Circus House
15 Finsbury Circus
London EC2M 7EB
UK
Milwaukee
777 East Wisconsin Avenue
Milwaukee, WI 53202
Nashville
2525 West End Avenue Suite 1000
Nashville, TN 37203
New York City
3 Rockefeller Plaza
610 Fifth Avenue
New York, NY 10020
Palo Alto
1661 Page Mill Road
Suite A
Palo Alto, CA 94304
San Francisco
50 California Street Suite 450
San Francisco, CA 94111
555 California Street
Suite 4900
San Francisco, CA 94104
Shanghai* Rm 42-022, 42/F, Hang Seng Bank Tower
No.1000 Lujiazui Ring Road
Pudong Shanghai 200120, China
St. Louis
8000 Maryland Avenue
Suite 500
St. Louis, MO 63105
Stamford
100 First Stamford Place
3rd Floor
Stamford, CT 06902
Tampa
3000 Bayport Drive Suite 760
Tampa, FL 33607
Washington, D.C.
1717 K Street NW
Suite 910
Washington, DC 20006
*Baird and its operating affiliates have offices in the United States, Europe and Asia.
Robert W. Baird & Co. Incorporated. Member SIPC. Robert W. Baird Ltd. and Baird Capital Partners Europe are authorized and regulated in the UK by the Financial Conduct Authority.
©2015 Robert W. Baird & Co. Incorporated.