Bactericidal effect of silver in cellulose acetate mixed ... · 4.6 Determination of the zeta...
100
Bactericidal effect of silver in cellulose acetate mixed matrix membranes Silver nanoparticles vs silver loaded zeolite Ana Rita Batista Vilas Boas Thesis to obtain the Master of Science Degree in Integrated Master in Chemical Engineering Supervisors: Prof. Maria Amélia Nortadas Duarte de Almeida Lemos Prof. Maria Norberta Neves Correia de Pinho Examination Committee Chairperson: Prof. José Manuel Félix Madeira Lopes Supervisor: Prof. Maria Amélia Nortadas Duarte de Almeida Lemos Members of the Committee: Prof. Eduardo Jorge Morilla Filipe December 2016
-
Upload
truongphuc -
Category
Documents
-
view
216 -
download
0
Transcript of Bactericidal effect of silver in cellulose acetate mixed ... · 4.6 Determination of the zeta...

Bactericidal effect of silver in cellulose acetate mixed
matrix membranes
Silver nanoparticles vs silver loaded zeolite
Ana Rita Batista Vilas Boas
Thesis to obtain the Master of Science Degree in
Integrated Master in Chemical Engineering
Supervisors:
Prof. Maria Amélia Nortadas Duarte de Almeida Lemos
Prof. Maria Norberta Neves Correia de Pinho
Examination Committee
Chairperson: Prof. José Manuel Félix Madeira Lopes
Supervisor: Prof. Maria Amélia Nortadas Duarte de Almeida Lemos
Members of the Committee: Prof. Eduardo Jorge Morilla Filipe
December 2016

Bactericidal effect of silver in cellulose acetate mixed
matrix membranes
Silver nanoparticles vs silver loaded zeolite
Ana Rita Batista Vilas Boas
Thesis to obtain the Master of Science Degree in
Integrated Master in Chemical Engineering
Supervisors:
Prof. Maria Amélia Nortadas Duarte de Almeida Lemos
Prof. Maria Norberta Neves Correia de Pinho
Dr. Ricardo Jaime Pereira Rosário dos Santos
Sílvia Patrícia Nunes Monteiro
Examination Committee
Chairperson: Prof. José Manuel Félix Madeira Lopes
Supervisor: Prof. Maria Amélia Nortadas Duarte de Almeida Lemos
Members of the Committee: Prof. Eduardo Jorge Morilla Filipe
December 2016


i
ACKNOWLEDGEMENTS
Gostaria de agradecer aos meus orientadores, Professora Amélia Lemos, Professora Norberta de
Pinho, Ricardo Santos e Sílvia Monteiro, e ao Professor Francisco Lemos, pela orientação, apoio e
transferência de conhecimento que me possibilitaram a realização desta tese.
A todos os que me ajudaram nos diferentes laboratórios que frequentei pela simpatia e por me
fazerem sentir à-vontade para fazer todas as perguntas.
Gostaria de agradecer o apoio da minha família e dos meus amigos, pelo ânimo que me deram ao
longo destes meses e por ouvirem os meus constantes desabafos.
Um agradecimento especial à minha mãe, ao meu pai e ao meu avô pelo incentivo e apoio
constantes, por me ouvirem sempre e pelos bons conselhos.
Ao Gonçalo pelo apoio incondicional, pela paciência, pela óptima companhia, por sempre acreditar
nas minhas capacidades e me ajudar a chegar a este momento.

ii
RESUMO
A nanofiltração é afectada pelo biofouling, que pode ser minimizado utilizando membranas de matriz
mista com propriedades antibacterianas. Assim, foram preparadas sete membranas de matriz mista
assimétricas de acetato de celulose através do método de inversão de fases incorporando, nas
soluções poliméricas de preparação das membranas, nanopartículas de prata, zeólito ZSM-5 e
diferentes teores de zeólitos permutados com prata (0,005%, 0,03%, 0,07% e 0,14% de prata na
membrana), composições estas confirmadas por termogravimetria.
A formação de nanopartículas de prata, utilizando nitrato de prata, borohidreto de sódio (agente
redutor) e PVP (agente estabilizante), pode ser descrita por uma cinética de segunda ordem. A
adição de formamida a nitrato de prata forma partículas de prata com diferentes distribuições de
tamanho. Pode-se afirmar que as nanopartículas de prata, assim como o aumento da concentração
de zeólito permutado com prata e ao contrário do zeólito ZSM-5, aumentam a permeabilidade
hidráulica das membranas de acetato de celulose. A incorporação destes materiais diminui os
coeficientes de rejeição para glucose, NaCl, Na2SO4, MgCl2 e MgSO4, assim como o potencial zeta
das membranas. A prata presente no zeólito, tanto em pó como na membrana, está na forma
catiónica, como observado por voltametria cíclica. A membrana de zeólito com prata (0,14% de prata)
apresentou o menor crescimento bacteriano de Escherichia coli e Pseudomonas aeruginosa após 300
minutos. O zeólito ZSM-5 não teve efeito bactericida contra as culturas, ao contrário do zeólito
permutado com prata que apresentou maior efeito contra E. coli.
Palavras-Chave: Membranas de acetato de celulose; Membranas nanocompósitas; Nanopartículas
de prata; Zeólito ZSM-5; Propriedades bactericidas

iii
ABSTRACT
Nanofiltration is still affected by biofouling, which can be minimized using mixed matrix membranes
with antibacterial properties. Thus, seven cellulose acetate asymmetric composite membranes were
prepared via the wet-phase inversion method incorporating, in the membrane casting solutions, silver
nanoparticles, ZSM-5 zeolite and different contents of silver exchanged zeolite (0,005%, 0,03%,
0,07% and 0,14% of silver in the membrane), which compositions were confirmed by
thermogravimetric analysis.
The silver nanoparticles formation, using silver nitrate, sodium borohydride (reducing agent) and PVP
(stabilising agent), can be described by a second order kinetics. The addition of formamide to silver
nitrate forms silver particles with different size distributions. It can be stated that silver nanoparticles
increase the hydraulic permeability of cellulose acetate membranes, contrary to ZSM-5 zeolite, and
the increasing concentration of silver exchanged zeolite increases this parameter. The incorporation of
these materials decreases the rejection coefficients to glucose, NaCl, Na2SO4, MgCl2 and MgSO4, as
the zeta potential of the membranes. The silver present in the zeolite, both in powder and in the
membrane, is in the cationic form, as seen in the cyclic voltammetry curves. The silver zeolite
membrane (0,14% silver) showed the lowest bacterial growth of Escherichia coli and Pseudomonas
aeruginosa after 300 minutes. The ZSM-5 zeolite had no bactericidal effect against the cultures,
contrary to the silver exchanged zeolite that showed higher effect against E. coli.
Keywords: Cellulose acetate membranes; Nanocomposite membranes; Silver nanoparticles; ZSM-5
zeolite; Antibacterial properties

iv
CONTENTS
Acknowledgements ...................................................................................................................................i
Resumo .................................................................................................................................................... ii
Abstract.................................................................................................................................................... iii
Contents .................................................................................................................................................. iv
List of Figures .......................................................................................................................................... vi
List of Tables .......................................................................................................................................... xii
Symbols ................................................................................................................................................. xiii
1 Introduction ...................................................................................................................................... 1
1.1 Objectives of the thesis ........................................................................................................... 2
1.2 Thesis structure ....................................................................................................................... 2
2 Literature Review ............................................................................................................................. 3
2.1 Nanofiltration and its applications ............................................................................................ 3
2.1.1 Water Treatment .............................................................................................................. 4
2.1.2 Food and pharmaceutical industry .................................................................................. 6
2.2 Membranes .............................................................................................................................. 6
2.2.1 Membranes structure ....................................................................................................... 7
2.2.2 Membrane separation processes .................................................................................... 9
2.3 Fouling ................................................................................................................................... 10
2.3.1 Conventional disinfection methods ................................................................................ 12
2.3.2 Use of silver nanoparticles ............................................................................................ 14
2.3.3 Use of zeolites ............................................................................................................... 16
3 Experimental .................................................................................................................................. 19
3.1 Experimental planning ........................................................................................................... 19
3.2 Manufacturing of the membranes .......................................................................................... 19
3.2.1 Preparation of silver nanoparticles ................................................................................ 19
3.2.2 Preparation of the zeolite ............................................................................................... 20
3.2.3 Preparation of the casting solutions .............................................................................. 21
3.2.4 Casting of the membranes ............................................................................................ 23
3.2.5 Annealing treatment ...................................................................................................... 24
3.3 Evaluation of the permeation performance ........................................................................... 24

v
3.3.1 Set-up ............................................................................................................................ 24
3.3.2 Compaction of the membranes ..................................................................................... 26
3.3.3 Hydraulic Permeability ................................................................................................... 26
3.3.4 Rejection Coefficients to Solutes ................................................................................... 26
3.3.5 Conductivity measurement ............................................................................................ 27
3.3.6 Total organic carbon measurement ............................................................................... 28
3.4 Characterization techniques .................................................................................................. 29
3.4.1 UV-Vis Spectroscopy ..................................................................................................... 29
3.4.2 Electrochemical studies ................................................................................................. 30
3.4.3 Thermogravimetric analysis ........................................................................................... 31
3.4.4 Determination of the zeta potential ................................................................................ 32
3.5 Evaluation of the bactericidal properties ............................................................................... 34
4 Results and Discussion ................................................................................................................. 37
4.1 Hydraulic Permeability ........................................................................................................... 37
4.2 Rejection Coefficients to Solutes ........................................................................................... 41
4.3 UV-Vis Spectroscopy ............................................................................................................. 43
4.4 Electrochemical studies ......................................................................................................... 45
4.4.1 Zeolite/Graphite Pellet ................................................................................................... 46
4.4.2 Membranes .................................................................................................................... 50
4.5 Thermogravimetric analysis ................................................................................................... 51
4.6 Determination of the zeta potential ........................................................................................ 53
4.7 Evaluation of the bactericidal properties ............................................................................... 54
5 Conclusions ................................................................................................................................... 61
5.1 Perspectives for future work .................................................................................................. 63
Bibliography ........................................................................................................................................... 65
A. Appendix .......................................................................................................................................... 1
A.1 Manufacturing of the membranes ............................................................................................ 1
Preparation of silver nanoparticles .................................................................................................. 1
A.2 Determination of the zeta-potential ......................................................................................... 1
A.3 Thermogravimetric analysis ..................................................................................................... 1
A.4 Evaluation of the bactericidal properties ................................................................................. 9

vi
LIST OF FIGURES
Figure 1-1 – Freshwater availability in 2007 (UNEP 2008). .................................................................... 1
Figure 2-1 – Types of membranes and characteristics (adapted from (X-Flow n.d.))............................. 3
Figure 2-2 – Schematic representation of symmetric membrane structures: A) porous cylindrical; B)
porous web or sponge; C) dense polymer film (Pinnau and Freeman 1999). ........................................ 7
Figure 2-3 – Asymmetric membrane structure (Scott and Hughes 1997). .............................................. 8
Figure 2-4 – Schematic representation of asymmetric membrane structures: A) integrally-skinned
(porous skin layer); B) integrally-skinned (non-porous skin layer) – a) selective skin layer (material A) –
b) microporous support (material A); C) thin-film composite – a) selective coating layer (material A) –
b) microporous support (material B) (Pinnau and Freeman 1999). ........................................................ 8
Figure 2-5 – Cross-flow membrane separation (Scott and Hughes 1997). ........................................... 10
Figure 2-6 – Mechanisms of organic fouling formation: a) complete pore blocking; b) intermediate
blocking; c) standard blocking; d) cake-layer formation (Zhang et al. 2015). ....................................... 10
Figure 2-7 – Schematic, sequential presentation of the steps in biofilm formation (adapted from
(Gottenbos, Van Der Mei, and Busscher 1999)). .................................................................................. 12
Figure 2-8 – Microbial Growth Curve in a Closed System (Prescott, Klein, and Harley 2002). ............ 12
Figure 2-9 – ZSM-5 framework viewed along [010] (Structure Commission of the International Zeolite
Association (IZA) 2007). ........................................................................................................................ 17
Figure 3-1 – Flowchart of the experiments performed. ......................................................................... 19
Figure 3-2 – Silver nanoparticles suspension. ...................................................................................... 20
Figure 3-3 – ZSM-5 zeolite after calcination: A) zeolite without silver; B) zeolite with embedded silver.
............................................................................................................................................................... 21
Figure 3-4 – P Selecta Vibromatic mechanical agitator. ....................................................................... 21
Figure 3-5 – Comparison of the casting solutions with zeolite and silver loaded zeolite with A: 0%; B:
0,005%; C: 0,03% and D: 0,07% of silver in the casting solution. ........................................................ 23
Figure 3-6 – Casting set-up: A) Casting support; B) Casting knife; C) Coagulation bath. .................... 23
Figure 3-7 – Casting process (Beisl 2015). ........................................................................................... 24
Figure 3-8 – Annealed membranes: A) CA400-30; B) CA400-30ZSM5; C) CA400-30Ag0,14; D)
CA400-30ZAg0,005; E) CA400-30ZAg0,03; F) CA400-30ZAg0,07. ..................................................... 24
Figure 3-9 – Ultrafiltration installation. ................................................................................................... 25
Figure 3-10 – Nanofiltration installation. ................................................................................................ 25
Figure 3-11 – Permeation cell used in ultra and nanofiltration installations. ......................................... 25
Figure 3-12 – Cell cross-section. 1. Feed inlet; 2. Feed outlet; 3. Permeate outlet; 4. Porous stainless
steel plate (membrane support) (Afonso and De Pinho 1990). ............................................................. 25
Figure 3-13 – Conductivity calibration curve for NaCl at 25℃............................................................... 27
Figure 3-14 – Conductivity calibration curve for Na2SO4 at 25℃ .......................................................... 27
Figure 3-15 – Conductivity calibration curve for MgCl2 at 25℃ ............................................................. 28
Figure 3-16 – Conductivity calibration curve for MgSO4 at 25℃. .......................................................... 28
Figure 3-17 – Shimadzu Total Organic Carbon Analyser TOC-VCSH. ................................................... 28
Figure 3-18 – TOC calibration curve for glucose (𝑪 (𝒑𝒑𝒎) = 𝟎, 𝟔𝟐𝟐𝟕 ∙ 𝑨𝒓𝒆𝒂 − 𝟏𝟐, 𝟑𝟗, 𝑹𝟐 = 𝟎, 𝟗𝟗𝟗𝟑). 29

vii
Figure 3-19 – UV-Vis spectrophotometer. ............................................................................................. 29
Figure 3-20 – Schematic representation of the electrodes used: A) zeolite/graphite pellet; B)
membrane; C) membrane/graphite pellet. ............................................................................................. 30
Figure 3-21 – Pellet press assembly layout. ......................................................................................... 30
Figure 3-22 – PIKE CrushIR hydraulic press. ....................................................................................... 30
Figure 3-23 – Electrochemical cell used to study the electrochemical behaviour of silver entrapped
inside zeolites. ....................................................................................................................................... 30
Figure 3-24 – Potentiostat/Potential programmer and data acquisition unit for cyclic voltammetry. .... 31
Figure 3-25 – STA 6000 from PerkinElmer. .......................................................................................... 32
Figure 3-26 – TGA data acquisition unit. ............................................................................................... 32
Figure 3-27 – Temperature scanning programme: A) 30℃ for 10 min; B) 30℃ to 110℃, 10℃/min; C)
110℃ for 15 min; D) 110℃ to 800℃, 10℃/min; E) 800℃ for 10 min; F) 800℃ to 30℃, 50℃/min. ....... 32
Figure 3-28 – Schematic representation of the electrochemical double layer (adapted from (Delgado et
al. 2005))................................................................................................................................................ 33
Figure 3-29 – EKA Electro Kinetic Analyser from Anton Paar (GmbH 2003). ...................................... 34
Figure 3-30 – Dilutions of the collected samples (adapted from (Prescott, Klein, and Harley 2002)). . 35
Figure 3-31 – Spread-Plate Technique (Prescott, Klein, and Harley 2002). ......................................... 35
Figure 3-32 – Tripartite petri dish with spread zeolite. .......................................................................... 35
Figure 4-1 – Pure water fluxes of the ultrafiltration membranes at a pressure range of 1 - 5 bar. ....... 37
Figure 4-2 – Pure water fluxes of the UFCA400-30 membrane at a pressure range of 1 - 5 bar ......... 37
Figure 4-3 – Pure water fluxes of the UFCA400-30ZSM5 membrane at a pressure range of 1 - 5 bar
(𝐽𝑝𝑤 [𝑘𝑔/(ℎ ∙ 𝑚2)] = 20,9 ∙ ∆𝑃 (𝑏𝑎𝑟), 𝑅2 = 0,9965). ............................................................................... 37
Figure 4-4 – Pure water fluxes of the UFCA400-30Ag0,14 membrane at a pressure range of 1 - 5 bar
(𝐽𝑝𝑤 [𝑘𝑔/(ℎ ∙ 𝑚2)] = 61,6 ∙ ∆𝑃 (𝑏𝑎𝑟), 𝑅2 = 0,9971). ............................................................................... 37
Figure 4-5 – Pure water fluxes of the UFCA400-30ZAg0,005 membrane at a pressure range of 1 - 5
bar (𝐽𝑝𝑤 [𝑘𝑔/(ℎ ∙ 𝑚2)] = 12,6 ∙ ∆𝑃 (𝑏𝑎𝑟), 𝑅2 = 0,9991). ......................................................................... 37
Figure 4-6 – Pure water fluxes of the UFCA400-30ZAg0,03 membrane at a pressure range of 1 - 5 bar
(𝐽𝑝𝑤 [𝑘𝑔/(ℎ ∙ 𝑚2)] = 18,0 ∙ ∆𝑃 (𝑏𝑎𝑟), 𝑅2 = 0,9936). ............................................................................... 38
Figure 4-7 – Pure water fluxes of the UFCA400-30ZAg0,07 membrane at a pressure range of 1 - 5 bar
(𝐽𝑝𝑤 [𝑘𝑔/(ℎ ∙ 𝑚2)] = 41,8 ∙ ∆𝑃 (𝑏𝑎𝑟), 𝑅2 = 0,9933). ............................................................................... 38
Figure 4-8 – Pure water fluxes of the UFCA400-30ZAg0,14 membrane at a pressure range of 1 - 5 bar
(𝐽𝑝𝑤 [𝑘𝑔/(ℎ ∙ 𝑚2)] = 28,4 ∙ ∆𝑃 (𝑏𝑎𝑟), 𝑅2 = 0,9995). ............................................................................... 38
Figure 4-9 – Comparison of the hydraulic permeability of the ultrafiltration membranes. ..................... 38
Figure 4-10 – Pure water fluxes of the nanofiltration membranes at a pressure range of 5 - 40 bar. .. 39
Figure 4-11 – Pure water fluxes of the NFCA400-30 membrane at a pressure range of 5 - 40 bar ..... 39
Figure 4-12 – Pure water fluxes of the NFCA400-30ZSM5 membrane at a pressure range of 5 - 40 bar
(𝐽𝑝𝑤 [𝑘𝑔/(ℎ ∙ 𝑚2)] = 1,9 ∙ ∆𝑃 (𝑏𝑎𝑟), 𝑅2 = 0,9992). ................................................................................. 39
Figure 4-13 – Pure water fluxes of the NFCA400-30Ag0,14 membrane at a pressure range of 5 - 40
bar (𝐽𝑝𝑤 [𝑘𝑔/(ℎ ∙ 𝑚2)] = 3,3 ∙ ∆𝑃 (𝑏𝑎𝑟), 𝑅2 = 0,9918). ........................................................................... 39

viii
Figure 4-14 – Pure water fluxes of the NFCA400-30ZAg0,005 membrane at a pressure range of 5 - 40
bar (𝐽𝑝𝑤 [𝑘𝑔/(ℎ ∙ 𝑚2)] = 1,6 ∙ ∆𝑃 (𝑏𝑎𝑟), 𝑅2 = 0,9993). ........................................................................... 39
Figure 4-15 – Pure water fluxes of the NFCA400-30ZAg0,03 membrane at a pressure range of 5 - 40
bar (𝐽𝑝𝑤 [𝑘𝑔/(ℎ ∙ 𝑚2)] = 1,7 ∙ ∆𝑃 (𝑏𝑎𝑟), 𝑅2 = 0,9925). ........................................................................... 40
Figure 4-16 – Pure water fluxes of the NFCA400-30ZAg0,07 membrane at a pressure range of 5 - 40
bar (𝐽𝑝𝑤 [𝑘𝑔/(ℎ ∙ 𝑚2)] = 2,6 ∙ ∆𝑃 (𝑏𝑎𝑟), 𝑅2 = 0,9989). ........................................................................... 40
Figure 4-17 – Pure water fluxes of the NFCA400-30ZAg0,14 membrane at a pressure range of 5 - 40
bar (𝐽𝑝𝑤 [𝑘𝑔/(ℎ ∙ 𝑚2)] = 1,4 ∙ ∆𝑃 (𝑏𝑎𝑟), 𝑅2 = 0,9942). ........................................................................... 40
Figure 4-18 – Comparison of the hydraulic permeability of the nanofiltration membranes. .................. 40
Figure 4-19 – Rejection coefficients for NaCl, Na2SO4, MgCl2, MgSO4 and glucose for ultrafiltration
membranes. ........................................................................................................................................... 41
Figure 4-20 – Rejection coefficients for NaCl, Na2SO4, MgCl2, MgSO4 and glucose for nanofiltration
membranes. ........................................................................................................................................... 42
Figure 4-21 – UV absorption spectra normalized by peak of silver nanoparticles suspension at
different time periods. ............................................................................................................................ 44
Figure 4-22 – UV absorption spectra normalized by area of silver nanoparticles suspension at different
time periods. .......................................................................................................................................... 44
Figure 4-23 – Effect of maturing time at initial concentration of 0,01 mL of reducing agent NaBH4. .... 44
Figure 4-24 – Variation of maximum absorbance with time in the formation of silver nanoparticles. ... 45
Figure 4-25 – UV absorption spectra of formamide addition to an aqueous solution of AgNO3
(dissolved with PVP). ............................................................................................................................. 45
Figure 4-26 – Cyclic voltammograms of calcined ZSM-5 zeolite and silver loaded zeolite (initial scan
towards negative potentials: -100mV → -800mV → 950mV → -100mV, scan rate: 10 mV/s, 1st cycle).46
Figure 4-27 – Cyclic voltammograms of calcined ZSM-5 zeolite and silver loaded zeolite (initial scan
towards negative potentials: -100mV → -800mV → 950mV → -100mV, scan rate: 10 mV/s, 2nd
cycle).
............................................................................................................................................................... 46
Figure 4-28 – Cyclic voltammogram of calcined silver loaded zeolite (initial scan towards positive
potentials: 0mV → 950mV → -800mV → 0mV, scan rate: 10 mV/s, 1st cycle). ..................................... 46
Figure 4-29 – Cyclic voltammogram of calcined silver loaded zeolite (initial scan towards positive
potentials: 0mV → 950mV → -800mV → 0mV, scan rate: 10 mV/s, 2nd
cycle). ..................................... 46
Figure 4-30 – Cyclic voltammograms of zeolite recovered from the casting solution of CA400-
30ZAg0,03 membrane (initial scan towards negative potentials: -100mV → -800mV → 950mV → -
100mV, scan rate: 10 mV/s, 1st cycle) and calcined silver exchanged zeolite. ..................................... 47
Figure 4-31 – Cyclic voltammograms of zeolite recovered from the casting solution of the CA400-
30ZAg0,03 membrane (initial scan towards negative potentials: -100mV → -800mV → 950mV → -
100mV, scan rate: 10 mV/s, 2nd
cycle) and calcined silver exchanged zeolite. .................................... 47
Figure 4-32 – Cyclic voltammograms of zeolite recovered from the casting solution of CA400-
30ZAg0,03 membrane (initial scan towards negative potentials: -100mV → -800mV → 950mV → -
100mV, scan rate: 10 mV/s, 1st cycle) and calcined silver exchanged zeolite. ..................................... 47

ix
Figure 4-33 – Cyclic voltammograms of zeolite recovered from the casting solution of the CA400-
30ZAg0,03 membrane (initial scan towards negative potentials: -100mV → -800mV → 950mV → -
100mV, scan rate: 10 mV/s, 2nd
cycle) and calcined silver exchanged zeolite. .................................... 47
Figure 4-34 – Cyclic voltammograms of zeolite recovered from the casting solution of CA400-
30ZAg0,03 membrane (initial scan towards positive potentials: -100mV → 950mV → -800mV → -
100mV, scan rate: 10 mV/s, 1st cycle) and calcined silver exchanged zeolite. ..................................... 48
Figure 4-35 – Cyclic voltammograms of zeolite recovered from the casting solution of CA400-
30ZAg0,03 membrane (initial scan towards positive potentials: -100mV → 950mV → -800mV → -
100mV, scan rate: 10 mV/s, 2nd
cycle) and calcined silver exchanged zeolite. .................................... 48
Figure 4-36 – Cyclic voltammograms of zeolite recovered from the casting solution of CA400-
30ZAg0,03 membrane (initial scan towards positive potentials: -100mV → 950mV → -800mV → -
100mV, scan rate: 10 mV/s, 1st cycle) and calcined silver exchanged zeolite. ..................................... 48
Figure 4-37 – Cyclic voltammograms of zeolite recovered from the casting solution of CA400-
30ZAg0,03 membrane (initial scan towards positive potentials: -100mV → 950mV → -800mV → -
100mV, scan rate: 10 mV/s, 2nd
cycle) and calcined silver exchanged zeolite. .................................... 48
Figure 4-38 – Six sequential cyclic voltammograms of calcined silver exchanged zeolite (initial scan
towards negative potentials: -100mV → -800mV → 950mV → -100mV, scan rate: 10 mV/s). .............. 49
Figure 4-39 – Time evolution of the cyclic voltammograms of calcined silver exchanged zeolite to
assess the silver ion leaching (initial scan towards negative potentials: 0mV → -800mV → 950mV →
0mV, scan rate: 10 mV/s). ..................................................................................................................... 49
Figure 4-40 – Cyclic voltammograms of UFCA400-30ZAg0,07 membrane, active face facing the
electrolyte and the electrode (initial scan towards negative potentials: -100mV → -800mV → 950mV →
-100mV, scan rate: 10 mV/s, 1st cycle). ................................................................................................. 50
Figure 4-41 – Cyclic voltammograms of UFCA400-30ZAg0,07 membrane, active face facing the
electrolyte and the electrode (initial scan towards negative potentials: -100mV → -800mV → 950mV →
-100mV, scan rate: 10 mV/s, 2nd
cycle). ................................................................................................ 50
Figure 4-42 – Cyclic voltammograms of UFCA400-30ZAg0,07 membrane, active face facing the
electrolyte and the electrode (initial scan towards positive potentials: -100mV → 950mV → -800mV →
-100mV, scan rate: 10 mV/s, 1st cycle). ................................................................................................. 50
Figure 4-43 – Cyclic voltammograms of UFCA400-30ZAg0,07 membrane, active face facing the
electrolyte and the electrode (initial scan towards positive potentials: -100mV → 950mV → -800mV →
-100mV, scan rate: 10 mV/s, 2nd
cycle). ................................................................................................ 50
Figure 4-44 – TG curve (weight as a function of time) of the seven prepared membranes. ................. 52
Figure 4-45 – TG curve (heat flow as a function of time) of the seven prepared membranes. ............. 52
Figure 4-46 – Samples weight at the end of the TGA programme and evaporated water percentage. 53
Figure 4-47 – Zeta potentials in the range of pH 4 – 9. ......................................................................... 54
Figure 4-48 – Bactericidal effect of NFCA400-30, NFCA400-30ZSM5 and NFCA400-30Ag0,14
membranes against P. aeruginosa (1st). ............................................................................................... 55
Figure 4-49 – Bactericidal effect of NFCA400-30ZAg0,005, NFCA400-30ZAg0,03 and NFCA400-
30ZAg0,07 membranes against P. aeruginosa (1st). ............................................................................. 55
x
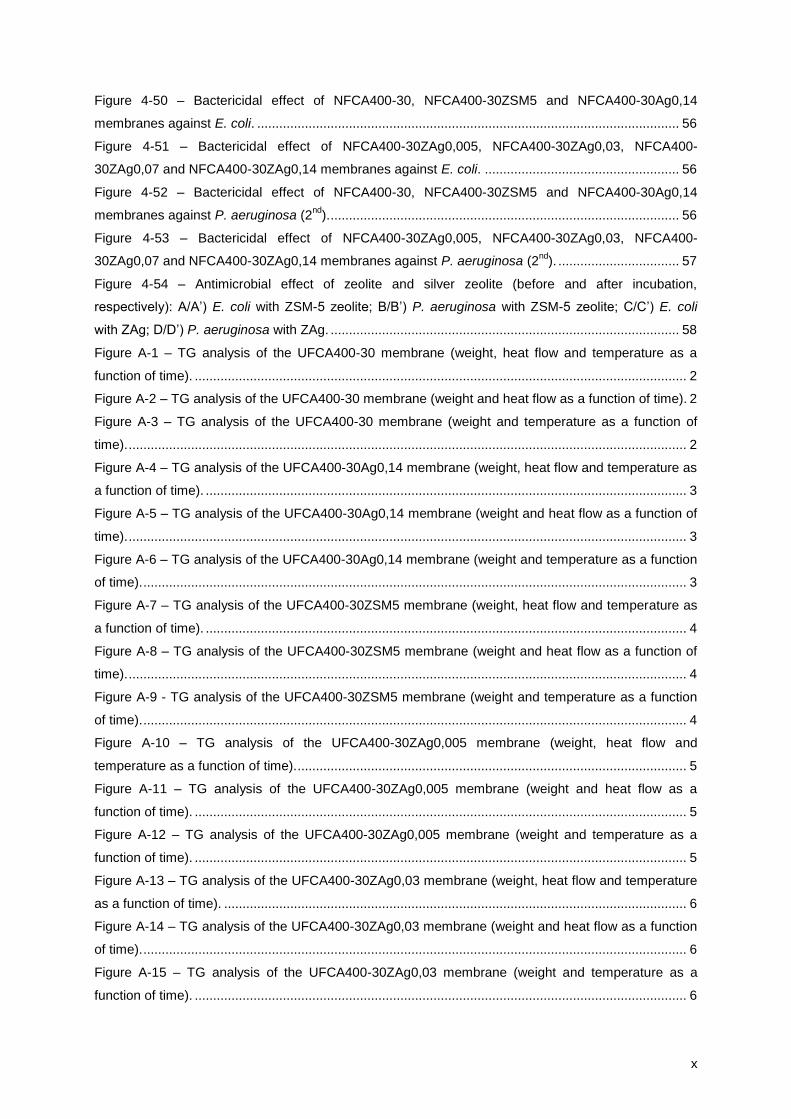
Figure 4-50 – Bactericidal effect of NFCA400-30, NFCA400-30ZSM5 and NFCA400-30Ag0,14
membranes against E. coli. ................................................................................................................... 56
Figure 4-51 – Bactericidal effect of NFCA400-30ZAg0,005, NFCA400-30ZAg0,03, NFCA400-
30ZAg0,07 and NFCA400-30ZAg0,14 membranes against E. coli. ..................................................... 56
Figure 4-52 – Bactericidal effect of NFCA400-30, NFCA400-30ZSM5 and NFCA400-30Ag0,14
membranes against P. aeruginosa (2nd
). ............................................................................................... 56
Figure 4-53 – Bactericidal effect of NFCA400-30ZAg0,005, NFCA400-30ZAg0,03, NFCA400-
30ZAg0,07 and NFCA400-30ZAg0,14 membranes against P. aeruginosa (2nd
). ................................. 57
Figure 4-54 – Antimicrobial effect of zeolite and silver zeolite (before and after incubation,
respectively): A/A’) E. coli with ZSM-5 zeolite; B/B’) P. aeruginosa with ZSM-5 zeolite; C/C’) E. coli
with ZAg; D/D’) P. aeruginosa with ZAg. ............................................................................................... 58
Figure A-1 – TG analysis of the UFCA400-30 membrane (weight, heat flow and temperature as a
function of time). ...................................................................................................................................... 2
Figure A-2 – TG analysis of the UFCA400-30 membrane (weight and heat flow as a function of time). 2
Figure A-3 – TG analysis of the UFCA400-30 membrane (weight and temperature as a function of
time). ........................................................................................................................................................ 2
Figure A-4 – TG analysis of the UFCA400-30Ag0,14 membrane (weight, heat flow and temperature as
a function of time). ................................................................................................................................... 3
Figure A-5 – TG analysis of the UFCA400-30Ag0,14 membrane (weight and heat flow as a function of
time). ........................................................................................................................................................ 3
Figure A-6 – TG analysis of the UFCA400-30Ag0,14 membrane (weight and temperature as a function
of time). .................................................................................................................................................... 3
Figure A-7 – TG analysis of the UFCA400-30ZSM5 membrane (weight, heat flow and temperature as
a function of time). ................................................................................................................................... 4
Figure A-8 – TG analysis of the UFCA400-30ZSM5 membrane (weight and heat flow as a function of
time). ........................................................................................................................................................ 4
Figure A-9 - TG analysis of the UFCA400-30ZSM5 membrane (weight and temperature as a function
of time). .................................................................................................................................................... 4
Figure A-10 – TG analysis of the UFCA400-30ZAg0,005 membrane (weight, heat flow and
temperature as a function of time). .......................................................................................................... 5
Figure A-11 – TG analysis of the UFCA400-30ZAg0,005 membrane (weight and heat flow as a
function of time). ...................................................................................................................................... 5
Figure A-12 – TG analysis of the UFCA400-30ZAg0,005 membrane (weight and temperature as a
function of time). ...................................................................................................................................... 5
Figure A-13 – TG analysis of the UFCA400-30ZAg0,03 membrane (weight, heat flow and temperature
as a function of time). .............................................................................................................................. 6
Figure A-14 – TG analysis of the UFCA400-30ZAg0,03 membrane (weight and heat flow as a function
of time). .................................................................................................................................................... 6
Figure A-15 – TG analysis of the UFCA400-30ZAg0,03 membrane (weight and temperature as a
function of time). ...................................................................................................................................... 6

xi
Figure A-16 – TG analysis of the UFCA400-30ZAg0,07 membrane (weight, heat flow and temperature
as a function of time). .............................................................................................................................. 7
Figure A-17 – TG analysis of the UFCA400-30ZAg0,07 membrane (weight and heat flow as a function
of time). .................................................................................................................................................... 7
Figure A-18 – TG analysis of the UFCA400-30ZAg0,07 membrane (weight and temperature as a
function of time). ...................................................................................................................................... 7
Figure A-19 – TG analysis of the UFCA400-30ZAg0,14 membrane (weight, heat flow and temperature
as a function of time). .............................................................................................................................. 8
Figure A-20 – TG analysis of the UFCA400-30ZAg0,14 membrane (weight and heat flow as a function
of time). .................................................................................................................................................... 8
Figure A-21 – TG analysis of the UFCA400-30ZAg0,14 membrane (weight and temperature as a
function of time). ...................................................................................................................................... 8

xii
LIST OF TABLES
Table 2-1 – Summarization of fouling types (Zhang et al. 2015). ......................................................... 11
Table 2-2 – Advantages and disadvantages of conventional disinfection methods (Center for
Environmental Research Information 1990; National Environmental Services Center 1966; US
Environmental Protection Agency 1995). .............................................................................................. 13
Table 3-1 – Chemicals used in the preparation of silver nanoparticles suspension. ............................ 20
Table 3-2 – Chemicals used in the preparation and titration of the zeolite. .......................................... 21
Table 3-3 – Chemicals used in the preparation of the casting solutions. .............................................. 22
Table 3-4 – Composition of the CA400-30, CA400-30Ag0,14 and CA400-30ZSM5 membranes. ....... 22
Table 3-5 – Composition of the CA400-30ZAg0,005, CA400-30ZAg0,03, CA400-30ZAg0,07 and
CA400-30ZAg0,14 membranes. ............................................................................................................ 22
Table 3-6 – Chemicals used in the determination of the rejection coefficient. ...................................... 27
Table 4-1 – Rejection coefficients for NaCl, Na2SO4, MgCl2, MgSO4 and glucose for ultrafiltration
membranes. ........................................................................................................................................... 41
Table 4-2 – Rejection coefficients for NaCl, Na2SO4, MgCl2, MgSO4 and glucose for nanofiltration
membranes. ........................................................................................................................................... 42
Table 4-3 – Samples weight at the end of the TGA programme and evaporated water percentage.... 52
Table 4-4 – Comparison of final weight percentage at the end of TGA programme and incorporated
components percentage in the casting solution. ................................................................................... 53
Table A-1 – Concentrations used to prepare the nanoparticle suspension. ........................................... 1
Table A-2 – Zeta potential as a function of pH for each prepared membrane. ....................................... 1
Table A-3 – Bactericidal effect of NFCA400-30, NFCA400-30ZSM5 and NFCA400-30Ag0,14
membranes against P. aeruginosa (1st). ................................................................................................. 9
Table A-4 – Bactericidal effect of NFCA400-30ZAg0,005, NFCA400-30ZAg0,03 and NFCA400-
30ZAg0,07 membranes against P. aeruginosa (1st). ............................................................................... 9
Table A-5 – Bactericidal effect of NFCA400-30, NFCA400-30ZSM5 and NFCA400-30Ag0,14
membranes against E. coli. ................................................................................................................... 10
Table A-6 – Bactericidal effect of NFCA400-30ZAg0,005 and NFCA400-30ZAg0,03 membranes
against E. coli. ....................................................................................................................................... 10
Table A-7 – Bactericidal effect of NFCA400-30ZAg0,07 and NFCA400-30ZAg0,14 membranes against
E. coli. .................................................................................................................................................... 11
Table A-8 – Bactericidal effect of NFCA400-30, NFCA400-30ZSM5 and NFCA400-30Ag0,14
membranes against P. aeruginosa (2nd
). ............................................................................................... 11
Table A-9 – Bactericidal effect of NFCA400-30ZAg0,005 and NFCA400-30ZAg0,03 membranes
against P. aeruginosa (2nd
). ................................................................................................................... 12
Table A-10 – Bactericidal effect of NFCA400-30ZAg0,07 and NFCA400-30ZAg0,14 membranes
against P. aeruginosa (2nd
). ................................................................................................................... 12

xiii
SYMBOLS
Abbreviation Explanation
A absorbance
AgNP silver nanoparticles
BOD5 biochemical oxygen demand
CA cellulose acetate
CEC cation-exchange capacities
CFU colony forming units
COD chemical oxygen demand
CV cyclic voltammetry
Da Dalton
DBP disinfection by-product
EDL electrochemical double layer
E. coli Escherichia coli
FAU faujasite
HS Helmholtz-Smoluchowski
HWW hospital wastewater
IC inorganic carbon
IHP inner Helmholtz plane
L-Asp L-aspartic acid
L-Phe L-phenylalanine
LTA Linde Type A
LTL Linde Type L
MF microfiltration
MIC minimum inhibitory concentration
MWCO molecular weight cut-offs
NF nanofiltration
NOM natural organic matter
NP nanoparticle
OD optical density
OHP outer Helmholtz plane
P. aeruginosa Pseudomonas aeruginosa
PAN polyacrylonitrile
PES polyethersulfone
PP polypropylene
PSf polysulfone
PTFE polytetrafluoroethylene
PVDF polyvinylidine fluoride
PVP polyvinylpyrrolidone

xiv
R correlation coefficient
RO reverse osmosis
rpm rotations per minute
SOD sodalite
SS suspended solids
S. aureus Staphylococcus aureus
Susp silver nanoparticle suspension
SWRO seawater reverse osmosis
TC total carbon
TGA thermogravimetric analysis
TOC total organic carbon
TSA tryptic soy agar
TSB tryptic soy broth
UF ultrafiltration
UV ultraviolet
UV-Vis ultraviolet-visible spectroscopy
UWW urban wastewater
ZAg silver containing zeolite
ZSM-5 Zeolite Socony Mobil–5
Symbol Explanation Unit
C concentration g/L
𝐶𝑏 solute concentration in the bulk feed solution g/L
𝐶𝑝 solute concentration in the permeate g/L
𝐸𝑠 streaming potential V
𝑓 rejection coefficient -
𝐽𝑝𝑤 pure water permeate flux kg/(h.m
2)
𝐿𝑝 hydraulic permeability kg/(h.m
2.bar)
MW molecular weight g/mol
P pressure Pa
𝑅 resistance of the channel in the measurement solution
𝑅𝐻 resistance of the channel in a concentrated ionic solution
t time s
𝛾 wavelength nm
∆𝑃 transmembrane pressure bar
𝜀 dielectric constant of the electrolyte -
𝜀0 vacuum permittivity F.m
-1
𝜁 zeta potential V

xv
𝜂 electrolyte viscosity (Pa.s)
𝜆0 electrical conductivity of the electrolyte solution S.m
-1
𝜆𝐻 conductivity of the solution of high salt concentration S.m
-1
𝜌 specific weight kg/m3
𝜎 conductivity S/cm

1
1 INTRODUCTION
All life on Earth depends upon one essential good: water. So much so that nations’ development is
directly linked to the freshwater availability and quality, since it is used for agricultural (75%), industrial
(20%) and domestic purposes (5%) (UNEP 2008).
In the mid of 2015, the world population reached 7,3 thousand millions and, according to the medium
hypothesis proposed by the United Nations, is expected to increase to 9,7 thousand millions by 2050
(Melorose, Perroy, and Careas 2015). Not only the increasing population, but also the climate
changes that disturbed the water cycle and the contamination of water reservoirs contributed to water
scarcity (UNEP 2008). Even more when only around 1% of the total water is accessible for
consumption, since 97,5% of total water in the planet is saline and the majority of freshwater is
unavailable in glaciers (USGS 2015).
In a planet were the volume of water is approximately constant, it will be difficult to provide enough
quality water to an increasing population, under the present circumstances, mainly when the
freshwater resources are unevenly distributed (Figure 1-1). It is necessary to find solutions that avoid
threatening water reserves and harming the environmental balance (UNEP 2008).
Figure 1-1 – Freshwater availability in 2007 (UNEP 2008).
Nanofiltration is increasingly used in wastewater treatment and drinking/process water production and
is the best available technique for removal of natural organic matter (NOM) and to avoid formation of
disinfection by-products (DBP), surpassing the traditional methods as a result of the development of
the membranes and the better prices due to enhanced use coupled with a more demanding water
quality. Although being an efficient and effective technology to use in wastewater treatment and water
reuse, nanofiltration is still hindered by membrane fouling, as it reduces membrane permeability (Van
der Bruggen, Mänttäri, and Nyström 2008; J. Wang et al. 2014; Wiesner and Chellam 1999). The
fouling, caused by membrane surface deposition, is hard to remove even with periodic cleaning, which
largely increases maintenance and operating costs. For this reason, the best option is to prevent
fouling at its earliest stages (Xie, Saito, and Hickner 2011).
2
Since membranes can have a wide range of characteristics by changing the material or fabrication
process, it is possible to create membranes with fouling resistance, by incorporating materials such as
zeolites, and antimicrobial properties, such as silver nanoparticles (Pendergast and Hoek 2011; J.
Wang et al. 2014).
1.1 OBJECTIVES OF THE THESIS
In order to investigate the bactericidal properties of silver nanoparticles, ZSM-5 zeolite and silver
exchanged zeolite incorporated in nanofiltration cellulose acetate (CA) membranes, the following
partial objectives were set:
1. Synthesis of asymmetric cellulose acetate and mixed matrix CA membranes with 0,14% of silver
nanoparticles, with ZSM-5 zeolite and with different contents of silver exchanged ZSM-5 zeolite
(0,005%, 0,03%, 0,07% and 0,14% of silver in the membrane);
2. Characterization of the silver nanoparticles formation and the role of formamide as a reducing
agent using UV-Vis spectroscopy;
3. Characterization of the membranes in case of pure water hydraulic permeability and rejection
coefficients for glucose, NaCl, Na2SO4, MgCl2 and MgSO4;
4. Characterization of the membranes by electrochemical studies (state of the silver),
thermogravimetric analysis and zeta potential;
5. Investigation of the bactericidal effect of the CA mixed matrix membranes, zeolite and silver
exchanged zeolite on Escherichia coli and Pseudomonas aeruginosa.
1.2 THESIS STRUCTURE
The thesis is divided in five chapters with the following content:
- Chapter 1 Scope, objective and structure of the present thesis.
- Chapter 2 Literature review on pressure-driven membranes processes and its applications,
membranes structure and separation process, nanocomposite membranes, type of
incorporated particles, method of nanoparticles incorporation in membrane
structure and effects of silver nanoparticles/zeolites in the biofouling control of
nanocomposite membranes.
- Chapter 3 Description of the experimental methods used in the preparation, characterization,
permeation and antibacterial experiments of the membranes.
- Chapter 4 Presentation and discussion of experimental results obtained in membrane
permeation experiments with pure water, glucose and salts (NaCl, Na2SO4, MgCl2
and MgSO4), with UV-Vis spectroscopy, with characterization through cyclic
voltammetry, thermogravimetric analysis and streaming potential and antibacterial
activity against Escherichia coli and Pseudomonas aeruginosa.
- Chapter 5 Conclusions and recommendations to future work.

3
2 LITERATURE REVIEW
The literature review of this thesis will focus in the applications of pressure-driven processes, in
particular biofouling control of nanofiltration membranes.
2.1 NANOFILTRATION AND ITS APPLICATIONS
Nowadays, the membrane separation technologies have an important role on wastewater reclamation
and particularly on desalination. These processes are favoured over others for not requiring chemical
additives, thermal inputs or regeneration of spent media. The pressure-driven membranes are
classified according to separation mechanism or intended application and include microfiltration
(suspended solids, protozoa and bacteria removal), ultrafiltration (virus and colloid removal),
nanofiltration (hardness, heavy metals and dissolved organic matter removal) and reverse osmosis
(desalination, water reuse and ultrapure water production), as presented in Figure 2-1 (Pendergast
and Hoek 2011; J. Wang et al. 2014).
Figure 2-1 – Types of membranes and characteristics (adapted from (X-Flow n.d.)).
The nanofiltration (NF) membrane is characterized by the molecular weight cut-offs (MWCO) between
reverse osmosis (RO) and ultrafiltration (UF) membranes (200 to 2000 Da) and the separation of
electrolytes in aqueous solutions due to the membrane materials containing charged groups
(molecular exclusion and solution diffusion mechanisms, respectively). It has been largely developed
and commercialized in the past decade as a promising technology for its low operation pressure, high
flux, high retention of multivalent anion salts, relatively low investment, long lifetimes and low
operation and maintenance costs. The applications of NF membranes include desalination and
concentration, separation and purification, drinking water production and wastewater treatment. This
process enables highly energy-efficient removal of turbidity, microorganisms and hardness, from both
natural and industrial waters (Hilal et al. 2004; J. Wang et al. 2014; X.-L. Wang et al. 2009).

4
2.1.1 WATER TREATMENT
Due to an intensive use of pesticides in agriculture, groundwater and surface water are increasingly
contaminated. These organic pollutants were usually removed using activated carbon and through
oxidation by ozone, techniques that have disadvantages. The activated carbon process uses carbon
filters that saturate rapidly, which efficiency to eliminate pesticides decreases with a high presence of
natural organic matter (NOM) due to a competitive adsorption, and has an enhanced cost by the
frequent regeneration of the carbon. The oxidation by ozone leads to the formation of small molecules
after the cut of pesticide molecules that can cause bacterial regrowth in water distribution systems and
also the formation of by-products (peroxides, ozonides, organobromine and bromate). Nanofiltration
can be used to treat all kinds of water (ground, surface and wastewater) or as a pre-treatment for
desalination in a more efficiently way (Boussahel et al. 2000; Hilal et al. 2004).
GROUNDWATER
Groundwater is an essential source of fresh water which quality has deteriorated due to the increased
human population and its activities. Nanofiltration is used to remove hardness, NOM, disinfection by-
product (DBP) precursors and multivalent ions from the groundwater (Hilal et al. 2004; Yang et al.
2016), as shown in the following examples: the NF membranes used by Schaep et al. (Schaep et al.
1998) had retentions higher than 90% for multivalent ions (e.g. sulphate and magnesium) and, for
monovalent ions, such as chloride and sodium, had retentions around 60-70%; Van der Bruggen et al.
(Van Der Bruggen et al. 2001) showed that the UTC-20 and NF70 membranes can remove the major
fraction of the hardness to less than the desired concentration in the drinking water and NF70
membrane had a rejection of pesticides (atrazine, simazine, diuron and isoproturon) of around 95%;
the NF membrane tested by E. Gwon et al. (Gwon et al. 2003) had a removal efficiency of dissolved
inorganic and organic matter of, respectively, 76,3% and 80%.
SURFACE WATER
Surface water is the most accessible fresh water reservoir and its composition often varies with
seasonal changes or rain. Nanofiltration is a reliable option to remove organics from the groundwater
(Hilal et al. 2004). K. Moons and Van der Bruggen (Moons and Van der Bruggen 2006) used self-
made membranes, produced with phase-inversion technique, to evaluate the organic micro pollutants
most commonly found in the Flemish surface water: estradiol, estrone and salicine. The retention
coefficients of these compounds for the UTC-20 membrane were, respectively, 75%, 83% and higher
than 97%. S. Köhler et al. (Köhler et al. 2016) studied a chemically resistant hollow-fibre NF
membrane in pilot scale at a drinking water treatment plant in Stockholm, Sweden, fed with full scale
process water from a rapid sand filter after aluminum sulphate coagulation. This combination removed
more than 90% of dissolved organic carbon and 96% of the absorbance at 254 nm. According to W.
Huang et al. (Huang et al. 2016), the all-cellulose nanocomposite membrane, with an electronegative
nature, were fabricated to remove nanoparticles and virus from aqueous medium. Rejections of 100%
for positively charged latex beads and 98,7% for Hepatitis C virus were obtained.

5
WASTEWATER
Nanofiltration is an efficient process for decontamination and recycling of all types of wastewater; the
only drawback is that in this type of water the water recovery rate should be approximately 100% (Hilal
et al. 2004). The textile industry is a water intensive industry which wastewater is loaded with
pollutants (textile dyes, suspended solids, mineral oils, electrolytes, surfactants). Y. Ong et al. (Ong et
al. 2014) used polyamide-imide hollow fibre nanofiltration membrane in various operating conditions
(temperature range: 25-70℃; solute concentration range: 100-1000ppm; pH range: 3-10) with
rejections of various dyes higher than 90%. The membrane permeates NaCl and Na2SO4 (over 80%
and 90%, respectively) that can be reused in the dyeing process. Liang et al. (Liang et al. 2014) used
a positively charged NF hollow fibre membrane that was also used in the treatment of dyes and was
able to remove almost 100% dyes at low flow and pressure. A coagulation-flocculation step before
nanofiltration can reduce membrane fouling and increase permeate flux. Pulido and Férez (Ochando
Pulido and Martínez Férez 2015) examined the performance of a thin-film composite polymeric NF
membrane as the tertiary treatment of secondary-treated two-phase olive mill wastewater and the
results were high feed recovery (90%) and significant rejection efficiencies for the electro conductivity
(58,1%) and organic matter (76,1%). S. Zulaikha et al. (Zulaikha et al. 2014) used NF membranes to
treat restaurant wastewater; the NF-90 membrane obtained COD, turbidity, BOD5 and conductivity
removal of, respectively, 97,8%, 99,9%, 86,8% and 82,3%. After the wastewater treatment, the
original water flux of the membrane was retrieved by over 50% after a simple rinsing process.
SALINE WATER
The success of a desalination process depends on the feed pre-treatment. Using NF as a pre-
treatment prevented seawater reverse osmosis (SWRO) membrane fouling by the removal of turbidity
and bacteria and scaling by removal of scale forming hardness ions and lowered required operating
pressure by reducing seawater TDS (Hilal et al. 2004). In a process of NF integrated with RO
desalination, the NF pre-treatment effectively removed divalent ions (rejections for Ca2+
, Mg2+
, SO42−
,
HCO3− and total hardness of 89,4%, 94,0%, 97,8%, 96,6% and 93,3%, respectively) and monovalent
ions (rejection of 40,3% for Cl− and Na
+) at low pressure (22 bar) (Zhou et al. 2015).
OTHERS
Nanofiltration can also be used to treat hospital wastewater (HWW) effluent, which is toxic for the
receptor ecosystems. The common pollutants in HWW can be divided in two categories, macro and
micropollutants. The macropollutants correspond to BOD5, COD, SS (usually 2-3 times higher than in
urban wastewater (UWW)), nitrogen and phosphorus compounds and Escherichia coli. The
micropollutants are mainly pharmaceuticals, detergents and disinfectants. Heavy metals are also
found in HWW (Beier et al. 2010; Verlicchi et al. 2010). P. Palma et al. (Palma et al. 2016)
characterized and evaluated the efficiency of NF membranes (NF90 and NF270) in this type of
wastewater. The membranes had high rejection coefficients for the majority of the studied parameters
(>90%) and the permeate concentrations were below limit values. The membranes removed the
toxicity detected in the initial samples (NF90 membrane promoted a greater decrease in the toxicity). It

6
was possible to obtain water with high quality and low ecotoxicological potential, without risks for
human populations and endangering the environmental balance.
2.1.2 FOOD AND PHARMACEUTICAL INDUSTRY
Membrane processes are an economically viable way to obtain water which meets the stringent water
quality regulation. In the food industry, one of the first industries to use membrane filtration, NF
membranes are required to avoid contamination of products and needed to meet the essential quality
and safety standards. Its main application is for concentration and demineralization of salty whey,
since the presence of monovalent salt ions in whey powders results in a negative sensorial perception
of consumers. In contrast, divalent ions contribute to the healthy image of the product. The value of
the products increases when monovalent cations are removed (Van der Bruggen, Mänttäri, and
Nyström 2008; X.-L. Wang et al. 2009). Separations of mixture solutions of neutral organic solute and
electrolyte are important in the food industry. Wang et al. (X.-L. Wang, Zhang, and Ouyang 2002)
investigated the possibility of separating saccharides from a NaCl solution by using a NF45 membrane
and expected a possible separation of the mixture solutions of bivalent anion electrolytes or neutral
organic solutes with few hundreds of MW and univalent anion electrolytes or neutral organic solutes
with few 10-folds of MW.
In the pharmaceutical industry, NF technology can be applied to separate amphoteric materials, such
as amino acids and proteins, due to the diverse rejection performance for solutes at different pH
values showed by commercial membranes. In these separations the most important factors are the
isoelectric points and the molecular weight of solutes. Wang et al. (X.-L. Wang, Ying, and Wang 2002)
performed permeation experiments of L-phenylalanine (L-Phe) and L-aspartic acid (L-Asp) aqueous
solutions with two commercial NF membranes, ESNA2 and ES20. The rejections to l-Phe and l-Asp by
ESNA2 membrane are about 0 and 90%, respectively, at a pH range of 4 - 9, while the rejections to l-
Phe and l-Asp by ES20 membrane are almost 100%, irrespective of pH value, which indicates that the
membranes can concentrate and separate l-Phe and l-Asp effectively by choosing proper conditions,
such as the pH value of the solution.
Nanofiltration plays an important role in water treatment, dairy industry and biomedical processes due
to the ability to separate monovalent and multivalent ions. Commercially available membranes have
good performance in many applications; however, the drive to protect existing water resources and to
produce new water resources demands membranes with improved productivity, selectivity, fouling
resistance and stability available at lower cost and with fewer manufacturing defects. Better
membranes require better materials (Pendergast and Hoek 2011).
2.2 MEMBRANES
The process industries produce a wide variety of chemicals and components which presents the
manufacturer with a need for separation, concentration and purification of a range of materials. In the
last decades this type of separations are based on one simple concept: a membrane. A membrane is

7
a thin barrier that permits selective mass transport. It is essentially a barrier that controls the relative
rates of transport of various species through itself and, by the feed stream separation, gives one
product depleted in certain components and a second product concentrated in these components. The
performance of a membrane is defined by two factors: flux (flowrate of fluid passing through the
membrane per unit area of membrane per unit time) and selectivity (fraction of solutes and particulates
in the feed retained by the membrane). An ideal membrane would have high selectivity and
permeability; however the attempt to maximise one factor implies a reduction in the other. It would
have also chemical resistance (to both feed and cleaning fluids), mechanical and thermal stability,
fouling resistance, manufacturing reproducibility, low manufacturing cost and ability to be packaged
into high surface area modules. The main uses of membranes in industry are the filtration of
suspended solids from liquid and gases containing dissolved solids, the removal of macromolecules
and colloids from liquids containing ionic species, the separation of mixtures of miscible liquids, the
selective separation of gases and vapours from gas and vapour streams, the selective transport of
ionic species and the virtually complete removal of all material, suspended and dissolved, from water
(Pinnau and Freeman 1999; Scott and Hughes 1997).
2.2.1 MEMBRANES STRUCTURE
The functioning of a membrane depends on its structure, as it determines the mechanism of
separation and, therefore, its application. The solid membranes have two types of structures,
symmetric (uniform structure throughout the entire membrane thickness) and asymmetric (gradient in
structure). The separation properties of symmetric membranes are determined by the entire structure,
while in asymmetric membrane are determined primarily by the densest region in the membrane
(Pinnau and Freeman 1999; Scott and Hughes 1997).
SYMMETRIC MEMBRANES
Symmetric membranes, which by definition are of a uniform structure, are of three general types (with
approximate cylindrical pores, porous and non-porous, as shown in Figure 2-2) and can be produced
by sintering or stretching (microporous membranes), casting (ion-exchange membranes), phase
inversion (pore membranes used in MF and UF) and extrusion (diffusion membranes for gas
permeation and pervaporation) (Pinnau and Freeman 1999; Scott and Hughes 1997).
Figure 2-2 – Schematic representation of symmetric membrane structures: A) porous cylindrical; B)
porous web or sponge; C) dense polymer film (Pinnau and Freeman 1999).
Inorganic materials such as microporous glass and ceramics are used to manufacture symmetric
membranes and can be coated to form composites to introduce specific improved properties (Pinnau
and Freeman 1999; Scott and Hughes 1997).

8
ASYMMETRIC MEMBRANES
Asymmetric membranes, currently the most employed membranes in industry, have variable structure
and transport properties across the membrane thickness. Its structure normally consists of a thin
dense layer (active layer, 0,1 – 1 m) supported by a highly porous thick support layer (100 – 200 m),
as presented in Figure 2-3. The dense layer provides the majority of selectivity for the membrane, due
to its chemical nature, size of pores and thickness, and the support layer is assumed to provide
mechanical support for the thin and fragile selective layer and a resistance-free path for water and
permeated solutes (Pendergast and Hoek 2011; J. Wang et al. 2014). Asymmetric membranes can be
categorized into three basic structures: A) integrally-skinned with a porous skin layer, B) integrally-
skinned with a dense skin layer and C) thin-film composite membranes (Figure 2-4).
Figure 2-3 – Asymmetric membrane structure (Scott and Hughes 1997).
Figure 2-4 – Schematic representation of asymmetric membrane structures: A) integrally-skinned (porous
skin layer); B) integrally-skinned (non-porous skin layer) – a) selective skin layer (material A) – b)
microporous support (material A); C) thin-film composite – a) selective coating layer (material A) – b)
microporous support (material B) (Pinnau and Freeman 1999).
Thin-film composite membranes consist of at least two structural elements made from different
materials: a porous support that provides mechanical strength and a thin selective top-layer
responsible for the separation. This characteristic enables the tailoring of membrane function for
specific applications and, for that, gives potential improvements to the membrane. They are usually
applied in processes in which permeation is controlled by the solution-diffusion mechanism
(nanofiltration, reverse osmosis, gas separation and pervaporation). The selective layer can be
applied by lamination, solution coating, interfacial polymerization or plasma polymerization methods
(Pinnau and Freeman 1999; Scott and Hughes 1997).
The integrally-skinned asymmetric membranes are prepared by the phase inversion method
developed by Loeb and Sourirajan, which confers the ability to vary the surface morphology (pore
size) of the active layer. In the phase inversion process induced by immersion precipitation, it is
necessary to prepare a ternary casting solution (polymer-solvent-nonsolvent), spread the solution as a
9
thin film, partially evaporate the solvent and immerse it into a nonsolvent bath (gelation of the polymer
film). Upon immersion of the cast solution into a liquid, which is a non-solvent for the polymer but
miscible with the solvent, an asymmetric structure with either a porous or non-porous skin layer is
formed. The structural gradient in integrally-skinned asymmetric membranes results from a very steep
polymer concentration gradient in the nascent membrane at the onset of phase separation. Phase
separation occurs by exchange of solvent and nonsolvent and an asymmetric membrane with a
denser top layer is formed. The final porous structure of the entire membrane, including the active
layer, and hence the subsequent performance (permeability and selectivity) depends on the method
steps. The phase inversion technique relies upon the controlled interaction of solvent and nonsolvent
solutions to induce a phase separation transitioning a polymer from a liquid dispersion into a solid
state (Murphy and de Pinho 1995; Pendergast and Hoek 2011; Pinnau and Freeman 1999; Sadrzadeh
and Bhattacharjee 2013; Scott and Hughes 1997).
The morphology and separation performance of the synthesized membranes can be controlled by
numerous parameters, such as solvent type, polymer type and concentration, nonsolvent system type
and composition, additives to the polymer solution and film casting conditions. Introducing additives
into the casting solution is the most important technique for improving performance of the resultant
membrane. The role of organic and inorganic additives, such as polymeric additives, alcohols,
surfactants and salts, was mainly reported as pore forming agents enhancing permeation properties
(Sadrzadeh and Bhattacharjee 2013).
Cellulose acetate (CA) is one of the first polymer membranes employed in aqueous based
separations, with properties ranging from MF to RO. The CA membranes are hydrophilic, offer a good
fouling resistance due to their smooth surfaces, as reported by M. Elimelech et al. (Elimelech et al.
1997), are relatively inexpensive and easy to manufacture. However, cellulose acetate presents low
oxidation (pH between 4 and 6), chemical (chlorine intolerance), thermal (temperatures lower than
30℃), and mechanical resistance, since it causes degradation of the polymer. Besides, CA
membranes are biodegradable and can be consumed by organisms growing in biofilms. Therefore, the
modification of cellulose acetate gains importance (Guillen et al. 2011; Pendergast and Hoek 2011;
Sivakumar, Mohan, and Rangarajan 2006).
Other types of polymers used to fabricate membranes are polysulfone (PSf), polyethersulfone (PES),
sulfonated PSf or PES, polyacrylonitrile (PAN), polypropylene (PP), poly-tetrafluoroethylene (PTFE or
Teflon) and polyvinylidine fluoride (PVDF). These materials exhibit excellent permeability, selectivity,
and stability in water treatment applications (Guillen et al. 2011; Pendergast and Hoek 2011).
2.2.2 MEMBRANE SEPARATION PROCESSES
In membrane processes, it is possible to operate in two modes: dead-end mode filtration (conventional
filtration) and cross-flow filtration (tangential filtration). In dead-end mode, the feed flow is
perpendicular to the membrane surface and the retained particles accumulate on the surface, forming
a filter cake that increases with time and decreases the permeation rate. To avoid the cake build-up,
an alternative cross-flow operation can be used (Figure 2-5), in which a feed stream flows tangentially

10
to the membrane surface and, as a result of the application of an appropriate driving force, a permeate
passes through the membrane (Scott and Hughes 1997).
Figure 2-5 – Cross-flow membrane separation (Scott and Hughes 1997).
When the permeate is collected, the feed is gradually reduced in concentration of the permeating
species along the membrane until it exits as retentate. Cross-flow velocities should be high to
minimise the impact of the accumulation of particulate material, although during a continued operation
a decline in flux rate occurs due to the fouling formation at the surface of the membrane (Scott and
Hughes 1997).
2.3 FOULING
Membrane fouling is the major drawback for pressure-driven processes, as it causes severe flux
decline, reducing the production efficiency and increasing energy consumption. Membrane fouling can
be of different types depending on the solutes (biofouling, organic and inorganic fouling) and of
different degrees (reversible and irreversible). The fouling formation largely varies with hydrodynamic
conditions and foulant−membrane or foulant−foulant interactions, which, in turn, depends on
membrane characteristics, feed composition and operating parameters. The different fouling types and
formation mechanisms are summarized in Table 2-1 (Zhang et al. 2015).
Organic fouling is generally produced by NOM, proteins and polysaccharides and has four
mechanisms of formation: complete pore blocking, intermediate blocking, standard blocking and cake-
layer formation (Figure 2-6). Inorganic fouling appears due to the deposition of inorganic matter on the
membrane surface and, subsequently, the formation of a cake layer by crystallization (CaSO4 and
CaCO3 as the main components) (Zhang et al. 2015). Biofouling occurs due to the deposition,
accumulation, growth and metabolism of microorganisms on a membrane surface. The membranes
adsorption of large molecular weight metabolic products, such as humus, polysaccharides fats and
microorganisms, promotes the growth of a biofilm and provides ideal living conditions for
microorganisms, resulting in irreversible fouling and flux decline (Zhang et al. 2015).
Figure 2-6 – Mechanisms of organic fouling formation: a) complete pore blocking; b) intermediate
blocking; c) standard blocking; d) cake-layer formation (Zhang et al. 2015).
11
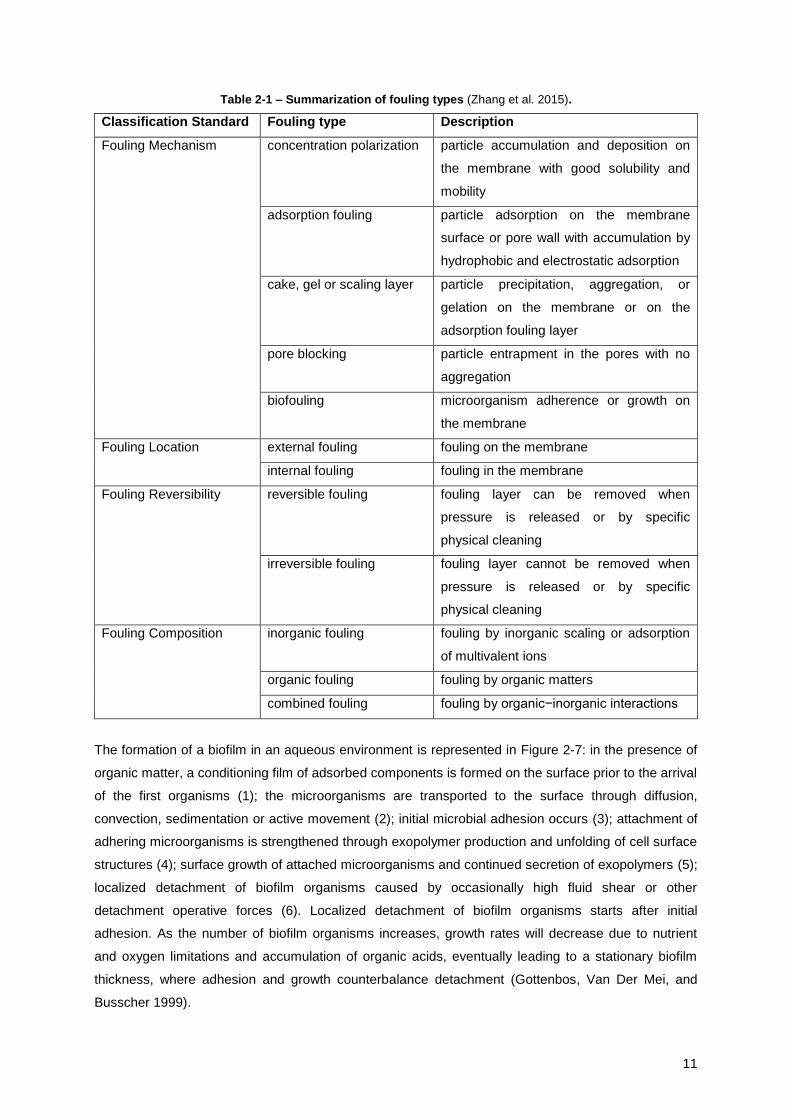
Table 2-1 – Summarization of fouling types (Zhang et al. 2015).
Classification Standard Fouling type Description
Fouling Mechanism concentration polarization particle accumulation and deposition on
the membrane with good solubility and
mobility
adsorption fouling
particle adsorption on the membrane
surface or pore wall with accumulation by
hydrophobic and electrostatic adsorption
cake, gel or scaling layer particle precipitation, aggregation, or
gelation on the membrane or on the
adsorption fouling layer
pore blocking particle entrapment in the pores with no
aggregation
biofouling microorganism adherence or growth on
the membrane
Fouling Location external fouling fouling on the membrane
internal fouling fouling in the membrane
Fouling Reversibility reversible fouling fouling layer can be removed when
pressure is released or by specific
physical cleaning
irreversible fouling fouling layer cannot be removed when
pressure is released or by specific
physical cleaning
Fouling Composition inorganic fouling fouling by inorganic scaling or adsorption
of multivalent ions
organic fouling fouling by organic matters
combined fouling fouling by organic−inorganic interactions
The formation of a biofilm in an aqueous environment is represented in Figure 2-7: in the presence of
organic matter, a conditioning film of adsorbed components is formed on the surface prior to the arrival
of the first organisms (1); the microorganisms are transported to the surface through diffusion,
convection, sedimentation or active movement (2); initial microbial adhesion occurs (3); attachment of
adhering microorganisms is strengthened through exopolymer production and unfolding of cell surface
structures (4); surface growth of attached microorganisms and continued secretion of exopolymers (5);
localized detachment of biofilm organisms caused by occasionally high fluid shear or other
detachment operative forces (6). Localized detachment of biofilm organisms starts after initial
adhesion. As the number of biofilm organisms increases, growth rates will decrease due to nutrient
and oxygen limitations and accumulation of organic acids, eventually leading to a stationary biofilm
thickness, where adhesion and growth counterbalance detachment (Gottenbos, Van Der Mei, and
Busscher 1999).

12
Figure 2-7 – Schematic, sequential presentation of the steps in biofilm formation (adapted from
(Gottenbos, Van Der Mei, and Busscher 1999)).
To study the population growth the microorganisms need to be in a phase where the chemical and
physiological properties are most uniform. This phase, the exponential phase, is characterized for a
constant rate of growth, without limitations of nutrients and other components (Figure 2-8) (Prescott,
Klein, and Harley 2002). The phase identification can be made spectrophotometrically, since there is a
relation between optical density (OD) and cell number: 109 cells/OD (Myers, Curtis, and Curtis 2013).
Figure 2-8 – Microbial Growth Curve in a Closed System (Prescott, Klein, and Harley 2002).
2.3.1 CONVENTIONAL DISINFECTION METHODS
To comply with the regulations, disease-causing organisms present in water supply have to be
destroyed or inactivated by means of disinfection. Primary disinfection provides the necessary
inactivation of bacteria and viruses in source water, while secondary disinfection maintains a residual
disinfectant that prevents the regrowth of microorganisms in the water distribution system. Disinfection
treatment methods include chlorination, chloramines, ozone and ultraviolet light; the
advantages/disadvantages of each technique are presented in Table 2-2. Disinfection effectiveness is

13
evaluated by analysing an indicator organism (total coliform bacteria); however harmless, its presence
indicates the possible survival of pathogens (Center for Environmental Research Information 1990;
National Environmental Services Center 1966).
Table 2-2 – Advantages and disadvantages of conventional disinfection methods (Center for Environmental
Research Information 1990; National Environmental Services Center 1966; US Environmental Protection Agency
1995).
Disinfection Method Advantage Disadvantage
Chlorination - Economical
- Easy to operate
- Very effective
- Appropriate as both a primary
and secondary disinfectant.
- Potential for harmful by-
products under certain
conditions
- Safety problems with gaseous
units
- Corrosive effect of sodium
hypochlorite
Chloramine - Appropriate to use as a
secondary disinfectant
- Produces few disinfection by-
products
- Week disinfectant
- Imparts a disagreeable taste
and odour to the water
Ozone - Very effective
- Minimal harmful by-products
- Requiring shorter contact time
and dosage than chlorine
- Relatively high cost
- Ozone gas is unstable and
must be generated onsite
- Requires a secondary
disinfectant
Ultraviolet Light (UV) - Very effective for viruses and
bacteria
- Easy to operate and maintain
- Produces no known toxic by-
products
- Safer than chlorine for
operations
- Inappropriate for surface water
- Requires a secondary
disinfectant
According to M. Khan et al. (M. T. Khan et al. 2015), chlorine is used to control/prevent biofouling in
cellulose triacetate (CTA) RO membranes used for desalting seawater in the Middle East region. It
was identified biofilm development in the membranes, which indicates an incapability of chlorination
on preventing its formation. Biofilm forming bacteria can sustain chlorine disinfection and acidic
cleaning either because of their developed resistance against acidic solution or because of the
protection given by the fouling matrix accumulated around them. N. Weerasekara et al. (Weerasekara,
Choo, and Lee 2016) also stated that chlorine, even using an high dosage, is insufficient for
preventing biofouling. Thus, chlorination is not recommended as a pre-treatment due to its
ineffectiveness in deterring biofouling and the high risk of generating toxic disinfectant by-products.
14
L. Applegate et al. (Applegate, Erkenbrecher, and Winters 1989) used chloramine to control biofouling
in a surface seawater RO plant in Middle East using PermasepR B-10 permeators. The chloramine
(disinfectant generated in situ) was used as an alternative to chlorine and showed to be a better
disinfectant and to reduce bacterial after-growth and biofouling.
The use of NF membrane with pre-ozonation for highly-concentrated surface water brine treatment
was studied by M. Park et al. (Park et al. 2016). The organic fouling potential was significantly reduced
using relatively low ozone doses (cake filtration as the dominant fouling mechanism) and is considered
a viable option to achieve higher recovery of NF membrane systems.
The effect of UV irradiation on NF membrane biofouling has been studied in pilot scale installations by
C. Marconnet et al. (Marconnet et al. 2011) using two identical parallel membrane pilots and a low
pressure UV reactor. UV irradiation was an efficient NF pre-treatment to reduce membrane biofouling
as it reduced the extent of biofouling (the global quantity of deposit, the sessile bacteria concentration
and the amount of extracellular polymeric substances present on the surface of the membrane) and
had a favourable effect on the water permeability of the membranes.
2.3.2 USE OF SILVER NANOPARTICLES
In nanotechnology, a nanoparticle is a material with dimensions of 0,1 – 100 nm that behaves as a
whole unit in terms of its transport, properties and unique characteristics. Nanoparticles, in particular
metallic nanoparticles (copper, zinc, titanium, magnesium, gold and silver), have unique optical,
electrical and thermal properties and are being incorporated into products for their remarkable
antibacterial effect, due to their extremely large surface area, which provides better contact with
microorganisms. However, greater attention has been given to silver nanoparticles (AgNP) since they
exhibit strong antimicrobial effectiveness against bacteria, viruses and eukaryotic microorganisms due
to the continuous release of a low level of silver ions. This release is a function of the nanoparticle size
(smaller particles have a faster release rate), the temperature (higher temperatures accelerate
dissolution) and exposure to oxygen, sulphur and light. It is important to understand the relationship
between the physical and chemical properties of AgNP and their potential risk to the environment and
human health. Understanding how their size, shape, surface and aggregation state change after
integration into a target application is critical for optimizing performance (C. Caro et al. 2010; Rauwel
et al. 2015).
PREPARATION METHODS
The properties of nanoparticles depend on synthesis techniques (radiation, chemical, photochemical
and electrochemical) and the kind of stabilising and reducing agent used (nature, concentration,
addition rate and mixing order). Chemical reduction of silver salts, such as silver nitrate, by inorganic
compounds, as sodium borohydride, is the most frequently applied method for the preparation of
stable silver nanoparticles and its colloidal dispersions in water or organic solvents, once it is the most
versatile, economical and easy method to control the shape and size of metal nanoparticles and
allows monitoring the growth process by spectroscopic methods, using a UV-Vis spectrophotometer.

15
The addition of a stabilising agent (polymers as polyvinylpyrrolidone (PVP)) is essential to prevent the
agglomeration of colloidal particles in the dispersion, as it coats the particle surface and causes a
steric stabilisation (Z. Khan et al. 2011; Widoniak, Eiden-Assmann, and Maret 2005; Zielińska et al.
2009). J. Widoniak et al. (Widoniak, Eiden-Assmann, and Maret 2005) found that the average particle
sizes decreases with an increase of silver precursor (silver nitrate), reducing and stabilising agents
concentration. Furthermore, the protecting agents also act reductively and support the activity of
reducing agents. M. Maillard et al. (Maillard, Giorgio, and Pileni 2003) found that the initial synthesis
conditions influence the solution colour, from red for the lowest reducing agent ratio to green and grey
for the highest. A. Zielińska et al. (Zielińska et al. 2009) used silver nitrate as precursor of silver
nanoparticles and PVP as stabilizer and a greenish colloid was obtained. The silver colloids spectra
contained a strong band close to 410 nm, confirming the reduction of silver ions to Ag0.
BIOFOULING CONTROL
Since the middle of the last century that silver is known for its antibacterial properties against
Staphylococcus aureus, Pseudomonas aeruginosa and Escherichia coli (C. Caro et al. 2010).
Although the exact mechanism of action of silver nanoparticles on the microbes is not yet understood,
some suggestions have been made according to the morphological and structural changes found in
the bacterial cells. The silver nanoparticles get attached to the cell membrane, penetrating inside the
bacteria and attacking the respiratory chain and cell division, which leads to cell death. This effect is
enhanced with the release of silver ions in the cells (Rai, Yadav, and Gade 2009). According to Ouay
and Stellacci (Le Ouay and Stellacci 2015), Ag+ is the actual antibacterial agent of silver nanoparticles,
which act as a silver ions reservoir from where the trapped silver ions are released, although the role
of metallic silver nanoparticles cannot be excluded. This oxidation can be due to the presence of
dissolved atmospheric oxygen in the colloidal solution.
R. Das et al. (Das, Gang, and Nath 2011) investigated the antimicrobial activity of linoleic acid capped
silver nanoparticles against Staphylococcus bacillus, Staphylococcus aureus and Pseudomonas
aeruginosa, which revealed an effective growth inhibition by more than 97%. The diameter of inhibition
zones around the disk containing silver nanoparticles was 9 mm, 11 mm and 10 mm, respectively.
This high activity is attributed to the dissolution of the released Ag0 and Ag
+ clusters.
W. Chou et al. (Chou, Yu, and Yang 2005) investigated the antibacterial activity of silver-loading
asymmetric cellulose acetate hollow fibre membrane against E. coli and S. aureus. After immersing in
water bath for 180 days, the silver content decreased to 60% in the bulk of the hollow fibres and to
10% on the surface comparing with the content after the manufacturing process. Despite the leaching
of the silver particles, the membranes still showed antibacterial activity. However, after permeating
with water for 5 days, the silver content in the hollow fibres decreased and did not show antibacterial
activity. To have a long-term antibacterial effect, the concentration of silver precursor should be 0,01%
– 0,1 wt.%.
D. Koseoglu-Imer et al. (Koseoglu-Imer et al. 2013) prepared polysulfone membranes with different
concentrations of silver nanoparticles (0% – 1 wt.%) and observed the following: after the addition of
AgNP there was a change in the surface structure of bare PS membrane; the increasing concentration

16
of AgNP leads to aggregation; hydraulic permeability increases and adsorptive fouling decreases with
low concentrations of silver nanoparticles (up to 0,25wt.%), comparing with the bare membrane; the
growth of bacterial colonies decreased with increasing silver nanoparticles concentration; the ionic
silver loss from the composite membranes during pure water filtration was minimal.
In the study of J. Li et al. (J. H. Li et al. 2013), silver nanoparticles improved poly(vinylidine fluoride)
membrane surface hydrophilicity and antifouling performance. The enhancement of membrane
surface hydrophilicity with the addition of silver nanoparticles was verified by the decrease of the water
contact angle. Relatively to the antifouling performance the incorporation of silver nanoparticles
decreases organic and biofouling activity. The most concentrated membrane reduced irreversible
resistance ratio in almost 80% compared with the virgin PVDF membrane. Using the inhibition zone
method to conclude about biofouling activity against S. aureus and E. coli, it was evident that the
membranes with AgNP incorporated had an antibacterial zone, contrary to the result obtained for the
simple membranes.
There are several types of nanoparticles that can be incorporated into polymer membranes capable of
control biofouling (Arthanareeswaran and Thanikaivelan 2010; Asapu et al. 2014; Jhaveri and Murthy
2016). Silver nanoparticles are suitable for the improvement of membrane surface hydrophilicity and
antifouling performance under the proper conditions.
2.3.3 USE OF ZEOLITES
A zeolite is a crystalline, hydrated aluminosilicate of alkali and alkaline earth cations having a
nanometre, open, three-dimensional structure. Zeolite crystals consist of a three-dimensional cross-
linked (Si/Al)O4 tetrahedral framework, in which each Al or Si atom occupies the vertex of a network
connecting four oxygen atoms. Zeolites are able to lose and gain water reversibly, present in the large
structural cavities and the entry channels leading into them, and to exchange extra framework cations,
without changing the crystal structure. The “molecular sieve” property of crystalline zeolites, due to a
very regular pore structure of molecular dimensions, selectively sorts molecules based primarily on a
size exclusion process. The weakly bonded extra framework cations can be exchanged by washing
with a strong solution of another cation. The zeolite cation-exchange capacities (CEC) depend on
temperature, water content, ion type and the ratio of Si to Al atoms in the matrix. The unique
adsorption, cation-exchange, dehydration–rehydration and catalytic properties of the zeolites allow
their use in industrial, agricultural, environmental and biological technology. The most common zeolite
employed in membranes are MFI-type, sodalite (SOD) and Linde Type A (LTA) (Mumpton 1999;
Pendergast and Hoek 2011).
ZSM-5 ZEOLITE
Zeolite ZSM-5 (MFI), the most commonly applied zeolite in membranes, is composed of a unit cell with
the chemical formula NanAlnSi96-nO192∙16H2O (n<27), with a structure composed by straight channels in
one direction and perpendicular sinusoidal channels that are not interconnected (Figure 2-9). Zeolites

17
have a high thermal stability (up to 1100℃) (Ali, Brisdon, and Thomas 2003; Pendergast and Hoek
2011; Structure Commission of the International Zeolite Association (IZA) 2007).
When incorporating MFI-type zeolite in porous membranes for water separations, crystals should be
oriented to the permeation direction, as pore size determines ion selectivity and framework density
determines water permeability. The ability to replace atoms via ion exchange may imbue the zeolite
with alternate charge and structural properties (sieve property, for example). Additionally, both the ion
and water molecule mobility through a zeolite depend upon the relative density of the framework
structure; open porous structures will facilitate less hindered transport (Pendergast and Hoek 2011).
Figure 2-9 – ZSM-5 framework viewed along [010] (Structure Commission of the International Zeolite
Association (IZA) 2007).
According to P. Lalueza et al. (Lalueza et al. 2011), silver exchanged ZSM-5 zeolite has higher
bactericidal effect comparing with silver nanoparticles, result related with the total amount of ionic
silver bioavailable, the oxidation state of the silver species and the particle size of the material.
BIOFOULING CONTROL
Zeolites can be used in biofouling control, with and without ion exchange. However, antibacterial
activity is achieved with cation-exchanged zeolites. Zeolites are considered an inorganic reservoir for
hosting ions that regulate their release, providing a rigid and stable structure. The silver ions
embedded in zeolites are responsible for the antimicrobial activity, most likely due to their intake by
bacterial cells when in contact with silver zeolite, which inhibits cellular functions and damages the
cell, or due to the generation of reactive oxygen molecules, which inhibit the respiration (Ferreira et al.
2012; Rai, Yadav, and Gade 2009).
L. Dong et al. (Dong et al. 2015) evaluated the bacteria adhesion, bacteria inactivation and biofilm
formation in Linde Type L (LTL) zeolite nanoparticles embedded polysulfone ultrafiltration membrane.
The anti-adhesion efficiency to Escherichia coli and Pseudomonas aeruginosa was high (reduction of
61% and 97%, respectively), which resulted in an enhanced anti-biofouling ability, demonstrated by
the reduced biofilm thickness of P. aeruginosa compared with the PSf membrane. The embedded LTL
nanoparticles showed no bactericidal effect on E. coli.
The antimicrobial activity of faujasite (FAU) zeolites doped with silver was reported by L. Ferreira
(Ferreira et al. 2012) using bacteria (Escherichia coli and Bacillus subtilis) and yeast (Saccharomyces
cerevisiae and Candida albicans). Contrary to the silver exchanged samples, the virgin zeolites did not
18
show microbial inhibitory effects, indicating that this behaviour is due to the presence of silver. The Y
FAU zeolite displayed lower minimum inhibitory concentration (MIC) for the bacteria (0,2 mg/mL)
compared with X FAU (0,3 mg/mL), which could be explained by the presence of metallic silver in the
last zeolite verified by XPS analysis. The effect of the silver zeolites on the yeast cultures were less
sensitive than bacteria (1,0 mg/mL), which can be explained by the complex cellular organization of
eukaryotic cells and the structure of the cellular wall.
D. Boschetto et al. (Boschetto et al. 2012) prepared polyethylene composite films with silver
exchanged zeolite-Y (5% silver) with application in food industry, such as the inclusion of antimicrobial
substances in plastic films with a controlled release on the surface of the food, inhibiting the growth of
microorganisms, increasing the shelf life and safety of the product. The zeolite Y without exchanged
silver showed no antimicrobial growth, while silver zeolite inhibited the growth of E. coli for
concentrations higher than 0,5 mgzeolite/mL within 24 hours, which reveals an effective antimicrobial
activity. When incorporated in the polymer, by pressing and wet casting, the zeolite impregnated with
silver showed inhibitory effects against bacteria, evidenced by the inhibition halos obtained (3 mm and
7 mm, respectively), which did not occurred with the free-zeolite polymer. This antimicrobial activity
difference may be due to the high temperatures used in the pressing process (80 – 130℃), which may
affect the silver stability, causing its reduction. Approximately 56% of silver was leached from the
zeolite to the medium, which contrasts with the 5% obtained when the zeolite is trapped into a
polymeric matrix. A Luria Bertani medium was used for leaching tests instead of water, since ionic
silver release can be increased by ion exchange due to the presence of other cations in water. This
situation leads to a lower release rate due to increased resistance for diffusion of the ions from the
zeolite to the bulk medium.
Higher bioavailability of cationic silver results in a higher bactericidal action of the silver-carrier
material. Silver ions bind particularly to zeolites, resulting in a gradual, stable and long-lasting release
of silver ions from zeolite, resulting in an increased antimicrobial potential, compared with silver
nanoparticles. However, further studies are required to clarify the possible long-term toxic effects of
silver (Boschetto et al. 2012; Lalueza et al. 2011; Matsuura et al. 1997).
The increasing public awareness and concern over the safety of products, processes and conditions
inspire and demand the development of new safe and cost-effective antimicrobial solutions,
encouraging the emergence and growth of new materials with antimicrobial properties. Mixed matrix
membranes seek to take advantage of both the low cost and ease of fabrication of organic polymeric
membranes and the mechanical strength and functional properties of inorganic materials (Ferreira et
al. 2012; Pendergast and Hoek 2011).

19
3 EXPERIMENTAL
3.1 EXPERIMENTAL PLANNING
Asymmetric cellulose acetate (CA) and mixed matrix membranes – CA/silver nanoparticles, CA/ZSM-5
zeolite and CA/silver loaded zeolite – were prepared by the wet phase inversion method. In the case
of mixed matrix membranes, besides the conventional polymeric casting solutions (polymer, solvent
system and additives), special attention is required for the incorporation of silver nanoparticles, zeolite
and silver loaded zeolite. To manufacture the different membranes, it was necessary to undertake
previous steps: preparation of silver nanoparticles, zeolite and casting solutions (characterized via UV-
Vis spectroscopy) and the casting of the membranes. An annealing treatment had to be performed to
obtain nanofiltration membranes. In order to characterize the prepared membranes, different
experiments were performed: evaluation of the permeation performance, electrochemical studies,
thermogravimetric analysis, determination of the zeta potentials and evaluation of the bactericidal
properties (Figure 3-1). All the reagents were used as-received, without further purification.
Figure 3-1 – Flowchart of the experiments performed.
3.2 MANUFACTURING OF THE MEMBRANES
3.2.1 PREPARATION OF SILVER NANOPARTICLES
To manufacture the silver containing membranes, the silver nanoparticles were prepared ex-situ
according to the synthesis protocol of Figueiredo et al. 2015 and using the concentrations presented in
Beisl, 2015. The concentrated nanoparticle aqueous solution was obtained by the reduction of silver
nitrate with sodium borohydride (Equation 3.1), both dissolved in an aqueous solution of
polyvinylpyrrolidone (PVP), which is used to protect the silver nanoparticles from growing and
agglomerating (H. Wang et al. 2005).
AgNPs and Zeolite
preparation
UV-Vis Spectroscopy
Casting solutions
preparation
Casting of the membranes
Electrochemical Studies
TG Analysis
Permeation Performance in UF Installation
Hydraulic Permeability
Salts and Glucose Rejection
Annealing treatment
Permeation Performance in NF Installation
Hydraulic Permeability
Salts and Glucose Rejection Zeta Potential
Determination
Bactericidal Properties Evaluation

20
The nanoparticle synthesis protocol to prepare 8 mL of the silver nanoparticle suspension started with
the preparation of an aqueous solution of PVP (0,08 g of PVP in a total volume of 8 mL), followed by
the dissolving of 0,4988 g of AgNO3 and 0,03026 g of NaBH4, separately, in a total volume of 4 mL of
the PVP solution previously prepared. An Erlenmeyer flask filled with the AgNO3 solution was
submerged in an ultrasonic bath and the NaBH4 was dropwise added to the AgNO3 solution while the
Erlenmeyer flask was being shaken. The suspension had to be stored in a fridge without exposure to
light. The chemicals used are stated in Table 3-1. To obtain a complete dissolution of the chemicals,
mechanical agitation and ultrasonic bath were used. The concentrations used to prepare the
nanoparticle suspension are presented in appendix 1A.1, Table A-1.
The estimated weight of the silver nanoparticles was obtained based on the volume of the solution that
was added and its concentration in silver nitrate.
𝐴𝑔𝑁𝑂3 + 𝑁𝑎𝐵𝐻4 → 𝐴𝑔0 + 0,5𝐻2 + 0,5𝐵2𝐻6 + 𝑁𝑎𝑁𝑂3 (3.1)
Table 3-1 – Chemicals used in the preparation of silver nanoparticles suspension.
Chemical Manufacturer LOT Purity MW (g/mol)
PVP BDH Chemicals 4722900G >88,18% ~44.000
AgNO3 Panreac 0000172531 >99,8% 169,87
NaBH4 Panreac 0000182216 >96% 37,83
Figure 3-2 – Silver nanoparticles suspension.
It is visible in Figure 3-2 that the obtained suspension had a homogeneous greenish brown tone. The
silver concentration of the prepared silver nanoparticles suspension was 0,040 gAg/mL and the weight
percentage of silver in the suspension 3,75 wt.%.
3.2.2 PREPARATION OF THE ZEOLITE
Of the seven membranes prepared, five have embedded zeolite: one with only zeolite and the other
four with silver in its structure. The zeolite used was ZSM-5, with a molar ratio of Si/Al of 15 and in the
ammonium form (Si15Al(O2)16NH4). To introduce the silver ions in the zeolite, a 0,1 M AgNO3 aqueous
solution was prepared and mixed with the zeolite (20 g of zeolite in 400 mL of the AgNO3 solution)
during three days with a magnetic stirrer at 600 rpm and without exposure to light to avoid the
reduction of the silver. After the complete exchange, the suspension was filtrated and purged with
deionized water. The quantity of silver present in all the solutions was measured by titration after
Mohr’s method (Canterbury 2015) in order to determine the silver content of the zeolite after the
exchange. This is obtained by the difference between the content in the mother solution (400 mL) and
in both filtrate (395 mL) and purging water (787 mL), which were, respectively, 10,5 mmol/L, 76,0

21
mmol/L and 0,7 mmol/L, assuming that all silver ions are either in the zeolite or in the filtrate and
purging water. Therefore, the ZSM-5 zeolite used has a silver content in weight of 4,85 wt.%
(Si15Al(O2)16Ag). After the titration, the silver containing zeolite was dried under vacuum and then in a
drying oven at 140℃ for 24 hours. Both zeolites, with and without silver, were at last calcined at 500℃
for 24 hours in a muffle furnace. The chemicals used in the preparation and titration of the zeolite are
stated in Table 3-2.
Table 3-2 – Chemicals used in the preparation and titration of the zeolite.
Chemical Manufacturer LOT Purity MW (g/mol)
ZSM-5 Zeolyst International 2493-60 - -
AgNO3 Panreac 0000172531 >99,8% 169,87
NaCl VWR 11D120005 >99,9% 58,44
Figure 3-3 – ZSM-5 zeolite after calcination: A) zeolite without silver; B) zeolite with embedded silver.
The calcined zeolites presented in Figure 3-3 have no visible difference, except the agglomeration in
the silver containing zeolite due to the previous ion exchange procedure. A grey colour appeared in
some parts of the zeolite with embedded silver, result of silver oxidation by exposure to light.
3.2.3 PREPARATION OF THE CASTING SOLUTIONS
To manufacture the membranes used, it was necessary to prepare a casting solution, which consisted
of a polymer, cellulose acetate (CA), and a solvent system, acetone and formamide (strong and weak
solvent, respectively). In order to improve the bactericidal effect, the silver nanoparticles suspension
and the zeolite with and without embedded silver can be added to the casting solution. The solutions
prepared were mixed in a bottle and agitated until CA was completely dissolved in a P Selecta
Vibromatic mechanical agitator (Figure 3-4) at 550 rpm.
Figure 3-4 – P Selecta Vibromatic mechanical agitator.
The different membranes prepared were of cellulose acetate without incorporated materials, with silver
nanoparticles, with zeolite and with different percentage of silver containing zeolite and the according
designation and abbreviation were, respectively, CA400-30 (CA), CA400-30Ag0,14 (CA/Ag0,14),

22
CA400-30ZSM5 (CA/ZSM-5) and CA400-30ZAg0,005 (CA/ZAg0,005), CA400-30ZAg0,03
(CA/ZAg0,03), CA400-30ZAg0,07 (CA/ZAg0,07), CA400-30ZAg0,14 (CA/ZAg0,14). The percentage
shown corresponds to the silver content in the membrane.
The preparation mode of the casting solutions was different accordingly to what was added. In all the
membranes, the addition sequence was cellulose acetate, formamide and acetone (added at last for
being the most volatile). In the silver nanoparticles membrane, the respective suspension was added
to the acetone in a flask, homogenised and then poured into the bottle with the cellulose acetate and
formamide. In the membranes with zeolite, this one was added after the polymer.
The chemicals used are presented in Table 3-3 and the quantities in Table 3-4 and Table 3-5. The
ones that contain silver were protected from light with aluminium foil and all the flasks were covered
with duct tape to avoid acetone evaporation. The added zeolite was in the powder form to avoid grains
in the casting solution.
Table 3-3 – Chemicals used in the preparation of the casting solutions.
Chemical Manufacturer LOT Purity MW (g/mol)
Cellulose acetate Sigma-Aldrich MKBM8033V ≥97% ~30.000
Acetone LabChem AC-49-2013 ≥99,7% 58,08
Formamide Sigma-Aldrich BCBH9281V ≥99,5% 45,04
Table 3-4 – Composition of the CA400-30, CA400-30Ag0,14 and CA400-30ZSM5 membranes.
CA400-30 CA400-30Ag0,14 CA400-30ZSM5
m (g) %wt m (g) %wt m (g) %wt
Cellulose Acetate 8,51 17,02 8,54 16,35 8,50 16,22
Formamide 15,01 30,01 15,16 29,02 15,12 28,84
Acetone 26,49 52,97 26,60 50,92 26,75 51,03
AgNP’s suspension - - 1,94 3,71 - -
Zeolite - - - - 2,05 3,91
Total 50,01 100 52,24 100 52,42 100
Silver percentage - 0,14 -
Table 3-5 – Composition of the CA400-30ZAg0,005, CA400-30ZAg0,03, CA400-30ZAg0,07 and CA400-
30ZAg0,14 membranes.
CA400-30ZAg0,005 CA400-30ZAg0,03 CA400-30ZAg0,07 CA400-30ZAg0,14
m (g) %wt m (g) %wt m (g) %wt m (g) %wt
Cellulose Acetate 8,51 16,83 8,52 16,83 8,58 16,67 8,51 16,50
Formamide 15,37 30,40 15,23 30,09 15,50 30,11 15,06 29,19
Acetone 26,63 52,67 26,60 52,55 26,65 51,77 26,55 51,46
Zeolite with silver 0,05 0,10 0,27 0,53 0,75 1,46 1,47 2,85
Total 50,56 100 50,26 100 51,48 100 51,59 100
Silver percentage 0,005 0,03 0,07 0,14

23
Figure 3-5 – Comparison of the casting solutions with zeolite and silver loaded zeolite with A: 0%; B:
0,005%; C: 0,03% and D: 0,07% of silver in the casting solution.
When prepared, the casting solutions have a white colour characteristic of the cellulose acetate. After
the agitation time, the solutions with silver incorporated gain a brown tone which is darker with the
increasing content of silver. Figure 3-5 shows four of the casting solutions with zeolite and silver
containing zeolite. To note that the CA400-30 casting solution has a similar colour to the CA400-
30ZSM5 (0% silver), the CA400-30Ag0,14 to the CA400-30ZAg0,005 and the CA400-30ZAg0,14 to
the CA400-30ZAg0,07.
3.2.4 CASTING OF THE MEMBRANES
To cast the membranes it was necessary to have a glass plate with a smooth surface without
imperfections, a casting knife and a coagulation bath, composed of deionized water and ice (Figure
3-6). This knife has a groove of 0,25 mm on one side which is responsible for casting a membrane
with the required thickness.
The casting solution was poured equally into the slot of the casting knife and the 30 seconds of
evaporation time began. The knife, placed with the groove faced down and to the upper part of the
glass, was moved through it up to the end, spreading out the casting solution evenly, as shown in
Figure 3-7. To assure a uniform membrane, both the glass and the casting knife had to be clean and
dry.
After the evaporation time, with all the glass covered with the casting solution, the plate was immersed
in the coagulation bath at 0℃. When the membrane started to detach from the plate, it was identified
and stored in the fridge immersed in deionized water in a hermetic box specific to the type of
membrane (simple, with silver nanoparticles, zeolite or silver containing zeolite).
Figure 3-6 – Casting set-up: A) Casting support; B) Casting knife; C) Coagulation bath.

24
Figure 3-7 – Casting process (Beisl 2015).
It was difficult to cast the membranes with higher concentrations of silver containing zeolite (CA400-
30ZAg0,14) since the zeolite agglomerates ripped the membrane during the casting.
3.2.5 ANNEALING TREATMENT
The casted membranes have a pore diameter characteristic of ultrafiltration. As the experiments were
made in ultra and nanofiltration conditions, to obtain nanofiltration characteristics the membranes had
to be annealed in order to contract the pores (Figure 3-8). The annealing treatment consists in a heat
treatment, in which the membranes, inside two petri dishes filled with deionized water, were placed in
a thermic bath at 95℃ ± 1℃ for 11 minutes (De Pinho 1988).
Figure 3-8 – Annealed membranes: A) CA400-30; B) CA400-30ZSM5; C) CA400-30Ag0,14; D) CA400-
30ZAg0,005; E) CA400-30ZAg0,03; F) CA400-30ZAg0,07.
After this time, the annealed membranes were cooled with deionized water at room temperature and
stored.
The membranes used in the bactericidal studies and a membrane with silver containing zeolite with
0,14% of silver content (CA400-30ZAg0,14P) were annealed in a heating plate, inside a measurement
beaker, at 95℃ ± 2℃ for 11 minutes.
3.3 EVALUATION OF THE PERMEATION PERFORMANCE
3.3.1 SET-UP
The characterization of the membranes was made in two crossflow filtration installations. These units
of ultrafiltration/nanofiltration (Figure 3-9/Figure 3-10, respectively) are similar and are composed of a
feed tank, a pump, a flowmeter, two manometers, five/six permeation cells in row and a pressure
valve.

25
Figure 3-9 – Ultrafiltration installation.
Figure 3-10 – Nanofiltration installation.
The flat plate cells have two detachable parts separated by a porous plate (membrane support) with a
permeation area of 13,2 cm2 (Figure 3-11 and Figure 3-12). To avoid damaging the membrane during
the experiments, a circular filter paper was placed between the porous plate and the membrane. In the
pressurized upper part of the cell, the feed inlet enters and, due to its conical geometry specially
designed to achieve a high degree of turbulence, passes tangentially through the membrane, exiting
as concentrate (Rosa and De Pinho 1994). The experiments were carried in concentration mode
where only the concentrate was recirculated to the feed tank and the permeate was collected in a
different vessel. As the circulating solution in the installations is considerably higher than the collected
permeates, the steady state is maintained and different membranes can be tested at once with the
same feed solution.
Figure 3-11 – Permeation cell used in ultra and
nanofiltration installations.
Figure 3-12 – Cell cross-section. 1. Feed inlet; 2.
Feed outlet; 3. Permeate outlet; 4. Porous stainless
steel plate (membrane support) (Afonso and De
Pinho 1990).

26
In the ultrafiltration installation, the pump (ISGEV AS 71 B 4 three-phase induction pump) is used to
collect the solution from the variable capacity feed tank to the five permeation cells, where the
circulation flow rate, measured in a flowmeter, is controlled simultaneously by the pump frequency and
the backpressure valve. Two manometers are placed before and after the cells to detect the feed
pressure and the pressure drop, respectively (Afonso and De Pinho 1990).
In the nanofiltration installation, similar to the ultrafiltration unit, a Hydra Cell G-03 diaphragm pump,
coupled with a damper to reduce pressure fluctuations, feeds the six permeation cells with a pressure
controlled by the backpressure valve and a circulating flow rate controlled by the hydraulic positive
displacement pumping action.
3.3.2 COMPACTION OF THE MEMBRANES
To avoid fluctuations in the permeation experiments, the membranes had to be compacted for two
hours at a pressure approximately 20% higher than the maximum operating pressure (40 bar and 6
bar at the nanofiltration and ultrafiltration installations, respectively) (Afonso and De Pinho 2000).
3.3.3 HYDRAULIC PERMEABILITY
The hydraulic permeability coefficient (𝐿𝑝), the simplest characterization parameter, reveals the pure
water permeation capacity of a membrane. It is the slope of the Equation 3.2 and describes the linear
variation of the pure water permeation fluxes (𝐽𝑝𝑤) as a function of applied transmembrane pressure
(∆𝑃). This value is the variation of permeate mass per unit of time, membrane area and applied
pressure.
𝐽𝑝𝑤 = 𝐿𝑝 ∙ ∆𝑃 ⇔ 𝐿𝑝 =𝐽𝑝𝑤
∆𝑃 (3.2)
The hydraulic permeability was measured with nanofiltration and ultrafiltration membranes. In
nanofiltration conditions, the fluxes were obtained at 5, 10, 15, 20, 25, 30, 35 and 40 bar, with a 0,6
L/min feed flow rate (Afonso and De Pinho 2000). At the ultrafiltration installation, the fluxes were
measured at a feed flow rate of 180 L/h at 1, 2, 3, 4 and 5 bar.
3.3.4 REJECTION COEFFICIENTS TO SOLUTES
In order to characterize the membranes in terms of the rejection coefficient (𝑓), five solutions were
prepared using glucose, NaCl, Na2SO4, MgCl2 and MgSO4 (Table 3-6). This important parameter is
obtained by the Equation 3.3, which reveals the solute fraction that was retained by the membrane by
the difference of the solute concentration in the bulk feed solution, 𝐶𝑏, and the concentration of the
solute in the permeate, 𝐶𝑝.
𝑓 =𝐶𝑏 − 𝐶𝑝
𝐶𝑏
(3.3)
The solutions had an initial feed concentration of 2 g/L and samples were taken from permeates and
before and after the experiment from the feed. The average of the feed values was assumed as the
bulk feed concentration. The experiment in nanofiltration conditions was conducted at 30 bar and a
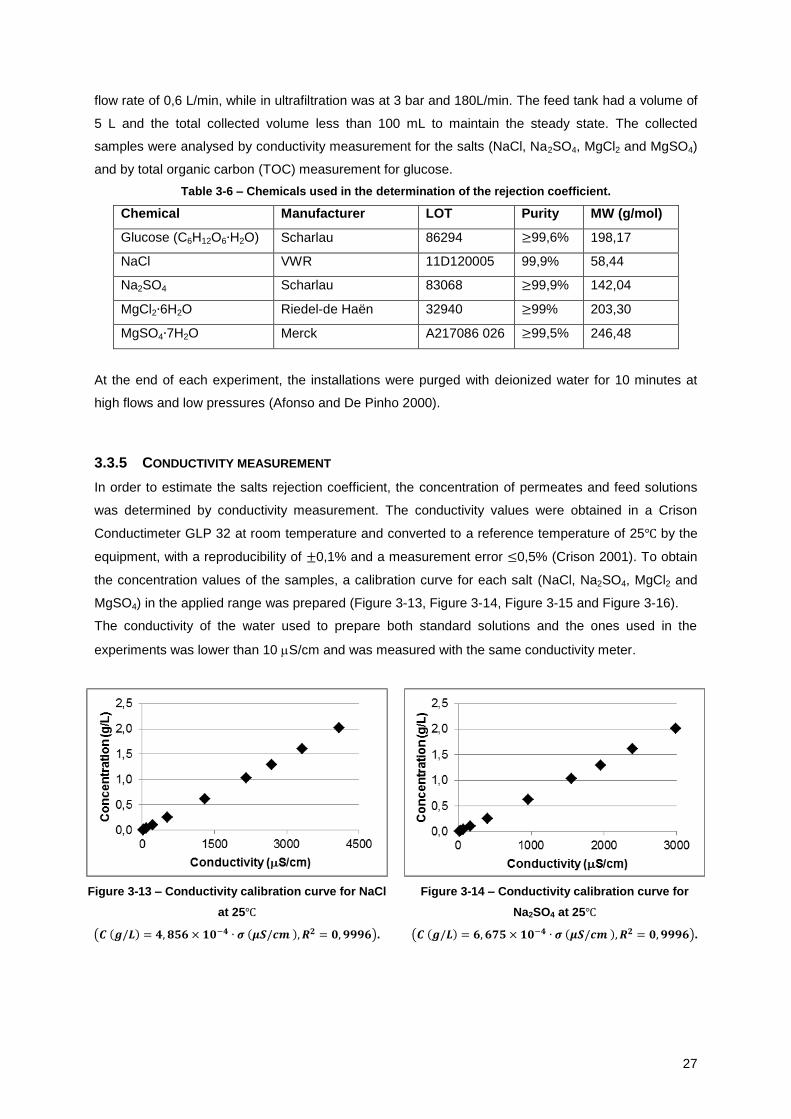
27
flow rate of 0,6 L/min, while in ultrafiltration was at 3 bar and 180L/min. The feed tank had a volume of
5 L and the total collected volume less than 100 mL to maintain the steady state. The collected
samples were analysed by conductivity measurement for the salts (NaCl, Na2SO4, MgCl2 and MgSO4)
and by total organic carbon (TOC) measurement for glucose.
Table 3-6 – Chemicals used in the determination of the rejection coefficient.
Chemical Manufacturer LOT Purity MW (g/mol)
Glucose (C6H12O6∙H2O) Scharlau 86294 ≥99,6% 198,17
NaCl VWR 11D120005 99,9% 58,44
Na2SO4 Scharlau 83068 ≥99,9% 142,04
MgCl2∙6H2O Riedel-de Haën 32940 ≥99% 203,30
MgSO4∙7H2O Merck A217086 026 ≥99,5% 246,48
At the end of each experiment, the installations were purged with deionized water for 10 minutes at
high flows and low pressures (Afonso and De Pinho 2000).
3.3.5 CONDUCTIVITY MEASUREMENT
In order to estimate the salts rejection coefficient, the concentration of permeates and feed solutions
was determined by conductivity measurement. The conductivity values were obtained in a Crison
Conductimeter GLP 32 at room temperature and converted to a reference temperature of 25℃ by the
equipment, with a reproducibility of ±0,1% and a measurement error ≤0,5% (Crison 2001). To obtain
the concentration values of the samples, a calibration curve for each salt (NaCl, Na2SO4, MgCl2 and
MgSO4) in the applied range was prepared (Figure 3-13, Figure 3-14, Figure 3-15 and Figure 3-16).
The conductivity of the water used to prepare both standard solutions and the ones used in the
experiments was lower than 10 S/cm and was measured with the same conductivity meter.
Figure 3-13 – Conductivity calibration curve for NaCl
at 25℃
(𝑪 (𝒈/𝑳) = 𝟒, 𝟖𝟓𝟔 × 𝟏𝟎−𝟒 ∙ 𝝈 (𝝁𝑺/𝒄𝒎 ), 𝑹𝟐 = 𝟎, 𝟗𝟗𝟗𝟔).
Figure 3-14 – Conductivity calibration curve for
Na2SO4 at 25℃
(𝑪 (𝒈/𝑳) = 𝟔, 𝟔𝟕𝟓 × 𝟏𝟎−𝟒 ∙ 𝝈 (𝝁𝑺/𝒄𝒎 ), 𝑹𝟐 = 𝟎, 𝟗𝟗𝟗𝟔).

28
Figure 3-15 – Conductivity calibration curve for MgCl2
at 25℃
(𝑪 (𝒈/𝑳) = 𝟗, 𝟔𝟖𝟗 × 𝟏𝟎−𝟒 ∙ 𝝈 (𝝁𝑺/𝒄𝒎 ), 𝑹𝟐 = 𝟎, 𝟗𝟗𝟗𝟕).
Figure 3-16 – Conductivity calibration curve for
MgSO4 at 25℃ (𝑪 (𝒈/𝑳) = 𝟐, 𝟖𝟕𝟎 × 𝟏𝟎−𝟕 ∙ 𝝈𝟐 +
𝟏, 𝟏𝟑𝟗 × 𝟏𝟎−𝟑 ∙ 𝝈(𝝁𝑺/𝒄𝒎 ), 𝑹𝟐 = 𝟎, 𝟗𝟗𝟗𝟒).
3.3.6 TOTAL ORGANIC CARBON MEASUREMENT
To obtain the membranes rejection coefficient for glucose, the total organic carbon content was
measured in a Shimadzu Total Organic Carbon Analyser TOC-VCSH (Figure 3-17). To analyse the
collected samples, a calibration curve with a wide range of glucose concentrations was acquired
(Figure 3-18). The TOC values were measured as total carbon (TC) since inorganic carbon (IC) was
previously eliminated (Equation 3.4). Both permeates, feed and calibration curve solutions were
acidified with 10 L of concentrated sulfuric acid to a pH lower than 2 and then agitated to purge the
volatile organic carbon (American Public Health Association, American Water Works Association
1999). A dilution was then made (usually 1:10) to avoid high carbon concentrations and corrosive
effect from a low pH solution.
The temperature of the equipment furnace was at 680℃ and the reconstituted air pressure at 200 kPa
(Corporation 2009).
𝑇𝑂𝐶 = 𝑇𝐶 − 𝐼𝐶 (3.4)
Figure 3-17 – Shimadzu Total Organic Carbon Analyser TOC-VCSH.

29
Figure 3-18 – TOC calibration curve for glucose (𝑪 (𝒑𝒑𝒎) = 𝟎, 𝟔𝟐𝟐𝟕 ∙ 𝑨𝒓𝒆𝒂 − 𝟏𝟐, 𝟑𝟗, 𝑹𝟐 = 𝟎, 𝟗𝟗𝟗𝟑).
3.4 CHARACTERIZATION TECHNIQUES
3.4.1 UV-VIS SPECTROSCOPY
In order to characterize the formation of silver nanoparticles and to conclude about formamide use as
a reducing agent, UV-Vis spectra were obtained in a UV-Vis spectrophotometer with diode array
detector coupled to a DH-2000-BAL UV-VIS-NIR light source from Micropack and Spectra Suite
software (Figure 3-19). Deionized water was used as the reference sample to take the blank spectrum
for all measurements.
Figure 3-19 – UV-Vis spectrophotometer.
To conclude about the type of silver particles, three spectra were acquired 30 minutes, three days and
four months after the silver nanoparticles preparation. The first two spectra were diluted several times
and had an unknown concentration. The spectrum acquired after 120 days had a suspension
concentration of 0,016 gAg/L. Normalizations by peak and by area were made to easily compare the
three obtained spectra.
The formation of the silver nanoparticles suspension was captured in the UV-Vis spectrophotometer.
In the 1 mL spectrophotometer cell, 10 L of the NaBH4 solution (0,02 mol/L) were added to 700 L of
the AgNO3 solution (0,06 mol/L) (both compounds were dissolved in an aqueous solution of PVP),
homogenized with a magnetic stirrer. From the variation of maximum absorbance with time it was
possible to obtain the kinetics of the formation of silver nanoparticles.

30
The effect of the addition of 10 L of formamide to 500 L of the AgNO3 solution (solution used in the
formation of the silver nanoparticles, 0,06 mol/L) was also monitored in the UV-Vis spectrophotometer.
The shape of the curves is sensitive to particle size, shape and polydispersity (Widoniak, Eiden-
Assmann, and Maret 2005).
3.4.2 ELECTROCHEMICAL STUDIES
Cyclic voltammetry (CV) consists in the measurement of the current intensity at the working electrode
during the potential scan, being considered the response signal to the potential excitation signal,
resulting in a current-potential curve (Kissinger and Heineman 1983). This method was used to
investigate the electrochemical behaviour of the silver inside the porous structure of the used zeolite.
The electrode consisted in a mixture of zeolite with graphite powder, in a 2:1 (w/w) proportion, a
membrane or a membrane placed between two layers of conductive powder (Figure 3-20). The
membranes were cut in the pellet press assembly layout (Figure 3-21) by inserting the membrane in
the chamber and pressing it with the piston.
The homogenised pellets, which weighted around 5,5 mg, were prepared by simple mixture and
subjected to a total applied pressure of 0,5 tonnes during 10 minutes in a PIKE CrushIR hydraulic
press (Figure 3-22). As in Figure 3-23, the pellets were then placed in a three-electrode cell, in contact
with a platinum auxiliary electrode disc, filled with 5 mL of 0,2 M electrolyte solution of optical grade
NaCl (99,99%, Aldrich), and the potentials measured using a silver reference electrode in a Luggin
tube (Lemos et al. 1999).
Figure 3-20 – Schematic representation of the
electrodes used: A) zeolite/graphite pellet; B)
membrane; C) membrane/graphite pellet.
Figure 3-21 – Pellet press assembly layout.
Figure 3-22 – PIKE CrushIR hydraulic press.
Figure 3-23 – Electrochemical cell used to study
the electrochemical behaviour of silver entrapped
inside zeolites.

31
Figure 3-24 – Potentiostat/Potential programmer and data acquisition unit for cyclic voltammetry.
A pellet of silver nanoparticles was made evaporating the suspension in a watch glass during 72
hours. The cyclic voltammetry of this pellet was not possible to perform since it dissolved in the
aqueous solution of NaCl. The experiment should be made using a different electrolyte.
The electrochemical studies were carried out in a Radiometer/Copenhagen DEA101 digital
electrochemical analyser, coupled to an IMT102 electrochemical interface, controlled by a computer,
which also acquired the data (
Figure 3-24).
The results obtained using the membrane/graphite pellets were not reproducible and conclusive.
3.4.3 THERMOGRAVIMETRIC ANALYSIS
The thermogravimetric analysis (TGA) measures the amount of change in the weight of a material as
a function of temperature or time when the sample is subjected to a controlled temperature
programme in a controlled atmosphere (Dean 2014). This technique was used to indirectly
characterize the membranes in terms of their composition.
This analysis was performed in a PerkinElmer STA 6000 (Figure 3-25) coupled to a Pyris Software
and a F12-ED Refrigerated/Heating Circulator from Julabo (Figure 3-26). The membranes were cut in
small pieces with a total approximate weight of 20 mg, accommodated in a ceramic pan and then
placed over the precision balance. For the sample atmosphere, air was used as the oxidative gas, with
a purge rate of 20 mL/minute. The defined temperature scanning programme was the following: hold
for 10 min at 30℃, heat from 30℃ to 110℃ at 10℃/min, hold for 15 min at 110℃, heat from 110℃ to
800℃ at 10℃/min, hold for 10 min at 800℃ and cool from 800℃ to 30℃ at 50℃/min (Figure 3-27) (Inc.
2004).
In the acquired TGA thermal curves, the absorbed water was lost up to the first isothermal step and it
was possible to calculate the evaporated water percentage. The volatile organic matter and other
components were lost in the next step of the programme (Bower and Yu 2011) and the remaining,
zeolite and silver, compared with the initial percentage weighted for the casting solution. The CA400-
30 membrane was considered as the reference value for weight loss.

32
Figure 3-25 – STA 6000 from PerkinElmer.
Figure 3-26 – TGA data acquisition unit.
Figure 3-27 – Temperature scanning programme: A) 30℃ for 10 min; B) 30℃ to 110℃, 10℃/min; C) 110℃
for 15 min; D) 110℃ to 800℃, 10℃/min; E) 800℃ for 10 min; F) 800℃ to 30℃, 50℃/min.
3.4.4 DETERMINATION OF THE ZETA POTENTIAL
The surface charge properties of a membrane used in aqueous applications strongly influences fouling
processes and retention capacity and can be described measuring zeta potential (Xie, Saito, and
Hickner 2011). This technique is influenced by surface composition, pH, nature of ions and ionic
strength (Bhattacharjee 2016). This method can also be used to determine the extent and efficiency of
chemical modification, such as silver exchanged zeolite (Thielbeer, Donaldson, and Bradley 2011).
In the presence of a liquid-solid interface, the solid component acquires a surface charge that attracts
counter ions from the liquid (Lauffer and Gortner 1939). These immobilized opposite charges are
located in the outer Helmholtz plane (OHP) compensating the charges of the specifically adsorbed
ions present in the inner Helmholtz plane (IHP). At the end of OHP, a more diffuse layer appears,
formed by mobile ions attracted by the surface charge. The two adjacent layers (Stern layer and
diffuse layer), separated by a plane of shear, form the electrochemical double layer (EDL). The
potential between the slip plane and the medium is the zeta potential (Figure 3-28) (Delgado et al.
A
B C
D
E
F
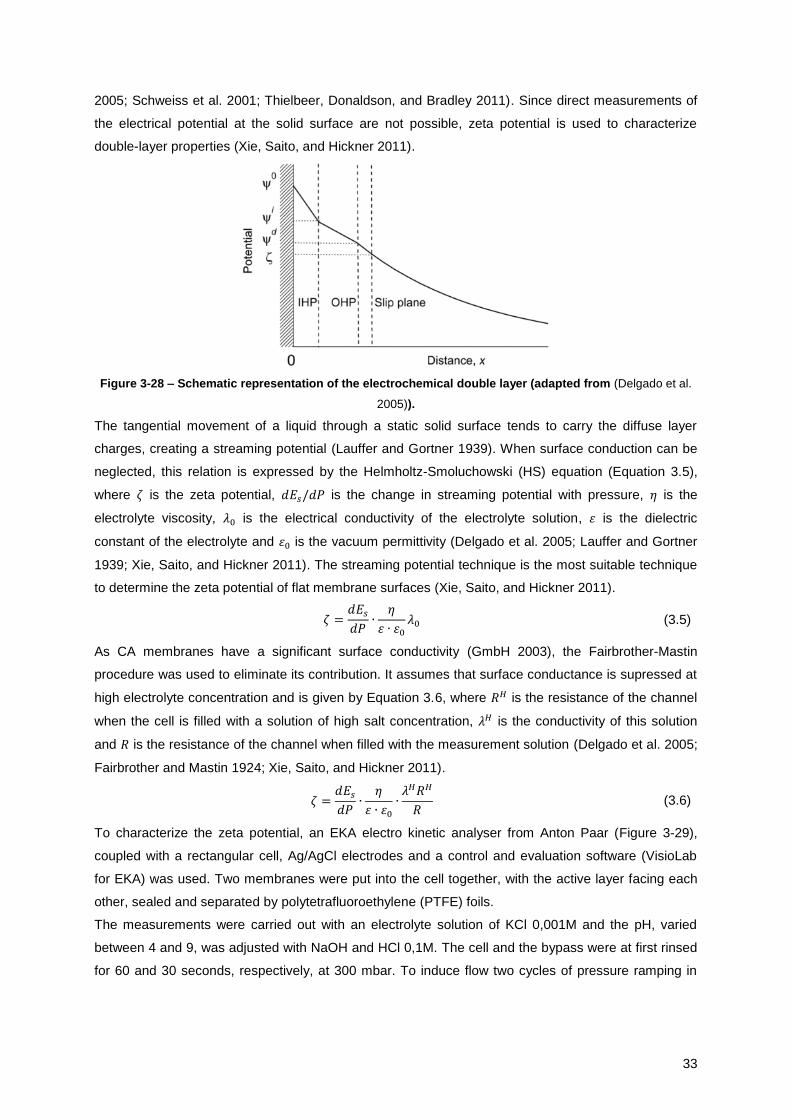
33
2005; Schweiss et al. 2001; Thielbeer, Donaldson, and Bradley 2011). Since direct measurements of
the electrical potential at the solid surface are not possible, zeta potential is used to characterize
double-layer properties (Xie, Saito, and Hickner 2011).
Figure 3-28 – Schematic representation of the electrochemical double layer (adapted from (Delgado et al.
2005)).
The tangential movement of a liquid through a static solid surface tends to carry the diffuse layer
charges, creating a streaming potential (Lauffer and Gortner 1939). When surface conduction can be
neglected, this relation is expressed by the Helmholtz-Smoluchowski (HS) equation (Equation 3.5),
where 𝜁 is the zeta potential, 𝑑𝐸𝑠/𝑑𝑃 is the change in streaming potential with pressure, 𝜂 is the
electrolyte viscosity, 𝜆0 is the electrical conductivity of the electrolyte solution, 𝜀 is the dielectric
constant of the electrolyte and 𝜀0 is the vacuum permittivity (Delgado et al. 2005; Lauffer and Gortner
1939; Xie, Saito, and Hickner 2011). The streaming potential technique is the most suitable technique
to determine the zeta potential of flat membrane surfaces (Xie, Saito, and Hickner 2011).
𝜁 =𝑑𝐸𝑠
𝑑𝑃∙
𝜂
𝜀 ∙ 𝜀0
𝜆0 (3.5)
As CA membranes have a significant surface conductivity (GmbH 2003), the Fairbrother-Mastin
procedure was used to eliminate its contribution. It assumes that surface conductance is supressed at
high electrolyte concentration and is given by Equation 3.6, where 𝑅𝐻 is the resistance of the channel
when the cell is filled with a solution of high salt concentration, 𝜆𝐻 is the conductivity of this solution
and 𝑅 is the resistance of the channel when filled with the measurement solution (Delgado et al. 2005;
Fairbrother and Mastin 1924; Xie, Saito, and Hickner 2011).
𝜁 =𝑑𝐸𝑠
𝑑𝑃∙
𝜂
𝜀 ∙ 𝜀0
∙𝜆𝐻𝑅𝐻
𝑅 (3.6)
To characterize the zeta potential, an EKA electro kinetic analyser from Anton Paar (Figure 3-29),
coupled with a rectangular cell, Ag/AgCl electrodes and a control and evaluation software (VisioLab
for EKA) was used. Two membranes were put into the cell together, with the active layer facing each
other, sealed and separated by polytetrafluoroethylene (PTFE) foils.
The measurements were carried out with an electrolyte solution of KCl 0,001M and the pH, varied
between 4 and 9, was adjusted with NaOH and HCl 0,1M. The cell and the bypass were at first rinsed
for 60 and 30 seconds, respectively, at 300 mbar. To induce flow two cycles of pressure ramping in
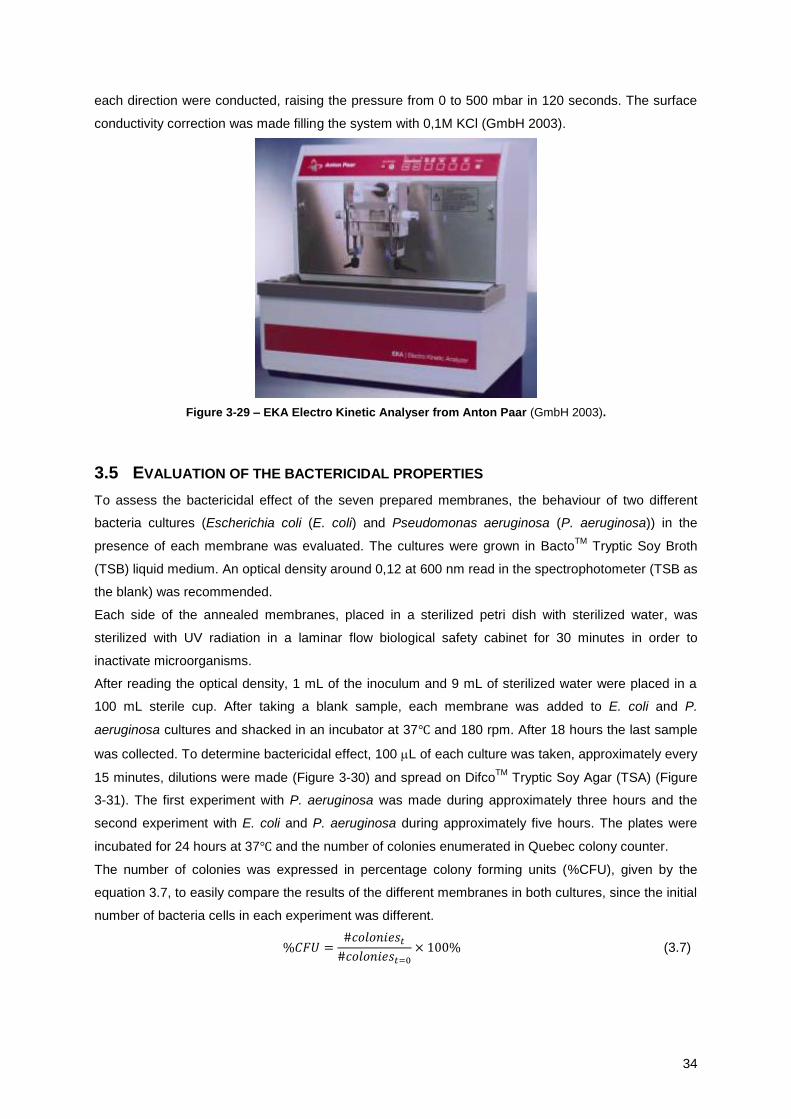
34
each direction were conducted, raising the pressure from 0 to 500 mbar in 120 seconds. The surface
conductivity correction was made filling the system with 0,1M KCl (GmbH 2003).
Figure 3-29 – EKA Electro Kinetic Analyser from Anton Paar (GmbH 2003).
3.5 EVALUATION OF THE BACTERICIDAL PROPERTIES
To assess the bactericidal effect of the seven prepared membranes, the behaviour of two different
bacteria cultures (Escherichia coli (E. coli) and Pseudomonas aeruginosa (P. aeruginosa)) in the
presence of each membrane was evaluated. The cultures were grown in BactoTM
Tryptic Soy Broth
(TSB) liquid medium. An optical density around 0,12 at 600 nm read in the spectrophotometer (TSB as
the blank) was recommended.
Each side of the annealed membranes, placed in a sterilized petri dish with sterilized water, was
sterilized with UV radiation in a laminar flow biological safety cabinet for 30 minutes in order to
inactivate microorganisms.
After reading the optical density, 1 mL of the inoculum and 9 mL of sterilized water were placed in a
100 mL sterile cup. After taking a blank sample, each membrane was added to E. coli and P.
aeruginosa cultures and shacked in an incubator at 37℃ and 180 rpm. After 18 hours the last sample
was collected. To determine bactericidal effect, 100 L of each culture was taken, approximately every
15 minutes, dilutions were made (Figure 3-30) and spread on DifcoTM
Tryptic Soy Agar (TSA) (Figure
3-31). The first experiment with P. aeruginosa was made during approximately three hours and the
second experiment with E. coli and P. aeruginosa during approximately five hours. The plates were
incubated for 24 hours at 37℃ and the number of colonies enumerated in Quebec colony counter.
The number of colonies was expressed in percentage colony forming units (%CFU), given by the
equation 3.7, to easily compare the results of the different membranes in both cultures, since the initial
number of bacteria cells in each experiment was different.
%𝐶𝐹𝑈 =#𝑐𝑜𝑙𝑜𝑛𝑖𝑒𝑠𝑡
#𝑐𝑜𝑙𝑜𝑛𝑖𝑒𝑠𝑡=0
× 100% (3.7)

35
Figure 3-30 – Dilutions of the collected samples (adapted from (Prescott, Klein, and Harley 2002)).
Figure 3-31 – Spread-Plate Technique (Prescott, Klein, and Harley 2002).
To evaluate the growth of the cultures in the presence of ZSM-5 zeolite and silver containing zeolite,
33,3 L of E. coli and P. aeruginosa cultures were placed in a petri dish with TSA in each part. In the
experiment it was used zeolite, with and without silver, sterilized in two different ways: autoclave and
by UV radiation. The zeolite was spread in two parts of the petri dish, the remaining being the blank
(Figure 3-32).
Figure 3-32 – Tripartite petri dish with spread zeolite.

36
The plates were incubated for 24 hours at 37℃. The results consisted in the evaluation of bacterial
growth in the presence of ZSM-5 zeolite/ZAg, compared to the blank sample.

37
4 RESULTS AND DISCUSSION
4.1 HYDRAULIC PERMEABILITY
The hydraulic permeability coefficient (𝐿𝑝), which describes the linear variation of the pure water
permeation fluxes (𝐽𝑝𝑤) as a function of applied transmembrane pressure (∆𝑃), was determined for the
seven prepared membranes, as described in chapter 3.3.3, for the ultrafiltration and nanofiltration
membranes (Figure 4-1 - Figure 4-9 and Figure 4-10 - Figure 4-18, respectively).
Figure 4-1 – Pure water fluxes of the ultrafiltration membranes at a pressure range of 1 - 5 bar.
Figure 4-2 – Pure water fluxes of the UFCA400-30
membrane at a pressure range of 1 - 5 bar
(𝑱𝒑𝒘 [𝒌𝒈/(𝒉 ∙ 𝒎𝟐)] = 𝟒𝟒, 𝟐 ∙ ∆𝑷 (𝒃𝒂𝒓), 𝑹𝟐 = 𝟎, 𝟗𝟗𝟖𝟓).
Figure 4-3 – Pure water fluxes of the UFCA400-
30ZSM5 membrane at a pressure range of 1 - 5 bar
(𝑱𝒑𝒘 [𝒌𝒈/(𝒉 ∙ 𝒎𝟐)] = 𝟐𝟎, 𝟗 ∙ ∆𝑷 (𝒃𝒂𝒓), 𝑹𝟐 = 𝟎, 𝟗𝟗𝟔𝟓).
Figure 4-4 – Pure water fluxes of the UFCA400-
30Ag0,14 membrane at a pressure range of 1 - 5 bar
(𝑱𝒑𝒘 [𝒌𝒈/(𝒉 ∙ 𝒎𝟐)] = 𝟔𝟏, 𝟔 ∙ ∆𝑷 (𝒃𝒂𝒓), 𝑹𝟐 = 𝟎, 𝟗𝟗𝟕𝟏).
Figure 4-5 – Pure water fluxes of the UFCA400-
30ZAg0,005 membrane at a pressure range of 1 - 5
bar (𝑱𝒑𝒘 [𝒌𝒈/(𝒉 ∙ 𝒎𝟐)] = 𝟏𝟐, 𝟔 ∙ ∆𝑷 (𝒃𝒂𝒓), 𝑹𝟐 = 𝟎, 𝟗𝟗𝟗𝟏).

38
Figure 4-6 – Pure water fluxes of the UFCA400-
30ZAg0,03 membrane at a pressure range of 1 - 5 bar
(𝑱𝒑𝒘 [𝒌𝒈/(𝒉 ∙ 𝒎𝟐)] = 𝟏𝟖, 𝟎 ∙ ∆𝑷 (𝒃𝒂𝒓), 𝑹𝟐 = 𝟎, 𝟗𝟗𝟑𝟔).
Figure 4-7 – Pure water fluxes of the UFCA400-
30ZAg0,07 membrane at a pressure range of 1 - 5 bar
(𝑱𝒑𝒘 [𝒌𝒈/(𝒉 ∙ 𝒎𝟐)] = 𝟒𝟏, 𝟖 ∙ ∆𝑷 (𝒃𝒂𝒓), 𝑹𝟐 = 𝟎, 𝟗𝟗𝟑𝟑).
Figure 4-8 – Pure water fluxes of the UFCA400-30ZAg0,14 membrane at a pressure range of 1 - 5 bar
(𝑱𝒑𝒘 [𝒌𝒈/(𝒉 ∙ 𝒎𝟐)] = 𝟐𝟖, 𝟒 ∙ ∆𝑷 (𝒃𝒂𝒓), 𝑹𝟐 = 𝟎, 𝟗𝟗𝟗𝟓).
Figure 4-9 – Comparison of the hydraulic permeability of the ultrafiltration membranes.
From the comparison of the values obtained for the hydraulic permeability of the different ultrafiltration
membranes (Figure 4-9), it can be stated that the incorporation of materials influences this
characterization parameter. The incorporation of silver nanoparticles, as reported by Figueiredo
(Figueiredo 2016), increases the hydraulic permeability of the membrane in comparison with the
cellulose acetate membrane (UFCA400-30Ag0,14 has an hydraulic permeability 39,6% higher than
UFCA400-30). This can be explained by the fact that silver nanoparticles prepared ex-situ are
preferentially located in the skin layer of the membrane and are hydrophilic (Sile-Yuksel et al. 2014). In
contrast, the incorporation of ZSM-5 zeolite decreases the hydraulic permeability of the membrane in
52,6% when compared with the CA membrane. This fact can be attributed to the hydrophobicity of the

39
ZSM-5 zeolite (J. Caro, Bülow, and Schirmer 1985) and the macrovoids reduction (Pendergast and
Hoek 2011). The addition of silver containing zeolite to the membrane also decreases the hydraulic
permeability, which becomes more pronounced with the increasing concentration (71,5%, 59,2% and
5,3% lower than the CA membrane). The UFCA400-30ZAg0,14 membrane does not follow the
tendency (hydraulic permeability 35,6% lower than UFCA400-30), probably indicating the existence of
a maximum silver zeolite concentration from which the hydraulic permeability decreases (Koseoglu-
Imer et al. 2013).
Figure 4-10 – Pure water fluxes of the nanofiltration membranes at a pressure range of 5 - 40 bar.
Figure 4-11 – Pure water fluxes of the NFCA400-30
membrane at a pressure range of 5 - 40 bar
(𝑱𝒑𝒘 [𝒌𝒈/(𝒉 ∙ 𝒎𝟐)] = 𝟏, 𝟖 ∙ ∆𝑷 (𝒃𝒂𝒓), 𝑹𝟐 = 𝟎, 𝟗𝟗𝟗𝟒).
Figure 4-12 – Pure water fluxes of the NFCA400-
30ZSM5 membrane at a pressure range of 5 - 40 bar
(𝑱𝒑𝒘 [𝒌𝒈/(𝒉 ∙ 𝒎𝟐)] = 𝟏, 𝟗 ∙ ∆𝑷 (𝒃𝒂𝒓), 𝑹𝟐 = 𝟎, 𝟗𝟗𝟗𝟐).
Figure 4-13 – Pure water fluxes of the NFCA400-
30Ag0,14 membrane at a pressure range of 5 - 40 bar
(𝑱𝒑𝒘 [𝒌𝒈/(𝒉 ∙ 𝒎𝟐)] = 𝟑, 𝟑 ∙ ∆𝑷 (𝒃𝒂𝒓), 𝑹𝟐 = 𝟎, 𝟗𝟗𝟏𝟖).
Figure 4-14 – Pure water fluxes of the NFCA400-
30ZAg0,005 membrane at a pressure range of 5 - 40
bar (𝑱𝒑𝒘 [𝒌𝒈/(𝒉 ∙ 𝒎𝟐)] = 𝟏, 𝟔 ∙ ∆𝑷 (𝒃𝒂𝒓), 𝑹𝟐 = 𝟎, 𝟗𝟗𝟗𝟑).

40
Figure 4-15 – Pure water fluxes of the NFCA400-
30ZAg0,03 membrane at a pressure range of 5 - 40 bar
(𝑱𝒑𝒘 [𝒌𝒈/(𝒉 ∙ 𝒎𝟐)] = 𝟏, 𝟕 ∙ ∆𝑷 (𝒃𝒂𝒓), 𝑹𝟐 = 𝟎, 𝟗𝟗𝟐𝟓).
Figure 4-16 – Pure water fluxes of the NFCA400-
30ZAg0,07 membrane at a pressure range of 5 - 40
bar (𝑱𝒑𝒘 [𝒌𝒈/(𝒉 ∙ 𝒎𝟐)] = 𝟐, 𝟔 ∙ ∆𝑷 (𝒃𝒂𝒓), 𝑹𝟐 = 𝟎, 𝟗𝟗𝟖𝟗).
Figure 4-17 – Pure water fluxes of the NFCA400-30ZAg0,14 membrane at a pressure range of 5 - 40 bar
(𝑱𝒑𝒘 [𝒌𝒈/(𝒉 ∙ 𝒎𝟐)] = 𝟏, 𝟒 ∙ ∆𝑷 (𝒃𝒂𝒓), 𝑹𝟐 = 𝟎, 𝟗𝟗𝟒𝟐).
Figure 4-18 – Comparison of the hydraulic permeability of the nanofiltration membranes.
After the annealing treatment, the hydraulic permeability of the nanofiltration membranes decreased
from tens to units. The incorporation of materials influences this parameter, although not as much as
seen in ultrafiltration membranes. The hydraulic permeability increases with the addition of silver
nanoparticles comparing with the cellulose acetate membrane, as reported by Beisl (Beisl 2015), an
increase of 83,1% that is more enhanced in the nanofiltration membrane. The ZSM-5 zeolite
incorporation also increases the hydraulic permeability (4,5% higher than NFCA400-30), which
contrasts with the result obtained with the ultrafiltration membranes (decrease of 52,6% compared
with UFCA400-30). The silver containing zeolite membranes with lower silver concentration,
NFCA400-30ZAg0,005 and NFCA400-30ZAg0,03, have lower hydraulic permeability than the CA

41
membrane, with a decrease of 9,7% and 3,2%, respectively, and the value of the NFCA40030ZAg0,07
membrane is 44,8% higher. The NFCA400-30ZAg0,14 membrane, as mentioned for the ultrafiltration
membrane, does not follow the tendency (hydraulic permeability 21,5% lower than NFCA400-30).
The hydraulic permeability obtained for the CA400-30ZAg0,14P membrane, annealed in a heating
plate as explained in chapter 3.2.5, was 0,2 kg/(h∙m2∙bar), 85,7% lower than the CA400-30ZAg0,14
membrane. This is due to the high dependency of hydraulic permeability of CA-400 membranes with
temperature: a higher annealing temperature leads to a decrease on hydraulic permeability (De Pinho
1988).
4.2 REJECTION COEFFICIENTS TO SOLUTES
The rejection coefficient, which reveals the solute fraction that was retained by the membrane, was
determined for the seven prepared membranes, as described in chapters 3.3.4, 3.3.5 and 3.3.6. This
parameter was obtained for NaCl, Na2SO4, MgCl2, MgSO4 and glucose and the results are presented
in Table 4-1 and Figure 4-19 for ultrafiltration membranes and in Table 4-2 and Figure 4-20 for
nanofiltration membranes.
Table 4-1 – Rejection coefficients for NaCl, Na2SO4, MgCl2, MgSO4 and glucose for ultrafiltration
membranes.
Rejection coefficient (%) NaCl Na2SO4 MgCl2.6H2O MgSO4
.7H2O Glucose
UFCA400-30 27,4 29,1 25,0 39,0 18,8
UFCA400-30ZSM5 55,7 50,8 48,3 58,5 41,1
UFCA400-30Ag0,14 17,0 10,0 6,8 12,4 4,2
UFCA400-30ZAg0,005 78,9 50,7 35,0 77,0 74,0
UFCA400-30ZAg0,03 61,0 59,7 55,9 71,1 49,7
UFCA400-30ZAg0,07 21,6 23,1 17,0 29,0 13,6
UFCA400-30ZAg0,14 22,0 27,9 30,8 35,3 29,6
Figure 4-19 – Rejection coefficients for NaCl, Na2SO4, MgCl2, MgSO4 and glucose for ultrafiltration
membranes.
The rejection coefficient of the UFCA400-30 membrane for NaCl, Na2SO4, MgCl2, MgSO4 and glucose
are, respectively, 27,4%, 29,1%, 25,0%, 39,0% and 18,8%. The UFCA400-30Ag0,14 has rejection
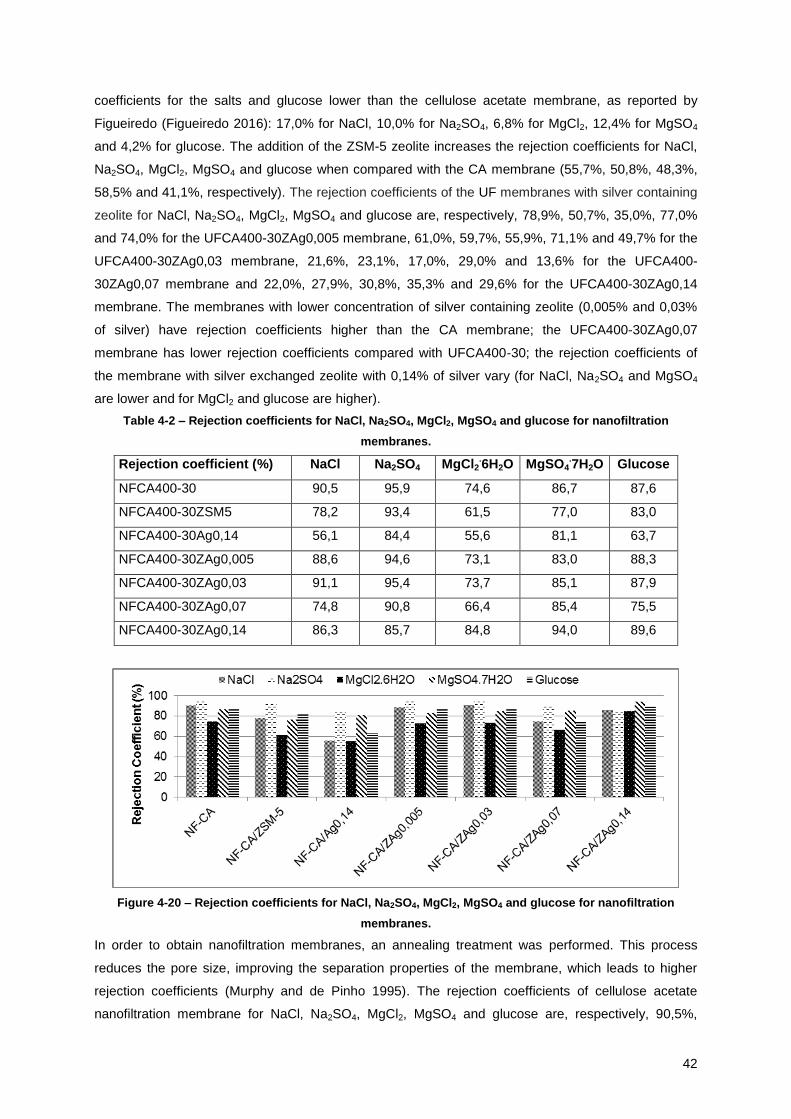
42
coefficients for the salts and glucose lower than the cellulose acetate membrane, as reported by
Figueiredo (Figueiredo 2016): 17,0% for NaCl, 10,0% for Na2SO4, 6,8% for MgCl2, 12,4% for MgSO4
and 4,2% for glucose. The addition of the ZSM-5 zeolite increases the rejection coefficients for NaCl,
Na2SO4, MgCl2, MgSO4 and glucose when compared with the CA membrane (55,7%, 50,8%, 48,3%,
58,5% and 41,1%, respectively). The rejection coefficients of the UF membranes with silver containing
zeolite for NaCl, Na2SO4, MgCl2, MgSO4 and glucose are, respectively, 78,9%, 50,7%, 35,0%, 77,0%
and 74,0% for the UFCA400-30ZAg0,005 membrane, 61,0%, 59,7%, 55,9%, 71,1% and 49,7% for the
UFCA400-30ZAg0,03 membrane, 21,6%, 23,1%, 17,0%, 29,0% and 13,6% for the UFCA400-
30ZAg0,07 membrane and 22,0%, 27,9%, 30,8%, 35,3% and 29,6% for the UFCA400-30ZAg0,14
membrane. The membranes with lower concentration of silver containing zeolite (0,005% and 0,03%
of silver) have rejection coefficients higher than the CA membrane; the UFCA400-30ZAg0,07
membrane has lower rejection coefficients compared with UFCA400-30; the rejection coefficients of
the membrane with silver exchanged zeolite with 0,14% of silver vary (for NaCl, Na2SO4 and MgSO4
are lower and for MgCl2 and glucose are higher).
Table 4-2 – Rejection coefficients for NaCl, Na2SO4, MgCl2, MgSO4 and glucose for nanofiltration
membranes.
Rejection coefficient (%) NaCl Na2SO4 MgCl2.6H2O MgSO4
.7H2O Glucose
NFCA400-30 90,5 95,9 74,6 86,7 87,6
NFCA400-30ZSM5 78,2 93,4 61,5 77,0 83,0
NFCA400-30Ag0,14 56,1 84,4 55,6 81,1 63,7
NFCA400-30ZAg0,005 88,6 94,6 73,1 83,0 88,3
NFCA400-30ZAg0,03 91,1 95,4 73,7 85,1 87,9
NFCA400-30ZAg0,07 74,8 90,8 66,4 85,4 75,5
NFCA400-30ZAg0,14 86,3 85,7 84,8 94,0 89,6
Figure 4-20 – Rejection coefficients for NaCl, Na2SO4, MgCl2, MgSO4 and glucose for nanofiltration
membranes.
In order to obtain nanofiltration membranes, an annealing treatment was performed. This process
reduces the pore size, improving the separation properties of the membrane, which leads to higher
rejection coefficients (Murphy and de Pinho 1995). The rejection coefficients of cellulose acetate
nanofiltration membrane for NaCl, Na2SO4, MgCl2, MgSO4 and glucose are, respectively, 90,5%,

43
95,9%, 74,6%, 86,7% and 87,6%. The NF membrane with silver nanoparticles, NFCA400-30Ag0,14,
has rejection coefficients for the salts and glucose lower than the NFCA400-30 membrane, as
reported by Beisl (Beisl 2015): 56,1% for NaCl, 84,4% for Na2SO4, 55,6% for MgCl2, 81,1% for MgSO4
and 63,7% for glucose. The addition of the ZSM-5 zeolite also decreases the rejection coefficients for
NaCl, Na2SO4, MgCl2, MgSO4 and glucose when compared with the CA membrane (78,2%, 93,4%,
61,5%, 77,0% and 83,0%, respectively). This result is similar to the NF membrane with incorporated -
zeolite used by Beisl (Beisl 2015), although the rejection coefficient decrease is less pronounced. The
rejection coefficients of the NF membranes with silver containing zeolite for NaCl, Na2SO4, MgCl2,
MgSO4 and glucose are, respectively, 88,6%, 94,6%, 73,1%, 83,0% and 88,3% for the NFCA400-
30ZAg0,005 membrane, 91,1%, 95,4%, 73,7%, 85,1% and 87,9% for the NFCA400-30ZAg0,03
membrane, 74,8%, 90,8%, 66,4%, 85,4% and 75,5% for the NFCA400-30ZAg0,07 membrane and
86,3%, 85,7%, 84,8%, 94,0% and 89,6% for the NFCA400-30ZAg0,14 membrane. The majority of the
rejection coefficients results for these membranes are lower than the ones obtained for the NFCA400-
30 membrane, except for the following: NFCA400-30ZAg0,005 with 88,3% for glucose, NFCA400-
30ZAg0,03 with 91,1% for NaCl and 87,9% for glucose and NFCA400-30ZAg0,14 with 84,8% for
MgCl2, 94,0% for MgSO4 and 89,6% for glucose.
The rejection coefficients are higher for the Na2SO4 salt, which is related with the negative charge of
the membrane surface and the higher/lower charge density of the anion/cation, resulting in stronger
electrostatic interaction forces with bivalent anions (Afonso and De Pinho 2000).
The membrane with silver containing zeolite with 0,14% of silver content annealed in a heating plate
(NFCA400-30ZAg0,14P) had rejection coefficients for NaCl, Na2SO4, MgCl2, MgSO4 and glucose of,
respectively, 98,7%, 76,1%, 87,2%, 87,1% and 96,9%. The obtained values for NaCl, MgCl2 and
glucose are higher than the ones of the NF4CA400-30ZAg0,14 membrane, which annealing was
performed in a thermic bath (De Pinho 1988).
4.3 UV-VIS SPECTROSCOPY
The three UV absorption spectra of the silver nanoparticles suspension, normalized by peak and by
area, at different time periods, are presented in Figure 4-21 and Figure 4-22, respectively.
As the spectra exhibit a single band with peaks in the typical absorption band range (around 400 nm)
and have no visible peak at 600 nm, it can be stated that the prepared suspension has well-dispersed
spherical silver nanoparticles (Desai et al. 2012). However, the red shift of the maximum absorption
with time from 401 nm in day 1, to 402 nm in day 4 and to 413 nm in day 120 with the bandwidth
increase in the last spectrum indicates an increase in the particle size and a possible aggregation
(Zielińska et al. 2009). The diameter of the silver nanoparticles, according to the obtained spectrum in
day 1, is 3,2 nm ± 0,2 nm (Baia and Simon 2007; Desai et al. 2012).
The formation of the silver nanoparticles and the effect of maturing time at initial concentration of 0,01
mL of reducing agent NaBH4 is presented in Figure 4-23.

44
Figure 4-21 – UV absorption spectra normalized by peak of silver nanoparticles suspension at different
time periods.
Figure 4-22 – UV absorption spectra normalized by area of silver nanoparticles suspension at different
time periods.
Figure 4-23 – Effect of maturing time at initial concentration of 0,01 mL of reducing agent NaBH4.
It is possible to see in Figure 4-23 that the formation of silver nanoparticles prepared at fixed
concentration of 0,01 mL of reducing agent NaBH4 exhibits absorption peaks around 400 nm, with an
increasing absorbance with time (between 0 and 1,4).
From the variation of maximum absorbance with time it was possible to obtain first and second order
kinetics of the formation of silver nanoparticles, given by Equation 4.1 and Equation 4.2, respectively.

45
𝐴(𝑡) = 1,34(1 − 𝑒−2,09𝑡) (4.1)
𝐴(𝑡) = 1,49 −1
1,87𝑡 + 0,67 (4.2)
As it can be seen in Figure 4-24, the second order kinetics of the silver nanoparticles formation has
the best fitting to the experimental points, with 0,02 as residue sum. The first order kinetics has a
residue sum of 0,07.
Figure 4-24 – Variation of maximum absorbance with time in the formation of silver nanoparticles.
The effect of the addition of formamide to an aqueous solution of AgNO3 solution is presented in
Figure 4-25. The addition of formamide leads to the appearance of a broad extinction band, which can
indicate the presence of different distributions of particles sizes: at lower wavelength, well-dispersed
spherical nanoparticles and, at longer wavelength, aggregates of primary particles interacting
collectively with the incident light as a large silver particle (Desai et al. 2012; Widoniak, Eiden-
Assmann, and Maret 2005).
Figure 4-25 – UV absorption spectra of formamide addition to an aqueous solution of AgNO3 (dissolved
with PVP).
4.4 ELECTROCHEMICAL STUDIES
Cyclic voltammetry analysis, as explained in chapter 3.4.2, was used in order to determine the
electrochemical state of the silver in the ion exchanged zeolite, either in powder or incorporated in a
membrane.

46
4.4.1 ZEOLITE/GRAPHITE PELLET
The CV curves obtained for the calcined ZSM-5 zeolite and silver exchanged zeolite, starting with a
reduction cycle, are presented in Figure 4-26 and Figure 4-27. The CV curves obtained for the
calcined silver exchanged zeolite, starting with an oxidation cycle, are presented in Figure 4-28 and
Figure 4-29.
Figure 4-26 – Cyclic voltammograms of calcined
ZSM-5 zeolite and silver loaded zeolite (initial scan
towards negative potentials: -100mV → -800mV →
950mV → -100mV, scan rate: 10 mV/s, 1st
cycle).
Figure 4-27 – Cyclic voltammograms of calcined
ZSM-5 zeolite and silver loaded zeolite (initial scan
towards negative potentials: -100mV → -800mV →
950mV → -100mV, scan rate: 10 mV/s, 2nd
cycle).
Figure 4-28 – Cyclic voltammogram of calcined
silver loaded zeolite (initial scan towards positive
potentials: 0mV → 950mV → -800mV → 0mV, scan
rate: 10 mV/s, 1st
cycle).
Figure 4-29 – Cyclic voltammogram of calcined
silver loaded zeolite (initial scan towards positive
potentials: 0mV → 950mV → -800mV → 0mV, scan
rate: 10 mV/s, 2nd
cycle).
The voltammogram of the ZSM-5 zeolite has an irreversible reduction peak at -450 mV in the first
cycle (Figure 4-26) that does not appear in the second cycle (Figure 4-27), which may correspond to a
species adsorbed. The voltammograms of the silver exchanged zeolite, starting towards negative
potentials (Figure 4-26 and Figure 4-27), show a reduction peak at around -750 mV and in the reverse
cycle an oxidation peak around 250 mV, with an amount of electric charge of, respectively, 13,4 mC
and 6,5 mC for the first cycle and 8,4 mC and 6,4 mC for the second cycle. Comparing both CV
curves for zeolite and silver loaded zeolite, it can be stated that the peaks appearing in the
voltammogram of the silver exchanged zeolite are caused by the silver. The voltammograms of the
silver exchanged zeolite, starting with the oxidation scan (Figure 4-28 and Figure 4-29), show a
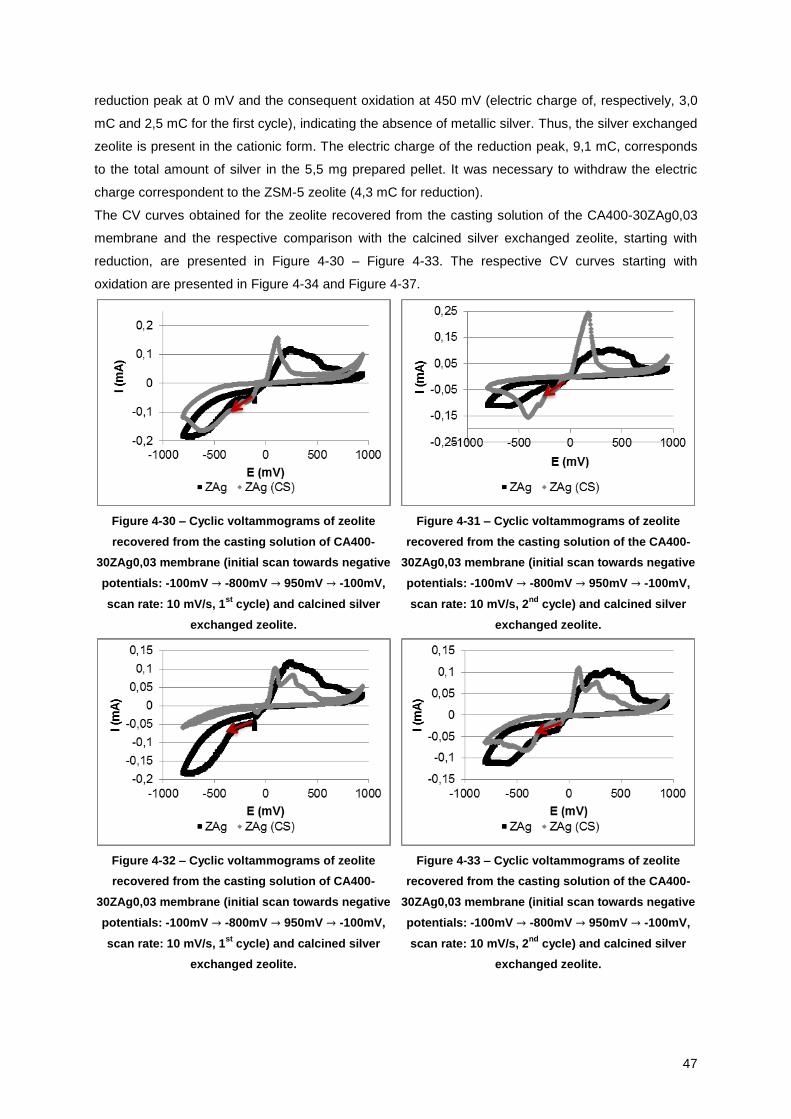
47
reduction peak at 0 mV and the consequent oxidation at 450 mV (electric charge of, respectively, 3,0
mC and 2,5 mC for the first cycle), indicating the absence of metallic silver. Thus, the silver exchanged
zeolite is present in the cationic form. The electric charge of the reduction peak, 9,1 mC, corresponds
to the total amount of silver in the 5,5 mg prepared pellet. It was necessary to withdraw the electric
charge correspondent to the ZSM-5 zeolite (4,3 mC for reduction).
The CV curves obtained for the zeolite recovered from the casting solution of the CA400-30ZAg0,03
membrane and the respective comparison with the calcined silver exchanged zeolite, starting with
reduction, are presented in Figure 4-30 – Figure 4-33. The respective CV curves starting with
oxidation are presented in Figure 4-34 and Figure 4-37.
Figure 4-30 – Cyclic voltammograms of zeolite
recovered from the casting solution of CA400-
30ZAg0,03 membrane (initial scan towards negative
potentials: -100mV → -800mV → 950mV → -100mV,
scan rate: 10 mV/s, 1st
cycle) and calcined silver
exchanged zeolite.
Figure 4-31 – Cyclic voltammograms of zeolite
recovered from the casting solution of the CA400-
30ZAg0,03 membrane (initial scan towards negative
potentials: -100mV → -800mV → 950mV → -100mV,
scan rate: 10 mV/s, 2nd
cycle) and calcined silver
exchanged zeolite.
Figure 4-32 – Cyclic voltammograms of zeolite
recovered from the casting solution of CA400-
30ZAg0,03 membrane (initial scan towards negative
potentials: -100mV → -800mV → 950mV → -100mV,
scan rate: 10 mV/s, 1st
cycle) and calcined silver
exchanged zeolite.
Figure 4-33 – Cyclic voltammograms of zeolite
recovered from the casting solution of the CA400-
30ZAg0,03 membrane (initial scan towards negative
potentials: -100mV → -800mV → 950mV → -100mV,
scan rate: 10 mV/s, 2nd
cycle) and calcined silver
exchanged zeolite.

48
Figure 4-34 – Cyclic voltammograms of zeolite
recovered from the casting solution of CA400-
30ZAg0,03 membrane (initial scan towards positive
potentials: -100mV → 950mV → -800mV → -100mV,
scan rate: 10 mV/s, 1st
cycle) and calcined silver
exchanged zeolite.
Figure 4-35 – Cyclic voltammograms of zeolite
recovered from the casting solution of CA400-
30ZAg0,03 membrane (initial scan towards positive
potentials: -100mV → 950mV → -800mV → -100mV,
scan rate: 10 mV/s, 2nd
cycle) and calcined silver
exchanged zeolite.
Figure 4-36 – Cyclic voltammograms of zeolite
recovered from the casting solution of CA400-
30ZAg0,03 membrane (initial scan towards positive
potentials: -100mV → 950mV → -800mV → -100mV,
scan rate: 10 mV/s, 1st
cycle) and calcined silver
exchanged zeolite.
Figure 4-37 – Cyclic voltammograms of zeolite
recovered from the casting solution of CA400-
30ZAg0,03 membrane (initial scan towards positive
potentials: -100mV → 950mV → -800mV → -100mV,
scan rate: 10 mV/s, 2nd
cycle) and calcined silver
exchanged zeolite.
The cyclic voltammetry curves of the pellets with zeolite recovered from the casting solution of CA400-
30ZAg0,03 membrane present differences in the experiments. It may be due to the lack of uniformity
of the starting material since it has undergone various washes and possible reactions with the solvents
used (formamide and acetone). It can be stated from the CV curves starting towards positive
potentials that the silver is in the cationic form since it has no oxidation peak (Figure 4-34 and Figure
4-36), as in the calcined silver exchanged zeolite. The pellets were made from the same initial sample
of graphite/zeolite.
In order to evaluate if a silver ion exchange between the pellet and the electrolyte solution occurs, a
silver exchange zeolite/graphite pellet was left in the cell during 74 hours after been subjected to six
cyclic voltammetry cycles, ensuring that the CV curves obtained were reproducible (Figure 4-38),

49
followed by an oxidation cycle, to guaranty that the silver stayed in the oxidized state. The first and last
obtained voltammograms of the oxidized pellet are presented in Figure 4-39.
Figure 4-38 – Six sequential cyclic voltammograms of calcined silver exchanged zeolite (initial scan
towards negative potentials: -100mV → -800mV → 950mV → -100mV, scan rate: 10 mV/s).
Figure 4-39 – Time evolution of the cyclic voltammograms of calcined silver exchanged zeolite to assess
the silver ion leaching (initial scan towards negative potentials: 0mV → -800mV → 950mV → 0mV, scan
rate: 10 mV/s).
In Figure 4-38, the reduction zone of the first cycle has a broad peak that converts into two well
defined peaks in the following cycles, instead of what is observed in the oxidation zone.
To compare the cyclic voltammograms (Figure 4-39), an integration of the electric current over time
was made for reduction and oxidation peaks, revealing similar values. The electric charge of the
reduction peaks for the first (t=0h) and last voltammograms (t=74h) was, respectively, 19,8 mC and
23,5 mC for the first cycle (C1) and 18,1 mC and 22,8 mC for the second cycle (C2). The electric
charge of the oxidation peaks of the voltammograms at zero and 74 hours was, respectively, 16,9 mC
and 21,4 mC for the first cycle and 16,2 mC and 20,4 mC for the second cycle. It is visible a change of
the oxidation pattern with the appearance of an oxidation peak at higher potentials, as the potential
was cycled repetitively, which may be due to the diffusion of silver ions into more stable sites in the

50
zeolite, resulting in the slightly shift of the peak potentials towards more positive values (Y.-J. Li and
Liu 2001).
4.4.2 MEMBRANES
The CV curves obtained for the UFCA400-30ZAg0,07 membrane, with the active face facing the
electrolyte and the electrode, are presented in Figure 4-40 and Figure 4-41 starting with an initial cycle
to negative potentials and in Figure 4-42 and Figure 4-43 starting with an oxidation cycle.
Figure 4-40 – Cyclic voltammograms of UFCA400-
30ZAg0,07 membrane, active face facing the
electrolyte and the electrode (initial scan towards
negative potentials: -100mV → -800mV → 950mV →
-100mV, scan rate: 10 mV/s, 1st
cycle).
Figure 4-41 – Cyclic voltammograms of UFCA400-
30ZAg0,07 membrane, active face facing the
electrolyte and the electrode (initial scan towards
negative potentials: -100mV → -800mV → 950mV →
-100mV, scan rate: 10 mV/s, 2nd
cycle).
Figure 4-42 – Cyclic voltammograms of UFCA400-
30ZAg0,07 membrane, active face facing the
electrolyte and the electrode (initial scan towards
positive potentials: -100mV → 950mV → -800mV →
-100mV, scan rate: 10 mV/s, 1st
cycle).
Figure 4-43 – Cyclic voltammograms of UFCA400-
30ZAg0,07 membrane, active face facing the
electrolyte and the electrode (initial scan towards
positive potentials: -100mV → 950mV → -800mV →
-100mV, scan rate: 10 mV/s, 2nd
cycle).
Comparing the experiments with the active face of the membrane facing the electrolyte and the
electrode, it was decided to evaluate the first option for being similar to the experiments with the silver
containing zeolite.
The voltammogram of the UFCA400-30ZAg0,07 membrane starting towards positive potentials
(Figure 4-42) show no oxidation peak in the first cycle, which indicates the absence of metallic silver.
51
Starting with reduction scan (Figure 4-40), two reduction peaks appear, at -180 mV and -560 mV. The
integration of the electric current over time between -100 mV and -700 mV lead to an electric charge
of the reduction peaks of 0,2 mC, which corresponds to a silver mass of 0,0002 mg. The UFCA400-
30ZAg0,07 membrane, with 0,07% of silver (chapter 3.2.3), weighted 1,0 mg and, accordingly,
contained 0,0007 mg of silver. Taking into account the uncertainties of the two measurements, the
results are comparable.
It was not possible to perform more experiments using this method since there was adsorption of
silver by the Pt disc electrode, affecting the following results.
4.5 THERMOGRAVIMETRIC ANALYSIS
The thermogravimetric analysis (TGA) was used to indirectly characterize the seven prepared
membranes in terms of their composition by measuring the amount of change in the weight of the
samples as a function of temperature/time, in a controlled temperature programme and atmosphere,
as described in chapter 3.4.3.
In the TGA programme, the weight and heat flow changes as a function of time were obtained for the
seven prepared membranes and the comparison is shown in Figure 4-44 and Figure 4-45,
respectively. In the first graphic, the descending TG curve indicates a weight loss; in the second
graphic, a positive peak indicates an endothermic process while a negative one indicates an
exothermic process.
The TGA thermal curves obtained for each membrane are presented in appendix 1A.3, Figure A-1 –
Figure A-21 (weight, heat flow and temperature as a function of time, weight and heat flow as a
function of time and weight and temperature as a function of time).
As it is shown in both Figure 4-44 and Figure 4-45, there are two distinct steps: the first one
corresponds to the water loss and the second to the cellulose acetate combustion. The dehydration of
the membrane starts immediately and stops before the second isothermal step (110℃); the cellulose
acetate combustion happens in the second heating ramp, between 350℃ and 600℃.
By the analysis of the results shown in Figure 4-44, the final weight of each sample was obtained,
considering the CA400-30 membrane as the reference value for weight loss, as well as the
evaporated water percentage, and is summarized in Table 4-3 and Figure 4-46. The final weight
indicates the presence in the membranes of the incorporated materials (silver, zeolite and silver
containing zeolite) and its percentage was compared with the initial percentage of the component
added to the casting solution, as presented in chapter 3.2.3, in Table 4-4 (wet and dry base, that is,
initial weight before and after the water evaporation, respectively).
The membranes have around 79% of non-structural water. The final weight obtained for each
membrane (Table 4-3 and Figure 4-46) follows the tendency of the percentages of the incorporated
materials in the casting solutions (Table 3-4 and Table 3-5): the membrane with the lowest final weight
was UFCA400-30ZAg0,005 and with the highest was UFCA400-30ZSM5. It is visible an increasing
weight with the increasing concentration of silver loaded zeolite.

52
Figure 4-44 – TG curve (weight as a function of time) of the seven prepared membranes.
Figure 4-45 – TG curve (heat flow as a function of time) of the seven prepared membranes.
Table 4-3 – Samples weight at the end of the TGA programme and evaporated water percentage.
Membrane Final weight (mg) Evaporated water (%)
UFCA400-30 0,0000 78,0
UFCA400-30Ag0,14 0,0462 80,3
UFCA400-30ZSM5 0,8266 79,1
UFCA400-30ZAg0,005 0,0030 80,9
UFCA400-30ZAg0,03 0,1239 78,0
UFCA400-30ZAg0,07 0,2229 78,3
UFCA400-30ZAg0,14 0,5629 76,6

53
Figure 4-46 – Samples weight at the end of the TGA programme and evaporated water percentage.
Table 4-4 – Comparison of final weight percentage at the end of TGA programme and incorporated
components percentage in the casting solution.
Membrane
Wet base Dry base
Weight of
AgNP/ZSM-5/ZAg
in casting
solution (%)
Final
weight after
TGA (%)
Weight of
AgNP/ZSM-5/ZAg
in casting
solution (%)
Final
weight after
TGA (%)
UFCA400-30 0,00 0,00 0,00 0,00
UFCA400-30Ag0,14 0,14 0,20 0,85 1,01
UFCA400-30ZSM5 3,91 3,97 19,43 19,03
UFCA400-30ZAg0,005 0,10 0,01 0,58 0,07
UFCA400-30ZAg0,03 0,53 0,63 3,07 2,85
UFCA400-30ZAg0,07 1,46 1,32 8,04 6,06
UFCA400-30ZAg0,14 2,85 2,54 14,73 10,85
As it can be seen in Table 4-4, in wet base and, accordingly, in dry base, the obtained results are in
general similar to the expected, except for the membrane UFCA400-30ZAg0,005. A second
experiment with this membrane was performed and 0,2517 mg was obtained as the final mass, which
correspond to a final weight percentage of 1,22. The incorporated silver loaded zeolite in the
membrane UFCA400-30ZAg0,005 may not be homogeneously dispersed.
4.6 DETERMINATION OF THE ZETA POTENTIAL
The zeta potential of the NF membranes were determined with a 0,001 M KCl electrolyte solution in
the pH range of 4 to 10, as explained in chapter 3.4.4, and the obtained results are presented in
Figure 4-47.

54
Figure 4-47 – Zeta potentials in the range of pH 4 – 9.
The obtained results show a variation of zeta potential with pH: with increasing pH, zeta potential
decreases, becoming more negative, which is typical of NF cellulose acetate membranes, due to the
negatively charge surface (Abitoye, Mukherjee, and Jones 2005). The dependence of zeta potential
with pH is different for each membrane: NFCA400-30ZAg0,14 membrane is the least influenced by the
pH (difference of 1,9 mV). The NFCA400-30Ag0,14, NFCA400-30ZAg0,07, NFCA400-30ZAg0,03,
NFCA400-30, NFCA400-30ZSM5 and NFCA400-30ZAg0,005 membranes show an increasing
dependency on the pH (difference of 2,0 mV, 2,0 mV, 2,1 mV, 2,5 mV, 3,2 mV and 4,2 mV,
respectively). Approximately from pH 6 it is visible a zeta potential stabilization, with a maximum
variation of 1,2 mV. From the initial pH to around pH 6, the membrane with highest zeta potential
dependency is NFCA400-30ZAg0,005 with a variation of 3,0 mV, contrasting with NFCA400-
30ZAg0,03 membrane with 1,3 mV. The remaining membranes (NFCA400-30, NFCA400-30Ag0,14,
NFCA400-30ZAg0,07, NFCA400-30ZAg0,14 and NFCA400-30ZSM5) show a zeta potential difference
of, respectively, 1,5 mV, 1,6 mV, 1,6 mV, 1,8 mV and 2,6 mV. The zeta potential of the modified
membranes decreases relatively to the NF CA membrane. The less modified membrane (NFCA400-
30ZAg0,005) has the lowest zeta potential, as reported by J. Abitoye et al. (Abitoye, Mukherjee, and
Jones 2005).
4.7 EVALUATION OF THE BACTERICIDAL PROPERTIES
The antibacterial effect of seven different membranes was determined against P. aeruginosa and E.
coli, as explained in chapter 3.5, using the percentage of the initial number of colony forming units
(%CFU). The results of the first experiment with P. aeruginosa are presented in Figure 4-48 and
Figure 4-49 and the results of the second experiment with E. coli and P. aeruginosa are presented in
Figure 4-50 – Figure 4-53. The results are summarized in appendix 1A.4, Table A-3 – Table A-10

55
(cumulative time, number of colonies and CFU percentage). The membranes used were annealed, as
mentioned in chapter 3.2.5.
Figure 4-48 – Bactericidal effect of NFCA400-30, NFCA400-30ZSM5 and NFCA400-30Ag0,14 membranes
against P. aeruginosa (1st
).
Figure 4-49 – Bactericidal effect of NFCA400-30ZAg0,005, NFCA400-30ZAg0,03 and NFCA400-30ZAg0,07
membranes against P. aeruginosa (1st
).
In Figure 4-48 are shown the results obtained for NFCA400-30, NFCA400-30ZSM5 and NFCA400-
30Ag0,14 membranes against P. aeruginosa. These membranes revealed a bacteriostatic effect, with
final CFU percentage of 90%, 125% and 93%, respectively. The membranes with zeolite and silver
nanoparticles showed a high bacterial growth after 18 hours of incubation. The results obtained for P.
aeruginosa for NFCA400-30ZAg0,005, NFCA400-30ZAg0,03 and NFCA400-30ZAg0,07 membranes
(Figure 4-49) showed bactericidal effect after 100 minutes, with inactivation ranging from 20% for
NFCA400-30ZAg0,03 to 83% for NFCA400-30ZAg0,005. The highest bactericidal effect for the
NFCA400-30ZAg0,005 membrane can be explained by the inhomogeneity of the membrane, result
obtained in thermogravimetric analysis, in which the membrane had a higher percentage of silver
loaded zeolite than the expected. After this time, an increase in the bacterial growth was observed in
NFCA400-30ZAg0,005 membrane, although still below 100% (44% CFU after 174 minutes). In the
end of the experiment with NFCA400-30ZAg0,03 membrane, a decrease of 30% in the bacterial
growth was observed. The membranes with silver exchanged zeolite, with 0,005% and 0,03% of silver
in the membrane, also showed no antimicrobial effect after 18 hours.

56
Figure 4-50 – Bactericidal effect of NFCA400-30, NFCA400-30ZSM5 and NFCA400-30Ag0,14 membranes
against E. coli.
Figure 4-51 – Bactericidal effect of NFCA400-30ZAg0,005, NFCA400-30ZAg0,03, NFCA400-30ZAg0,07 and
NFCA400-30ZAg0,14 membranes against E. coli.
Figure 4-52 – Bactericidal effect of NFCA400-30, NFCA400-30ZSM5 and NFCA400-30Ag0,14 membranes
against P. aeruginosa (2nd
).

57
Figure 4-53 – Bactericidal effect of NFCA400-30ZAg0,005, NFCA400-30ZAg0,03, NFCA400-30ZAg0,07 and
NFCA400-30ZAg0,14 membranes against P. aeruginosa (2nd
).
The results obtained for membranes against E. coli (Figure 4-50 and Figure 4-51) revealed the
absence of antibacterial effect, with a visible growth. The tendency of the membranes with silver
loaded zeolite is similar to the obtained in the first experiment with P. aeruginosa. Against P.
aeruginosa there was also no antibacterial effect (Figure 4-52 and Figure 4-53), with all the
membranes showing bacterial growth with the exception of NFCA400-30Ag0,14, which presented a
bacteriostatic effect. However, the time of the experiment with the silver nanoparticles membrane was
around two hours while with the other six membranes it was over four hours. Against P. aeruginosa
there is an increasing bacterial growth with the decreasing concentration of silver containing zeolite.
For both cultures, the NFCA400-30ZAg0,14 membrane showed the lowest bacterial growth after five
hours. This result is expected since the membrane has the highest silver content in the membrane
(0,14%), which is trapped inside the ZSM-5 zeolite and results in a gradual and more lasting release of
silver ions (Matsuura et al. 1997). The result obtained for NFCA400-30Ag0,14 against E. coli contrasts
with the one obtained by Beisl (Beisl 2015), in which a high bacterial effect was observed: inactivation
of 99,8% after 180 minutes. The general absence of bactericidal effect may be related with the
annealing process. Although incorporated particles, prepared ex-situ, are preferentially located in the
skin layer of nanocomposite membranes during phase inversion process, which results in more
accessible particles, the more intensive annealing treatment described in chapter 3.2.5 tightened the
pores on the surface, which may have made the silver nanoparticles, zeolite and silver zeolite less
accessible (Murphy and de Pinho 1995; Sile-Yuksel et al. 2014; Taurozzi et al. 2008). This assumption
may be corroborated with the results after 18 hours of incubation, in which a decrease or a more
controlled growth of P. aeruginosa was observed for NFCA400-30Ag0,14, NFCA400-30ZAg0,07 and
NFCA400-30ZAg0,14.
The antibacterial effect of ZSM-5 zeolite and silver containing zeolite powder against E. coli and P.
aeruginosa was also evaluated, as described in chapter 3.5. A change in the silver exchanged zeolite
colour was observed after approximately 1,25 hours. Since it only occurred in the silver loaded zeolite,
it can be stated that the colour change is due to the silver release from the zeolite to the agar medium,
which may be due to the exchange between the silver inside the zeolite and the sodium present in the
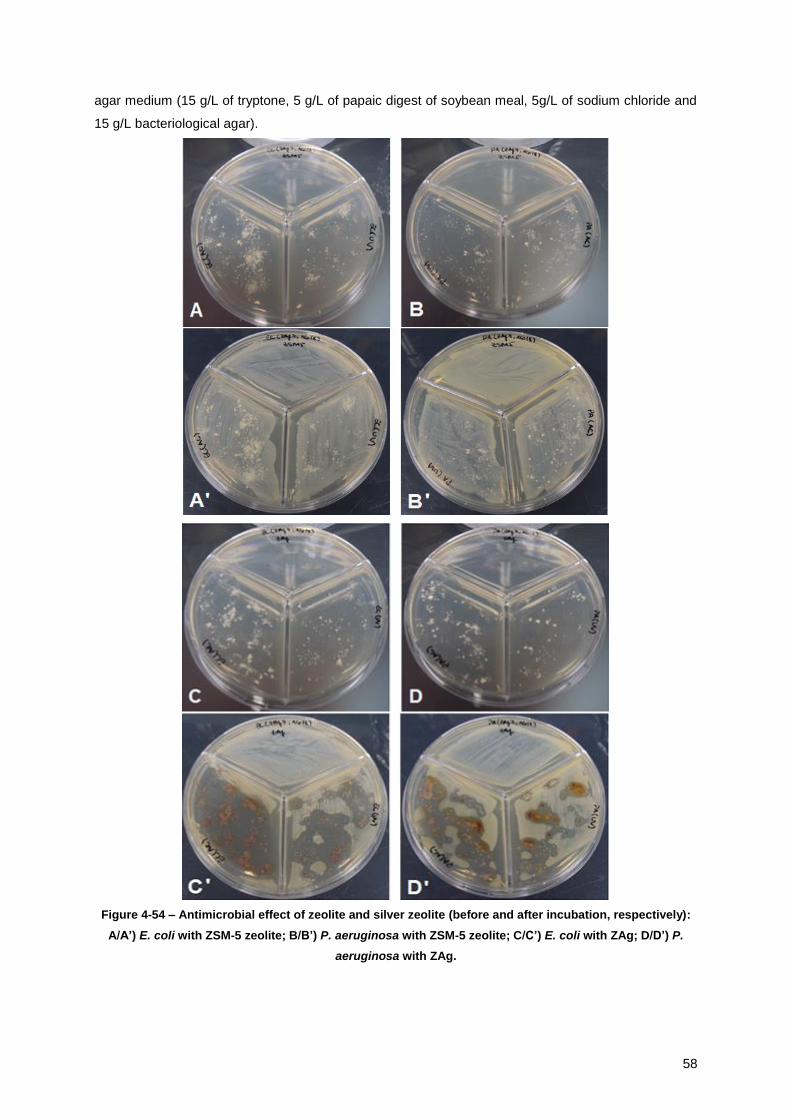
58
agar medium (15 g/L of tryptone, 5 g/L of papaic digest of soybean meal, 5g/L of sodium chloride and
15 g/L bacteriological agar).
Figure 4-54 – Antimicrobial effect of zeolite and silver zeolite (before and after incubation, respectively):
A/A’) E. coli with ZSM-5 zeolite; B/B’) P. aeruginosa with ZSM-5 zeolite; C/C’) E. coli with ZAg; D/D’) P.
aeruginosa with ZAg.

59
Figure 4-54 shows the difference in bacteria growth in the presence of ZSM-5 zeolite/ZAg, compared
with the blank sample. ZSM-5 zeolite shows no antibacterial effect in both cultures, since there was no
growth inhibition. The silver containing zeolite revealed a strong bactericidal effect for both cultures,
being the effect more pronounced in E. coli than in P. aeruginosa.

60

61
5 CONCLUSIONS
The experiments made with the asymmetric mixed matrix membranes, with silver nanoparticles, ZSM-
5 zeolite and silver loaded zeolite incorporated, showed interesting results.
From the UV absorption spectra, it can be stated that the silver suspension prepared to incorporate in
the cellulose acetate membrane has well-dispersed spherical silver nanoparticles. However, the red
shift of the maximum absorption and the bandwidth increase with time indicates an increase in the
particle size and a possible aggregation. The formation of the silver nanoparticles prepared at fixed
concentration of reducing agent NaBH4 can be described by a second order kinetics and exhibits
absorption peaks around 400 nm with increasing absorbance with time. The addition of formamide
leads to the appearance of a broad extinction band, which can indicate the presence of different
distributions of particles sizes.
The incorporation of materials influences hydraulic permeability. In ultrafiltration, the incorporation of
silver nanoparticles increased the hydraulic permeability of the membrane in 39,6% comparing with
the cellulose acetate membrane. In contrast, the incorporation of ZSM-5 zeolite decreases the
hydraulic permeability of the membrane in 52,6%. The addition of silver exchanged zeolite also
decreases the hydraulic permeability, becoming higher with the increasing concentration (71,5%,
59,2% and 5,3% for the CA400-30ZAg0,005, CA400-30ZAg0,03 and CA400-30ZAg0,07 membranes,
respectively). In nanofiltration, the hydraulic permeability increases with the addition of silver
nanoparticles and ZSM-5 zeolite comparing with the cellulose acetate membrane (83,1% and 4,5%,
respectively). As mentioned for ultrafiltration membranes, hydraulic permeability increases with
increasing concentration of silver containing zeolite (difference of -9,7%, -3,2% and 44,8% for CA400-
30ZAg0,005, CA400-30ZAg0,03 and CA40030ZAg0,07 membranes). The CA400-30ZAg0,14
membrane does not follow the tendency (hydraulic permeability 35,6% lower than CA400-30),
probably indicating the existence of a maximum silver zeolite concentration from which the hydraulic
permeability decreases.
The results for rejection coefficients of the ultrafiltration membranes for NaCl, Na2SO4, MgCl2, MgSO4
and glucose vary, not showing a tendency with the incorporated materials or rejected species. With
the nanofiltration membranes, the rejection coefficients are higher for the Na2SO4 salt, except for the
CA400-30ZAg0,14 membrane, and lower for the MgCl2 salt, which can be related with the negative
charge of the membrane surface and the stronger electrostatic interaction forces with bivalent anions.
The rejection coefficients of CA400-30, CA400-30ZSM5, CA400-30Ag0,14, CA400-30ZAg0,005,
CA400-30ZAg0,03, CA400-30ZAg0,07 and CA400-30ZAg0,14 membranes for Na2SO4 are,
respectively, 95,9%, 93,4%, 84,4%, 94,6%, 95,4%, 90,8% and 85,7%. For MgCl2 are, respectively,
74,6%, 61,5%, 55,6%, 73,1%, 73,7%, 66,4% and 84,8%. The majority of the rejection coefficients
results for the membranes with incorporated materials are lower than the ones obtained for the
cellulose acetate membrane.
The electrochemical studies performed via cyclic voltammetry revealed that the silver present in the
zeolite, in powder form and incorporated in the membrane, is in the cationic form. The silver inside the
zeolite seems to diffuse into more stable sites in the zeolite with time.
62
The thermogravimetric analysis, used to indirectly characterize the membranes composition, revealed
that membranes have around 79% of non-structural water. In general the final weight of the
membranes was similar to the expected by the casting solutions, except for the least modified
membrane, CA400-30ZAg0,005, in which the incorporated components may not be homogeneously
dispersed in the membrane.
The negative zeta-potential of the membranes decreased with increasing pH, in the pH range of 4 – 9.
The zeta potential of the modified membranes decreased relatively to the cellulose acetate
membrane. The CA400-30ZAg0,005 membrane has the lowest zeta potential and the CA400-
30ZAg0,14 membrane is the least influenced by the pH. Approximately from pH 6 the zeta potential of
the membranes stabilize, with a maximum variation of 1,2 mV.
The antibacterial effect of the asymmetric membranes was determined against Pseudomonas
aeruginosa and Escherichia coli. In the first experiment with P. aeruginosa, the CA400-30, CA400-
30ZSM5 and CA400-30Ag0,14 membranes revealed a bacteriostatic effect after 150 minutes and the
CA400-30ZAg0,005, CA400-30ZAg0,03 and CA400-30ZAg0,07 membranes showed bactericidal
effect after 100 minutes. The membranes showed a high bacterial growth after 18 hours. The results
obtained against E. coli and P. aeruginosa (second experiment) revealed the absence of antibacterial
effect, with a visible growth. Against P. aeruginosa there was an increasing bacterial growth with the
decreasing concentration of silver containing zeolite. For both cultures, the CA400-30ZAg0,14
membrane showed the lowest bacterial growth after five hours which is expected due to the higher
silver content (0,14%) trapped inside the ZSM-5 zeolite, resulting in a gradual and more lasting
release of silver ions. The evaluation of the bacteria growth in the presence of the ZSM-5 zeolite/silver
zeolite powder revealed that ZSM-5 zeolite shows no antibacterial effect in both cultures, since there
was no growth inhibition. In contrast, the silver containing zeolite revealed strong bactericidal for both
cultures, being the effect more pronounced in E. coli than in P.aeruginosa.
Combining the experiments performed, the most promising membrane is the CA400-30ZAg0,07, since
the casting of the membrane is not difficult, it has higher hydraulic permeability than the nanofiltration
cellulose acetate membrane, it has rejection coefficients from 67% to MgCl2 and 91% to Na2SO4 and
one of the highest antibacterial effects.

63
5.1 PERSPECTIVES FOR FUTURE WORK
As future work, the following suggestions are pointed out:
- Investigate the role of PVP as support of silver reducing agents;
- Investigate the role of the system of solvents (acetone and formamide) in the silver loaded zeolite
incorporated in the casting solutions;
- Investigate the silver oxidation state of silver nanoparticles through electrochemical studies;
- Investigate the silver leaching from the membranes to the medium;
- Determine the antibacterial activity of the asymmetric cellulose and mixed matrix membranes,
annealed at 95℃, against E. coli and P. aeruginosa;
- Investigate the antibacterial properties of silver nanoparticles suspension in contact with different
bacteria;
- Investigate the antibacterial properties of mixed matrix membranes in long term permeation
conditions of a solution containing bacteria;
- Investigate the biofouling formation at membranes surfaces in long term permeation conditions.

64
65
BIBLIOGRAPHY
Abitoye, Joshua Olufemi, Parna Mukherjee, and Kimberly Jones. 2005. “Ion Implantation: Effect on
Flux and Rejection Properties of NF Membranes.” Environmental Science and Technology
39(17): 6487–93.
Afonso, Maria Diná, and Maria Norberta De Pinho. 1990. “Ultrafiltration of Bleach Effluents in
Cellulose Production.” Desalination 79(2–3): 115–24.
———. 2000. “Transport of MgSO4, MgCl2, and Na2SO4 across an Amphoteric Nanofiltration
Membrane.” Journal of Membrane Science 179(1–2): 137–54.
Ali, M. A., B. Brisdon, and W. J. Thomas. 2003. “Synthesis, Characterization and Catalytic Activity of
ZSM-5 Zeolites Having Variable Silicon-to-Aluminum Ratios.” Applied Catalysis A: General
252(1): 149–62.
American Public Health Association, American Water Works Association, Water Environment
Federation. 1999. Standard Methods Standard Methods for the Examination of Water and
Wastewater.
Applegate, Lynn E., Carl W. Erkenbrecher, and Harvey Winters. 1989. “New Chloroamine Process to
Control Aftergrowth and Biofouling in permasepR B-10 RO Surface Seawater Plants.”
Desalination 74(C): 51–67.
Arthanareeswaran, G., and P. Thanikaivelan. 2010. “Fabrication of Cellulose Acetate-Zirconia Hybrid
Membranes for Ultrafiltration Applications: Performance, Structure and Fouling Analysis.”
Separation and Purification Technology 74(2): 230–35.
Asapu, Sunitha, Santosh Pant, Cyndee L. Gruden, and Isabel C. Escobar. 2014. “An Investigation of
Low Biofouling Copper-Charged Membranes for Desalination.” Desalination 338(1): 17–25.
Baia, Lucian, and Simion Simon. 2007. “UV-VIS and TEM Assessment of Morphological Features of
Silver Nanoparticles from Phosphate Glass Matrices.” Modern Research and Educational Topics
in Microscopy: 576–83.
Beier, S. et al. 2010. “Treatment of Hospital Wastewater Effluent by Nanofiltration and Reverse
Osmosis.” Water Science and Technology 61(7): 1691–98.
Beisl, Stefan. 2015. “Investigation of the Influence of Silver Nanoparticles on the Permeation and
Bactericidal Properties of Nanofiltration Membranes.” Technischen Universität Wien; Instituto
Superior Técnico.
Bhattacharjee, Sourav. 2016. “DLS and Zeta Potential - What They Are and What They Are Not?”
Journal of Controlled Release 235: 337–51.
Boschetto, Daiane Lúcia et al. 2012. “Preparation and Antimicrobial Activity of Polyethylene
Composite Films with Silver Exchanged Zeolite-Y.” Chemical Engineering Journal 204–205:
210–16.
Boussahel, R., S. Bouland, K.M. Moussaoui, and A. Montiel. 2000. “Removal of Pesticide Residues in
Water Using the Nanofiltration Process.” Desalination 132(October): 205–9.
Bower, Nathan, and Anne Yu. 2011. 88 Journal of Chemical Education Exploiting Mass
Measurements in Different Environments: Density, Magnetic Susceptibility, and

66
Thermogravimetry.
Van Der Bruggen, B., K. Everaert, D. Wilms, and C. Vandecasteele. 2001. “Application of
Nanofiltration for Removal of Pesticides, Nitrate and Hardness from Ground Water: Rejection
Properties and Economic Evaluation.” Journal of Membrane Science 193(2): 239–48.
Van der Bruggen, B., M. Mänttäri, and M. Nyström. 2008. “Drawbacks of Applying Nanofiltration and
How to Avoid Them: A Review.” Separation and Purification Technology 63(2): 251–63.
Canterbury, University of. 2015. “Determination of Chloride Ion Concentration by Titration (Mohr ’S
Method ).” : 1–2.
Caro, C. et al. 2010. Nanotechnology and Nanomaterials Silver Nanoparticles. ed. David Pozo.
InTech.
Caro, Jürgen, Martin Bülow, and Wolfgang Schirmer. 1985. “Microdynamics of Methane, Ethane and
Propane in ZSM-5 Type Zeolites.” Journal of the Chemical Society, Faraday Transactions 1 81:
2541–50.
Center for Environmental Research Information. 1990. “Environmental Pollution Control Alternatives:
Drinking Water Treatment for Small Communities.” : 1–82.
Chou, Wen-Li, Da-Guang Yu, and Ming-Chien Yang. 2005. “The Preparation and Characterization of
Silver-Loading Cellulose Acetate Hollow Fiber Membrane for Water Treatment.” Polymers for
Advanced Technologies 16(8): 600–607.
Corporation, Shimadzu. 2009. Total Organic Carbon Analyzer TOC-VCPH/CPN.
Crison. 2001. Conductimetros GLP 31/32: Manual Del Usuario. Alella.
Das, Ratan, Sneha Gang, and Siddhartha Sankar Nath. 2011. “Preparation and Antibacterial Activity
of Silver Nanoparticles.” Journal of Biomaterials and Nanobiotechnology 2(4): 472–75.
Dean, Derrick. 2014. Thermal Gravimetric Analysis.
Delgado, A. V. et al. 2005. “Measurement and Interpretation of Electrokinetic Phenomena (IUPAC
Technical Report).” Pure and Applied Chemistry 77(10): 1753–1805.
Desai, Rucha, Venu Mankad, Sanjeev K. Gupta, and Prafulla K. Jha. 2012. “Size Distribution of Silver
Nanoparticles: UV-Visible Spectroscopic Assessment.” International Journal of Nanoscience 4:
30–34.
Dong, Lei xi et al. 2015. “Fabrication and Anti-Biofouling Properties of Alumina and Zeolite
Nanoparticle Embedded Ultrafiltration Membranes.” Desalination 365: 70–78.
Elimelech, Menachem, Xiaohua Zhu, Amy E. Childress, and Seungkwan Hong. 1997. “Role of
Membrane Surface Morphology in Colloidal Fouling of Cellulose Acetate and Composite
Aromatic Polyamide Reverse Osmosis Membranes.” Journal of Membrane Science 127(1): 101–
9.
Fairbrother, Fred, and Harold Mastin. 1924. “CCCXII.—Studies in Electro-Endosmosis. Part I.” J.
Chem. Soc., Trans. 125: 2319–30.
Ferreira, Liliana et al. 2012. “Antimicrobial Activity of Faujasite Zeolites Doped with Silver.”
Microporous and Mesoporous Materials 160: 126–32.
Figueiredo, Ana Sofia et al. 2015. “Tailoring of Structures and Permeation Properties of Asymmetric
Nanocomposite Cellulose Acetate/silver Membranes.” Journal of Applied Polymer Science

67
132(21).
———. 2016. “Asymmetric Nanocomposite Cellulose Acetate/silver Ultrafiltration Membranes –
Permeation Performance and Antibacterial Effect.” Instituto Superior Técnico.
GmbH, Anton Paar. 2003. EKA: Electro Kinetic Analyzer Instruction Manual. Austria.
Gottenbos, Bart, Henny C. Van Der Mei, and Henk J. Busscher. 1999. “Models for Studying Initial
Adhesion and Surface Growth in Biofilm Formation on Surfaces.” Methods in Enzymology 310:
523–34.
Guillen, Gregory R., Yinjin Pan, Minghua Li, and Eric M V Hoek. 2011. “Preparation and
Characterization of Membranes Formed by Nonsolvent Induced Phase Separation: A Review.”
Industrial and Engineering Chemistry Research 50(7): 3798–3817.
Gwon, Eun M., Myong J. Yu, Hee Kyong Oh, and Yong H. Ylee. 2003. “Fouling Characteristics of NF
and RO Operated for Removal of Dissolved Matter from Groundwater.” Water Research 37(12):
2989–97.
Hilal, Nidal et al. 2004. “A Comprehensive Review of Nanofiltration Membranes: Treatment,
Pretreatment, Modelling, and Atomic Force Microscopy.” Desalination 170(3): 281–308.
Huang, Weijuan et al. 2016. “Fabrication of Flexible Self-Standing All-Cellulose Nanofibrous
Composite Membranes for Virus Removal.” Carbohydrate Polymers 143: 9–17.
Inc., Perkin Elmer. 2004. A Beginner’s Guide to Thermogravimetric Analysis.
Jhaveri, Jainesh H., and Z. V. P. Murthy. 2016. “A Comprehensive Review on Anti-Fouling
Nanocomposite Membranes for Pressure Driven Membrane Separation Processes.” Desalination
379: 137–54.
Khan, Muhammad Tariq, Pei Ying Hong, Nabil Nada, and Jean Philippe Croue. 2015. “Does
Chlorination of Seawater Reverse Osmosis Membranes Control Biofouling?” Water Research 78:
84–97.
Khan, Zaheer, Shaeel Ahmed Al-Thabaiti, Abdullah Yousif Obaid, and A. O. Al-Youbi. 2011.
“Preparation and Characterization of Silver Nanoparticles by Chemical Reduction Method.”
Colloids and Surfaces B: Biointerfaces 82(2): 513–17.
Kissinger, P. T., and W. R. Heineman. 1983. “Cyclic Voltammetry.” Journal of Chemical Education
60(9): 702–6.
Köhler, Stephan J. et al. 2016. “Upgrading Coagulation with Hollow-Fibre Nanofiltration for Improved
Organic Matter Removal during Surface Water Treatment.” Water Research 89: 232–40.
Koseoglu-Imer, Derya Y., Borte Kose, Mahmut Altinbas, and Ismail Koyuncu. 2013. “The Production of
Polysulfone (PS) Membrane with Silver Nanoparticles (AgNP): Physical Properties, Filtration
Performances, and Biofouling Resistances of Membranes.” Journal of Membrane Science 428:
620–28.
Lalueza, Patricia, Marta Monzón, Manuel Arruebo, and Jesús Santamaría. 2011. “Bactericidal Effects
of Different Silver-Containing Materials.” Materials Research Bulletin 46(11): 2070–76.
Lauffer, Max A., and Ross Aiken Gortner. 1939. “Electrokinetics. XXI. Electrokinetic Theory. Streaming
Potential and the Electroösmotic Counter Effect.” The Journal of Physical Chemistry 43(6): 721–
32.
68
Lemos, M.A.N.D.A. et al. 1999. “Modelling the Voltammetric Behaviour of Cobalt Cations inside
Zeolites.” Studies in Surface Science and Catalysis 122: 443–46.
Li, Jian Hua et al. 2013. “The Double Effects of Silver Nanoparticles on the PVDF Membrane: Surface
Hydrophilicity and Antifouling Performance.” Applied Surface Science 265: 663–70.
Li, Yong-Jun, and Chun-Yan Liu. 2001. “Silver-Exchanged Zeolite Y-Modified Electrodes: Size
Selectivity for Anions.” Journal of Electroanalytical Chemistry 517(1–2): 117–20.
Liang, Can Zeng et al. 2014. “Treatment of Highly Concentrated Wastewater Containing Multiple
Synthetic Dyes by a Combined Process of Coagulation/flocculation and Nanofiltration.” Journal
of Membrane Science 469: 306–15.
Maillard, Mathieu, Suzanne Giorgio, and Marie Paule Pileni. 2003. “Tuning the Size of Silver
Nanodisks with Similar Aspect Ratios: Synthesis and Optical Properties.” Journal of Physical
Chemistry B 107(11): 2466–70.
Marconnet, C. et al. 2011. “Membrane Biofouling Control by UV Irradiation.” Desalination 276(1–3):
75–81.
Matsuura, T. et al. 1997. “Prolonged Antimicrobial Effect of Tissue Conditioners Containing Silver-
Zeolite.” Journal of dentistry 25(5): 373–77.
Melorose, J., R. Perroy, and S. Careas. 2015. 1 United Nations World Population Prospects.
Moons, Kathleen, and Bart Van der Bruggen. 2006. “Removal of Micropollutants during Drinking
Water Production from Surface Water with Nanofiltration.” Desalination 199(1–3): 245–47.
Mumpton, Frederick A. 1999. “La Roca Magica: Uses of Natural Zeolites in Agriculture and Industry.”
Proceedings of the National Academy of Sciences of the United States of America 96(7): 3463–
70.
Murphy, Damien, and Maria Norberta de Pinho. 1995. “An ATR-FTIR Study of Water in Cellulose
Acetate Membranes Prepared by Phase Inversion.” Journal of Membrane Science 106(3): 245–
57.
Myers, John A, Brandon S Curtis, and Wayne R Curtis. 2013. “Improving Accuracy of Cell and
Chromophore Concentration Measurements Using Optical Density.” BMC Biophysics 6(1): 4.
National Environmental Services Center. 1966. 1 National Dirinking Water Clearinghouse Fact Sheet
Tech Brief - Disinfection.
Ochando Pulido, Javier Miguel, and Antonio Martínez Férez. 2015. “Impacts of Operating Conditions
on Nanofiltration of Secondary-Treated Two-Phase Olive Mill Wastewater.” Journal of
Environmental Management 161: 219–27.
Ong, Yee Kang et al. 2014. “Nanofiltration Hollow Fiber Membranes for Textile Wastewater Treatment:
Lab-Scale and Pilot-Scale Studies.” Chemical Engineering Science 114: 51–57.
Le Ouay, Benjamin, and Francesco Stellacci. 2015. “Antibacterial Activity of Silver Nanoparticles: A
Surface Science Insight.” Nano Today 10(3): 339–54.
Palma, P. et al. 2016. “Membranes Technology Used in Water Treatment: Chemical, Microbiological
and Ecotoxicological Analysis.” Science of the Total Environment 568: 998–1009.
Park, Minkyu et al. 2016. “Pre-Ozonation for High Recovery of Nanofiltration (NF) Membrane System:
Membrane Fouling Reduction and Trace Organic Compound Attenuation.” Journal of Membrane
69
Science 523(September 2016): 255–63.
Pendergast, MaryTheresa M., and Eric M. V. Hoek. 2011. “A Review of Water Treatment Membrane
Nanotechnologies.” Energy & Environmental Science 4(6): 1946–71.
De Pinho, Maria Norberta. 1988. “Annealing Effect of Cellulose Acetate Membranes on Ethanol and
Glucose Reverse Osmosis Separation.” Desalination 68(2–3): 211–21.
Pinnau, I., and B. D. Freeman. 1999. “Formation and Modification of Polymeric Membranes:
Overview.” Membrane Formation and Modification 744: 1.
Prescott, Lansing M, Donald A Klein, and John P Harley. 2002. Microbiology Microbiology.
Rai, Mahendra, Alka Yadav, and Aniket Gade. 2009. “Silver Nanoparticles as a New Generation of
Antimicrobials.” Biotechnology Advances 27(1): 76–83.
Rauwel, Protima, Erwan Rauwel, Stanislav Ferdov, and Mangala P. Singh. 2015. “Silver
Nanoparticles : Synthesis, Properties and Applications.” 2015: 2–4.
Rosa, Maria João, and Maria Norberta De Pinho. 1994. “Separation of Organic Solutes by Membrane
Pressure-Driven Processes.” Journal of Membrane Science 89(3): 235–43.
Sadrzadeh, Mohtada, and Subir Bhattacharjee. 2013. “Rational Design of Phase Inversion
Membranes by Tailoring Thermodynamics and Kinetics of Casting Solution Using Polymer
Additives.” Journal of Membrane Science 441: 31–44.
Schaep, Johan et al. 1998. “Removal of Hardness from Groundwater by Nanofiltration.” Desalination
119(1–3): 295–302.
Schweiss, Ruediger, Petra B. Welzel, Carsten Werner, and Wolfgang Knoll. 2001. “Dissociation of
Surface Functional Groups and Preferential Adsorption of Ions on Self-Assembled Monolayers
Assessed by Streaming Potential and Streaming Current Measurements.” Langmuir 17(14):
4304–11.
Scott, K., and R. Hughes. 1997. Journal of Membrane Science Industrial Membrane Separation
Technology.
Sile-Yuksel, Merve, Bahar Tas, Derya Y. Koseoglu-Imer, and Ismail Koyuncu. 2014. “Effect of Silver
Nanoparticle (AgNP) Location in Nanocomposite Membrane Matrix Fabricated with Different
Polymer Type on Antibacterial Mechanism.” Desalination 347: 120–30.
Sivakumar, Muthusamy, Doraisamy Raju Mohan, and Ramamoorthy Rangarajan. 2006. “Studies on
Cellulose Acetate-Polysulfone Ultrafiltration Membranes: II. Effect of Additive Concentration.”
Journal of Membrane Science 268(2): 208–19.
Structure Commission of the International Zeolite Association (IZA). 2007. “Framework Type MFI.” :
212–13. http://rcsr.fos.su.se/IZA-SC/ftc_fw.php?STC=MFI (October 23, 2016).
Taurozzi, Julian S. et al. 2008. “Effect of Filler Incorporation Route on the Properties of Polysulfone-
Silver Nanocomposite Membranes of Different Porosities.” Journal of Membrane Science 325(1):
58–68.
Thielbeer, Frank, Ken Donaldson, and Mark Bradley. 2011. “Zeta Potential Mediated Reaction
Monitoring on Nano and Microparticles.” Bioconjugate Chemistry 22(2): 144–50.
UNEP. 2008. United Nations Environment Programme (UNEP) Vital Water Graphics: An Overview of
the State of the World’s Fresh and Marine Waters.

70
US Environmental Protection Agency. 1995. “Environmental Planning for Small Communities A Guide
for Local Decision-Makers.” (September): 156.
USGS. 2015. “The USGS Water Science School.” http://water.usgs.gov/edu/earthgwlandsubside.html.
Verlicchi, P., A. Galletti, M. Petrovic, and D. BarcelÓ. 2010. “Hospital Effluents as a Source of
Emerging Pollutants: An Overview of Micropollutants and Sustainable Treatment Options.”
Journal of Hydrology 389(3–4): 416–28.
Wang, Hongshui et al. 2005. “Mechanisms of PVP in the Preparation of Silver Nanoparticles.”
Materials Chemistry and Physics 94(2–3): 449–53.
Wang, Jinwen et al. 2014. “A Critical Review of Transport through Osmotic Membranes.” Journal of
Membrane Science 454: 516–37.
Wang, Xiao-Lin et al. 2009. “Characterization and Applications of Nanofiltration Membranes: State of
the Art.” Desalination 236(1–3): 316–26.
Wang, Xiao-Lin, Ai-ling Ying, and Wei-ning Wang. 2002. “Nanofiltration of L-Phenylalanine and L-
Aspartic Acid Aqueous Solutions.” Journal of Membrane Science 196: 59–67.
Wang, Xiao-Lin, Chenghong Zhang, and Pingkai Ouyang. 2002. “The Possibility of Separating
Saccharides from a NaCl Solution by Using Nanofiltration in Diafiltration Mode.” Journal of
Membrane Science 204(1–2): 271–81.
Weerasekara, Nuwan A., Kwang Ho Choo, and Chung Hak Lee. 2016. “Biofouling Control: Bacterial
Quorum Quenching versus Chlorination in Membrane Bioreactors.” Water Research 103: 293–
301.
Widoniak, J., S. Eiden-Assmann, and G. Maret. 2005. “Silver Particles Tailoring of Shapes and Sizes.”
Colloids and Surfaces A: Physicochemical and Engineering Aspects 270–271(1–3): 340–44.
Wiesner, M R, and S Chellam. 1999. “The Promise of Membrane Technologies.” Environmental
science & technology 33(17): 360–66.
X-Flow. “Membrane Technology: For Every Industry and Filtration Application.”
http://xflow.pentair.com/en/technologies/membrane-technology-in-general (October 18, 2016).
Xie, He, Tomonori Saito, and Michael A. Hickner. 2011. “Zeta Potential of Ion-Conductive Membranes
by Streaming Current Measurements.” Langmuir 27(8): 4721–27.
Yang, Qingchun et al. 2016. “Hydrochemical Characterization and Pollution Sources Identification of
Groundwater in Salawusu Aquifer System of Ordos Basin, China.” Environmental Pollution 216:
340–49.
Zhang, Wenxiang, Jianquan Luo, Luhui Ding, and Michel Y. Jaffrin. 2015. “A Review on Flux Decline
Control Strategies in Pressure-Driven Membrane Processes.” Industrial and Engineering
Chemistry Research 54(11): 2843–61.
Zhou, Dong et al. 2015. “Development of Lower Cost Seawater Desalination Processes Using
Nanofiltration Technologies - A Review.” Desalination 376(1219): 109–16.
Zielińska, Anna et al. 2009. “Preparation of Silver Nanoparticles with Controlled Particle Size.”
Procedia Chemistry 1(2): 1560–66.
Zulaikha, S., W. J. Lau, A. F. Ismail, and J. Jaafar. 2014. “Treatment of Restaurant Wastewater Using
Ultrafiltration and Nanofiltration Membranes.” Journal of Water Process Engineering 2: 58–62.

A.1
A. APPENDIX
A.1 MANUFACTURING OF THE MEMBRANES
PREPARATION OF SILVER NANOPARTICLES
The concentration of the chemicals used in the preparation of the silver nanoparticles suspension is
presented in Table A-1.
Table A-1 – Concentrations used to prepare the nanoparticle suspension.
Chemical mweighted (g) C (g/mL) C (mol/L)
PVP 0,0812 0,010 -
AgNO3 0,5038 0,126 0,741
NaBH4 0,0302 0,008 0,200
A.2 DETERMINATION OF THE ZETA-POTENTIAL
The zeta potential as a function of pH for each membrane is presented in Table A-2.
Table A-2 – Zeta potential as a function of pH for each prepared membrane.
NFCA400-30 NFCA400-30ZSM5 NFCA400-30Ag0,14
pH ZP (mV) pH ZP (mV) pH ZP (mV)
4,274 -3,117 4,108 -5,378 4,223 -6,229
4,534 -3,518 4,441 -6,178 4,504 -6,439
5,179 -3,970 5,540 -7,488 5,284 -7,108
6,210 -4,599 6,316 -7,928 6,356 -7,836
6,774 -4,728 7,229 -8,229 6,908 -7,975
7,165 -4,957 8,637 -8,499 7,391 -8,120
8,563 -5,206 9,997 -8,603 7,953 -8,143
9,307 -5,607 9,446 -8,266
NFCA400-30ZAg0,005 NFCA400-30ZAg0,03 NFCA400-30ZAg0,07 NFCA400-30ZAg0,14
pH ZP (mV) pH ZP (mV) pH ZP (mV) pH ZP (mV)
4,063 -6,835 4,292 -4,479 4,319 -3,995 4,134 -6,827
4,255 -7,600 4,801 -4,955 4,545 -4,791 4,680 -7,624
5,362 -9,657 5,858 -5,456 4,846 -5,450 5,589 -8,225
6,185 -9,871 6,550 -5,798 6,516 -5,641 6,674 -8,578
7,323 -10,460 7,146 -6,062 7,285 -5,587 8,180 -8,884
8,968 -10,710 9,733 -6,546 8,253 -5,796 8,778 -8,901
9,143 -11,070 9,837 -6,036 9,353 -8,718
A.3 THERMOGRAVIMETRIC ANALYSIS
The TGA thermal curves for each prepared membrane are presented in Figure A-1 – Figure A-21.

A.2
Figure A-1 – TG analysis of the UFCA400-30 membrane (weight, heat flow and temperature as a function
of time).
Figure A-2 – TG analysis of the UFCA400-30 membrane (weight and heat flow as a function of time).
Figure A-3 – TG analysis of the UFCA400-30 membrane (weight and temperature as a function of time).

A.3
Figure A-4 – TG analysis of the UFCA400-30Ag0,14 membrane (weight, heat flow and temperature as a
function of time).
Figure A-5 – TG analysis of the UFCA400-30Ag0,14 membrane (weight and heat flow as a function of
time).
Figure A-6 – TG analysis of the UFCA400-30Ag0,14 membrane (weight and temperature as a function of
time).

A.4
Figure A-7 – TG analysis of the UFCA400-30ZSM5 membrane (weight, heat flow and temperature as a
function of time).
Figure A-8 – TG analysis of the UFCA400-30ZSM5 membrane (weight and heat flow as a function of time).
Figure A-9 - TG analysis of the UFCA400-30ZSM5 membrane (weight and temperature as a function of
time).

A.5
Figure A-10 – TG analysis of the UFCA400-30ZAg0,005 membrane (weight, heat flow and temperature as a
function of time).
Figure A-11 – TG analysis of the UFCA400-30ZAg0,005 membrane (weight and heat flow as a function of
time).
Figure A-12 – TG analysis of the UFCA400-30ZAg0,005 membrane (weight and temperature as a function
of time).

A.6
Figure A-13 – TG analysis of the UFCA400-30ZAg0,03 membrane (weight, heat flow and temperature as a
function of time).
Figure A-14 – TG analysis of the UFCA400-30ZAg0,03 membrane (weight and heat flow as a function of
time).
Figure A-15 – TG analysis of the UFCA400-30ZAg0,03 membrane (weight and temperature as a function of
time).

A.7
Figure A-16 – TG analysis of the UFCA400-30ZAg0,07 membrane (weight, heat flow and temperature as a
function of time).
Figure A-17 – TG analysis of the UFCA400-30ZAg0,07 membrane (weight and heat flow as a function of
time).
Figure A-18 – TG analysis of the UFCA400-30ZAg0,07 membrane (weight and temperature as a function of
time).

A.8
Figure A-19 – TG analysis of the UFCA400-30ZAg0,14 membrane (weight, heat flow and temperature as a
function of time).
Figure A-20 – TG analysis of the UFCA400-30ZAg0,14 membrane (weight and heat flow as a function of
time).
Figure A-21 – TG analysis of the UFCA400-30ZAg0,14 membrane (weight and temperature as a function of
time).

A.9
A.4 EVALUATION OF THE BACTERICIDAL PROPERTIES
The results obtained in the antibacterial effect of the membranes are presented in Table A-3 – Table
A-10.
Table A-3 – Bactericidal effect of NFCA400-30, NFCA400-30ZSM5 and NFCA400-30Ag0,14 membranes
against P. aeruginosa (1st
).
NFCA400-30 NFCA400-30ZSM5 NFCA400-30Ag0,14
t (min) #Colonies %CFU t (min) #Colonies %CFU t (min) #Colonies %CFU
0 940.000 100 0 1.100.000 100 0 1.295.000 100
19 550.000 59 14 1.010.000 92 22 1.545.000 119
39 670.000 71 23 1.300.000 118 35 1.510.000 117
58 1.090.000 116 33 1.270.000 115 45 1.600.000 124
117 1.070.000 114 43 1.160.000 105 55 1.260.000 97
132 1.340.000 143 65 1.530.000 139 66 1.695.000 131
150 850.000 90 76 1.080.000 98 77 1.650.000 127
87 1.230.000 112 88 1.790.000 138
117 740.000 67 101 1.995.000 154
127 1.090.000 99 114 1.685.000 130
140 1.060.000 96 125 1.225.000 95
150 1.380.000 125 135 1.210.000 93
Table A-4 – Bactericidal effect of NFCA400-30ZAg0,005, NFCA400-30ZAg0,03 and NFCA400-30ZAg0,07
membranes against P. aeruginosa (1st
).
NFCA400-30ZAg0,005 NFCA400-30ZAg0,03 NFCA400-30ZAg0,07
t (min) #Colonies %CFU t (min) #Colonies %CFU t (min) #Colonies %CFU
0 1.800.000 100 0 1.000.000 100 0 2.490.000 100
16 1.600.000 89 15 600.000 60 12 1.490.000 60
31 1.200.000 67 26 800.000 80 21 1.930.000 78
42 1.300.000 72 49 800.000 80 31 1.350.000 54
53 800.000 44 59 1.200.000 120 41 1.640.000 66
75 400.000 22 88 800.000 80 48 1.220.000 49
92 600.000 33 100 1.000.000 100 57 1.990.000 80
103 300.000 17 112 800.000 80 67 1.730.000 69
144 400.000 22 138 500.000 50 77 1.330.000 53
163 700.000 39 156 700.000 70 89 1.540.000 62
174 800.000 44 98 1.450.000 58
109 730.000 29

A.10
Table A-5 – Bactericidal effect of NFCA400-30, NFCA400-30ZSM5 and NFCA400-30Ag0,14 membranes
against E. coli.
NFCA400-30 NFCA400-30ZSM5 NFCA400-30Ag0,14
t (min) #Colonies %CFU t (min) #Colonies %CFU t (min) #Colonies %CFU
0 1.200.000 100 0 500.000 100 0 500.000 100
32 400.000 33 18 1.900.000 380 18 1.000.000 200
49 300.000 25 40 1.200.000 240 32 500.000 100
70 900.000 75 56 300.000 60 46 1.100.000 220
87 800.000 67 76 300.000 60 59 700.000 140
132 5.200.000 433 92 1.600.000 320 72 1.700.000 340
149 6.000.000 500 111 4.400.000 880 85 3.500.000 700
165 5.600.000 467 128 4.400.000 880 99 2.800.000 560
192 18.500.000 1.542 150 8.600.000 1.720 118 3.200.000 640
235 31.400.000 2.617 169 23.800.000 4.760 187 24.900.000 4.980
200 44.600.000 8.920
247 58.800.000 11.760
Table A-6 – Bactericidal effect of NFCA400-30ZAg0,005 and NFCA400-30ZAg0,03 membranes against E.
coli.
NFCA400-30ZAg0,005 NFCA400-30ZAg0,03
t (min) #Colonies %CFU t (min) #Colonies %CFU
0 1.300.000 100 0 600.000 100
21 200.000 15 16 100.000 17
37 200.000 15 31 1.100.000 183
56 900.000 69 47 400.000 67
100 4.600.000 354 63 2.000.000 333
119 8.700.000 669 80 2.800.000 467
142 10.800.000 831 112 8.200.000 1.367
162 16.400.000 1.262 131 7.500.000 1.250
185 26.800.000 2.062 152 12.300.000 2.050
174 28.000.000 4.667
196 46.200.000 7.700
211 44.500.000 7.417
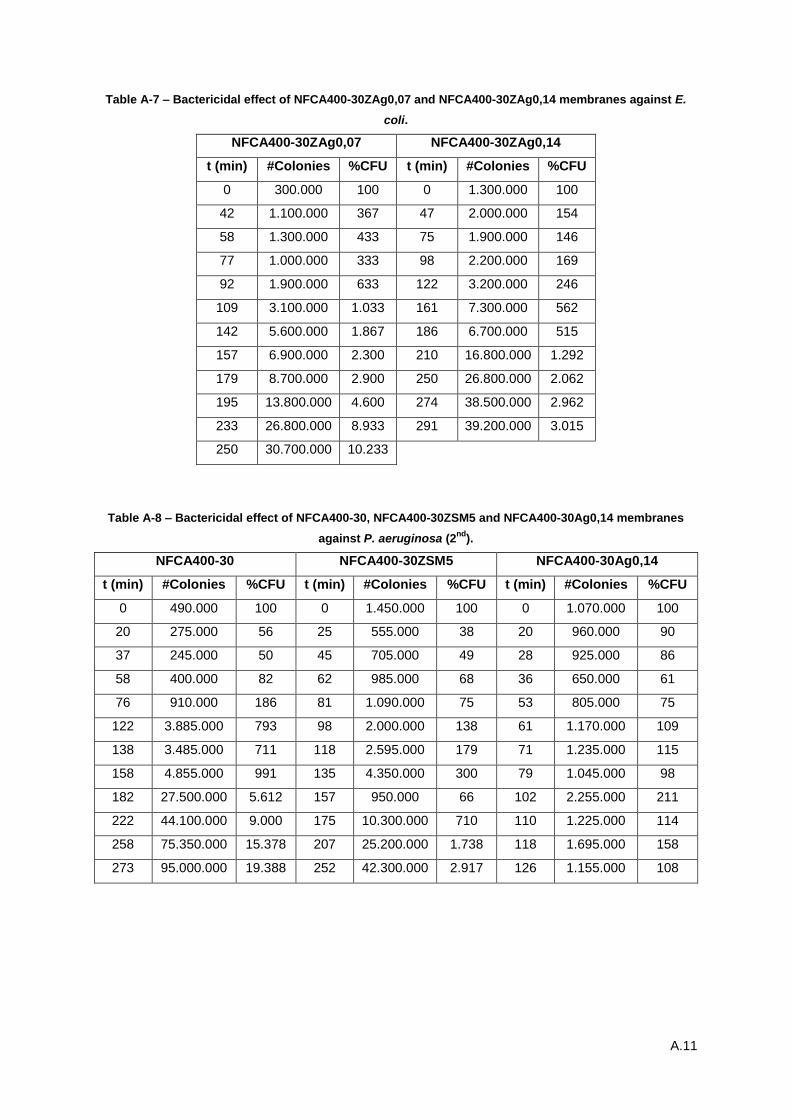
A.11
Table A-7 – Bactericidal effect of NFCA400-30ZAg0,07 and NFCA400-30ZAg0,14 membranes against E.
coli.
NFCA400-30ZAg0,07 NFCA400-30ZAg0,14
t (min) #Colonies %CFU t (min) #Colonies %CFU
0 300.000 100 0 1.300.000 100
42 1.100.000 367 47 2.000.000 154
58 1.300.000 433 75 1.900.000 146
77 1.000.000 333 98 2.200.000 169
92 1.900.000 633 122 3.200.000 246
109 3.100.000 1.033 161 7.300.000 562
142 5.600.000 1.867 186 6.700.000 515
157 6.900.000 2.300 210 16.800.000 1.292
179 8.700.000 2.900 250 26.800.000 2.062
195 13.800.000 4.600 274 38.500.000 2.962
233 26.800.000 8.933 291 39.200.000 3.015
250 30.700.000 10.233
Table A-8 – Bactericidal effect of NFCA400-30, NFCA400-30ZSM5 and NFCA400-30Ag0,14 membranes
against P. aeruginosa (2nd
).
NFCA400-30 NFCA400-30ZSM5 NFCA400-30Ag0,14
t (min) #Colonies %CFU t (min) #Colonies %CFU t (min) #Colonies %CFU
0 490.000 100 0 1.450.000 100 0 1.070.000 100
20 275.000 56 25 555.000 38 20 960.000 90
37 245.000 50 45 705.000 49 28 925.000 86
58 400.000 82 62 985.000 68 36 650.000 61
76 910.000 186 81 1.090.000 75 53 805.000 75
122 3.885.000 793 98 2.000.000 138 61 1.170.000 109
138 3.485.000 711 118 2.595.000 179 71 1.235.000 115
158 4.855.000 991 135 4.350.000 300 79 1.045.000 98
182 27.500.000 5.612 157 950.000 66 102 2.255.000 211
222 44.100.000 9.000 175 10.300.000 710 110 1.225.000 114
258 75.350.000 15.378 207 25.200.000 1.738 118 1.695.000 158
273 95.000.000 19.388 252 42.300.000 2.917 126 1.155.000 108

A.12
Table A-9 – Bactericidal effect of NFCA400-30ZAg0,005 and NFCA400-30ZAg0,03 membranes against P.
aeruginosa (2nd
).
NFCA400-30ZAg0,005 NFCA400-30ZAg0,03
t (min) #Colonies %CFU t (min) #Colonies %CFU
0 100.000 100 0 315.000 100
20 320.000 320 26 345.000 110
62 2.780.000 2.780 42 350.000 111
81 4.565.000 4.565 57 630.000 200
101 1.800.000 1.800 72 365.000 116
123 16.250.000 16.250 89 2.035.000 646
149 21.250.000 21.250 122 4.325.000 1.373
164 44.400.000 44.400 140 11.000.000 3.492
180 76.000.000 76.000 161 12.100.000 3.841
210 95.000.000 95.000 184 28.550.000 9.063
206 47.700.000 15.143
222 79.000.000 25.079
Table A-10 – Bactericidal effect of NFCA400-30ZAg0,07 and NFCA400-30ZAg0,14 membranes against P.
aeruginosa (2nd
).
NFCA400-30ZAg0,07 NFCA400-30ZAg0,14
t (min) #Colonies %CFU t (min) #Colonies %CFU
0 720.000 100 0 595.000 100
20 1.475.000 205 24 630.000 106
36 2.080.000 289 53 240.000 40
54 1.965.000 273 78 780.000 131
71 2.035.000 283 111 260.000 44
88 4.300.000 597 143 335.000 56
120 9.200.000 1.278 168 360.000 61
136 12.800.000 1.778 208 910.000 153
157 27.200.000 3.778 231 830.000 139
173 22.900.000 3.181 250 2.500.000 420
213 43.050.000 5.979 272 1.135.000 191
227 44.300.000 6.153 289 1.515.000 255