Bacterial Community Composition and Diversity in Methane Charged Sediments Revealed by Multitag...
13
This article was downloaded by: [McGill University Library] On: 20 April 2013, At: 18:37 Publisher: Taylor & Francis Informa Ltd Registered in England and Wales Registered Number: 1072954 Registered office: Mortimer House, 37-41 Mortimer Street, London W1T 3JH, UK Geomicrobiology Journal Publication details, including instructions for authors and subscription information: http://www.tandfonline.com/loi/ugmb20 Bacterial Community Composition and Diversity in Methane Charged Sediments Revealed by Multitag Pyrosequencing Leila J. Hamdan a , Masoumeh Sikaroodi b & Patrick M. Gillevet b a Marine Biogeochemistry Section, U.S. Naval Research Laboratory, Washington, District of Columbia, USA b Microbiome Analysis Center, Department of Environmental Science and Policy, George Mason University, Manassas, Virginia, USA Version of record first published: 08 Feb 2012. To cite this article: Leila J. Hamdan , Masoumeh Sikaroodi & Patrick M. Gillevet (2012): Bacterial Community Composition and Diversity in Methane Charged Sediments Revealed by Multitag Pyrosequencing, Geomicrobiology Journal, 29:4, 340-351 To link to this article: http://dx.doi.org/10.1080/01490451.2011.559305 PLEASE SCROLL DOWN FOR ARTICLE Full terms and conditions of use: http://www.tandfonline.com/page/terms-and-conditions This article may be used for research, teaching, and private study purposes. Any substantial or systematic reproduction, redistribution, reselling, loan, sub-licensing, systematic supply, or distribution in any form to anyone is expressly forbidden. The publisher does not give any warranty express or implied or make any representation that the contents will be complete or accurate or up to date. The accuracy of any instructions, formulae, and drug doses should be independently verified with primary sources. The publisher shall not be liable for any loss, actions, claims, proceedings, demand, or costs or damages whatsoever or howsoever caused arising directly or indirectly in connection with or arising out of the use of this material.
Transcript of Bacterial Community Composition and Diversity in Methane Charged Sediments Revealed by Multitag...

This article was downloaded by: [McGill University Library]On: 20 April 2013, At: 18:37Publisher: Taylor & FrancisInforma Ltd Registered in England and Wales Registered Number: 1072954 Registered office: Mortimer House,37-41 Mortimer Street, London W1T 3JH, UK
Geomicrobiology JournalPublication details, including instructions for authors and subscription information:http://www.tandfonline.com/loi/ugmb20
Bacterial Community Composition and Diversity inMethane Charged Sediments Revealed by MultitagPyrosequencingLeila J. Hamdan a , Masoumeh Sikaroodi b & Patrick M. Gillevet ba Marine Biogeochemistry Section, U.S. Naval Research Laboratory, Washington, District ofColumbia, USAb Microbiome Analysis Center, Department of Environmental Science and Policy, GeorgeMason University, Manassas, Virginia, USAVersion of record first published: 08 Feb 2012.
To cite this article: Leila J. Hamdan , Masoumeh Sikaroodi & Patrick M. Gillevet (2012): Bacterial Community Compositionand Diversity in Methane Charged Sediments Revealed by Multitag Pyrosequencing, Geomicrobiology Journal, 29:4, 340-351
To link to this article: http://dx.doi.org/10.1080/01490451.2011.559305
PLEASE SCROLL DOWN FOR ARTICLE
Full terms and conditions of use: http://www.tandfonline.com/page/terms-and-conditions
This article may be used for research, teaching, and private study purposes. Any substantial or systematicreproduction, redistribution, reselling, loan, sub-licensing, systematic supply, or distribution in any form toanyone is expressly forbidden.
The publisher does not give any warranty express or implied or make any representation that the contentswill be complete or accurate or up to date. The accuracy of any instructions, formulae, and drug doses shouldbe independently verified with primary sources. The publisher shall not be liable for any loss, actions, claims,proceedings, demand, or costs or damages whatsoever or howsoever caused arising directly or indirectly inconnection with or arising out of the use of this material.

Geomicrobiology Journal, 29:340–351, 2012Copyright © Taylor & Francis Group, LLCISSN: 0149-0451 print / 1521-0529 onlineDOI: 10.1080/01490451.2011.559305
Bacterial Community Composition and Diversity in MethaneCharged Sediments Revealed by Multitag Pyrosequencing
Leila J. Hamdan,1 Masoumeh Sikaroodi,2 and Patrick M. Gillevet2
1Marine Biogeochemistry Section, U.S. Naval Research Laboratory, Washington,District of Columbia, USA2Microbiome Analysis Center, Department of Environmental Science and Policy,George Mason University, Manassas, Virginia, USA
Bacterial diversity in sediments obtained along the Chilean mar-gin from areas containing methane seeps, and a hydrate moundwere explored by cloning and sequencing and multitag pyrose-quencing (MTPS). These libraries were statistically compared todetermine the robustness of taxonomic assignment derived frommultiplexed pyrosequencing strategies targeting variable regionsV1 and V2 of the small subunit rRNA gene for environmentalstudies. There was no statistical difference in the composition ofthe libraries, thus, MTPS was utilized to describe diversity in threegeochemical zones in these environments. Unidentified Cyanobac-teria isolates were abundant in the sulfate reduction zone (SRZ),Deltaproteobacteria were concentrated at the sulfate methane tran-sition zone (SMTZ) and Chloroflexi/GNS dominated methanogen-esis zone (MGZ). Although there was variation among specificgroups, communities in the SRZ and MGZ did not differ signifi-cantly. However, the community dominated by Deltaproteobacteriadifferentiates the SMTZ from the other zones. Supplemental ma-terials are available for this article. Go to the publisher’s onlineedition of Geomicrobiology Journal to view the free supplementalfile.
Keywords AOM, bacteria, Chilean margin, methane, multi-tag, py-rosequencing, sulfate
INTRODUCTIONThe ability to determine the number and types of microorgan-
isms within a community is fundamental to understanding thestructure and function of an ecosystem. Microbiomic studies are
Received 28 July 2010; accepted 28 January 2011.This work was supported by the Office of Naval Research and
the Naval Research Laboratory Chemistry Division Young InvestigatorProgram. We thank the captain and crew of the OSV Vidal Gormaz forfield assistance, R. Downer and L. Bryant for design and operation ofthe coring device. We thank our collaborators R. Coffin, J. Pohlman,W. Wood, R. Plummer, and J. Diaz, for their support of this study.
Address correspondence to Leila J. Hamdan, Marine Biogeochem-istry Section, Code 6114, U.S. Naval Research Laboratory, Over-look Ave. SW, Washington, DC 22375, USA. E-mail: [email protected]
uniquely suited to provide information on the composition of en-vironmental microbial communities (Hudson 2008; Kowalchuket al. 2007; Parameswaran et al. 2007; Pernthaler et al. 2008)including those found in marine methane seeps. Numerous at-tempts have been made to recover culturable organisms frommethane seeps, but to date, axenic cultures have not been ob-tained and in vitro studies have provided limited information onkey taxonomic groups involved in the anaerobic oxidation ofmethane (AOM) (Girguis et al. 2005; Nauhaus et al. 2007).
In contrast, culture independent studies of methane seep com-munities have vastly expanded the understanding of these sys-tems (Boetius et al. 2000; Inagaki et al. 2006; Knittel et al.2005; Lanoil et al. 2001; Orphan et al. 2001; Pernthaler et al.2008). Studies of environmental samples assayed by cloningand Sanger sequencing can be costly and time consuming, es-pecially if clone libraries are exhaustively analyzed (Grant andOgilvie 2004; Taylor et al. 2008) and when large sample sets areneeded. Although sample number may be minimized by pool-ing, for biogeochemical studies of methane seeps it is desirableto have direct comparison of phylogenetic data to geochemi-cal data from discrete samples to reveal changes in communitycomposition in different redox zones.
The three principal microbial metabolic pathways present inmethane seeps are sulfate reduction, methanogenesis, and AOM(Harrison et al. 2009; Orcutt et al. 2005). These pathways, alongwith inherent geochemical and geological conditions at seeplocations in the global ocean, regulate the export of methane tonear surface sediments and the overlying water column (Valen-tine and Reeburgh 2000; Whiticar 1999). Exhaustive studies ofbacterial community composition and the biogeochemistry ofseep environments should be conducted in order to determinethe unique role that the bacteria play in natural methane seeps.
A recent study of a methane seep along the Chilean mar-gin (Hamdan et al. 2008) revealed the identity of the dominantbacterial clades at the sulfate methane transition zone (SMTZ).However, more in depth studies of the complexity of bacterialcommunities at this location are required to understand the dis-tribution and diversity of bacteria in the sulfate reduction zone
340
Dow
nloa
ded
by [
McG
ill U
nive
rsity
Lib
rary
] at
18:
37 2
0 A
pril
2013
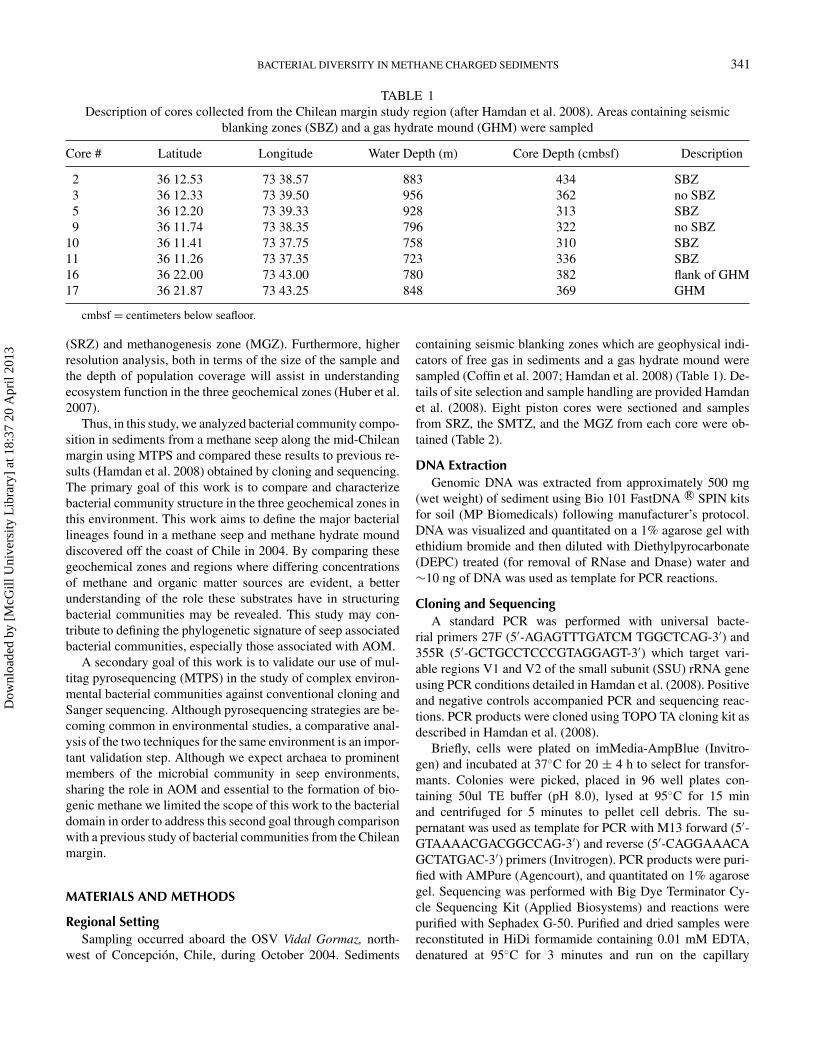
BACTERIAL DIVERSITY IN METHANE CHARGED SEDIMENTS 341
TABLE 1Description of cores collected from the Chilean margin study region (after Hamdan et al. 2008). Areas containing seismic
blanking zones (SBZ) and a gas hydrate mound (GHM) were sampled
Core # Latitude Longitude Water Depth (m) Core Depth (cmbsf) Description
2 36 12.53 73 38.57 883 434 SBZ3 36 12.33 73 39.50 956 362 no SBZ5 36 12.20 73 39.33 928 313 SBZ9 36 11.74 73 38.35 796 322 no SBZ
10 36 11.41 73 37.75 758 310 SBZ11 36 11.26 73 37.35 723 336 SBZ16 36 22.00 73 43.00 780 382 flank of GHM17 36 21.87 73 43.25 848 369 GHM
cmbsf = centimeters below seafloor.
(SRZ) and methanogenesis zone (MGZ). Furthermore, higherresolution analysis, both in terms of the size of the sample andthe depth of population coverage will assist in understandingecosystem function in the three geochemical zones (Huber et al.2007).
Thus, in this study, we analyzed bacterial community compo-sition in sediments from a methane seep along the mid-Chileanmargin using MTPS and compared these results to previous re-sults (Hamdan et al. 2008) obtained by cloning and sequencing.The primary goal of this work is to compare and characterizebacterial community structure in the three geochemical zones inthis environment. This work aims to define the major bacteriallineages found in a methane seep and methane hydrate mounddiscovered off the coast of Chile in 2004. By comparing thesegeochemical zones and regions where differing concentrationsof methane and organic matter sources are evident, a betterunderstanding of the role these substrates have in structuringbacterial communities may be revealed. This study may con-tribute to defining the phylogenetic signature of seep associatedbacterial communities, especially those associated with AOM.
A secondary goal of this work is to validate our use of mul-titag pyrosequencing (MTPS) in the study of complex environ-mental bacterial communities against conventional cloning andSanger sequencing. Although pyrosequencing strategies are be-coming common in environmental studies, a comparative anal-ysis of the two techniques for the same environment is an impor-tant validation step. Although we expect archaea to prominentmembers of the microbial community in seep environments,sharing the role in AOM and essential to the formation of bio-genic methane we limited the scope of this work to the bacterialdomain in order to address this second goal through comparisonwith a previous study of bacterial communities from the Chileanmargin.
MATERIALS AND METHODS
Regional SettingSampling occurred aboard the OSV Vidal Gormaz, north-
west of Concepcion, Chile, during October 2004. Sediments
containing seismic blanking zones which are geophysical indi-cators of free gas in sediments and a gas hydrate mound weresampled (Coffin et al. 2007; Hamdan et al. 2008) (Table 1). De-tails of site selection and sample handling are provided Hamdanet al. (2008). Eight piston cores were sectioned and samplesfrom SRZ, the SMTZ, and the MGZ from each core were ob-tained (Table 2).
DNA ExtractionGenomic DNA was extracted from approximately 500 mg
(wet weight) of sediment using Bio 101 FastDNA R© SPIN kitsfor soil (MP Biomedicals) following manufacturer’s protocol.DNA was visualized and quantitated on a 1% agarose gel withethidium bromide and then diluted with Diethylpyrocarbonate(DEPC) treated (for removal of RNase and Dnase) water and∼10 ng of DNA was used as template for PCR reactions.
Cloning and SequencingA standard PCR was performed with universal bacte-
rial primers 27F (5′-AGAGTTTGATCM TGGCTCAG-3′) and355R (5′-GCTGCCTCCCGTAGGAGT-3′) which target vari-able regions V1 and V2 of the small subunit (SSU) rRNA geneusing PCR conditions detailed in Hamdan et al. (2008). Positiveand negative controls accompanied PCR and sequencing reac-tions. PCR products were cloned using TOPO TA cloning kit asdescribed in Hamdan et al. (2008).
Briefly, cells were plated on imMedia-AmpBlue (Invitro-gen) and incubated at 37◦C for 20 ± 4 h to select for transfor-mants. Colonies were picked, placed in 96 well plates con-taining 50ul TE buffer (pH 8.0), lysed at 95◦C for 15 minand centrifuged for 5 minutes to pellet cell debris. The su-pernatant was used as template for PCR with M13 forward (5′-GTAAAACGACGGCCAG-3′) and reverse (5′-CAGGAAACAGCTATGAC-3′) primers (Invitrogen). PCR products were puri-fied with AMPure (Agencourt), and quantitated on 1% agarosegel. Sequencing was performed with Big Dye Terminator Cy-cle Sequencing Kit (Applied Biosystems) and reactions werepurified with Sephadex G-50. Purified and dried samples werereconstituted in HiDi formamide containing 0.01 mM EDTA,denatured at 95◦C for 3 minutes and run on the capillary
Dow
nloa
ded
by [
McG
ill U
nive
rsity
Lib
rary
] at
18:
37 2
0 A
pril
2013

342 L. J. HAMDAN ET AL.
TABLE 2Descriptive statistics for multitag pyrosequence (MTPS) libraries. Data on the geochemical zones where samples were collected
from and the number of sequences obtained for each sample are reported. The Simpson’s Diversity index (D) was used tocalculate sample biodiversity. The number of phylotypes, total sequences and D are reported for forward and reverse sequences
separately
Sample Geochemical Sample Depth Phylotypes Phylotypes D D Sequences Sequencesname Core zone (cmbsf) Forward Reverse Forward Reverse Forward Reverse
2 32C 2 SRZ 37 22 28 0.10 0.06 466 3392 29C 2 SRZ 132 14 22 0.22 0.17 465 3322 27C 2 SMTZ 189 24 19 0.20 0.12 327 2732 24C 2 MGZ 264 27 20 0.07 0.10 390 3113 46C 3 SRZ 28 14 23 0.19 0.14 361 3153 40C 3 SMTZ 187 10 11 0.26 0.35 315 2893 35C 3 MGZ 332 18 14 0.17 0.18 291 2365 56C 5 SRZ 118 14 16 0.16 0.16 450 4095 51C 5 SMTZ 243 21 21 0.10 0.13 266 2095 48C 5 MGZ 313 8 10 0.35 0.29 244 2359 8S 9 SRZ 77 15 21 0.20 0.17 588 5319 3S 9 SMTZ 247 15 21 0.15 0.10 278 2339 1S 9 MGZ 297 20 19 0.13 0.12 316 30010 20S 10 SRZ 85 18 15 0.22 0.23 274 24410 16S 10 SMTZ 180 16 14 0.15 0.23 540 48410 12S 10 MGZ 280 19 24 0.10 0.08 452 42311 40S 11 SRZ 6 18 19 0.12 0.11 367 32311 38S 11 SMTZ 26 14 11 0.18 0.25 268 24711 37S∗ 11 SMTZ 36 21 16 0.10 0.12 204 16911 36S 11 MGZ 56 27 29 0.06 0.05 228 24911 24S 11 MGZ 336 22 24 0.11 0.10 343 33916 93S 16 SRZ 20 20 23 0.10 0.14 348 29816 89S 16 SRZ 112 22 16 0.07 0.13 302 24916 86S∗ 16 SMTZ 182 22 18 0.10 0.14 196 15916 78S 16 MGZ 382 21 21 0.13 0.18 199 16917 12T 17 SRZ 6 29 32 0.05 0.04 345 32417 11T∗ 17 SMTZ 11 26 13 0.08 0.18 251 25417 5T 17 MGZ 97 20 14 0.14 0.27 385 26117 99S 17 MGZ 269 21 18 0.12 0.13 269 25817 98S 17 MGZ 299 26 23 0.07 0.12 335 336
MGZ = methanogenesis zone.SRZ = sulfate reduction zone.SMTZ = sulfate-methane transition zone.cmbsf = centimeters below the seafloor.∗denotes samples which were included in clone analysis.
sequencer (SCE9610, SpectruMedix LLC). Data were ana-lyzed with BaseSpectrum (SpectruMedix LLC), and manuallychecked and trimmed with Sequencher (Gene Codes Corp.).
Clone and MTPS data were used in MEGABLAST searchesagainst GenBank. The hit table was parsed and the hit withthe highest bit score was chosen as the closest relative ofthe sequence in question. Sequence data, the correspondingGenBank hits, and the putative identification were writtenas a GDE formatted database (Smith 1994) using customPERL scripts. Clone and MTPS libraries were analyzed us-
ing classic rarefaction analysis (Heck et al. 1975; Kemp andAller 2004) to estimate diversity of the phylotypes in thecommunity.
Multitag PyrosequencingPrior to MTPS all samples were analyzed by Length
Heterogeneity-PCR (LH-PCR) as described in Hamdan et al.(2008, 2011). LH-PCR was conducted to screen for repro-ducibility and normalize the PCR yield for individual samplesprior to pooling for MTPS analysis.
Dow
nloa
ded
by [
McG
ill U
nive
rsity
Lib
rary
] at
18:
37 2
0 A
pril
2013

BACTERIAL DIVERSITY IN METHANE CHARGED SEDIMENTS 343
Pyrosequencing and its use for determining diversity of mi-crobial communities by sequencing of the 16S rRNA gene havebeen previously described (Margulies et al. 2005; Sogin et al.2006). Multiplexing was achieved by generating a set of tenforward-reverse barcode pair primers that contained 27F and355R primers (as above) tagged on the 5′ end with a 4 basebarcode (Patent number: WO/2008/061193). These primers tar-get variable regions V1 and V2 of the SSU rRNA gene. PCR wasperformed on individual samples using the barcoded primers.Samples were amplified for 32 cycles as described in Hamdanet al. (2008) and product was diluted so that the yield in eachsample was equivalent.
Ten samples were pooled and ligated to the PCR linkers usedin the emulsion step of pyrosequencing. Pyrosequencing wasperformed by 454-Life Sciences (Branford, CT) on the GS-20instrument with 10 tagged samples included in a single slot.The length of resulting sequences averaged 150 bp. The datafrom each well were “deconvoluted” by sorting the sequencesinto bins based on the barcodes and the taxa in the sampleswere normalized by the total number of reads from each bar-code using a PERL script. Short sequences falling below 75bp, reads having quality scores less than 25 and ambiguousreads having multiple Ns were removed from the dataset. Dueto the short read length of sequences, alignment of forward andreverse sequence pairs were often not possible. As a result, for-ward and reverse libraries were aligned and analyzed separately.MTPS sequence MEGABLAST search results were binnedbased on their barcode using a PERL script (Ghannoum et al.2010).
Statistical AnalysisUniFrac (Lozupone and Knight 2005; Lozupone et al.
2006) was used to compare Clone and MTPS libraries. For-ward and reverse MTPS libraries for complementary sampleswere compared individually. Clone and MTPS sequences werealigned using Clustal, a Neighbor Joining tree file was con-structed using PAUP and an environment file was defined foreach sample (sample name, analysis method) using a PERLscript. The tree file and environment file were loaded into theUniFrac online server (http://bmf2.colorado.edu/unifrac/index.psp).
The UniFrac Significance test that measures the distancebetween communities based on phylotypes was used to deter-mine if significant differences exist between clone and MTPSlibraries. The analysis was weighted using the abundance of se-quences in each contig group. The P-value generated from theUniFrac significance test describes if libraries for identical sam-ples differ significantly. The P-values were Bonferroni correctedfor the number of comparisons that were made. Principal co-ordinates analysis (PCO) was conducted on phylogenetic treesusing UniFrac to graphically display the UniFrac significancetest results. UniFrac was also used to measure the similarity be-tween sequence libraries constructed for SRZ, SMTZ and MGZsamples and for core comparisons.
Non-metric multi-dimensional scaling analysis (MDS) andhierarchal cluster analysis were conducted on a similarity ma-trix generated from a Bray-Curtis similarity analysis of MTPSdata using Primer-E (v.6) in order to graphically display sampleassemblages. The minimum stress level for the MDS analysiswas set at 0.01 with 25 restarts.
RESULTS AND DISCUSSION
Comparison of MTPS and Clone ResultsBacterial community amplicons from the SMTZ (Table 2)
of cores 11, 16 and 17 (samples 11-37S, 16-86S and 17-11T,respectively) were cloned and 226 clones were sequenced fromthese samples. A detailed description of these results are pre-sented in Hamdan et al. (2008). DNA from the same threesamples and 27 additional samples were analyzed by MTPS(Table 2). Samples are identified according to the core and geo-chemical zone from which they originated (Table 2). Descriptivedata for each sample are provided in Table 2. Table 3 providesan overview of the geochemical conditions in each core. Moredetail on the geochemistry of this environment is provided inHamdan et al. (2008).
The UniFrac Significance test results for the clone-MTPS(forward and reverse) comparison for samples 11-37S, 16-86Sand 17-11T are presented in Table 4. The probability that cloneand MTPS libraries for the same sample are dissimilar wasextremely low (P ≥ 0.87 in all cases). The analysis indicatesthat forward or reverse MTPS reads of 100–200 bp length cov-ering variable regions V1 or V2 of the small subunit rRNAgene identify the same community composition as longer readsobtained by conventional methods which cover both variable re-gions. This is an important finding, as most tag-pyrosequencingstrategies for environmental studies target variable region V6(Brazelton et al. 2010; Huse et al. 2008).
The number of clones was on the same order of magnitudeas MTPS sequences due to multiplexing (i.e., multiple sam-ples pooled in a run). However, with newer versions of Pyrose-quencing (GS-FLX Titanium reagents), one or two orders ofmagnitude more reads are possible. With greater numbers ofsequences, potential exists for revealing greater diversity in theenvironment than described here. Hence discrepancies betweenMTPS and clone data could emerge. On the other hand, thecurrent depth of sequencing identifies taxa that compose lessthan 1% of the bacteria-specific sequence library indicating thatgreater sequencing depth may not impact statistical compar-isons.
PCO was based on the UniFrac distance matrix and the re-sulting plot (Figure 1) describes the variation represented byeach principal coordinate (i.e., each axis). Principal coordinates(PC) 1 and 2 are depicted and combined explain ∼70% of thevariation for forward and reverse reads. Overall, the PCO analy-sis revealed clustering of clone and MTPS libraries for the samesample but segregates the libraries from different samples.
Dow
nloa
ded
by [
McG
ill U
nive
rsity
Lib
rary
] at
18:
37 2
0 A
pril
2013

344 L. J. HAMDAN ET AL.
TABLE 3Summary of average geochemical conditions observed in three geochemical zones in each sediment core. For information on
methods and discrete sample data see Hamdan et al. 2008
Geochemical Zone depth Chloride Sulfate Total dissolved Dissolved inorganic Methane Dissolved inorganic MethaneCore zone (cmbsf) (mM) (mM) sulfides (mM) carbon (mM) (mM) carbon δ13C δ13C
2 SRZ 164 532.8 16.6 0.0 10.9 0.0 −18 −682 SMTZ 189 540.1 2.3 0.0 24.1 0.0 −23 −502 MGZ 432 538.8 0.0 0.0 35.3 5.7 −8 −833 SRZ 162 544.8 12.8 0.0 16.0 0.0 −19 −573 SMTZ 187 531.3 0.5 0.0 29.4 0.1 −21 −903 MGZ 362 543.4 0.0 0.0 37.8 5.9 −6 −845 SRZ 218 538.3 15.2 0.0 13.6 0.0 −18 −565 SMTZ 243 537.0 1.2 0.0 28.3 0.0 −22 −635 MGZ 313 537.0 0.0 0.0 31.8 1.0 −17 −919 SRZ 217 540.5 15.9 0.0 12.9 0.0 −17 −619 SMTZ 247 530.0 0.0 0.0 30.2 0.3 −20 −939 MGZ 322 538.1 0.1 0.0 33.4 2.9 −12 −88
10 SRZ 160 533.0 16.6 0.0 10.3 0.0 −22 −5710 SMTZ 180 540.1 0.5 0.0 23.4 0.0 −28 −10110 MGZ 310 539.7 0.0 0.0 30.4 5.8 −11 −8211 SRZ 16 540.6 13.6 8.4 9.5 0.0 −41 −7311 SMTZ 36 539.3 0.0 14.1 15.9 1.4 −45 −8111 MGZ 336 532.7 0.1 1.1 22.4 3.1 −12 −6716 SRZ 157 541.2 17.9 1.7 7.0 0.0 −37 −6116 SMTZ 182 543.5 4.5 0.3 10.1 0.2 −50 −7816 MGZ 382 542.5 0.8 12.2 13.3 5.2 −39 −7917 SRZ 6 540.8 19.0 36.7 7.4 0.3 −34 −8317 SMTZ 11 537.6 10.5 32.1 11.2 0.2 −50 −8317 MGZ 369 518.0 1.3 55.5 15.2 4.4 −27 −66
MGZ = methanogenesis zone.SRZ = sulfate reduction zone.SMTZ = sulfate-methane transition zone.cmbsf = centimeters below the seafloor.
MPTS Survey ResultsIn total, 18861 sequences were analyzed and ∼2.8 Mb of
data were obtained. On average, 629 sequences were analyzedper sample (Table 2). Sequences were evenly distributed be-tween forward and reverse reads. The largest average number ofsequences were obtained from the SRZ (733 average) followedby the MGZ (597 average) and the SMTZ (551 average). Therewere fewer SMTZ samples because the zone appears across arestricted depth.
The Simpson’s Index (D) was used to estimate communitydiversity. With this index, D = 0 indicates infinite diversity and,D = 1 indicates no diversity (Table 2). In general, there were notrends observed in diversity among different geochemical zonesor among different cores. The value of D generally co-variedbetween forward and reverse reads. The lowest diversity wasobserved for samples 3-40C (SMTZ, core 3) and 5-48C (MGZ,core 5). The same result of low comparative diversity for 3-40Cwas obtained when operational taxonomic unit (OTU) diversitywas explored using LH-PCR (Hamdan et al. 2008).
We proceeded to analyze sequences that represent ≥1% ofthe total of each individual sample with the a priori assump-tion that the bulk of the metabolic functionality of the bacterialcommunity will be provided by the most abundant taxa. Thisargument is made because 16S sequences often (but not always)indicate function carried out by a community. However, thisapproach may focus on numerically dominant populations thatmay or may not be active in the samples.
As a whole, the greatest phylogenetic richness was observedfor the Chloroflexi/GNS where 46 and phylotypes were ob-served in all samples in the forward and reverse libraries re-spectively. Similar to other studies of methane seeps in theeastern Pacific (Biddle et al. 2005; Harrison et al. 2009; Ina-gaki et al. 2006; Parkes et al. 2005) Chloroflexi/GNS sequenceswere abundant and accounted for 7%–20% of sequences(Table 5). The highest concentration of Chloroflexi/GNS wasin the MGZ (Table 5). The majority of Chloroflexi/GNS wereclosely (≥98%) related to uncultured environmental clonesobtained from methane charged marine sediments. The most
Dow
nloa
ded
by [
McG
ill U
nive
rsity
Lib
rary
] at
18:
37 2
0 A
pril
2013

BACTERIAL DIVERSITY IN METHANE CHARGED SEDIMENTS 345
TABLE 4UniFrac significance test measuring similarity between clone and MTPS libraries for the same
sample. Forward and reverse sequences were aligned separately and compared to clonesindividually. P-values represent the probability that two communities are the same. All P-values arecorrected for multiple comparisons by multiplying the actual P-value by the number of comparisons
made (Bonferroni correction)
Forward MTPS comparison
MTPS11 37S MTPS16 86S MTPS17 11T
Clone11 37S 1 0.12 0.32Clone16 86S <0.001 0.87 <0.001Clone17 11T 0.13 0.15 1
Reverse MTPS comparison
MTPS11 37S MTPS16 86S MTPS17 11T
Clone11 37S 0.96 0.05 0.22Clone16 86S 0.02 0.88 0.26Clone17 11T 0.19 0.27 0.97
abundant of these in the forward library were related to a cloneisolated from hydrothermal vent fluids (GenBank AccessionAY869672, Huber et al. 2006). In the reverse library, the mostabundant Chloroflexi/GNS hit was a clone isolated from gashydrate containing sediments from the Gulf of Mexico (Gen-Bank Accession EU729310.1). Few Chloroflexi/GNS bacteriahave been cultivated (Adrian 2009; Sekiguchi 2006) and theirmetabolic role in seep environments is unknown.
Numerous observations of Chloroflexi/GNS in deep sedi-ments, and frequently below the SMTZ in methane seeps (Har-rison et al. 2009; Heijs et al. 2007; Reed et al. 2006), have ledto speculation that they play a role in methanogenesis possi-bly through the supply or regulation of metabolic intermediates.This is suggested by studies of environmental isolates from theAnaerolineanae and Caldilineae classes that demonstrate rapidgrowth only in the presence of methanogens (Sekiguchi 2006).
Fifty-two phylotypes were observed for the Proteobacteriain the forward library and 42 in the reverse library. Amongthese, the Deltaproteobacteria exhibited the greatest speciesrichness in the forward library with 23 phylotypes. In the re-verse library, 12 Deltaproteobacteria phylotypes were observed.Deltaproteobacteria accounted for 14% of all sequences (bothlibraries), and were most abundant at the SMTZ (35% of for-ward reads, 29% of reverse reads) (Table 5). The majority ofDeltaproteobacteria related sequences in the forward librarymatched most closely (≥98%) with an uncultured clone isolatedfrom sample 11–37S (GenBank Accession EF093848) associ-ated with the Desulfosarcina/Desulfococcus branch (Hamdanet al. 2008). In the current study, over 70% of sequences show-ing similarity to this clone were from the SMTZ. In the reverselibrary, 82% of Deltaproteobacteria related sequences bore thegreatest similarity (≥98%) to a Geobacter strain isolated from
lake sediment (GenBank Accession Y19190). Most sampleshad sequences related to this isolate; however, the highest abun-dances were in SMTZ samples (see supplemental Table S1,available online).
Numerous studies document significant populations ofDeltaproteobacteria in methane charged sediments and enrich-ment of Desulfosarcina/Desulfococcus at the SMTZ (Hamdanet al. 2008; Harrison et al. 2009; Inagaki et al. 2006; Mills et al.2003) due to their suspected role in AOM (Valentine 2002). Bycontrast, there are no reports to indicate Geobacter enrichmentat the SMTZ. Although there is high agreement in the abun-dance of (total) Deltaproteobacteria related sequences in boththe forward and reverse libraries, the reduction in diversity inDeltaproteobacteria and presence of phylotypes that are not of-ten encountered under the strict conditions of the SMTZ in thereverse library indicates that in some cases misidentification atthe phylotype level will result from the use of reverse sequences.
Geochemical data from cores 10, 11, 16, and 17 suggests thatenrichment of Deltaproteobacteria sequences at the SMTZ iscorrelated with AOM activity within that zone (Hamdan et al.2008). At the SMTZ in these cores, DIC δ13C and methane δ13Cwere both isotopically depleted (Table 3). The appearance of13C-depleted DIC can only be explained by the oxidation of a13C-depleted substrate, likely methane in this case.
Unlike the Deltaproteobacteria, the abundance of Alpha,Beta, Gamma and Epsilon-proteobacteria sequences were lowerin SMTZ samples compared to the two other zones (Table 5).Epsilon and Gammaproteobacteria were the least abundant ofall Proteobacteria sequences (<2%) (Table 5). Alphaproteobac-teria sequences ranged between 2% and 7% of the total for eachzone. There was a high level of agreement between forward andreverse libraries for this group. Betaproteobacteria sequences
Dow
nloa
ded
by [
McG
ill U
nive
rsity
Lib
rary
] at
18:
37 2
0 A
pril
2013

346 L. J. HAMDAN ET AL.
FIG. 1. Principal Coordinates Analysis (PCO) for Clone and MTPS libraries.Forward (A) and reverse (B) sequences were compared against clone librariesindependently.
were observed in all zones and were in lowest abundance atthe SMTZ. There were significantly more Betaproteobacteriarelated sequences in the forward library compared to the reverselibrary (Table 5).
A large number of sequences in the forward and reverse li-braries were grouped within two unique contig groups. The con-tig groups were most closely related with unknown environmen-tal sequences. Because of the numeric abundance of sequencesin these groups specifically, they accounted for 20% of forwardsequences and 16% of reverse sequences, an attempt was madeto provide information on their taxonomic identity and differ-entiate them from the bulk of other sequences with no knownaffiliation. Forward sequences in the unidentified group exhib-ited high similarity (>99%) to an uncultured isolate obtained
from biofilms formed in chlorine contaminated drinking wa-ter supply systems (GenBank Accession AY328718) (Williamset al. 2004).
Reverse sequences in the unidentified group exhibitedhigh similarity (>99%) to an isolate obtained from chlori-nated ethenes contaminated ground water (GenBank AccessionFM206100) collected from a constructed wetland (Imfeld et al.2009). BLAST searches on these isolates and review of theliterature revealed that both sequences were associated withCyanobacteria. Because of the indirect relationship betweensequences from this study to confirmed Cyanobacteria isolates,it cannot be definitively stated that these sequences are directlyrelated to the Cyanobacteria. Instead, they are identified for dis-cussion purposes as Cyanobacteria-like sequences. Althoughthe same hit was not obtained for the dominant Cyanobacte-ria-like phylotype in the forward and reverse libraries, there isconsiderable agreement in the patterns of abundance and diver-sity between the two libraries for this group (Table S1).
In both libraries, the greatest accumulation of Cyano-bacteria-like sequences was observed in the SRZ (Table 5).These values are driven by the abundance of Cyanobacteria-like sequences in cores from the DTAGS transect, in particularPC3 and PC5. In PC3 and PC5, on average 26 and 23% of for-ward and reverse (respectively) sequences were affiliated withthe Cyanobacteria-like contig group (Table S1). PC3 and PC5were collected from the greatest water depth, down slope fromother cores. The down slope appearance of these sequences inthe SRZ may be evidence that these locations are phytodetritustraps. Thus, the presence of Cyanobacteria-like sequences maybe an indicator of dormant populations imported from the watercolumn.
Notably, in PC11, also from the DTAGS transect, as wellas PC16 and PC17 obtained from the hydrate mound, theabundance of Cyanobacteria-like sequences was significantlylower. In the forward and reverse libraries for PC17, the abun-dance of such sequences were minimal in PC17 (<2% of se-quences). In addition, sequences from the Cyanobacteria-likecontig groups were absent from samples 11 38S, 17 11T and17 99S.
Due to the absence of Cyanobacteria related sequences insome samples, and the use of negative controls through all PCRand sequencing steps, it is unlikely that the high abundance ofsuch sequences is a result of experimental error. In addition,the concentrated appearance of these sequences at the base ofthe slope is indicative that their presence is not the result of arandom contamination event.
In the clone study conducted on this region (Hamdan et al.2008), no Cyanobacterial phylotypes were observed. This is ofconcern due to their elevated abundance in the current study.However, Cyanobacteria-like sequences were minimal in theMTPS libraries for samples used in the 2008 study. Specifically,in 11 37S and 16 86S, Cyanobacteria-like sequences accountedfor less than 1 and 4% of forward and reveres sequences, and in17 11T no such sequences were observed (Table S1).
Dow
nloa
ded
by [
McG
ill U
nive
rsity
Lib
rary
] at
18:
37 2
0 A
pril
2013

BACTERIAL DIVERSITY IN METHANE CHARGED SEDIMENTS 347
TABLE 5Summary of phylogenetic classes observed in the MTPS survey of samples obtained from the methanogenesis zone (MGZ),sulfate reduction zone (SRZ) and sulfate methane transition zone (SMTZ). Data are provided for both forward and reverse
sequence reads for each zone
Forward Reads Reverse Reads
Phylogenetic group SRZ SMTZ MGZ SRZ SMTZ MGZ
Acidobacteria 0.1% 0.1% 0.1% 0.2% 0.5% 0.0%Actinobacteria 5.9% 1.3% 3.8% 14.4% 6.1% 14.2%Alphaproteobacteria 6.6% 2.3% 5.3% 5.1% 3.8% 6.3%Bacilli 0.2% 0.2% 0.0% 0.2% 1.3% 0.1%Betaproteobacteria 10.7% 2.7% 7.2% 2.1% 1.3% 2.6%CFB 4.9% 6.0% 3.2% 2.5% 3.6% 3.9%Chloroflexi/GNS 10.4% 7.4% 17.7% 12.7% 16.1% 20.0%Clostridia 8.4% 8.9% 15.3% 3.0% 0.4% 0.1%Cyanobacteria 24.6% 16.9% 17.6% 18.7% 12.2% 15.2%Deferribacteres 0.3% 0.2% 0.2% 0.0% 0.0% 0.0%Deltaproteobacteria 4.7% 35.2% 6.7% 11.9% 28.5% 5.1%Epsilonproteobacteria 0.5% 0.0% 0.0% 0.6% 0.0% 0.1%Erysipelotrichi 0.2% 0.2% 0.0% 0.0% 0.0% 0.0%Gammaproteobacteria 2.3% 0.3% 0.3% 1.8% 0.0% 1.0%Gemmatimonades 0.1% 0.0% 0.0% 0.0% 0.0% 0.5%JS1 Candidate 3.8% 5.2% 6.6% 17.0% 16.9% 21.9%Mollicutes 1.1% 1.4% 0.6% 0.0% 0.0% 0.0%No clear affiliation 3.1% 5.6% 5.7% 5.6% 1.9% 2.6%OP Candidate 0.0% 1.6% 2.8% 0.9% 1.5% 2.9%Oscillatoriales 0.0% 0.0% 0.0% 0.1% 0.0% 0.0%Sphingobacteria 0.0% 0.0% 0.0% 1.5% 3.0% 2.1%Spirochaetes 11.6% 4.1% 6.4% 0.9% 1.5% 0.7%Verrucomicrobia 0.0% 0.5% 0.0% 0.0% 0.9% 0.0%WS3 Candidates 0.0% 0.0% 0.3% 0.4% 0.5% 0.7%
CFB = Cytophage-Flavobacterium-Bacteroides.GNS = Green nonsulfur bacteria.
The relatively high abundance of Cyanobacteria-like se-quences in cores from the DTAGS transect, especially the downslope core may be explained by the study area situated within theChilean upwelling region (Espinosa et al. 2009; Masquelier andVaulot 2008). The presence of the upwelling creates conditionsthat favor Cyanobacteria blooms. A study conducted duringthe same time frame as this study focused on the abundance ofwater column Cyanobacteria, primarily Prochlorococcus andSynechococcus (Masquelier and Vaulot 2008). Masquelier andVaulot (2008) observed high concentrations (up to 1 × 10⁴ cellsmL−1) of Cyanobacteria within our study region in the upper50 m of the water column. Cells that escape predation in thewater column may settle in coastal sediments, thus accountingfor the elevated number of Cyanobacteria related sequencesespecially within the SRZ. However, because the Cyanobac-teria-like contig group is not affiliated with any known watercolumn phylotypes, other explanations for their abundance aresought.
Another possible explanation for the abundance ofCyanobacteria-like sequences is association with near shorebenthic microbial mat communities dominated by Thioploca sp.(Gallardo 1977). Cyanobacteria are common members of thesecommunities. After the seasonal die off of filamentous benthicmats, genetic material may be deposited in sediments furtherout on the shelf. This may explain the relationship between se-quences observed during this study and clones associated withfilamentous biofilms.
A discrepancy in the abundance of JS1 candidate relatedsequences in the forward and reverse libraries is apparent (Table5). JS1 candidate sequences accounted for less than 5% of theforward library and 19% of the reverse library. In both cases,there was a moderate increase in JS1 candidate abundance withdepth (Table 5). These discrepancies likely have much to do withshorter reads not covering both of the variable regions (V1 andV2) that were interrogated in this study as well as the generallyuncharacterized nature of JS1 candidates.
Dow
nloa
ded
by [
McG
ill U
nive
rsity
Lib
rary
] at
18:
37 2
0 A
pril
2013

348 L. J. HAMDAN ET AL.
Although JS1 candidate related sequences were not equiva-lent in the forward and reverse libraries, the number of phy-lotypes that matched sequences from this study was nearlyequivalent (3 and 4 for forward and reverse libraries respec-tively). In addition two of the three phylotypes detected in theforward library were detected in the reverse library. JS1 candi-dates are observed frequently in methane seeps and are thoughtto play a unique but yet undiscovered role in biogeochemicalprocesses in deep marine methane charged sediments (Blaze-jak and Schippers 2010; Inagaki et al. 2006; Webster et al.2004). Because of their numeric importance to these environ-ments as revealed through previous works, future studies of seepenvironments should employ sequencing strategies that covertwo or more variable regions simultaneously to avoid misiden-tification of JS1 candidates or misinterpretation of libraryresults.
Spirochaetes did not account for a major fraction of forwardor reverse sequences. Such sequences were more abundant inthe forward library (8% of total sequences) than the reverselibrary (1% of total sequences). In both cases, a large accumula-tion of Spirochaetes related sequences were observed in samplesfrom all three zones in Core 16 and in the SRZ from Core 11(Table S1). Although sequence abundance was not equivalent,the number of unique phylotypes observed in both librarieswas. In addition, sequences related to a clone isolated from sed-iments in the Gulf of Mexico (GenBank Accession AB448905)were observed in both libraries. Our previous study documentedhigh abundance of a single Spirochaete clone in sample 16–86S(SMTZ) and a related OTU (observed by LH-PCR) exclusivelyin Core 16 (Hamdan et al. 2008). However, no MTPS sequencesfrom this study were related to the Spirochaete clone observedin our previous work.
Spirochaetes have been observed in association withchemosynthetic communities at methane rich hydrothermalvents (Blazejak et al. 2005; Campbell and Cary 2001).Spirochaete phylotypes in this study appear to be concentratedwithin Core 16 due to association with chemosynthetic ben-thic invertebrate communities and hydrogen sulfide enrichmentat the edge of the gas hydrate mound (Hamdan et al. 2008;Table 2).
Numerous sequences could not be assigned any taxonomybecause the best hit resulting from the MEGABLAST searchprovided little information useful for phylogenetic assignment.Such sequences are identified as having “No clear affiliation”(Table 5). The abundance of such sequences was roughly equalbetween forward and reverse libraries. Sequences related to 16(forward) and 20 (reverse) phylotypes fell into the category(Table 5). When the resulting highest hits themselves were usedin BLAST searches, this yielded only hits for other unclassi-fied isolates. Although no phylogenetic information accompa-nies this group, the isolation source in GenBank provided someuseful information. All but one phylotype in the group wereobtained from environmental settings, largely methane chargedsediments from the Peru Margin, Juan de Fuca Ridge, South
China Sea, Santa Barbara Basin, Eel River Basin, and GuaymasBasin.
Bacterial Community Composition in ThreeGeochemical Zones
The main goal of this work was to determine if communitiesin the SRZ, MGZ and SMTZ differ significantly. The UniFracsignificance test was used to compare composition in groupsof samples (geochemical zone or core) and individual samples.The analysis revealed that the probability that SMTZ samplesdiffered significantly from the SRZ and the MGZ group was high(p < 0.001). However, the probability that there are significantdifference between the MGZ and SRZ was extremely low (p >
0.84).The MDS (Figure 2) analysis on both forward and reverse
sequences illustrates three main clusters of samples: SMTZ sam-ples from cores 3, 10, 11 and 17, Core 16 samples; and the major-ity of remaining samples. The orientation of samples within theSMTZ cluster appears to be driven by the abundance Deltapro-teobacteria sequences. Select samples within the SMTZ clusterhad marginally lower biodiversity (Table 3) and the percentof sequences related to Deltaproteobacteria was generally ele-vated (Table S1). Missing from the SMTZ cluster are the SMTZsamples from cores 2, 5, and 9.
These samples originated from cores that had reducedmethane concentration relative to other locations and diffusiondriven sulfate gradients (Hamdan et al. 2008). DIC δ13C datafrom these cores did not demonstrate that sulfate dependentAOM was driving sulfate depletion (Table 3). It is likely thatthe bacterial community at the SMTZ in cores 2, 5 and 9 doesnot reflect the characteristic profile of the bacterial microbiomeassociated with AOM in methane charged sediments and hence,they fell within the clusters that contain the majority of MGZand SRZ samples.
A cluster of all samples from core 16 was evident on theMDS plots (Figure 2). The UniFrac significance test indicateddissimilarity between core 16 and all other cores (p < 0.001)except core 17 (p > 0.05). The distinct grouping of core 16 sam-ples seems to be driven in part by a relatively high abundanceof Spirochaete related sequences found almost exclusivelyin this core which are likely present due to association withchemosynthetic benthic communities (Hamdan et al. 2008).In addition, biodiversity in samples from core 16 was slightlyelevated compared to others cores (Table 2).
Samples 17-12S and 11-37S are outliers in the MDS plots.Sample 17-12S has the highest biodiversity of all samples(Table 2). The high biodiversity of this sample is evidenced bythe fact that over 60% of sequences for this sample were of phy-lotypes that accounted for less than 1% of the total population.Sample 11-37S appears to be an outlier because of an elevatedabundance sequences identified as Cytophage-Flavobacterium-Bacteroides (CFB) in the forward library, and sequences iden-tified as Sphingobacteria in the reverse library relative to othersamples.
Dow
nloa
ded
by [
McG
ill U
nive
rsity
Lib
rary
] at
18:
37 2
0 A
pril
2013

BACTERIAL DIVERSITY IN METHANE CHARGED SEDIMENTS 349
Resemblance: S17 Bray Curtis similarity
zoneMGZSRZSMTZ
Similarity3050
10_12S_F
10_16S_F 10_20S_F
11_24S_F
11_36S_F
11_37S_F
11_38S_F
11_40S_F
16_78S_F
16_86S_F
16_89S_F16_93S_F
17_11T_F
17_12S_F
17_5T_F
17_98S_F
17_99S_F
2_24C_F
2_27C_F
2_29C_F
2_32C_F
3_35C_F
3_40C_F
3_46C_F
5_48C_F
5_51C_F5_56C_F
9_1S_F
9_3S_F
9_8S_F
Resemblance: S17 Bray Curtis similarity
10_12S_R
10_16S_R
10_20S_R
11_24S_R
11_36S_R
11_37S_R
11_38S_R
11_40S_R
16_78S_R
16_86S_R
16_89S_R
16_93S_R
17_11T_R
17_12S_R
17_5T_R
17_98S_R17_99S_R
2_24C_R
2_27C_R
2_29C_R
2_32C_R
3_35C_R
3_40C_R
3_46C_R
5_48C_R
5_51C_R
5_56C_R
9_1S_R
9_3S_R
9_8S_R
2D Stress: 0.17
A
B
2D Stress: 0.16
FIG. 2. Multi-dimensional scaling (MDS) plot of the assemblages of MTPS sequences in each sediment sample obtained from the methanogenesis zone(MGZ –triangles) the sulfate reduction zone (SRZ- squares) and the sulfate-methane transition zone (SMTZ- diamonds). Contours were generated by a hierarchalcluster analysis conducted on a Bray-Curtis analysis of similarity for forward (A) and reverse (B) sequences. Contours represent the degree of similarity (%)between samples in each cluster.
Because the SRZ and MGZ are characterized by two dia-genic metabolic processes which compete for substrates, it wasreasonable to hypothesize that bacterial communities in bothzones would be distinct. The abundance of Chloroflexi/GNS andClostridia sequences were markedly elevated in MGZ samplescompared to the other zones. However, the UniFrac significance
test does not indicate that this observation is significantly dif-ferent. While this finding is surprising, it is consistent with ourprevious work where statistical analysis of LH-PCR data for104 samples collected during this effort confirms that there wasno significant difference in community composition betweenthe SRZ and MGZ (Hamdan et al. 2008). These results may
Dow
nloa
ded
by [
McG
ill U
nive
rsity
Lib
rary
] at
18:
37 2
0 A
pril
2013

350 L. J. HAMDAN ET AL.
suggest that like conventional methods, high-throughput DNAbased assays are unable to differentiate active communities fromdormant ones in deep marine sediments.
Future studies that focus on analysis of the microbial tran-scriptome and proteome may be useful in differentiating be-tween active and dormant populations. Likewise, future studiesof archaeal communities in these sediments m may demonstratedifferences in community composition between the SRZ andMGZ given the importance of archaeal lineages to methaneproduction and methane oxidation in anoxic sediments. In ad-dition, δ13C data from this study indicate a distinctly biogenic(archaeal) origin for methane (Table 3 and (Hamdan et al. 2008)and presumably a distinct archaeal community associated withmethanogenesis in deeper sediments.
CONCLUSIONSMTPS sequences were statistically compared against con-
ventional clone data to demonstrate the utility of 454-pyrosequencing of the hypervariable regions V1 and V2 forstudying environmental sample sets. The analysis revealed thatMPTS sequence library data is complementary to clone librarydata and the two data sets yield statistically comparable in-formation. This justifies comparisons of data sets establishedwith these different methods and suggests that such compar-isons should continue to be made as pyrosequencing technologyevolves.
MTPS analysis revealed that community structure at theSMTZ was distinct from both the SRZ and MGZ. However, sta-tistical delineation between the MGZ and SRZ was not observed.A distinct bacterial community was observed at the SMTZ in ar-eas receiving significant methane input from deeper sediments.At such locations, relatively few Deltaproteobacteria phylo-types dominated community composition. Although a similarfinding was made during a previous study of this region, whichrelied on clone libraries, the data presented here are significantfor three reasons.
First, the size of the sequence library for this study is nearlytwo orders of magnitude larger than the previous one thus pro-viding support for the previous work. Second, due to the largersize of the sequence library, a greater number of “rare” se-quences were observed that were not found in a smaller clonelibrary. Despite the greater community coverage, the study stilldemonstrates that relatively few lineages are responsible forthe bacterial microbiome found at the SMTZ in this methaneseep. Third, the SMTZ community observed along the ChileanMargin bears similar characteristics to SMTZ communities ob-served throughout the ocean. This finding supports the emergingidea of a distinct yet cosmopolitan community at this globallysignificant geochemical horizon.
REFERENCESAdrian L. 2009. ERC-group microflex: microbiology of Dehalococcoides-like
Chloroflexi. Rev Environ Sci Biotechnol 8:225–229.
Biddle JF, House CH, Brenchley JE. 2005. Microbial stratification in deeplyburied marine sediment reflects changes in sulfate/methane profiles. Geobi-ology 3:287–295.
Blazejak A, Erseus C, Amann R, Dubilier N. 2005. Coexistence of bacte-rial sulfide oxidizers, sulfate reducers, and spirochetes in a gutless worm(Oligochaeta) from the Peru margin. Appl Environ Microbiol 71:1553–1561.
Blazejak A, Schippers A. 2010. High abundance of JS-1- and Chloroflexi-relatedBacteria in deeply buried marine sediments revealed by quantitative, real-timePCR. FEMS Microbiol Ecol 72:198–207.
Boetius A, Ravenschlag K, Schubert CJ, Rickert D, Widdel F, Gleseke A,Amann R, Jørgensen BB, Witte U, Pfannkuche O. 2000. A marine micro-bial consortium apparently mediating anaerobic oxidation methane. Nature407:623–626.
Brazelton WJ, Sogin ML, Baross JA. 2010. Multiple scales of diversificationwithin natural populations of archaea in hydrothermal chimney biofilms.Environ Microbiol Repts 2:236–242.
Campbell BJ, Cary SC. 2001. Characterization of a novel spirochete associatedwith the hydrothermal vent polychaete annelid, Alvinella pompejana. ApplEnviron Microbiol 67:110–117.
Coffin R, Pohlman J, Gardner J, Downer R, Wood W, Hamdan L, Walker S,Plummer R, Gettrust J, Diaz J. 2007. Methane hydrate exploration on themid Chilean coast: A geochemical and geophysical survey. J Petrol Sci Eng56:32–41.
Espinosa LF, Pantoja S, Pinto LA, Rullkotter J. 2009. Water column distributionof phospholipid-derived fatty acids of marine microorganisms in the Hum-boldt Current system off northern Chile. Deep-Sea Research Part Ii-Top StudOceanogr 56:1039–1048.
Gallardo VA. 1977. Large benthic microbial communities in sulphide biotaunder Peru-Chile subsurface countercurrent. Nature 268:331–332.
Ghannoum MA, Jurevic RJ, Mukherjee PK, Cui F, Sikaroodi M, Naqvi A,Gillevet PM. 2010. Characterization of the oral fungal microbiome (Myco-biome) in healthy individuals. PLoS Pathog 6:e1000713.
Girguis PR, Cozen AE, DeLong EF. 2005. Growth and population dynam-ics of anaerobic methane-oxidizing archaea and sulfate-reducing bacte-ria in a continuous-flow bioreactor. Appl Environ Microbiol 71:3725–3733.
Grant A, Ogilvie LA. 2004. Name that microbe: rapid identification of taxaresponsible for individual fragments in fingerprints of microbial communitystructure. Mol Ecol. Notes 4:133–136.
Hamdan LJ, Gillevet PM, Sikaroodi M, Pohlman JW, Plummer RE, Coffin RB.2008. Geomicrobial characterization of gas hydrate-bearing sediments alongthe mid-Chilean margin. FEMS Microbiol Ecol 65:15–30.
Hamdan LJ, Gillevet PM, Pohlman JW, Sikaroodi M, Greinert J, Coffin RB.2011. Diversity and biogeochemical structuring of bacterial communitiesacross the Porangahau ridge accretionary prism, New Zealand. FEMS Mi-crobiology Ecology 77:518–532.
Harrison BK, Zhang H, Berelson W, Orphan VJ. 2009. Variations in archaealand bacterial diversity associated with the sulfate-methane transition zonein continental margin sediments (Santa Barbara Basin, California). ApplEnviron Microbiol 75:1487–1499.
Heck KL, Vanbelle G, Simberloff D. 1975. Explicit calculation of rarefactiondiversity measurement and determination of sufficient sample size. Ecology56:1459–1461.
Heijs S, Haese R, van der Wielen P, Forney L, van Elsas J. 2007. Use of 16SrRNA gene based clone libraries to assess microbial communities poten-tially involved in anaerobic methane oxidation in a Mediterranean cold seep.Microb Ecol 53:384–398.
Huber JA, Johnson HP, Butterfield DA, Baross JA. 2006. Microbial life in ridgeflank crustal fluids. Environ Microbiol 8:88–99.
Huber JA, Mark Welch D, Morrison HG, Huse SM, Neal PR, Butterfield DA,Sogin ML. 2007. Microbial population structures in the deep marine bio-sphere. Science 318:97–100.
Hudson ME. 2008. Sequencing breakthroughs for genomic ecology and evolu-tionary biology. Mol Ecol Notes 8:3–17.
Dow
nloa
ded
by [
McG
ill U
nive
rsity
Lib
rary
] at
18:
37 2
0 A
pril
2013

BACTERIAL DIVERSITY IN METHANE CHARGED SEDIMENTS 351
Huse SM, Dethlefsen L, Huber JA, Welch DM, Relman DA, Sogin ML. 2008.Exploring microbial diversity and taxonomy using SSU rRNA hypervariabletag sequencing. PLOS Genetics 4.
Inagaki F, Nunoura T, Nakagawa S, Teske A, Lever M, Lauer A, Suzuki M,Takai K, Delwiche M, Colwell FS, others. 2006. Biogeographical distributionand diversity of microbes in methane hydrate-bearing deep marine sediments,on the Pacific Ocean Margin. Proc Natl Acad Sci USA 103:2815–2820.
Kemp PF, Aller JY. 2004. Bacterial diversity in aquatic and other environments:what 16S rDNA libraries can tell us. FEMS Microbiol Ecol 47:161–177.
Knittel K, Losekann T, Boetius A, Amann R, Kort R. 2005. Diversity anddistribution of methanotrophic archaea at cold seeps. Appl Environ Microbiol71:467–479.
Kowalchuk GA, Speksnijder AGCL, Zhang K, Goodman RM, van VeenJA. 2007. Finding the needles in the metagenome haystack. Microb Ecol53:475–485.
Lanoil BD, Sassen R, La Duc MT, Sweet ST, Nealson KH. 2001. Bacteriaand archaea physically associated with Gulf of Mexico gas hydrates. ApplEnviron Microbiol 67:5143–5153.
Lozupone C, Hamady M, Knight R. 2006. UniFrac—An online tool for com-paring microbial community diversity in a phylogenetic context. BMC Bioin-formatics 7:371.
Lozupone C, Knight R. 2005. UniFrac: a new phylogenetic method for compar-ing microbial communities. Appl Environ Microbiol 71:8228–8235.
Margulies M, Egholm M, Altman WE, Attiya S, Bader JS, Bemben LA, BerkaJ, Braverman MS, Chen YJ, Chen Z, others. 2005. Genome sequencing inmicrofabricated high-density picolitre reactors. Nature 437:376–380.
Masquelier S, Vaulot D. 2008. Distribution of micro-organisms along a transectin the South-East Pacific Ocean (BIOSOPE cruise) using epifluorescencemicroscopy. Biogeosciences 5:311–321.
Mills DK, Fitzgerald K, Litchfield CD, Gillevet PM. 2003. A comparison ofDNA profiling techniques for monitoring nutrient impact on microbial com-munity composition during bioremediation of petroleum-contaminated soils.J Microbiol Meth 54:57–74.
Nauhaus K, Albrecht M, Elvert M, Boetius A, Widdel F. 2007. In vitro cellgrowth of marine archaeal-bacterial consortia during anaerobic oxidation ofmethane with sulfate. Environ Microbiol 9:187–196.
Orcutt B, Boetius A, Elvert M, Samarkin V, Joye SB. 2005. Molecular bio-geochemistry of sulfate reduction, methanogenesis and the anaerobic oxida-tion of methane at Gulf of Mexico cold seeps. Geochim Cosmochim Acta69:4267–4281.
Orphan VJ, Hinrichs KU, Ussler W, Paull CK, Taylor LT, Sylva SP, Hayes JM,Delong EF. 2001. Comparative analysis of methane-oxidizing archaea and
sulfate-reducing bacteria in anoxic marine sediments. Appl Environ Micro-biol 67:1922–1934.
Parameswaran P, Jalili R, Tao L, Shokralla S, Gharizadeh B, Ronaghi M, FireAZ. 2007. A pyrosequencing-tailored nucleotide barcode design unveils op-portunities for large-scale sample multiplexing. Nucl Acids Res 35:e130.
Parkes RJ, Webster G, Cragg BA, Weightman AJ, Newberry CJ, FerdelmanTG, Kallmeyer J, Jørgensen BB, Aiello IW, Fry JC. 2005. Deep sub-seafloor prokaryotes stimulated at interfaces over geological time. Nature436:390–394.
Pernthaler A, Dekas AE, Brown CT, Goffredi SK, Embaye T, Orphan VJ.2008. Diverse syntrophic partnerships from deep-sea methane vents revealedby direct cell capture and metagenomics. Proc Natl Acad Sci 105:7052–7057.
Reed A, Lutz R, Vetriani C. 2006. Vertical distribution and diversity of bacteriaand archaea in sulfide and methane-rich cold seep sediments located at thebase of the Florida Escarpment. Extremophiles 10:199–211.
Sekiguchi Y. 2006. Yet-to-be cultured microorganisms relevant to methane fer-mentation processes. Microbes Environ 21:1–15.
Smith SW, Overbeek R, Woese CR, Gilbert W, Gillevet PM. 1994. The GeneticData Environment (GDE): An expandable graphic interface for manipulatingmolecular information. CABIOS 10:671–675.
Sogin ML, Morrison HG, Huber JA, Welch DM, Huse SM, Neal PR, Arrieta JM,Herndl GJ. 2006. Microbial diversity in the deep sea and the underexplored“rare biosphere.” Proc Natl Acad Sci USA 103:12115–12120.
Taylor DL, Booth MG, McFarland JW, Herriott IC, Lennon NJ, NusbaumC, Marr TG. 2008. Increasing ecological inference from high throughputsequencing of fungi in the environment through a tagging approach. MolEcol Resour 8:742–752.
Valentine DL. 2002. Biogeochemistry and microbial ecology of methane oxida-tion in anoxic environments: A review. Antonie Van Leeuwenhoek Int J GenMolec Microbiol 81:271–282.
Valentine DL, Reeburgh WS. 2000. New perspectives on anaerobic methaneoxidation. Environ Microbiol 2:477–484.
Webster G, Parkes RJ, Fry JC, Weightman AJ. 2004. Widespread occurrenceof a novel division of bacteria identified by 16S rRNA gene sequences orig-inally found in deep marine sediments. Appl Environ Microbiol 70:5708–5713.
Whiticar MJ. 1999. Carbon and hydrogen isotope systematics of bacterial for-mation and oxidation of methane. Chem Geol 161:291–314.
Williams MM, Domingo JWS, Meckes MC, Kelty CA, Rochon HS. 2004.Phylogenetic diversity of drinking water bacteria in a distribution systemsimulator. J Appl Microbiol 96:954–964.
Dow
nloa
ded
by [
McG
ill U
nive
rsity
Lib
rary
] at
18:
37 2
0 A
pril
2013