Research Data Management: How will Northwestern address new sharing requirements?

BackgroundtoResearch
• ‘Higher’speedpassengertrains(upto110mph)arebeingincreasinglydiscussed
• Amtrak’sexperienceshowsthatthereisnotasafe(whenempty)freightcartruckforspeedsover70mph
• FRAisfundingresearchforfreightcartrucksthataredeemedsafeupto125mph
• SharmaandAssociates,Inc.awardedcontracttodesignanddevelopahigherspeedtruck,whichtheydid,andtheysubsequentlyhiredDavidBurnstojointlydevelopabusinesscaseforjustificationforfundingfurthertestinganddevelopment

IsthereaBusinessCaseforHigherSpeedFreight?
• Inthe1930stherewereveryprofitablemailandexpresstrainsthatwereoperatedatpassengertrainspeeds
• Thistrafficshiftedtoair,roadandintermodal• Todayrailroadintermodaloperatesatonly50to60%oftoday’spassengertrainspeeds
• Manyshippers,especiallyforlongerdistances,needfasterservicessotheymakeuseofteamdriventrucksandevenair
• Onlyalimitedvolumeoffreightcanjustifytheextracostofhigherspeeddelivery,oninventorycostalone

U.S.RailandTrucktonsbylengthofhaul
Source: 2007 Commodity Flow Survey
In terms of tons volume is small

RailandTruckTonMiles
0
100
200
300
400
500
600
Lessthan50miles
50- 99miles 100- 249miles
250- 499miles
500- 749miles
750- 999miles
1,000- 1,499miles
1,500- 2,000miles
Morethan2,000miles
Tonmiles-billions
Rail
Truck
~$28billion/yr
2007 Commodity Flow SurveyAbove 1,500 miles rail is only 27% and above 2,000 miles 15%
A large percentage of shippers are prepared to pay 2 to 3 times rail for the better service and the speed of trucks

ExampleofComparativeSpeeds
0 10 20 30 40 50 60 70 80 90 100
BNSFExpedited
BNSFPremium
BNSFTOFC
PassengerSchedule
Truck1driver
Truck2drivers
ComparisonofDoortoDoorTransitTimesLAtoCHI(hrs)
OriginDrayage
Wait
Load
Transit
EndDrayage
COFC Seattle-Chicago on Union Pacific 50% slower than Amtrak
Why is TOFC so much slower than Amtrak?

HowFastisTrucking
Typical COFC average speed (30 mph)
This is where is the potential $$$ are

LongDistancesSpeedComparison
0
20
40
60
80
100
120
140
250 500 750 1000 1250 1500 1750 2000 2250 2500 2750 3000 3250
Tran
sitHou
rs
Miles
35
50
75
100
125
1driver
2drivers
AverageSpeedor no.Drivers
To compete with team driven truck average speed needs to be at least 50 mph
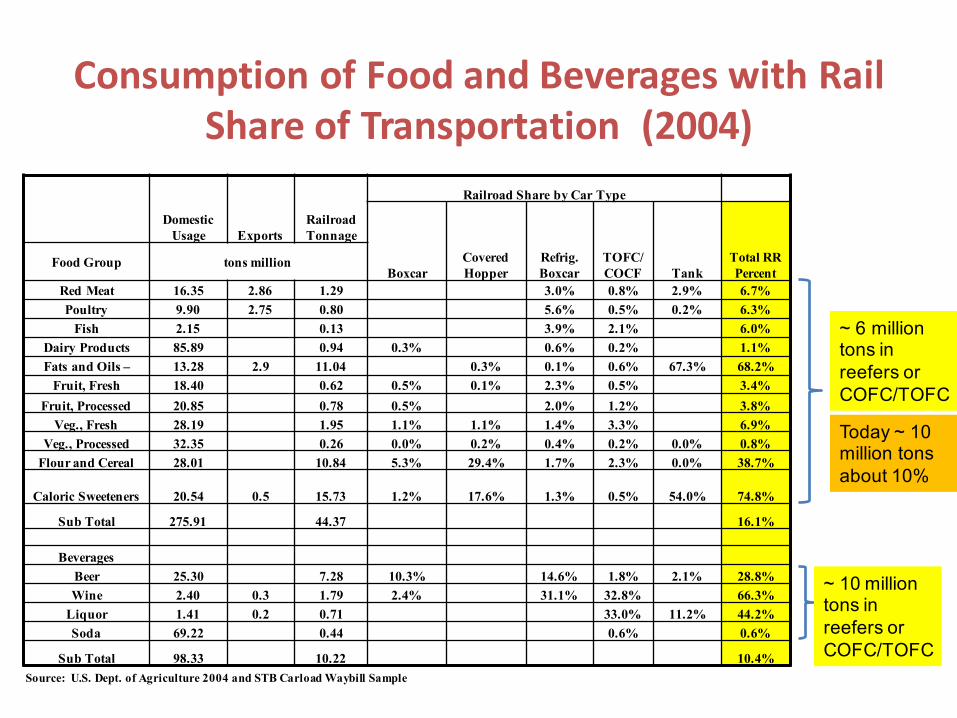
ConsumptionofFoodandBeverageswithRailShareofTransportation(2004)
DomesticUsage Exports
RailroadTonnage
Railroad Share by Car Type
BoxcarCoveredHopper
Refrig. Boxcar
TOFC/ COCF Tank
Total RR Percent
Food Group tons million
Red Meat 16.35 2.86 1.29 3.0% 0.8% 2.9% 6.7%Poultry 9.90 2.75 0.80 5.6% 0.5% 0.2% 6.3%
Fish 2.15 0.13 3.9% 2.1% 6.0%Dairy Products 85.89 0.94 0.3% 0.6% 0.2% 1.1%Fats and Oils – 13.28 2.9 11.04 0.3% 0.1% 0.6% 67.3% 68.2%
Fruit, Fresh 18.40 0.62 0.5% 0.1% 2.3% 0.5% 3.4%Fruit, Processed 20.85 0.78 0.5% 2.0% 1.2% 3.8%
Veg., Fresh 28.19 1.95 1.1% 1.1% 1.4% 3.3% 6.9%Veg., Processed 32.35 0.26 0.0% 0.2% 0.4% 0.2% 0.0% 0.8%
Flour and Cereal 28.01 10.84 5.3% 29.4% 1.7% 2.3% 0.0% 38.7%
Caloric Sweeteners 20.54 0.5 15.73 1.2% 17.6% 1.3% 0.5% 54.0% 74.8%
Sub Total 275.91 44.37 16.1%
BeveragesBeer 25.30 7.28 10.3% 14.6% 1.8% 2.1% 28.8%Wine 2.40 0.3 1.79 2.4% 31.1% 32.8% 66.3%
Liquor 1.41 0.2 0.71 33.0% 11.2% 44.2%Soda 69.22 0.44 0.6% 0.6%
Sub Total 98.33 10.22 10.4%Source: U.S. Dept. of Agriculture 2004 and STB Carload Waybill Sample
~ 6 million tons in reefers or COFC/TOFC
~ 10 million tons in reefers or COFC/TOFC
Today ~ 10 million tons about 10%

ColdChainisaNecessity!
Common NameStorage Temp. F
Relative Humidity %
Highest Freezing Temp. F
Ethylene production
Ethylene sensitivity
Approx. storage-life
Apple-not chill sensitive 30-32 90-95 29.3 VH H 3-6 monthsApple-chill sensitive 40 90-95 29.3 VH H 1-2 monthsApricot 31-32 90-95 30 M M 1-3 weeksArugula 32 95-100 VL H 7-10 daysAsparagus 36 95-100 31 VL M 2-3 weeksAvocado-Fuerte, Hass 37-45 85-90 29.1 H H 2-3 weeksAvocado-Fuchs, Pollard 55 85-90 30.4 H H 2 weeksAvocado-Lula, Booth 40 90-95 30.4 H H 4-8 weeks
~ 200 separate categories
Mix and match produce is a necessity

EstimateofAnnualTonnageofFruitsandVegetablesConsumedbyLocation
PercentOriginating Annual
TonnageDestination Locations Population West & SW Florida
Northeast 23.0 5,092,706 552,161Midwest 17.5 3,874,885 420,123Southeast 21.4 4,738,431
Total Daily 'Truck' loads ConsumedNortheast 728 79Midwest 554 60Southeast 677
Produce Cost per lbMarket price
per tonOrange Juice $3 (4 lb – half gal.) $1,500Strawberries $2.50 $5,000
Processed Lettuce $4.00 $8,000Herbs and Raspberries $15.00 $30,000
Avocados $3.30 $6,600Potatoes $0.80 $1,600
Note: FOB prices are approximately 30% of retail prices.
TypicalNewYorkPrices
Some produce can pay for high transport costs
Basically 3 major corridors

HowcanRailwayCompetewithTeamDrivenTrucks?
Rail Current times hrs PassengerTrain ~ 54 mph
Priority Freight Train ~ 59 mph
Single Driver
TeamDriversLow High Average
Field to packing shed 0.5 3 1.5 1.5 1.5 1.5 1.5
Packing Shed 3 2160 8 4 4 4 4
Transport to Consd. Facility 1 36 8 8 4
Consolidation Facility 5 36 24 12 5
Rail or Road Transit 100 124 112 60 55 129 69
Rail Transload Facility 5 36 24 12 5
Transit to Distribution Center 0.25 48 8 8 8
Wholesale Distribution Center 4 24 8 8 4 4
Total Hours (after packing shed) 115.25 304 184 108 81 134.5 78.5
Total Days (after packing shed) 4.8 12.7 7.7 4.5 3.4 5.6 3.3
Comparison of field-to-distribution center for shipping from California to Northeast by rail and road

RevenueperFreightCarBasedonCostofTrucking
Averageshelflife
% by weight
Truck charge $
Handling discount
Truck loads/car
Rev./ 55 car train
Category 1 (Berries, lettuce, etc) 8days 15% 10000 20% 2.5 165000
Category 2 (Leaf veg, oranges, etc) 14days 45% 7500 20% 3.5 519750
Category 3 (Root veg., apples, etc) 28days 40% 6000 20% 4.0 422400
Potential avg. revenue per Car $ 20130
Revenue per 55 car train $ $1,107,150
Cars per trainTruck loads per train
Potential additional $ Potential Rev./Train
Category 1 (Berries, package lettuce) 8.25 20.6 0
Category 2 (Leaf veg, oranges, etc) 24.75 86.6 1500 129938
Category 3 (Root veg., apples, etc) 22 88.0 1000 88000
Additional Revenue/55 car train $ $217,938
Value of additional freshness

RailPotentialRevenuefromProduce~$330/trainmile
Total Daily 'Truck' loads Consumed/day
From West and SW
From Florida
Average CarLoads/day
Rev/Car Annual Rev.
Northeast 728 79 205 20000 $1,435,000,000Midwest 554 60 156 14000 $764,000,000Southeast 677 0 191 14000 $934,000,000
$3,133,000,000
Average CarLoads/day
Ave. Valuetime savings
Annual $for Shelf Life
Northeast205 4000 $287,000,000
Midwest156 2600 $142,000,000
Southeast191 2600 $174,000,000
$602,000,000
Freshness Value
Could be added to annual revenue
If backhaul is empty revenue ~$280/train mile
Originating from W and SW only considered
Probably not sufficient for dedicated train

ProduceSummary• Railtransittimemustcompetewithteamdriventrucks• Operatingassecondsectiontopassengertrainminimizes
trainpathinterference• Mustbeabletoconsolidateandmixproduce• Higherspeedfreighttakesadvantageofcompetitivespeed
andcarweightcapacity• 300+%increaseinfreightcarutilization• Onlyabout10%ofproducecurrentlyshippedbyrail• Annualrevenuepotentialcouldbeashighas$3.7billion

01,0002,0003,0004,0005,0006,0007,000
Lessthan50miles
50- 99miles
100-249miles
250-499miles
500-749miles
750-999miles
1,000-1,499miles
1,500-2,000miles
Morethan2,000miles
Tons(thous) Ton-miles (mil) Avgmiles
02000400060008000
1000012000140001600018000
TonsperDayNextday
TonsperDayDeferred
TonsperDayGround
Service TypePackages('000) %
Next Day Air 1205 9%
Deferred 941 7%
Ground 11140 84%
Total daily volume 13286
PackageandCourierService
Source: Commodity Flow Index
34 million tons per year but there are problems
Source: UPS

Tons per DayNext day Deferred Ground
Less than 50 miles 1366 1062 1274650 - 99 miles 719 559 6712100 - 249 miles 1551 1206 14473250 - 499 miles 1712 1331 15974500 - 749 miles 1322 1028 12340750 - 999 miles 971 755 90581,000 - 1,499 miles 1082 842 101021,500 - 2,000 miles 723 562 6745More than 2,000 miles
725 564 67706535 5082 60990
Corridors% Population On Corridor
Traffic Percentage
Distance miles
National Tons/day
Trucks/ Day UPS only Comments
NE-SE 44.4 23% 750 to 999 764 55Tunnels will restrict to single stack and will not go through Atlanta
MW-SE 38.9 20% 1000 -1499 852 61SW-SE 34.8 18% 1500-2000 569 41 Will not go through DallasSW-MW-NE 53.9 27% <2000 571 41 Must go through ChicagoOther 24.7 13% Probably does not warrant train.
PackageandCourierService
Team driven truck tonnage is small in weight but larger in volume
Source: UPS

Low Average High
PassengerTrain
Priority Train 65 mph
Single Driver
TeamDrivers
Drayage 0.25 0.5 2.5 0.5 0.25Wait 0.1 0.5 3 0.5 0.1Load 0.1 0.25 0.5 0.25 0.1Transit 60 55 129 61Unload Average 0.1 0.5 0.5 0.5 0.1Drayage 0.25 0.5 2.5 0.5 0.25Total Time hrs 62.25 55.8 129 61
Train Distance miles 3250Revenue/Container
Deferred $ 9000Ground $ 6000
Train Length (cars) 25 50 75Total Containers 50 100 150
Deferred 20 20 20Ground 30 80 130
Deferred Revenue 180000 180000 180000Ground Revenue 180000 480000 780000Train Revenue 360000 660000 960000$ per train mile 110.77 203.08 295.38
For package and courier service there appear to be four major long distance traffic lanes:
• Los Angeles to New York via Chicago• New York to Florida, via Atlanta (Based on passenger train routes this currently is not yet available by rail)• Los Angeles to Dallas (There is currently no direct passenger train route)• Atlanta to Dallas (Currently not a passenger train route).
COFC /TOFC speed based on single driver
PackageandCourierService
Would probably require minimum 50 car trains

PackageandCourierService-Summary
• ‘Ground’servicebusinessrequiredtofillthetrain
• Whatwouldbethevalueoffaster‘ground’service?
• Servicedemandvariesbydayofweek
• Lendsitselftodoublestack• Hubandspokecouldbeaproblem• Identifiedannualrevenue~$54million Interested in
rail but how?

OpportunityandProblemsofShortDistances
TotalTimeatVariousAverageSpeedsandDistances
0
5
10
15
20
25
30
35
40
45
0 200 400 600 800 1000Distance(Miles)
TotalTim
e(Hou
rs)
35MPH
50MPH
75MPH
100MPH
125MPH
1Driver
2Drivers
Up to 500 miles trucks are faster even for rail at 100 mph
Under 500 miles rail must be integral part of logistics chain, such as overnight and higher speeds makes additional city pairs possible
Extend the Canadian Pacific Expressway approach

ShortDistanceSummary• 6pairsofU.S.citieshaveapotential• SanFrancisco- LosAngeles• Atlanta– CentralFlorida• Atlanta– Richmond/Washington• Chicago– Minneapolis• Chicago– KansasCity• Chicago– Pittsburgh• Washington– Boston(likelynotfeasiblebecauseofthelimitationsofthe
NorthandEastRiverTunnelsatPenn.StationNewYork).
• Potentialannualrevenue$150to$250million

HigherSpeedIntermodal• Intermodaltrainstodayoperateatsingledriverspeedsorslower• Manifestfreightgenerallycannotjustifyhighertrainspeeds• LessTruckLoad(LTL)rangefrom150lbsto5tons,average1200
lbs,about250milliontons/year• About15%demandforpremiumservice,with20%higherprice• Majoritywillbecontainerized• SW– NWLTLdemandisfor2.5trains/day• Asingletrainadaywitha40%premium,fillingrestwith
economy,6trainsperweekeachwayismaybefinanciallyviable• Annualrevenueonhigherspeedtrains$318million,ofwhichat
least$140millionwillbeadditionalrevenue• Mayrequiredoublestacks,higherspeedmaybedifficult

CostofGoingFaster(Averageof60mphcomparedto30mph)
Source: average cost percentage AAR and University of Illinois
0
2
4
6
8
10
12
14
0 20 40 60 80 100
ToralTrainResitance
TrainSpeedmph
Cars
COFC
At higher speeds cars are more cost effective per ton of capacity than containers
Source: University of IllinoisClass1 IncreaseinCost HigherSpeedCost
CatigoriesofExpense Average Cars COFC Cars COFCTransportation w/o fuel 25% 0% 0% 25 25Fuel 20% 90% 118% 38 43.6Equipment 25% 49% 98% 37.3 49.4Track 18% 20% 25% 21.6 22.5GeneralandAdmin 12% 0% 0% 12 12
100% 133.9 152.5
Estimate%increaseincost 33.9 52.5
Higher speed trains can be 34% more expensive

LineCapacityConsiderations
• Fastertrainshaulhigher-ratedfreightandaremoreprofitable,allowingthesacrificeofsomeslow-freightcapacitywithoutfinancialpenalty
• 70mphpassengertrainrequires~three(3)50mphtrainpaths
• Secondsectiontopassengertrainonlyrequires0.5to1additionaltrainpaths
• Computerizeddispatchingwillreducecapacityproblemandincreaseoverallspeed
• Lappedsidingswouldbeanadvantage

LineCapacityCosts
"Average"freightsdisplaced
HigherSpeedFreightCostDifferential
0% 20% 40% 60% 80% 100%
0.5 $104 $122 $140 $157 $175 $193
1 $118 $136 $154 $172 $190 $208
2 $147 $165 $183 $201 $219 $237
3 $176 $194 $212 $230 $248 $266
4 $205 $223 $241 $259 $277 $295
5 $234 $252 $270 $288 $306 $323
6 $263 $281 $299 $317 $335 $352
7 $292 $310 $328 $346 $364 $381
Revenuepertrainmiletooffsetlosttrainpaths
FreightRevenue/Freight-train-mile: $118.32
FreightServiceExpense/Freight-train-mile: $89.37
FreightOperatingIncome/Freight-train-mile: $28.95
FreightServiceExpense/FreightRevenueRatio: 75.5%
Revenueandexpenseper‘Average’trainmile
Source : AAR
Produce train revenue $280 to $330/ train mile
Courier and Package revenue ~$200+/train mile
LTL Intermodal revenue ~ $165/ mile
If only one average freight displaced, operating income could be ~ $200/train-mile

TheFreightCarTruckQuestion• Railroadsdonotofferfreightserviceatpassengertrainspeeds
orhigherbecausethereisnoproven,safeandlowmaintenancefreighttruckthatcanbeoperatedabove70mphand100+tons
• Forpriorityfreightmaximumspeedsof90or100mphareneeded
• Heavieraxleloadsandhigherspeedsdictateatrackfriendlytruckthatwillprobablyrequireaprimarysuspension
• Higherspeedfreightcarutilizationwillbe5to10timesaconventionalfrightcar,socapitalcostnotsignificant
• NorthAmericanfreightcartrucksuppliershavelimitedinterestindevelopingahigherspeed,heavyaxleloadtruckbecausetherailroadsarecurrentlyshowinglittle,ifany,interest

PotentialoftheHigherSpeedFreightCar
• Couldincreaserailrevenuebyatleast$4.5billion/year– Produce$3.1to$3.7billion– PackageandCourieratleast$54million– HigherSpeedIntermodal~$318million– ShortDistanceintermodal$150to$250million– Longdistancetrucking,unidentifiedadditionalrevenue,maybe$5to
$10billionayear
• Couldincreaseannualoperatingincomebyabout$2billion• Improvementsinconventionalfreightcartrucks• Freightrailroadscouldbenefitfrominfrastructurerequired
for‘higher’speedpassengertrain• Willresultinsignificantreductionoflongdistancetrucktraffic


![TRANSPORTATION RESEARCH BOARD [ TRB ] ANNUAL … · Destination Choice Ying Chen, Northwestern University Hani Mahmassani, Northwestern University ... James Hicks, WSP|Parsons Brinckerhoff](https://static.fdocuments.us/doc/165x107/5f2326922d6ba04c4236f8b4/transportation-research-board-trb-annual-destination-choice-ying-chen-northwestern.jpg)