BACKGROUND INFORMATION ON COMMUNITY … INFORMATION ON COMMUNITY COLLEGES " May"2013" " "" 2"...
32
C Copyright © 2013 National Center on Education and the Economy Two and a half years ago, the National Center on Education and the Economy (NCEE) began a project to determine, empirically, what it takes to succeed in initial credit bearing courses in our nation’s two and fouryear open admissions colleges. As part of that project, Betsy Brown Ruzzi, Vice President and Emily Wicken, Research Analyst, assembled the most current information available on the state of community colleges in the United States. THE CHANGING NATURE OF THE U.S. ECONOMY AND WHAT WE ARE DOING ABOUT IT As our economy continues to shift from a goodsbased to a knowledgebased economy, a greater proportion of the workforce will need some form of college degree or certification in order to succeed. Of the 20 fastestgrowing professions, 12 require an associate’s degree or higher, and of the 71 jobs projected to grow by 20 percent or more in the coming years, all of them will require some college. 1 Opportunities for workers who have no postsecondary education will only diminish. By 2018, workers without postsecondary education will be competing for just 38 percent of all jobs, as compared to 72 percent of all jobs 40 years ago. 2 Despite the shifting nature of the US economy, the American education system has not been keeping up with the demand for a more highly educated workforce. The United States is being surpassed by other countries, notably countries like Canada, South Korea and Japan, in terms of the proportion of the workforce with a college degree. 3 The United States currently ranks fourth in the proportion of workforceage (2564) adults with a postsecondary degree (surpassed by Canada, Israel and Japan), but among the population between the ages of 2534, it has just the ninthhighest proportion of people with a tertiary degree. 4 The countries that are already ahead of the US in this second measure have been increasing their proportion of the workforce with a tertiary degree more rapidly than has the US. 5 In Canada, the number climbed from 37 * percent to 51 percent between 1997 and 2010, in South Korea, from 20 percent to 40 percent, and in Japan from 31 to 45 percent. 6 Across the OECD, the number has increased from 21 percent to 30 percent between 1997 and 2009, 7 but the US has not kept pace, with gains of only 8 percent between 1997 and 2010, from 34 percent to 42 percent. 8 The United States also lags behind the OECD average in terms of high school and postsecondary graduation rates. 9 Between 1995 and 2009, the graduation rate for bachelor’s degree programs in the United States saw a slight increase from 33 percent to 38 percent, and graduation * Percentages throughout the document are rounded. This may occasionally result in totals being slightly greater than 100 percent. NATIONAL CENTER ON EDUCATION AND THE ECONOMY BACKGROUND INFORMATION ON COMMUNITY COLLEGES May 2013
Transcript of BACKGROUND INFORMATION ON COMMUNITY … INFORMATION ON COMMUNITY COLLEGES " May"2013" " "" 2"...

C
Copyright © 2013 National Center on Education and the Economy
Two and a half years ago, the National Center on Education and the Economy (NCEE) began a project to determine, empirically, what it takes to succeed in initial credit bearing courses in our nation’s two-‐ and four-‐year open admissions colleges. As part of that project, Betsy Brown Ruzzi, Vice President and Emily Wicken, Research Analyst, assembled the most current information available on the state of community colleges in the United States.
THE CHANGING NATURE OF THE U.S. ECONOMY AND WHAT WE ARE DOING ABOUT IT
As our economy continues to shift from a goods-‐based to a knowledge-‐based economy, a greater proportion of the workforce will need some form of college degree or certification in order to succeed. Of the 20 fastest-‐growing professions, 12 require an associate’s degree or higher, and of the 71 jobs projected to grow by 20 percent or more in the coming years, all of them will require some college.1 Opportunities for workers who have no postsecondary education will only diminish. By 2018, workers without postsecondary education will be competing for just 38 percent of all jobs, as compared to 72 percent of all jobs 40 years ago.2
Despite the shifting nature of the US economy, the American education system has not been keeping up with the demand for a more highly educated workforce.
The United States is being surpassed by other countries, notably countries like Canada, South Korea and Japan, in terms of the proportion of the workforce with a college degree.3 The United States currently ranks fourth in the proportion of workforce-‐age (25-‐64) adults with a postsecondary degree (surpassed by Canada, Israel and Japan), but among the population between the ages of 25-‐34, it has just the ninth-‐highest proportion of people with a tertiary degree.4 The countries that are already ahead of the US in this second measure have been increasing their proportion of the workforce with a tertiary degree more rapidly than has the US.5 In Canada, the number climbed from 37* percent to 51 percent between 1997 and 2010, in South Korea, from 20 percent to 40 percent, and in Japan from 31 to 45 percent.6 Across the OECD, the number has increased from 21 percent to 30 percent between 1997 and 2009,7 but the US has not kept pace, with gains of only 8 percent between 1997 and 2010, from 34 percent to 42 percent.8
The United States also lags behind the OECD average in terms of high school and postsecondary graduation rates.9 Between 1995 and 2009, the graduation rate for bachelor’s degree programs in the United States saw a slight increase from 33 percent to 38 percent, and graduation * Percentages throughout the document are rounded. This may occasionally result in totals being slightly greater than 100 percent.
NATIONAL CENTER ON EDUCATION AND THE ECONOMY
BACKGROUND INFORMATION ON COMMUNITY COLLEGES May 2013
2
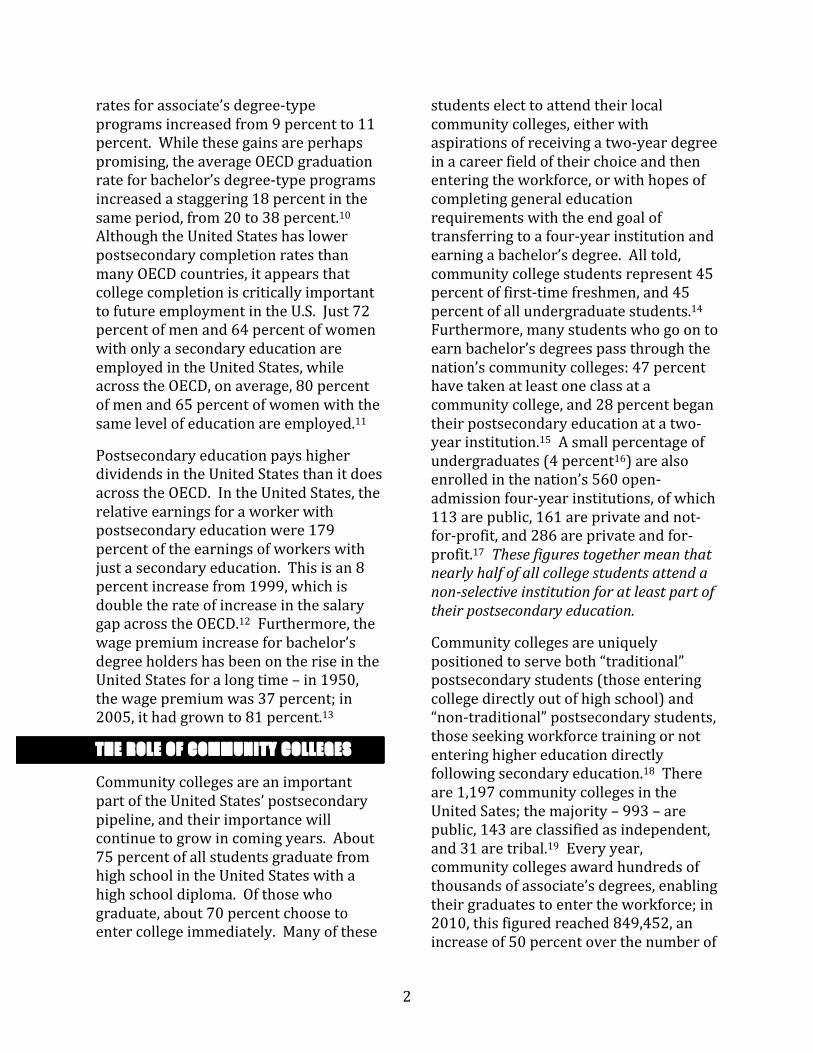
rates for associate’s degree-‐type programs increased from 9 percent to 11 percent. While these gains are perhaps promising, the average OECD graduation rate for bachelor’s degree-‐type programs increased a staggering 18 percent in the same period, from 20 to 38 percent.10 Although the United States has lower postsecondary completion rates than many OECD countries, it appears that college completion is critically important to future employment in the U.S. Just 72 percent of men and 64 percent of women with only a secondary education are employed in the United States, while across the OECD, on average, 80 percent of men and 65 percent of women with the same level of education are employed.11
Postsecondary education pays higher dividends in the United States than it does across the OECD. In the United States, the relative earnings for a worker with postsecondary education were 179 percent of the earnings of workers with just a secondary education. This is an 8 percent increase from 1999, which is double the rate of increase in the salary gap across the OECD.12 Furthermore, the wage premium increase for bachelor’s degree holders has been on the rise in the United States for a long time – in 1950, the wage premium was 37 percent; in 2005, it had grown to 81 percent.13
THE ROLE OF COMMUNITY COLLEGES
Community colleges are an important part of the United States’ postsecondary pipeline, and their importance will continue to grow in coming years. About 75 percent of all students graduate from high school in the United States with a high school diploma. Of those who graduate, about 70 percent choose to enter college immediately. Many of these
students elect to attend their local community colleges, either with aspirations of receiving a two-‐year degree in a career field of their choice and then entering the workforce, or with hopes of completing general education requirements with the end goal of transferring to a four-‐year institution and earning a bachelor’s degree. All told, community college students represent 45 percent of first-‐time freshmen, and 45 percent of all undergraduate students.14 Furthermore, many students who go on to earn bachelor’s degrees pass through the nation’s community colleges: 47 percent have taken at least one class at a community college, and 28 percent began their postsecondary education at a two-‐year institution.15 A small percentage of undergraduates (4 percent16) are also enrolled in the nation’s 560 open-‐admission four-‐year institutions, of which 113 are public, 161 are private and not-‐for-‐profit, and 286 are private and for-‐profit.17 These figures together mean that nearly half of all college students attend a non-‐selective institution for at least part of their postsecondary education.
Community colleges are uniquely positioned to serve both “traditional” postsecondary students (those entering college directly out of high school) and “non-‐traditional” postsecondary students, those seeking workforce training or not entering higher education directly following secondary education.18 There are 1,197 community colleges in the United Sates; the majority – 993 – are public, 143 are classified as independent, and 31 are tribal.19 Every year, community colleges award hundreds of thousands of associate’s degrees, enabling their graduates to enter the workforce; in 2010, this figured reached 849,452, an increase of 50 percent over the number of

3
associate’s degrees awarded a decade earlier. By contrast, the number of bachelor’s degrees increased just 33.3 percent between 2000 and 2010.20 Overall enrollment in community colleges has increased 26 percent over the last decade, which represents an increase of about two million students.21 President Obama has called for an additional five million community college graduates to enter the American workforce by 2020 in order to meet growing labor needs.22
Many of America’s high school students and high school graduates hope to obtain a postsecondary qualification, and enrollment in undergraduate institutions has more than doubled between 1970, when 7,369,000 students were enrolled in a college or university, and 2012, when a projected 18,528,000 students enrolled.23 Although the majority of undergraduates choose to attend four-‐year colleges, the percent that picks community colleges is on the rise. In 1970, less than a third (31 percent) of
undergraduates attended a two-‐year college, but in 2010, 42 percent were enrolled in community colleges.24
WHO ARE COMMUNITY COLLEGE STUDENTS?
Students attending community colleges tend to represent a slightly different demographic than students at four-‐year colleges and universities, and have somewhat different patterns of attendance: they skew older, are more likely to attend school part-‐time, are more likely to work while in school, and are more likely to be the first in their families to attend college. The average age of a community college student is 28, while the median age is 23.25 Fifty-‐two percent are recent high school graduates.26 The age of students pursuing bachelor’s degrees is slightly younger, with 67 percent of bachelor’s degrees awarded to students under the age of 23, and just 13 percent awarded to students older than 30.27 Less than half (44 percent) of
35
147
39
0.2
3 2
Less-‐Than-‐Two-‐Year
Two-‐Year Private For-‐Profit
Two-‐Year Private Not-‐for-‐Profit
Two-‐Year Public
Four-‐Year Private For-‐Profit
Four-‐Year Private Not-‐for-‐Profit
Four-‐Year Public
Chart 1: Postsecondary Undergraduate Enrollment by Control of Institution, Fall 2010
(Source: NCES. (2012). Enrollment in Postsecondary Institutions, Fall 2010; Financial Statistics, Fiscal Year 2010; and Graduation Rates, Selected Cohorts 2002-‐07: First Look, Table 2.)

4
community college students devote themselves to their studies full time, as opposed to the overwhelming majority (78 percent) of students at four-‐year institutions who pursue full-‐time course loads. 28 Just 20 percent of students who receive bachelor’s degrees29 are the first in their families to attend college, as compared to 42 percent of community college students.30 Among full-‐time community college students, 40 percent are employed; this number rises to 75 percent among part-‐time students. Similarly, 40 percent of full-‐time students at four-‐year colleges are employed, while 72 percent of part-‐time four-‐year students are employed. Seven percent of full-‐time community college students work 35 or more hours a week on top of their studies.31
Students in community college come from all socioeconomic levels; however, 41 percent of all students enrolled in higher education and living in poverty go to our community colleges, which is roughly proportionate to the percentage of all students who choose community colleges
over four-‐year institutions.32 Although a large number of disadvantaged students attend community colleges, the students’ socioeconomic backgrounds at these schools are fairly evenly divided across the range of income classifications.
Among 2003-‐04 beginning postsecondary students who chose community colleges, about a quarter (24 percent) of students come from the lowest income level, 29 percent from low-‐middle income families, 29 percent from high-‐middle income families, and 18 percent from high-‐income families. At public four-‐year institutions, the demographics look similar, but are slightly skewed toward the higher end of the income spectrum. Just 17 percent of students at those institutions come from the lowest income level, 23 percent from low-‐middle income families, about 29 percent from the high-‐middle income range, and about 30 percent from the high-‐income range. At private four-‐year colleges, a full 35 percent of students come from the highest income range.33
Two-‐Year Institutions
Four-‐Year Institutions
0
10
20
30
40
50
60
70
80
First in Familyto Attend College
AttendFull-‐Time
Work WhileAttending School
Chart 2: Selected Characteristics of College Students, Two-‐ and Four-‐Year Institutions
(Sources: NCES. (2012). Enrollment in Postsecondary Institutions, Fall 2010; Financial Statistics, Fiscal Year 2010; and Graduation Rates, Selected Cohorts 2002-‐07: First Look,7; American Association of Community Colleges. (2012). 2012 Community College Fast Facts, 1; NCES. (2011). The Condition of Education: 2011, 290-‐91.)

5
Women dominate the community college landscape; the student body is 57 percent female and 43 percent male. African American students make up 15 percent of the student body; Hispanic students 18 percent; Asian/Pacific Islander 6 percent, and Native Americans 1 percent.34 These demographics differ somewhat from the demographics of students enrolled in bachelor’s degree programs; fewer minorities attend four-‐year institutions, and white students comprise 59 percent of the student body. African American, Hispanic and Asian/Pacific Islander students make up 13, 10 and 6 percent of the undergraduate student body at four-‐year institutions.35 However, the gender divide is the about same as it is in community colleges – 56 percent female and 44 percent male.36
The percent of minorities attending community colleges has remained fairly stable over the last 30 years,37 but there have been some demographic changes among the community college student body. In particular, community college students are trending younger, particularly in the past decade. In 2001, 42 percent of students enrolled in all two-‐year institutions were under the age of 21.38 This number has steadily climbed since then to 45 percent.39 This is likely due to the fact that high school students are now more likely immediately to enter college than they were in the past, and are more likely to choose a community college. In 1975, just 51 percent of high school graduates went on to college immediately (with 18 percent choosing community colleges) whereas in 2010,
0
5
10
15
20
25
30
35
40
Lowest Lowest LowestLowMiddle
LowMiddle
LowMiddle
HighMiddle
HighMiddle
HighMiddle
Highest Highest Highest
Public Two-‐YearInstitutions
Public Four-‐YearInstitutions
Private Not-‐for-‐ProfitFour-‐Year Institutions
Chart 3: Percent Distribution of 2003-‐2004 Beginning Postsecondary Students by Income Level
(Source: NCES. (2009). Issue Tables: Choosing a Postsecondary Institution: Considerations Reported by Students, Table 2.)

6
68.1 percent chose immediate enrollment in postsecondary education, and 27 percent opted for community colleges. 40
ASPIRATIONS OF STUDENTS ENTERING COMMUNITY COLLEGES
Community college students are often assumed to be “nontraditional” undergraduates – older than students at four-‐year colleges and from minority groups. While the statistics bear this out to some degree, the demographics show that community college enrollment is shifting and that community colleges are becoming a more attractive option for all types of undergraduate students.
ATTAINMENT GOALS
The educational goals of the typical community college student reflect this – they suggest that community colleges are no longer seen as places just to receive vocational training, but instead are seen as a stepping-‐stone to further educational pursuits. Most students – just over 80 percent – entering community college report that they hope to earn at least a bachelor’s degree before they hang up their cap and gown. A full 44 percent hope to earn a degree beyond a bachelor’s, and just 19 percent of community college students report that they intend to end their education with either an associate’s degree or a certificate.41 Although the majority of students who begin postsecondary education in community colleges know that they will have to transfer schools in order to reach their degree goals, they choose to attend community colleges for part of their degrees because these colleges are affordable and often close to home. When
questioned about why they chose a particular college (for this survey, students were given the opportunity to select more than one reason), 73 percent of community college students cited cost, and 83 percent cited location. Other reasons students gave for choosing their colleges included personal and family reasons (40 percent), the programs and courses offered (38 percent) and the reputation of the school (34 percent).42
AREAS OF STUDY
The chosen majors of community college students reflect the desire of many of them to transfer to a four-‐year program. About one-‐third of community college students choose to major in the liberal arts and sciences, general studies or humanities, a figure that has remained steady over the last decade.43 This suggests that many students turn to community college to inexpensively and conveniently fulfill general education requirements before moving on to subject-‐area specialization at a four-‐year school. Other popular majors include the health professions (21 percent) and business (16 percent). Another 7 percent of students choose to major in engineering. Security/protective services and computer/information services round out the most popular majors, both with about 4 percent of students choosing these fields. While health-‐related majors have experienced an increase in graduates between the 1999-‐2000 and 2009-‐2010 school years (from 15 percent to 21 percent), engineering has dropped from about 11 percent of graduates to just about 7 percent over the same period. Most other fields have remained fairly stable.44

7
33.5
1.2
20.9
15.7
6.5
4.4
3.8
2.3
2.12 1.3
1.10.90.80.70.50.5
0.30.2
Parks, Recreation, Leisure and Fitness Studies
Biological and biomedical sciences
Physical sciences and science technologies
Public administration and social service professions
Agriculture and natural resources
Psychology
Communications and communications technologies
Family and consumer sciences
Legal professions and studies
Social sciences and history
Education
Multi/interdisciplinary studies
Visual and performing arts
Computer and information services
Homeland security, law enforcement, fire-‐fighting and related
Engineering and engineering technologies
Business, management, marketing
Health professions and related clinical sciences
Liberal arts and sciences, general studies and humanities
Chart 4: Percent of Associate’s Degrees Awarded by Major, 2010
(Source: NCES. (2012). The Condition of Education: 2012.)

8
THE PATH TO CREDIT BEARING COURSES
Although the vast majority of community college students hope to earn a four-‐year degree, many of them are prevented, at least initially, from taking credit-‐bearing courses. The majority of community colleges assess all students upon entry for “college readiness,” and if a student proves to be lacking in skills determined to be necessary for success in college courses, he or she is placed into remedial or “developmental” classes. Not every state requires students to enroll in developmental courses; in some states it is a recommendation. In most cases, students who take developmental classes pay for them as they would a credit-‐bearing class, but get no credit toward a certificate or degree (or toward transfer), and cannot move on to a credit-‐bearing course until they have completed the developmental sequence. This understandably affects students’ chances at college completion as developmental courses eat into financial aid packages and can serve to discourage students from pursuing what they perceive as more difficult college-‐level courses – or bar entry to them altogether. Some states and community college systems are now taking a hard look at the role of remedial courses in community college completion and are debating whether or not to limit or remove remedial courses altogether45 or allow students to take both remedial courses and credit bearing courses at the same time.46
PLACEMENT TESTS
Placement tests are widely used among postsecondary institutions to determine whether or not a student will be referred to developmental or remedial classes. A
2012 report from the National Assessment Governing Board, using data from the 2011 Fall semester, found that 71 percent of colleges and universities used some type of mathematics test, and 53 percent used some type of reading test to place students into developmental education.47 Among community colleges, however, the figure is even higher: 100 percent of public two-‐year institutions use some type of math test to evaluate students (either the ACT, the SAT, The College Board’s ACCUPLACER, ACT’s COMPASS, or another test), while 94 percent also used a reading test from one of the above providers.48
Among those exams, the ACCUPLACER (administered by the College Board) and COMPASS (administered by ACT) tests are used the most often at community colleges. Thirty-‐two percent of community colleges use the ACCUPLACER Elementary Algebra test, and 49 percent use the COMPASS Algebra test (smaller proportions, 10 percent and 11 percent, respectively, use those companies’ College-‐Level Mathematics and College Algebra exams). In reading, 39 percent of community colleges use the ACCUPLACER Reading Comprehension test, while 61 percent use the COMPASS reading test.49 Community colleges also use SAT or ACT scores to determine course placement, although many community college students either do not report their SAT or ACT scores or have not taken one of these college entrance tests.
CUT SCORES
While almost all community colleges use some type of test to determine student placement in remedial education, there is broad variation in the cut scores employed across institutions, meaning

9
that very different levels of student performance are considered “college ready,” across two-‐year public institutions and often between programs within a community college. According to a 2011 survey done by Wested for the National Assessment Governing Board, the cut scores students are required to meet or exceed to be placed into credit-‐bearing courses using the mathematics section of the ACT test can range from a score of 10 to a score of 25 on a 36 point scale.50 The ACCUPLACER range across institutions for Elementary Algebra is even more pronounced, with the institution with the lowest cut score referring students to developmental education if they scored below 25 (on a scale of 20 to 120), while another community college refers students to developmental education if they scored below 110. The range for COMPASS Algebra across community colleges is similarly broad at 15 to 86, on a scale of 1 to 99.51 The mean cut scores across all community colleges tend, perhaps unsurprisingly, to be more or less in the middle of these ranges: 19 for the ACT; 471 for the SAT; 70 for ACCUPLACER Elementary Algebra; and 49 for COMPASS Algebra.52
The range of reading cut scores is also quite wide across institutions: 14-‐25 for the ACT; 340-‐550 for the SAT; 50-‐106 for ACCUPLACER Reading Comprehension; and 20-‐91 for COMPASS Reading.53 In this case, the mean scores across all community colleges do not fall in the middle of the range for all assessments. For the ACT and the SAT, they do, with the mean cut scores being 18 and 470, respectively. However, for the ACCUPLACER Reading Comprehension and the COMPASS Reading tests, the mean cut scores are on the higher end of the
spectrum – 77 out of a possible 120 for ACCUPLACER Reading Comprehension, and 76 out of a possible 99 for COMPASS Reading.54
The ACCUPLACER and COMPASS placement tests, unlike the SAT or ACT, were developed specifically to help evaluate student skills when entering postsecondary education. The ACCUPLACER test includes an essay and multiple choice, computer-‐adaptive sections in reading comprehension, arithmetic, algebra and college-‐level math. The test is internet-‐based and provides student scores almost immediately, including for the essay portion, which is computer-‐scored along with the multiple choice components. The COMPASS test is very similar, and both tests take place over a period of about one-‐and-‐a-‐half to three hours depending on how the students do as they move through the levels of difficulty on test items. Both tests are computer adaptive – a correct answer generates a follow-‐up question that is more difficult than the previous question until the student no longer provides a correct answer.55
COMMUNITY COLLEGE PLACEMENT POLICIES
The Center for Community College Student Engagement has studied the policies related to the use of placement tests on community college students’ experiences using two separate national surveys. Surveys used were the Survey of Entering Student Engagement (SENSE) (administered at 90 colleges in 2011) and the Community College Survey of Student Engagement (CCSSE) (administered at 435 colleges in 2011).56 They found that 88 percent of SENSE respondents and 74 percent of CCSSE respondents were required to take a placement test upon

10
enrolling in community college. This survey did not require students to indicate why they were not required to take a placement test, and community college policies on requiring placement tests, or using proxies for placement tests such as high school GPA or SAT or ACT scores, vary. Of those who took a placement test, 82 percent of SENSE respondents and 72 percent of CCSSE respondents were told that they were required to take at least one developmental course.57
Forty-‐four percent of colleges reported that they offer some form of placement test preparation to incoming students, but just 13 percent require students to complete test preparation prior to being tested. When students do prepare for remedial placement tests, the most popular method by far was studying on their own using college-‐provided online or printed materials. Thirty-‐eight percent of SENSE respondents and 28 percent of CCSSE respondents reported studying in this way, whereas just 17 percent of SENSE and 10 percent of CCSSE respondents reported participating in a brief refresher session (of a duration of eight hours or less), and a similarly low number of students (14 percent of SENSE and 9 percent of CCSSE) reported participating in a multiday or multi-‐week refresher session.58
RESEARCH ON PLACEMENT TESTS
The Community College Research Center (CCRC) at Teachers College, Columbia University has also completed extensive research on the issues of remediation and placement test effectiveness. Although their studies have focused on the predictive capabilities of placement tests, all of their data point to a central
conclusion: placement tests alone are not a strong predictor of college success. A better predictor, they argue, would take into account several other factors, most importantly, high school GPA.59 However, CCRC has also been able to discern two trends in placement test accuracy. First, various studies have found that placement tests are more accurate at predicting success in community college courses than they are at predicting the need for remediation. Second, placement tests are more accurate at predicting success in mathematics than they are at predicting success in English.
With regard to the first of these trends, a 2011 study from CCRC found that when predicting whether a student will be able to earn a C or better in a college-‐level course, the COMPASS exam has an accuracy rate of between 63 and 72 percent. In terms of predicting whether a student will earn a B or higher, the accuracy rate is between 60 and 72 percent, depending on the subject. For ACCUPLACER, the accuracy rates for success in college courses are 73-‐84 percent for a C or better and 59-‐66 for a B or better.60
The authors of this CCRC study point out, however, that these accuracy rates are based only on the students who take college-‐level classes, and therefore exclude the large number of students who are referred to remediation and never complete the sequence in order to enter credit-‐bearing courses. Therefore we cannot know whether or not those students might have been successful in college courses. In order to better assess a student’s eligibility for credit bearing courses, the authors of the study believe that other data about the student, such as high school GPA, should be taken into

11
account.61 Furthermore, while they find COMPASS and ACCUPLACER to be “reasonably valid predictors of students’ grades in college-‐level coursework,” they do not see evidence that using these tests improves student outcomes.62
A 2012 CCRC study did find, however, that mathematics placement tests “generate a substantial reduction in severe placement errors,” as opposed to the practice of allowing all students to enroll immediately in college-‐level courses. On the other hand, in English, placement tests actually increase the number of severe errors.63 Others have expanded on this work, examining the other side of the placement test equation, the placement of college-‐ready students in remedial classes. While placement tests have relatively high accuracy in predicting success in credit bearing courses, they also have a relatively high “severe” misplacement rate of students who could succeed in college classes being barred from enrolling in them. One CCRC study concluded that between 27 and 33 percent of students are mis-‐assigned in their English placement, and between 21 and 28 percent of students are mis-‐assigned in their math placement.64
CCRC also studied the outcomes of students who ignored their developmental placement recommendations and proceeded directly to credit-‐bearing courses. They found that while students who ignored remedial placement recommendations had a slightly lower success rate than students who had not been referred to remediation, they did have a substantially higher success rate in terms of credits completed than the students who complied with their recommendations and enrolled in
developmental courses.65 In real terms, of their sample, 17 percent of students who were told that they required developmental math and 45 percent of students who were told that they required developmental reading decided to ignore that advice and enroll directly into a credit-‐bearing “gatekeeper” course (that is, the first college-‐level course).66 Of the students who decided to ignore placement advice, 72 percent completed the credit-‐bearing course they enrolled in instead of the remedial course. However, only 27 percent of the students who took their placement advice and enrolled in remediation were able to complete a credit-‐bearing course.67
DEVELOPMENTAL COURSES
Most community college students hope to earn a bachelor’s degree. The same is true for the (large) subset of community college students who are assigned to developmental courses upon their arrival on campus. The National Center for Education Statistics (NCES) found that among students who enrolled in any type of remediation, just 16 percent hoped to end their education before attaining a bachelor’s degree, while 45 percent hoped to attain a master’s degree or beyond.68 A NCES longitudinal study revealed, however, few of these students met their educational goals within five years. Among all students participating in remediation, five years after enrollment, just about 5 percent had attained a bachelor’s degree, 14 percent had earned an associate’s degree, and 7 percent had earned a certificate.69 Attaining a bachelor’s degree necessarily means, for community college students, transferring at some point to a four-‐year institution. However, of community college students who entered postsecondary education in

12
2004 and were assigned to remediation, just 18 percent had transferred to a four-‐year institution within five years. This can be compared to the 21 percent of the total cohort who transferred to a four-‐year institution within five years.70
Another recent study by Complete College America, which collected data from 31 states and more than 10 million students, found that 52 percent of students entering community colleges that took part in this study were assigned to developmental courses, as compared to 20 percent of students in four-‐year colleges.71 At two-‐year colleges, 62 percent of the students placed into remediation actually completed those courses, but only 22.3 percent completed remediation and the associated college-‐level courses within two years,72 with just 10 percent graduating in three years. A slightly higher number of their non-‐remedial counterparts (13.9 percent) graduated within three years.73 The same study found that developmental education rates are much higher than the national average in some states, with Tennessee having the highest proportion of students assigned to developmental education in college at 71 percent. 74 NCES puts the community college remediation figure somewhat lower than Complete College America at 42 percent. This figure refers to any student who ever took a remedial course.75
Among 2003-‐04 first time postsecondary students, as of 2009, 39 percent of students at a public, four-‐year institution had taken a remedial course, and 32 percent at a private, not-‐for-‐profit four-‐year institution had done the same. In community colleges, however, 68 percent had taken at least one remedial course, and on average, students took 2.9
remedial courses and passed 1.9.76 Community college students are much more likely to need a remedial math course than a remedial English course – 60 percent of students enroll in a remedial math course, while 17 percent enroll in a remedial English course.77
These numbers are even more alarming in certain community college systems. A study conducted by Judith Scott Clayton and Olga Rodriguez at the Community College Research Center at Teachers College, Columbia University, Development, Discouragement, or Diversion? New Evidence on the Effects of College Remediation, found that among their sample group – 100,000 students at a Large Urban Community College System – 90 percent of all students were assigned to some form of remediation. Seventy-‐two percent of students required some remediation in mathematics; 72 percent required remediation in writing; and 38 percent in reading.78
It is not only the rates of remedial course assignments that speak to the level of preparation of students who emerge from high school, but also the level of the developmental courses to which students are assigned as well. Another CCRC study found that about one third of the students entering community college are referred to the lowest level of developmental mathematics, a course that is pitched two or three levels below the entry-‐level college mathematics course taken by most community college students, and 11 percent of students are referred to the lowest level of developmental reading.79
OUTCOMES FOR STUDENTS IN DEVELOPMENTAL COURSES
According to the same study, some students choose not to enroll in the

13
developmental courses to which they are assigned, but the majority of students (about 80 percent in math and 67 percent in English) do.80 And if they are assigned to developmental reading and writing courses, the likelihood is that students will be able to pass. Sixty-‐eight percent of students who enroll in developmental writing and 71 percent of students who enroll in developmental reading courses are able to pass them, but just 33 percent of students who enroll in developmental math courses are able to do the same.81 However, of the students who start in the lowest level of developmental courses (three levels below the college level), just 16 percent of math students and 22 percent of reading students will complete the full sequence within three years, and about 25 percent will drop out instead of
attempting to complete the sequence.82 Students assigned to developmental courses at any level see the following results: 44 percent of reading students complete their sequences within three years (this is 66 percent of the students who actually enroll in the courses after being referred to them), and 31 percent of math students complete their sequences within three years (44 percent of the students who actually enroll).83
CCRC finds that developmental education does indeed significantly decrease a student’s chances of completion. Less than 25 percent of community college students who enrolled in a remedial course completed a degree or certificate within eight years of enrollment (a time frame of either 800 or 400 percent of
0
10
20
30
40
50
Vocational/Technical
Social/BehavioralSciences
HealthEducationComputerScience
AccountingBusiness/Management
Percent of Students inRemediation
Chart 5: Percent of Total Students in Remediation by Major
(Source: NCES. (2010). Digest of Education Statistics, Table 241.)*

14
normal completion time, depending on the type of degree), compared with 40 percent of students who did not enroll in a remedial course.84
Remediation does not just impact whether a student will graduate, it impacts whether a student will even enter a program of study (defined as a series of courses leading to a credential in a specific field). In a 2012 update of a 2011 report, David Jenkins and Cho Sung-‐Woo at CCRC found that 56 percent of all students, after enrolling in community college, entered a program of study. Of the students referred to one remedial subject (31 percent of the total cohort), just 38 percent of students entered a program of study, and this rate declined as the number of remedial courses to which a student was referred rose. Just under 19 percent of students referred to two remedial courses (20 percent of the total cohort) entered a program of study, and only 10 percent of students who were referred to three remedial subjects (13percent of students in the cohort) entered a program of study.85
Furthermore, it appears that students may be assigned to remediation who could otherwise have succeeded in college classes. In “Development, Discouragement, or Diversion,” Scott Clayton and Rodriguez contend that in their sample, 25 percent of students who were required to take remedial math could probably have earned a B or better in a “relevant college course,” and up to 70 percent of students assigned to remedial reading could do the same.86
COLLEGE READINESS MEASURES
Placement tests and developmental education both have the same end goal: ensuring that students who end up in
credit-‐bearing college-‐level courses are, in fact, ready for college. To that end, high schools and test providers across the country have attempted to furnish their students with “college-‐ready” curricula and assessments, so that students will know prior to stepping on campus whether or not they are prepared to be there. However, despite such high rates of remediation at community colleges across the country, it appears that students who enroll in community college do not have particular trouble completing high school graduation requirements. According to a 2008 study from Strong American Schools (no longer in existence), in which 688 students in remedial courses at community colleges across the country were surveyed, only 14 percent reported finding their high school classes in any way difficult. Just 1 percent found high school classes “very” difficult, and 13 percent found them “somewhat” difficult. On the other hand, 24 percent of remedial students found their high school classes “very” easy, while an additional 24 percent found them “somewhat” easy, leaving 27 percent of remedial students who felt that high school classes were “right at their level.”87
Doubts about the value of a high school diploma have led national testing companies to develop tests to measure a student’s levels of college readiness upon graduation from high school. ACT considers “college-‐ready” to be the ability to “enroll and succeed in credit-‐bearing first-‐year courses at a postsecondary institution” without needing developmental education. They set college-‐ready benchmarks based on student scores on the ACT subject area tests to predict a 75 percent likelihood of earning a C or better and a 50 percent likelihood of earning a B or better.88 For

15
the 2012 graduating high school class (52 percent of which took the ACT),89 ACT found that just 25 percent of students met the ACT college-‐ready benchmark scores in all four of their tested subjects (English, Reading, Math and Science). A majority of students (67 percent and 52 percent, respectively) were college-‐ready in English and Reading, while 46 percent were college-‐ready in Math and 31 percent in Science.90 Twenty-‐eight percent of students met none of these benchmarks.91 Another 9 percent of students were within two points of meeting the benchmark in English; 11 percent in Reading, 9 percent in Math and 15 percent in Science.92
The College Board also measures college readiness based on SAT scores; the benchmark is a combined score of 1550 (out of a possible 2400), which predicts a 65 percent chance of earning at least a B-‐ average during the first year of college, which the College Board contends is itself a strong predictor of continued college success and completion.93 In their 2012 report, they announced that 43 percent of high school seniors had met their college readiness benchmarks.94
COMMUNITY COLLEGE OUTCOMES
If a student is able to successfully begin taking credit-‐bearing courses at a community college, either right away or after clearing the hurdles of developmental education, they still need either to successfully complete a sequence of courses leading to a certificate or associate’s degree, or to transfer to a four-‐year school in pursuit of a bachelor’s degree in order to reap most of the benefits of postsecondary education. Unfortunately, in the majority
of cases, students leave community college without a degree or certificate.
TRANSFER STUDENTS
Eighty percent of community college students begin college hoping to earn a bachelor’s degree or higher, meaning that they must transfer either within or after their first two years of college to a four-‐year institution. A NCES longitudinal study found that of students who entered community colleges in 2003, by 2009, 39.9 percent of students had transferred. Of that 40 percent, 61 percent had transferred to a four-‐year institution, or 24 percent of the entire cohort95 – a far cry from the 80 percent who hoped to earn a bachelor’s degree.
Of the 24 percent of the initial cohort who transfer, about 60 percent of students from the 2003-‐04 cohort had attained some type of certification by 2009; 43 percent had earned a bachelor’s degree as their highest degree. This is only 10 percent of the entire initial cohort, 80 percent of which had hoped to attain a bachelor’s degree when they entered community college.
Students who were younger when they first enrolled were more likely to transfer from a community college to a four-‐year institution: 33 percent who enrolled at the age of 18 or younger made the leap, whereas just 6 percent of students who were 30 or older when they entered transferred to a four-‐year school. The level of education achieved by a student’s parents also seems to have an impact on the likelihood of transfer to a four-‐year school; just 14 percent of students whose parents had earned a high school diploma or less transferred, while 32 percent of students whose parents held bachelor’s degrees transferred.96

16
In 2012, the National Student Clearinghouse Research Center provided more recent figures on community college students in their report Transfer and Mobility: A National View of Pre-‐Degree Student Movement in Post-‐Secondary Institutions. The National Student Clearinghouse Research Center used a dataset drawn from their own StudentTracker database, which they claim tracks 93 percent of all college enrollments across the country, and can track the same student from institution to institution. However, despite the different datasets, the National Student Clearinghouse figures are not dissimilar to the NCES figures. Of students who began at a public two-‐year institution in
Fall 2006, 33 percent had transferred at least once between 2006 and 2011.97 Of those who did transfer, 41 percent went to four-‐year public institutions; 38 percent went to a different two-‐year public institution, and 14 percent went to a four-‐year private, not-‐for-‐profit institution.98
COMPLETION
According to NCES, only 13 percent of students who entered community college as a first-‐time, full-‐time student in 2007 earned an associate’s degree in normal program completion time, † (two years) † NCES defines “normal time to completion” as “the amount of time necessary for a student to
Downward Transfer
Lateral Transfer
Upward Transfer
Public Two-‐Year
For-‐Profit
Prifvate Not-‐For-‐Profit Four-‐YearPublic Four-‐Year
After Fifth Year
After Fourth Year
After Third Year
After Second Year
After First Year
Certificate
Associate's
Bachelor's
60.8%36%
30.9% 42.9%
11.9%
11.5%
3.1%
39.4%
27.9%
5.9%5.8%
21.1%
14.3%
2.2%
43.2%
No degree/certificateearned within 6 years.
Direction of Transfer
Type of Institution
Time of Transfer(Two-‐Year to Four-‐Year Institution)
Highest Degree Earned after Tranfer(Two-‐Year to Four-‐Year Institution)
40.3%
Chart 6: Characteristics and Outcomes of Community College Transfers
(Source: NCES. (2011). Six-‐Year Attainment, Persistence, Transfer, Retention, and Withdrawal Rates of Students Who Began Postsecondary Education in 2003-‐2004.)

17
from public two-‐year institutions.99 Among students who are completing programs of less than two years in length, such as certificates, the outcomes are much higher: 57 percent graduate on time.100 If we expand the time frame and look at completion of a two-‐year degree within four years, the figures look somewhat better; NCES reports that 22 percent of students seeking an associate’s degree at a public two-‐year institution have earned that degree within 150 percent of normal time, or three years, and 28 percent have done so in 200 percent of normal time, or four years.101
A separate 2011 study by Complete College America, which relied on self-‐reported data from 33 participating states based on completion metrics established by Complete College America and the National Governors’ Association, reported that the average time to completion for students who do graduate is, as the NCES data indicates, often far beyond the length of the program. The study also found that, on average, full-‐time students complete a one-‐year certificate in 3.3 years and an associate’s degree in 3.8 years. Time to completion jumps to 4.4 years for a one-‐year certificate and 5 years for an associate’s degree among part-‐time students.102
complete all requirements for a degree or certificate according to the institution’s catalog. This is typically 4 years (8 semesters or trimesters, or 12 quarters, excluding summer terms) for a bachelor’s degree in a standard term-‐based institution; 2 years (4 semesters or trimesters, or 6 quarters, excluding summer terms) for an associate’s degree in a standard term-‐based institution; and the various scheduled times for certificate programs.” “Normal time to completion” assumes full-‐time enrollment.
Open-‐admission four-‐year institutions, like community colleges, have fairly low overall graduation rates; within six years, 27 percent have graduated; the figure is highest at private, not-‐for-‐profit open-‐admission institutions, which have a six-‐year graduate rate of 35 percent. Public and private for-‐profit open-‐admission four-‐year institutions have six-‐year graduate rates of 31 percent and 13 percent, respectively.103
Another recent study undertaken by the National Student Clearinghouse Research Center, Completing College: A National View of Student Attainment Rates, provides a different look at college completion. They derived their dataset from both of their own StudentTracker and DegreeVerify services, which tracks 94 percent of national college enrollments, with specific reference to enrollment intensity. With these instruments, the National Student Clearinghouse Research Center was able to follow the cohort of first-‐time college students enrolling in Fall 2006 for six years in order to provide a longitudinal picture of their outcomes, tracking even the students who completed degrees at institutions other than the one they initially enrolled in.104 Using this methodology, the National Student Clearinghouse Research Center found that 36 percent of students who began their post-‐secondary education in public two-‐year institutions had completed a degree or certificate within six years, with an additional 20 percent still enrolled in higher education. Of those students who completed, 66 percent completed a degree at their initial two-‐year institution; 8 percent completed a degree at a different two-‐year institution, and 26 percent completed their first degree at a four-‐year institution.105

18
Although the National Student Clearinghouse numbers revise upwards the traditionally measured completion rates for all types of institutions, the authors of the report do point out that among students who begin at two-‐year public institutions, the drop-‐out and stop-‐out rate for full-‐time students after six years is 43 percent, while the overall drop-‐out and stop-‐out rate for full-‐time students after six years is less than half of that, at 20 percent.106 The numbers are worse for community college students who attended part-‐time: their drop-‐out/stop-‐out rate after six years is almost 70 percent, while the rate for students with mixed enrollment (sometimes attending full-‐time, sometimes attending part-‐time) is slightly better at 40 percent.107
Recent analysis from the NCES Beginning Postsecondary Students Longitudinal
Study by the American Association of Community Colleges also paints a more positive picture than other interpretations of NCES data. They found that when the figures on completion are expanded to six years, 62 percent of students are “successful” – that is, they have either earned a credential (44 percent), or are still enrolled (19 percent).108
WHO SUCCEEDS?
GPA
One central predictor of the likelihood of transfer and the likelihood of the completion of either a sub-‐baccalaureate degree or a baccalaureate degree is college GPA. The experiences and outcomes of students who entered postsecondary education in the 2003-‐04 academic year as reported in an NCES longitudinal study suggest that GPA has a
Chart 7: Percent of Students Graduating in 100, 150 and 200 Percent of Normal Completion Time, by Control of Institution
(Source: NCES. (2010). Tracking Students to 200 Percent of Normal Time: Effect on Institutional Graduation Rates.)
Two-‐Year Institutions
0 10 20 30 40 50 60 708 Years6 Years4 Years
8 Years6 Years4 Years
8 Years6 Years4 Years
4 Years3 Years2 Years
4 Years3 Years2 Years
4 Years3 Years2 Years
Public
PrivateNot-‐For-‐Profit
PrivateFor-‐Profit
Public
PrivateNot-‐For-‐Profit
PrivateFor-‐Profit
Four-‐Year Institutions

19
significant correlation to completion and dropout rates. Of students who had a first year GPA of 2.5 or less, 47 percent had dropped out within six years with no degree or certificate earned. This number dropped to 31 percent among students with a first year GPA of 3.5 or more. On the other end of the attainment spectrum, 33 percent of students with a GPA of 2.5 or less had attained a degree or certificate after six years; this number rose to 58 percent of students with a GPA of 3.5 or higher.109
Breaking out the data for two-‐year institutions, it is clear that GPA and college success has the same correlation for community college students as it does for the entire undergraduate population. Data from the same longitudinal study indicates that students with a GPA of 3.5 or higher were least likely to drop out at any point, and more likely to have attained a degree or certificate within six years. The reverse was true for students with a GPA of 2.5 or lower.110 NCES found that 21 percent of all students who began at a two-‐year institution and remained there had earned a degree or certificate within six years, and 37 percent had dropped out. However, just 20 percent of students with a GPA of 2.5 or lower had attained a degree or certificate within six years, and 43.3 percent had dropped out. The remainder was still enrolled either at their initial institution or a different institution. Among those with a GPA of 3.5 or higher, 30 percent had earned a degree or certificate, and just 34 percent had dropped out.111
GPA also correlates with a student’s likelihood to transfer. A 2006 study by Clifford Adelman, titled The Toolbox Revisited: Paths to Degree Completion from High School Through College, found
that there was a clear connection between a student’s GPA at the end of the second year and ultimate attainment: students who went on to earn a bachelor’s degree had a mean GPA of 2.84, whereas students who did not had a mean GPA of 2.37.112 Community college GPA necessarily affects a student’s transfer prospects, because typically, four-‐year schools require transfer students from community colleges to meet certain GPA requirements in order to transfer into a bachelor’s degree program. These requirements vary from school to school, jurisdiction to jurisdiction and state to state, though it appears that generally, a GPA of at least 2.0 is required for a community college student to transfer to a local state university.
STUDENT COMMITMENT
Another factor that correlates to college success is student commitment. NCES measures student commitment to earning a degree by their stated goals, course enrollment and persistence in attending at least two classes a semester. A 2006 study found that students in community colleges who were classified as more committed to earning a four-‐year degree were more likely to earn a credential and to remain in college for at least nine months. Only 17 percent of the more committed students attended less than nine months of college and did not attain a credential; this was true for 30 percent of less committed students.113
ENROLLMENT STATUS
The data in the National Student Clearinghouse Research Center report Completing College: A National View of Student Attainment Rates suggests that enrollment level, which could also perhaps be seen as a proxy for

20
commitment, appears to be related to completion among community college students. While 36 percent of all students who began at a two-‐year public institution in 2006 had completed either a two-‐year or a four-‐year degree by 2012, this figure rose to more than half – 53 percent – of students who began at a two-‐year public institution and were enrolled exclusively full-‐time. Of students who were enrolled exclusively part-‐time, just 18 percent had completed either a two-‐year or a four-‐year degree within six years, and of students who had a mixed enrollment pattern (enrolling full-‐time in
some semesters and part-‐time in others), 33 percent had completed either a two-‐year or a four-‐year degree within six years.114
COLLEGE COSTS AND FINANCIAL AID
Although community colleges are generally perceived as the “affordable option” in higher education (and indeed they are compared to four-‐year colleges), many students still require financial aid and go into debt in order to attend. Average annual tuition and fees at community colleges are substantially lower than at their public four-‐year
0
10
20
30
40
50
3.50 or Higher
3.00-‐3.46
2.50-‐2.99
Less than 2.50GPA
Certificate Associate’sDegree
RemainedEnrolled at
First Institution,No Degree
Transferred Dropped Out
Chart 8: Community College Student Outcomes after Six Years, by College GPA

21
counterparts. Public, in-‐district community colleges charge on average $2,963 a year in tuition and fees as compared to $8,244 at four-‐year schools.115 However, despite the lower costs, 40 percent of full-‐time community college students have such low incomes that they qualify for need-‐based aid – as compared to 22 percent of public four-‐year students and 19 percent of private four-‐year students. Eighty-‐three percent of community college students have documented financial aid need.116
FINANCIAL AID
Students at public two-‐year institutions are much less likely than students at public four-‐year institutions to borrow money to pay for college, though this number has risen in the last decade. Thirty-‐five percent of community college students borrowed money toward their degrees in 2009, up 4 percent from 2001. The rate of student borrowing in public four-‐year institutions has by contrast declined slightly from 61 to 58 percent, though it still far outpaces that of two-‐year students.117
During the 2009-‐2010 school year, 85 percent of four-‐year students and 75 percent of two-‐year students received some form of financial aid. The most common type of aid received was, in both cases, grant or scholarship aid. Among community college students, 67 percent receive a grant or scholarship. In this category, 57 percent received federal grants (56 percent got Pell grants, specifically), and 26 percent received state or local government grants or scholarships. An additional 10 percent received an institutional grant or scholarship. About 40 percent received aid in the form of loans. Federal loans were granted to 39 percent of community college students, while 3 percent of students received another type of student loan.118
The Institute for College Access and Success reports that while a large proportion of community college students receive financial aid, a full 80 percent of community college students report having unmet need, and the average aid gap, after all aid is awarded, is $5,277.119
0
2
4
6
8
10
12
Public Institutions PrivateNot-‐For-‐ProfitInstitutions
PrivateFor-‐ProfitInstitutions
Four-‐Year
Two-‐Year
Chart 9: Percent of Students Defaulting on Loans
(Source: NCES. (2011). The Condition of Education, 2011, 133. NCES did not update this data in the 2012 edition of The Condition of Education.)

22
DEFAULT RATES
Community college students are more likely than their four-‐year counterparts to default on their loans. In 2008, the default rate for community college students (that is, students at public two-‐year institutions) was 10 percent, as compared to 4 percent of students at public four-‐year institutions. Among students at private not-‐for-‐profit institutions, the default rate was 8 percent at two-‐year schools and 4 percent at four-‐year schools. Students attending private for-‐profit institutions are the most likely to default on their loans, and unlike in the other categories, the default rates are nearly equivalent, with 12 percent of two-‐year students defaulting compared to 11 percent of four-‐year students.120
Although community college students are more likely to default on their loans than students at four-‐year schools, they tend to have a smaller amount of debt overall. The College Board reports in their 2010 Community College Trends Brief that 62 percent of students who earned an associate’s degree had no debt, while an additional 23 percent owed less than $10,000. Nine percent owed between $10,000 and $19,999; and 3 percent owed $20,000 to $29,000. Just 2 percent owed more than $30,000. Similarly, 70 percent of students who earned certificates were debt-‐free, whereas just under 10 percent owed more than $10,000. Private for-‐profit institutions appear to be the most likely to produce graduates in debt. At two-‐year institutions, 76 percent of graduates owe more than $10,000, while just 2 percent have no debt.121
EMPLOYMENT OUTCOMES
Higher education has long corresponded to greater employment opportunities, and
this will continue as low-‐skill and routine jobs are increasingly shifted to developing countries or replaced by automation. Recent NCES data on unemployment rates indicates just how important having some postsecondary education can be when it comes to employment. Thirteen percent of people in the workforce with only a high school diploma are unemployed. This figure drops to about 10 percent for people with some college, and down to 7 percent for those with an associate’s degree. Workers who hold bachelor’s degrees fare best; the unemployment rate among this group is just 4 percent. 122
Educational attainment also affects the positions available to employees. Workers with only a high school diploma are employed primarily in service (21 percent), clerical (16 percent), craft (14 percent), production (20 percent) and sales (12 percent) positions. Just 5 percent are employed in professional positions, and even fewer (3 percent) in technical positions. By contrast, 44 percent of workers with an associate’s degree are employed in the positions that are either managerial, professional, or technical, and just 9 percent are employed in production, while 14 percent are employed in service. The contrasts are starker for those with degrees beyond an associate’s. The majority (64 percent) of bachelor’s degree holders are employed in managerial, professional or technical positions. This figure jumps to 87 percent of people holding advanced degrees, with a full 52 percent of this group employed in professional positions. However, even having a vocational certificate improves employment prospects over just a high school diploma – in some cases, substantially. Among workers who hold a vocational certificate,

23
10 percent are employed in technical positions, a 7 percent improvement over high school graduates.123
Degree attainment also affects salary quite substantially. Among people who never completed high school, the median annual salary is $21,000. Completing high school gives employees a small boost to $29,200; an associate’s degree produces a median annual salary of $33,200. Bachelor’s degrees in non-‐STEM fields command median annual earnings of $45,300, while someone with a bachelor’s degree in a STEM field can expect a salary of $58,200.124
CONCLUSION
The United States is falling behind other countries in the proportion of the population with postsecondary degrees. Attaining higher education has become increasingly important as the United States has transitioned to a knowledge economy, and is directly correlated to lower rates of unemployment and higher salaries. And our students understand this. They are attending college in record numbers. Community colleges, which have long been our country’s gateway to postsecondary education for “non-‐traditional” students, are becoming increasingly popular among students of all types, with many community college students intending to transfer to more selective four-‐year institutions for a bachelor’s degree after completing initial coursework.
But despite the fact that more students than ever are attending college, they are not succeeding at high rates. Many students who enter community college never complete a credential of any kind, much less transfer to a four-‐year institution and earn a bachelor’s degree. This is largely due to the fact that they are entering college unprepared for the rigors of higher education. Large numbers of students, particularly at community colleges, are referred to remedial education, which slows down their progress considerably, and requires them to spend time and money which many do not have.
And it is not even clear that remediation is always helping these students. Most schools use placement tests to determine whether students need remediation, but these tests do not always accurately predict whether the student will succeed in a college class – there are likely a lot of false negatives, resulting in students being referred to remediation who could have passed a credit-‐bearing course.125 Research also shows, however, that high school GPA is a strong predictor of college readiness. This suggests that if students are able to succeed in high school by doing well in the core courses in the curriculum, it is likely that they will be able to succeed in community college. As we look hard at our high school programs of study to insure that courses are aligned with initial credit-‐bearing courses in our community colleges, we must give all of our high school students the supports they need to succeed in these courses prior to entering college.

24
APPENDIX 1 : HIGH SCHOOL STUDENT PATHWAYS THROUGH TERTIARY EDUCATION AND THE WORKFORCE 1 2 6

25
APPENDIX 2: DISTRIBUTION OF UNDERGRADUATE DEBT BY SECTOR AND TYPE OF DEGREE
(Source: The College Board Advocacy & Policy Center. (2011). Trends in Community College Education: Enrollment, Prices, Student Aid, and Debt Levels. Trends in Higher Education Series, 5.)
$10,000 -‐ $19,999
No Debt
Less than $10,000
$30,000 -‐ $39,999
$20,000 -‐ $29,999
$40,000+
Public Private Not-‐For-‐ProfitPrivate For-‐Profit
Bachelor’s Degree
Associate’s Degree
Certificate
Public
Public
Private For-‐Profit
Private For-‐Profit

26
APPENDIX 3: INTERNATIONAL GRADUATION RATES, SECONDARY AND TERTIARY EDUCATION ‡
(Source: OECD. (2011). Education at a Glance: 2011.)
‡ The OECD defines “Tertiary-‐type A” education as programs that “are largely theory-‐based and are designed to provide sufficient qualifications for entry to advanced research program and professions with high skill requirements, such as medicine, dentistry or architecture. Tertiary-‐type A programs have a minimum cumulative theoretical duration (at tertiary level) of three years’ full-‐time equivalent, although they typically last four or more years.” They define “Tertiary-‐type B” education as programs that “are typically shorter than those of Tertiary-‐type A and focus on practical, technical or occupational skills for direct entry into the labor market, although some theoretical foundations may be covered in the respective programs. They have a minimum duration of two years full-‐time equivalent at the tertiary level.”
0 20 40 60 80 100
Tertiary-‐type B Tertiary-‐type A Upper Secondary
Mexico
Turkey
Spain
Sweden
United States
Canada
Italy
Slovak Republic
OECD Avg.
Czech Republic
Germany
Denmark
Poland
EU21 Avg.
Hungary
Iceland
Israel
New Zealand
Switzerland
Ireland
Norway
United Kingdom
Finland
Japan
Portugal
Slovenia
Australia
Austria
Netherlands

27
APPENDIX 5: GPA REQUIREMENTS FOR TRANSFER TO FOUR-YEAR COLLEGES IN SELECTED STATES
State School or System
GPA Requirements Notes
Arizona
Arizona State University 2.0
Transfers must have either an associate’s degree with a 2.0 GPA or completion of the Arizona General Education Curriculum with a 2.5 GPA. Non-residents must have a 2.5 GPA.
University of Arizona 2.0 Non-residents must have a 2.5 GPA. Transfers
must meet high school competency requirements.
Connecticut
Central Connecticut
State University 2.0
Transfers are admitted with a C or better after completing at least 12 or more college-level credits (not including remedial coursework) from regionally accredited institutions. Transfers are not required to submit SAT or ACT scores if the applicant has successfully completed more than twelve college level credits or has been out of high school for more than five years.
University of Connecticut 2.7
At minimum, transfer applicants must have a 2.7 cumulative GPA in challenging academic course work. Some schools within the University, such as the School of Business and the School of Engineering require at minimum a 3.0 GPA in college level courses. The minimum grade point average does not guarantee admission.
Kentucky
Kentucky State University 2.0
All transfer students who have completed 24 or more semester hours of college work must have earned a cumulative GPA of 2.00. All transfer students who have completed less than 24 semester hours of college work in addition to submitting transcripts from all institutions attended must also submit High School Transcripts and ACT or SAT Test Scores.
University of Kentucky 2.0 Students with fewer than 23 college credits must
meet freshman admissions requirements.
Mississippi
Mississippi State University 2.0
Students may transfer to Mississippi State University from regionally accredited community, junior or senior colleges for any period of enrollment, provided they have earned a 2.0 GPA on all college courses attempted as well as earned a 2.0 GPA on the 30-hours of core courses.
University of Mississippi 2.0
Students may be accepted for transfer from other regionally accredited colleges and universities if they have earned an associate's degree intended for transfer to a four-year school with a minimum 2.0 cumulative GPA. In addition, students may be accepted from other regionally accredited colleges and universities if a minimum 2.0 cumulative GPA has been maintained on all course work attempted with the exception of vocational/technical or other courses not acceptable for transfer.

28
1 Andrew Wiley, Jeffrey Wyatt and Wayne J. Camara. (2010). The Development of a Multidimensional College Readiness. The College Board, 1. 2 Achieve, Inc. (2011 (?)). What Does College-‐ and Career-‐Ready Really Mean? The Future Ready Project, 2. (http://www.futurereadyproject.org/sites/frp/files/College-‐%26-‐Career-‐Readiness.pdf) 3 Andrew Wiley, Jeffrey Wyatt and Wayne J. Camara. (2010). The Development of a Multidimensional College Readiness. The College Board, 1. See also OECD. (2011). Education at a Glance: 2011, 38. 4 OECD. (2012). Education at a Glance: 2012, Table A1.4 and A1.3a. Countries with the same rate are counted as being ranked at the same level. In terms of actual countries that have a higher rate than the United States, there are 12, and the US is also tied with Sweden. 5 OECD. (2012). Education at a Glance: 2012, Table A1.4 and A1.3a. 6 OECD. (2012). Education at a Glance: 2012, Table A1.4. 7 OECD. (2011). Education at a Glance, 2011, 41-‐42. 8 OCED. (2012). Education at a Glance: 2012, Table A1.4. 9 OECD. (2011). Education at a Glance: 2011, 54, 68. 10 OECD. (2011). Education at a Glance: 2011, 68. 11 OECD. (2012). Education at a Glance: 2012, Table A7.1a. For ISCED 3A programs, for which the typical graduation age in the US is listed as 18. 12 OECD. (2011). Education at a Glance: 2011, 149. Relative earnings is derived by using “earnings in different occupations for those with an upper secondary (ISCED 3/4) education … as a benchmark to assess earnings premiums for those with a tertiary education,” (141). 13 Georgetown Center on Education and the Workforce. (2011). The Undereducated American, 17; American Association of Community Colleges. (2013). Community College Contributions. AACC Policy Brief 2013-‐01PB, 5. 14 American Association of Community Colleges. (2013). 2013 Community College Fast Facts, 1. 15 American Association of Community Colleges. (2013). Community College Contributions. AACC Policy Brief 2013-‐01PB, 11. 16 American Enterprise Institute. (2009). Diplomas and Dropouts: Which Colleges Actually Graduate Their Students (and Which Don’t), 7. 17 NCES. (2012). The Condition of Education: 2012, 274. 18 American Association of Community Colleges. “Community College Trends and Statistics,” http://www.aacc.nche.edu/AboutCC/Trends/Pages/default.aspx; “Community Colleges Past to Present,” http://www.aacc.nche.edu/AboutCC/history/Pages/pasttopresent.aspx. 19 NCES. (2009). Issue Tables: Choosing a Postsecondary Institution: Considerations Reported by Students, Table 1. 20 NCES. (2012). The Condition of Education: 2012, 258-‐59. 21 Committee on Measures of Student Success. (2011). A Report to Secretary of Education Arne Duncan, 5. 22 Committee on Measures of Student Success. (2011). A Report to Secretary of Education Arne Duncan, 5. 23 NCES. (2012). The Condition of Education: 2012, 162. Data beyond 2010 is projected. 24 NCES. (2012). The Condition of Education, 2012, 162-‐64. 25 American Association of Community Colleges. (2013). Community College Fast Facts: 2013, 1. 26 NCES. (2009). Issue Tables: Choosing a Postsecondary Institution: Considerations Reported by Students, Table 1. 27 NCES Tables Library, Table 1. Demography and Enrollment by Sex and Race/Ethnicity: Percentage Distribution of 2007-‐08 first-‐time bachelor’s degree recipients by sex, race/ethnicity, and enrollment characteristics. 28 NCES. (2012). Enrollment in Postsecondary Institutions, Falls 2010; Financial Statistics, Fiscal Year 2010; and Graduation Rates, Selected Cohorts 2002-‐07: First Look. 7. I had to calculate the percentages myself based on the cohort numbers. 29 American Association of Community Colleges. (2011). 2011 Community College Fast Facts, 1. 30 American Association of Community Colleges. (2012) 2012 Community College Fast Facts, 1. 31 NCES. (2012). The Condition of Education: 2012, 256. The 2012 volume does not provide data for total number of students working during college (full-‐ and part-‐time students aggregated), so we will have to go with the 2011 data for this.

29
32 American Association of Community Colleges. (2012). Why Access Matters: The Community College Student Body, 8. 33 NCES. (2009). Issue Tables: Choosing a Postsecondary Institution: Considerations Reported by Students, Table 2. 34 American Association of Community Colleges. (2013). 2013 Community College Fast Facts, 1. 35 NCES College and Careers Tables Library. “Table 12. Number and percentage distribution of enrollment in Title IV 4-‐year institutions, by race/ethnicity, control of institution, and student level: United States, fall 2009.” http://nces.ed.gov/datalab/tableslibrary/viewtable.aspx?tableid=7489 36 NCES College and Careers Tables Library. “Table 8. Number and percentage distribution of enrollment at Title IV 4-‐year institutions, by gender, attendance status, control of institution, and student level: United States, fall 2009.” http://nces.ed.gov/datalab/tableslibrary/viewtable.aspx?tableid=7485 37 NCES Tables Library. Table 1A. Total undergraduate enrollment in degree-‐granting institutions, percentage change, percentage distribution, and proportion who were enrolled in 2-‐year institutions, by race/ethnicity: Fall 1984, 1994, and 2004. 38 NCES Tables Library, Table 20, “Percent distribution of undergraduate enrollment in Title IV degree-‐granting 2-‐year institutions, by attendance status, gender, control of institution, and age of student: United States, fall 2001. (table ID 1048). 39 NCES Tables Library, Table 20, “Percent distribution of undergraduate enrollment in Title IV 2-‐year institutions, by attendance status, gender, control of institution, and age of student: United States, fall 2009. (table ID 7501). 40 NCES. (2012). The Condition of Education: 2012, 246. 41 NCES. (2011). Community College Student Outcomes: 1994-‐2009, 5. 42 NCES. (2009). Issue Tables: Choosing a Postsecondary Institution: Considerations Reported by Students, Table 2. 43 NCES. (2012). The Condition of Education: 2012, 258. 44 NCES. (2012). The Condition of Education: 2012, 258. 45 “Malloy to colleges: no more semesters of remediation,” The CT Mirror, June 1, 2012, http://www.ctmirror.org/blogs/malloy-‐colleges-‐no-‐more-‐semesters-‐remediation; “Measure Would End No-‐Credit Remedial Classes at Colleges,” Hartford Courant, March 19. 2012, http://articles.courant.com/2012-‐03-‐19/news/hc-‐remedial-‐bill-‐0320-‐20120319_1_remedial-‐work-‐college-‐credits-‐remedial-‐college-‐classes. See also Education Commission of the States, Postsecondary success: Developmental/Remediation, http://www.ecs.org/html/issue.asp?issueid=200&subIssueID=274. 46 Complete College America. (n.d.) Transform Remediation: The Co-‐Requisite Course Model. http://www.completecollege.org/docs/CCA%20Co-‐Req%20Model%20-‐%20Transform%20Remediation%20for%20Chicago%20final%281%29.pdf; McGraw-‐Hill. (2012). The Tipping Point in Developmental Education. McGraw-‐Hill Education Policy Paper. www.mheducation.com/uar/Developmental_Ed_White_Paper.pdf. 47 “Public two-‐year institutions” are used as a proxy for “community colleges” throughout the paper. 48 Fields, R. and Parsad, B. (2012). Tests and Cut Scores Used for Student Placement in Postsecondary Education: Fall 2011. Washington, DC: National Assessment Governing Board, 11, 17. 49 Fields, R. and Parsad, B. (2012). Tests and Cut Scores Used for Student Placement in Postsecondary Education: Fall 2011. Washington, DC: National Assessment Governing Board, 11, 17. 50 Fields, R. and Parsad, B. (2012). Tests and Cut Scores Used for Student Placement in Postsecondary Education: Fall 2011. Washington, DC: National Assessment Governing Board, 15. 51 Fields, R. and Parsad, B. (2012). Tests and Cut Scores Used for Student Placement in Postsecondary Education: Fall 2011. Washington, DC: National Assessment Governing Board, 15. 52 Fields, R. and Parsad, B. (2012). Tests and Cut Scores Used for Student Placement in Postsecondary Education: Fall 2011. Washington, DC: National Assessment Governing Board, 13. 53 Fields, R. and Parsad, B. (2012). Tests and Cut Scores Used for Student Placement in Postsecondary Education: Fall 2011. Washington, DC: National Assessment Governing Board, 21. 54 Fields, R. and Parsad, B. (2012). Tests and Cut Scores Used for Student Placement in Postsecondary Education: Fall 2011. Washington, DC: National Assessment Governing Board, 19. 55 Hughes, Katherine and Judith Scott-‐Clayton. (2011). “Assessing Developmental Assessment in Community Colleges,” Community College Research Center Working Paper No. 19, Assessment of Evidence Series, 9.

30
56 http://www.ccsse.org/aboutccsse/colleges.cfm 57 Center for Community College Student Engagement. (2012). A Matter of Degrees: Promising Practices for Community College Student Success – A First Look, 8-‐9. 58 Center for Community College Student Engagement. (2012). A Matter of Degrees: Promising Practices for Community College Student Success – A First Look, 10. 59 See, for example, Judith Scott-‐Clayton. (2012). “Do High-‐Stakes Placement Exams Predict College Success?,” CCRC Working Paper No. 41.; Clive Belfield and Peter Crosta. (2012). “Predicting Success in College: The Importance of Placement Tests and High School Transcripts,” CCRC Working Paper No. 42. 60 Hughes, Katherine and Judith Scott-‐Clayton. (2011). “Assessing Developmental Assessment in Community Colleges,” Community College Research Center Working Paper No. 19, Assessment of Evidence Series, 15. 61 Hughes, Katherine and Judith Scott-‐Clayton. (2011). “Assessing Developmental Assessment in Community Colleges,” Community College Research Center Working Paper No. 19, Assessment of Evidence Series, 19. 62 Hughes, Katherine and Judith Scott-‐Clayton. (2011). “Assessing Developmental Assessment in Community Colleges,” Community College Research Center Working Paper No. 19, Assessment of Evidence Series, 25-‐26. Judith Scott-‐Clayton updated these findings in her 2012 paper, “Do High-‐Stakes Placement Exams Predict College Success?,” in which she looked at data from 42,000 first-‐time entrants into a community college system. She found that using placement test scores resulted in “a full 70% of students being accurately placed in math under the B-‐or-‐higher success criterion, but only 49 percent under the passing criterion.” She found the same to be true in English, with 61% accurately placed under the former criterion and just 36% under the latter.62 Scott-‐Clayton further found that compared to allowing all students to enroll immediately in college-‐level courses, math placement tests do “generate a substantial reduction in severe placement errors,” but in English, placement tests actually increase the number of severe errors. 63 Community College Research Center. (2012). “Do High-‐Stakes Placement Exams Predict College Success?,” Working Paper No. 41, 32. 64 Belfield, Clive and Peter Crosta. (2012). “Predicting Success in College: The Importance of Placement Tests and High School Transcripts,” Community College Research Center Working Paper No. 42, 28. 65 Community College Research Center. (2012). “Do High-‐Stakes Placement Exams Predict College Success?,” Working Paper No. 41, 1. 66 Bailey, Thomas, Dong Wook Jeong and Sung-‐Woo Cho. (2009). Referral, Enrollment, and Completion in Developmental Education Sequences in Community Colleges. Community College Research Center Working Paper No. 15, 12. 67 Bailey, Thomas, Dong Wook Jeong and Sung-‐Woo Cho. (2009). Referral, Enrollment, and Completion in Developmental Education Sequences in Community Colleges. Community College Research Center Working Paper No. 15, 13. 68 NCES. (2011). Community College Student Outcomes: 1994-‐2009, Table 1-‐B. 69 NCES. (2011). Community College Student Outcomes: 1994-‐2009, Table 2-‐B. 70 NCES. (2011). Community College Student Outcomes: 1994-‐2009, Table 3-‐B. 71 Complete College America. (2012). Remediation: Higher Education’s Bridge to Nowhere, 6. 72 Complete College America. (2012). Remediation: Higher Education’s Bridge to Nowhere, 8. 73 Complete College America. (2012). Remediation: Higher Education’s Bridge to Nowhere, 10. 74 Complete College America. (2011). Time is the Enemy, 34. 75 NCES. (2011). The Condition of Education, 225. NCES did not update the data in the 2011 version of The Condition of Education in the 2012 version. 76 NCES. (2012). “An Overview of Classes Taken and Credits Earned by Postsecondary Students,” US Department of Education. Web Tables. NCES 2013-‐151rev, 13, Table 2-‐A. 77 NCES. (2012). “An Overview of Classes Taken and Credits Earned by Postsecondary Students,” US Department of Education. Web Tables. NCES 2013-‐151rev, Tables 2_B and 2-‐C. 78 Scott Clayton, Judith and Olga Rodriguez. “Development, Discouragement, or Diversion? New Evidence on the Effects of College Remediation.” NBER Working Paper No. 18328. August, 2012, 12. 79 Bailey, Thomas. (2008). “Challenge and Opportunity: Rethinking the Role and Function of Developmental Education in Community College,” Community College Research Center, Teachers College Columbia University Working Paper No. 14, 3-‐4.

31
80 Bailey, Thomas. (2008). “Challenge and Opportunity: Rethinking the Role and Function of Developmental Education in Community College,” Community College Research Center, Teachers College Columbia University Working Paper No. 14, 2-‐3. 81 Bailey, Thomas. (2008). “Challenge and Opportunity: Rethinking the Role and Function of Developmental Education in Community College,” Community College Research Center, Teachers College Columbia University Working Paper No. 14, 3-‐4. 82 Bailey, Thomas. (2008). “Challenge and Opportunity: Rethinking the Role and Function of Developmental Education in Community College,” Community College Research Center, Teachers College Columbia University Working Paper No. 14, 4-‐5. 83 Bailey, Thomas. (2008). “Challenge and Opportunity: Rethinking the Role and Function of Developmental Education in Community College,” Community College Research Center, Teachers College Columbia University Working Paper No. 14, 4. 84 Bailey, Thomas. (2008). “Challenge and Opportunity: Rethinking the Role and Function of Developmental Education in Community College,” Community College Research Center, Teachers College Columbia University Working Paper No. 14, 5. 85 Jenkins, David and Cho Sung-‐Woo. (2012). “Get With the Program: Accelerating Community College Students’ Entry into and Completion of Programs of Study,” Community College Research Center Working Paper No. 32 (originally released April 2011), 14. 86 Scott Clayton, Judith and Olga Rodriguez. “Development, Discouragement, or Diversion? New Evidence on the Effects of College Remediation.” NBER Working Paper No. 18328. August, 2012, 29. 87 Strong American Schools. (2008). Diploma to Nowhere, 8. 88 ACT. (2011). The Condition of College & Career Readiness 2011, preface. 89 ACT. (2012). The Condition of College & Career Readiness 2012, preface. 90 ACT. (2012). The Condition of College & Career Readiness 2012, 1. 91 ACT. (2012). The Condition of College & Career Readiness 2012, 4. 92 ACT. (2012). The Condition of College & Career Readiness 2012, 3. 93 The College Board. (2012). The SAT Report on College & Career Readiness: 2012, 21. 94 The College Board. (2012). The SAT Report on College & Career Readiness: 2012, 23. 95 NCES College & Career Tables Library. Table 6. Transfer Status After 6 Years: Percentage of 2003-‐04 beginning students who transferred by 2009 and direction of transfer, by sector of first postsecondary institution: 2004-‐09. (http://nces.ed.gov/datalab/tableslibrary/viewtable.aspx?tableid=8137). 96 NCES. (2011). Community College Student Outcomes: 1994-‐2009, Table 3-‐A. 97 National Student Clearinghouse Research Center. (2012). Transfer and Mobility: A National View of Pre-‐Degree Student Movement in Postsecondary Institutions. Signature Report 2, 19. 98 National Student Clearinghouse Research Center. (2012). Transfer and Mobility: A National View of Pre-‐Degree Student Movement in Postsecondary Institutions. Signature Report 2, 23. 99 NCES (2012). Enrollment in Postsecondary Institutions, Fall 2011; Financial Statistics, Fiscal Year 2011; and Graduation Rates, Selected Cohorts, 2003-‐2008: First Look (Provisional Data). NCES 2012-‐174rev, Table 4, 11. 100 US Department of Education. (2010). Issue Brief: Tracking Students to 200 Percent of Normal Time: Effect on Institutional Graduation Rates, 3. 101 NCES (2012). Enrollment in Postsecondary Institutions, Fall 2011; Financial Statistics, Fiscal Year 2011; and Graduation Rates, Selected Cohorts, 2003-‐2008: First Look (Provisional Data). NCES 2012-‐174rev, Table 4, 11. 102 Complete College America. (2011). Time is the Enemy. 103 NCES. (2011). The Condition of Education: 2011, 274. 104 National Student Clearinghouse Research Center. (2012). Completing College: A National View of Student Attainment Rates. Signature Report 4, 15. 105 National Student Clearinghouse Research Center. (2012). Completing College: A National View of Student Attainment Rates. Signature Report 4, 21. 106 National Student Clearinghouse Research Center. (2012). Completing College: A National View of Student Attainment Rates. Signature Report 4, 33. 107 National Student Clearinghouse Research Center. (2012). Completing College: A National View of Student Attainment Rates. Signature Report 4, 32. 108 American Association of Community Colleges. (2013). Community College Contributions. AACC Policy Brief 2013-‐01PB, 7.

32
109 NCES. (2011). Six-‐Year Attainment, Persistence, Transfer, Retention, and Withdrawal Rates of Students Who Began Postsecondary Education in 2003-‐2004, Table 5.0-‐B. 110 NCES. (2011). Six-‐Year Attainment, Persistence, Transfer, Retention, and Withdrawal Rates of Students Who Began Postsecondary Education in 2003-‐2004, Table 5.1-‐B. 111 NCES. (2011). Six-‐Year Attainment, Persistence, Transfer, Retention, and Withdrawal Rates of Students Who Began Postsecondary Education in 2003-‐2004, Table 3.1-‐B. 112 Adelman, Clifford. (2006). The Toolbox Revisited: Paths to Degree Completion from High School Through College. U.S. Department of Education, Table 18. 113 NCES. (2006). Profile of Undergraduates in US Postsecondary Education Institutions: 2003-‐04. With a Special Analysis of Community College Students, Table 14-‐A. 114 National Student Clearinghouse Research Center. (2012). Completing College: A National View of Student Attainment Rates. Signature Report 4, 32. 115 American Association of Community Colleges. (2012). 2012 Community College Fast Facts, 1. 116 The Institute for College Access & Success. (2009). Quick Facts About Financial Aid and Community College, 1. 117 Education Sector. (2012). Degreeless in Debt: What Happens to Borrowers Who Drop Out, 2. 118 NCES. (2012). The Condition of Education: 2012, 264. 119 The Institute for College Access & Success. (2009). Quick Facts About Financial Aid and Community College, 1-‐2. 120 NCES. (2011). The Condition of Education: 2011, 133. The 2012 edition of The Condition of Education does not provide more recent data on this indicator. 121 The College Board Advocacy & Policy Center. (2011). Trends in Community College Education: Enrollment, Prices, Student Aid, and Debt Levels. Trends in Higher Education Series, 5. 122 NCES. (2011). The Condition of Education: 2011, 212. NCES did not update the data used in the 2011 edition of The Condition of Education in the 2012 version. 123 United States Census Bureau. (2012). “What it’s Worth: Field of Training and Economic Status in 2009,” Current Population Reports, 7. 124 NCES. (2012). Higher Education: Gaps in Access and Persistence Study. NCES 2012-‐046, 228. 125 NCEE. (2013). What Does It Really Mean to Be College and Work Ready? The Mathematics and English Literacy Required of First Year Community College Students. 126 http://nces.ed.gov/das/library/tables_listings/spring2010firstlook.asp. Table 10: “Graduation rates of students at the Title IV institution where the students started as full-‐time, first-‐time students, by control of institution, degree sought, level of institution, degree completed, and time to degree: US cohort years 2001 and 2005;” Table 7: “Graduation Rates at Title IV institutions, by race/ethnicity, level and control of institution, gender, degree sought, and degree completed at the institution where the students started as full-‐time, first-‐time students: United States, cohort years 2003 and 2006.” NCES. (2011). The Condition of Education, 212, 225. NCES (2012). The Condition of Education, , 80, 244. NCES. (2011). Six-‐Year Attainment, Persistence, Transfer, Retention, and Withdrawal Rates of Students Who Began Postsecondary Education in 2003-‐2004, Table 3.0-‐A. Drop out data: 37.4 percent of community college students drop out within six years; 16.7 percent of students at four-‐year institutions do this. In this study, dropouts are defined as “had left first institution, never enrolled at another.” NCES. (2011). Six-‐Year Attainment, Persistence, Transfer, Retention, and Withdrawal Rates of Students Who Began Postsecondary Education in 2003-‐2004, Table 3.0-‐A.