Background: Despite cumulative evidence shows ...
23
Page 1/23 Identication of Key Genes and Competitive Endogenous RNA Network Construction in Osteonecrosis of the Femoral Head by Integrated Bioinformatics Analysis Yang Dinglong The second hospital of Shanxi medical university Chen Shuai the second hospital of Shanxi medical university Chen Yujing the second hospital of Shanxi medical university Wang Beiyang the second hospital of Shanxi medical university Zhang Guohao the second hospital of Shanxi medical university Zhang Zhiqiang ( [email protected] ) The second hospital of Shanxi medical university https://orcid.org/0000-0002-9288-5832 Research article Keywords: Osteonecrosis of the femoral head (ONFH), ceRNA, PLEK, TLR2, TREM1 Posted Date: November 15th, 2021 DOI: https://doi.org/10.21203/rs.3.rs-1050652/v1 License: This work is licensed under a Creative Commons Attribution 4.0 International License. Read Full License
Transcript of Background: Despite cumulative evidence shows ...
Page 1/23
Identi�cation of Key Genes and CompetitiveEndogenous RNA Network Construction inOsteonecrosis of the Femoral Head by IntegratedBioinformatics AnalysisYang Dinglong
The second hospital of Shanxi medical universityChen Shuai
the second hospital of Shanxi medical universityChen Yujing
the second hospital of Shanxi medical universityWang Beiyang
the second hospital of Shanxi medical universityZhang Guohao
the second hospital of Shanxi medical universityZhang Zhiqiang ( [email protected] )
The second hospital of Shanxi medical university https://orcid.org/0000-0002-9288-5832
Research article
Keywords: Osteonecrosis of the femoral head (ONFH), ceRNA, PLEK, TLR2, TREM1
Posted Date: November 15th, 2021
DOI: https://doi.org/10.21203/rs.3.rs-1050652/v1
License: This work is licensed under a Creative Commons Attribution 4.0 International License. Read Full License

Page 2/23
AbstractBackground: Despite cumulative evidence shows osteonecrosis of the femoral head (ONFH) could resultin the progressive collapse of the femoral head. The pathogenesis of ONFH remains unclear. Early ONFHis di�cult to diagnose due to the lack of effective biomarkers.
Method: In Gene Expression Omnibus (GEO) database, we searched the Microarray datasets for serum(GSE123568) in ONFH and normal controls to identify differentially expressed genes (DEGs) by Rsoftware. The enrichment analyses were performed to enrich pathways of DEGs. Protein–proteininteraction (PPI), miRNA-mRNA co-expression, ceRNA networks were constructed using Cytoscape toidentity top15 hub genes, target miRNAs of hub genes and potential regulatory pathways. Furthermore,hub genes validated in GSE74089 with high diagnostic value for ONFH were selected as key genes. TheHuman Protein Atlas (HPA) and Bgee Database were used to �nd out the subcellular and tissuedistribution of key genes.
Results: A total of 568 DEGs were identi�ed between 30 ONFH samples and 10 normal controls. KyotoEncyclopedia of Genes and Genomes (KEGG) and Gene Ontology (GO) enrichment analysis showed thatDEGs are mostly enriched in innate immune responses, thrombosis and signal transduction. Fifteen hubgenes were identi�ed by PPI network using Cytoscape. The 15 hub genes were almost all positivelycorrelated with each other. The expression of PLEK (P 0.001), TLR2 (P 0.05), and TREM1 (P 0.001) werevalidated in dataset GSE74089 and they had high diagnostic value (AUC 0.8) for ONFH. MALAT1-miR-146b-5p-TLR2, MALAT1-miR-664b-3p-PLEK, NORAD-miR-106b-5p-TLR2, and MSMO1-miR-106b-5p-TLR2might be potential RNA regulatory pathways in the disease progression of ONFH. PLEK mainly expressedin nucleus, TREM1 in dictyosome, and TLR2 in nucleoplasm and mitochondria.
Conclusions: In this study, we found that PLEK, TLR2, and TREM1 might be potential biomarkers indiagnostic and play a vital role in the progression of ONFH.
IntroductionOsteonecrosis of the femoral head (ONFH) is a potentially debilitating disease that results in theprogressive collapse of the femoral head and subsequent degenerative arthritis (1). ONFH is a relativelycommon disorder that most frequently occurs in men aged 30-50 years with several major risk factors,including trauma, long-term or high-dose use of glucocorticoids, and long-term heavily intake of alcohol.In the United States, more than 20,000 new cases of femoral head necrosis are diagnosed each year (2).From 1992 through 2008 in the United States, the total number of surgeries for ONFH increased from3570 to 6400 per year, nearly doubling over a 16-year time period (3). Among 8.12 million patients havebeen diagnosed with ONFH as of 2017 in China, and the average annual number of new cases was14,103 in Korea (4). However, the pathogenesis of ONFH is still unclear (5).
As a subtype of non-traumatic ONFH, steroid-induced ONFH (SONFH) is related to the elevation ofpressure in bone because of increasing lipogenesis and hyperplasia of adipocytes in bone marrow.
Page 3/23
Increased pressure could decelerate the blood �ow in femoral head eventually causing avascularosteonecrosis (6). Bone marrow edema, decreased hematopoietic cells, adipocyte hypertrophy and amarked increase in empty bone traps in the subchondral region of the femoral head suggests that bloodhyperviscosity may play an important role in the pathogenesis of hormonal ischemic necrosis of thefemoral head (7). Because of nonspeci�c symptom in the early period, patients with SONFH usually missthe best time to receive nonsurgical therapy, early diagnosis and treatment of SONFH are crucial (8).Many ONFH patients with nonspeci�c symptoms often lead to late detection. Late stage of ONFH willseriously affect the life quality of patients for its pain or other reasons. However, there is no effective drugto treat ONFH at an early stage. Until now, effective biomarkers for diagnosis of ONFH remains lacking.The etiology of traumatic ONFH has been speci�c, the molecular mechanisms and pathogenesisunderlying non-traumatic ONFH remains unclear, which is the basics for the molecular therapy of ONFH.
Currently, microarray and transcriptomic analyses have been widely used in various diseases, including avariety of tumors and ONFH (9–11), to identify new biomarkers to improve treatment and diagnosis. Inaddition, competitive endogenous RNA (ceRNA) networks can elucidate a new mechanism for promotingthe development of the disease in a transcriptional regulatory network (12). However, transcriptionalregulatory network for ONFH remains lacking. Through the combination of microarray and bioinformaticsanalyses, it is possible to explore potential vital genes and pathway networks that are closely related tothe development of diseases.
In this study, based on Gene Expression Omnibus (GEO) database, we �rst identi�ed differentiallyexpressed genes (DEGs) by screening criteria. Then Gene Ontology (GO) and Kyoto Encyclopedia ofGenes and Genomes (KEGG) enrichment analyses were performed. A protein–protein interaction (PPI)network was constructed to identify clustering modules and hub genes associated with ONFH. Further,target miRNAs of selected hub genes were predicted, and co-expression networks were constructed.Subsequently, we screened the selected hub genes using another GEO dataset and receiver operatingcharacteristic (ROC) curve. Finally, we constructed ceRNA networks based on the predictions of long non-coding RNAs (lncRNAs) and circular RNAs (circRNAs) (Fig. 1).
Methods
GEO data acquisitonWe used GEO database to obtain microarray data for ONFH patients and normal controls. Screeningcriteria: (1) Homo sapiens Expression Pro�ing by array; (2) phripheral secrum, hip cartilage or femoralhead tissues of ONFH patients and normal controls; (3) more than �ve samples were included in eachdataset; (4) complete information about samples in each dataset. Finally, the GPL15207 datasetGSE123568, which included phripheral securm samples in 30 ONFH patients and 10 normal controls, wasselected as test sets. The GPL13497 dataset GSE74089 obtaining 4 ONFH and 4 non-ONFH hip cartilagesamples was selected as validation set.

Page 4/23
Data normalization and identi�cation of DEGsThe original �les were downloaded from the GEO database, and pre-processed by using R software(version 3.6.3) GEO query package (13), and the probes that targeted multiple molecules were screened.The box diagrams were used to show the degree of inter-sample normalization. The limma package wasused to analyse the differentially expressed genes. The screening criteria were |log2 (fold change) |>1 andadjusted p value (Q value) <0.05. To better visualize these DEGs, we used R software Complex Heatmappackage to make heatmaps and ggplot2 package to make volcano plots.
Enrichment analysisGene Set Enrichment Analysis (GSEA) was used to analyse the distribution trends of the DEGs in aprede�ned set to determine their contribution to phenotypes. R software (version 3.6.3) clusterPro�lepackage (14) was used for GSEA, org.Hs.eg.db package for ID translation and GOplot package for Z-score calculation (15). And the histogram, bubble diagram, ring diagram and chordal graph were createdto visualize these enrichment results. The enriched pathways or functions with false discovery rate (FDR)q-value 0.25, adjusted P-value 0.05, normalized enrichment score (|NES|) 1 were selected.
Construction of the PPI networkThe online tool STRING (https://string-db.org/) with a �lter condition (combined score 0.4) was used toconstructed PPI network based on all DEGs. Next, the PPI network was generated in Cytoscape software(v3.8.2) using the downloaded interaction information. Minimal Common Oncology Data Elements(MCODE) was used to obtain cluster scores and identify important gene clusters. CytoHubba was used torecognize the hub genes which were located toward the network center (16). We used namely Degree, �vealgorithms, Maximum Neighborhood Component (MNC), Maximal Clique Centrality (MCC), ClusteringCoefcient, and Density of Maximum Neighborhood Component (DMNC) to calculate the top 15 hubgenes.
Construction of the miRNA-mRNA and protein-chemicalinteraction networksWe used NetworkAnalyst database (https://www.networkanalyst.ca/) to predict target miRNAs andchemicals of hub genes, and constructed the mRNA-miRNA co-expressed, protein-chemical interactionnetworks based on the interaction information using Cytoscape.
Construction of ceRNA networks

Page 5/23
StarBase (version 3.0) (http://starbase.sysu.edu.cn/index.php) was used to predict lncRNAs andcircRNAs that interacted with the target miRNAs (�lter criteria: clip data: high stringency, =3; degradomedata: with or without degradome data). Finally, we used Cytoscape to constructed the ceRNA networkbased on the interactions among mRNAs, lncRNAs, miRNAs, and circRNAs.
Tissue and intracellular distributionWe used the Human Protein Atlas (HPA) Database (https://www.proteinatlas.org/) to �nd out thesubcellular distribution of key genes and their expression in bone marrow, blood and muscle tissues(normalized expression, NX). The gene expression scores of key genes in bone marrow, blood, trabecularbone tissue, layer of synovial tissue, skeletal muscle tissue, and cartilage tissue were obtained from theBgee database (https://bgee.org).
Statistics analysisThe R software (version3.6.2) was used to perform stastical analysis which was visualized by usingggplot2 package. The T test was used to compare the difference of hub genes between two groups. TheR software pROC package was used for ROC analysis and ggplot2 package was used to draw ROC curve.
Ethics statementAll analyses were based on the public GEO database, we did not need the informed consent of thepatients, thus no ethical approval and patient consent are required.
Results
Identifcation of DEGsThe dataset GSE123568 including 30 ONFH samples and 10 normal control samples was used for theanalysis and identi�cation of DEGs. Comparing with the genes in the normal control samples, weidenti�ed a total of 568 DEGs in the ONFH samples, including 221 down-regulated and 347 up-regulatedgenes. Next, a heat map and volcano plot analysis were used to visualize these DEGs, as shown in Fig.2a-b. The median of each sample was basically on one horizontal line, so the degree of normalizationamong the samples was great (Fig. 2c).
Enrichment analysisFunctional and pathway enrichment analysis was performed using the R software clusterPro�lerPackage. The screening criteria for signi�cant gene sets were p<0.05 and False discovery rate (FDR)

Page 6/23
<0.25. We observed that most of the enriched gene sets were associated with the innate immuneresponses, thrombosis and signal transduction (Table 1). Next, GO, KEGG pathway and Reactomeenrichment analyses were performed for DEGs using the R software clusterPro�ler package. We willassess the DEGs enrichment pathways from multiple perspectives. Based on the Q value < 0.05, weselected the top two, three, one and four biological processes (BP), cellular components (CC), molecularfunctions (MF), and KEGG pathways and displayed them in chordal curve, circle diagram, bubble plots,and histogram (Fig. 3a-e). The GO enrichment analysis of DEGs also shows that ONFH samples have astronger neutrophil response than control samples, including neutrophil activation, neutrophil activationinvolved in immune response, neutrophil mediated immunity, and neutrophil degranulation. KEGGpathway enrichment analysis showed that DEGs were enriched for osteoclast differentiation,leishmaniasis, the interaction of viral proteins with cytokines and cytokine receptors, and chemokinesignaling pathways. Particularly, nine pathways related to immunity and thrombosis were visualized inFig. 3f.
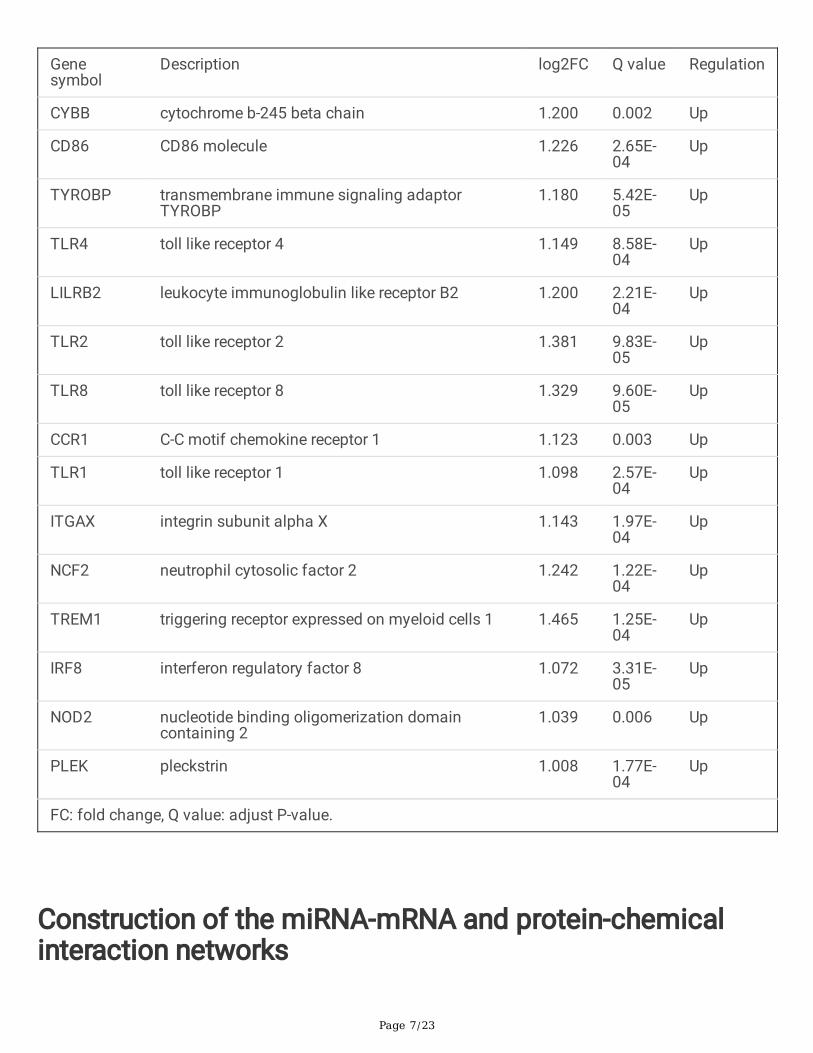
PPI network construction, MCODE cluster modules and hubgene identifcationThe interaction network between proteins encoded by DEGs was constructed by STRING, consisting of174 nodes and 1,510 edges, and visualized by Cytoscape (Fig. 4a). In this network, we identi�ed fourmodules using MCODE plugin based on �ltering criteria, as shown in Fig. 4b-e. Cluster 1 has the highestcluster score (24 nodes and 133 edges), followed by cluster 2 (11 nodes and 53 edges), cluster 3 (18nodes and 55 edges), and cluster 4 (11 nodes and 15 edges). Fifteen hub genes such as cytochrome b-245 beta chain (CYBB) and CD86 molecule (CD86) were selected by intersecting the results of �vealgorithms of cytohubba, including MCC, DMNC, degree, MNC, and clustering coe�cients as showed inTable 2 (16). The �fteen hub genes may play an imprtant role in the pathogenesis of ONFH. Finally, weanalysed the correlation among the �fteen hub genes by using ggplot2 R package. We found that mostgenes were positively correlated with each others (Fig. 4f).
Table 2
15 hub genes identifed by cytoHubba in PPI network.
Page 7/23
Genesymbol
Description log2FC Q value Regulation
CYBB cytochrome b-245 beta chain 1.200 0.002 Up
CD86 CD86 molecule 1.226 2.65E-04
Up
TYROBP transmembrane immune signaling adaptorTYROBP
1.180 5.42E-05
Up
TLR4 toll like receptor 4 1.149 8.58E-04
Up
LILRB2 leukocyte immunoglobulin like receptor B2 1.200 2.21E-04
Up
TLR2 toll like receptor 2 1.381 9.83E-05
Up
TLR8 toll like receptor 8 1.329 9.60E-05
Up
CCR1 C-C motif chemokine receptor 1 1.123 0.003 Up
TLR1 toll like receptor 1 1.098 2.57E-04
Up
ITGAX integrin subunit alpha X 1.143 1.97E-04
Up
NCF2 neutrophil cytosolic factor 2 1.242 1.22E-04
Up
TREM1 triggering receptor expressed on myeloid cells 1 1.465 1.25E-04
Up
IRF8 interferon regulatory factor 8 1.072 3.31E-05
Up
NOD2 nucleotide binding oligomerization domaincontaining 2
1.039 0.006 Up
PLEK pleckstrin 1.008 1.77E-04
Up
FC: fold change, Q value: adjust P-value.
Construction of the miRNA-mRNA and protein-chemicalinteraction networks

Page 8/23
We used the NetworkAnalyst database to predict the target miRNAs and chemicals of hub genes. Weobtained 81 target miRNAs for 7 central genes (Fig. 5a) and 8 target chemicals for 2 central genes (Fig.5b).
ROC curve of 15 hub genes in the peripheral secrumsamples (GSE123568)The pROC and ggplot2 R package were used to analyse and draw the ROC curve of 15 hub genes in theperipheral secrum samples. Finally, the hub genes with hige diagnostic value (area under the curve, AUC >0.8) were selected as key genes for further analysis, including CD86 (AUC=0.847), IRF8 (AUC=0.877),ITGAX (AUC=0.847), LILRB2 (AUC=0.880), NCF2 (AUC=0.887), PLEK (AUC=0.863), TLR1 (AUC=0.847),TLR2 (AUC=0.860), TLR4 (AUC=0.837), TREM1 (AUC=0.863), and TYROBP (AUC=0.873) (Fig. 6). Hence,we hypothesized they were the biomarkers for the diagnosis of ONFH based on our present samples.
The expression of 15 hub genes in the hip cartilagesamples (GSE74089)We analysed the expression of 15 hub genes in the hip cartilage samples, and identitied 4 key genesNOD2 (P value: 0.002 in GSE123568, 0.007 in GSE 74089), PLEK (P value: <0.001 in GSE123568, 0.001 inGSE 74089), TLR2 (P value: <0.001 in GSE123568, 0.038 in GSE 74089), TREM1 (P value: <0.001 inGSE123568, <0.001 in GSE 74089). As showed in Fig. 7a-c, the expression of four key genes were allincreased in the peripheral secrum samples (GSE123568) and hip cartilage samples (GSE74089). Finally,three hub genes (PLEK, TREM1, TLR2) whose AUC (ROC) 0.8 and expression trend was veri�ed inGSE74089 was selected as key genes in the procession of ONFH.
Tissue and intracellular distribution of PLEK, TREM1 andTLR2We compared the gene expression score of three key genes in Bgee database and the gene expressionlevel of three key genes in HPA database. We found that, in gene expression level, PLEK was highlyexpressed in bone marrow and lowly in cartilage, TLR2 and TREM1 were highly expressed in blood andlowly in skeletal muscle tissue (Fig. 8a). In gene expression scores, PLEK was highly expressed in bonemarrow and lowly in muscle tissues, TLR2 and TREM1 were highly expressed in blood and lowly inmuscle tissue (Fig. 8b). Finally, we explored the intracellular distribution of key genes, the results showedthat PLEK mainly expressed in nucleus, TREM1 in dictyosome, and TLR2 in nucleoplasm andmitochondria (Fig. 8c).

Page 9/23
Prediction of target ncRNAs and construction of ceRNAnetworksIt is well known that miRNAs induce gene silencing and down-regulate the gene expression by bindingmRNAs. However, circRNA and lncRNA can up-regulate the expression of gene by binding miRNAs andcompeting with mRNAs. Such interactions between mRNAs, miRNAs, circRNAs, and lncRNAs are knownas ceRNA networks (12). We selected ncRNAs present in most miRNA prediction results as our predictedcircRNAs and lncRNAs. Finally, we obtained 13 target lncRNAs and 27 target circRNAs for PLEK 4 targetmiRNAs; and 13 target circRNAs and 19 target lncRNAs for TLR2 8 target miRNAs. But the predictedmiRNAs of TREM1 was absent in NetworkAnalyst database. So only two ceRNA networks wereconstructed by Cytoscape based on the prediction results in the end (Fig. 9a-b). Subsequently, weconducted a literature search and selected two reproted down-regulated lncRNAs and one down-regulatedmiRNA in ONFH, one up-regulated miRNA in senescence of vascular smooth muscle cells, one down-regulated miRNA in processe of osteoblast differentiation, and one circRNA that presented in mostmiRNA prediction results of TLR2. Finally, we proposed four potential RNA regulatory pathways of ONFH:MALAT1 (metastasis associated lung adenocarcinoma transcript 1)-miR-146b-5p-TLR2, MALAT1- miR-664b-3p-PLEK, NORAD (non-coding RNA activated by DNA damage )-miR-106b-5p-TLR2, andMSMO1(methylsterol monooxygenase 1)-miR-106b-5p-TLR2 (Fig. 9c).
DiscussionAlthough the etiology of traumatic ONFH has been speci�c, the pathogenesis underlying non-traumaticONFH remains unclear. The diagnosis and treatment for early ONFH can effectively delay the process andsigni�cantly improve the life quality of ONFH patients. However, it is di�cult to diagnose early ONFHowning to the lack of biomarkers, and effective drugs for ONFH are still lacking. This work explored themechanisms of ONFH disease development at the transcriptome level and potential biomarkers for theearly diagnosis and treatment of ONFH.
Immune disorder is closely related to the development of ONFH. For example, previous studies havefound that IL-1α and TNF-α promote the development of ONFH, and IL-23 and IL-33 are vital for thediagnosis of ONFH (17–20). In our study, we screened out 568 DEGs by comparing gene expression ofserum between ONFH patients and normal controls. GO enrichment analysis of DEGs revealed severalimmune-related pathways, such as nuetrophil degranulation, nuetrophil mediated immunity, nuetrophilactivation involed in immune response, nuetrophil activation, signaling by interleukins, and class I MHCmediated antigen processing presentation. Furthermore, signaling pathways related to thrombosis andosteoclast processing are also involved, such as osteoclast differentiation and platelet activationsignaling and aggregation. The GO enrichment results indicated these DEGs and pathways may berelated to the development of ONFH. For example, Po´sa´n found that platelet activation was signi�cantlyhigher in patients with ONFH compared with that in healthy controls (21).
Page 10/23
In our study, we found that the expression of NOD2, PLEK, TLR2 and TREM1 were up-regulated in ONFHpatients (serum and hip cartilage), and the AUCs of PLEK (AUC=0.863), TLR2 (AUC=0.860) and TREM1(AUC=0.863) are more than 0.8. Therefore, we hypothesize that PLEK, TLR2 and TREM1 may bebiomarkers for early diagnosis of ONFH and play a signifcant role in the pathogenesis of ONFH based onavailable samples. According to the Bgee and HPA online database, we found that the expression ofPLEK, TLR2, and TREM1 in bone marrow and blood was higher than that in soft tissues such as muscletissues. Furthermore, we constructed ceRNA networks and an mRNA-miRNA co-expression network toelucidate the pathogenesis of ONFH at the transcriptome level.
PLEK, is also called pleckstrin, is a protein kinase C (PKC) substrate induced by macrophages to express.It is known to play an important role in the secretion and activation of the pro-in�ammatory cytokines IL-1β and TNF-α (22, 23). Studies have indicate that PLEK is signi�cantly overexpressed in cardiovasculardisease, and is a crucial protein for platelet aggregation, activation, and degranulation (24–26).According to BioGPS, PLEK is mainly expressed in nucleus. Although there are not studies that elucidatedthe function of PLEK in ONFH, our study found that PLEK was signi�cantly up-regulated in serum and hipcartilage of ONFH patients, and has a high diagnostic value in OFNH (AUC=0.863).
TLR2, is also known as toll like receptor 2, plays a fundamental role in pathogen recognition andactivation of innate immunity and has been implicated in the pathogenesis of several autoimmunediseases according to the NCBI gene database. According to BioGPS, TLP2 is highly expressed in blood.At present, TLR2 has not been reported in ONFH-related studies. It is reported that the absence of TLR2 onbone marrow cells supports angiogenic processes and TLR2 promotes the atherosclerosis process (27,28). In our study, TLR2 was up-regulated in serum and hip cartilage of ONFH patients compared withnormal controls. It was predicted that miR-146a-5p and miR-106b-5p targeted at TLR2. MiR-146a-5p isdown-regualated in ONFH and miR-106b-5p supresse the process of osteogenesis (29, 30). These resultsall refect that TLR2 may play an important role in the osteogenesis and the disease progression of ONFH.
TREM1, is also called triggering receptor expressed on myeloid cells 1, encodes a receptor belonging tothe Ig superfamily that is expressed on myeloid cells. TREM1 also ampli�es neutrophil and monocyte-mediated in�ammatory responses (31). Similar to PLEK, TERM1 is also highly expressed in blood. AndTREM1 is specifcally expressed in dictyosome composed of many �attened vesicles whose mainfunction is secretion (32). A study by Yonatan Edel et al. reported that plasma TREM1 levels aresigni�cantly increased in patients with thrombotic primary antiphospholipid syndrome (33). It is knownthat intravascular thrombotic is possible pathogenesis of ONFH (34). So TREM1 may play an importantrole in the pathogenesis of ONFH. Besides, it also found that TREM1 promotes atherosclerosis andthrombin generation (35, 36). In our study, we identifed that TREM1 was signi�cantly up-regulated inONFH and has a high diagnostic value in ONFH (AUC=0.863). We considered TREM1 as a novel andeffective biomarker for the diagnosis and treatment of ONFH.
Furthermore, the target lncRNAs and circRNAs of target miRNAs were predictd for PLEK and TLR2, andceRNA networks were constructed with Cytoscape. The ceRNA networks revealed the potential
Page 11/23
pathogenesis of ONFH at the transcriptome level. Then we conducted a literature research to selectpotential miRNAs, lncRNAs, and circRNAs. Among the miRNAs, we selected down-regulated miRNA inONFH: miRNA-146a-5p (in osteoblast), up-regulated miRNA in senescent vascular smooth muscle cells:miR-664b-3p, and miRNA suppressing osteogenesis: miR-106b-5p (29, 30, 37). Among the lncRNAs, weselected down-regulated lncRNAs in ONFH: MALAT1 (in serum), NORAD (in bone marrow mesenchymlstem cell) (38, 39). Therefore, we proposed three potential RNA regulatory pathways in the process ofONFH: MALAT1-miR-146b-5p-TLR2/ MALAT1-miR-664b-3p-PLEK/ NORAD-miR-106b-5p-TLR2. Finally, weselected one circRNA that presented in most miRNA prediction results of TLR2: MSMO1, and proposed apotential RNA regulatory pathway: MSMO1-miR-106b-5p-TLR2.
As far as I know, this is a novel study to explore effective biomarkers in the diagnosis and treatment ofONFH. Our study provides insights into the pathogenesis of ONFH. Of course, the sample size used foranalysis in our study was relatively small and the prediction of ncRNA was just based on onlinedatabase. Therefore, we have planed further study to increase sample size and conduct experiment toverify our views.
ConclusionOur work identifed three crucial genes, PLEK, TLR2, and TREM1, as potential biomarkers for the diagnosisand treatment of ONFH and provided insight into the pathogenesis of ONFH at the transcriptome level. Inaddition, we propose that MALAT1-miR-146b-5p-TLR2, MALAT1- miR-664b-3p-PLEK, NORAD-miR-106b-5p-TLR2, and MSMO1-miR-106b-5p-TLR2 are potential RNA regulatory pathways in the diseaseprogression of ONFH.
AbbreviationsDEGs: differentially expressed genes; PPI: protein–protein interaction; ONFH: osteonecrosis of thefemoral head; SONFH: steroid-induced ONFH; ceRNA: competitive endogenous RNA; GEO: GeneExpression Omnibus; GO: Gene Ontology; KEGG: Kyoto Encyclopedia of Genes and Genomes; HPA:Human Protein Atlas; ROC: receiver operating characteristic; GSEA: Gene Set Enrichment Analysis; NES:normalized enrichment score; FDR: false discovery rate; MCODE: Minimal Common Oncology DataElements; MNC: Maximum Neighborhood Component; MCC: Maximal Clique Centrality; lncRNA: long non-coding RNA; circRNA: circular RNA; nx: normalized expression; BP: biological processes; CC: cellularcomponents; MF: molecular functions; AUC: area under the curve; PKC: protein kinase C; MALAT1:metastasis associated lung adenocarcinoma transcript 1; NORAD: non-coding RNA activated by DNAdamage; MSMO1: methylsterol monooxygenase 1; CYBB: cytochrome b-245 beta chain; CD86: CD86molecule
Declarations
Acknowledgements

Page 12/23
Not applicable.
Authors’ contributionsConception and design: D Yang, Z Zhang; Administrative support: Z Zhang; Provision of study materials:D Yang, Z Zhang; Collection and assembly of data: D Yang, S Chen, Y Chen; Data analysis andinterpretation: D Yang, S Chen, Y Chen, B Wang, G Zhang; Manuscript writing: All authors; Final approvalof manuscript: All authors.
FundingNone.
Availability of data and materialsWe state that the data will not be shared since all the raw data are present in the article.
Ethics approval and consent to participateNot applicable.
Consent for publicationNot applicable.
Competing interestsThe authors declare that they have no competing interests.
Author details1Department of Orthopedics, the Second Hospital of Shanxi Medical University, No.382 Wuyi RoadTaiyuan, China, 030000; 2School of Public Health, Xi'an Jiaotong University, No.76 Yanta xi Road, Xi’an,China, 710000.
References

Page 13/23
1. Tian L, Sun S, Li W, et al. Down-regulated microRNA-141 facilitates osteoblast activity and inhibitsosteoclast activity to ameliorate osteonecrosis of the femoral head via up-regulating TGF-beta2. CellCycle 2020;19(7):772–86.
2. Mont MA, Hungerford DS. Non-traumatic avascular necrosis of the femoral head. J Bone Joint SurgAm 1995;77(3):459–74.
3. Maruyama M, Nabeshima A, Pan CC, et al. The effects of a functionally-graded scaffold and bonemarrow-derived mononuclear cells on steroid-induced femoral head osteonecrosis. Biomaterials2018;187:39–46.
4. Hao Y, Guo H, Xu Z, et al. Meta-analysis of the potential role of extracorporeal shockwave therapy inosteonecrosis of the femoral head. J Orthop Surg Res 2018;13(1):166.
5. Durbin RP. Letter: Acid secretion by gastric mucous membrane. Am J Physiol 1975;229(6):1726.
�. Tan G, Kang PD, Pei FX. Glucocorticoids affect the metabolism of bone marrow stromal cells andlead to osteonecrosis of the femoral head: a review. Chin Med J (Engl) 2012;125(1):134–9.
7. Wang A, Ren M, Wang J. The pathogenesis of steroid-induced osteonecrosis of the femoral head: Asystematic review of the literature. Gene 2018;671:103–9.
�. Li G, Liu H, Zhang X, et al. The protective effects of microRNA-26a in steroid-induced osteonecrosisof the femoral head by repressing EZH2. Cell Cycle 2020;19(5):551–66.
9. Demircioglu D, Cukuroglu E, Kindermans M, et al. A Pan-cancer Transcriptome Analysis RevealsPervasive Regulation through Alternative Promoters. Cell 2019;178(6):1465-77 e17.
10. Kaczkowski B, Tanaka Y, Kawaji H, et al. Transcriptome Analysis of Recurrently Deregulated Genesacross Multiple Cancers Identi�es New Pan-Cancer Biomarkers. Cancer Res 2016;76(2):216–26.
11. Han N, Li Z. Non-coding RNA Identi�cation in Osteonecrosis of the Femoral Head Using CompetitiveEndogenous RNA Network Analysis. Orthop Surg 2021;13(3):1067–76.
12. Salmena L, Poliseno L, Tay Y, et al. A ceRNA hypothesis: the Rosetta Stone of a hidden RNAlanguage? Cell 2011;146(3):353–8.
13. Davis S, Meltzer PS. GEOquery: a bridge between the Gene Expression Omnibus (GEO) andBioConductor. Bioinformatics 2007;23(14):1846–7.
14. Yu G, Wang LG, Han Y, et al. clusterPro�ler: an R package for comparing biological themes amonggene clusters. OMICS 2012;16(5):284–7.
15. Walter W, Sanchez-Cabo F, Ricote M. GOplot: an R package for visually combining expression datawith functional analysis. Bioinformatics 2015;31(17):2912–4.
1�. Chin CH, Chen SH, Wu HH, et al. cytoHubba: identifying hub objects and sub-networks from complexinteractome. BMC Syst Biol 2014;8 Suppl 4:S11.
17. El-Tahan RR, Ghoneim AM, El-Mashad N. TNF-alpha gene polymorphisms and expression.Springerplus 2016;5(1):1508.
1�. Oppmann B, Lesley R, Blom B, et al. Novel p19 protein engages IL-12p40 to form a cytokine, IL-23,with biological activities similar as well as distinct from IL-12. Immunity 2000;13(5):715–25.

Page 14/23
19. Parham C, Chirica M, Timans J, et al. A receptor for the heterodimeric cytokine IL-23 is composed ofIL-12Rbeta1 and a novel cytokine receptor subunit, IL-23R. J Immunol 2002;168(11):5699–708.
20. Samara S, Kollia P, Dailiana Z, et al. Predictive role of cytokine gene polymorphisms for thedevelopment of femoral head osteonecrosis. Dis Markers 2012;33(4):215–21.
21. Posan E, Harsfalvi J, Szepesi K, et al. Increased platelet activation and decreased �brinolysis in thepathogenesis of aseptic necrosis of the femoral head. Platelets 1998;9(3-4):233–5.
22. Ding Y, Kantarci A, Badwey JA, et al. Phosphorylation of pleckstrin increases proin�ammatorycytokine secretion by mononuclear phagocytes in diabetes mellitus. J Immunol 2007;179(1):647–54.
23. Hasturk H, Kantarci A, Van Dyke TE. Oral in�ammatory diseases and systemic in�ammation: role ofthe macrophage. Front Immunol 2012;3:118.
24. Lundmark A, Davanian H, Bage T, et al. Transcriptome analysis reveals mucin 4 to be highlyassociated with periodontitis and identi�es pleckstrin as a link to systemic diseases. Sci Rep2015;5:18475.
25. Abrams CS, Zhao W, Belmonte E, et al. Protein kinase C regulates pleckstrin by phosphorylation ofsites adjacent to the N-terminal pleckstrin homology domain. J Biol Chem 1995;270(40):23317–21.
2�. Frobel J, Cadeddu RP, Hartwig S, et al. Platelet proteome analysis reveals integrin-dependentaggregation defects in patients with myelodysplastic syndromes. Mol Cell Proteomics2013;12(5):1272–80.
27. Wagner NM, Bierhansl L, Butschkau A, et al. TLR2-de�ciency of cKit+ bone marrow cells isassociated with augmented potency to stimulate angiogenic processes. Int J Clin Exp Pathol2013;6(12):2813–23.
2�. Dunzendorfer S, Lee HK, Tobias PS. Flow-dependent regulation of endothelial Toll-like receptor 2expression through inhibition of SP1 activity. Circ Res 2004;95(7):684–91.
29. Li P, Sun N, Zeng J, et al. Differential expression of miR-672-5p and miR-146a-5p in osteoblasts inrats after steroid intervention. Gene 2016;591(1):69–73.
30. Fang T, Wu Q, Zhou L, et al. miR-106b-5p and miR-17-5p suppress osteogenic differentiation bytargeting Smad5 and inhibit bone formation. Exp Cell Res 2016;347(1):74–82.
31. Gaudet P, Livstone MS, Lewis SE, et al. Phylogenetic-based propagation of functional annotationswithin the Gene Ontology consortium. Brief Bioinform 2011;12(5):449–62.
32. Liu J, Huang Y, Li T, et al. The role of the Golgi apparatus in disease (Review). Int J Mol Med2021;47(4).
33. Edel Y, Kliminski V, Pokroy-Shapira E, et al. Elevated plasma level of soluble triggering receptorexpressed on myeloid cells-1 is associated with in�ammation activity and is a potential biomarker ofthrombosis in primary antiphospholipid syndrome. Arthritis Res Ther 2019;21(1):10.
34. Xu J, Gong H, Lu S, et al. Animal models of steroid-induced osteonecrosis of the femoral head-acomprehensive research review up to 2018. Int Orthop 2018;42(7):1729–37.

Page 15/23
35. Di Pillo E, Carrasco K, Brustolin B, et al. Inhibition of triggering receptor expressed on myeloid cells-1impairs thrombin generation. J Thromb Haemost 2020;18(2):454–62.
3�. Joffre J, Potteaux S, Zeboudj L, et al. Genetic and Pharmacological Inhibition of TREM-1 Limits theDevelopment of Experimental Atherosclerosis. J Am Coll Cardiol 2016;68(25):2776–93.
37. Nguyen DDN, Zain SM, Kamarulzaman MH, et al. Intracellular and exosomal microRNAome pro�lingof human vascular smooth muscle cells during replicative senescence. Am J Physiol Heart CircPhysiol 2021;321(4):H770-H83.
3�. Jin Y, Zhu HX, Wei BF. Reduced serum and local LncRNA MALAT1 expressions are linked withdisease severity in patients with non-traumatic osteonecrosis of the femoral head. Technol HealthCare 2021;29(3):479–88.
39. Fu D, Yang S, Lu J, et al. LncRNA NORAD promotes bone marrow stem cell differentiation andproliferation by targeting miR-26a-5p in steroid-induced osteonecrosis of the femoral head. Stem CellRes Ther 2021;12(1):18.
TableDue to technical limitations, table 1 is only available as a download in the Supplemental Files section.
Figures
Figure 1

Page 16/23
The �ow chart of the whole study.
Figure 2
Identi�cation of DEGs. (a) Heatmap plot of DEGs between the ONFH samples and normal controlsamples. (b) Volcano plot of DEGs between the ONFH samples and normal control samples. The redrepresents up-regulated genes and blue represents down-regulated genes. (c) The box diagram of ONFHsamples and normal control samples for inter-sample normalization. The red represents the ONFHsamples and blue represents normal control samples. DEGs, differentially expressed genes.

Page 17/23
Figure 3
KEGG, GO pathway, and Reactome enrichment analyses of DEGs. (a) The chord plot showing the top twoBP, CC, MF, and KEGG pathways. (b) The circle diagram showing the top three BP, CC, MF, and KEGGpathways. (c) The circle diagram showing the top three BP, CC, MF, and KEGG pathways. (d) Theannotation of KEGG and GO pathways. (e) The bubble plots showing the top one BP, CC, MF, and KEGGpathways. (f) The mountain plot showing nine pathways related to immunity and thrombosis. BP,

Page 18/23
biological processes; CC, cellular components; MF, molecular functions; GO, Gene Ontology; KEGG, KyotoEncyclopedia of Genes and Genomes; DEGs, differentially expressed genes.
Figure 4
PPI network of DEGs constructed by cytoscape, four cluster modules extracted by MCODE, andcorrelation between hub genes with each other. Red, orange and yellow ellipses represent hub genes. (a)PPI network of DEGs (174 nodes and 1,510 edges). (B) Cluster1 (24 nodes and 133 edges) (b) Cluster2(11 nodes and 53 edges) (c) Cluster 3 (18 nodes and 55 edges) (d) Cluster 4 (11 nodes and 15 edges). (e)

Page 19/23
The correlation between hub genes with each other. PPI, protein- protein interaction; DEGs, differentiallyexpressed genes; MCODE, Minimal Common Oncology Data Elements.
Figure 5
The mRNA-miRNA co-expressed and protein-chemical interaction networks constructed by Cytoscape. (a)The mRNA-miRNA co-expressed network including 81 target miRNAs for 7 hub genes. (b) The protein-chemical interaction network including 8 target chemicals for 2 hub genes.

Page 20/23
Figure 6
ROC curve of 15 hub genes in ONFH samples (GSE123568). The hub genes whose AUC was more than0.8 were selected for further analysis. ROC, receiver operating characteristic; AUC, area under the curve.

Page 21/23
Figure 7
The expression of hub genes in peripheral serum (GSE123568) and hip cartilage (GSE74089). (a) Theexpression of NOD2, PLEK, TLR2, and TREM1 was up-regulated in peripheral serum and hip cartilage. (b)The expression of 15 hub genes in hip cartilage visualized as circular heat map. (c) The expression ofNOD2, PLEK, TLR2, and TREM1 in GSE123568 and GSE74089 datasets visualized as histogram. NC,normal controls. *:P 0.05, **P 0.01, ***P 0.001.

Page 22/23
Figure 8
The tissue and intracellular distribution of PLEK, TREM1 and TLR2. (a) The gene expression scores ofPLEK, TREM1 and TLR2 in bone marrow, trabecular bone tissue, skeletal muscle tissue, blood, layer ofsynovial tissue, and cartilage in in Bgee database. (b) The gene expression level of PLEK, TREM1 andTLR2 in HPA database. (c) The intracellular distribution of PLEK, TREM1 and TLR2. Green colorrepresents the expression location of PLEK, TREM1 and TLR2.

Page 23/23
Figure 9
Two ceRNA networks of PLEK, and TLR2 and the potential RNA regulatory pathways. (a) ceRNA networkof PLEK. (b) ceRNA network of TLR2. (c) MALAT1-miR-146b-5p-TLR2, MALAT1- miR-664b-3p-PLEK,NORAD-miR-106b-5p-TLR2, and MSMO1-miR-106b-5p-TLR2. MALAT1, metastasis associated lungadenocarcinoma transcript 1; NORAD, non-coding RNA activated by DNA damage; MSMO1, methylsterolmonooxygenase 1.
Supplementary Files
This is a list of supplementary �les associated with this preprint. Click to download.
Table1.docx


![Investigation of Cumulative Retrospective Cost Adaptive ...1].pdf · missile model9,10.Model reference adaptive control using a retrospective correction filter shows that a given](https://static.fdocuments.us/doc/165x107/5f49a983f7e8d1699d355d87/investigation-of-cumulative-retrospective-cost-adaptive-1pdf-missile-model910model.jpg)