Back to the Staffing Surge - EdChoice TO THE STAFFING SURGE The Great Teacher Salary Stagnation and...
49
BACK TO THE STAFFING SURGE The Great Teacher Salary Stagnation and the Decades-Long Employment Growth in American Public Schools Benjamin Scafidi, Ph.D.
Transcript of Back to the Staffing Surge - EdChoice TO THE STAFFING SURGE The Great Teacher Salary Stagnation and...

BACK TO THESTAFFING SURGEThe Great Teacher Salary Stagnation and the Decades-Long Employment Growth in American Public Schools
Benjamin Scafidi, Ph.D.

ABOUT EDCHOICEEdChoice is a nonprofit, nonpartisan organization dedicated to advancing full and unencumbered educational choice as the best pathway to successful lives and a stronger society. EdChoice believes that families, not bureaucrats, are best equipped to make K–12 schooling decisions for their children. The organization works at the state level to educate diverse audiences, train advocates and engage policymakers on the benefits of high-quality school choice programs. EdChoice is the intellectual legacy of Milton and Rose D. Friedman, who founded the organization in 1996 as the Friedman Foundation for Educational Choice.
MAY 2017

BACK TO THESTAFFING SURGEThe Great Teacher Salary Stagnation and the Decades-Long Employment Growth in American Public Schools
Benjamin Scafidi, Ph.D.

TABLE OF CONTENTS
LIST OF FIGURES
Executive Summary ........................................................................................................................................ 1Introduction ..................................................................................................................................................... 5 Student Achievement Remained Flat During the Costly Modern Staffing Surge........................6 National Public School Test Scores .................................................................................................6 National Public High School Graduation Rates............................................................................ 7 The Kids Are Not Worse Off ..................................................................................................................... 8 Critiques of the Original Staffing Surge Report ................................................................................... 8 Report Roadmap ........................................................................................................................................9Beyond the Staffing Surge, FY 2009 to FY 2012 .......................................................................................9 Back to the Staffing Surge, FY 2012 to FY 2015 ...................................................................................... 10 Student Outcomes in American Public Schools After 2008 ............................................................11Increases in Public School Resources After FY 1992 and the Great TeacherSalary Stagnation ........................................................................................................................................... 12 Increases in School Resources—Where Did They Go? .................................................................... 13Updating the Modern Staffing Surge and Its Opportunity Costs to FY 2015 .................................. 14Changes in American Public School Staffing Ratios .............................................................................. 16Conclusion ...................................................................................................................................................... 17Appendix 1: State-Specific Data .................................................................................................................. 21Appendix 2: Expanded Notes and Sources for Figures .........................................................................35Notes ............................................................................................................................................................... 41About the Author ...........................................................................................................................................45Acknowledgments .........................................................................................................................................45
Figure 1: Growth in Students and Public School Personnel, FY 1950 to FY 2009 ......................... 5Figure 2: Growth in Students and Public School Personnel, FY 1992 to FY 2009 .........................6Figure 3: NAEP Public School 17-Year-Olds’ Reading and Math Test Scores, 1992 and 2008 .............................................................................................................................. 7Figure 4: Public High School Graduation Rates, 1970, 1991, and 2009 ............................................. 8Figure 5: Staffing Retreat—US Public Schools, FY 2009 to FY 2012 ............................................... 10Figure 6: Back to the Staffing Surge—US Public Schools, FY 2012 to FY 2015 ..............................11Figure 7: NAEP Public School 17-Year-Olds’ Reading and Math Test Scores, 2008 and 2012 .............................................................................................................................11Figure 8: Public High School Graduation Rates During the Staffing Retreat, 2009 and 2013 ........................................................................................................................... 12Figure 9: Increase in Real Public School Spending Per Student, FY 1992 to FY 2014 .................................................................................................................... 13Figure 10: Inflation-Adjusted Average Teacher Salaries, FY 1992 and FY 2014 ........................... 13

LIST OF TABLES
Figure 11: Changes in Inflation-Adjusted Public School Spending, Teacher Salaries, and Staff, FY 1992 to FY 2014 ................................................................................................ 14 Figure 12: Staffing Surge in American Public Schools, FY 1992 to FY 2015 .................................. 15Figure 13: Student–Staff Ratios in American Public Schools, 1950, 1992, and 2015 ................... 16Figure 14: Growth in Students and Public School Personnel, United States, FY 1950 to FY 2015 ................................................................................................................. 17
Table 1: Change in Inflation-Adjusted Per-Student Spending and Average Teacher Salaries by State, FY 1992 to FY 2014 .....................................................................................22Table 2: Changes in Public School Students and Staff and Opportunity Costs by State, FY 1992 to FY 2015 ..........................................................................................................23Table 3: Student–Staff Ratios by State, FY 1992 to FY 2015 .............................................................29Table 4: Student–Teacher Ratios by State, FY 1992 to FY 2015 ....................................................... 31Table 5: Student–"All Other Staff" Ratios by State, FY 1992 to FY 2015 ........................................33

EXECUTIVE SUMMARYIn reports released in 2012 and 2013, the Friedman Foundation for Educational Choice—now EdChoice —showed that American public schools had been on a six-decade staffing surge. That is, between 1950 and 2009, public schools added school personnel at a rate that far exceeded the increases needed to keep up with student enrollment growth. This staffing surge was documented using publicly available data that state departments of education annually report to the US Department of Education, where each public school employee was placed into one of two categories—teachers and all other staff. “All other staff” includes district and school administrators, teacher aides, counselors, social workers, reading and math coaches, janitors, bus drivers, cafeteria workers, curriculum specialists, etc.
This study updates the original Staffing Surge reports by analyzing staffing patterns in American public schools using more recent data—through fiscal years (FY) 2014 or 2015, as available. As the annual data on public school staffing became available for the school years after 2009 and showed that staffing was declining, a new report on the topic could have been entitled Beyond the Staffing Surge. However, the staffing retreat proved fleeting. Now, after FY 2012, we are Back to the Staffing Surge.
In addition, though the original two Staffing Surge reports calculated the significant opportunity costs of these hiring trends, the present study delves more deeply into their effect on teacher compensation.
From fiscal year (FY) 1950 to FY 2015, the earliest and most recent years with available data, American public schools added full-time equivalent (FTE) personnel at a rate almost four times that of student enrollment growth. These additional personnel were disproportionately non-teachers. While the number of FTE teachers increased almost two and a half times as fast as the increase in students—resulting in significantly smaller class sizes—the number of non-teachers or “all other staff” increased more than seven times the increase in students.
It could be argued that this staffing surge was worth it in the 1950s, the 1960s, the 1970s, the 1980s, and early 1990s because during those decades public schools began welcoming students with special needs and were allowed to integrate by race or were actively integrated by government policies. But, the staffing surge has continued even after its first 42-year period that ended in 1992. The modern staffing surge, which began in 1992, has been expensive for taxpayers and has posed a tremendous opportunity cost on teachers and parents.
1 EDCHOICE.ORG
Growth in Students and Public School Personnel, United States, FY 1950 to FY 2015
800%
700%
600%
500%
400%
300%
200%
100%
0Total SchoolPersonnel
381%
Students
100%
Teachers
243%
Administratorsand All Other Staff
709%
Sources: See Appendix 2.
FIGURE E1

Between fiscal years 1992 and 2014, inflation adjusted (“real”) per-student spending increased by 27 percent, where 2014 was the most recent year with complete data available. However, real average salaries for public school teachers actually fell by 2 percent during this time period. Despite the large increase in real taxpayer resources devoted to public school students, there was a Great Teacher Salary Stagnation from 1992 to 2014.
Instead of increasing teacher salaries over and above the cost of living, the American public education system continued its staffing surge. From FY 1992 to FY 2014, public schools experienced a 19 percent increase in student enrollment growth. Yet at the same time, they increased FTE staff by almost double that rate—a 36 percent increase in FTE school personnel. Continuing with a consistent decades-long pattern, public schools increased staffing primarily by hiring non- teachers. Specifically, public schools increased their FTE teacher force by 28 percent from FY 1992 to 2014 and increased the number of FTE non-teachers by 45 percent—more than double the increase in the number of students.
The disproportionate growth in “all other staff” has presented the public education system with a very large opportunity cost.
If the increase in “all other staff” alone had matched student enrollment growth between FY 1992 and FY 2015—the most recent staffing data available—then a cautious estimate finds American public schools would have saved almost $35 billion in annual recurring savings. That is $35 billion every single year from 1992 to 2015, for a cumulative total of $805 billion over this time period.
One thing public schools could have done with that recurring $35 billion: Give every teacher a permanent $11,100 raise. Another potential use of those funds: Give more than 4 million students $8,000 education savings accounts (ESAs) that could be used to offset tuition payments at private schools, to save for college, or to pay for other educational services, therapies, curriculum, and materials. What it boils down to: Dollars used to fund the public school staffing surge placed a significant opportunity cost that precluded raises for teachers and/or school choice opportunities for students.
Any argument for the post-1992 staffing surge would be weak in that it has been costly, and—as discussed in the original reports and in the body of this study—it has not led to measurable academic benefits for American public school students.
2BACK TO THE STAFFING SURGE
Changes in Inflation-Adjusted Public School Spending, Teacher Salaries, and Staff, FY 1992 to FY 2014
50%
40%
30%
20%
10%
0
Sources: See Appendix 2.
Students All Staff
19%
36%
All OtherStaff
Teachers
28%
45%
Per StudentSpending
Average TeacherSalaries
27%
-2%
FIGURE E2

3 EDCHOICE.ORG
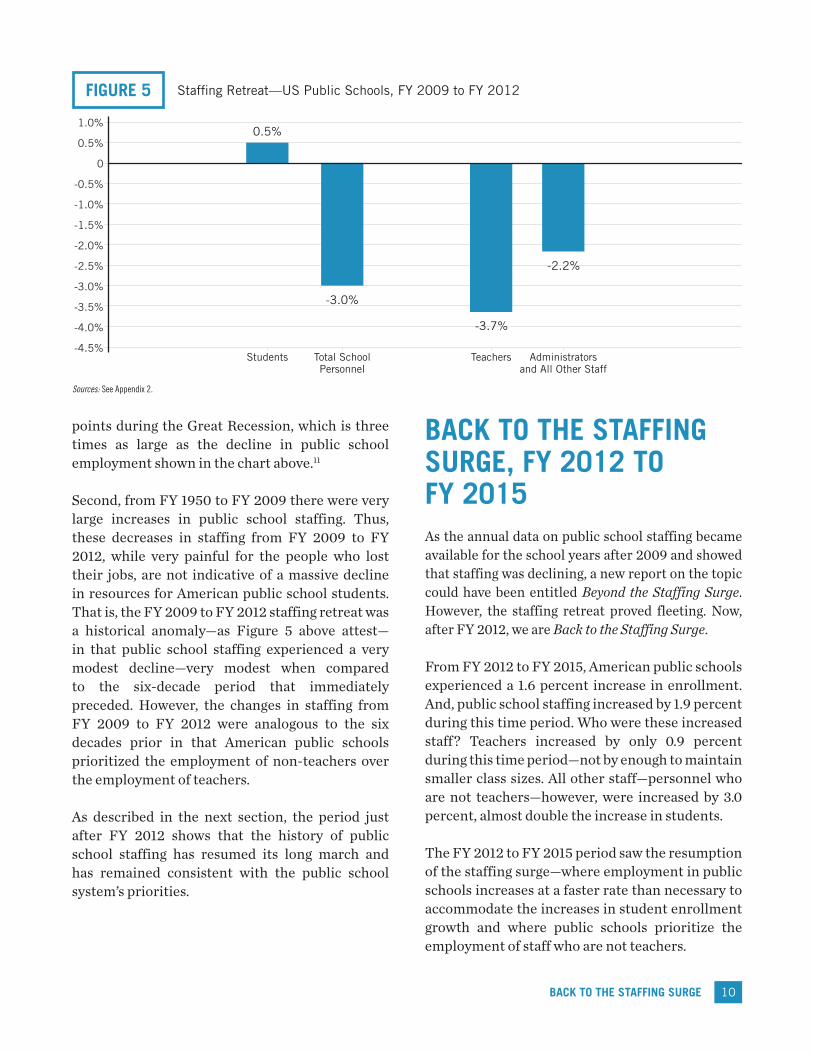
The original Staffing Surge reports contained data through 2009. With regards to public school staffing, the post-2009 period has been an anomaly in some ways, but more of the same in others. Well-publicized public school staffing declines occurred during the Great Recession that began toward the end of 2008. Interestingly, the American public school system reduced its teacher force by more than it reduced its ranks of non-teachers during the Great Recession. From FY 2009 to FY 2012, the number of public school teachers fell by 3.7 percent,
while the number of non-teachers (all other staff ) declined by only 2.2 percent.
Though public school staffing declined from FY 2009 to 2012, this staffing retreat was a historical anomaly and proved fleeting. After FY 2012, American public schools were back to the staffing surge as public school employment began growing again at a rate faster than increases in student enrollment. And, the public school system continued its decades-long preference for hiring
US Public School Staffing Retreat During the Great Recession, FY 2009 to FY 2012
1.0%
0.5%
0
-0.5%
-1.0%
-1.5%
-2.0%
-2.5%
-3.0%
-3.5%
-4.0%
-4.5%Students
0.5%
Total SchoolPersonnel
-3.0%
Teachers
-3.7%
Administratorsand All Other Staff
-2.2%
Sources: See Appendix 2.
FIGURE E3
Back to the Staffing Surge—US Public Schools, FY 2012 to FY 2015
3.5%
3.0%
2.5%
2.0%
1.5%
1.0%
0.5%
0Staff
1.9%
Students
1.6%
Teachers
0.9%
All Other Staff
3.0%
Sources: See Appendix 2.
FIGURE E4

non-teachers moreso than teachers. In fact, the hiring of teachers has not kept up with the increase in students in the years after FY 2012—despite the fact that overall personnel increases were greater than the increases in students.
For many decades—in boom times and even during and after the Great Recession—the American public education system has had a preference for hiring non-teachers relative to:
•Hiring teachers
•Providing teachers with real (inflation-adjusted) salary increases, or
•Empowering parents with vouchers, scholarships, or education savings accounts to find the educational settings that best meet the unique needs of their children.
We can continue going back to the staffing surge and its diversion of resources away from teachers and school choice opportunities for parents and students. Or, perhaps it is time to move to a new education system—one that is student-centered and one that devotes more of its considerable resources to its frontline talent: its teachers.
4BACK TO THE STAFFING SURGE

5 EDCHOICE.ORG
INTRODUCTIONUsing data reported by state departments of education to the National Center for Education Statistics (NCES) at the US Department of Education, a 2012 study by the Friedman Foundation for Educational Choice—now called EdChoice—documented the decades long “staffing surge” that occurred in US public schools after 1950.1 A follow-up report in early 2013 provided more information on state-specific staffing surges.2 These reports showed the increases in public school students as compared to the increases in public school staff.
All public school staff were placed into one of two categories: (a) teachers or (b) all other staff. All other staff includes district and school administrators, teacher aides, counselors, social workers, reading and math coaches, janitors, bus drivers, cafeteria workers, curriculum specialists, etc.
As shown in Figure 1 above, US public schools experienced an increase in school personnel that was just more than four times greater than the increase in students between 1950 and 2009. However, the increase in teachers, while more
than two and a half times as large as the increase in students, was dwarfed by the increase in administrators and all other staff. The increase in this latter category of employees was more than seven times as great as the increase in students. Employee data here and throughout this report are in full-time equivalents (FTEs).
Perhaps this staffing surge was worth a try in the 1950s, 1960s, 1970s, 1980s, and early 1990s because of efforts to integrate schools, to provide more resources to students with special needs, and to increase funding in low-wealth school districts. However, the original Staffing Surge reports also showed these hiring patterns were still present in the FY 1992 to FY 2009 time period, as shown in Figure 2. Many readers of the original Staffing Surge report have asked for the “all other staff” category to be broken down into finer categories, such as ‘administrators,’ ‘teacher aides,’ etc. It is not feasible to separate public school employees into those finer categories because the state-level data on the number of employees in those finer categories often experience massive change from year to year for individual states in unbelievable ways. It appears that different state department
Growth in Students and Public School Personnel, FY 1950 to FY 2009
800%
700%
600%
500%
400%
300%
200%
100%
0Total SchoolPersonnel
386%
Students
96%
Teachers
252%
Administratorsand All Other Staff
702%
FIGURE 1
Sources: See Appendix 2.

6BACK TO THE STAFFING SURGE
of education employees make different decisions across years as to under which categories specific jobs should be placed. As an example, the number of “instructional aides” in Indiana public schools supposedly decreased by more than 8,500 from FY 2011 to FY 2012, according to data the Indiana Department of Education reported to the NCES. Nevertheless, during that same time period, the number of “student support service staff” supposedly increased by more than 10,000 employees.3 It strains credulity that Indiana public schools laid off 8,500 aides in summer 2011 and used those funds to hire 10,000 more student support service staff for the next school year. It is perhaps likely that those employees were merely reclassified into different categories in FY 2011 and FY 2012. That said, there does not seem to be unbelievable changes for the two categories of employees used in this report and in the prior Staffing Surge reports—(a) teachers and (b) everybody else, as called in this report “all other staff.” To be sure, if states are inaccurately reporting the number of teachers or the number of total staff to the NCES, then this report will contain those inaccurate data.4
Student Achievement Remained Flat During the Costly Modern Staffing SurgeAmerican public schools hired more staff during the modern staffing surge such that public school students in FY 2009 had significantly more access to teachers and even more access to non-teachers relative to students in FY 1992. Despite this large investment in additional personnel, there does not seem to have been much return in terms of measured student outcomes.
National Public School Test Scores
As shown below, national test scores for American public school students measured by the National Assessment for Education Progress (NAEP) Long-Term Trend Assessments for 17-year-olds did not increase during the modern staffing surge. I use scores for 17-year-olds because these scores reflect the culmination of students’ public school careers.5
National reading scores actually fell by 4 percentage points between 1992 and 2008—a minor change. National math scores for public school students were
Growth in Students and Public School Personnel, FY 1992 to FY 2009
50%
45%
40%
35%
30%
25%
20%
15%
10%
0Total SchoolPersonnel
39%
Students
17%
Teachers
32%
Administratorsand All Other Staff
46%
FIGURE 2
Sources: See Appendix 2.

7 EDCHOICE.ORG
unchanged during that time period. Despite this large investment in personnel during the modern staffing surge, national test scores did not increase.
National Public High School Graduation Rates
Public high school graduation rates nudged upward between 1991 and 2009. That is, public high school graduation rates increased from 73.7 percent to 75.5 percent during this time period.6 Thus, the staffing surge occurred at the same time as an increase of 1.8 percentage points in the nation’s graduation rate.
Should one conclude that increasing public school staffing is the key to increasing graduation rates based on this experience from one time period? No. Here’s why.
Before concluding that increasing public school staffing well beyond what is needed to accommodate enrollment growth is what would improve graduation rates in the future, one should consider the time period prior to the modern staffing surge for which valid graduation rate statistics are available—1970 to 1991.
Between 1970 and 1991, public high school graduation rates in the United States fell by 5 percentage points, from 78.7 percent to 73.7 percent. During this earlier time period in which public high school graduation rates fell by 5 percentage points:
• The number of public school students fell by 8 percent
• The number of FTE staff increased by 36 percent
• Among these staff increases, the number of teachers increased by 21 percent, while the number of FTE all other staff increased by 58 percent. As shown in Figure 4 on page 8, taking both time periods together—the entirety of 1970 to 2009, the public high school graduation rate fell by 3.2 percentage points during a period of massive investments in additional public school personnel—investments well above what was needed to accommodate enrollment increases. Thus, over a four-decade period of time, for which graduation data are available, the public school staffing surge was not associated with increases in public school graduation rates.
NAEP Public School 17-Year-Olds’ Reading and Math Test Scores, 1992 and 2008
320
280
220
160
120
80
40
02008 Reading
284
1992 Reading
288
1992 Math
305
2008 Math
305
FIGURE 3
Source: National Center for Education Statistics, NAEP Data Explorer [database], accessed February 24, 2017, retrieved from https://nces.ed.gov/nationsreportcard/lttdata
SCOR
E

8BACK TO THE STAFFING SURGE
Based on national test scores and graduation rates for American public schools, there is no evidence that the costly increase in public school staffing has led to gains in measurable outcomes for American students in recent decades.
The Kids Are Not Worse Off
Some may believe extra public school staff were necessary because American students have become more disadvantaged over recent decades. This issue was considered at length on pages 8 and 9 of the original Staffing Surge report, and readers interested in this particular issue should consult the original report.7 There are now four studies on this topic as well, and each finds that modern American students are not less advantaged relative to students in decades past.8 Each of those four studies finds that public school students in recent years are actually slightly more advantaged relative to students of decades ago, on balance. That is, students in more recent years have characteristics that—by critics’ logic—would suggest higher student achievement relative to students of decades ago. But as Figures 3 and 4 show, that has not been the case.
While students in recent years are more likely to have some characteristics that have statistically been associated with lower student outcomes—single parent homes, English is not their first language, etc., American students in recent years also are more likely to have other characteristics that have statistically been associated with higher student outcomes—higher family income, more educated parents, fewer children in the household, etc.
Each of those four empirical studies finds that—taking all changes in student characteristics together—American public school students in recent years have, on balance, characteristics that are more favorable for positive student outcomes relative to public school students of decades ago. Given the massive increase in public school personnel—well over and beyond what was needed to accommodate student enrollment growth—given the data on stagnant student achievement in public schools over time, and given that students in recent years have characteristics that are slightly more favorable for student achievement, the productivity of American public schools has fallen rather dramatically over the past few decades. And in retrospect, the staffing surge in American public schools has appeared to have been a costly failure. That is, the staffing surge has failed to increase measurable academic outcomes for students.
Critiques of the Original Staffing Surge Report
There were several critiques of the original Staffing Surge report. It is worth noting that none of the critiques disputed that the staffing surge had occurred, and they did not dispute any of the numbers in the original reports regarding the massive size of the public school staffing surge. For citations of the critiques of the original reports and responses by the author, please see pages 10–14 of the 2013 Staffing Surge report.9 After reading the present study, the original reports, the
100%
80%
60%
40%
20%
01991
73.7%
1970
78.7%
2009
75.5%
Sources: See Appendix 2.
Public High School Graduation Rates, 1970, 1991, and 2009FIGURE 4

9 EDCHOICE.ORG
criticisms of them, and author responses, readers can make their own judgments about whether the six-plus decades long and expensive staffing surge in the American public education system was a wise taxpayer investment.
Report Roadmap
The original Staffing Surge reports described the decades-long staffing surge that began at least as early as FY 1950 and continued to FY 2009. This report updates the original reports by analyzing staffing patterns in American public schools using more recent data—through fiscal years 2014 or 2015, as available. The Great Recession, which began in late 2008, and its aftermath show that historical public school staffing trends continued even in the face of negative economic times.
While the original reports considered the significant opportunity costs of the staffing surge, the present study delves more deeply into the effect of the staffing surge on teacher compensation. The rest of this report describes as follows:
• The staffing retreat that took place from FY 2009 to FY 2012
• The return to the staffing surge after FY 2012
• The relationship between recent public school staffing trends and student outcomes
• Trends in inflation adjusted increases in public school spending per student, staffing, and the Great Teacher Salary Stagnation
• Changes in staffing ratios in public schools over time.
Finally, the report offers concluding remarks, and state-specific data can be found in Appendix 1.
BEYOND THE STAFFING SURGE, FY 2009 TO FY 2012The Great Recession that began in earnest in late 2008 took a large toll on American families due to massive job losses, record numbers of mortgage defaults and housing foreclosures, historic declines in property values, and other forms of economic distress. For example, the U-6 unemployment rate—the rate that includes those looking for work, discouraged workers who have stopped looking for work, and individuals working part-time who would rather work full-time—increased from 8.0 percent in March 2007 to 17.1 percent in December 2009.10 As a consequence of this historic decrease in jobs, income, and wealth during the Great Recession, state and local government budgets suffered greatly as well, which affected the staffing of America’s public schools.
As shown in Figure 5 on page 10, American public schools did experience a staffing retreat between FY 2009 and FY 2012. However, instead of primarily cutting back on administrators and other staff, US public school districts disproportionately reduced their teaching ranks to deal with the fiscal effects of the Great Recession.
When budgets for public education were increasing, public schools invested heavily into hiring more teachers and even more heavily into increasing administrators and other staff. When budgets for public education were declining, public schools decreased their teaching forces more than they decreased personnel in other areas.
Further, this staffing retreat should be placed in economic and historical context.
First, job losses in the K–12 public education sector were far lower than job losses elsewhere. As mentioned above, the national U-6 unemployment rate increased by just more than 9 percentage
points during the Great Recession, which is three times as large as the decline in public school employment shown in the chart above.11
Second, from FY 1950 to FY 2009 there were very large increases in public school staffing. Thus, these decreases in staffing from FY 2009 to FY 2012, while very painful for the people who lost their jobs, are not indicative of a massive decline in resources for American public school students. That is, the FY 2009 to FY 2012 staffing retreat was a historical anomaly—as Figure 5 above attest—in that public school staffing experienced a very modest decline—very modest when compared to the six-decade period that immediately preceded. However, the changes in staffing from FY 2009 to FY 2012 were analogous to the six decades prior in that American public schools prioritized the employment of non-teachers over the employment of teachers.
As described in the next section, the period just after FY 2012 shows that the history of public school staffing has resumed its long march and has remained consistent with the public school system’s priorities.
BACK TO THE STAFFING SURGE, FY 2012 TO FY 2015As the annual data on public school staffing became available for the school years after 2009 and showed that staffing was declining, a new report on the topic could have been entitled Beyond the Staffing Surge. However, the staffing retreat proved fleeting. Now, after FY 2012, we are Back to the Staffing Surge.
From FY 2012 to FY 2015, American public schools experienced a 1.6 percent increase in enrollment. And, public school staffing increased by 1.9 percent during this time period. Who were these increased staff? Teachers increased by only 0.9 percent during this time period—not by enough to maintain smaller class sizes. All other staff—personnel who are not teachers—however, were increased by 3.0 percent, almost double the increase in students.
The FY 2012 to FY 2015 period saw the resumption of the staffing surge—where employment in public schools increases at a faster rate than necessary to accommodate the increases in student enrollment growth and where public schools prioritize the employment of staff who are not teachers.
10BACK TO THE STAFFING SURGE
1.0%
0.5%
0
-0.5%
-1.0%
-1.5%
-2.0%
-2.5%
-3.0%
-3.5%
-4.0%
-4.5%Students
0.5%
Total SchoolPersonnel
-3.0%
Teachers
-3.7%
Administratorsand All Other Staff
-2.2%
Sources: See Appendix 2.
Staffing Retreat—US Public Schools, FY 2009 to FY 2012FIGURE 5

11 EDCHOICE.ORG
After a brief hiatus during the Great Recession, the staffing surge in the American public education system has returned.
Student Outcomes in American Public Schools After 2008
During the staffing retreat that occurred during the Great Recession, student test scores on the NAEP Long-Term Trend Assessment were roughly
flat for public school students. As shown on the charts below, national reading scores for 17-year -olds increased by one point, and national math scores did not change despite the staffing retreat.
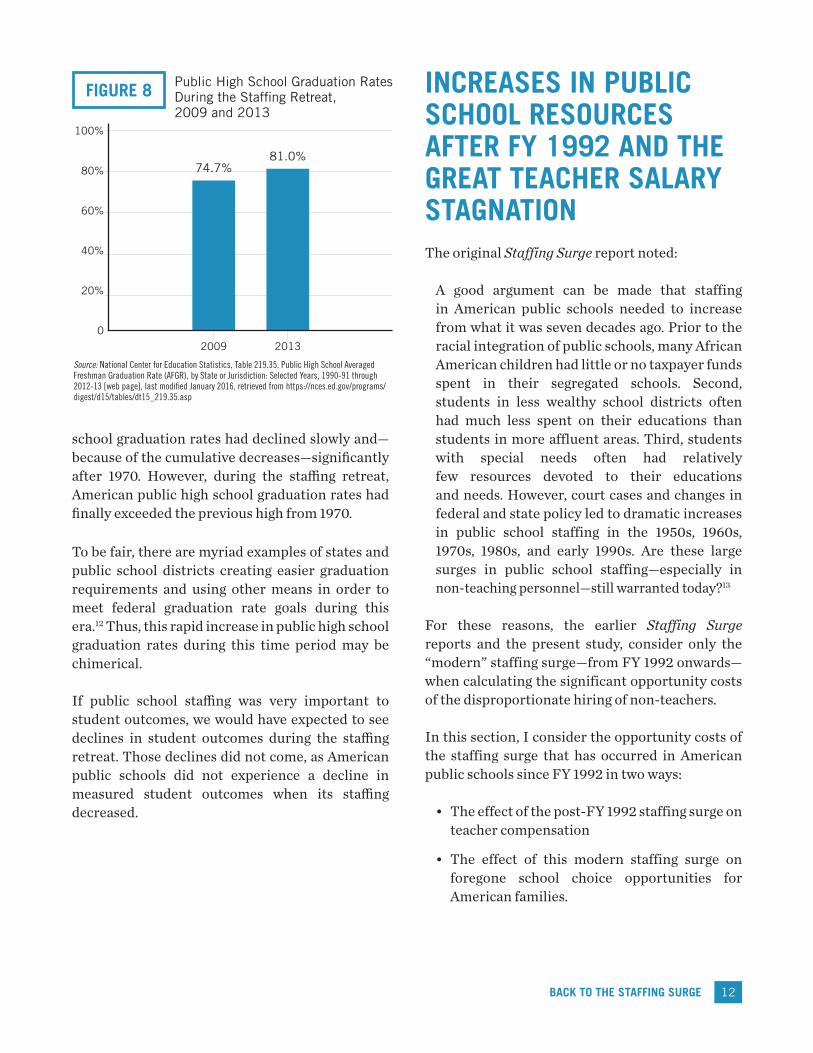
Interestingly, measured public high school graduation rates skyrocketed during the staffing retreat. From 2009 to 2013, the Averaged Freshman Graduation rate increased by 6.3 percentage points—an astonishing increase in a very short period of time. American public high
3.5%
3.0%
2.5%
2.0%
1.5%
1.0%
0.5%
0Staff
1.9%
Students
1.6%
Teachers
0.9%
All Other Staff
3.0%
Sources: See Appendix 2.
Back to the Staffing Surge—US Public Schools, FY 2012 to FY 2015FIGURE 6
NAEP Public School 17-Year-Olds’ Reading and Math Test Scores, 2008 and 2012
350
300
250
200
150
100
50
02012 Reading
285
2008 Reading
284
2008 Math
305
2012 Math
305
FIGURE 7
Source: National Center for Education Statistics, NAEP Data Explorer [database], accessed February 24, 2017, retrieved from https://nces.ed.gov/nationsreportcard/lttdata
SCOR
E
12BACK TO THE STAFFING SURGE
school graduation rates had declined slowly and—because of the cumulative decreases—significantly after 1970. However, during the staffing retreat, American public high school graduation rates had finally exceeded the previous high from 1970.
To be fair, there are myriad examples of states and public school districts creating easier graduation requirements and using other means in order to meet federal graduation rate goals during this era.12 Thus, this rapid increase in public high school graduation rates during this time period may be chimerical.
If public school staffing was very important to student outcomes, we would have expected to see declines in student outcomes during the staffing retreat. Those declines did not come, as American public schools did not experience a decline in measured student outcomes when its staffing decreased.
INCREASES IN PUBLIC SCHOOL RESOURCES AFTER FY 1992 AND THE GREAT TEACHER SALARY STAGNATIONThe original Staffing Surge report noted: A good argument can be made that staffing in American public schools needed to increase from what it was seven decades ago. Prior to the racial integration of public schools, many African American children had little or no taxpayer funds spent in their segregated schools. Second, students in less wealthy school districts often had much less spent on their educations than students in more affluent areas. Third, students with special needs often had relatively few resources devoted to their educations and needs. However, court cases and changes in federal and state policy led to dramatic increases in public school staffing in the 1950s, 1960s, 1970s, 1980s, and early 1990s. Are these large surges in public school staffing—especially in non-teaching personnel—still warranted today?13
For these reasons, the earlier Staffing Surge reports and the present study, consider only the “modern” staffing surge—from FY 1992 onwards—when calculating the significant opportunity costs of the disproportionate hiring of non-teachers.
In this section, I consider the opportunity costs of the staffing surge that has occurred in American public schools since FY 1992 in two ways:
• The effect of the post-FY 1992 staffing surge on teacher compensation
• The effect of this modern staffing surge on foregone school choice opportunities for American families.
100%
80%
60%
40%
20%
02013
81.0%
2009
74.7%
Source: National Center for Education Statistics, Table 219.35. Public High School Averaged Freshman Graduation Rate (AFGR), by State or Jurisdiction: Selected Years, 1990-91 through 2012-13 [web page], last modified January 2016, retrieved from https://nces.ed.gov/programs/digest/d15/tables/dt15_219.35.asp
Public High School Graduation Rates During the Staffing Retreat, 2009 and 2013
FIGURE 8

13 EDCHOICE.ORG
Increases in School Resources—Where Did They Go?American public schools saw their funding increase by 27 percent on a per-student and inflation adjusted basis between FY 1992 and FY 2014. That is, American public school students in FY 2014 had 27 percent more in real resources spent on their public educations as compared to public school students in FY 1992. FY 2014 is the most recent year for which public school funding data are available at the time of writing this report.
As shown in Figure 9, American public schools spent, on average, $12,355 per student in FY 2014. Adjusted for inflation by the Consumer Price Index for All Urban Consumers (CPI-U), public school spending was $9,711 in FY 1992.
In FY 1992, average spending per public school student was actually $5,733. The January 1992 CPI-U was equal to 138.1, and the January 2014 CPI-U was equal to 233.916. To make actual spending in 1992 comparable to actual spending in 2014, actual spending in 1992 is inflated by the CPI-U: $5,733*(233.916/138.1) = $9,711.14 The actual amount spent per student in public schools in FY 2014 was $12,355.
Given the significant increase in public school spending after 1992, where did these funds go? One place these spending increases did not go was to salary increases for teachers.
While real per student spending in public schools increased by 27 percent from FY 1992 to FY 2014 (and likely increased a bit more by FY 2015), real teacher salaries actually declined by $1,086, or 2 percent. Thus, real spending increases on public schools did not translate into real salary increases for teachers. Thus, there was a Great Teacher Salary Stagnation from 1992 to 2014.15
Actual average teacher salaries were $34,063 in FY 1992, and, adjusted for inflation, average FY 1992 teacher salaries were $57,696, as shown in Figure 10 below.
The CPI-U is used to create real spending and salary figures for FY 1992 so that historical data are comparable to more recent data in terms of purchasing power. As noted above, the CPI-U overstates actual inflation. If there were a more accurate inflation-adjustment that went back to FY 1992, it would have been used here. That said, using a different inflation-adjustment would not change the difference between the significant real
$14,000
$12,000
$10,000
$8,000
$6,000
$4,000
$2,000
0FY 2014
$12,335
FY 1992
$9,711
Sources: See Appendix 2.
Increase in Real Public School Spending Per Student, FY 1992 to FY 2014
FIGURE 9
$70,000
$60,000
$50,000
$40,000
$30,000
$20,000
$10,000
0FY 2014
$56,610
FY 1992
$57,696
Sources: See Appendix 2.
Inflation-Adjusted Average Teacher Salaries, FY 1992 and FY 2014FIGURE 10

14BACK TO THE STAFFING SURGE
per-student spending increase and the teacher salaries—both columns in the above graph would move proportionately in the same direction. Regardless of the inflation-adjustment mechanism used to compare purchasing power over time, it remains the case that there were starkly different trends between real per-student spending and teacher salaries between FY 1992 and FY 2014.
Given that real increases in real spending per public school student did not find their way into teachers’ pockets, then where did those increases in resources go? One place increased resources went: more staffing, especially the staffing of non-teachers. As shown in the chart below, even after a massive decades-long staffing surge, American public schools continued after FY 1992 to hire staff at a rate in excess of what was needed to keep pace with enrollment growth.16 As the number of public school students increased by 19 percent between FY 1992 and FY 2014, the number of FTE school personnel increased by 36 percent. The number of FTE teachers increased by 28 percent, while the number of non-teachers increased by 45 percent—over two and a half times the increase in the number of students.
UPDATING THE MODERN STAFFING SURGE AND ITS OPPORTUNITY COSTS TO FY 2015In the prior section, I considered the staffing surge through FY 2014, as data on public school spending per student was available only until FY 2014 at the time this report was written. As FY 2015 data on staffing is currently available, data on the modern staffing surge, after FY 1992 can be updated to FY 2015.
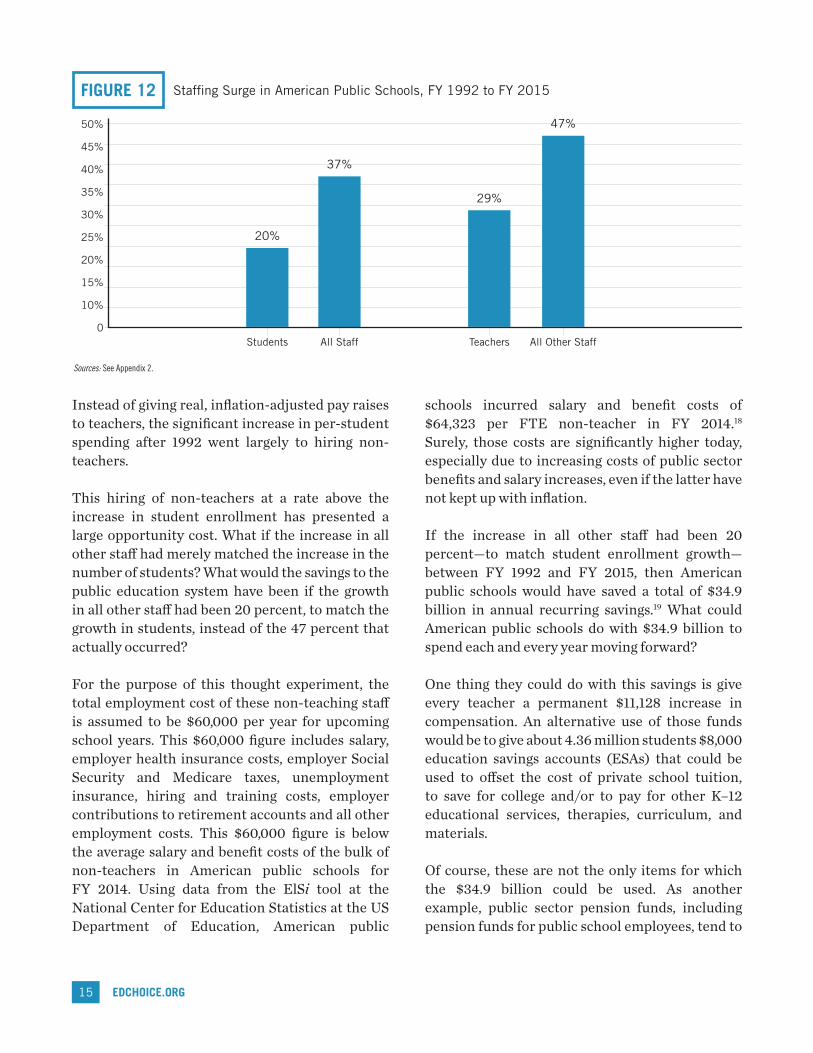
Between FY 1992 and FY 2015, public school enrollment increased by 20 percent nationally. However, public schools increased FTE staff by 37 percent—almost twice as fast as the increase in student enrollment growth. The increase in teachers during this time period was 29 percent, about 1.5 times the growth in students. However, the growth in all other staff, those who are not teachers, was almost 2.5 times the growth in students. This disproportionate growth in all other staff matches the pattern present in American public schools for more than six decades.17
50%
40%
30%
20%
10%
0
Per StudentSpending
27%
Average TeacherSalaries
-2%
Students
19%
All Staff
36%
Teachers
28%
All OtherStaff
45%
Note: State-specific data on changes in inflation-adjusted spending, teacher salaries, and staff can be found in Appendix 1.Sources: See Appendix 2.
Changes in Inflation-Adjusted Public School Spending, Teacher Salaries, and Staff, FY 1992 to FY 2014FIGURE 11
15 EDCHOICE.ORG
Instead of giving real, inflation-adjusted pay raises to teachers, the significant increase in per-student spending after 1992 went largely to hiring non-teachers.
This hiring of non-teachers at a rate above the increase in student enrollment has presented a large opportunity cost. What if the increase in all other staff had merely matched the increase in the number of students? What would the savings to the public education system have been if the growth in all other staff had been 20 percent, to match the growth in students, instead of the 47 percent that actually occurred?
For the purpose of this thought experiment, the total employment cost of these non-teaching staff is assumed to be $60,000 per year for upcoming school years. This $60,000 figure includes salary, employer health insurance costs, employer Social Security and Medicare taxes, unemployment insurance, hiring and training costs, employer contributions to retirement accounts and all other employment costs. This $60,000 figure is below the average salary and benefit costs of the bulk of non-teachers in American public schools for FY 2014. Using data from the ElSi tool at the National Center for Education Statistics at the US Department of Education, American public
schools incurred salary and benefit costs of $64,323 per FTE non-teacher in FY 2014.18 Surely, those costs are significantly higher today, especially due to increasing costs of public sector benefits and salary increases, even if the latter have not kept up with inflation.
If the increase in all other staff had been 20 percent—to match student enrollment growth—between FY 1992 and FY 2015, then American public schools would have saved a total of $34.9 billion in annual recurring savings.19 What could American public schools do with $34.9 billion to spend each and every year moving forward?
One thing they could do with this savings is give every teacher a permanent $11,128 increase in compensation. An alternative use of those funds would be to give about 4.36 million students $8,000 education savings accounts (ESAs) that could be used to offset the cost of private school tuition, to save for college and/or to pay for other K–12 educational services, therapies, curriculum, and materials.
Of course, these are not the only items for which the $34.9 billion could be used. As another example, public sector pension funds, including pension funds for public school employees, tend to
Staffing Surge in American Public Schools, FY 1992 to FY 2015
50%
45%
40%
35%
30%
25%
20%
15%
10%
0All Staff
37%
Students
20%
Teachers
29%
All Other Staff
47%
FIGURE 12
Sources: See Appendix 2.

16BACK TO THE STAFFING SURGE
be significantly underfunded.20 That is, expected liabilities of these pension funds—payments promised to current and future retirees—exceed the assets of the funds. By using increases in taxpayer funds to hire more personnel, these taxpayer dollars therefore cannot be used to fully fund retirement benefits promised to public school employees. Further, by hiring more employees, the American public school system is exacerbating its underfunded pension problem by increasing the number of employees for which it must provide retirement benefits—a double-whammy to the multi-trillion dollar public sector pension crisis.
Appendix 1 of this report presents state-specific data on the modern staffing surge and its oppurtunity costs.
CHANGES IN AMERICAN PUBLIC SCHOOL STAFFING RATIOS The disproportionate increases in public school staffing over the past six-plus decades—disproportionate in that public schools hired staff at a rate well above what was needed to keep up with
student enrollment growth—has led to large declines in staffing ratios, where there are now significantly fewer students per public school employee.
From FY 1950 to FY 1992 the number of students per full-time equivalent (FTE) employee fell from 19.3 to 9.2 students per FTE employee—a decline of 52.3 percent. Thus, public school students in 1992 had access to more than twice the staffing as compared to public school students in 1950.
By FY 2015, the number of students per FTE employee had fallen again, to 8 students per employee—a further decline of 13.3 percent.
Student–teacher ratios also declined precipitously from FY 1950 to 1992—from 27.5 students per teacher in FY 1950 to 17.3 students per teacher in FY 1992. Thus, public school teachers in 1992 were responsible for 37 percent fewer students, on average, relative to teachers in 1950. This ratio fell again from FY 1992 to 2015—from 17.3 to 16.1, a further decline of 7 percent. Thus, public school students in FY 2015 had significantly more access to teachers relative to students of 1992 and dramatically more access to teachers than students in 1950.
Student–Staff Ratios in American Public Schools, 1950, 1992, and 2015
70
60
50
40
30
20
10
0
FIGURE 13
19.3
FY 1950
27.5
9.2
FY 1992
17.3
65.0
19.8
8.0
FY 2015
16.1 16.1
Sources: See Appendix 2.
Student–Total Staff Student–Teacher Student–Non-Teacher
STU
DEN
T–ST
AFF
RATI
O

17 EDCHOICE.ORG
The most dramatic increases in public school staffing have been in the hiring of non-teachers. As shown in Figure 13 above, the student–non- teacher ratio fell from 65 in 1950 to 19.8 in 1992, a decline of 228 percent. That is, public school students in 1992 had more than three times as much access to non-teachers in 1992 relative to public school students in 1950.
The pupil-non-teacher ratio fell again from 1992 to 2015, from 19.8 non-teachers per student to 16.1 in FY 2015, a further decline of almost 19 percent.
By FY 2015, the ratio of students per teacher and the ratio of students per non-teacher were roughly equivalent at 16.1. If the decades long trend of American public schools hiring non-teachers at a rapid pace has continued past 2015, then public schools of today—FY 2017—employ more non-teachers than teachers nationwide. This workforce is dramatically different than the workforce that was present in public schools in FY 1992 and especially FY 1950.
Appendix 1 of this report features state-specific data on staffing ratios over time.
It is likely that few would be concerned about this dramatic increase in magnitude and the dramatic
change in composition of the public school workforce and the associated added workforce costs if outcomes for public school students had increased during these decades. As discussed on pages 6, 7, 11, and 12 of this report, these student outcomes have been relatively flat over a long time period—despite the dramatic increases in public school staffing and especially in the numbers of non-teachers. These adverse trends are even more worrisome given that students of today appear to have, on balance, characteristics more favorable for student achievement relative to students of decades past.
CONCLUSION Between 1950 and 2015, the number of students in America’s public schools doubled. However, the public education system increased its FTE staffing by almost four times the increase in students. The number of FTE teachers increased by almost two and a half times the increase in students, while the increase in “all other staff”—personnel who are not classified as teachers—increased by just more than seven times as fast as the increase in students.
800%
700%
600%
500%
400%
300%
200%
100%
0Total SchoolPersonnel
381%
Students
100%
Teachers
243%
Administratorsand All Other Staff
709%
Sources: See Appendix 2.
Growth in Students and Public School Personnel, United States, FY 1950 to FY 2015FIGURE 14

There was a decline in public school staffing during the Great Recession, but this decline in staffing was very minor when compared to the above decades-long staffing surge. Further, the decline in staffing proved fleeting. While public school staffing experienced a modest decline from FY 2009 to FY 2012, the staffing surge resumed after FY 2012.
The staffing surge that has occurred in American public schools has been very costly for American taxpayers and has had a tremendous opportunity cost. While real (inflation-adjusted) per-student public school spending increased by 27 percent after FY 1992, average salaries for American public school teachers actually decreased by 2 percent in real terms, a Great Teacher Salary Stagnation.
After FY 1992 the increase in “all other staff” increased by 47 percent, and the increase in the number of public school students was only 20 percent. (The increase in teachers in excess of the increase in students is not considered in this example.) If the increase in all other staff had been 20 percent—to match student enrollment growth—between FY 1992 and FY 2015, then American public schools would have saved a total of $34.9 billion in annual recurring savings. One thing American public schools could do with this $34.9 billion annually is give every teacher a permanent increase in compensation more than $11,000 per year. An alternative use of that $34.9 billion would be to give more than 4 million students $8,000 education savings accounts (ESAs) that could be used to offset the cost of private school tuition, to save for college, and/or to pay for other K–12 educational services, therapies, curriculum, and materials.
While the staffing surge was costly to taxpayers and directed funds to the employment of non-teachers instead of giving teachers raises and/or giving parents more opportunities to choose the best educational settings for their children, perhaps the biggest disappointment with the staffing surge is the apparent lack of a return on investment. Despite the massive increases in
staffing over many decades, student outcomes as measured by national test scores for 17-year-old public school students and public high school graduation rates have not increased as a result of staffing increases. Generally, test scores have been flat during the staffing surge, and graduation rates initially fell when staffing was increasing rapidly, increased slightly during later staffing increases, and—perhaps surprisingly—increased rapidly when staffing was declining. Thus, there has not been an overall positive relationship between increasing public school staffing beyond the staffing needed to accommodate enrollment growth and student outcomes.
Based on the evidence presented in this report and in the prior Staffing Surge reports, the 65-year staffing surge has been a costly failure. Given the duration of the staffing surge and the pattern that real increases in taxpayer funding for public school students are diverted away from salary increases for teachers and toward the hiring of additional non-teachers, it is time to break out of the politics and bureaucracy that has consistently led to these costly uses of taxpayer funds and relatively flat student outcomes. It is time to let parents have control over the significantly higher taxpayer resources devoted to their children—significantly higher than the funds spent on students in decades past—so that parents have the power and responsibility to find the best educational settings for their children.
18BACK TO THE STAFFING SURGE
Education spending will be most effective if it relies on parental choice and private initiative—the building blocks of success throughoutour society.”
-Milton Friedman21
“
19 EDCHOICE.ORG
Some school choice skeptics believe that parents—especially disadvantaged parents—will not be able to make wise educational decisions for their children. For those who believe parents will not make good decisions for their children if they are given educational choice: How do you defend the costly staffing surge and its stagnant student outcomes? Would disadvantaged parents have chosen the staffing surge and accompanying Great Teacher Salary Stagnation? Would disadvantaged parents have chosen big increases in taxpayer funding for schools with relatively flat student outcomes? Would any parents have chosen these?No one knows exactly what parents would choose under a system of universal educational choice. No one knows exactly what new school opportunities would be discovered by educators and parents unshackled from the current politics and bureaucracy that control the traditional American public education system. All of that said, the early returns suggest that expanding educational choice for families would improve a range of student and social outcomes and that teachers would receive well-deserved pay raises.
More School Choices Yield Better Outcomes for Students and Teachers
The body of empirical evidence, on balance, shows that the limited private educational choice programs that exist today—such as school vouchers—have led to better outcomes for students who choose schools and for students who remain in public schools. Those programs not only improve student test scores, but also social outcomes. More school choice also appears to be associated with higher teacher salaries.22

20BACK TO THE STAFFING SURGE

Appendix 1 contains five figures with state-specific data. The first figure contains data on FY 1992 and FY 2014 real (inflation-adjusted) increases in public school spending per student as compared to real changes in teacher salaries. FY 2014 is the most recent data available on per-student spending.
Public schools in 47 states plus the District of Columbia experienced real increases in per-student spending—that is, adjusted for inflation, public school students in these states and D.C. spent more money per student in FY 2014 relative to FY 1992. Thus, students in these public schools had more real resources devoted to their education in FY 2014 relative to FY 1992. There were real spending decreases in three rapidly growing states: Arizona, Florida, and Nevada. Forty-nine states plus the District of Columbia had spending patterns such that inflation-adjusted salaries for teachers did not keep pace with changes in per-student spending. Nevada was the outlier.
The next four figures report staffing surge data for each state and changes in staffing ratios for FY 1992 and FY 2015. Thirty-eight states increased staff at a rate greater than what was needed to accommodate enrollment growth, and an additional 10 states plus the District of Columbia increased staff even though student enrollments declined or did not increase between fiscal years 1992 and 2015. In only one state—Arizona—did increases in public school employment not keep pace with increases in student enrollments. Of course, one would expect this pattern if public schools have some fixed personnel expenses such as central office and school administration. However, from 1992 to 2015, Arizona public schools increased its teacher force by less than its student enrollment growth, while increasing its ranks of “all other staff” far in excess of its increase in students.
Ten state departments of education did not report accurate data on public school staffing to the National Center for Education Statistics at the US Department of Education for FY 1992, FY 2015, or both years. Alternative years—that contain accurate data—are reported for nine of those states as indicated below:
South Carolina does not appear to have reported accurate data on the number of non-teachers employed in public schools for several decades. Thus, they do not have accurate data reported for total staff either.
21 EDCHOICE.ORG
APPENDIX 1 State-Specific Data
Louisiana MontanaNevada New YorkOhio Rhode IslandTexas Utah Virginia
FY 1993 and FY 2014FY 1993FY 1994FY 2012FY 2014FY 2014FY 1993FY 2014FY 1993

22BACK TO THE STAFFING SURGE
Per-Student
Spending
AverageTeacherSalaraies
-2%
7%
-13%
-14%
3%
6%
-11%
-11%
1%
11%
-9%
6%
-4%
0%
-3%
-13%
5%
-7%
-3%
12%
-3%
-2%
14%
-12%
-6%
2%
-4%
7%
7%
27%
57%
37%
-3%
52%
26%
15%
45%
49%
76%
-3%
28%
29%
9%
56%
12%
39%
45%
38%
54%
42%
45%
61%
5%
26%
54%
33%
32%
40%
United States
Alabama
Alaska
Arizona
Arkansas
California
Colorado
Connecticut
Delaware
District of Columbia
Florida
Georgia
Hawaii
Idaho
Illinois
Indiana
Iowa
Kansas
Kentucky
Louisiana
Maine
Maryland
Massachusetts
Michigan
Minnesota
Mississippi
Missouri
Montana
Nebraska
TABLE 1
StatePer-
StudentSpending
AverageTeacherSalaraies
-3%
2%
-2%
3%
4%
-8%
17%
0%
4%
2%
-3%
5%
2%
1%
-2%
1%
2%
-2%
-7%
-10%
-3%
-10%
10%
-12%
56%
29%
44%
46%
1%
90%
26%
26%
14%
38%
50%
41%
35%
41%
17%
38%
65%
26%
17%
39%
15%
85%
Nevada
New Hampshire
New Jersey
New Mexico
New York
North Carolina
North Dakota
Ohio
Oklahoma
Oregon
Pennsylvania
Rhode Island
South Carolina
South Dakota
Tennessee
Texas
Utah
Vermont
Virginia
Washington
West Virginia
Wisconsin
Wyoming
Sources: See Appendix 2.
State
Change in Inflation-Adjusted Per-Student Spending and Average Teacher Salaries by State, FY 1992 to FY 2014

23 EDCHOICE.ORG 24BACK TO THE STAFFING SURGE
Students All Staff
37%
7%
22%
56%
43%
33%
74%
55%
69%
22%
55%
67%
44%
47%
33%
28%
20%
38%
26%
4%
19%
47%
30%
3%
48%
20%
3%
11%
69%
12%
24%
50%
13%
31%
0%
43%
48%
4%
29%
11%
9%
3%
12%
7%
-11%
-16%
19%
13%
-3%
11%
United States
Alabama
Alaska
Arizona
Arkansas
California
Colorado
Connecticut
Delaware
District of Columbia
Florida
Georgia
Hawaii
Idaho
Illinois
Indiana
Iowa
Kansas
Kentucky
Louisiana
Maine
Maryland
Massachusetts
Michigan
Minnesota
Teachers
29%
6%
9%
42%
37%
20%
55%
22%
58%
3%
64%
75%
23%
34%
20%
4%
14%
28%
11%
-1%
-3%
36%
28%
2%
24%
All Other Staff
47%
8%
36%
72%
50%
48%
94%
99%
82%
47%
47%
60%
76%
69%
49%
53%
26%
50%
41%
9%
48%
60%
32%
4%
81%
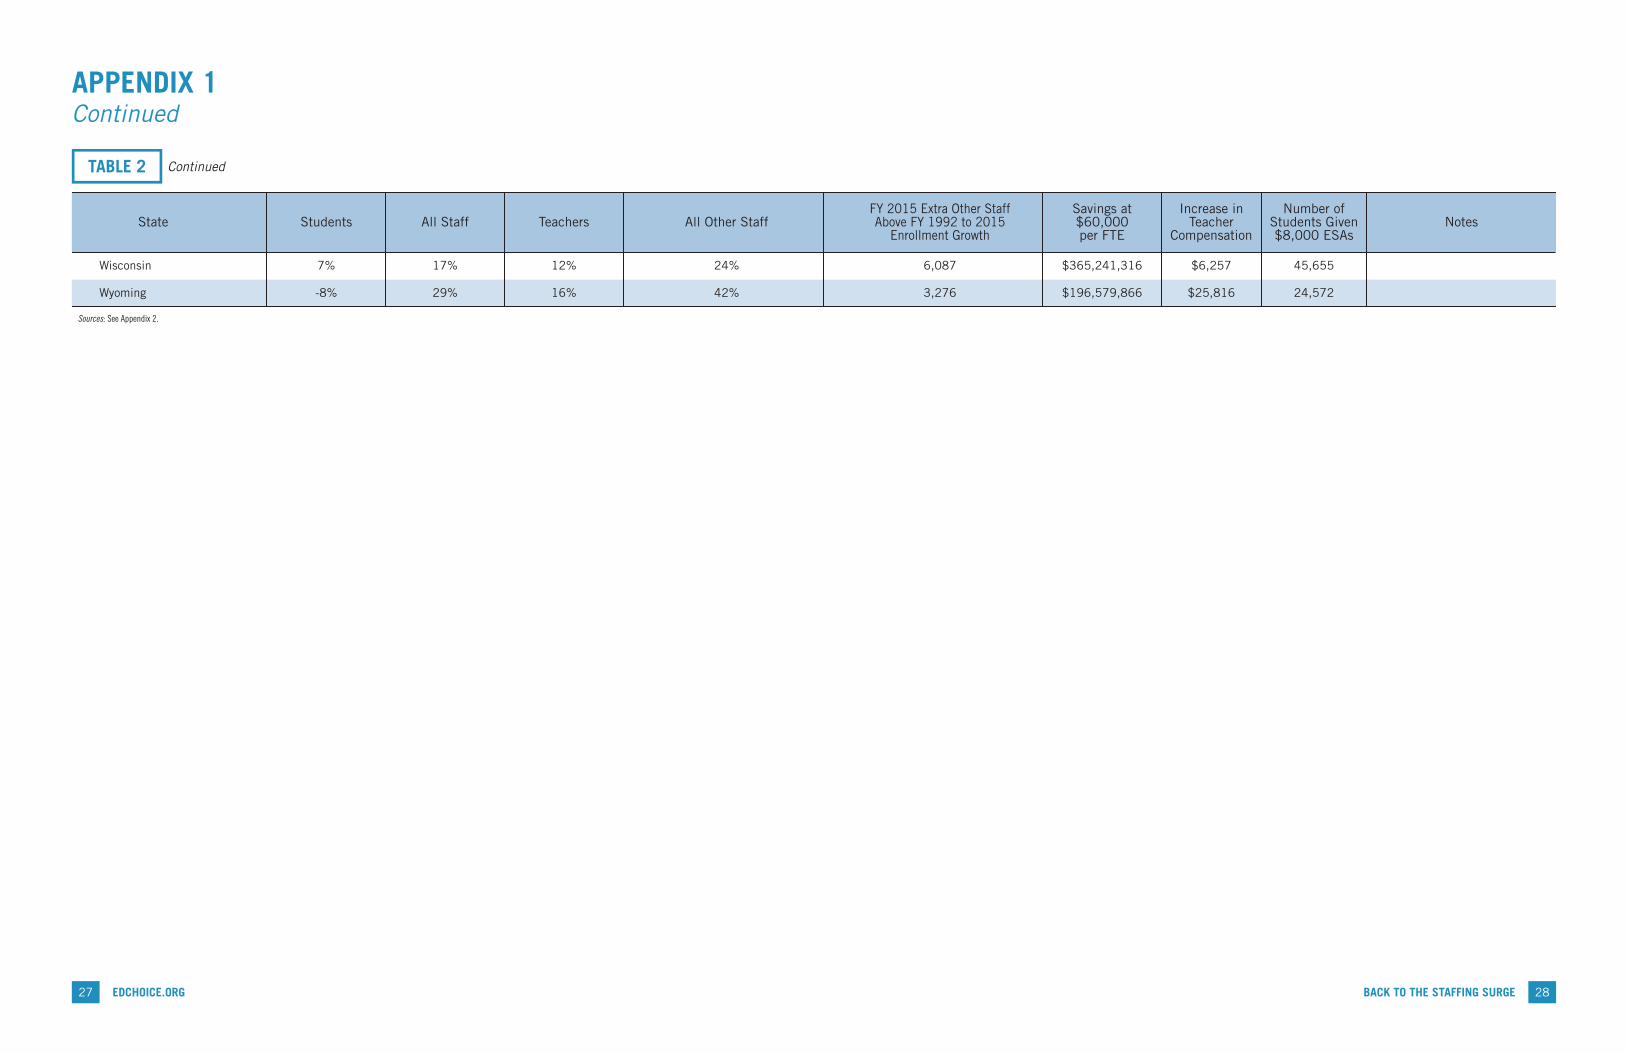
TABLE 2 Changes in Public School Students and Staff and Opportunity Costs by State, FY 1992 to FY 2015
Savings at $60,000 per FTE
FY 2015 Extra Other StaffAbove FY 1992 to 2015
Enrollment Growth
Increase inTeacher
Compensation
$11,128
$2,771
$13,385
$1,136
$16,460
$11,175
$15,250
$32,143
$15,468
$20,422
$1,441
$4,352
$22,567
$10,862
$15,040
$25,192
$11,290
$13,708
$19,445
$11,476
$29,934
$15,118
$6,912
$4,841
$25,137
$34,855,239,920
$118,434,493
$103,856,157
$54,650,683
$583,171,417
$2,991,369,304
$783,658,284
$1,351,977,838
$149,249,410
$134,078,942
$260,010,676
$485,115,477
$263,190,658
$169,547,822
$1,992,087,580
$1,424,569,010
$402,883,845
$516,243,152
$808,622,331
$532,889,320
$447,112,611
$894,910,908
$496,670,166
$411,696,112
$1,399,844,726
580,921
1,974
1,731
911
9,720
49,856
13,061
22,533
2,487
2,235
4,334
8,085
4,387
2,826
33,201
23,743
6,715
8,604
13,477
8,881
7,452
14,915
8,278
6,862
23,331
Number ofStudents Given$8,000 ESAs
4,356,905
14,804
12,982
6,831
72,896
373,921
97,957
168,997
18,656
16,760
32,501
60,639
32,899
21,193
249,011
178,071
50,360
64,530
101,078
66,611
55,889
111,864
62,084
51,462
174,981
Notes
FY 1993 and FY 2014 data.
State
APPENDIX 1 Continued

25 EDCHOICE.ORG
Students All Staff
15%
26%
7%
35%
101%
56%
58%
36%
20%
51%
29%
28%
23%
25%
28%
12%
31%
50%
61%
65%
30%
40%
43%
2%
-3%
9%
-10%
12%
95%
4%
26%
10%
2%
41%
-10%
-3%
17%
21%
3%
0%
21%
1%
19%
48%
37%
-10%
24%
24%
-12%
Mississippi
Missouri
Montana
Nebraska
Nevada
New Hampshire
New Jersey
New Mexico
New York
North Carolina
North Dakota
Ohio
Oklahoma
Oregon
Pennsylvania
Rhode Island
South Carolina
South Dakota
Tennessee
Texas
Utah
Vermont
Virginia
Washington
West Virginia
Teachers
15%
28%
1%
21%
68%
29%
43%
28%
22%
52%
17%
3%
12%
4%
21%
1%
33%
8%
52%
56%
49%
18%
32%
39%
-5%
All Other Staff
15%
24%
14%
53%
144%
89%
77%
44%
18%
51%
46%
56%
36%
48%
35%
30%
65%
49%
66%
85%
43%
50%
49%
10%
TABLE 2 Continued
Savings at $60,000 per FTE
FY 2015 Extra Other StaffAbove FY 1992 to 2015
Enrollment Growth
Increase inTeacher
Compensation
$10,055
$6,544
$12,324
$16,939
$13,769
$31,188
$17,926
$15,400
$3,452
$3,572
$21,703
$30,653
$8,872
$13,967
$13,987
$10,691
$23,446
$11,202
$6,318
$15,754
$26,532
$10,175
$8,847
$11,620
$324,887,237
$440,759,031
$126,126,587
$389,379,123
$290,959,912
$460,736,099
$2,062,638,633
$345,125,165
$723,253,717
$354,769,481
$196,389,195
$3,249,555,664
$373,277,078
$388,995,902
$1,706,787,667
$105,029,686
$225,492,580
$731,926,603
$2,162,491,330
$429,238,240
$219,573,470
$915,402,943
$526,899,985
$232,731,935
5,415
7,346
2,102
6,490
4,849
7,679
34,377
5,752
12,054
5,913
3,273
54,159
6,221
6,483
28,446
1,750
3,758
12,199
36,042
7,154
3,660
15,257
8,782
3,879
Number ofStudents Given$8,000 ESAs
40,611
55,095
15,766
48,672
36,370
57,592
257,830
43,141
90,407
44,346
24,549
406,194
46,660
48,624
213,348
13,129
28,187
91,491
270,311
53,655
27,447
114,425
65,862
29,091
Notes
FY 1993 data.
FY 1994 data.
FY 2012 data.
FY 2014 data.
FY 2014 data.
Unable to report total staff or all other staff.
FY 1993 data.
FY 2014 data.
FY 1993 data.
State
APPENDIX 1 Continued
26BACK TO THE STAFFING SURGE
27 EDCHOICE.ORG
Students All Staff
17%
29%
7%
-8%
Wisconsin
Wyoming
Teachers
12%
16%
All Other Staff
24%
42%
TABLE 2 Continued
Savings at $60,000 per FTE
FY 2015 Extra Other StaffAbove FY 1992 to 2015
Enrollment Growth
Increase inTeacher
Compensation
$6,257
$25,816
$365,241,316
$196,579,866
6,087
3,276
Number ofStudents Given$8,000 ESAs
45,655
24,572
Notes
Sources: See Appendix 2.
State
APPENDIX 1 Continued
28BACK TO THE STAFFING SURGE

29 EDCHOICE.ORG
APPENDIX 1 Continued
FY 1992Student–Staff
FY 2015Student–Staff NotesState
8.0
8.5
7.7
10.9
6.6
11.0
8.2
5.8
7.2
5.9
8.1
7.9
8.1
10.6
7.8
7.5
7.0
7.0
7.1
7.4
5.7
7.5
7.4
8.4
7.4
FY 1993 and FY 2014 data.
9.2
8.8
8.5
10.0
8.5
11.9
9.5
8.0
9.3
7.2
8.8
8.9
11.2
12.1
9.4
8.8
8.1
8.6
8.4
8.7
8.0
9.2
8.5
8.9
9.9
United States
Alabama
Alaska
Arizona
Arkansas
California
Colorado
Connecticut
Delaware
District of Columbia
Florida
Georgia
Hawaii
Idaho
Illinois
Indiana
Iowa
Kansas
Kentucky
Louisiana
Maine
Maryland
Massachusetts
Michigan
Minnesota
TABLE 3 Student–Staff Ratios by State FY 1992 and FY 2015
Sources: See Appendix 2.

30BACK TO THE STAFFING SURGE
FY 1992Student–Staff
FY 2015Student–Staff NotesState
7.2
7.2
7.1
6.7
10.2
5.8
6.0
7.3
6.7
8.1
6.1
6.9
8.0
9.6
7.2
8.2
6.9
7.8
7.8
11.4
4.8
7.2
9.6
7.1
8.4
5.6
FY 1993 data.
FY 1994 data.
FY 2012 data.
FY 2014 data.
FY 2014 data.
Unable to report total staff or all other staff.
FY 1993 data.
FY 2014 data.
FY 1993 data.
8.5
8.4
8.4
8.1
10.5
8.6
7.5
8.9
7.8
8.7
8.7
9.2
8.4
9.9
8.9
9.2
8.9
9.9
8.4
13.7
7.0
8.1
11.1
8.3
9.2
7.8
Mississippi
Missouri
Montana
Nebraska
Nevada
New Hampshire
New Jersey
New Mexico
New York
North Carolina
North Dakota
Ohio
Oklahoma
Oregon
Pennsylvania
Rhode Island
South Carolina
South Dakota
Tennessee
Texas
Utah
Vermont
Virginia
Washington
West Virginia
Wisconsin
Wyoming
TABLE 3 Continued

31 EDCHOICE.ORG
APPENDIX 1 Continued
FY 1992Student–Teacher
FY 2015Student–Teacher NotesState
16.1
17.4
16.9
23.1
13.9
23.6
17.3
12.9
13.9
12.3
15.3
15.6
15.6
18.6
15.5
18.5
14.2
13.2
16.6
15.3
12.2
14.8
13.3
18.1
15.4
FY 1993 and FY 2014 data.
17.3
17.8
16.7
19.3
17.0
22.8
17.9
14.0
16.8
12.7
17.6
18.5
18.5
19.4
16.8
17.6
15.7
15.2
17.2
17.0
14.0
16.9
15.1
19.2
17.2
United States
Alabama
Alaska
Arizona
Arkansas
California
Colorado
Connecticut
Delaware
District of Columbia
Florida
Georgia
Hawaii
Idaho
Illinois
Indiana
Iowa
Kansas
Kentucky
Louisiana
Maine
Maryland
Massachusetts
Michigan
Minnesota
TABLE 4 Student–Teacher Ratios by State FY 1992 and FY 2015
Sources: See Appendix 2.

32BACK TO THE STAFFING SURGE
FY 1992Student–Teacher
FY 2015Student–Teacher NotesState
15.2
13.6
14.1
13.6
21.7
12.5
12.2
15.2
12.9
15.6
11.8
16.3
16.4
21.6
14.3
14.5
15.3
13.8
15.2
15.3
23.0
10.6
14.2
18.0
14.0
14.9
12.4
FY 1993 data.
FY 1994 data.
FY 2012 data.
FY 2014 data.
FY 2014 data.
Unable to report total staff or all other staff.
FY 1993 data.
FY 2014 data.
FY 1993 data.
17.9
16.0
15.8
14.7
18.7
15.5
13.8
17.6
15.4
16.8
15.3
17.3
15.6
18.6
16.8
14.6
16.9
14.8
19.4
16.1
24.9
13.8
15.1
20.2
15.3
15.7
15.6
Mississippi
Missouri
Montana
Nebraska
Nevada
New Hampshire
New Jersey
New Mexico
New York
North Carolina
North Dakota
Ohio
Oklahoma
Oregon
Pennsylvania
Rhode Island
South Carolina
South Dakota
Tennessee
Texas
Utah
Vermont
Virginia
Washington
West Virginia
Wisconsin
Wyoming
TABLE 4 Continued

33 EDCHOICE.ORG
APPENDIX 1 Continued
FY 1992Student–All Other Staff
FY 2015Student–All Other Staff NotesState
16.1
16.6
14.1
20.5
12.7
20.8
15.5
10.4
15.1
11.5
17.1
15.8
16.9
24.6
15.8
12.6
13.9
14.8
12.4
14.4
10.6
15.1
16.8
15.6
14.2
FY 1993 and FY 2014 data.
19.8
17.4
17.3
20.8
17.0
24.9
20.1
18.4
20.9
16.8
17.6
17.0
28.6
32.3
21.3
17.6
17.0
20.0
16.3
17.6
18.5
20.3
19.7
16.7
23.2
United States
Alabama
Alaska
Arizona
Arkansas
California
Colorado
Connecticut
Delaware
District of Columbia
Florida
Georgia
Hawaii
Idaho
Illinois
Indiana
Iowa
Kansas
Kentucky
Louisiana
Maine
Maryland
Massachusetts
Michigan
Minnesota
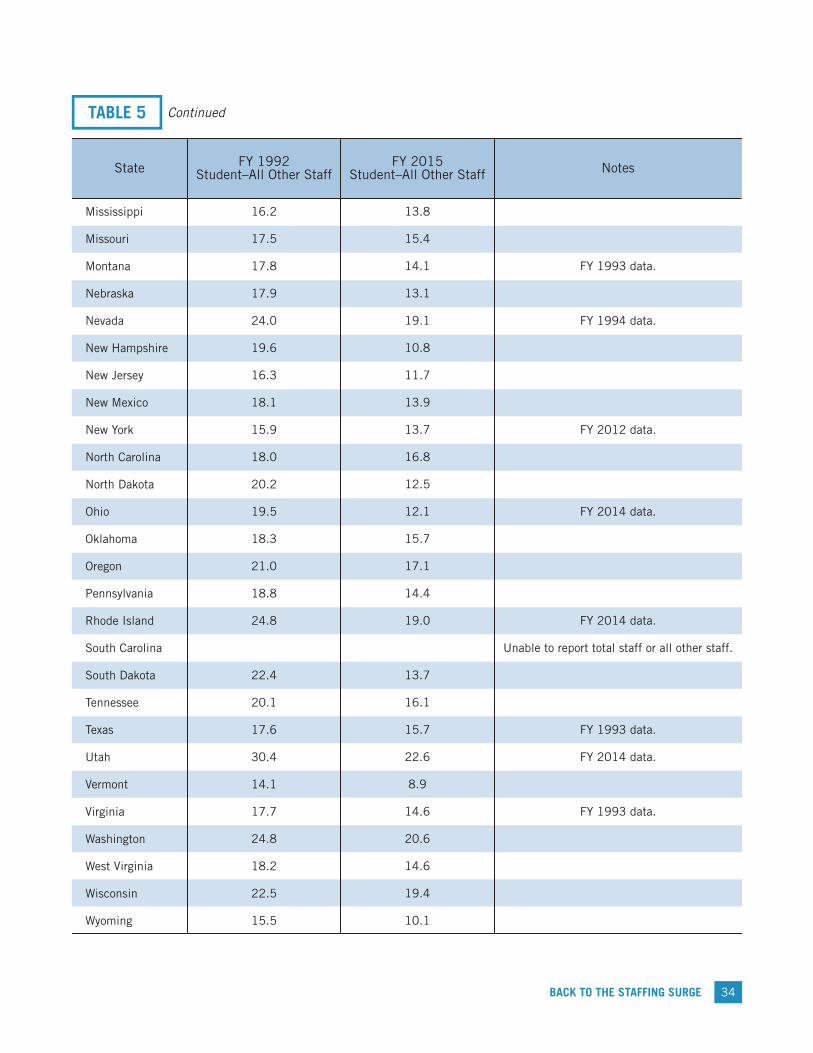
TABLE 5 Student–"All Other Staff" Ratios by State FY 1992 and FY 2015
Sources: See Appendix 2.
34BACK TO THE STAFFING SURGE
FY 1992Student–All Other Staff
FY 2015Student–All Other Staff NotesState
13.8
15.4
14.1
13.1
19.1
10.8
11.7
13.9
13.7
16.8
12.5
12.1
15.7
17.1
14.4
19.0
13.7
16.1
15.7
22.6
8.9
14.6
20.6
14.6
19.4
10.1
FY 1993 data.
FY 1994 data.
FY 2012 data.
FY 2014 data.
FY 2014 data.
Unable to report total staff or all other staff.
FY 1993 data.
FY 2014 data.
FY 1993 data.
16.2
17.5
17.8
17.9
24.0
19.6
16.3
18.1
15.9
18.0
20.2
19.5
18.3
21.0
18.8
24.8
22.4
20.1
17.6
30.4
14.1
17.7
24.8
18.2
22.5
15.5
Mississippi
Missouri
Montana
Nebraska
Nevada
New Hampshire
New Jersey
New Mexico
New York
North Carolina
North Dakota
Ohio
Oklahoma
Oregon
Pennsylvania
Rhode Island
South Carolina
South Dakota
Tennessee
Texas
Utah
Vermont
Virginia
Washington
West Virginia
Wisconsin
Wyoming
TABLE 5 Continued

35 EDCHOICE.ORG
APPENDIX 2 Expanded Notes and Sources for FiguresFIGURE E1Thomas D. Snyder and Charlene M. Hoffman (1994), Digest of Education Statistics 1994 (NCES No. 94–115), Table 42, p. 56, retrieved from https://nces.ed.gov/pubs94/94115.pdf; National Center for Education Statistics, Table 84. Staff and Teachers in Public Elementary and Secondary Schools, by State: Fall 1987 to Fall 1993 [web page], last modified April 1995, retrieved from https://nces.ed.gov/programs/digest/d95/dtab084.asp; National Center for Education Statistics, Table 201.10. Historical Summary of Public Elementary and Secondary School Statistics: Selected Years, 1869-70 through 2012-13 [web page], last modified January 2016, retrieved from https://nces.ed.gov/programs/digest/d15/tables/dt15_201.10.asp; National Center for Education Statistics, Table 203.40. Enrollment in Public Elementary and Secondary Schools, by Level, Grade, and State or Jurisdiction: Fall 2013 [web page], last modified August 2015, retrieved from https://nces.ed.gov/programs/digest/d15/tables/dt15_203.40.asp
FIGURE E2Spending data come from National Center for Education Statistics, Common Core of Data (CCD), "State Nonfiscal Public Elementary/Secondary Education Survey," 2010-11 v.1a, 2011-12 v.1a and "State Nonfiscal Public Elementary/Secondary Education Survey Directory Data," 2014-15 v.1a, accessed February 24, 2017, retrieved via ElSi tableGenerator from https://nces.ed.gov/ccd/elsi/tableGenerator.aspx; National Center for Education Statistics, Table 236.75. Total and Current Expenditures Per Pupil in Fall Enrollment in Public Elementary and Secondary Schools, by Function and State or Jurisdiction: 2013-14 [web page], last modified July 2016, retrieved from https://nces.ed.gov/programs/digest/d16/tables/dt16_236.75.asp. Average teacher salaries come from National Center for Education Statistics, Table 77. Estimated Average Annual Salary of Teachers in Public Elementary and Secondary Schools, by State: 1969-70 to 1994-95 [web page], last modified April 1995, retrieved from https://nces.ed.gov/programs/digest/d95/dtab077.asp; National Center for Education Statistics, Table 211.60. Estimated Average Annual Salary of Teachers in Public Elementary and Secondary Schools, by State: Selected Years, 1969-70 [web page], last modified September 2015, retrieved from https://nces.ed.gov/programs/digest/d15/tables/dt15_211.60.asp. The FY 1992 average teacher salary is inflation-adjusted by the January 1992 and January 2014 CPI-U, available from Bureau of Labor Statistics, CPI-All Urban Consumers, retrieved from https://data.bls.gov/cgi-bin/surveymost?bls. Data on student enrollments and FTE staff come from Thomas D. Snyder and Charlene M. Hoffman (1994), Digest of Education Statistics 1994 (NCES No. 94–115), Table 42, p. 56, retrieved from https://nces.ed.gov/pubs94/94115.pdf; National Center for Education Statistics, Table 84. Staff and Teachers in Public Elementary and Secondary Schools, by State: Fall 1987 to Fall 1993 [web page], last modified April 1995, retrieved from https://nces.ed.gov/programs/digest/d95/dtab084.asp; National Center for Education Statistics, Table 203.45. Enrollment in Public Elementary and Secondary Schools, by Level, Grade, and State or Jurisdiction: Fall 2013 [web page], last modified August 2015, retrieved from https://nces.ed.gov/programs/digest/d16/tables/dt16_203.45.asp; National Center for Education Statistics, Table 213.20. Staff Employed in Public Elementary and Secondary School Systems, by Type of Assignment and State or Jurisdiction: Fall 2013 [web page], last modified August 2014, retrieved from https://nces.ed.gov/programs/digest/d15/tables/dt15_213.20.asp
FIGURE E3Author’s calculations; National Center for Education Statistics, Table 38. Enrollment in Public Elementary and Secondary Schools, by Level, Grade, and State or Jurisdiction: Fall 2008 [web page], last modified November 2010, retrieved from https://nces.ed.gov/programs/digest/d11/tables/dt11_038.asp; National

36BACK TO THE STAFFING SURGE
Center for Education Statistics, Table 87. Staff Employed in Public Elementary and Secondary School Systems, by Type of Assignment and State or Jurisdiction: Fall 2008 [web page], last modified February 2012, retrieved from https://nces.ed.gov/programs/digest/d11/tables/dt11_087.asp; National Center for Education Statistics, Table 203.45. Enrollment in Public Elementary and Secondary Schools, by Level, Grade, and State or Jurisdiction: Fall 2011 [web page], last modified August 2013, retrieved from https://nces.ed.gov/programs/digest/d14/tables/dt14_203.45.asp; National Center for Education Statistics, Table 213.40. Staff, Teachers, and Teachers as a Percentage of Staff in Public Elementary and Secondary Schools Systems, by state or Jurisdiction: Selected Years, Fall 2000 through Fall 2012 [web page], last modified October 2014, retrieved from https://nces.ed.gov/programs/digest/d14/tables/dt14_213.40.asp
FIGURE E4Author’s calculations; National Center for Education Statistics, Table 203.40. Enrollment in Public Elementary and Secondary Schools, by Level, Grade, and State or Jurisdiction: Fall 2014 [web page], last modified August 2016, retrieved from https://nces.ed.gov/programs/digest/d16/tables/dt16_203.40.asp; National Center for Education Statistics, Table 213.40. Staff, Teachers, and Teachers as a Percentage of Staff in Public Elementary and Secondary School Systems, by State or Jurisdiction: Selected Years, Fall 2000 through Fall 2014 [web page], last modified August 2016, retrieved from https://nces.ed.gov/programs/digest/d16/tables/dt16_213.40.asp; National Center for Education Statistics, Table 38. Enrollment in Public Elementary and Secondary Schools, by Level, Grade, and State or Jurisdiction: Fall 2008 [web page], last modified November 2010, retrieved from https://nces.ed.gov/programs/digest/d11/tables/dt11_038.asp; National Center for Education Statistics, Table 87. Staff Employed in Public Elementary and Secondary School Systems, by Type of Assignment and State or Jurisdiction: Fall 2008 [web page], last modified February 2012, retrieved from https://nces.ed.gov/programs/digest/d11/tables/dt11_087.asp
FIGURE 1Author's calculations; Thomas D. Snyder and Charlene M. Hoffman (1991), Digest of Education Statistics 1991 (NCES No. 91–697), Table 37, p. 47 and Table 77, p. 86, retrieved from https://nces.ed.gov/pubs91/91697.pdf; National Center for Education Statistics, Table 36. Enrollment in Public Elementary and Secondary Schools, by State or Jurisdiction, Selected Years: Fall 1990 through Fall 2010 [web page], last modified November 2010, retrieved from https://nces.ed.gov/programs/digest/d10/tables/dt10_036.asp; National Center for Education Statistics, Table 36. Staff and Teachers in Public Elementary and Secondary School Systems, by State or Jurisdiction: Fall 2000 through Fall 2008 [web page], last modified November 2010, retrieved from https://nces.ed.gov/programs/digest/d10/tables/dt10_036.asp
FIGURE 2Author's calculations; Thomas D. Snyder (1994), Digest of Education Statistics 1994 (NCES No. 94–115), Table 42, p. 56, retrieved from https://nces.ed.gov/pubs94/94115.pdf; National Center for Education Statistics (1995), Staff and Teachers in Public Elementary and Secondary Schools, by State: Fall 1987 to Fall 1993 [web page], last modified April 1995, retrieved from https://nces.ed.gov/programs/digest/d95/dtab084.asp; National Center for Education Statistics, Table 36. Enrollment in Public Elementary and Secondary Schools, by State or Jurisdiction, Selected Years: Fall 1990 through Fall 2010 [web page], last modified November 2010, retrieved from https://nces.ed.gov/programs/digest/d10/tables/dt10_036.asp; National Center for Education Statistics, Table 87. Staff and Teachers in Public Elementary and Secondary School Systems, by State or Jurisdiction: Fall 2000 through Fall 2008 [web page], last modified November 2010, retrieved from https://nces.ed.gov/programs/digest/d10/tables/dt10_087.asp

37 EDCHOICE.ORG
FIGURE 4National Center for Education Statistics, Table 100. High School Graduates, by Sex and Control of Schools: Selected Years, 186 High School Graduates, by Sex and Control of Schools: Selected Years, 1869-70 through 2007-08 [web page], last modified July 2007, retrieved from https://nces.ed.gov/programs/digest/d07/tables/dt07_100.asp; National Center for Education Statistics, Table 219.35. Public High School Averaged Freshman Graduation Rate (AFGR), by State or Jurisdiction: Selected Years, 1990-91 through 2012-13 [web page], last modified January 2016, retrieved from https://nces.ed.gov/programs/digest/d15/tables/dt15_219.35.asp
FIGURE 5Author's calculations; National Center for Education Statistics, Table 38. Enrollment in Public Elementary and Secondary Schools, by Level, Grade, and State or Jurisdiction: Fall 2008 [web page], last modified November 2010, retrieved from https://nces.ed.gov/programs/digest/d11/tables/dt11_038.asp; National Center for Education Statistics, Table 87. Staff Employed in Public Elementary and Secondary School Systems, by Type of Assignment and State or Jurisdiction: Fall 2008 [web page], last modified February 2012, retrieved from https://nces.ed.gov/programs/digest/d11/tables/dt11_087.asp; National Center for Education Statistics, Table 203.45. Enrollment in Public Elementary and Secondary Schools, by Level, Grade, and State or Jurisdiction: Fall 2011 [web page], last modified August 2013, retrieved from https://nces.ed.gov/programs/digest/d14/tables/dt14_203.45.asp; National Center for Education Statistics, Table 213.40. Staff, Teachers, and Teachers as a Percentage of Staff in Public Elementary and Secondary Schools Systems, by State or Jurisdiction: Selected Years, Fall 2000 through Fall 2012 [web page], last modified October 2014, retrieved from https://nces.ed.gov/programs/digest/d14/tables/dt14_213.40.asp
FIGURE 6Author's calculations; National Center for Education Statistics, Table 203.40. Enrollment in Public Elementary and Secondary Schools, by Level, Grade, and State or Jurisdiction: Fall 2014 [web page], last modified August 2016, retrieved from https://nces.ed.gov/programs/digest/d16/tables/dt16_203.40.asp; National Center for Education Statistics, Table 213.40 Staff, Teachers, and Teachers as a Percentage of Staff in Public Elementary and Secondary School Systems, by State or Jurisdiction: Selected Years, Fall 2000 through Fall 2014 [web page], last modified August 2016, retrieved from https://nces.ed.gov/programs/digest/d16/tables/dt16_213.40.asp; National Center for Education Statistics, Table 38. Enrollment in Public Elementary and Secondary Schools, by Level, Grade, and State or Jurisdiction: Fall 2008 [web page], last modified November 2010, retrieved from https://nces.ed.gov/programs/digest/d11/tables/dt11_038.asp; National Center for Education Statistics, Table 87. Staff Employed in Public Elementary and Secondary School Systems, by Type of Assignment and State or Jurisdiction: Fall 2008 [web page], last modified February 2012, retrieved from https://nces.ed.gov/programs/digest/d11/tables/dt11_087.asp
FIGURE 9National Center for Education Statistics, Common Core of Data (CCD), "National Public Education Financial Survey (State Fiscal)," 2013-14 (FY 2014) v.1a and "State Nonfiscal Public Elementary/Secondary Education Survey Directory Data," 2014-15 v.1a, accessed February 24, 2017, retrieved via ElSi tableGenerator from https://nces.ed.gov/ccd/elsi/tableGenerator.aspx; National Center for Education Statistics, Table 236.75. Total and Current Expenditures Per Pupil in Fall Enrollment in Public Elementary and Secondary Schools, by Function and State or Jurisdiction: 2013-14 [web page], last modified July 2016, retrieved from https://nces.ed.gov/programs/digest/d16/tables/dt16_236.75.asp

38BACK TO THE STAFFING SURGE
FIGURE 10National Center for Education Statistics, Table 77. Estimated Average Annual Salary of Teachers in Public Elementary and Secondary Schools, by State: 1969-70 to 1994-95 [web page], last modified April 1995, retrieved from https://nces.ed.gov/programs/digest/d95/dtab077.asp; National Center for Education Statistics, Table 211.60. Estimated Average Annual Salary of Teachers in Public Elementary and Secondary Schools, by State: Selected Years, 1969-70 [web page], last modified September 2015, retrieved from https://nces.ed.gov/programs/digest/d15/tables/dt15_211.60.asp. The FY 1992 average teacher salary is inflation-adjusted by the January 1992 and January 2014 CPI-U, available from Bureau of Labor Statistics, CPI-All Urban Consumers, accessed February 24, 2017, retrieved from https://data.bls.gov/cgi-bin/surveymost?bls
FIGURE 11National Center for Education Statistics, Common Core of Data (CCD), "National Public Education Financial Survey (State Fiscal)," 2013-14 (FY 2014) v.1a and "State Nonfiscal Public Elementary/Secondary Education Survey Directory Data," 2014-15 v.1a, accessed February 24, 2017, retrieved via ElSi tableGenerator from https://nces.ed.gov/ccd/elsi/tableGenerator.aspx; National Center for Education Statistics, Table 236.75. Total and Current Expenditures Per Pupil in Fall Enrollment in Public Elementary and Secondary Schools, by Function and State or Jurisdiction: 2013-14 [web page], last modified July 2016, retrieved from https://nces.ed.gov/programs/digest/d16/tables/dt16_236.75.asp. Average teacher salaries come from National Center for Education Statistics, Table 77. Estimated Average Annual Salary of Teachers in Public Elementary and Secondary Schools, by State: 1969-70 to 1994-95 [web page], last modified April 1995, retrieved from https://nces.ed.gov/programs/digest/d95/dtab077.asp; National Center for Education Statistics, Table 211.60. Estimated Average Annual Salary of Teachers in Public Elementary and Secondary Schools, by State: Selected Years, 1969-70 [web page], last modified September 2015, retrieved from https://nces.ed.gov/programs/digest/d15/tables/dt15_211.60.asp. The FY 1992 average teacher salary is inflation-adjusted by the January 1992 and January 2014 CPI-U, available from Bureau of Labor Statistics, CPI-All Urban Consumers, accessed February 24, 2017, retrieved from https://data.bls.gov/cgi-bin/surveymost?bls. Data on student enrollments and FTE staff come from National Center for Education Statistics, Thomas D. Snyder and Charlene M. Hoffman (1994), Digest of Education Statistics 1994 (NCES No. 94–115), Table 42, p. 56, retrieved from https://nces.ed.gov/pubs94/94115.pdf; National Center for Education Statistics, Table 84. Staff and Teachers in Public Elementary and Secondary Schools, by State: Fall 1987 to Fall 1993 [web page], last modified April 1995, retrieved from NCES website: https://nces.ed.gov/programs/digest/d95/dtab084.asp; National Center for Education Statistics, Table 213.20. Staff Employed in Public Elementary and Secondary School Systems, by Type of Assignment and State or Jurisdiction: Fall 2013 [web page], last modified August 2014, retrieved from https://nces.ed.gov/programs/digest/d15/tables/dt15_213.20.asp; National Center for Education Statistics, Table 203.45. Enrollment in Public Elementary and Secondary Schools, by Level, Grade, and State or Jurisdiction: Fall 2013 [web page], last modified August 2015, retrieved from https://nces.ed.gov/programs/digest/d16/tables/dt16_203.45.asp
FIGURE 12Thomas D. Snyder and Charlene M. Hoffman (1994), Digest of Education Statistics 1994 (NCES No. 94–115), Table 42, p. 56, retrieved from https://nces.ed.gov/pubs94/94115.pdf, National Center for Education Statistics, Table 84. Staff and Teachers in Public Elementary and Secondary Schools, by State: Fall 1987 to Fall 1993 [web page], last modified April 1995, retrieved from https://nces.ed.gov/programs/digest/d95/dtab084.asp; National Center for Education Statistics, Table 203.40. Enrollment in Public Elementary and Secondary Schools, by Level, Grade, and State or Jurisdiction: Fall 2014 [web page], last modified August 2016, retrieved from https://nces.ed.gov/programs/digest/d16/tables/dt16_203.40.asp; National Center for Education

39 EDCHOICE.ORG
Statistics, Table 213.40. Staff, Teachers, and Teachers as a Percentage of Staff in Public Elementary and Secondary School Systems, by State or Jurisdiction: Selected Years, Fall 2000 through Fall 2014 [web page], last modified August 2016, retrieved from https://nces.ed.gov/programs/digest/d16/tables/dt16_213.40.asp
FIGURE 13Thomas D. Snyder and Charlene M. Hoffman (1994), Digest of Education Statistics 1994 (NCES No. 94–115), Table 42, p. 56, retrieved from https://nces.ed.gov/pubs94/94115.pdf; National Center for Education Statistics, Table 84. Staff and Teachers in Public Elementary and Secondary Schools, by State: Fall 1987 to Fall 1993 [web page], last modified April 1995, retrieved from https://nces.ed.gov/programs/digest/d95/dtab084.asp; National Center for Education Statistics, Table 201.10. Historical Summary of Public Elementary and Secondary School Statistics: Selected Years, 1869-70 through 2012-13 [web page], last modified January 2016, retrieved from https://nces.ed.gov/programs/digest/d15/tables/dt15_201.10.asp; National Center for Education Statistics, Table 203.40. Enrollment in Public Elementary and Secondary Schools, by Level, Grade, and State or Jurisdiction: Fall 2014 [web page], last modified August 2016, retrieved from https://nces.ed.gov/programs/digest/d16/tables/dt16_203.40.asp; National Center for Education Statistics, Table 213.40. Staff, Teachers, and Teachers as a Percentage of Staff in Public Elementary and Secondary School Systems, by State or Jurisdiction: Selected Years, Fall 2000 through Fall 2014 [web page], last modified August 2016, retrieved from https://nces.ed.gov/programs/digest/d16/tables/dt16_213.40.asp
FIGURE 14Ibid.
TABLE 1Spending data come from National Center for Education Statistics, Common Core of Data (CCD), "State Nonfiscal Public Elementary/Secondary Education Survey," 2010-11 v.1a, 2011-12 v.1a and "State Nonfiscal Public Elementary/Secondary Education Survey Directory Data," 2014-15 v.1a, accessed February 24, 2017, retrieved via ElSi tableGenerator from https://nces.ed.gov/ccd/elsi/tableGenerator.aspx; National Center for Education Statistics, Table 236.75. Total and Current Expenditures Per Pupil in Fall Enrollment in Public Elementary and Secondary Schools, by Function and State or Jurisdiction: 2013-14 [web page], last modified July 2016, retrieved from https://nces.ed.gov/programs/digest/d16/tables/dt16_236.75.asp. Average teacher salaries come from National Center for Education Statistics (1995), Table 77. Estimated Average Annual Salary of Teachers in Public Elementary and Secondary Schools, by State: 1969-70 to 1994-95 [web page], last modified April 1995, retrieved from https://nces.ed.gov/programs/digest/d95/dtab077.asp; National Center for Education Statistics, Table 211.60. Estimated Average Annual Salary of Teachers in Public Elementary and Secondary Schools, by State: Selected Years, 1969–70 [web page], last modified September 2015, retrieved from https://nces.ed.gov/programs/digest/d15/tables/dt15_211.60.asp. The FY 1992 average teacher salary is inflation-adjusted by the January 1992 and January 2014 CPI-U, available from Bureau of Labor Statistics, CPI-All Urban Consumers, accessed February 24, 2017, retrieved from https://data.bls.gov/cgi-bin/surveymost?bls. Data on student enrollments and FTE staff come from Thomas D. Snyder and Charlene M. Hoffman (1994), Digest of Education Statistics 1994 (NCES No. 94–115), Table 42, p. 56, retrieved from https://nces.ed.gov/pubs94/94115.pdf; National Center for Education Statistics, Table 84. Staff and Teachers in Public Elementary and Secondary Schools, by State: Fall 1987 to Fall 1993 [web page], last modified April 1995, retrieved from https://nces.ed.gov/programs/digest/d95/dtab084.asp; National Center for Education Statistics, Table 203.45. Enrollment in Public Elementary and Secondary Schools, by Level, Grade, and State or Jurisdiction: Fall 2013 [web page], last modified August 2015, retrieved from https://nces.ed.gov/programs/digest/d16/tables/dt16_203.45.asp; National Center for Education Statistics,

40BACK TO THE STAFFING SURGE
Table 213.20. Staff Employed in Public Elementary and Secondary School Systems, by Type of Assignment and State or Jurisdiction: Fall 2013 [web page], last modified August 2014, retrieved from https://nces.ed.gov/programs/digest/d15/tables/dt15_213.20.asp
TABLE 2Ibid.
TABLE 3Ibid.
TABLE 4Ibid.
TABLE 5Ibid.

41 EDCHOICE.ORG
NOTES1 Benjamin Scafidi (2012), The Staffing Surge: Decades of Employment Growth in America’s Public Schools, retrieved from EdChoice website: http://www.edchoice.org/wp-content/uploads/2015/07/11-2012-Staffing-Surge-WEB.pdf
2 Benjamin Scafidi (2013), The Staffing Surge: Decades of Employment Growth in America’s Public Schools, Part II, retrieved from EdChoice website: http://www.edchoice.org/wp-content/uploads/2015/07/2013-2-Staffing-Surge-Part-II.pdf
3 National Center for Education Statistics, Common Core of Data (CCD), "State Nonfiscal Public Elementary/Secondary Education Survey," 2010-11 v.1a, 2011-12 v.1a and "State Nonfiscal Public Elementary/Secondary Education Survey Directory Data," 2014-15 v.1a, accessed February 24, 2017, retrieved via ElSi tableGenerator from https://nces.ed.gov/ccd/elsi/tableGenerator.aspx
4 I encourage researchers at local universities and state policy think tanks to ask their state departments of education for historical personnel files on public school employees. Researchers would be able to use these data to conduct their own analyses of employment growth in public schools in their respective states to analyze which specific job positions led to the staffing surges in their states. These personnel files are public information and are easily uploaded onto an FTP server for distribution to researchers.
5 The NAEP Long-Term Trend Assessment is given every four years to a national sample of nine-, 13-, and 17-year-old students. This exam is better than the Main NAEP Assessment for analyzing national trends over time because the Long-Term Trend Assessment has been “relatively unchanged” since it was created, whereas the Main NAEP Assessment changes “about every decade to reflect changes in curriculum.” That is, the Long-Term Trend scores are designed to measure long term trends. For a description of the NAEP Long-Term Trend Assessment and how it compares to the Main NAEP Assessment, see National Center for Education Statistics, NAEP Overview, last modified March 30, 2016, retrieved from http://nces.ed.gov/nationsreportcard/about/ltt_main_diff.asp. Thus, the Long-Term Trend scores, allow for an apples-to-apples comparison of achievement over time, whereas the Main NAEP Assessment does not. NAEP scores for nine and 13-year-olds have increased over time on the Long Term Trend Assessment. That improvement in younger grades does not necessarily benefit students when their scores decline and stagnate as they get older and graduate high school—and enter the labor force or post-secondary education. As an example, for admissions decisions, colleges do not ask for evidence of elementary and middle school achievement—they ask only for evidence of student achievement in high school.
6 This estimate of the high school graduation rate is the Averaged Freshman Graduation Rate (AFGR). The AFGR is the most accurate estimate of the public high school graduation rate
available for this time period. The AFGR equals the number of public high school graduates in a given year divided by the sum of the number of eighth and ninth graders three and four years previously—divided by two. Thus, the AFGR has a denominator that is the average of the number of eighth and ninth graders three and four years prior. The AFGR decreased significantly for American public schools from 1970 to about the year 2000. In the new century, public high school graduation rates have increased rapidly, especially during the Great Recession. See National Center for Education Statistics, Public High School Averaged Freshman Graduation Rate (AFGR), by State or Jurisdiction: Selected Years, 1990-91 through 2012-13 [web page], last modified January 2016, retrieved from https://nces.ed.gov/programs/digest/d15/tables/dt15_219.35.asp. This issue of graduation rates and their relationship to public school staffing trends is discussed further on pages 11 and 12 in this report. For more information on the validity of using the AFGR to measure graduation rates and for trends in the AFGR after 1970, see James J. Heckman and Paul A. LaFontaine (2010), The American High School Graduation Rate: Trends and Levels, Review of Economics and Statistics, 92(2), pp. 244–262, https://www.jstor.org/stable/27867535
7 The original Staffing Surge report contains a description of the evidence that public school students have become slightly more advantaged in recent years in terms of possessing characteristics that have historically been favorable for promoting student outcomes. See Benjamin Scafidi (2012), The Staffing Surge: Decades of Employment Growth in America’s Public Schools, pp. 8–9, retrieved from EdChoice website: http://www.edchoice.org/wp-content/uploads/2015/07/11-2012-Staffing-Surge-WEB.pdf 8 There are only four empirical studies that analyze the issue of whether students are becoming more advantaged or disadvantaged over time in terms of characteristics that have historically been favorable for academic achievement. Each of these four studies finds that students in more recent years have characteristics that are, on balance, more favorable for student achievement. In alphabetical order by first author’s last name, these studies are: Jay P. Greene and Greg Forster (2004), The Teachability Index: Can Disadvantaged Students Learn? (Center for Civic Innovation Education Working Paper No. 5), retrieved from Manhattan Institute website: http://www.manhattan-institute.org/pdf/ewp_06.pdf; Jay P. Greene and Brian Kisida (2012, September), The Educability Index, paper presented at the School Productivity Project Conference, George W. Bush Institute, Dallas, TX; David W. Grissmer, Sheila N. Kirby, Mark Berends, and Stephanie Williamson (1994), Student Achievement and the Changing American Family, retrieved from RAND Corporation website: https://www.rand.org/content/dam/rand/pubs/monograph_reports/2006/MR488.pdf; Caroline M. Hoxby (2003), School Choice and Competition: Evidence from the United States, Swedish Economic Policy Review, 10, pp. 9-65, retrieved from http://www.government.se/49b73e/contentassets/25c599d2a5a241b98255e7650f3da9ec/caroline-m.-hoxby-school-choice-and-school-competition 9 Benjamin Scafidi (2013), The Staffing Surge: Decades of

42BACK TO THE STAFFING SURGE
Employment Growth in America’s Public Schools, Part II, retrieved from EdChoice website: http://www.edchoice.org/wp-content/uploads/2015/07/2013-2-Staffing-Surge-Part-II.pdf
10 Federal Reserve Bank of St. Louis, Total Unemployed, Plus All Marginally Attached Workers Plus Total Employed Part Time for Economic Reasons (U6RATE) [graph], retrieved from https://fred.stlouisfed.org/series/U6RATE
11 The job losses in the American public education sector were surely greatly mitigated by the American Recovery and Reinvestment Act of 2009, the stimulus package pushed by President Barack Obama and passed by Congress. Ibid.
12 For example, in the wake of efforts in 2008 to improve the accuracy of reported public high school graduation rates, the U.S. Department of Education granted waivers to states to allow GED’s, alternative diplomas, and students who graduated late to be counted as on-time graduates, which have the effect of inflating reported graduation statistics. Alliance for Excellent Education (2013), The Effect of ESSA Waiver Plans on High School Graduation Rate Accountability, retrieved from Alliance for Excellent Education website: http://all4ed.org/wp-content/uploads/2013/06/ESEAWaivers.pdf
13 Benjamin Scafidi (2012), The Staffing Surge: Decades of Employment Growth in America’s Public Schools, p. 24, retrieved from EdChoice website: http://www.edchoice.org/wp-content/uploads/2015/07/11-2012-Staffing-Surge-WEB.pdf
14 It is typical for interest groups to suggest that the actual cost of providing their good or service has increased at a rate greater than the CPI-U—and advocates for public schools make this claim as well. The CPI-U is a reasonable measure to use for inflation for the purposes of the analysis here for several reasons, including: (a) the CPI-U overstates actual inflation (for a good lay description of this issue, see Scott Winship (June 15, 2015), Debunking Disagreement Over Cost-Of-Living Adjustment, Forbes, retrieved from http://www.forbes.com/sites/scottwinship/2015/06/15/debunking-disagreement-over-cost-of-living-adjustment/#203f4e1170fc ), so if actual inflation is truly higher than average in some situation the CPI-U will be a more accurate representation of inflation in that situation; (b) most public school expenditures are for wages and salaries—and people who receive wages and salaries experience increases in their standard of living when their incomes increase faster than true increases in prices—and the CPI-U overstates those true increases in prices; and (c) regarding other items that public schools purchase, some have increased at rates faster than the CPI-U (construction materials, health insurance), while others have increased at rates slower than the CPI-U or even decreased over time (energy, food, technology). For each of these reasons, it is reasonable to use the CPI-U for the purposes of this report.
15 This moniker, the “Great Teacher Salary Stagnation”, surely owes its name to the title of a book by economist Tyler Cowen (2011), The Great Stagnation: How America Ate All
the Low-Hanging Fruit of Modern History, Got Sick, and Will (Eventually) Feel Better.
16 Interestingly, public school advocates typically claim that they face very large fixed costs—especially when testifying against school choice legislation. Thus, they claim that a significant portion of their costs will not increase in the presence of student enrollment growth, as these costs are fixed. The decades-long staffing surge that began at least as far back as 1950 indicates that public school personnel are actually quite variable—they are hired at a rate that exceeds the growth in the student population.
17 This trend of hiring more non-teachers relative to teachers may have predated the 1949–50 school year, but there are no readily apparent data that would allow one to analyze public school hiring trends prior to FY 1950.
18 In the salary and benefit cost information available via ElSi (https://nces.ed.gov/ccd/elsi), the salaries and benefits of teacher aides were not able to be separated from the salary and benefit costs of teachers. Since teacher aides surely have salary and benefit costs below $64,323 annually, the lower figure of $60,000 as the average salary and benefit cost average for all non-teachers is used to calculate opportunity costs in this report. $60,000 is a cautious figure for average salary and benefit costs for the current fiscal year and into the future—given recent pay increases and given the increasing cost of employee benefits in the public sector.
19 There were 580,921 non-teachers in FY 2015 over and above the increase in non-teachers (“all other staff”) needed to accommodate student enrollment growth after FY 1992. A cautious estimate of the annual total employment cost of these additional non-teachers is: 580,921 x $60,000 = $34,855,000,000 (rounded to the nearest hundred-million dollars). Author’s calculations; Thomas D. Snyder and Charlene M. Hoffman (1994), Digest of Education Statistics 1994 (NCES No. 94–115), Table 42, p. 56, retrieved from https://nces.ed.gov/pubs94/94115.pdf; National Center for Education Statistics, Table 84. Staff and Teachers in Public Elementary and Secondary Schools, by State: Fall 1987 to Fall 1993 [web page], last modified April 1995, retrieved from https://nces.ed.gov/programs/digest/d95/dtab084.asp; National Center for Education Statistics, Table 203.40. Enrollment in Public Elementary and Secondary Schools, by Level, Grade, and State or Jurisdiction: Fall 2014 [web page], last modified August 2016, retrieved from https://nces.ed.gov/programs/digest/d16/tables/dt16_203.40.asp; National Center for Education Statistics, Table 213.40. Staff, Teachers, and Teachers as a Percentage of Staff in Public Elementary and Secondary School Systems, by State or Jurisdiction: Selected Years, Fall 2000 through Fall 2014 [web page], last modified August 2016, retrieved from https://nces.ed.gov/programs/digest/d16/tables/dt16_213.40.asp
20 Irina Stefanescu and Ivan Vidangos (2014, October 31), Introducing Actuarial Liabilities and Funding Status of Defined-Benefit Pensions in the U.S. Financial Accounts [FEDS Note], retrieved from https://www.federalreserve.gov/

43 EDCHOICE.ORG
econresdata/notes/feds-notes/2014/introducing-actuarial-liabilities-funding-status-defined-benefit-pensions-us-financial-accounts-20141031.html
21 Milton Friedman (2002, February 20), Our Best Chance for Better Schools, New York Post, retrieved from http://nypost.com/2002/02/20/our-best-chance-for-better-schools
22 The empirical evidence, on balance, shows that the limited parental choice programs that exist today have led to better outcomes for students who choose schools and for students who remain in public schools. For surveys of this evidence, see Greg Forster (2016), A Win-Win Solution: The Empirical Evidence on School Choice (4th ed.), Friedman Foundation for Educational Choice, retrieved from EdChoice website: http://www.edchoice.org/wp-content/uploads/2016/05/A-Win-Win- Solution-The-Empirical-Evidence-on- School-Choice.pdf; Dennis Epple, Richard E. Romano, and Miguel Urquiola (2015), School Vouchers: A Survey of the Economics Literature (NBER Working Paper No. 21523), National Bureau of Economic Research, http://dx.doi.org/10.3386/w21523. For evidence that social outcomes have improved under the limited parental choice programs that exist today, see the aforementioned studies and Benjamin Scafidi (2015), The Integration Anomaly: Comparing the Effects of K-12 Education Delivery Models on Segregation in Schools, Friedman Foundation for Educational Choice, pp.12–21, retrieved from EdChoice website: http://www.edchoice.org/wp-content/uploads/2015/10/2015-10-The-Integration-Anomaly-WEB.pdf. For evidence that the presence of more school choices for parents would lead to higher teacher salaries, see Caroline Hoxby (2002), Would School Choice Change the Teaching Profession?, Journal of Human Resources, 37(4), pp. 846–891, https://www.jstor.org/stable/3069619; Richard Vedder and Joshua Hall (2000), Private School Competition and Public School Teacher Salaries, Journal of Labor Research, 21(1), pp. 161–168, http://dx.doi.org/10.1007/s12122-000-1010-7

44BACK TO THE STAFFING SURGE

45 EDCHOICE.ORG
ACKNOWLEDGMENTSThe author thanks Paul DiPerna, Jennifer Wagner, Katie Brooks, Rick Hess, Lindsey Burke, Michael Podgursky, Marty Lueken, Drew Catt, Michael Shaw, and Claire Freda for helpful comments. All remaining errors are mine.
ABOUT THE AUTHORDr. Ben Scafidi is a professor of Economics and director of the Education Economics Center at Kennesaw State University. He is also a Friedman Fellow with EdChoice and a senior fellow with the Georgia Public Policy Foundation. His research has focused on education and urban policy.
Previously, he served as chair of the state of Georgia’s Charter Schools Commission, the education policy advisor to Gov. Sonny Perdue, on the staff of both of Gov. Roy Barnes’ Education Reform Study Commissions, and as an expert witness for the state of Georgia in school funding litigation. He received his Ph.D. in economics from the University of Virginia and his B.A. in economics from the University of Notre Dame.
Ben and Lori Scafidi and their four children reside in Kennesaw, Georgia.

COMMITMENT TO METHODS & TRANSPARENCYEdChoice is committed to research that adheres to high scientific standards, and matters of methodology and transparency are taken seriously at all levels of our organization. We are dedicated to providing high-quality information in a transparent and efficient manner.
The American Association for Public Opinion Research (AAPOR) welcomed EdChoice to its AAPOR Transparency Initiative (TI) in September of 2015. The TI is designed to acknowledge those organizations that pledge to practice transparency in their reporting of survey-based research findings and abide by AAPOR’s disclosure standards as stated in the Code of Professional Ethics and Practices.
All individuals have opinions, and many organizations (like our own) have specific missions or philosophical orientations. Scientific methods, if used correctly and followed closely in well-designed studies, should neutralize these opinions and orientations. Research rules and methods minimize bias. We believe rigorous procedural rules of science prevent a researcher’s motives, and an organization’s particular orientation, from pre-determining results.
If research adheres to proper scientific and methodological standards, its findings can be relied upon no matter who has conducted it. If rules and methods are neither specified nor followed, then the biases of the researcher or an organization may become relevant, because a lack of rigor opens the door for those biases to affect the results.
The author welcomes any and all questions related to methods and findings.

BOARD OF DIRECTORS & OFFICERSDr. Patrick Byrne Chairman
Janet F. Martel Vice Chairperson
Lawrence A. O’Connor, Jr. Treasurer
J. Scott Enright Secretary
Robert C. Enlow
Dr. David D. Friedman
William J. Hume
Fred Klipsch
Fred Reams
Virginia Walden Ford
Dr. Michael Walker
111 MONUMENT CIRCLESUITE 2650INDIANAPOLIS, IN 46204317 681 0745