Back Door 022205
53
Back Door Links Between Directors and Executive Compensation David F. Larcker a Scott A. Richardson a Andrew J. Seary b İrem Tuna a a The Wharton School, University of Pennsylvania, Philadelphia, PA 19104-6365 United States. b School of Communication, Simon Fraser University, Burnaby B.C. V5A 1S6 Canada. Draft: February 22, 2005 We would like to thank David Chun and Roger Boissonnas of Equilar Inc. for their considerable help on this research project.
Transcript of Back Door 022205

Back Door Links Between Directors and Executive Compensation
David F. Larckera Scott A. Richardsona
Andrew J. Searyb İrem Tunaa
aThe Wharton School, University of Pennsylvania, Philadelphia, PA 19104-6365 United States.
bSchool of Communication, Simon Fraser University,
Burnaby B.C. V5A 1S6 Canada.
Draft: February 22, 2005
We would like to thank David Chun and Roger Boissonnas of Equilar Inc. for their considerable help on this research project.
Back Door Links Between Directors and Executive Compensation
Abstract This paper examines whether links between inside and outside directors have an impact on CEO compensation. Using a comprehensive sample of 22,074 directors for 3,114 firms, we develop a measure of the “back door” distance between each pair of directors on a company’s board. Specifically, using the entire network of directors and firms, we compute the minimum number of other company boards that are required to establish a connection between each pair of directors (ignoring the obvious link that occurs when directors are on the same board). The back door distance provides a measure for the existence and strength of a communication channel between board members that can be used to influence decisions by the board of directors. We document that CEOs at firms where there is a relatively short back door distance between inside and outside directors or between the CEO and the members of the compensation committee earn substantially higher levels of total compensation (after controlling for standard economic determinants and other personal characteristics of the CEO and the structure for board of directors). This statistical association is consistent with recent claims that the monitoring ability of the board is hampered by “cozy” and possibly difficult to observe relationships between directors.

1
Back Door Links Between Directors and Executive Compensation
1. Introduction
The role of corporate governance in monitoring and controlling corporate
management has been the subject of considerable research in accounting, economics, and
finance (e.g., see Shleifer and Vishny, 1997, Bhagat and Black, 2002, and Bushman and
Smith, 2001, for general reviews). Examples of these types of studies are Morck,
Shleifer, and Vishny (1988), Byrd and Hickman (1992), Brickley, Coles and Terry
(1994), Yermack (1996), Core, Holthausen, and Larcker (1999), Klein (2002), and
Gompers, Ishii, and Metrick (2003). The general research question in this literature is
whether selected dimension of corporate governance influences the decisions made by
executives and the economic performance of the firm.
Since the purpose of the board of directors is to explicitly monitor management
behavior for a dispersed group of individual shareholders, the structure of the board has
been the focus of many theoretical and empirical studies (e.g., Hermalin and Weisbach,
1998 and Rosenstein and Wyatt, 1990). One dimension of board structure that is
especially important is the “independence” of individual board members. It is commonly
alleged that personal relationships between directors reduce the independence of board
members and this has an impact on the choices made by the board of directors (e.g., the
compensation paid to the CEO). Corporate governance rating services and activist
shareholders often mention this aspect of director interlocks in their discussions of
questionable corporate governance. For example, the AFL-CIO Executive Paywatch
profiles the CEO-compensation committee relationships that they view as suspicious.
The Corporate Library and Governance Metrics International include measures of

2
director interlocks when developing their rating of firm governance practices. Finally,
the former chairman of the SEC, Arthur Levitt, in a recent Wall Street Journal editorial
noted that the “cozy” relationships between the CEO and interlocked directors need to
cease, especially for the compensation committee (Levitt, 2004). Levitt went as far to
say that there should be no interlocking relationships.
Despite the conventional wisdom that suggests the existence of interlocks erodes
the ability of the board to serve as an independent monitor of top management, there is
relatively little evidence on this idea. For example, Hallock (1997), Core, Holthausen,
and Larcker (1999) and Fich and White (2003) provide mixed evidence on whether
director interlocks have a statistical association with the level of CEO compensation.
However, these studies use a very narrow definition of links between directors (i.e.,
reciprocal interlocks) and restrict their analysis to small samples (i.e., less than 500
firms). Thus, the substantive impact of relationships between directors and CEO
compensation is an unresolved question.
The purpose of our study is to assess the association between director linkages
and CEO compensation using a comprehensive sample of 22,074 directors for 3,114
firms. Moreover, we apply social network analysis to this large sample to develop a new
measure for links between directors which we refer to as the “back door” distance. This
measure is the minimum number of other company boards that are required to establish a
connection between each pair of directors (ignoring the obvious link that occurs when
directors are on the same board). The back door distance provides a measure for the
existence and strength of a communication channel between board members that can be
used to influence decisions by the board of directors. Prior research only considers links

3
similar to the situation where an outside director on firm A is interlocked if an inside
officer of firm A serves on the board of that outside director’s primary company. In
contrast, we explicitly measure the potentially important “friend of a friend” links that
occur through various relationships in our large network of directors.
We find a statistically negative relation between various measures of the
minimum distance from inside directors to outside directors (and from the CEO to
members of the compensation committee) and CEO compensation. This result is robust
to the inclusion of standard economic determinants of compensation, CEO
characteristics, and board of director characteristics. These results are consistent with the
agency cost explanation discussed in the popular and business press that CEOs are able to
extract economic rent using the information and influence channels that exist when they
are linked to outsider directors or members of the compensation committee.
The remainder of the paper is divided into four sections. Section 2 provides a
review of the prior literature on director interlocks and develops our research hypotheses.
Section 3 describes our sample, measurement choices, and methodological approach.
Our results are presented in Section 4. Finally, the conclusions of our study are
summarized in Section 5.
2. Background
2.1 Literature Review
There is a substantial literature examining structural relationships within social
networks. This field, social network analysis, has its roots in sociology, social
psychology and anthropology (e.g., Moreno, 1934) with the development of graph theory
and sociograms to capture the relationships between members of a network. More

4
recently, mathematical techniques have been developed to quantify various aspects of the
components of these networks (see Scott, 2000, chapter 2 for an excellent summary).
Social network analysis assumes that agents in a network are interconnected or
exhibit some degree of dependence. Moreover, the links between agents are the channels
by which information is communicated and this exchange of information produces an
environment that provides “opportunities for or constraints on individual actions
(Wasserman and Faust, 1994, p. 4). Studies based in this network perspective are very
broad and cover a wide range of topics including the diffusion and adoption of innovation
(Coleman, Katz and Menzel, 1957), coalition formation (Kapferer, 1969), group problem
solving (Bavelas, 1950), elite decision making (e.g., Laumann, Marsden, and
Galaskiewicz, 1977) and information diffusion in labor markets (Granovetter, 1974). The
types of networks examined in these papers include social communities, powerful
families and political and economic systems (e.g., Padgett and Ansell’s 1993 examination
of business interests and marriage patterns in Florentine families in the 1400’s, and
Galaskiewicz’s 1985 work on CEOs and social club networks).
The techniques developed in social network analysis can be applied to any setting
where there are relations between agents in the network and there is reason to believe that
these links impact the decision making of the agents in the network. In our empirical
analysis, we focus on the corporate network (i.e., the network that exists between
corporate directors). Specifically, we identify and measure the existence and strength of
relational ties between directors and assess the economic significance of these relations
on CEO compensation.

5
Our analysis is most closely related to prior social network analysis examining
corporate interlocks (i.e., where board members exhibit some type of structural
dependence). The extensive literature examining board interlocks can be traced back to
the 1960s. For example, Levine (1972) documents the interlocked directorates between
the boards of major banks and the boards of major industrials using a sample of 14 banks
and 70 industrial firms using data from 1965. Dooley (1969) also documents the role of
bankers in interlocks and the advantage gained by the industrial company because capital
can be obtained at favorable rates when a banker is on the board. Interestingly, the
majority of the director network research tends to only document the nature of the
network interrelationships. For example, how particular interlocks are created (Pfeffer
and Salancik, 1978), how they are maintained (Palmer, Friedland and Singh, 1986), how
dense and/or central the network is (Davis, Yoo and Baker, 2003) have been studied.
However, very little work has been done documenting economic consequences of the
network. Indeed, Mizruchi (1992) notes that the evidence examining whether
interlocking affects corporate behavior is “fragmented and contradictory”. The notable
exceptions to this summary statement include work that documents the impact of the
social network on firms’ decisions to adopt poison pills (Davis, 1991), firms’ decisions to
switch stock exchanges (Rao, Davis and Ward 2000) and firms’ decisions to make
political contributions (Mizruchi, 1992).
Some prior work has examined characteristics of the director network (i.e., board
interlocks) and CEO compensation. Since CEO compensation is an observable decision
that is made on a regular basis, this decision seems to be a natural place to assess the
impact of links between directors on monitoring behavior. Hallock (1997) examined how

6
the reciprocal interlocks for employee and non-employee directors of 602 firms in 1992
affected CEO pay. After controlling for standard economic determinants of CEO
compensation, he finds only weak evidence that his narrow definition of director
interlocks affect CEO compensation. More recently, Fich and White (2003) examine the
impact of the number of mutual director interlocks on CEO compensation for a sample of
366 large industrial firms (the sample is based on the Fortune 500 firms used by
Yermack, 1996). They define two boards to be “mutually interlocked” if they share at
least two directors. They find some evidence that compensation, after controlling for
standard economic determinants, is positively related to the number of mutual director
interlocks that exist on the board. Finally, Core, Holthausen and Larcker (1999) find no
association between direct outsider interlocks (i.e., an outside director on firm A is
interlocked if an inside officer of firm A serves on the board of that outside director’s
primary company) and executive compensation using a sample of 205 firms from 1982-
1984.
Collectively, prior research has found only weak evidence of an association
between director interlocks and CEO compensation. However, this research is limited by
small sample sizes and very strict definitions of director interlocks. Small sample sizes
cause a large part of the corporate network to be ignored when measuring links between
directors, and therefore many potential linkages are ignored in these analyses.1
Restricting the focus to reciprocal interlocks (Hallock, 1997) will ignore many “friend of 1 Fich and White (2003) limit their analyses to large, industrial firms. This sample systematically excludes financial institutions and utilities which prior work has shown to be a central part of the corporate director network (Levine, 1972 and Dooley 1969). Even excluding a small number of firms will greatly limit the ability of the network analysis to recover linkages between firms. With our comprehensive sample of 3,114 firms including all industries and both small and large firms we are far less likely to be missing linkages within the network. Indeed, we find that the largest cluster in our network is 1,685 firms (i.e., firms that are interconnected through their directors) suggesting that prior studies looking at samples of 366 firms (e.g., Fich and White 2003) are missing large sections of the network.

7
a friend” relations in the data (Mizruchi, 1992).2 In this paper we re-examine the effect
of director links on CEO compensation for a large sample of firms using a more
comprehensive measure for the linkages between directors that captures not only
reciprocal interlocks but all possible connections between directors within the network of
directors. Our measurement goal is to develop an estimate for the existence and strength
of the natural channels through which information and influence is disseminated between
directors.
2.2 Research Hypotheses
While there has been a substantial literature on social network analysis, especially
the corporate director network, the summary above highlights that very little work has
documented economic consequences of these relations. The aim in our paper is to study
the linkages in the director network and examine whether these linkages affect CEO
compensation. Our specific focus is on the links that exist between directors that occur
because they serve on multiple boards. As discussed more fully in Section 3, we use the
entire network of directors and firms to compute the minimum number of other company
boards that are required to establish a connection between each pair of directors (ignoring
the obvious link that occurs when directors are on the same board).3 We term the
resulting measure as the “back door” distance. This provides a measure for the existence
and strength of a communication channel between board members that can be used to
influence decisions by the board of directors.
2 ExecuComp also has a very narrow definition of interlocks. It defines an interlock as existing if the officer is involved in a relationship requiring disclosure in the "Compensation Committee Interlocks and Insider Participation" section of the proxy. This will capture only very specific linkages between directors. 3 This type of computation is related to the “degree of separation” measures that are commonly discussed in popular press features. For example, Stanley Milgram’s famous six degrees of separation among individuals is an example of this type of research (Milgram, 1967).
8
Despite the rhetoric by the financial pundits and activist governance
organizations, it is not theoretically obvious that such an association will be evident in the
data and, if such an association does exist, whether it will have a positive or negative
impact on the firm. We may observe no relation between the “back door” linkages and
CEO compensation because it is possible that the observed linkages in the corporate
director network are nothing more than a neutral permutation of the parameters of the
network. For example, there are a limited number of people who can serve as directors
and each firm requires a certain number of directors on the board. Indeed, some prior
work has suggested that random assignments of directors to boards yield very similar
representations of the observed data (e.g., Newman, Strogatz and Watts, 2001 and
Conyon and Muldoon, 2004). Under this scenario the linkages between directors are not
necessarily indicative of monitoring problems, but rather a manifestation of how natural
constraints impact the observed network structure.
If the “back door” linkages are not neutral mutations and do impact board
decision making and CEO compensation, it is not clear whether close links between
directors will lead to lower or higher levels of pay. Under the agency cost or
entrenchment view, the “back door” linkage reflects the idea of friendly relations
between directors that will impede their ability to make decisions in the best interests of
the firm. Favorable compensation decisions will be made to obtain favorable decisions in
return (or to avoid awkward personal interactions). Under this view, “back door” links
reflect compromised independence and objectivity of the director which will manifest as
higher levels of CEO compensation. These linked directors will be sympathetic to the
CEO in setting pay levels (e.g., Fich and White, 2003).

9
Corporate governance rating services and activist shareholders often mention this
aspect of director interlocks in their discussions of questionable corporate governance.
For example, the AFL-CIO Executive Paywatch profiles the CEO-compensation
committee relationships that they view as suspicious for large companies such as
Safeway, Apple Computers and Cisco Systems. Similarly, ratings agencies such as The
Corporate Library and Governance Metrics International include measures of director
interlocks when rating firm governance practices. Some conventional wisdom suggests
that the existence of these interlocks erodes the ability of the board to serve as a monitor
of top management. Indeed, the former chairman of the SEC, Arthur Levitt, in a recent
Wall Street Journal editorial noted that the “cozy” relationships between the CEO and
interlocked directors need to cease, especially for the compensation committee (Levitt,
2004). Levitt went as far to say that there should be no interlocking relationships. If this
agency cost explanation is descriptive in our sample, we would expect CEO
compensation to increase when there are close links between insider and outside board
members. This result would provide support for the conjectures of rating agencies and
regulators that focus on these types of director links.
Finally, CEO compensation may exhibit an association with the extent of director
links because these links reflect strategic alliances between powerful individuals and
firms. These alliances can be a potentially valuable intangible asset for a company. In
particular, these alliances make the firm inherently less risky because of the strength of
the business relation created by the director associations (Schoorman, Bazerman and
Atkin, 1981). Burt (1983) shows that director interlocks are associated with the extent to
which one industry exercises market constraint over another, so the presence of the
10
interlock suggests an attempt of the firm to establish alliances to mitigate risk and
uncertainty by expanding the boundary of the firm. Indeed, some of the earlier work
examining relations between banks and financial companies found that industrial firms
with links to banks were able to attract lower cost of capital (Dooley, 1969 and Mizruchi
and Stearns, 1988). If the links between directors are a measure of firm risk, we would
expect close links to result in lower CEO compensation because the required risk
premium will be lower. However, it is also possible that the existence of strategic
alliances is a measure of CEO quality. Thus, close links between directors can be
desirable for shareholders and this would suggest that close links should increase CEO
compensation. Furthermore, the type of director who is a central member of these
networks has an economic incentive to maintain his or her personal reputation. This
would suggest additional monitoring benefit from these “back door” linkages that would
counteract the ”co-opting” of these directors to CEO interests.
3. Methodological Approach
3.1 Sample
Our primary sample is developed from extensive board and compensation data
collected from proxy statements by Equilar Inc. for companies with fiscal year ends
ranging from June, 2002 to May, 2003 (or Compustat data year 2002). The board of
director data consists of 22,074 individuals that are directors for 3,114 individual
companies. Our sample spans many sectors of the economy and has a distribution of
firms that is very similar to the composition of the complete Compustat file (see Table 1).
Our sample represents approximately 85 percent of the market capitalization of the

11
Russell 3000 as of the end of 2002 (and this index accounts for about 98 percent of the
total market capitalization of the U.S. equity markets).
Panel A of table 2 reports descriptive statistics for various board characteristics.
The size of the board of directors ranges from a minimum of three to a maximum of 31
with the mean (median) board size of 8.6 (8) directors. The mean fraction of independent
outsider (affiliated) directors on the board is 62 (17) percent.4 A relatively small fraction
of the board is over the age of 70 (10 percent of independent outsider directors and 8
percent of affiliated directors) with very few boards having appointed a lead director or
an outside director that can call meetings of all outside directors in executive session (6
percent). The majority of independent outside directors have been appointed during the
insider directors’ tenure (69 percent) and only a small portion of the sample (11 percent)
have an outsider serving as chairperson of the board. For the directors in our network,
each director is affiliated with at least one company and up to ten different 10 companies.
The mean director is affiliated with 1.22 companies and 18,197 (or 82.4 percent) of the
directors are affiliated with only a single company (untabulated).
3.2 Measurement Issues
Relations Between Directors
The construct of interest is the link between directors on a given board. Standard
measures of these board relations have focused on interlocks. For example, ExecuComp
defines an officer to be interlocked if the officer (i) serves on the board committee that
makes his compensation decisions, or (ii) serves on the board (and possibly compensation
committee) of another company that has an executive officer serving on the
4 We use the definition of affiliated (or “grey”) directors developed by Equilar (which is a combination of SEC, NYSE, and NASD guidelines). Any outside directors that were mentioned in the “certain transactions” section of the proxy statement or a former executive was classified as affiliated.

12
compensation committee of the indicated officer's company, or (iii) serves on the
compensation committee of another company that has an executive officer serving on the
board (and possibly compensation committee) of the indicated officer's company. This
especially narrow definition for links between directors misses substantial relations
between directors that are more than one step removed from each another.
Figure 1 illustrates the basic measurement approach that we use to compute links
between directors. The left side of Figure 1 captures the standard reciprocal interlock –
directors 1 and 2 on the board of company A are also on the board of company B. The
back door distance for this pair of directors is equal to one. The right side of Figure 1
captures a link between directors 1 and 2 that is facilitated by a third company. Since the
directors of another company are necessary for this link, the back door distance for this
pair of directors is equal to two. We refer to such linkages as “back door” (denoted
BDD) because they only exist for two directors that are on more than one board and the
linkages do not involve the direct linkage between directors (i.e., the fact that directors 1
and 2 are both on the board of company A). These types of potentially important “friend
of a friend” linkages are absent from the measures of director interlocks used in prior
research.
As is standard in social network analysis, we develop our BDD measures using a
rectangular incident matrix that captures the links between the 22,074 directors. Two
directors are linked if they serve together on the same board. The resulting affiliation
network serves as the primary input into our computations. For the BDD to be defined
for a director, this individual must be affiliated with more than one company. For a
specific pair of directors for a given firm, we remove their direct links that occur because

13
they are board members for that firm and then we compute the shortest (or geodesic) path
between them which must go through other firms. Obviously, the BDD is only defined
for companies that have more than one director with outside connections. This path will
not be defined if all directors are only together on a given company’s board. It may also
not exist if there is no path from one director to another director outside the company
(though this happens only occasionally).
The affiliation network involving all 22,074 directors is not completely
connected. That is, there are pairs of directors that cannot be reached by following paths
defined by the director links in the entire network. Sets of directors that are connected
are referred to as components, and there are 605 components in our network. The largest
component consists of 16,752 directors from 2,455 companies. The other 604
components contain 54 or less people and 5 or less companies. Interestingly, 561 of
these components consist of only one company with no overlap to any other company.
The analysis described above generates an exhaustive search for links between all
directors in the network. Since our empirical analysis of executive compensation is
conducted at the firm level, it is necessary to aggregate these between director relations.
In order to develop a parsimonious set of results, we report the relations between all
inside directors and all outside directors, and the relations between the CEO and all
members of the compensation committee, by considering the minimum BDD between
either inside directors and outside directors, or the CEO and the members of the
compensation committee.5
5 Our measure is computed using insiders and outsiders, and ignores the affiliated (or “grey” directors). We assume that the affiliated directors are potentially compromised with regard to independence, and thus we
14
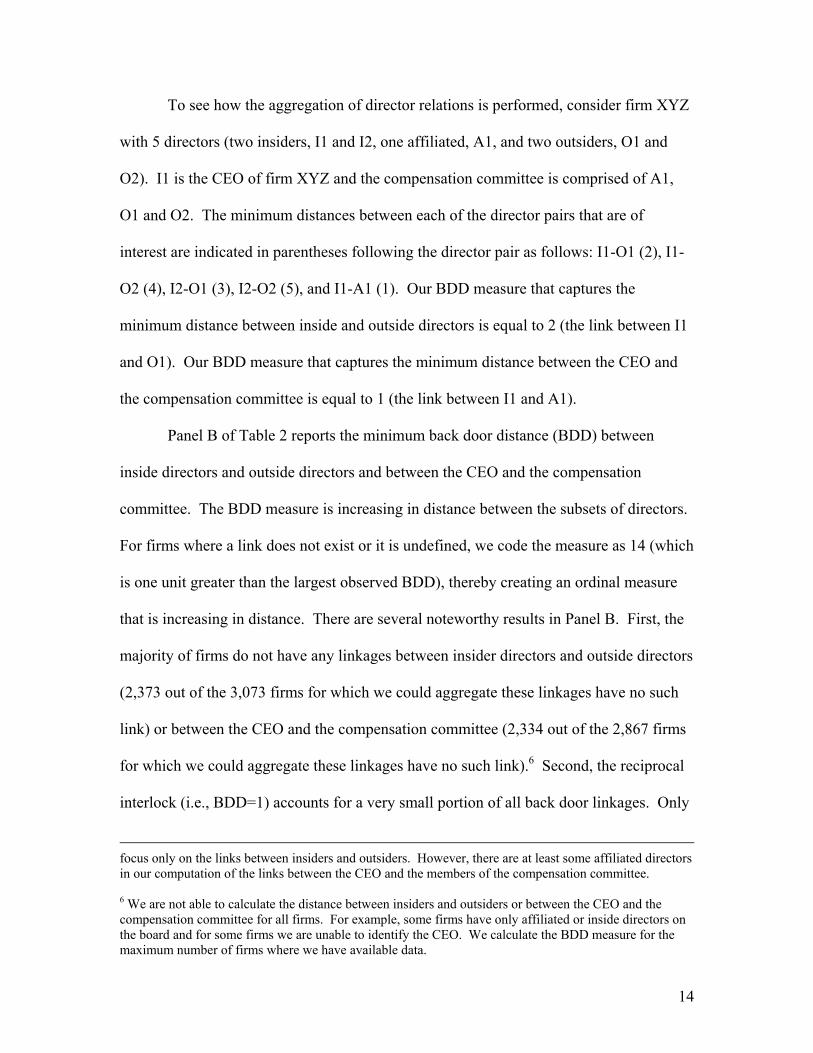
To see how the aggregation of director relations is performed, consider firm XYZ
with 5 directors (two insiders, I1 and I2, one affiliated, A1, and two outsiders, O1 and
O2). I1 is the CEO of firm XYZ and the compensation committee is comprised of A1,
O1 and O2. The minimum distances between each of the director pairs that are of
interest are indicated in parentheses following the director pair as follows: I1-O1 (2), I1-
O2 (4), I2-O1 (3), I2-O2 (5), and I1-A1 (1). Our BDD measure that captures the
minimum distance between inside and outside directors is equal to 2 (the link between I1
and O1). Our BDD measure that captures the minimum distance between the CEO and
the compensation committee is equal to 1 (the link between I1 and A1).
Panel B of Table 2 reports the minimum back door distance (BDD) between
inside directors and outside directors and between the CEO and the compensation
committee. The BDD measure is increasing in distance between the subsets of directors.
For firms where a link does not exist or it is undefined, we code the measure as 14 (which
is one unit greater than the largest observed BDD), thereby creating an ordinal measure
that is increasing in distance. There are several noteworthy results in Panel B. First, the
majority of firms do not have any linkages between insider directors and outside directors
(2,373 out of the 3,073 firms for which we could aggregate these linkages have no such
link) or between the CEO and the compensation committee (2,334 out of the 2,867 firms
for which we could aggregate these linkages have no such link).6 Second, the reciprocal
interlock (i.e., BDD=1) accounts for a very small portion of all back door linkages. Only
focus only on the links between insiders and outsiders. However, there are at least some affiliated directors in our computation of the links between the CEO and the members of the compensation committee. 6 We are not able to calculate the distance between insiders and outsiders or between the CEO and the compensation committee for all firms. For example, some firms have only affiliated or inside directors on the board and for some firms we are unable to identify the CEO. We calculate the BDD measure for the maximum number of firms where we have available data.

15
179 out of the 700 (i.e., 25.6 percent) firms that have a link between insiders and
outsiders are reciprocally interlocked. Likewise, there is a reciprocal interlock between
the CEO and the compensation committee for only 111 out of 533 (i.e., 20.8 percent)
firms that have any link between the CEO and compensation committee. This result
implies that prior research focusing on a very strict definition of an interlock misses a
substantial amount of the (back door) links that exist within the director network.
Since our BDD measure is ordinal in nature, changes in the measure are not
necessarily interpretable along its continuum. This is especially true for firms where no
such link exists (i.e., were we set BDD=14). In section 4, we outline various approaches
to address this limitation. Specifically, in our empirical analyses, we use the continuous
BDD measure along with several discrete versions of this variable. Finally, it is
important to note that panel B of Table 2 only reports the minimum distance between
subsets of the board. The empirical results discussed in section 4.2 are also robust to
using the average distance or the number of links between these groups.
Executive Compensation
We use the typical approach for measuring the annual flow of compensation to a
CEO. Our CEO compensation data is obtained from detailed proxy statement data
provided by Equilar for the time period from June, 2002, to May, 2003 that corresponds
to the period for which the board of director data is collected. We measure the total
dollar value of all expected compensation received by the CEO including actual salary,
actual annual bonus, Black-Scholes value of stock options, target value for restricted
stock grants, target value for performance plans and miscellaneous other pay (including
matching contributions for deferred compensation, life insurance, disclosed perquisites,

16
etc.). The mean (median) level of total CEO compensation in our sample is about $3.41
($1.57) million (Table 2, Panel D).
In our empirical tests assessing the impact of various director relations (defined
above) on CEO compensation, we consider several specifications. We condition CEO
compensation on (i) standard economic determinants, (ii) various CEO characteristics,
and (iii) various board characteristics. We include these various sets of control variables
to mitigate concerns that our BDD measure simply reflects underlying firm or board
characteristics that would typically determine executive compensation (i.e., the BDD
simply mimics a known association for CEO compensation and is not a unique variable).
Finally, we run both linear and log-linear (using the natural logarithm) specifications of
CEO compensation model to examine both the dollar impact of director relations and the
elasticity of this relation.
Our economic determinants are standard in the literature (e.g., Core, Holthausen
and Larcker, 1999) and they include Book-to-Market, calculated as the book value of
common equity (Compustat data item 60) divided by the market value of common equity
(item 25 * item 199), Mkt. Cap. (market value of common equity), ROA (return on
assets) calculated as income before extraordinary items (item18) deflated by average total
assets (item 6), RET (12 month return) calculated as the percentage change in price
inclusive of dividends for the fiscal period, σ(ROA) calculated as the standard deviation
of ROA using at least 3 and up to 5 years of prior data, and σ(RET) calculated as the
standard deviation of RET using at least 3 and up to 5 years of prior data. The total
compensation variable and all control variables are winsorized at the extreme two
percentiles (i.e., values less (greater) than the 2nd (98th) percentile are set equal to the

17
value of the 2nd (98th) percentile). We also include a vector of industry fixed effects (two-
digit SIC) in the regressions. Panel C of Table 2 reports descriptive statistics for these
economic determinants for our sample. The mean (median) market capitalization is
$2.46 ($0.52) billion dollars. The mean Book-to-Market is about 0.57 and the mean firm
reported a loss equal to 3 percent of its average assets.7
Our CEO characteristics include CEO tenure, CEO age and whether the CEO is
the founder of the company. Panel D of Table 2 reports that 16 percent of the CEOs in
our sample are founders, the average CEO is 54 years old and has served as CEO for 11
years. These CEO characteristics are used in order to control for the impact of age and
tenure on the riskiness of the compensation plan offered to the CEO and the possibility
that founder CEOs have a reward structure that is very different from other CEOs.
The board characteristics we examine include board size, board composition,
director age, insider appointed directors, the existence of a lead director and whether an
outside director is the chairman of the board. Each of these variables has been examined
in various studies on corporate governance. One of the key variables in this set of
controls is board size. That is, our BDD measure may in part be driven by the size of the
board. Large boards have the potential to have more director-to-director relationships,
especially when we are aggregating links across sub-sets of directors (e.g., insiders to
outsiders). This issue is commonly addressed in social network analysis by scaling the
relational measures by board size. For example, the centrality measure of Bonacich
(1972) that is commonly used to describe the corporate director network is scaled by the
size of the board. To ensure that the relation between director relations and CEO
7 The sample sizes vary for each of the variables as we report the descriptive statistics for the maximum sample available. In our regression analysis below we only include firms in each specification that have the full complement of independent variables for the respective specification.

18
compensation is not driven by board size, we include this variable in our regression
analysis.8
4. Results
In this section, we present the results of our empirical analyses examining the
association between director relations and executive compensation. First, we discuss
significant correlations between our BDD measure and various independent variables in
our CEO compensation regressions. Second, we discuss the multivariate regression
results. There are many alternate specifications for our regression analysis. As discussed
above in section 3.2, we examine the linkages between (i) inside directors and
independent outside directors, and (ii) CEO and members of the compensation
committee. In all cases we focus only on the minimum distance between each director.
Alternatives include the average distance or the number of possible linkages between
each director pair. These alternatives are highly correlated with the minimum distance
and for the sake of brevity we only tabulate results for minimum distance (untabulated
results using average distance or number of links generate very similar results to those
reported). We also examine continuous and discrete versions of our BDD measure.9
4.1 Bivariate correlation results
8It is useful to note the BDD measure is at least partially exogenous. While a company can institute policies limiting, or even prohibiting, external board appointments, the firm does not have a direct say in which firms that the director will hold an additional director appointment. Firms can voluntarily align themselves to take advantage of alliances across industry affiliations (e.g., Dooley, 1969 and Burt, 1983), but ultimately it is the interdependence between members of the network that determine the ties within the network. It is not the result of decisions of one firm. This is a desirable feature of the network analysis because it at least partially mitigates the standard endogeneity problems that plague traditional economic analysis. 9 We have also examined binary versions of the BDD measure. We summarize these results in section 4.3.

19
Table 3 reports significant correlations between our director relations measure and
Mkt. Cap., Board Size and board composition. We limit our discussion only to
correlations that are greater than 0.15 in absolute value for the sake of brevity. The first
row of Table 3 reports the correlations for the minimum distance between insider and
outside directors. This distance is smaller for large firms, large boards and for firms with
a higher percentage of outside directors. These results are somewhat expected because
inside directors have greater potential to exhibit a link with other directors if they serve
on larger boards and with a larger number of outside directors. Similar correlations are
observed in the second row of Table 3 which reports the correlations for the minimum
distance between the CEO and the compensation committee. This is also to be expected
because the compensation committee is primarily composed of outside directors and
outside directors of large firms are more likely to have multiple board memberships.
The remaining six rows of Table 3 convert the continuous BDD measures to
discrete variables. As mentioned in section 3.2, the ordinal scale that we use for BDD
(from 1 to 14) may not have the natural interpretation of a variable that has an interval
scale. For example, increasing the BDD from 1 to 2 is unlikely to have the same
substantive impact on board behavior as increasing the BDD from 11 to 12. In order to
gain some insight into the measurement properties of the BDD, we convert this measure
into three indicator groups. The first group includes firms where the minimum BDD is
between one and three, the second group is where the minimum BDD is between four and
six, and the third group is where the minimum BDD is greater than six. Firms in the first
group (shorter distance) tend to be larger, have larger boards and more independent
outsiders on the board. Firms in the third group (longer distance) tend to be smaller, with

20
smaller boards and fewer independent outsiders on the board. These associations hold for
both relations between insiders and outsiders and relations between the CEO and the
compensation committee. Since we observe statistically significant correlations between
our BDD measures and one of the primary determinants of CEO compensation (i.e.,
market capitalization) and two common measures of board structure (i.e., board size and
the percentage of outside directors on the board), we control for these effects in our
multivariate regression tests.
4.2 Multiple regression results
Tables 4 through 7 report our regression results.10 Each table has two panels.
Panel A reports the linear specification where the dollar value of total CEO compensation
is regressed on various determinants. Panel B reports the log-linear specification where
the natural logarithm of total compensation is regressed on various determinants (where
several determinants are also transformed via the natural logarithm). Within each panel
we have four models. The first model only includes the standard economic determinants
of CEO compensation. This model is the same across the four tables and is included for
comparative purposes. The second model adds the BDD measure to the standard
economic determinants. The third model adds CEO characteristics (i.e., age, tenure and
founder status). Finally, the fourth model adds board characteristics (i.e., percentage of
the directors that are outsiders and affiliated, percentage of the inside, affiliated, and
outside directors that are older than 70, percentage of the affiliated and outside directors
that have a board tenure less than the maximum board tenure for an insider director,
board size, presence of a lead director, and presence of an outside chairman of the board).
10 Observations were deleted if the absolute value of the studentized residual was greater than four. This “outlier” adjustment causes there to be a different sample size for the dollar value and log-linear specifications.
21
Panel A of Table 4 reports dollar value of CEO compensation regression results
using the minimum distance between insiders and outsiders as the BDD measure. The
first column reports the standard economic determinant model. CEO compensation is
increasing in firm size, growth, performance and is decreasing in the volatility of
accounting performance. This specification includes a vector of industry indicator
variables and is able to explain 50.7 percent of the cross-sectional variation in executive
compensation. We add the BDD measure in Model 2 and find a statistically significant
negative coefficient equal to -$82,773 (t-statistic of -5.73). An increase in BDD of one
unit is associated with $82,773 less CEO pay. This negative relation is also evident in
models 3 and 4 even after we add in the selected CEO and board characteristics. In
model 4 the coefficient on BDD remains statistically significant (coefficient estimate of -
$53,869 and t-statistic of -3.38). This final specification includes measures of board size
and board composition that are correlated with BDD (as reported in Table 3). Including
these additional variables does not remove the negative statistical association between
BDD and CEO compensation. In panel B we see very similar results for the log-linear
specification. The coefficient on BDD ranges from -0.09 (t-statistic of -4.01) in model 2
to -0.06 (t-statistic of -2.45) in model 4. This suggests that a 10 percent increase in the
distance between insiders and outsiders is associated with a 0.6 percent decrease in CEO
pay. Other associations of note are that CEO pay is decreasing in CEO tenure (log-linear
specification only), CEO founder status and chairman outsider status; and CEO pay is
increasing in the fraction of outsiders and affiliated directors appointed to the board and
board size (linear specification only). These associations are robust across the alternate
specifications in Tables 5 through 7.

22
Table 5 reports regression results for the impact of BDD on CEO compensation
for linkages between the CEO and the compensation committee. These tests are perhaps
the most informative for our research question because it is the compensation committee
that sets (or at least provides a key input into the process that sets) CEO compensation.
In panel A, the coefficient on BDD ranges from -$68,081 (t-statistic of -4.27) in model 2
to -$40,490 (t-statistic of -2.29) in model 4. Likewise, in the log-linear specification in
panel B we find that the coefficient on BDD ranges from -0.02 (t-statistic of -4.25) in
model 2 to -0.01 (t-statistic of -2.38) in model 4. A 10 percent increase in the distance
between the CEO and the compensation committee is associated with a 0.1 percent
decrease in CEO pay. These results are very consistent with the results of the regression
analyses using the minimum BDD between insiders and outsiders.
We repeat the analyses in Tables 4 and 5 using discrete versions of the BDD
measure in Tables 6 and 7. We define two new indicator variables to capture discrete
intervals of BDD. First, we define an indicator variable equal to one if BDD is between
one and three, and zero otherwise. Second, we define another indicator variable equal to
one if BDD is between four and six, and zero otherwise. The intercept in these
specifications captures the average level of CEO pay for firms where BDD is between
seven and 14. For the linear specification in panel A of Table 6, we find that the level of
CEO pay is greater for firms where BDD is between one and three or between four and
six, relative to the group where BDD is greater than or equal to 7, where BDD is
measured as the minimum distance between inside and outside directors. While the
coefficients on the group where 4≤BDD≤6 (in model 4 the coefficient is $751,227, t-
statistic of 3.28) is greater than the group where 1≤BDD≤3 (in model 4 the coefficient is

23
$499,281, t-statistic of 2.21), in unreported F-tests we find that this difference is not
statistically significant at conventional levels (the F-statistics for models 2, 3, and 4 are
1.26, 0.01, and 0.75 respectively). For the log-linear specification in panel B of Table 6,
we find a positive relation between CEO compensation and the BDD indicator variables.
For firms where 1≤BDD≤3, the coefficient on BDD is greater than that for the group
where 4≤BDD≤6, across all three models in panel B of Table 6 (the F-statistics for
models 2, 3, and 4 are 2.48, 1.23, and 0.60 respectively, with the differences in model 2
significant at conventional levels).
Finally, in Table 7 we see similar results for the discrete BDD measures of the
CEO to compensation committee linkages. Firms where the distance between the CEO
and compensation committee is less than or equal to six are associated with higher levels
of pay and greater elasticity of CEO pay with respect to BDD, relative to firms where the
distance between the CEO and compensation committee is greater than or equal to
seven.11 (For the linear specifications (panel A), the F-statistics testing coefficient
equality across the BDD indicator variables for models 2, 3, and 4 are 0.08, 1.04, and
1.14 respectively. For the log-linear specifications (panel B), the respective F-statistics
for models 2, 3, and 4 are 0.43, 0.06, and 0.05. All these F-statistics are insignificant.)
The regression results reported in Tables 4 through 7 use the maximum sample
available for each specification. However, this makes it difficult to examine the
explanatory power across specifications (i.e., model 1 through model 4) because the
sample size changes for each model. In unreported analyses, we also estimated all
regression analyses using constant sample sizes of 2,089 (2,115) firms for the linear (log-
11 We also used a variety of alternate cut-offs to create the discrete BDD measure and found very similar results.

24
linear) inside to outside specifications and, 2,045 (2,069) firms for the linear (log-linear)
CEO to compensation committee specifications. The adjusted R2 of the economic
determinants only specification (model 1) is 48.5 (49.2) percent for the linear (log-linear)
specification. For model 2, which includes the BDD measure, the adjusted R2 increases
to 49.0 (49.5) percent for the linear (log-linear) specification. This increase in
explanatory power is similar across the various BDD measures (i.e., inside directors to
outside directors, CEO to compensation committee, and the continuous and discrete
versions of the BDD measure). Finally, in model 4 the adjusted R2 increases to about
50.3 (51.3) percent for the linear (log-linear) specification. The increase in explanatory
power from including the BDD measure is between 0.5 to 1 percent for each
specification. This increase in explanatory power is small relative to the economic
determinants, but it is of roughly the same magnitude as the incremental explanatory
power associated with including the CEO characteristics or board characteristics in the
compensation regression.12 Since there is not a well-established benchmark for assessing
the size of incremental explanatory power, it is difficult to conclude that BDD either does
or does not have a substantive impact on CEO compensation.
Collectively, the regression results indicate a robust negative statistical
association between the BDD measure and CEO compensation. Firms with close links
between either inside directors and outside directors or between the CEO and the
compensation committee are observed to provide higher levels of compensation to their 12 It is also instructive to note that this level of explanatory power is large when compared to the explanatory power obtained for CEO compensation regressions that include various governance characteristics. For example, Larcker, Richardson and Tuna (2004) note that the addition of 39 structural measures of corporate governance, increases the adjusted R2 of a CEO compensation regression from 41.1 percent for an economic determinants only specification to 46 percent for a specification including all 39 governance variables (although several of the governance variables in their specification had unexpected signs). Thus, the increase in explanatory power from our BDD measure is comparable to the explanatory power produced by a comprehensive set of governance characteristics.

25
CEOs. These results are consistent with the agency cost explanation discussed in section
2.2 and suggest that CEOs are able to extract economic rent using the information and
influence channels that exist when directors have “back door” links. Moreover, this
negative relation is robust to the inclusion of standard economic determinants of CEO
pay, as well as various CEO and board characteristics.
4.3 Additional empirical analyses
In unreported analyses, we also examine two alternative BDD measures. First,
we use the standard definition of reciprocal director interlocks that has been employed in
the prior literature (e.g., Hallock 1997 and Fich and White 2003) and is the typical
definition of compensation committee reciprocal interlocks reported in Execucomp. For
these regressions we define an indicator variable equal to one if BDD=1 and zero
otherwise. This specification groups director relations with a distance greater than one
with firm observations where no such link exists (i.e. BDD=14). Using this binary
specification, for our linear (log-linear) CEO compensation regressions using the link
between inside and outside directors, the t-statistics for models 2 through 4 range from
3.85 to 1.90 (2.80 to 1.97) and coefficient estimates range from $1,010,860 (0.19) for
model 2 to $538,075 (0.14) for model 4. For our linear (log-linear) CEO compensation
regression specifications using the link between the CEO and the compensation
committee, the t-statistics for models 2 through 4 range from 1.53 to 0.54 (0.88 to 0.48)
and coefficient estimates range from $499,754 (0.07) for model 2 to $186,624 (0.04) for
model 4. These weaker results are consistent with prior research that has found mixed
evidence supporting an association between director relations and executive
compensation. The stronger results reported in Tables 4 through 7 suggest that the “back

26
door” linkages between directors that span more than one firm are an important part of
the director network that should be included in any empirical examination of the
economic consequences of the relationships within the corporate director network.
Our second alternative BDD measure is an indicator variable that is equal to one
if a link between directors exists (irrespective of length) and zero if no link exists (i.e.,
BDD=14). For our linear (log-linear) CEO compensation regressions, using the
minimum distance between inside and outside directors in this binary form, the t-statistics
for models 2 through 4 range from 5.38 to 3.57 (3.88 to 2.51) and coefficient estimates
range from $834,253 (0.16) for model 2 to $612,422 (0.11) for model 4. For our linear
(log-linear) CEO compensation regression specifications, using the minimum distance
between the CEO and the compensation committee in this binary form, the t-statistics for
models 2 through 4 range from 4.23 to 2.44 (4.48 to 2.59) and coefficient estimates range
from $709,611 (0.20) for model 2 to $453,688 (0.12) for model 4. These results again
suggest that the statistical association between “back door” distance and CEO
compensation is robust to alternative measurement choices.
5. Summary and Conclusions
The role of the board of directors as part of the governance landscape has received
considerable attention from academics, governance rating agencies and regulators. A key
task of the board is to determine the compensation package of the CEO. Indeed,
characteristics of top executive compensation packages are one of the key inputs into the
governance ratings produced by Governance Metrics International, Institutional
Shareholder Services, The Corporate Library and other similar organizations.

27
In this study we examine the impact of corporate board interlocks (broadly
defined) on CEO compensation. Previous research examining very narrow definitions of
corporate interlocks with small samples has been unable to document a robust association
between interlocks and CEO compensation (e.g., Hallock 1997 and Fich and White
2003). Using a comprehensive sample of 22,074 directors in 2002 and applying social
network analysis to develop measures for the links between directors, we find a strong
negative relation between various measures of the minimum distance from inside
directors to outside directors (and from the CEO to members of the compensation
committee) and CEO compensation. For example, where a link between the CEO and the
compensation committee exists, CEOs receive an extra $453,688 in total compensation.
Although the size of the extra compensation varies, the statistical significance of this
relation is robust to the inclusion of standard economic determinants of compensation,
alternate specifications of CEO compensation (linear and log-linear), and inclusion of
various CEO and board characteristics.
Our study has several implications for corporate governance. First, the results
lend support to the claims of regulators and rating agencies that have questioned the
ability of boards with substantial ties between directors to serve as effective monitors of
management. Our results suggest that CEOs are able to extract economic rents through
additional compensation when they have linkages with the directors that serve on the
compensation committee or when the inside and outside directors are linked. Second, our
study highlights the limitations of existing measures used in the prior research on director
interlocks. For example, ExecuComp focuses only on reciprocal interlocks. Such
interlocks represent only a small faction of all linkages between directors. Of the 3,114
28
firms in our sample only 5.7 percent are reciprocally interlocked, but 24 percent are
linked within the network. This implies that prior research has failed to capture a large
part of the linkages within the corporate director network either due to looking at small
samples or by focusing on solely reciprocal interlocks.
Our study has a number of limitations and it is important to make these explicit.
First, we use only one year of data in our analysis and this restricts our ability to
generalize to other periods. However, an advantage of our sample period is that it is after
(or perhaps concurrent with) the changes introduced by the Sarbanes-Oxley Act, and this
means that our results should reflect the current state of corporate governance. In
addition, despite being limited to one year, our sample size is very large (3,114 firms)
relative to prior work that has examined the association between director interlocks and
executive compensation (less than 500 firms). Second, although we examine a variety of
alternative specifications and incorporate a large set of control variables, there is always
the possibility that correlated omitted variables confound our interpretations. For
example, BDD may capture an unobserved economic characteristic that should rationally
be used to set CEO compensation (e.g., CEO quality). Third, it is difficult to assess
whether the incremental explanatory power associated with the BDD measure is
sufficient to make substantive conclusions about whether “back door” links actually have
an important impact on CEO compensation. Fourth, the BDD measure is at least partially
endogenous and this raises the typical concerns about the consistency of the regression
estimates. However, it is useful to note that BDD is not strictly endogenous because the
choices about directors made by other firms have an important impact on the BDD
measure. Finally, we only examine the impact of BDD on CEO compensation. If links

29
between directors impact their ability and motivation to monitor management, we should
also observe BDD to affect financial reporting choices, investment and financing
decisions, and perhaps firm performance. These analyses would be an interesting
extension for future research.
30
References
Bavelas, A. 1950. Communication Patterns in Task-Oriented Groups. Journal of the Acoustical Society of America, 22, 271-282. Bhagat, S., and B. Black. 2002. The non-correlation between board independence and long-term firm performance. Journal of Corporation Law, 27, 2, 231-273. Bonacich, P. 1972. Technique for Analyzing Overlapping Memberships. In Costner, H. (Ed.) Sociological Methodology, San Francisco, Jossey Bass. Brickley, J., J. Coles and R. Terry. 1994. Outside Directors and the Adoption of Poison Pills. Journal of Financial Economics, 35, 371-390. Burt, R. 1983. Corporate Profits and Cooptation: Networks of Market Constraints and Directorate Ties in the American Economy. New York Academic Press. Bushman, R. M., and A. J. Smith. 2001. Financial accounting information and corporate governance. Journal of Accounting and Economics, 32, 237-334. Byrd, J. and K. Hickman. 1992. Do Outside Directors Monitor Managers? Evidence from Tender Offer Bids. Journal of Financial Economics, 32, 195-207. Coleman, J. S., E. Katz, and H. Menzel. 1957. The Diffusion of an Innovation Among Physicians. Sociometry, 20, 253-270. Conyon, M. J., and M. R. Muldoon. 2004. The Small World Network Structure of Boards of Directors. Working paper, University of Pennsylvania and University of Manchester. Core, John E., Robert W. Holthausen, and David. F. Larcker. 1999. Corporate Governance, Chief Executive Officer Compensation, and Firm Performance, Journal of Financial Economics, 51, 371-406. Davis, G. F. 1991. Agents Without Principles? The Spread of the Poison Pill Through the Intercorporate Network. Administrative Science Quarterly, 36, 583-613. Davis, G. F., M. Yoo and W. E. Baker. 2003. The Small World of the American Corporate Elite, 1982-2001. Strategic Organization, 3, 301-326. Dooley, P. C. 1969. The Interlocking Directorate. American Economic Review, 59, 314-323. Fich, E. M., and L. J. White. 2003. CEO Compensation and Turnover: The Effects of Mutually Interlocked Boards. Wake Forest Law Review, 38, 935-959.

31
Galaskiewicz, J. 1985. Social Organization of an Urban Grants Economy. Newbury Park, CA: SAGE Publishing. Gompers, P. A., J. L. Ishii, and A. Metrick. 2003. Corporate Governance and Equity Prices. Quarterly Journal of Economics, 118, 107-155. Granovetter, M. 1974. Getting a Job. Cambridge MA, Harvard University Press. Hallock, K. F. 1997. Reciprocally Interlocking Boards of Directors and Executive Compensation. Journal of Financial and Quantitative Analysis, 32, 331-344. Hermalin, B. E. and M. S. Weisbach. 1998. Endogenously Chosen Boards of Directors and Their Monitoring of the CEO. American Economic Review, 88 (1), 96-118. Kapferer, B. 1969. Norms and the Manipulation of Relationships in a Work Context. In Mitchell, J. C. (Ed.) Social Networks in Urban Settings. Manchester University Press. Klein, April. 2002. Audit committee, board of director characteristics, and earnings management. Journal of Accounting and Economics, 33, 375-400. Larcker, D. F., S. A. Richardson, and I. Tuna. 2004. How important is corporate governance?, Working paper, University of Pennsylvania. Laumann, E. O., P. V. Marsden and J. Galaskiewicz. 1977. Community-elite influence structures: Extensions of a Network Approach. American Journal of Sociology, 83, 594-631. Levine, J. H. 1972. The Sphere of Influence. American Sociological Review, 37, 14-27. Levitt, Jr. A. 2004. Money, money, money. Wall Street Journal editorial, November 22, 2004, p A14. Milgram, S. 1967. The Small World Problem. Psychology Today, 2, 60-67. Mizruchi, M. S. 1992. The Structure of Corporate Political Action: Inter-firm Relations and Their Consequences. Harvard University Press. Mizruchi, M. S., and L. B. Stearns. 1988. A Longitudinal Study of the Formation of Interlocking Directorates. Administrative Science Quarterly, 33, 194-210. Morck, R., A. Shleifer, and R. W. Vishny. 1988. Management ownership and market valuation: An empirical analysis, Journal of Financial Economics, 20, 293-315. Moreno, J. L. 1934. Who Shall Survive? Foundations of Sociometry, Group Psychotherapy, and Sociodrama. Washington D.C.: Nervous and Mental Disease Publishing Co. (Beacon House).

32
Newman, M. E. J., S. H. Strogatz and D. J. Watts. 2001. Random graphs with arbitrary degree distributions and their applications. Physical Review, 64, 1-19. Padgett, J. F., and C. K. Ansell. 1993. Robust action and the rise of the Medici, 1400-1434. American Journal of Sociology, 98, 1259-1319. Palmer, D., R. Friedland, and J. Singh. 1986. The Ties that Bind: Organizational and Class Bases of Stability in a Corporate Interlock Network. American Sociological Review, 51, 781-796. Pfeffer, J., and G. R. Salancik. 1978. The External Control of Organizations: A Resource Dependence Perspective. New York, Harper and Row Publishers. Rao, H., G. F. Davis, and A. Ward. 2000. Embeddedness, Social Identity and Mobility: Why Firms Leave the NASDAQ and Join the New York Stock Exchange. Administrative Science Quarterly, 45, 268-292. Rosenstein, S. and J. G. Wyatt. 1990. Outside directors, board independence, and shareholder wealth. Journal of Financial Economics, 26, 175-191. Schoorman, F.D., M. H. Bazerman, and R. S. Atkin. 1981. Interlocking Directorates: A Strategy for Reducing Environmental Uncertainty. Academy of Management Review, 6, 243-251 Scott, J. 2000. Social Network Analysis: A Handbook. SAGE Publications, London. Shleifer, A. and R. W. Vishny. 1997, A Survey of Corporate Governance. Journal of Finance, 52 (2), 737-783. Wasserman, S., and K. Faust. 1994. Social Network Analysis: Methods and Applications. Cambridge University Press. Yermack, D., 1996. Higher Market Valuation of Companies with a Small Board of Directors. Journal of Financial Economics, 40, 185-211.

33
Figure 1Examples of Computing the Back Door Distance (BDD) Between Board Members
Company A
Director 1 Director 2
Company B
Director 1 Director 2
BDD Between Director 1 and Director 2 = 1
Company A
Director 1 Director 2
BDD Between Director 1 and Director 2 = 2
Company B
Director 1 Director 3
Company C
Director 3 Director 2

34
Table 1
Industry Composition of the Sample Two-digit
SIC Industry Percent of Sample Compustat Composition
1 Crops 0.1 0.2 7 Agriculture Services 0.1 0.1 10 Ores 0.2 1.2 12 Coal 0.2 0.2 13 Oil & Gas 2.5 4.0 14 Quarry 0.2 0.2 15 Building – Light 0.5 0.6 16 Building – Heavy 0.2 0.2 17 Construction 0.2 0.3 20 Food 1.3 1.9 21 Tobacco 0.2 0.1 22 Textile Mill 0.3 0.7 23 Apparel 0.7 0.9 24 Lumber 0.5 0.4 25 Furniture 0.4 0.5 26 Paper 0.9 0.8 27 Printing 1.2 1.2 28 Chemicals 8.0 5.0 29 Petroleum 0.4 0.4 30 Rubber 1.1 1.1 31 Leather 0.4 0.2 32 Stone 0.5 0.6 33 Metal Work – Basic 1.3 1.1 34 Metal Work – Fabrication 1.1 1.4 35 Industrial 4.7 5.2 36 Electrical 6.2 5.5 37 Transport – Equipment 1.5 1.6 38 Instruments 4.7 4.7 39 Misc. Manufacturing 0.8 1.0 40 Railroad 0.3 0.2 42 Motor freight 0.7 0.6 44 Water Transport 0.4 0.3 45 Air Transport 0.8 0.6 46 Pipe Lines 0.0 0.1 47 Transport – Services 0.4 0.3 48 Communications 3.4 3.8 49 Utilities 3.3 3.0 50 Durables – Wholesale 1.6 2.3

35
Two-digit SIC Industry Percent of Sample Compustat
Composition
51 NonDurables – Wholesale 0.8 1.4 52 Garden 0.2 0.2 53 General Stores 0.6 0.6 54 Food Stores 0.4 0.6 55 Auto Dealers 0.5 0.3 56 Apparel – Retail 1.5 0.6 57 Home Equipment 0.5 0.5 58 Eating 0.9 1.4 59 Misc. Retail 1.9 1.7 60 Depositories 10.9 7.9 61 Non-depositories 1.1 1.5 62 Brokers 1.3 1.0 63 Insurance 3.9 2.0 64 Ins Agents 0.7 0.5 65 Real Estate 0.4 1.3 67 Trusts 4.9 6.9 70 Hotels 0.3 0.5 72 Personal Services 0.3 0.3 73 Business Services 12.0 11.0 75 Auto Repair 0.1 0.2 78 Movies 0.3 0.9 79 Amusements 0.8 1.1 80 Health 1.5 1.7 81 Legal 0.0 0.0 82 Educational 0.4 0.3 83 Social 0.1 0.2 87 Engineering – Retail 1.9 1.8 99 Nonclassifiable 0.2 1.0
Total 100% 100%

36
Table 2 Descriptive Statistics for sample firm characteristics, CEO pay and characteristics,
Board Characteristics, and BDD measures
Panel A: Board Characteristics
Variable N Mean Std. Dev. Median Interquartile
Range
Board size 3,114 8.60 2.56 8 3 % outsiders 3,114 61.93 17.87 62.50 25 % affiliated 3,114 16.93 16.15 14.29 27.27 % outsiders older than 70 3,114 10.42 16.33 0 20 % affiliated older than 70 3,114 7.55 21.91 0 0 % affiliated appointed by insiders 3,114 42.98 46.74 0 100 % outsiders appointed by insiders 3,114 69.26 34.83 81.82 57.14 Lead director 3,114 0.06 0.25 0 0 Outside director is Chair 3,114 0.11 0.32 0 0
Panel B: BDD measures
Minimum Distance from Insiders to Outsiders
Minimum Distance from the CEO to the Compensation
Committee Value Frequency % Frequency %
1 179 5.8 111 3.9 2 76 2.5 50 1.7 3 114 3.7 82 2.9 4 135 4.4 116 4.0 5 109 3.5 89 3.1 6 53 1.7 50 1.7 7 19 0.6 18 0.6 8 10 0.3 10 0.3 9 0 0 3 0.1 10 2 0.1 2 0.1 11 2 0.1 1 0.0 12 1 0.0 1 0.0 13 0 0 0 0 14 2,373 77.2 2,334 81.4
Total 3,073 100 2,867 100
37
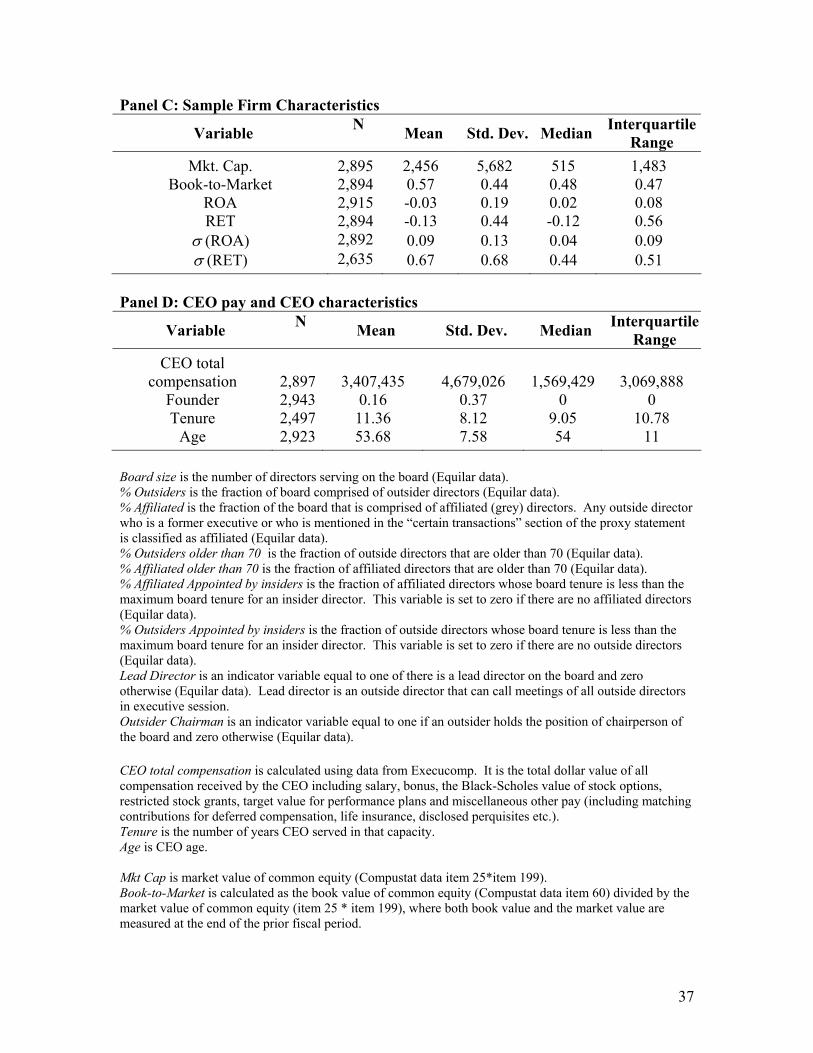
Panel C: Sample Firm Characteristics
Variable N Mean Std. Dev. Median InterquartileRange
Mkt. Cap. 2,895 2,456 5,682 515 1,483 Book-to-Market 2,894 0.57 0.44 0.48 0.47
ROA 2,915 -0.03 0.19 0.02 0.08 RET 2,894 -0.13 0.44 -0.12 0.56
σ (ROA) 2,892 0.09 0.13 0.04 0.09 σ (RET) 2,635 0.67 0.68 0.44 0.51
Panel D: CEO pay and CEO characteristics
Variable N Mean Std. Dev. Median InterquartileRange
CEO total compensation
2,897 3,407,435 4,679,026 1,569,429 3,069,888
Founder 2,943 0.16 0.37 0 0 Tenure 2,497 11.36 8.12 9.05 10.78
Age 2,923 53.68 7.58 54 11
Board size is the number of directors serving on the board (Equilar data). % Outsiders is the fraction of board comprised of outsider directors (Equilar data). % Affiliated is the fraction of the board that is comprised of affiliated (grey) directors. Any outside director who is a former executive or who is mentioned in the “certain transactions” section of the proxy statement is classified as affiliated (Equilar data). % Outsiders older than 70 is the fraction of outside directors that are older than 70 (Equilar data). % Affiliated older than 70 is the fraction of affiliated directors that are older than 70 (Equilar data). % Affiliated Appointed by insiders is the fraction of affiliated directors whose board tenure is less than the maximum board tenure for an insider director. This variable is set to zero if there are no affiliated directors (Equilar data). % Outsiders Appointed by insiders is the fraction of outside directors whose board tenure is less than the maximum board tenure for an insider director. This variable is set to zero if there are no outside directors (Equilar data). Lead Director is an indicator variable equal to one of there is a lead director on the board and zero otherwise (Equilar data). Lead director is an outside director that can call meetings of all outside directors in executive session. Outsider Chairman is an indicator variable equal to one if an outsider holds the position of chairperson of the board and zero otherwise (Equilar data). CEO total compensation is calculated using data from Execucomp. It is the total dollar value of all compensation received by the CEO including salary, bonus, the Black-Scholes value of stock options, restricted stock grants, target value for performance plans and miscellaneous other pay (including matching contributions for deferred compensation, life insurance, disclosed perquisites etc.). Tenure is the number of years CEO served in that capacity. Age is CEO age. Mkt Cap is market value of common equity (Compustat data item 25*item 199). Book-to-Market is calculated as the book value of common equity (Compustat data item 60) divided by the market value of common equity (item 25 * item 199), where both book value and the market value are measured at the end of the prior fiscal period.

38
ROA (return on assets) is calculated as income before extraordinary items (item18) deflated by average total assets. RET (12 month stock return) is calculated as the percentage change in price inclusive of dividends for the fiscal period. σ(ROA) is the standard deviation of ROA using at least 3 and up to 5 years of prior data. σ(RET) is the standard deviation of RET using at least 3 and up to 5 years of prior data.

39
Table 3 Correlations between Back Door Distance measures and some select variables.
Correlations between Back Door Distance measures and the other variables are less than 0.15 in absolute value.
Mkt. Cap. Board Size % outsiders
minimum distance from insiders to
outsiders
-0.34 (<0.01)
-0.23 (<0.01)
-0.15 (<0.01)
minimum distance from the CEO to the
compensation committee
-0.30 (<0.01)
-0.20 (<0.01)
-0.16 (<0.01)
minimum distance from insiders to
outsiders ≤3
0.37 (<0.01)
0.25 (<0.01)
0.16 (<0.01)
minimum distance from insiders to
outsiders ≥4 and ≤6
0.03 (0.07)
0.02 (0.20)
0.03 (0.16)
minimum distance from insiders to
outsiders ≥7
-0.32 (<0.01)
-0.22 (<0.01)
-0.14 (<0.01)
minimum distance from the CEO to the compensation
committee ≤ 3
0.29 (<0.01)
0.20 (<0.01)
0.11 (<0.01)
minimum distance from the CEO to the compensation committee ≥4 and
≤6
0.11 (<0.01)
0.07 (<0.01)
0.10 (0.01)
minimum distance from the CEO to the compensation
committee ≥6
-0.29 (<0.01)
-0.20 (<0.01)
-0.16 (<0.01)
Board size is the number of directors serving on the board (Equilar data). % Outsiders is the fraction of board comprised of outsider directors (Equilar data). Mkt. Cap. is market value of common equity (Compustat data item 25*item 199).

40
Table 4 Association between CEO compensation and Back Door Distance
Back Door Distance is measured as the minimum distance between the Insiders to the Outsiders
Panel A: Dollar value of total CEO compensation
Explanatory variables Model 1 (Economic
Determinants Only)
Model 2 (Model 1 and
BDD)
Model 3 (Model 2 and
CEO characteristics)
Model 4 (Model 3 and other board
characteristics) Intercept 1,471,566.50
(7.00) 2,549,135.10
(8.94) 5,476,381.40
(8.33) 1,555,736.50
(1.71) Mkt Cap 483.89
(42.85) 457.50 (38.32)
457.40 (34.32)
428.48 (30.77)
Book-to-Market -681,431.00 (-4.29)
-643,056.90 (-3.97)
-698,694.80 (-3.58)
-694,338.00 (-3.62)
ROA 379,328.31 (0.77)
327,033.61 (0.65)
-155,198.50 (-0.26)
-57,218.70 (-0.10)
RET 480,528.57 (2.74)
532,315.53 (2.99)
778,995.28 (3.60)
733,839.01 (3.45)
σ (ROA) -2,683,201.00 (-3.65)
-2,441,612.00 (-3.26)
-2,517,005.00 (-2.83)
-2,047,809.00 (-2.33)
σ (RET) 80,055.32 (0.78)
91,766.36 (0.89)
92,164.51 (0.79)
163,016.86 (1.41)
BDD -82,772.89 (-5.73)
-77,256.64 (-4.85)
-53,868.57 (-3.38)
Founder -451,348.00 (-2.08)
-296,484.50 (-1.38)
Tenure -10,306.54 (-1.02)
-3,149.60 (-0.30)
Age -13,691.75 (-1.26)
-16,140.64 (-1.50)
% outsiders 40,297.07 (5.25)
% affiliated 18,663.60 (2.19)
% outsiders older than 70 -5,878.02 (-1.31)
% affiliated older than 70 1,593.59 (0.50)
% affiliated appointed by insiders
171.42 (0.09)
% outsiders appointed by insiders
146.32 (0.06)
Board size 115,290.95 (3.19)
Lead director 93,604.31 (0.35)
Outsider Chair -521,399.10 (-2.21)
Industry Indicators Included Included Included Included N
Adj. R2 2,464 50.7%
2,441 50.3%
2,090 48.2%
2,089 49.6%

41
Table 4 - Continued Panel B: Natural logarithm of total CEO compensation
Explanatory variables Model 1 (Economic
Determinants Only)
Model 2 (Model 1 and
BDD)
Model 3 (Model 2 and
CEO characteristics)
Model 4 (Model 3 and other board
characteristics) Intercept 10.56
(106.38) 10.90
(83.78) 11.58
(20.50) 10.90
(18.88) Ln(Mkt Cap) 0.52
(45.09) 0.51
(40.38) 0.51
(35.57) 0.49
(31.27) Book-to-Market 0.15
(3.33) 0.13
(2.96) 0.16
(3.00) 0.13
(2.52) ROA -0.22
(-1.70) -0.22
(-1.68) -0.29
(-1.94) -0.28
(-1.93) RET 0.47
(9.96) 0.47
(9.98) 0.51
(9.19) 0.50
(9.09) σ (ROA) -0.04
(-0.19) -0.02
(-0.12) -0.12
(-0.54) -0.08
(-0.36) σ (RET) 0.07
(2.45) 0.07
(2.50) 0.07
(2.22) 0.08
(2.60) Ln(BDD) -0.09
(-4.01) -0.07
(-3.06) -0.06
(-2.45) Founder -0.15
(-2.86) -0.13
(-2.34) Ln(Tenure) -0.11
(-4.46) -0.10
(-3.71) Ln(Age) 0.01
(0.10) -0.04
(-0.26) % outsiders 0.01
(5.97) % affiliated 0.01
(3.47) % outsiders older than 70 -0.01
(-1.63) % affiliated older than 70 0.01
(0.84) % affiliated appointed by
insiders 0.00
(0.63) % outsiders appointed by
insiders 0.00
(0.72) Ln(Board size) 0.06
(0.68) Lead director -0.01
(-0.04) Outsider Chair -0.15
(-2.45) Industry indicators Included Included Included Included
N Adj. R2
2,496 54.5%
2,471 54.3%
2,115 50.3%
2,115 51.3%
Board size is the number of directors serving on the board (Equilar data). % Outsiders is the fraction of board comprised of outsider directors (Equilar data).

42
% Affiliated is the fraction of the board that is comprised of affiliated (grey) directors. Any outside director who is a former executive or who is mentioned in the “certain transactions” section of the proxy statement is classified as affiliated (Equilar data). % Outsiders older than 70 is the fraction of outside directors that are older than 70 (Equilar data). % Affiliated older than 70 is the fraction of affiliated directors that are older than 70 (Equilar data). % Affiliated Appointed by insiders is the fraction of affiliated directors whose board tenure is less than the maximum board tenure for an insider director. This variable is set to zero if there are no affiliated directors (Equilar data). % Outsiders Appointed by insiders is the fraction of outside directors whose board tenure is less than the maximum board tenure for an insider director. This variable is set to zero if there are no outside directors (Equilar data). Lead Director is an indicator variable equal to one of there is a lead director on the board and zero otherwise (Equilar data). Lead director is an outside director that can call meetings of all outside directors in executive session. Outsider Chairman is an indicator variable equal to one if an outsider holds the position of chairperson of the board and zero otherwise (Equilar data). CEO total compensation is calculated using data from Execucomp. It is the total dollar value of all compensation received by the CEO including salary, bonus, the Black-Scholes value of stock options, restricted stock grants, target value for performance plans and miscellaneous other pay (including matching contributions for deferred compensation, life insurance, disclosed perquisites etc.). Tenure is the number of years CEO served in that capacity. Age is CEO age. Mkt Cap is market value of common equity (Compustat data item 25*item 199). Book-to-Market is calculated as the book value of common equity (Compustat data item 60) divided by the market value of common equity (item 25 * item 199), where both book value and the market value are measured at the end of the prior fiscal period. ROA (return on assets) is calculated as income before extraordinary items (item18) deflated by average total assets. RET (12 month stock return) is calculated as the percentage change in price inclusive of dividends for the fiscal period. σ(ROA) is the standard deviation of ROA using at least 3 and up to 5 years of prior data. σ(RET) is the standard deviation of RET using at least 3 and up to 5 years of prior data.
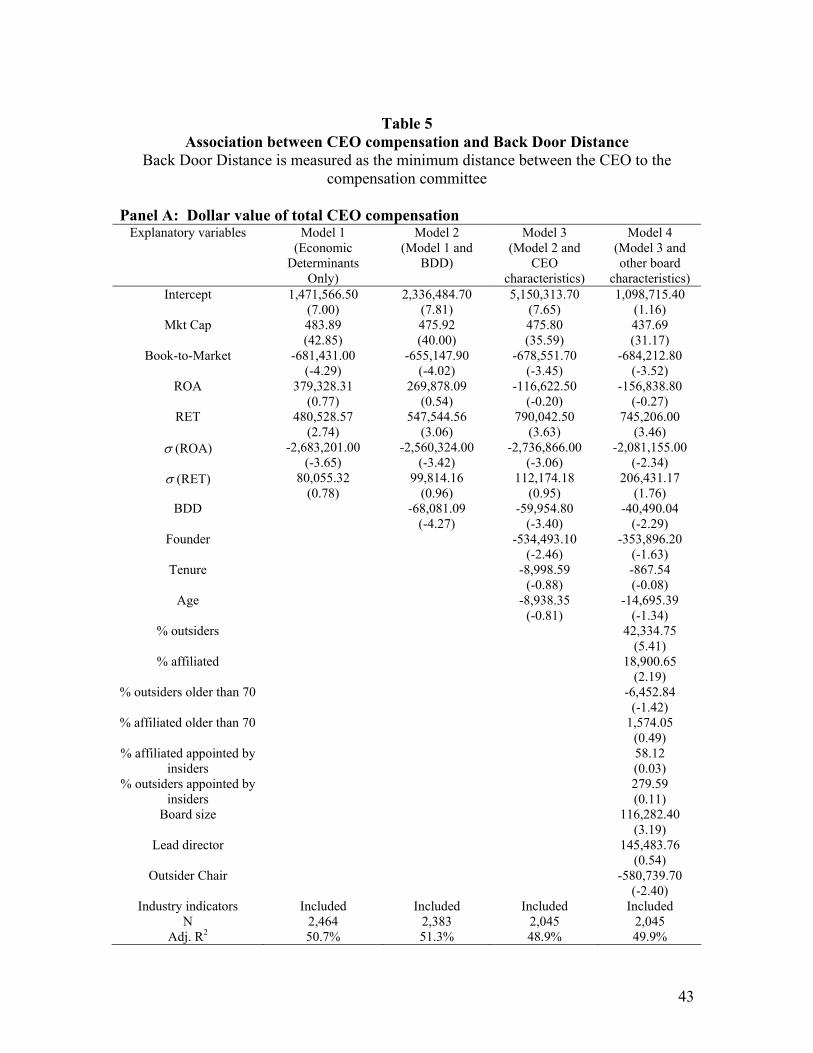
43
Table 5
Association between CEO compensation and Back Door Distance Back Door Distance is measured as the minimum distance between the CEO to the
compensation committee
Panel A: Dollar value of total CEO compensation Explanatory variables Model 1
(Economic Determinants
Only)
Model 2 (Model 1 and
BDD)
Model 3 (Model 2 and
CEO characteristics)
Model 4 (Model 3 and other board
characteristics) Intercept 1,471,566.50
(7.00) 2,336,484.70
(7.81) 5,150,313.70
(7.65) 1,098,715.40
(1.16) Mkt Cap 483.89
(42.85) 475.92 (40.00)
475.80 (35.59)
437.69 (31.17)
Book-to-Market -681,431.00 (-4.29)
-655,147.90 (-4.02)
-678,551.70 (-3.45)
-684,212.80 (-3.52)
ROA 379,328.31 (0.77)
269,878.09 (0.54)
-116,622.50 (-0.20)
-156,838.80 (-0.27)
RET 480,528.57 (2.74)
547,544.56 (3.06)
790,042.50 (3.63)
745,206.00 (3.46)
σ (ROA) -2,683,201.00 (-3.65)
-2,560,324.00 (-3.42)
-2,736,866.00 (-3.06)
-2,081,155.00 (-2.34)
σ (RET) 80,055.32 (0.78)
99,814.16 (0.96)
112,174.18 (0.95)
206,431.17 (1.76)
BDD -68,081.09 (-4.27)
-59,954.80 (-3.40)
-40,490.04 (-2.29)
Founder -534,493.10 (-2.46)
-353,896.20 (-1.63)
Tenure -8,998.59 (-0.88)
-867.54 (-0.08)
Age -8,938.35 (-0.81)
-14,695.39 (-1.34)
% outsiders 42,334.75 (5.41)
% affiliated 18,900.65 (2.19)
% outsiders older than 70 -6,452.84 (-1.42)
% affiliated older than 70 1,574.05 (0.49)
% affiliated appointed by insiders
58.12 (0.03)
% outsiders appointed by insiders
279.59 (0.11)
Board size 116,282.40 (3.19)
Lead director 145,483.76 (0.54)
Outsider Chair -580,739.70 (-2.40)
Industry indicators Included Included Included Included N
Adj. R2 2,464 50.7%
2,383 51.3%
2,045 48.9%
2,045 49.9%
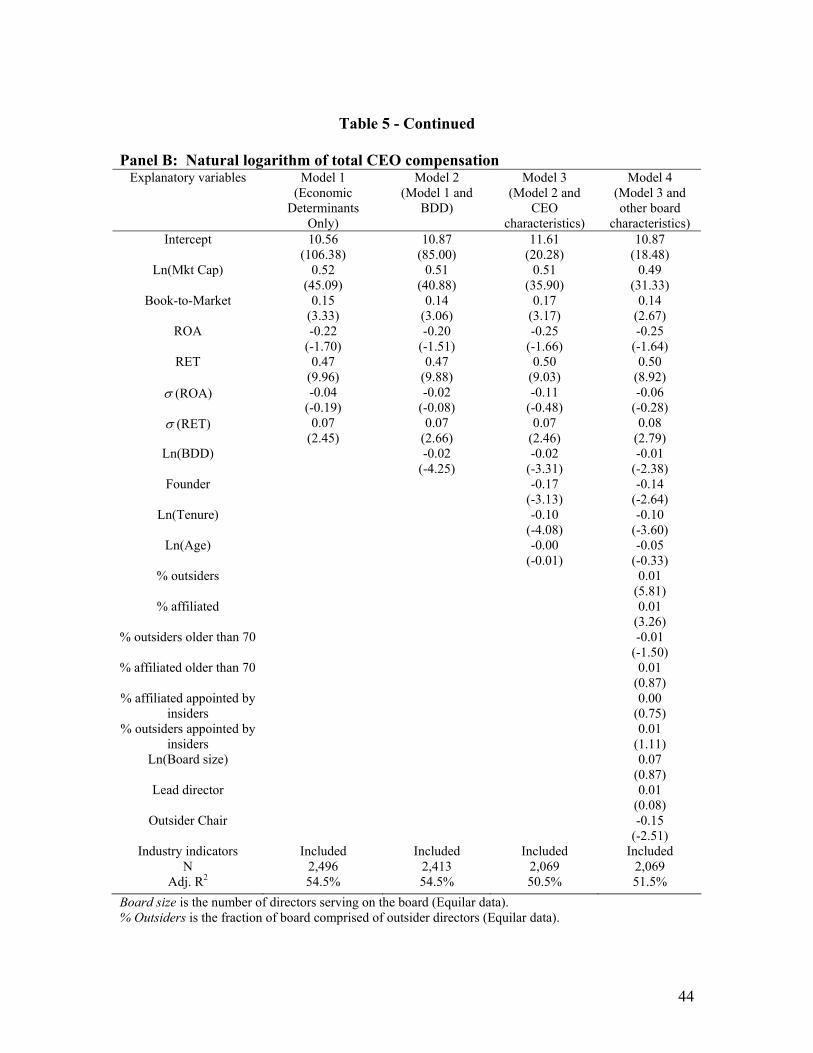
44
Table 5 - Continued
Panel B: Natural logarithm of total CEO compensation
Explanatory variables Model 1 (Economic
Determinants Only)
Model 2 (Model 1 and
BDD)
Model 3 (Model 2 and
CEO characteristics)
Model 4 (Model 3 and other board
characteristics) Intercept 10.56
(106.38) 10.87
(85.00) 11.61
(20.28) 10.87
(18.48) Ln(Mkt Cap) 0.52
(45.09) 0.51
(40.88) 0.51
(35.90) 0.49
(31.33) Book-to-Market 0.15
(3.33) 0.14
(3.06) 0.17
(3.17) 0.14
(2.67) ROA -0.22
(-1.70) -0.20
(-1.51) -0.25
(-1.66) -0.25
(-1.64) RET 0.47
(9.96) 0.47
(9.88) 0.50
(9.03) 0.50
(8.92) σ (ROA) -0.04
(-0.19) -0.02
(-0.08) -0.11
(-0.48) -0.06
(-0.28) σ (RET) 0.07
(2.45) 0.07
(2.66) 0.07
(2.46) 0.08
(2.79) Ln(BDD) -0.02
(-4.25) -0.02
(-3.31) -0.01
(-2.38) Founder -0.17
(-3.13) -0.14
(-2.64) Ln(Tenure) -0.10
(-4.08) -0.10
(-3.60) Ln(Age) -0.00
(-0.01) -0.05
(-0.33) % outsiders 0.01
(5.81) % affiliated 0.01
(3.26) % outsiders older than 70 -0.01
(-1.50) % affiliated older than 70 0.01
(0.87) % affiliated appointed by
insiders 0.00
(0.75) % outsiders appointed by
insiders 0.01
(1.11) Ln(Board size) 0.07
(0.87) Lead director 0.01
(0.08) Outsider Chair -0.15
(-2.51) Industry indicators Included Included Included Included
N Adj. R2
2,496 54.5%
2,413 54.5%
2,069 50.5%
2,069 51.5%
Board size is the number of directors serving on the board (Equilar data). % Outsiders is the fraction of board comprised of outsider directors (Equilar data).

45
% Affiliated is the fraction of the board that is comprised of affiliated (grey) directors. Any outside director who is a former executive or who is mentioned in the “certain transactions” section of the proxy statement is classified as affiliated (Equilar data). % Outsiders older than 70 is the fraction of outside directors that are older than 70 (Equilar data). % Affiliated older than 70 is the fraction of affiliated directors that are older than 70 (Equilar data). % Affiliated Appointed by insiders is the fraction of affiliated directors whose board tenure is less than the maximum board tenure for an insider director. This variable is set to zero if there are no affiliated directors (Equilar data). % Outsiders Appointed by insiders is the fraction of outside directors whose board tenure is less than the maximum board tenure for an insider director. This variable is set to zero if there are no outside directors (Equilar data). Lead Director is an indicator variable equal to one of there is a lead director on the board and zero otherwise (Equilar data). Lead director is an outside director that can call meetings of all outside directors in executive session. Outsider Chairman is an indicator variable equal to one if an outsider holds the position of chairperson of the board and zero otherwise (Equilar data). CEO total compensation is calculated using data from Execucomp. It is the total dollar value of all compensation received by the CEO including salary, bonus, the Black-Scholes value of stock options, restricted stock grants, target value for performance plans and miscellaneous other pay (including matching contributions for deferred compensation, life insurance, disclosed perquisites etc.). Tenure is the number of years CEO served in that capacity. Age is CEO age. Mkt Cap is market value of common equity (Compustat data item 25*item 199). Book-to-Market is calculated as the book value of common equity (Compustat data item 60) divided by the market value of common equity (item 25 * item 199), where both book value and the market value are measured at the end of the prior fiscal period. ROA (return on assets) is calculated as income before extraordinary items (item18) deflated by average total assets. RET (12 month stock return) is calculated as the percentage change in price inclusive of dividends for the fiscal period. σ(ROA) is the standard deviation of ROA using at least 3 and up to 5 years of prior data. σ(RET) is the standard deviation of RET using at least 3 and up to 5 years of prior data.

46
Table 6 Association between CEO compensation and Back Door Distance
Back Door Distance is the minimum distance between the Insiders to the Outsiders.
Panel A: Dollar value of total CEO compensation Explanatory variables Model 1
(Economic Determinants
Only)
Model 2 (Model 1 and
BDD)
Model 3 (Model 2 and
CEO characteristics)
Model 4 (Model 3 and other board
characteristics) Intercept 1,471,566.50
(7.00) 1,403,356.00
(6.58) 4,403,923.10
(7.18) 796,303.92
(0.92) Mkt Cap 483.89
(42.85) 456.51 (37.60)
458.67 (33.93)
430.63 (30.67)
Book-to-Market -681,431.00 (-4.29)
-650,180.00 (4.01)
-710,124.00 (-3.64)
-705,654.70 (-3.67)
ROA 379,328.31 (0.77)
318,633.84 (0.64)
-165,581.40 (-0.28)
-69,566.33 (-0.12)
RET 480,528.57 (2.74)
534,035.32 (3.00)
784,241.69 (3.63)
739,905.74 (3.48)
σ (ROA) -2,683,201.00 (-3.65)
-2,438,232.00 (-3.25)
-2,494,175.00 (-2.80)
-2,021,730.00 (-2.30)
σ (RET) 80,055.32 (0.78)
91,993.88 (0.89)
87,477.43 (0.75)
156,544.20 (1.35)
1 ≤ BDD ≤ 3 1,035,477.30 (5.03)
853,970.42 (3.80)
499,281.26 (2.21)
4 ≤ BDD ≤ 6 729,985.09 (3.44)
870,586.43 (3.74)
751,227.26 (3.28)
Founder -439,319.20 (-2.03)
-282,995.20 (-1.31)
Tenure -10,114.08 (-1.00)
-2,746.90 (-0.26)
Age -14,019.12 (-1.29)
-16,663.56 (-1.54)
% outsiders 40,367.69 (5.26)
% affiliated 18,595.52 (2.19)
% outsiders older than 70 -6,064.90 (-1.35)
% affiliated older than 70 1,353.50 (0.43)
% affiliated appointed by insiders
115.86 (0.06)
% outsiders appointed by insiders
142.82 (0.06)
Board size 117,954.13 (3.25)
Lead director 83,912.61 (0.32)
Outsider Chair -526,701.60 (-2.23)
Industry indicators Included Included Included Included N
Adj. R2 2,464 50.7%
2,441 50.3%
2,090 48.2%
2,089 49.6%

47
Table 6 - Continued Panel B: Natural logarithm of total CEO compensation
Explanatory variables Model 1 (Economic
Determinants Only)
Model 2 (Model 1 and
BDD)
Model 3 (Model 2 and
CEO characteristics)
Model 4 (Model 3 and other board
characteristics) Intercept 10.56
(106.38) 10.67
(103.22) 11.39
(20.55) 10.74
(18.97) Ln(Mkt Cap) 0.52
(45.09) 0.50
(40.04) 0.51
(35.29) 0.49
(31.17) Book-to-Market 0.15
(3.33) 0.13
(2.94) 0.15
(2.97) 0.13
(2.50) ROA -0.22
(-1.70) -0.22
(-1.70) -0.29
(-1.96) -0.29
(-1.95) RET 0.47
(9.96) 0.47
(9.98) 0.51
(9.20) 0.50
(9.10) σ (ROA) -0.04
(-0.19) -0.03
(-0.13) -0.12
(-0.54) -0.08
(-0.36) σ (RET) 0.07
(2.45) 0.07
(2.52) 0.07
(2.24) 0.08
(2.61) 1 ≤ BDD ≤ 3 0.20
(3.78) 0.16
(2.81) 0.12
(2.14) 4 ≤ BDD ≤ 6 0.09
(1.67) 0.08
(1.33) 0.07
(1.12) Founder -0.15
(-2.85) -0.13
(-2.34) Ln(Tenure) -0.11
(-4.43) -0.10
(-3.68) Ln(Age) 0.01
(0.10) -0.04
(-0.25) % outsiders 0.01
(5.97) % affiliated 0.01
(3.46) % outsiders older than 70 -0.01
(-1.65) % affiliated older than 70 0.01
(0.85) % affiliated appointed by
insiders 0.00
(0.62) % outsiders appointed by
insiders 0.00
(0.74) Ln(Board size) 0.06
(0.67) Lead director -0.01
(-0.06) Outsider Chair -0.15
(-2.46) Industry indicators Included Included Included Included
N Adj. R2
2,496 54.5%
2,471 54.2%
2,115 50.3%
2,115 51.2%
Board size is the number of directors serving on the board (Equilar data). % Outsiders is the fraction of board comprised of outsider directors (Equilar data).

48
% Affiliated is the fraction of the board that is comprised of affiliated (grey) directors. Any outside director who is a former executive or who is mentioned in the “certain transactions” section of the proxy statement is classified as affiliated (Equilar data). % Outsiders older than 70 is the fraction of outside directors that are older than 70 (Equilar data). % Affiliated older than 70 is the fraction of affiliated directors that are older than 70 (Equilar data). % Affiliated Appointed by insiders is the fraction of affiliated directors whose board tenure is less than the maximum board tenure for an insider director. This variable is set to zero if there are no affiliated directors (Equilar data). % Outsiders Appointed by insiders is the fraction of outside directors whose board tenure is less than the maximum board tenure for an insider director. This variable is set to zero if there are no outside directors (Equilar data). Lead Director is an indicator variable equal to one of there is a lead director on the board and zero otherwise (Equilar data). Lead director is an outside director that can call meetings of all outside directors in executive session. Outsider Chairman is an indicator variable equal to one if an outsider holds the position of chairperson of the board and zero otherwise (Equilar data). CEO total compensation is calculated using data from Execucomp. It is the total dollar value of all compensation received by the CEO including salary, bonus, the Black-Scholes value of stock options, restricted stock grants, target value for performance plans and miscellaneous other pay (including matching contributions for deferred compensation, life insurance, disclosed perquisites etc.). Tenure is the number of years CEO served in that capacity. Age is CEO age. Mkt Cap is market value of common equity (Compustat data item 25*item 199). Book-to-Market is calculated as the book value of common equity (Compustat data item 60) divided by the market value of common equity (item 25 * item 199), where both book value and the market value are measured at the end of the prior fiscal period. ROA (return on assets) is calculated as income before extraordinary items (item18) deflated by average total assets. RET (12 month stock return) is calculated as the percentage change in price inclusive of dividends for the fiscal period. σ(ROA) is the standard deviation of ROA using at least 3 and up to 5 years of prior data. σ(RET) is the standard deviation of RET using at least 3 and up to 5 years of prior data.

49
Table 7 Association between CEO compensation and Back Door Distance
Back Door Distance is the minimum distance between the CEO to the compensation committee.
Panel A: Dollar value of total CEO compensation Explanatory variables Model 1
(Economic Determinants
Only)
Model 2 (Model 1 and
BDD)
Model 3 (Model 2 and
CEO characteristics)
Model 4 (Model 3 and other board
characteristics) Intercept 1,471,566.50
(7.00) 1,389,346.30
(6.53) 4,310,396.70
(6.97) 581,404.57
(0.66) Mkt Cap 483.89
(42.85) 475.12 (39.69)
476.26 (35.44)
438.15 (31.11)
Book-to-Market -681,431.00 (-4.29)
-663,811.20 (-4.08)
-693,484.20 (-3.53)
-696,361.50 (-3.58)
ROA 379,328.31 (0.77)
275,103.65 (0.55)
-96,424.83 (-0.16)
-138,543.50 (-0.24)
RET 480,528.57 (2.74)
553,249.82 (3.10)
801,934.20 (3.68)
754,858.31 (3.51)
σ (ROA) -2,683,201.00 (-3.65)
-2,535,333.00 (-3.38)
-2,692,568.00 (-3.01)
-2,049,352.00 (-2.31)
σ (RET) 80,055.32 (0.78)
100,957.67 (0.97)
114,637.85 (0.98)
208,842.45 (1.78)
1 ≤ BDD ≤ 3 821,003.52 (3.45)
550,056.29 (2.09)
332,872.36 (1.27)
4 ≤ BDD ≤ 6 735,296.57 (3.36)
882,863.26 (3.69)
678,528.43 (2.85)
Founder -531,821.80 (-2.45)
-351,702.60 (-1.62)
Tenure -8,678.30 (-0.85)
-431.04 (-0.04)
Age -9,175.78 (-0.83)
-14,915.48 (-1.37)
% outsiders 41,678.38 (5.32)
% affiliated 18,534.97 (2.15)
% outsiders older than 70 -6,559.02 (-1.44)
% affiliated older than 70 1,415.95 (0.44)
% affiliated appointed by insiders
30.69 (0.02)
% outsiders appointed by insiders
135.38 (0.05)
Board size 117,224.16 (3.22)
Lead director 136,695.50 (0.50)
Outsider Chair -578.466.60 (-2.39)
Industry indicators Included Included Included Included N
Adj. R2 2,464 50.7%
2,383 51.3%
2,045 49.0%
2,045 49.9%

50
Table 7 - Continued Panel B: Natural logarithm of total CEO compensation
Explanatory variables Model 1 (Economic
Determinants Only)
Model 2 (Model 1 and
BDD)
Model 3 (Model 2 and
CEO characteristics)
Model 4 (Model 3 and other board
characteristics) Intercept 10.56
(106.38) 10.63
(102.69) 11.40
(20.35) 10.71
(18.66) Ln(Mkt Cap) 0.52
(45.09) 0.51
(40.80) 0.51
(35.83) 0.49
(31.29) Book-to-Market 0.15
(3.33) 0.14
(3.02) 0.16
(3.13) 0.14
(2.64) ROA -0.22
(-1.70) -0.20
(-1.51) -0.25
(-1.65) -0.24
(-1.63) RET 0.47
(9.96) 0.47
(9.89) 0.51
(9.05) 0.50
(8.94) σ (ROA) -0.04
(-0.19) -0.01
(-0.06) -0.10
(-0.46) -0.06
(-0.26) σ (RET) 0.07
(2.45) 0.07
(2.66) 0.07
(2.47) 0.08
(2.79) 1 ≤ BDD ≤ 3 0.21
(3.48) 0.17
(2.65) 0.13
(1.93) 4 ≤ BDD ≤ 6 0.16
(2.84) 0.15
(2.51) 0.11
(1.78) Founder -0.17
(-3.13) -0.14
(-2.64) Ln(Tenure) -0.10
(-4.08) -0.10
(-3.59) Ln(Age) 0.01
(0.02) -0.04
(-0.31) % outsiders 0.01
(5.80) % affiliated 0.01
(3.26) % outsiders older than 70 -0.01
(-1.51) % affiliated older than 70 0.01
(0.87) % affiliated appointed by
insiders 0.00
(0.73) % outsiders appointed by
insiders 0.01
(1.11) Ln(Board size) 0.07
(0.86) Lead director 0.01
(0.07) Outsider Chair -0.15
(-2.50) Industry indicators Included Included Included Included
N Adj. R2
2,496 54.5%
2,413 54.5%
2,069 50.5%
2,069 51.5%
Board size is the number of directors serving on the board (Equilar data). % Outsiders is the fraction of board comprised of outsider directors (Equilar data).

51
% Affiliated is the fraction of the board that is comprised of affiliated (grey) directors. Any outside director who is a former executive or who is mentioned in the “certain transactions” section of the proxy statement is classified as affiliated (Equilar data). % Outsiders older than 70 is the fraction of outside directors that are older than 70 (Equilar data). % Affiliated older than 70 is the fraction of affiliated directors that are older than 70 (Equilar data). % Affiliated Appointed by insiders is the fraction of affiliated directors whose board tenure is less than the maximum board tenure for an insider director. This variable is set to zero if there are no affiliated directors (Equilar data). % Outsiders Appointed by insiders is the fraction of outside directors whose board tenure is less than the maximum board tenure for an insider director. This variable is set to zero if there are no outside directors (Equilar data). Lead Director is an indicator variable equal to one of there is a lead director on the board and zero otherwise (Equilar data). Lead director is an outside director that can call meetings of all outside directors in executive session. Outsider Chairman is an indicator variable equal to one if an outsider holds the position of chairperson of the board and zero otherwise (Equilar data). CEO total compensation is calculated using data from ExecuComp. It is the total dollar value of all compensation received by the CEO including salary, bonus, the Black-Scholes value of stock options, restricted stock grants, target value for performance plans and miscellaneous other pay (including matching contributions for deferred compensation, life insurance, disclosed perquisites etc.). Tenure is the number of years CEO served in that capacity. Age is CEO age. Mkt Cap is market value of common equity (Compustat data item 25*item 199). Book-to-Market is calculated as the book value of common equity (Compustat data item 60) divided by the market value of common equity (item 25 * item 199), where both book value and the market value are measured at the end of the prior fiscal period. ROA (return on assets) is calculated as income before extraordinary items (item18) deflated by average total assets. RET (12 month stock return) is calculated as the percentage change in price inclusive of dividends for the fiscal period. σ(ROA) is the standard deviation of ROA using at least 3 and up to 5 years of prior data. σ(RET) is the standard deviation of RET using at least 3 and up to 5 years of prior data.
![FROM BACK DOOR TO FRONT DOOR - Jesuit Refugee ... of ConTenTs [ from baCk Door To fronT Door ] 1 Introduction Macedonia Reasons for fleeing A traumatic journey A variety of routes](https://static.fdocuments.us/doc/165x107/5ac10d437f8b9a5a4e8cb512/from-back-door-to-front-door-jesuit-refugee-of-contents-from-back-door-to.jpg)