BABEȘ - BOLYAI UNIVERSITY OF CLUJ -...
59
BABEȘ - BOLYAI UNIVERSITY OF CLUJ - NAPOCA FACULTY OF CHEMISTRY AND CHEMICAL ENGINEERING A Kinetic Study on the Oxidation of Thiols and Mercaptoacids by several Transitional Metal Ions Summary of Ph D. Thesis Scientific Advisor Ph.D Student Prof. Dr. Ioan BÂLDEA Dana‐Maria SABOU Cluj‐Napoca 2011
Transcript of BABEȘ - BOLYAI UNIVERSITY OF CLUJ -...

BABEȘ - BOLYAI UNIVERSITY OF CLUJ - NAPOCA FACULTY OF CHEMISTRY AND CHEMICAL ENGINEERING
A Kinetic Study on the Oxidation of
Thiols and Mercaptoacids by several
Transitional Metal Ions
Summary of Ph D. Thesis
Scientific Advisor Ph.D Student
Prof. Dr. Ioan BÂLDEA Dana‐Maria SABOU
Cluj‐Napoca 2011

BABEȘ - BOLYAI UNIVERSITY OF CLUJ - NAPOCA FACULTY OF CHEMISTRY AND CHEMICAL ENGINEERING
A Kinetic Study on the Oxidation of Thiols and
Mercaptoacids by several Transitional Metal Ions
Dana‐Maria SABOU
Summary of Ph D. Thesis
Jury:
PRESIDENT
Assoc. Prof. Dr. Cornelia MAJDIK, Dean,
Faculty of Chemistry and Chemical Engineering, Babeş-Bolyai University, Cluj-Napoca
SCIENTIFIC ADVISOR
Prof. Dr. Ioan BÂLDEA, Babeş-Bolyai University, Cluj-Napoca
REVIEWERS
Prof. Dr. C. M. Rom. Acad. Dumitru OANCEA, University of Bucharest
Prof. Dr. Eng. Marcel Ionel POPA, Technical University “Gh. Asachi”, Iaşi
Assoc. Prof. Dr. Eng. Alexandra Ana CSAVDARI, Babeş-Bolyai University, Cluj-Napoca
Cluj‐Napoca 2011

i
CONTENTS OF THE THESIS INTRODUCTION .................................................................................................................v
THE STRUCTURE OF THE PH.D. THESIS ..............................................................vii I. THEORETICAL CONSIDERATIONS ON REDOX PROCESSES
I.1. GENERAL ASPECTS …............................................................................................1
I.2. THE ELECTRON-TRANSFER MECHANISM. OUTER-SPHERE AND INNER - SPHERE MECHANISMS ..........................................................................1
I.3. OXIDATION OR REDUCTION OF THE COORDINATED LIGAND................4
I.4. EVIDENCE OF THE INVOLVEMENT OF AN INTERMEDIATE.....................5
I.4.1. PROOF THAT NO INTERMEDIATE EXISTS...............................................6
I.5. CATALYSIS IN REDOX REACTIONS....................................................................6
I.5.1. CATALYSIS BY IONIC ASSOCIATION IN OUTER SPHERE REACTIONS 6
I.5.2. CATALYSIS BY ANOTHER REDOX COUPLE .............................................7 II. CHARACTERIZATION OF THE REACTING SYSTEMS INVESTIGATED IN THIS WORK II.1. THIOLS ......................................................................................................................8
II.1.1. THE STRUCTURE AND REACTIVITY OF THIOLS ..................................9
II.1.2. THE OXIDATION OF THIOLS …..............................................................10
II.1.3. THE STUDIED THIO-COMPOUNDS .......................................................12
II.2. CHROMIUM (VI) ....................................................................................................14
II.2.1. OXIDATION STATES OF CHROMIUM …................................................14
II.2.2. EQUILIBRIA IN Cr(VI) SOLUTIONS ........................................................17
II.2.3. OXIDATIONS WITH CHROMIUM(VI) .....................................................20
II.2.3.1. Reduction of Chromium (VI) ...........................................................22
II.2.3.2. Reduction of Cr(V) intermediates ....................................................29
II.2.3.3. Behaviour of Cr(IV) as an intermediate ……...................................31
II.2.3.4. The oxidation of thiols by Cr(VI) .....................................................33
II.3. VANADIUM (V) ......................................................................................................37
II.3.1. THE CHEMISTRY OF AQUEOUS SOLUTIONS OF VANADIUM ..........37
II.3.2. OXIDATIONS OF ORGANIC SUBSTANCES BY VANADIUM (V)...........40
II.3.2.1. Oxidation of thiols by vanadium(V) .................................................42
II.4. HEXACYANOFERRATE (III) ..............................................................................44
II.4.1. FERRI- AND FERRO-CYANIC COMPLEXES...........................................44

ii
II.4.2. OXIDATIONS OF SOME ORGANIC SUBSTRATES BY HEXACYANOFERRATE (III) ....................................................................48
II.4.2.1. Oxidation of thiols by hexacyanoferrate (III) ...................................51
II.4.2.2. Cu2+ catalysis in the oxidation of thiols by hexacyanoferrate (III) ..52
II.4.2.3. EDTA – complexing agent for cationic impurities ..........................54 III. ORIGINAL CONTRIBUTIONS
III.1. EXPERIMENTAL ASPECTS...............................................................................56
III.1.1. REAGENTS AND SOLUTIONS.................................................................56
III.1.2. APPARATUSES AND EXPERIMENTAL PROCEDURES .......................57
III.1.2.1. Spectrofotometric measurements ....................................................57
III.1.2.2. ESR measurements ..........................................................................63
III.1.2.3. Calorimetric measurements..............................................................64 A. OXIDATIONS OF THIOLACTIC ACID BY VARIOUS OXIDIZING SYSTEMS
III.2. THE OXIDATION OF THIOLACTIC ACID BY CHROMIUM(VI) IN ACIDIC MEDIUM ..................................................................................................65
III.2.1. INTRODUCTORY ASPECTS ....................................................................65
III.2.1.1. Preliminary observations .................................................................66
III.2.1.2. Choice of working conditions .........................................................66
III.2.2. GLOBAL STOICHIOMETRY OF THE PROCESS ...................................68
III.2.3. ELECTRONIC SPECTRA. EVIDENCE OF AN INTERMEDIATE...........70
III.2.4. DETERMINATION OF THE OBSERVED RATE CONSTANTS ..............71
III.2.4.1. Experimental curves ........................................................................71
III.2.4.2. Mechanistic model and mathematic approach ................................72
III.2.5. KINETICS OF THE INTERMEDIATE FORMATION ..............................83
III.2.5.1. Determination of the reaction orders based on the apparent constants ..........................................................................................83
III.2.5.2. Verification of the reaction orders. Initial rate method ...................86
III.2.5.3. Evaluation of the rate constants for intermediate formation based on the apparent constants ................................................................88
III.2.6. KINETICS OF THE ELECTRON TRANSFER STEP (DECAY OF THE INTERMEDIATE) .....................................................................................90
III.2.7. INFLUENCE OF IONIC STRENGTH ......................................................93
III.2.8. DETERMINATION OF ACTIVATION ENERGIES ..................................94
III.2.9. INVOLVEMENT OF OTHER INTERMEDIATES ....................................95

iii
III.2.10. DISCUSSIONS. MECHANISM OF THE PROCESS ..............................97
III.2.11. CONCLUSIONS ....................................................................................100
III.3. THE OXIDATION OF THIOLACTIC ACID BY VANADIUM (V) IN ACIDIC MEDIUM ...............................................................................................................102
III.3.1. INTRODUCTORY ASPECTS...................................................................102
III.3.2. PRELIMINARY INVESTIGATIONS ........................................................103
III.3.3. KINETICS OF ACID HYDROLYSIS OF POLYVANADATE ..................104
III.3.4. KINETICS OF POLYVANADATE REDUCTION ...................................106
III.3.4.1. Influence of the thiol concentration ..............................................108
III.3.4.2. Influence of acidity .......................................................................108
III.3.5. ACTIVATION PARAMETERS .................................................................111
III.3.6. THE OXIDATION BY VO2+ ....................................................................111
III.3.6.1. Effects of reactant concentrations and of ionic strength ...............111
III.3.6.2. ESR investigations on VO2+- thiolactic acid system .....................113
III.3.7. CONCLUSIONS AND MECHANISM .....................................................114
III.4. OXIDATION OF THIOLACTIC ACID BY HEXACYANOFERRATE (III) IN PERCHLORIC ACID MEDIUM ..................................................................116
III.4.1. INTRODUCTORY CONSIDERATIONS .................................................116
III.4.1.1. Stoichiometry .................................................................................116
III.4.1.2. Kinetic curves and their processing ...............................................117
III.4.2. SPECTRAL PROOF OF INTERMEDIATE FORMATION .....................118
III.4.3. EFFECTS OF THE CONCENTRATIONS OF THE REACTANTS .........119
III.4.3.1. Influence of thiolactic acid concentration .....................................120
III.4.3.2. Influence of acidity ........................................................................122
III.4.4. DETERMINATION OF ACTIVATION PARAMETERS ..........................123
III.4.5. FREE RADICALS ....................................................................................124
III.4.6. REACTION MECHANISM ......................................................................124
III.4.7. CONCLUSIONS ......................................................................................126
B. OXIDATIONS OF OTHER THIOCOMPOUNDS BY CHROMIUM (VI)
III.5. OXIDATION OF GLUTATHIONE BY CHROMIUM(VI) IN PERCHLORIC ACID MEDIUM ....................................................................................................127
III.5.1. INTRODUCTORY ASPECTS ..................................................................127

iv
III.5.1.1. Working conditions .......................................................................127
III.5.1.2. Preliminary observations ...............................................................127
III.5.2. PROOF OF THE EXISTENCE OF AN INTERMEDIATE ......................128
III.5.3. KINETICS OF THE FORMATION OF THE INTERMEDIATE .............129
III.5.3.1. Reaction order with respect to chromate .......................................130
III.5.3.2. Reaction orders with respect to glutathione and H+ ion ................131
III.5.4. KINETICS OF THE DECOMPOSITION OF THE INTERMEDIATE ....132
III.5.4.1. Experimental curves ......................................................................132
III.5.4.2. Influence of the glutathione concentration on the reaction rate ....132
III.5.4.3. Influence of the H+ concentration on the reaction rate ..................133
III.5.4.4. Apparent activation energy of the electron transfer step ...............134
III.5.5. PARAMAGNETIC INTERMEDIATES ....................................................134
III.5.6. CONCLUSIONS ......................................................................................135
III.6. OXIDATION OF BENZYL MERCAPTANE (α-TOLUENE-THIOL) WITH CHROMIUM(VI) IN GLACIAL ACETIC ACID .............................................136
III.6.1. INTRODUCTORY CONSIDERATIONS .................................................136
III.6.1.1. Working conditions and method ...................................................136
III.6.1.2. Preliminary observations ...............................................................138
III.6.2. ELECTRONIC SPECTRA. EVIDENCE OF INTERMEDIATE ..............138
III.6.3. KINETICS OF THE PROCESS ...............................................................140
III.6.4. EQUILIBRIUM OF INTERMEDIATE FORMATION. EQUILIBRIUM CONSTANT .............................................................................................144
III.6.5. TEMPERATURE EFFECT .....................................................................146
III.6.6. DISCUSIONS AND CONCLUSIONS. MECHANISM. ...........................147
GENERAL CONCLUSIONS ..........................................................................................149
REFERENCES ...................................................................................................................153
ANNEXES ............................................................................................................................179
Key Words: kinetics, homogeneous redox reactions, thiols, thiolactic acid, glutathione,
benzyl mercaptan, transition metal ions, chromium VI, vanadium V, hexacyanoferrate III,
spectrophotometry, ESR.

1
INTRODUCTION
One of the most prevalent classes of chemical processes, the oxidation-reduction
(redox) reactions, contains the simplest of processes, such as the formation of a compound
from its elements, as well as some of the most complex reactions, like those taking place in
the living cells, either generating energy for them to live or governing their decay after death.
Furthermore, oscillating reactions, taking place in vitro or in vivo also involve redox
processes. It is therefore easily understood, that there is a great interest of scientists in this
field to describe the intimate mechanisms of redox processes.
THE STRUCTURE OF THE PH.D THESIS
The Ph.D. thesis is made of two main sections. The first (Chapters I and II) gives a
concise literature presentation of the class of redox reactions investigated (Chapter I) together
with a description of the properties and reactions of the substances used in the kinetic study
(Chapter II). The literature data focuses on the class of thiol compounds, with their anti-
oxidizing character, in their reactions with various oxidants. The oxidizing character of
Cr(VI), V(V), as well as that of Fe(III) in the hexacyanoferrate(III) complex, are described by
several examples in order to provide a basis for the interpretations of the studies undertaken.
The second section (Chapter III) contains the personal contributions. It first provides a
detailed presentation of the apparatuses and experimental procedures employed, and it
continues by presenting the results obtained with the five reaction systems studied, as
depicted in the scheme below.
Each system has been approached kinetically, searching for the involvement of some
short-lived or long-lived intermediates to understand the details of their mechanism.
The general conclusions summarize the obtained results as well as the similarities or
the difference occurring within these systems.
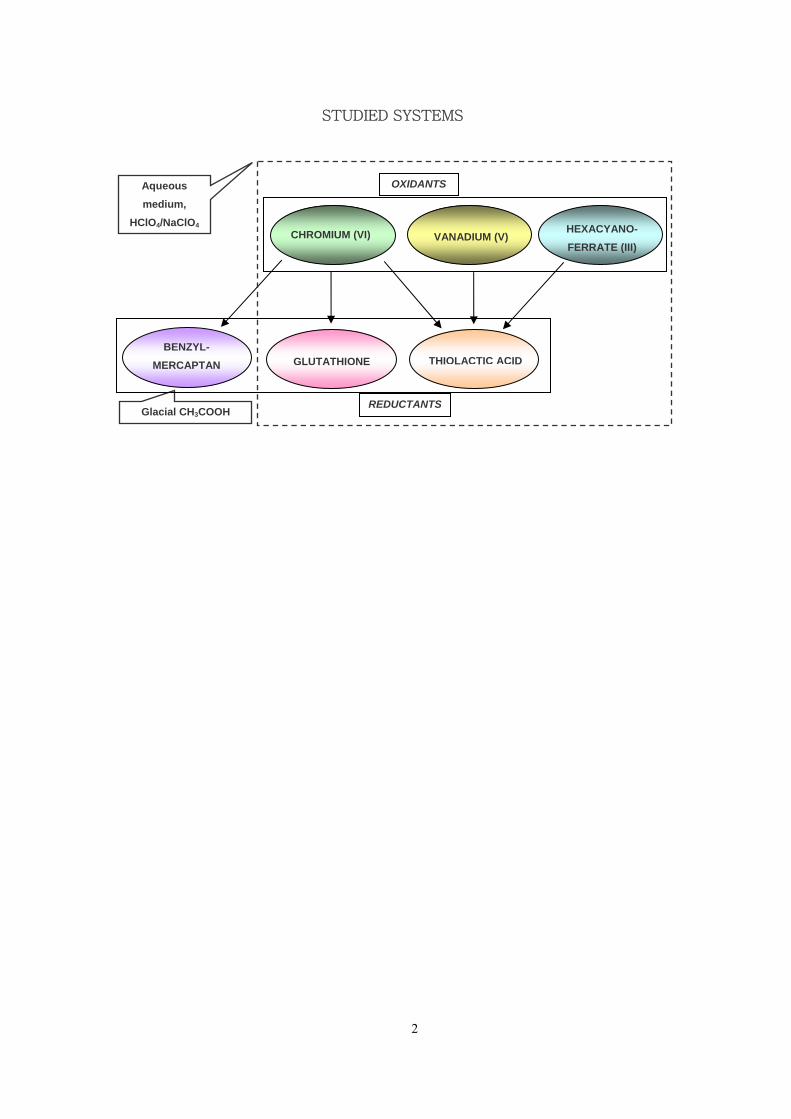
STUDIED SYSTEMS
2
CHROMIUM (VI) VANADIUM (V)HEXACYANO-FERRATE (III)
GLUTATHIONE THIOLACTIC ACID
OXIDANTS
BENZYL- MERCAPTAN
Aqueous medium,
HClO4/NaClO4
Glacial CH3COOH REDUCTANTS

I. THEORETICAL CONSIDERATIONS ON REDOX PROCESSES
I.1. GENERAL ASPECTS
The most important feature of an oxidation-reduction reaction is the charge transfer
between the participants. The electron transfer implies that changes must take place at the
atomic level in the orbital populations of the two species, thus influencing the other bonds in
which the respective atoms are involved.1 This work approaches mixed redox reactions,
taking as reducing agents several organic substrates and as oxidizing agents complexes of
different transitional metals ion in their highest oxidation state.
I.2. THE ELECTRON-TRANSFER MECHANISM. OUTER-SPHERE AND INNER -
SPHERE MECHANISMS.
Considering the electron transfer reaction and the structural changes accompanying it,
Henry Taube5 (Nobel prize 1983) classified these redox processes into two classes:
- outer-sphere redox processes
- inner-sphere redox processes.
Figure I.2.1 presents schematically the two ways of electron-transfer:
ox1 red2 ox1 red2
a) b)
Figure I.2.1. Schematic representation of the interactions between reactants: outer-sphere (a) and inner-sphere (b)
Outer-sphere mechanisms involve a direct transfer between reducing and oxidizing
agent with minimum of interaction. The coordination spheres do not suffer any modifications
to their compositions, only some changes of ligand-metal ion distances and solvation
interaction take place. The electron transfers by tunnelling and obeys the Franck-Condon
restriction. The electron moves faster (10-15 s), while nuclei remain „frozen” in their actual
positions, the time of their movement being much longer (10-13 s).
Taking into account the outer-sphere mechanism and self-exchange reactions (with no
chemical transformation) Rudolph A. Marcus (Nobel prize 1992) introduced and developed a
theoretical model to calculate rate constants for the electron-transfer8,10. Numerous inorganic
reactions proved to obey this model13-16. The extention of this to organic reactions led to
3

4
further elaboration of the theory by many other authors18-21. Some research has been done also
on mixed inorganic-organic systems; a work to which we have contributed confirms the
applicability of Marcus theory in the case of the oxidation of N,N,N’,N’-tetramethyl-p-
phenylendiammine (TMPPD) with Fe(CN)63-, MnO4
-, Co(NH3)63+and Ru(OH)3+.27
Inner-sphere mechanisms, on the contrary, necessitate an intimate interaction
between the coordination spheres of the reactants by linking them together in a complex
having at least one ligand in common. This should precede the electron-transfer in a
substitution process. The electron is transferred through this ligand having a role of a bridge.
These mechanisms have three steps: a) formation of the complex with a common ligand as a
bridge, b) electron-transfer c) dissociation of the complex into the reaction products28.
Although, in principle, any of these steps might control the rate, in most situations the
electron transfer occurs as the rate-determining step1,2,29.
Transfer of the common ligand from the oxidizing species to the oxidized form of the
reducing agent is a solid argument for the inner-sphere mechanism37. A modification of the
rate by changing the ligand having the role of bridge is another support of such a mechanism.
On the contrary, the lack of such influence argues for an outer-sphere mechanism.
Generally, systems which are inert to substitution will react by an outer-sphere
pathway. For systems labile to substitution, a redox rate which is comparable to the
substitution rate indicates an inner-sphere interaction. More information on the way the
electron transfer takes place is brought about by the activation parameters. A small activation
enthalpy supports an outer-sphere mechanism.
I.3. OXIDATION OR REDUCTION OF THE COORDINATED LIGAND
Numerous studies have been seen where the species oxidized by the metal ions is an
organic or inorganic substrate, brought as ligand into the first coordination sphere.40-43 The
inner-sphere complex (ML, M = metal, L = ligand) so formed decomposes to give the redox
products. Alternatively, ML may decay via a competing route. This second case implies
considerably different structures for ML and the activated complex of the redox process.
The occurrence of ML species can be actually detected, or only implied by the
experimental form of the rate law. Examples of ligand oxidation are found in reactions of
various oxidants, such as CeIV, FeIII, MnIII, CoIII, VV, CrVI, AgII or CuII.
Fewer cases are encountered where the ligand is reduced. Complexes with molecular
oxygen or peroxocomplexes44 can serve as examples.

5
I.4. EVIDENCE OF THE INVOLVEMENT OF AN INTERMEDIATE
When the rate law suggests the involvement of an intermediate, the most direct
evidence in found in measurements of its physico-chemical properties. This approach requires
the existence of an experimental technique for its detection. Often, it is necessary that the
intermediate is formed in quite high concentration (comparable to those of the reactants in the
case of a rapid pre-equilibrium). Depending on the life-time of the intermediate, the detection
may use classical techniques or some arrangements designed for rapid reactions. Two
techniques that were employed in our present studies are spectrophotometry and ESR
spectrometry.45,46
Proof that no intermediate exists
With the large difference between electronic spectra (UV-VIS) of reactants and
products, the successive recordings of spectra during the reaction can bring information on the
involvement of intermediate. The appearance of isosbestic points is a proof there is a linear
correlation47,48 of the concentrations of the species, meaning that the reactant is transformed
directly into the product and no intermediate is present. If is not the case, or this appears only
within a short period at the beginning of the reaction, and the intersection position is changed,
it indicates that some intermediate of significant concentration is formed
I.5. CATALYSIS IN REDOX REACTIONS
Catalysis by another redox couple This phenomenon occurs when a redox couple can mediate uni-equivqlent or bi-
equivalent electron transfer. An example is the oxidation of Cr(III) to Cr(VI) by S2O82−,
which is catalyzed by Ag(I). The latter is able to form Ag(III) with the bi-equivalent
peroxydisulfate. This, then forms Ag(II) in a reaction with Ag(I). Ag(II) will react uni-
equivalently with Cr(III), or another intermediate species of Cr, to finally form Cr(VI).
Numerous oxidations of organic compounds are catalyzed by redox couples. Such
examples are OsO4 catalysis via the formation of double bridged intermediates57-59 or Ce(IV)
catalysis via Ce(III) intermediates60.
The couple Cu2+/Cu+ exerts a catalytic effect on many redox systems54-56. Cu(II)
easily accepts an electron to form Cu+, which is quite an unstable species in solution and is
rapidly oxidized by any oxidizing agent. This way, the switch helps the progress of the main
redox reaction. Sometimes, this intervention is undesirable because the copper ion is one of
the most commonly occurring impurities in chemicals, and may cause irreproducible results,
which in turn make the interpretation of kinetic data difficult.

II. CHARACTERIZATION OF REACTING SYSTEMS UNDERTAKEN
IN THIS WORK
II.1. THIOLS
Thio-compounds are organic substances containing sulphur and are present in nature,
especially in living organisms. The thiols – or mercaptans – have at least one -SH group
bound to a carbon atom, similar to the hydroxyl group in alcohols.
The oxidation of thiols
Due to the similarity to the hydroxyl group, often the reactions of these two classes of
organic compounds are compared. When oxidation is considered, there is no similarity. In the
case of alcohols, the atom changing its oxidation state is the carbon atom containing hydroxyl
group65-70. On the contrary, thiols are oxidized at the thiol group73-81. Moreover, hydroxyl
containing compounds are bi-equivalent reducing agents whereas – at a mild oxidation –
thiols are one-equivalent reducing agents.
The oxidation of thiols takes place depending on the reaction conditions and the nature
of oxidizing agent. The possible oxidation states are presented in figure II.1.2.
R S S Rdisulfide
R SHthiol
R S OHsulfenic acid
R S OH
O
sulfinic acid
R SO3H sulfonicacid
R S S R
O
O
O
Odisulfone
R S S R
O
Othiosulfone
Figure II.1.2. Thio-compounds in various oxidation steps.
With strong oxidants, the very stable sulfonic acids are the ultimate species.
In the case of mild oxidation disulfides or sulfenic acids are the reaction products.
Sulfenic acids are instable compounds and are oxidized further. Disulfides are quite stable,
and, as a rule, are the final products under mild oxidation. They are formed by combination of
thiyl radicals (RS•), through cleaving of the S–H bond. The disulfide formation can be
bypassed if a more rapid reaction can take place. The free radicals pathway is the most
frequently encountered paths to yield disulfide.
6

The studied thio-compounds
The structures of the three compounds investigated in this work, all are presented in
figure II.1.3. All three of them are mono-thiols, but with otherwise quite different structures,
which expectedly should reflect in their properties.
a. benzylmercaptan
(α-toluene thiol) b. thiolactic acid
(2-mercaptopropionic acid) c. glutathione
(γ-glutamilcysteinylglycine)
Figura II.1.3. Structural formulas of the used thiols.
II.2. CHROMIUM (VI)
Like any other transitional metal, chromium displays multiple oxidation states. In
aqueous solutions, the possible oxidation states are +6, +5, +4, +3 and +2. The +2 state is
unstable and aggressively reducing. The +6 state, the highest for chromium, gives solutions
with oxidizing properties. The unstable states +5 and +4 are also oxidizing by nature. The +3
state, in turn, is particularly stable for chromium, in air and aqueous solutions (acidic mostly)
unlike for the other elements of its group. This makes Cr(III) both the product of Cr(II)
oxidation and of Cr(VI) reduction, the latter taking place often in more steps, through
formation of Cr(V) and/or Cr(IV).
Whatever the oxidation state, chromium forms coordinative complexes in aqueous
solutions. Cr(III) has very good complexating properties; its complexes are hexa-coordinated,
with octahedral geometry, the only generally inert to substitution chromium complexes. Those
of Cr(II) are fewer, usually hexa-coordinated as well, weak and very labile to substitution; the
replacement of the water ligand in the corresponding hexahydrate has rates close to the
diffusion limit.100 Cr(VI) is known to form tetrahedral anionic species, labile to substitution,
which is why it reacts by inner sphere mechanisms. The instability of the electronic
configurations of Cr(V) and Cr(IV) introduces some difficulties in studying their properties in
general. Their complexes are also labile to substitution. For a long time those of Cr(V) were
considered to be exclusively tetra-coordinated65 and those of Cr(IV) hexa-coordinated,
justifying in this way that the rate determining role was usually attributed to the formation of
a Cr(IV) state in multi-step mechanisms, as this is requiring the most structural changes. More
7

recent studies, many by ESR spectroscopy, have brought proof of penta- of even hexa-
coordinated structures of some Cr(V) complexes140,155,302b. Some penta-coordinated102 or even
hepta-coordinated104b complexes of Cr(IV) with chelating ligands have also been prepared,
thus opening the possibility for new structural interpretations of the species in solutions
too102a,105d.
Equilibria in Cr(VI) solutions
Depending on the acidity and total chromium concentration, various species can be
found in aqueous solution, interconnected by equilibria99,108, the main of which are listed
below (eqs. 2.2.3.-2.2.7)
+− + HCrO24
−4HCrO K: 7.94·105 (M-1) 2.2.3
+− + HHCrO4 42CrOH K: 5.5·10-1 (M-1) 2.2.4
−4HCrO2 OHOCr 2
272 +− K: ≈ 158 (or 98)109 (M-1) 2.2.5
+− + HOCr 272
−72OHCr K: 1.41·10-1 (M-1) 2.2.6
+− + HOHCr 72 722 OCrH K: very small 2.2.7 Computations based on these have rendered HCrO4
- as the major species in weak
acidic solutions (pH 1÷5) of chromium concentration lower than 10-4 M 48.
Following the model of reaction 2.2.5, similar condensation processes involve species able to
provide hydrogen ions108,109,110b (eq. 2.2.8).
−+− ++ XHHCrO4 OHXCrO 23 +− 2.2.8
Such species could be acids used as medium for the reaction or the substrate itself. It
often means that a first condensation with the acid in the medium takes place, creating a new
species, which in turn will act as the oxidant for the substrate. The reactivity of the new form
of the oxidant may vary appreciably from that of the HCrO4-. Perchloric acid in diluted
solutions is considered amongst the most inert acids to such condensation, the reason for it
being chosen as medium for many reactions, including those approached in this work.
Oxidations with chromium(VI)
Mechanistically, Cr(VI) oxidations proceed by inner-sphere. With an appropriate
partner, the first step is an equilibrium of the type in 2.2.856,67,69,76,111,115,156,176-181. The
condensation complex formed further decomposes by transfer of electron(s). Most times, the
redox step is rate determining. Cr(VI) accepts a total of three electrons in order to reduce to
8

Cr(III), that can transfer simultaneously or through various combinations of steps, passing
through one or another unstable oxidation states. Such possibilities are illustrated in figure
II.2.3.
The three-electron transfers are rare (one example is the reaction with sulphite ion);
amongst the organic substrates they indicate co-oxidations144, since no functional groups are
able to provide all three electrons.
1 2 3 4 5 6
Cr (VI)
Cr(V)
Cr(IV)
Cr(III)
Cr(II)
Figura II.2.3. Possible reaction routes for the reduction of Cr(VI)
The path of choice is the result of a compromise between the tendency of chromium to
accept two electrons simultaneously and the substrate capacity of providing these electrons.
When the tendencies match, as is the case for hydroxy-compounds, the bi-electronic route
with Cr(IV) formation will be chosen. With thiols, on the other hand, that are one-electron
reducing agents, the route via Cr(V) becomes of comparable importance176-181. Often, the two
routes coexist. Once formed, the Cr(V) or Cr(IV) intermediates open new reaction paths for
the substrate oxidation. These allude to the substantial complexity of oxidations by
chromium(VI).
II.3. VANADIUM (V)
The chemistry of aqueous solutions of vanadium(V)185,186
The many species of vanadium (V) involved in just as many equilibria in aqueous
solutions, are illustrated, but not exhausted, in the figure below. As can be seen, depending on
the total vanadium concentration and on pH, the species acting as oxidant for a given
substrate may vary significantly.
Also, factors such as temperature or ionic strength may affect the equilibria. This
makes kinetic studies difficult, if only, from the perspective that one could hardly find a large
9

enough range of conditions – a condition for a reliable kinetic study – over which to extend
the study and at the same time, with reasonable approximation, deal with the same oxidant.
Figure II.3.1. Vanadium (V) species in aqueous solutions, as function of total vanadium concentration and pH of solution186.
Oxidations by vanadium (V) of organic substances
Some of the features generally accepted217 for the oxidations of organic substrates
with vanadium (V), in the form VO2+, in acidic aqueous media, are inner-sphere mechanisms,
mostly via 1:1 (sometimes also 1:2 or 2:1) V(V):substrate complex intermediates, and
vanadium (IV) as a product. Still, bi-electronic reductions of V(V) to V(III) are often
presumed, but further re-oxidation of V(III) is assumed, at the expense of another V(V). This
is, nevertheless, more difficult to support when the reducing substrate is taken in excess.
With the decavanadate ion (HV10O285+), it was proposed that one unit at a time is
displaced and reduced, rate determining being the fragmentation of the polyvanadate
unit214,215.
Lately, vanadium is studied in connection with biological thio-compounds, such as
glutathione218,219. Attention is paid to the quite stable V(IV) complexes resulting from V(V)
reduction by such thiols. Since V(IV) is isoelectronic with Cr(V), some structural similarities
of their complexes is assumed, thus allowing the gain of further insight on the carcinogenic
Cr(V) structure and behaviour.
10

II.4. HEXACYANOFERRATE (III)
Ferri- and ferro-cyanic complexes
Of the many oxidation states possible for iron, only the very usual +2 and +3 states
form hexacyanoferric complexes, extremely stable species, inert to ligand substitution.
The hexacyanoferrate (III) ion (FeIII(CN)63-) also known as ferricyanide, is the completely de-
protonated anion of ferricyanic acid (H3Fe(CN)6), a strong acid in all its dissociation steps221.
H3Fe(CN)6 H2[Fe(CN)6]- + H+ K1 = 1,78·106 M 2.4.1 H2[Fe(CN)6]- H[Fe(CN)6]2- + H+ K2 = 1,70·103 M 2.4.2 H[Fe(CN)6]2- Fe(CN)6
3- + H+ K3 = 3,98 M 2.4.3
Thus, on a large pH range, the completely dissociated form is the only one present in solution.
Similarly, hexacyanoferrate (II) ion (FeII(CN)64-) also known as ferrocyanide, is the
completely de-protonated form of the ferrocyanic acid (H4Fe(CN)6), which is also strong in its
first and second dissociation steps, but weaker in its last two227:
H4Fe(CN)6 H3[Fe(CN)6]- + H+ K1' = 3,47·102 M 2.4.4
H3[Fe(CN)6]- H2[Fe(CN)6]2- + H+ K2
' = 1,20 M 2.4.5 H2[Fe(CN)6]2- H[Fe(CN)6]3- + H+ K3
' = 2,24·10-3 M 2.4.6 H[Fe(CN)6]3- Fe(CN)6
4- + H+ K4' = 6,46·10-5 M 2.4.7
Therefore, Fe(CN)6
4- is protonated easier than Fe(CN)63- in media of the same acidity.
Oxidations with hexacyanoferrate (III)
Since the electron transfer in the hexacyanoferrate complexes takes place between the
metallic centres, the redox couple [Fe(CN)6]3-/[Fe(CN)6]4- is a monoelectronic system. It is
also very stable, due to the fact that both complex ions are inert to ligand substitution. That, in
turn, means that almost without exception the oxidations with hexacyanoferrate(III) proceed
by outer-sphere mechanisms225. A rate constant of 5,54·104 M-1s-1 has been determined for the
electron transfer.
Fe(CN)63- + e- Fe(CN)6
4- 2.4.11
On the other hand, since H+ ions are not involved in the redox equation, the standard
potential of the couple is independent on acidity233,234 over a large pH range (4÷13). Its 11
12
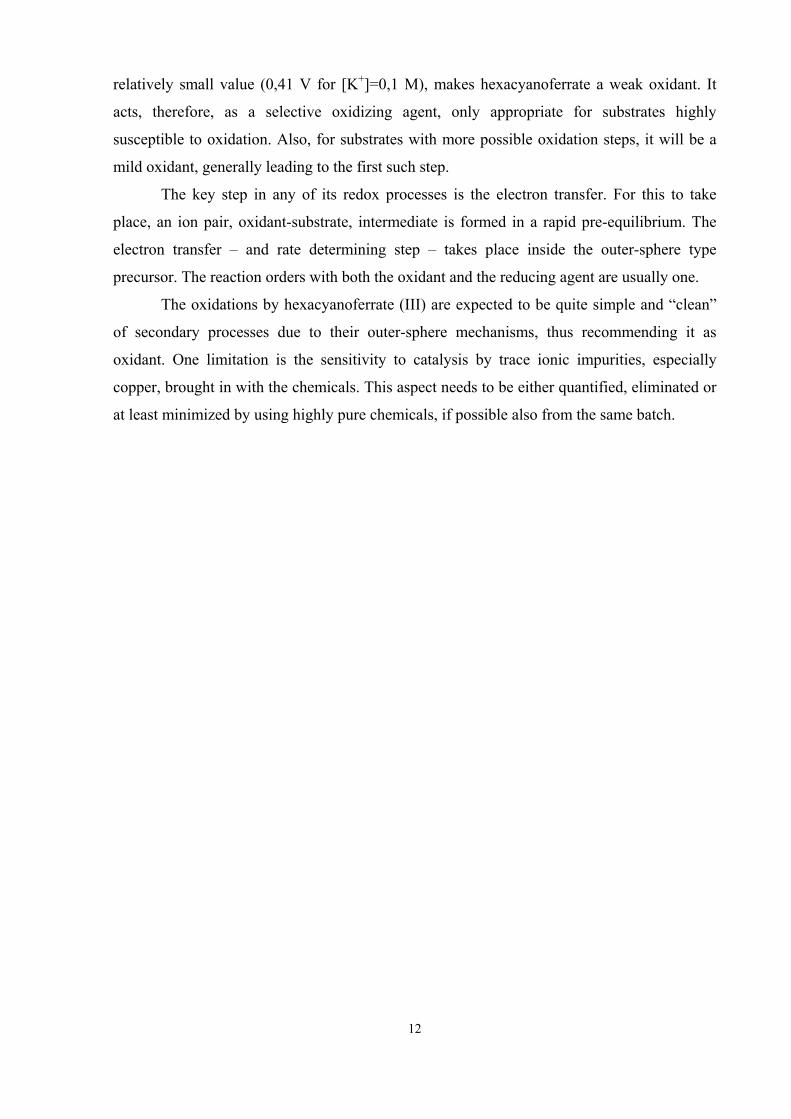
relatively small value (0,41 V for [K+]=0,1 M), makes hexacyanoferrate a weak oxidant. It
acts, therefore, as a selective oxidizing agent, only appropriate for substrates highly
susceptible to oxidation. Also, for substrates with more possible oxidation steps, it will be a
mild oxidant, generally leading to the first such step.
The key step in any of its redox processes is the electron transfer. For this to take
place, an ion pair, oxidant-substrate, intermediate is formed in a rapid pre-equilibrium. The
electron transfer – and rate determining step – takes place inside the outer-sphere type
precursor. The reaction orders with both the oxidant and the reducing agent are usually one.
The oxidations by hexacyanoferrate (III) are expected to be quite simple and “clean”
of secondary processes due to their outer-sphere mechanisms, thus recommending it as
oxidant. One limitation is the sensitivity to catalysis by trace ionic impurities, especially
copper, brought in with the chemicals. This aspect needs to be either quantified, eliminated or
at least minimized by using highly pure chemicals, if possible also from the same batch.

13
III ORIGINAL CONTRIBUTIONS
III.1. EXPERIMENTAL ASPECTS
In the large majority of the kinetic experiments of the thesis, the detection method was
spectrophotometry in the ultra violet and visible (UV-VIS) range. Additionally, a series of
experiments were conducted using electron spin resonance (ESR) spectroscopy.
In order to study processes of different time scales, different experimental setups were
applied, including static or flow methods, with the latter used both in the stopped and
continuous modes.
This chapter of the thesis describes the used apparatuses and the corresponding
methods of operation. Further, the experimentally obtained data is presented and analyzed.
III.2. THE OXIDATION OF THIOLACTIC ACID BY Cr(VI) IN ACIDIC MEDIA298
Taking into account the equilibria involving Cr(VI)99 species it is possible to chose
conditions of its concentration and acidity to have the HCrO4− species dominant in the
solution. UV-VIS spectral measurements established these conditions.
Introductory aspects
Preliminary observations
A rapid change of solution color, from yellow to red-brown, taking place during the
mixing of the two reactants acidic solutions, was seen, which pales as time elapses. This
suggests the formation of an intermediate species during the reaction process.
Stoichiometry
The spectrophotometric titration, where the remaining Cr(VI) color was measured
after the reaction has been accomplished in mixtures having increasing thiolactic acid (RSH)
to Cr(VI) molar ratios, showed almost zero absorbance at ratios greater than 3. At lower
ratios, the dependence showed no linear behavior because further oxidation to oxygenated
products might take place (Fig. III.2.2.). This is in agreement with other literature
data115,172,173,176,177,179,299

0 2 4 6 8 100.0
0.1
0.2
0.3
0.4
0.5
0.6
Stoichiometric ratio 3:1
N
Abs
orba
nce
/ a.u
.
[RSH]/[Cr(VI)]
Figure III.2.2. Results of spectrophotometric titration. ([RSH] increasing, [Cr(VI)]0 = 6.67·10-5 M, [H+] = 1·10-3 M (HClO4), μ = 0.5 M (NaClO4), T = 293 K)
To verify the 3 to 1 ratio, six reaction mixtures were allowed to complete the process
and then the excess thiol was titrated iodometrically. The mean of these experiments showed a
ratio of 3.09 ± 0.03 moles of thiolactic acid to react with 1 mole of Cr(VI). Therefore the
overall stoichiometry is (where the coordination shell of Cr(III) complex is not specified):
6 CH3CH(COOH)SH + 2 HCrVIO4- + 8 H+ 3 (CH3CH(COOH)S)2 + 2 CrIII + 8 H2O 3.2.1 ⎯→⎯
Electronic spectra. Evidence of an intermediate.
Electronic spectra of HCrO4−, thiolactic acid and a reaction mixture at various time
intervals are presented in figure III.2.3. It is observed that the mixture exhibits an absorption
band around 420 nm. The batochromic shift of the charge-transfer maximum from 350 in
HCrO4− to 420 nm in the mixture argues the change of an oxygen ligand of Cr(VI) with a
sulphur, and a condensed compound of esteric type, thiolato-chromate, is formed. This takes
place as shown in the following equilibria:
CH3CH(COOH)SH +HOCrO3
- CH3CH(COOH)SCrO3- + H2O 3.2.2
CH3CH(COOH)S-+ HOCrO3-+H+ CH3CH(COOH)SCrO3
- + H3O+ 3.2.3
The progress of the reaction can be followed at either 350 nm or 420 nm, yet neither
of these wavelengths corresponds to a single species.
14

-0.001
0.2
0.4
0.6
600300 400 500
Abs
orba
nce
/ a.u
.
wavelength / nm
1
2
3
4
5 7
6
Figure III.2.3. Comparative spectra of the reactants and reaction mixture.
1- [RSH] = 0.1 M; 2- [Cr(VI)]=7.22·10-5 M; 3÷7- reaction mixtures at some time intervals ([RSH] = 2.67·10-3 M, [Cr(VI)]0 = 6.67·10-5 M, [H+] = 3.16·10-3 M, μ =0.5 M, T = 293 K)
REACTION KINETICS
Experimental curves. Mechanistic model and mathematic approach
The reaction is quite rapid and reaches accomplishment within several minutes. Figure
III.2.4 presents examples of the absorbance evolution during time.
0
0.5
0.1
0.2
0.3
0.4
0 300100 200
Abs
orba
nce
/ a.u
.
Time / s
a
b
Figure III.2.4. (1) Experimental kinetic curves recorded at 350 nm and 420 mn a) 350 nm, b) 420 nm
([RSH] = 1.33·10-3 M, [Cr(VI)]0 = 6.67·10-5 M, [H+] = 3.16·10-2 M, μ =0.5 M, T = 293K.
The shape of the kinetic curve at 420 nm is a bi-phasic one, showing the presence of
two consecutive processes. Both the recordings at 350 nm and at 420 nm seem to follow an
exponential dependence, towards the end of the process. So, the mathematic model of the
system is given as:
R + S (+ H+) I (+ H+) k1, k-1 3.2.4
I (+ S) (+ H+) P (+ H+) k2 3.2.5
Under the excess concentration of substrate S, and also of that of hydrogen ion, which may
intervene in the process as catalyst, this simplifies greatly, to:
R I P 3.2.6 ⎯⎯→⎯ obsk1 ⎯⎯→⎯ obsk2
15

That is a sequence of two apparent first order reactions, which can easily be
manipulated. The integrated form of the absorbance evolution is:
tk
obsobs
PIobstk
obsobs
IobsPobsR
obsobs ekk
kRekkkkeRAA 21 })({][}{][
21
10
21
120
−−∞ −
ε−ε+
−ε−ε
+=− ll 3.2.8
where A and A∞ stand for actual and final absorbances, l is the path length of the cell and εR,
εI, and εP are the molar absorptivities of reactant R, intermediate I, and product P. A simpler
form (by grouping, next to an exponential term, all constants in one) can be obtained:
tktk obsobs eeAA 2121
−−∞ γ+γ=− 3.2.9
Data processing: Method A – linear regression. A classical approach of
manipulation of this equation in order to obtain rate constants is linearization. When the
condition k1obs > 5 k2obs is fulfilled300, at long times of the reaction, the first exponential term
vanishes (only the second step proceeds) and it is possible to determine k2obs and γ2 from a
linear logarithmic form.
tk obseAA 22
−∞ γ=− 3.2.10
For the beginning of the process, where the formation of intermediate prevails, another
equation can be derived:
( ) tkAA obs22lnln −γ=− ∞ 3.2.11
which in its linear form permits the determination of γ1 and k1obs .
( ) tkeAA obstk obs
112 lnln 2 −γ=γ−− −∞ 3.2.13
The handling of data has been done using Microsoft Excel, where simple linear
regressions were performed. At long times (after more than 90 % of reaction) the behavior is
linear with R2 between 0.9925 and 0.9990. The plots of equation 3.2.13 were also linear (R2 ∈
[0.9911÷0.9999]) at short time after mixing. Experimental kinetic curves at 350 nm and 420
nm led to comparable values, as shown in table III.2.1.
Some advantages and limitations of this method are discussed in detail in the thesis,
commenting on the selection of the time range to be employed for the curves to compute the
rate coefficients, as well as on the condition k1obs > 5 k2obs which is not fulfilled.
16

Table III.2.1. Mean values (3-5 individual runs) of k2obs and k1obs obtained under similar conditions at the two λ ([HCrO4
-] = 6.67 x 10⁻⁵ M, T = 293 K, μ = 0.5 M).
k2obs, med (s-1) k1obs, med (s-1) k1obs, med / k2obs, med k420 / k350 103⋅[RSH]
(M) 102⋅[H+]
(M) 350 nm
420 nm
350 nm
420 nm
350 nm
420 nm
k2obs,
med k1obs,
med
3.3 7.93 0.108 0.117 0.21 0.25 1.94 2.14 1.08 1.19
3.3 6.24 0.100 0.107 0.19 0.22 1.90 2.06 1.07 1.16
3.3 1.97 0.075 0.077 0.100 0.120 1.33 1.56 1.03 1.20
3.3 0.79 0.061 0.062 0.080 0.090 1.31 1.45 1.02 1.13
3.3 0.65 0.060 0.062 0.078 0.087 1.30 1.40 1.03 1.12
3.3 3.12 0.086 0.077 0.136 0.135 1.58 1.75 0.90 0.99
1.3 3.12 0.038 0.035 0.048 0.053 1.26 1.51 0.92 1.10
4.0 3.12 0.100 0.091 0.16 0.16 1.64 1.80 0.91 1.00
5.3 3.12 0.134 0.117 0.21 0.21 1.60 1.75 0.87 0.96
6.7 3.12 0.150 0.139 0.24 0.24 1.61 1.76 0.93 1.01 Obs. Estimated standard errors of the means are around 5% for k2obs and 5-6% for k1obs, if taking into account the propagation of errors for the individual runs, but, for k1obs, not taking into account the errors due to k2obs and γ2.
Data processing: Method B – non-linear regression. The un-manipulated
experimental curves were fitted with an equation which has a kinetic meaning, derived from
the supposed mathematical model. For this, equation 3.2.9 was written in the form below,
which satisfies the requirements of the software used.
0))((
2))((
10201 YeFeFY XXkXXk obsobs +⋅+⋅= +−+− 3.2.14
with )(0003335.021
2
21
11
obsobs
obsP
obsobs
obsIR kk
kkk
kF−⋅ε
+−⋅ε
−ε⋅= and )(0003335.021
12obsobs
PIobs kk
kF−ε−ε
⋅=
and where Y = A (absorbance), X = t (time), X0 = time delay at the start of data acquisition, Y0
= a correction factor for base line (the translation of the curve along the Y axis, including A∞),
0.0003335=[Cr(VI)]0⋅l , and k1obs, k2obs, εR, εI and εP all are as described above.
B1. Fiting single curves. The program TableCurve 2D 5.0 (Systat Software) has been
used. It operates by successive iterations varying the specified parameters in order to get the
best fit. Details of the initialization and the limitations are given in the thesis along with molar
absorbance coefficients and time delays. The results seem to be comparable to those of
method A, although method A appears to overestimate k1obs.
17

B2. Fitting groups of curves. The program Origin 8.0 (Origin Labs) has been
employed for fitting groups of individual runs using a nonlinear least squares method
(Levenberg-Marquardt). In these fits, certain parameters were required to be identical for all
curves, thus imposing global conditions on the fit. For example, in a set where the
concentration of one species was varied, and those of the other reactants together with the rest
of the experimental conditions were kept the same, the restraint that the value of the molar
absorptivity of the intermediate should be identical for all curves in the group, was used.
Figure III.2.6 presents a comparison of the fits and experimental points, showing a very good
superposition, particularly when the contribution of the end-part of the reaction to the curve
has been “equilibrated” by removing of the excess readings (points) in this region.
0 50 100 150 200 250
0.0
0.1
0.2
0.3 (a)
Abso
rban
ce /
a.u.
time / s
0 20 40 60 80 100 120
0.0
0.1
0.2
0.3 (b)
Abs
orba
nce
/ a.u
.
time / s
Figure III.2.6. “Global” fits by Origin 8.0 of a selection of curves by using all the points (a), or by elimination the final tail (b) (T=293K, μ.=0.5 M, [H+] = 0.0316 M; [RSH]= variable).
18
A comparison of the three methods of handling the data is presented in table III.2.5.
There are some differences between the methods, but the errors are of the same order of
magnitude between the two variants of fitting. The somewhat smaller errors of the method B2
are the result of the statistic n greatly enhanced by the use of the points of more curves. The
two fitting methods have the advantage that, by determining k1obs and k2obs simultaneously,
both of them rely on each other’s precision, thus improving mostly the results on k1obs.

Tabel III.2.5. Comparison of the mean values of k1obs and k2obs and their estimated errors (%), obtained by the three different methods (T = 293 K, [H+]0=3.12⋅10-2 M, [Cr(VI)]0=6.67⋅10-5 M)
Method A Method B1 Method B2 350 nm 420 nm 420 nm 420nm 103
[RSH] (M) k1obs
(s-1) *rel. error
(%) k1obs (s-1)
*rel. error (%)
k1obs (s-1)
rel. error (%)
k1obs (s-1)
rel. error (%)
1.3 0.048 10.9 0.053 12.3 0.051 7.8 0.038 3.2 2.7 0.120 4.3 0.110 4.5 0.086 6.8 0.071 3.5 3.3 0.136 5.6 0.135 5.7 0.104 6.3 0.092 3.8 4.0 0.164 4.4 0.164 6.5 0.130 6.9 0.113 4.1 5.3 0.213 4.8 0.205 4.9 0.182 7.3 0.163 4.8 6.7 0.241 5.7 0.244 6.9 0.216 6.5 0.202 5.1 8.0 - - 0.297 7.5 0.253 6.1 0.224 5.1
k2obs (s-1)
rel. error (%)
k2obs (s-1)
rel. error (%)
k2obs (s-1)
rel. error (%)
k2obs (s-1)
rel. error (%)
1.3 0.039 3.8 0.035 6.2 0.048 7.2 0.055 3.2 2.7 0.081 4.3 0.063 3.5 0.066 7.2 0.081 3.6 3.3 0.087 4.3 0.077 3.7 0.087 5.9 0.089 3.8 4.0 0.100 3.7 0.091 4.7 0.101 6.7 0.100 3.9 5.3 0.136 6.9 0.117 5.3 0.129 5.4 0.111 4.4 6.7 0.150 4.8 0.139 5.0 0.148 4.0 0.130 4.4 8.0 - - 0.150 5.4 0.177 4.8 0.149 4.2
* The errors of these rate coefficients do not contain the errors due to individual k2obs determination. With those, there should be less significant digits to some values (as given in other tables); the extra digit was here kept
solely for comparison purpose.
Although the values of the rate constants differ sometimes, the handling in the kinetic
interpretation leads to the same conclusions. Taking into consideration that there are fewer
restrictions with the method B1, it was chosen to present the data obtained this way.
Thus far it has been established that the process takes place by two distinct steps, the
first being the formation of a condensed intermediate that reacts further towards the products.
The apparent rate constants for the two processes are functions of the reaction conditions
(concentration, acidity, temperature and ionic strength).
Kinetics of the intermediate formation
As the concentration of organic substrate and acidity are in large excess, the rate
coefficient dimensions (s-1) correspond to first order in HCrO4−, which is the limiting reactant.
To find the reaction order of the excess reactants, the model implies that k1obs can be written
as , taking into account both directions of the equilibrium. bbaobs HkHRSHkk ][][][ 10011
+−
+ +=
19

Under thiolactic acid excess, the first term prevails. Making use of log – log plots, the
equation is
0011 ]lg[]lg[lglg +⋅+⋅+= HbRSHakk obs 3.2.19 and can be used to obtain partial orders with respect to RSH or H+. Therefore, at constant
acidity, the slope of the regression line gives the reaction order with respect to RSH, whose
excess was varied, and at constant excess of RSH and mineral acid varied, the order with
respect to H+. The combined figure III.2.7-8 illustrates those dependences.
2.0 2.5 3.0
0.6
0.8
1.0
1.2
1.4
1.6
- lg(
k 1obs
)
- lg([RSH]0)
a = 1.033R2 = 0.9833
1.0 1.5 2.0 2.5 3.0
0.8
1.0
1.2
1.4
1.6
- lg(
k 1obs
)
- lg([H+]0) Figure III.2.7-8. Log – log plots to determine partial orders with respect to RSH and H+.
The illustrated dependencies show a linear behavior on [RSH] with an integer 1.0
order, and a curve on [H+]. At low acid concentration, the order with respect to hydrogen ion
is near zero and increases as the concentration of the mineral acid is raised. This behavior
appears systematic within all experimental conditions employed (various excesses of RSH
and various temperatures). The reaction order in H+ is fractional between zero and one, with
an increasing trend as the acidity is increased. From a mechanistic point of view, this can be
interpreted by the intervention of two concurrent reaction paths, one of zero order, and the
other of first order in H+, their relative importance being modulated by the range of acid
concentration. The conclusion to be drawn from these facts and the micro-reversibility
principle is that, the apparent first-order rate constant can be written as:
( ) ( )][]][[][ 1101
011
+−
+− +++= HkRSHHkkRSHkk HH
obs 3.2.20
Because these results were based on k1obs obtained with relative large errors, they were
verified by measurements with a technique for fast reactions. The kinetic curves recorded at
20

350 nm and extrapolated to zero time yield the initial rate expressed by the variation of
absorbance with time:
dba
Rnm VICrHRSHk
dtdA
dtVICrdr 0001
350350 )]([][][1)]([ +=
⋅−=−=
lε 3.2.21
By using various excesses of RSH and HClO4, as well as several Cr(VI)
concentrations (always as the limiting reactant), the following reaction orders were obtained
from the double logarithmic plots of log r0 as a function of log(concentration of varied
species):
HCrO4− : 1.1 ± 0.1; RSH: 1.02 ± 0.06 ; H+: 0.68 ± 0.06
These results confirm the previous ones from the classical method of separation of the process
into a sequence of two steps.
In order to evaluate the values of the rate constants the data under static conditions
were analyzed. By plotting k1obs as a function of excess thiol at constant acidity and as a
function of acidity at constant thiol concentration the following figures were obtained:
0,000 0,003 0,006 0,009 0,0120,0
0,1
0,2
0,3
slope intercept 30.7 ± 0.8 0.012 ± 0.004 18.2 ± 0.6 0.014 ± 0.003 17.8 ± 0.2 0.0065 ± 0.0009
[H+] = 0.0312 M [H+] = 0.0098 M [H+] = 0.0031 M
k 1obs
/ s-1
[RSH] / M
0.00 0.02 0.04 0.06 0.08 0.10 0.12
0.0
0.1
0.2
0.3
slope intercept 2.39 ± 0.09 0.089 ± 0.004 1.53 ± 0.06 0.072 ± 0.003 0.91 ± 0.02 0.035 ± 0.001
[RSH] = 0.0050 M [RSH] = 0.0033 M [RSH] = 0.0017 M
k 1obs
/ s-1
[H+] / M
Figure III.2.10. Linear dependence on RSH with the slope k1
0+k1H[H+] (M-1 s-1)
Figure III.2.11. Linear plots of k1obs as a function of [H+] with the slope k-1
H+k1H[RSH] (M-1 s-1)
The intercepts in figure III.2.10 are slightly positive (statistically different from zero)
but affected by large errors. Theoretically, they might represent the
contribution to the apparent first-order rate constant. The slope is the
(M-1s-1) term in k1obs. From these slopes rates of k10 = (15±2) M-1s-1 and k1
H=
(5±1)⋅102 M-2s-1 were obtained for the formation of the intermediate in the path involving
hydrogen ion. From the graph in figure III.2.11, with the intercepts differing from zero, it is
01−k
01k
][1+
−+ Hk H
][1++ Hk H
21

obvious that there is a term having zero-order with respect to H+ and another having first
order in it. The same feature was observed under other different conditions. The linear
regression parameters yield values of k10 = 16±3 M-1s-1 and k1
H= (4.4±0.4)⋅102 M-2s-1, in fairly
good agreement with those obtained from the thiolactic acid concentration effect.
Kinetics of the electron transfer step (decay of the intermediate)
In order to determine reaction orders with respect to the reactive species, the apparent
first-order rate constants k2obs were used as dependent on the excess concentration of
thiolactic acid or hydrogen ion concentration. Graphs of the type exemplified below were
obtained under various conditions.
2.0 2.5 3.0
0.6
0.8
1.0
1.2
1.4
- lg(
k 2obs
)
- lg([RSH]0)
a' = 0.7601R2 = 0.9686
[H+] = 0.0312 M
1.0 1.5 2.0 2.5 3.0
0.6
0.8
1.0
1.2
1.4
- lg(
k 2obs
)
- lg([H+]0)
[RSH] = 0.005 M
Figure III.2.12. Log-log plots to determine partial orders with respect to RSH and H+
In the case of the organic substrate, the graphs were linear to a good approximation
and a fractional order between zero and one was obtained in all cases. This observation can
be interpreted as the concurrence of two processes, one of zero and the other of first order in
RSH. From a mechanistic point of view this could be considered as a monomolecular
decomposition of the intermediate, to form Cr(V) and a thiyl free radical RS•, along with a
bimolecular process involving the complex and a new thiol molecule yielding the disulfide
and Cr(IV) in an bi-equivalent electron transfer. On the other hand, the fractional order can
be viewed as an expression of the one-plus form301, k2obs = α[RSH]/(1+β[RSH]), as suggested
by the presence of the pre-equilibrium of intermediate formation. This hypothesis is going to
be tested in the following.
In the case of the involvement of hydrogen ions, once again there is a fractional order
of less than 1, increasing with rising acidity, as in the case of formation of the intermediate
RSCrO3−. These facts can be interpreted with two concurrent paths or by a one-plus
dependence. 22

][1
][])[( 2022 RSH
RSHHkkk Hobs β
α+
+= + 3.2.22; ][][1
]][[2 +
+
++=
HRSHRSHHk obs γβ
α 3.2.22’
The second form stipulates a decreasing effect of H+ which was not found experimentally.
The first form implies two parallel processes, meaning that a plot of k2obs as a function of the
acidity should yield a line with some positive intercept. It is so, as figure III.2.13 clearly
demonstrates.
0,00 0,02 0,04 0,06 0,08 0,100,0
0,1
0,2
slope intercept 1.32 ± 0.05 0.063 ± 0.002 1.30 ± 0.03 0.046 ± 0.001 0.81 ± 0.02 0.031 ± 0.001
[RSH] = 0.0050 M [RSH] = 0.0033 M [RSH] = 0.0017 M
k 2obs
/ s-1
[H+] / M
Figure III.2.13 Linear dependence of k2obs on [H+]
The accepted form of eq.3.2.22 stipulates that the slope and intercepts are:
Slope=][1
][][2 RSHRSHHk H
βα+
+ 3.2.23; Intercept=][1
][02 RSH
RSHkβ
α+
3.2.23’
On the other hand, for the dependence of k2obs on the organic substrate, equation 3.2.22
predicts a curved shape with the gradient diminishing as thiol concentration is increased. Such
behavior was obtained, as it is seen in figure III.2.14. Also, lines of declining slopes were
obtained when plotting the intercepts and the slopes in figure III.2.13 against the
concentration of thiolactic acid, thus strengthening the belief in the truthfulness of this rate
equation.
0,000 0,003 0,006 0,009 0,0120,0
0,1
0,2 [H+] = 0.0312 M [H+] = 0.0098 M [H+] = 0.0031 M
k 2obs
/ s-1
[RSH] / M
Figure III.2.14. Dependence of k2obs on
thiolactic acid concentration
23

24
The increase of ionic strength showed no effect on the reaction of thioester complex
formation while it diminishes the rate of its consumption. This is in agreement with the
involvement of a neutral molecule in building of the intermediate, and some interaction of
particles with opposite charges in its decomposition by a redox process.
Determination of activation energies
Because of the complexity of the system, only experimental activation energies could
be determined from the dependence of either k1obs or k2obs with temperature. Seven
temperatures, between 280 and 315 K were used at five perchloric acid concentrations. Nice
Arrhenius plots were obtained with R2 between 0.990 and 0.997. The results are given in table
III.2.6.
Table III.2.6. Experimental activation energies (each figure has an error less than 2%)
Ea (kJ/mol) 102⋅[H+] (M)
Intermediate formation Electron transfer step
5.0 33.5 34.1
3.2 35.6 36.4
2.0 34.6 35.3
1.0 34.9 35.2
0.63 33.5 33.9
0.31 33.5 33.6
Mean: 34 ± 2 35 ± 3
Involvement of other intermediates
Because of the complexity of the system, some non-kinetic information was
necessary. The literature brings proof of the implication of thiyl radicals in the majority of
thiol oxidation reactions. Therefore we used the system to initiate the polymerization of
methyl methacrylate. An increase in temperature of 1- 1.2 ºC was measured in a small
calorimeter containing the reaction mixture and methyl methacrylate. At the end of the
process, some polymer was isolated.
ESR spectra were also recorded in order to identify paramagnetic species, such as
Cr(V) and thiyl radicals. The obtained results were compared to g values given in the
literature. Working in a flow system, with [Cr(VI)]0 = 2.5⋅10-3 M and [RSH]0 = 1.5⋅10-2 M,
the spectra presented in figure III.2.18 were obtained.

3340 3360 3380 3400 3420
**
g=2,002
g=1,988
g=1,985
ES
R s
igna
l int
ensi
ty /
a.u.
magnetic field / G
*
Figure III.2.18. Paramagnetic intermediates Cr(V) (red) and organic radical (blue). Signals marked with * are 53Cr satellites of the principal signal at g = 1.985, with the last of the four expected lines overlapping
with the signal of the organic radical at g = 2.002.
The species were assigned based on their g values: g = 1.985 and g = 1.988 were
specific to oxo-complexes of Cr(V), and values g = 2.002 to an organic radical. It should be
noted that the two parts of the spectrum shown in figure III.2.18 were recorded using different
amplification settings of the ESR spectrometer.
In a stopped flow variant, at g = 1.985 and g = 2.002 kinetic curves were recorded
taking the normalized intensity of the signals, as presented in figure III.2.19. Further
discussion of the ESR results is given in the thesis.
0 25 50
-0.2
0.0
0.2
0.4
0.6
0.8
1.0
75
[RSH]0=1,5x10⁻² M
[Cr(VI)]0=2,5x10⁻³ M
Cr(V) organic radical
Nor
mal
ized
ES
R s
igna
l / a
.u.
Time / s
Figure III.2.19. Time evolution of the relative intensity of the signal for Cr(V) and the mixed one involving the organic free radical.
A surprising observation is that Cr(V) is not an extremely active species, its lifetime
is rather long, in contrast to the majority of literature beliefs.
25

Discussions. Mechanism of the process
Based on the kinetic and extra-kinetic results presented, the following network of reactions is
most probable:
RSH + HOCrO3− RSCrO3
− + H2O , Kf 3.2.25 01
0,1 kk −
RSH + HOCrO3− + H+ RSCrO3
− + H3O+ , Kf 3.2.26 H1
H,1 kk −
RSCrO3−+ RSH Cr(IV) + RSSR k21 3.2.29
RSCrO3−+ RSH + H+ Cr(IV) + RSSR k22 3.2.30
No precise affirmation can be made on the successive steps or rate-determining ones.
To get the correct stoichiometry, Cr(IV) species should react further to form final products
and generate Cr(V). The processes are characterized by higher rate constants and take place as
fast as the corresponding intermediate species are formed, with the exception of the last one.
Cr(IV) + RSH Cr(III) + RS• 3.2.31
Cr(IV) + Cr(VI) 2 Cr(V) 3.2.32
Cr(V) + 2 RSH RSSR + Cr (III) 3.2.33
An alternative, kinetically indistinct, with the rate determining steps as one-equivalent
electron transfer and the formation of Cr(V) and a disulfide ion radical, is:
RSCrO3− + RSH Cr(V) +RSSR−• k21’ 3.2.34
RSCrO3− + RSH + H+ Cr(V) +RSSR−• k22’ 3.2.35
The disulfide radical anion is a species with an electron in the anti-bonding S-S link,
evidenced by β rays bombardment of thiol solutions184 and is much more stable as compared
to the thiyl radical, as determined in this work using MO calculations. The formation
enthalpies are -254.3 kcal/mol for RSSR−• and -64.19 kcal/mol for RS•.
The rate law deduced from each of the two variants of the mechanism is:
][][1
][][][
][1][][
4
222
4
2214 −
+−
−
++
+=− HCrO
RSHKHRSHKk
HCrORSHK
RSHKkdt
HCrOdf
f
f
f 3.2.40
in perfect agreement with the experimental one. Recall, that a first order with respect to
thioester has been found, which contains one substrate molecule. Therefore the actual order
with thiolactic acid is a fractional one, between 1 and 2. Taking into account the extra-kinetic
26

proofs of the presence of free radicals, the stoichiometry and the Cr(V) implication, there
should be sufficient arguments in favour of this mechanism.
III.3. THE OXIDATION OF THIOLACTIC ACID BY VANADIUM (V) IN ACIDIC
MEDIUM303
The difficulties arising in oxidation with V(V) owe to the existence of numerous
hydrolytic and acid-base equilibria involving this valence state, depending strongly on the
solution pH and on the V(V) concentration. Monomer species like
, and 434224
34 VOH,VOH,HVO,VO −−− +
2VO
102VH,
as well as iso-polyvanadates such as
are involved92-98. The decomposition and
dissociation of decavanadate have been studied by spectrophotometrical means in basic99.100,
neutral and weakly basic101 or acidic solutions102.103, even from the kinetic point of view.
−− 428
52810 OOHV−−−− 6
28104124
393
272 ,OV,OV,OV,OV
The purpose of this approach was to study the oxidation of thiolactic acid under
conditions where the main species is decavanadate and vanadyl ion, respectively, and search
for some reaction intermediates. Classic spectrophotometry was employed when the oxidant
was HV10O285- as it shows an intense yellow color185. Alternatively, stopped-flow
measurements were performed, when comparable concentrations of VO2+ and thiolactic acid
were used, but under the excess of H+ ion.
Preliminary investigations
The stoichiometry of the reaction has been considered 2 CH3CH(SH)COOH : 1 V(V),
as Pickering and McAuley216 determined for the oxidation of mercaptosuccinic acid. The
products were disulphide and V(III) and this was confirmed by a spectrophotometrical
titration.
To establish a wavelength at which the process can be monitored, spectra of HV10O285-
and VO2+ at a concentration of 2.22⋅10−4 M expressed as monomer and thiolactic acid of
1.11⋅10−2 M were compared. An important difference has been noticed at 340 nm. The
monomeric species VO2+ reacts very rapidly, and require a method for fast reactions. On the
other hand, the oxidation by decavanadate proceeds slowly an can be monitored by classical
spectrophotometry.298c,d
27

The oxidation by decavanadate
Under the condition of a large excess of thiolactic acid (RSH) the evolution of the
absorbance presents an exponential shape, as shown in figure III.3.2. It should be mentioned
that, at the acidity employed in the measurements, acid hydrolysis of decavanadate takes place
along with the oxidation process. This is also shown in figure III.3.2. As seen, the hydrolysis
proceeds slower as compared to the oxidation. The acid hydrolysis obeys a first-order
dependence on the concentration of the coloured species (decavanadate).
0
0.9
0.2
0.4
0.6
0.8
0 300100 200
Abso
rban
ce /
a.u.
Time / s
b
a
Figure III.3.2. Time-dependence of the absorbance for the acid hydrolysis (a) and combined redox + hydrolysis (b). Conditions: [HV10O28
5-] = 2.22⋅10-5 M, [RSH] = 2.22⋅10-2 M , HClO4 = 7.98⋅10-2 M and μ = 0.5 M at T = 293 K.
The corresponding semi-logarithmic plots were linear to more than 90 % of reaction.
tkAAAA obsh−−=− ∞∞ )ln()ln( 0 3.3.1
Here, A, A0 and A∞ stand for absorbance at the time t, at the beginning and at the end of the
process, respectively, and for the observed first-order rate constant of hydrolysis. This is
in agreement with the data obtained by Clare and co-workers195. The same type of linear
equation has been used for the overall hydrolysis and reduction by RSH process. It should be
mentioned that the linear parts of such plots were only so for, at most, 1 unit of natural
logarithm (about 25 % of the reaction). Within this range of V(V) conversion the correlation
coefficients were in the range of 0.999 - 0.9999. The reason for such a behavior is seen in a
higher reactivity towards reduction of the smaller poly-oxovanadates or monomeric forms.
Both hydrolysis and redox processes release fragments of higher reactivity, resulting an
increase of the reaction rate. This work shows that the VO2+ ion reacts quite rapidly. Its low
concentration leads to the conclusion that it does not contribute significantly to the solution
absorbance. By using the early part of the reaction it can be expected that the decavanadate
obshk
28

species is the one involved. The fact that the V(V) consumption by both hydrolysis
and reduction by thiolactic acid proceeds faster that the hydrolysis itself indicates that also
polymeric vanadates accept electrons, and thus not only the monomeric V(V) species,
generated by the hydrolysis. Because the oxidation and hydrolysis take place simultaneously
and both obey first-order kinetics, one can distinguish them by making the differences
between the apparent first-order rate constants of the overall process and the hydrolysis.
−52810OHV
kr obs = kobs - kh obs 3.3.5
kobs represents the first-order rate constant for redox process only. A combined table of III.3.1
and III.3.2 of the thesis contains the obtained values of the first-order rate constants under
several experimental conditions.
Table III.3.1 and III.3.2 First order rate constants for overall process, hydrolysis and redox at various
excesses of thiolactic acid and various perchloric acid concentration at ionic strength μ = 0.5 M, T = 293 K, [HV10O28
5-] = 2.22⋅10-5 M-1 (2.22⋅10-4 M-1 in V(V)total). The values in the table are means of 3 to 4 kinetic runs.
102[HClO4] (M)
102[RSH] (M)
103 kobs (s-1)
103 kh obs (s-1)
103 kr obs (s-1)
1.00 - - 0.475 - 1.59 - - 0.854 - 2.51 - - 1.42 - 3.16 - - 1.80 - 5.01 - - 3.06 - 7.94 - - 5.04 - 10.00 - - 6.63 - 1.59 2.22 12.23 11.38 2.51 2.22 8.55 7.13 3.16 2.22 7.96 6.16 5.01 2.22 6.50 3.44 7.94 2.22 7.70 2.66 10.00 2.22 9.17 2.54 3.16 0.556 2.80 0.997 3.16 1.11 4.43 2.63 3.16 3.33 12.23 10.42 3.16 4.44 14.83 13.02 3.16 5.56 18.28 16.47
As seen from the data presented, the acid hydrolysis exhibits a linear dependence on
the acidity. So it has been determined previously by Clare and co-workers195 at higher H+
concentrations and in nitric acid. The results of this work, when using HClO4 as the hydrogen
ion source, extend the first-order range towards lower acidities.
29

Concerning the redox process, a first-order dependence on the thiolactic acid
concentration has been noted as shown in figure III.3.5, while the effect of the acidity on the
rate is more complex, as depicted in figure III.3.7.
0.00 0.01 0.02 0.03 0.04 0.05 0.06
0.000
0.004
0.008
0.012
0.016
k obs /
s-1
[RSH] / M
(a)
Figure III.3.5. The effect of thiolactic acid on the
reaction rate. T=293, [H+]= 0.316 M-1and μ=0.5 M.
0.00 0.02 0.04 0.06 0.08 0.10
0.002
0.004
0.006
0.008
0.010
0.012
0.014
kob
s / s
-1
[H+] / M
(b)
Figure III.3.7. Non-linear dependence of kobs
on H+ ion concentration
The equation of the line at constant acidity is:
])[009.0312.0()0003.00007.0( RSHkobs ±+±−= 3.3.6
confirming the first-order dependence on RSH. Figure III.3.7 indicates a negative (–1) order
with respect to hydrogen ion concentration. If some intermediate complex V-thiolactic acid is
involved, through a V-S bond, as proved by McAuley216, then the thiol function is involved
and it should be acid dissociated, which is in accordance with a negative order. A plot of kobs
as a function of [H+]-1gave a straight line.
Further experiments are needed in order to suggest a well-argued reaction mechanism.
It is clear that some consecutive one-equivalent electron transfer steps are involved. The
mixture changes its color to a pale-blue one, characteristic to V(IV) compounds, identified by
ESR studies.
An attempt to determine activation parameters of the reactions has also been made.
Measurements at three different temperatures (293, 303 and 313 K) have been undertaken,
studying both the hydrolysis and the redox process, where the experimental activation
energies of Ea h = 61 ± 2 kJ.mol-1 and Ea redox = 41 ± 3 kJ.mol-1 respectively, for the two
reactions have been computed. Even if few, these measurements are trustworthy, as the value
obtained for Eh is very similar to the one given by Clare at al195 in nitric acid (75 kJ⋅mol-1).
30

31
The oxidation by VO2+
Oscillograph traces, showing the disappearance of VO2+, were recorded at various
concentrations of VO2+, RSH and H+, the latter chosen in a concentration range ensuring that
vanadium VO2+ was the predominant species. The reaction is completed within 1- 1.5 sec.
Reaction orders were determined, combining the isolation and the initial rate methods.
That is, varying the concentration of one reactant while keeping the concentration of the
others constant together with the ionic strength (0.1 M) and then, upon calculation of the
initial reaction rate, determining the reaction order with respect to the varied reactant
concentration, from classic log – log plots. The slope of the lines were 1.11 for RSH, 1.51 for
VO2+ and −1.14 for H+, representing the order on the specified reacting species. This
corresponds to a first-order in RSH in the range of concentration (2.5⋅10-3 - 2.25⋅10-2 M) at
constant concentration of VO2+ (2.5⋅10-3 M), and − 1 with respect to H+, within the narrow
range of concentrations used, limited by the construction of the stopped-flow apparatus,
which does not allow for more acidic solutions, and by the incomplete hydrolysis of the
polymeric structure of the oxovanadium compound at lower acidities. Nevertheless, a clear
trend towards decreasing rates with increasing pH was seen, allowing the estimation of the
reaction order of H+ as being -1. For VO2+ concentrations ranging from 5⋅10-4 M to 3.5⋅10-3 M
at constant concentration of thiolactic acid (1.13⋅10-2 M), the method leads to an order of 1.5.
The influence of the ionic strength of the solution upon the reaction was also
investigated, using fixed concentrations of the reactants, while applying ionic strengths of 0.1
to 1 M. It was found that the redox process suffers no influence of the ionic strength, as the
plot shows no trend.
ESR investigations on the VO2+−thiolactic acid system.
The first ESR measurements were performed in continuous flow, attempting to
identify paramagnetic species in the reaction of VO2+ (2.5⋅10-3 M) with thiolactic acid 7.5⋅10-3
M, H+ 0.032 M and ionic strength 0.1 M. They showed the presence of free V(IV), in
moderate concentrations, at some stage of the reaction. This complies with some results
reported in literature214,215. Figure III.3.12 shows the intensity of the ESR signal of the V(IV)
compound at several times after mixing, showing that it decays in time.

2800 3200 3600 4000
24 min
20 min
16 min
10 min
6 min
3 min
0 min
Magnetic field / G
ES
R s
igna
l int
entit
y / a
.u.
Figure III.3.12. ESR spectrum of V(IV) and its evolution in time.
The idea of comparing the results with those obtained for the oxidation of thiolactic
acid by Cr(VI), prompted the search for organic radicals in the studied reaction. However, no
such species were observed, due either to experimental limitations, or to the reaction itself,
where the radical is formed in very low “steady-state” concentrations.
With identical experimental setup - only differing by the application of stopped-flow,
kinetic curves were obtained. Good and reproducible kinetic curves were produced, but as this
part of the study is still in its early stages results are sparse.
Conclusions
Although more data is needed to establish a reaction scheme, there are several obvious
facts, such as: the rate expression, the occurrence of electron transfer involving
polyoxovanadate, prior to the separation of a monomeric reactive form, the involvement of
V(IV) which reacts not so rapidly as considered previously, and the lack of effect of ionic
strengths. All these argue the presence of several parallel and consecutive steps: the formation
of a 1 : 1 complex containing a S-V bond along with a 1 : 2 complex RSH : V(V) where the
substrate is a bridge. Also, the formation of V(IV) in a one-equivalent electron transfer, which
requires the formation of a free thiyl radical. On the basis of these results a probable sequence
of reactions can be advanced, when the oxidizing agent is VO2+.
VO2
+ + RSH VO2 – SR + H+ K1 3.3.7
VO2 – SR V(IV) + RS• k1 3.3.8
32

VO2+ + RSH VO2 – SR’COO – VO2 + 2 H+ K2 3.3.9
VO2 – SR’COO – VO2 V(IV) + RS• k2 3.3.10
V(IV) + RSH V(III) + RS• + H+ k3 3.3.11
2 RS• RSSR 3.3.12
Further ESR studies can bring information on the role of V(IV) in the reaction.
The mechanism of reaction with HV10O285- should be, in a way, similar: the formation
of an adduct that reacts and forms a V(IV) and a free thiyl radical and a cluster with one unit
of V(V) less. Here, the large volume does not permit the formation of a 1:2 complex.
III.4. OXIDATION OF THIOLACTIC ACID BY HEXACYANOFERRATE(III) IN
PERCHLORIC ACID MEDIUM304
Hexacyanoferrate (III) is well-known as a selective one-electron outer-sphere oxidant.
The key step in the oxidation is an outer-sphere electron transfer, generally acknowledged to
proceed by the formation of a substrate-oxidant ion-pair. Some electronic spectra obtained
with mixtures of Fe(III) and Fe(II) of different ratios, compared to spectra obtained at various
intervals of time in the presence of thiolactic acid argues the involvement of such a species.
Preliminary observations
Reaction stoichiometry. The oxidation of thiolactic acid (abbreviated as RSH) by
hexacyanoferrate (III) proves to have a 1[Fe(CN)6]3- : 1 RSH stoichiometric ratio, as found by
spectrophotometrical titration (figure III.4.1).
0 1 2 3 4 5 6 7 8 9 100,0
0,2
0,4
0,6
0,8
1,0
1,2
Raport stoechiometric 1,1:1
Abs
orba
nta
/ u.a
.
[RSH]/[Fe(CN)63-]
Figure III.4.1. Remaining absorbance of [Fe(CN)6]3- after the reaction with thiolactic acid has been accomplished.
33

This indicates that the oxidation of thiol-acid to the corresponding disulphide takes the
following form:
+2CH3CH(SH)COOH → 2HFe(CN)6
3-+(HOOCCH(CH3)S)2 +2H+ 3.4.1 −26)(2 CNHFe
Kinetics
The kinetic approach employed pseudo-first-order conditions (excess concentrations
of the substrate and the hydrogen ion as well as a constant ionic strength μ = 0.5 M). Indeed, a
linear plot obeying a semi-logarithmic equation has been found, for all but the initial part. The
linearity was quite good (R2 between 0.9980 and 0.9999), implying a first-order behavior of
the absorbing species (hexacyanoferrate(III) and its outer-sphere ion-pair intermediate).
Our interest focuses on the influences exhibited by the thiolactic acid and hydrogen
ion on the pseudo-first-order constant, describing the electron-transfer process. Such rate
coefficients have been obtained from the linear part of semi-logarithmic plots of the type
ln(A-A∞) = f(t), and are collected in part in table III.4.1 (the number of replicate runs are
specified in parenthesis). Series of measurements have been performed at 3 constant acidities
while varying the thiolactic acid concentration and then for 3 excess concentrations of RSH
while the acidity was varied. In both cases the outcome was a complex behavior.
Table III.4.1. First order rate constants at 293±0.1 K, μ=0.5 M and [[Fe(CN)6]3-] = 2.22 10-4M, as a function of
2-mercapto-propionic acid concentration for 3 different excess concentrations of HClO4 and as a function of [H+] for 3 different excess concentrations of the thiol - acid.
[H+] (M) [RSH] (M)
0.32 0.10 0.032 0.011 0.017 0.022 102
[RSH] (M) 103 kobs
(s-1) 103 kobs
(s-1) 103 kobs
(s-1)
102 [H+] (M) 103 kobs
(s-1) 103 kobs
(s-1) 103 kobs
(s-1) 0.44 0.36 (6) 2.96 (3) 15.85 0.94 (6) 2.14 (3) 2.87 (3) 1.11 2.29 (11) 18.80 (11) 12.59 1.45 (5) 2.93 (3) 4.48 (3) 1.67 4.42 (9) 36.02 (6) 10.00 2.29 (11) 4.42 (9) 7.41 (14) 2.22 7.41 (14) 61.46 (7) 7.94 3.66 (7) 6.91 (3) 10.29 (6) 2.78 1.69 (4) 11.68 (7) 96.95 (6) 6.31 5.10 (10) 10.27 (3) 15.16 (6) 3.33 2.49 (5) 16.81 (13) 124.96 (5) 5.01 8.08 (8) 14.92 (4) 22.00 (4) 3.89 3.40 (4) 22.59 (8) 156.36 (7) 3.98 13.81 (8) 22.14 (3) 37.36 (5) 4.44 4.38 (5) 28.44 (9) 194.23 (6) 3.16 18.80 (11) 36.02 (6) 61.46 (7) 5.00 5.38 (5) 35.90 (3) 206.86 (5) 2.51 30.23 (6) 51.89 (4) 84.31 (5) 5.56 6.54 (7) 48.44 (5) 286.91 (8) 2.00 42.42 (7) 78.24 (3) 120.66 (3)
1.58 63.36 (9) 114.04 (3) 170.84 (7)
34

When the concentration of thiolactic acid was varied, the log – log plots were linear
with slopes of quite similar values, but being slightly smaller than 2 (1.893, 1.95 and 1.74 for
concentrations of mineral acid of 0.5 M, 1.0 M and 1.5 M, respectively). The second-order
representations were not satisfactory, as they exhibited negative intercept or obvious
curvature. Thus a fractional order between first- and second-order with respect to thiolactic
acid has been considered. This behavior can be described fairly well by a one-plus form of the
rate expression. No occurrence of curvature was observed in the one-plus type plot; along
with the slightly improved correlation coefficients it favors this approach. The corresponding
equations are shown below:
35
][1
][ 2
RSHkRSHkkb
aobsd +
= 3.4.4 a
b
aobsd kk
RSHkkRSH
+=][
11][ 3.4.5
where ka and kb are combinations of rate constants of the elementary steps involved in the
reaction mechanism. Figure III.4.5 shows the linear behavior, described by eq.3.4.5.
0 50 100 150 200 2500
2
4
6
8
10
12
14
16
18
[RS
H]/k
obs
/ M
s
1/[RSH] / M-1
[H+] = 0.32 M [H+] = 0.10 M [H+] = 0.032 M
Figure III.4.5. Linear form of one-plus rate law at three constant acidities
When the hydrogen ion concentration was varied at constant concentration of
thiolactic acid, the corresponding log–log plots showed an intermediate negative order,
between -1 and -2 (-1.87, -1.74 and -1.82, when [RSH]0 was 0.011 M, 0.017 M or 0.022 M
respectively). This provides strong evidence for an interpretation in the light of one-plus type
plots whose linear form is
'
'
' ][1][
1a
b
aobs kkH
kHk+= +
+ 3.4.6
Figure III.4.7 shows good linear plots of the above given equation.

0.00 0.04 0.08 0.12 0.160
2000
4000
6000
8000
1/([H
+ ]kob
s) / M
-1 s
[RSH] = 1.1 10-2 M [RSH] = 1.7 10-2 M [RSH] = 2.2 10-2 M
[H+] / M Figure III.4.7. The effect of the acidity on the first-order rate constant, eq.3.4.6.
The temperature effect has been checked in the range 283 – 313 K and [H+] = 0.1 M,
[RSH] =2.22⋅10-2 M and constant ionic strengths of 0.5 M. A good Arrhenius plot has been
obtained and an experimental activation energy of 10.6±0.5 kJ.mol-1 has been computed from
the slope of the line. This is a rather small value, indicating the presence of an exothermic pre-
equilibrium.
Presence of free radicals. The involvement of free radicals in the overall process has
been proved by the initiation of polymerization of methyl methacrylate by the redox system.
An increase of temperature due to polymerization has been measured in a small calorimeter
containing reacting mixture and monomer. Also, at the end, some polymer could be isolated.
Reaction mechanism.
The experimental results comprising reaction orders, the one-plus rate law, spectral
evidence of the involvement of an outer-sphere intermediate and free radicals led to the
following proposed sequence of steps:
RSH +− + HRS K1 3.4.8
RSH])CN(Fe[ 36 +− ( ) +− +⋅ HSR])CN(Fe[ 4
6 K2 3.4.9
( ) −− +⋅ RSSR])CN(Fe[ 46 k, r.d.s. 3.4.10 −− ∴+ SRRS])CN(Fe[ 4
6
−− +∴ 36 ])CN(Fe[SRRS 3.4.11 −+ 4
6 ])CN(Fe[SR:RS
The reactive species is the outer-sphere complex, which undergoes electron transfer
assisted by a new de-protonated thiolactic molecule to form a short-lived disulphide radical
anion, which is more stable than a thiyl radical. It reacts as quickly as it is generated with
hexacyanoferrate (III) to give the final oxidation product, the disulphide.
36

The rate law deduced from this mechanism, when [Fe(III)]t is followed by the change
of solution color at 420 nm, is of the form one-plus and explains the dependence on both
[RSH] and [H+].
])([]}/[][1]{[
]/[][)]([ 26
2
221 −
++
+
+= CNHFe
HRSHKHHRSHKkK
dtIIIFed t 3.4.16
The linear form of the observed first-order rate coefficient as dependent on both RSH and H+
is:
121
1][
][1][
][kKRSH
HKkKHk
RSHobs
+=+
+ 3.4.17
Such a line was obtained (Figure III.4.10) with all data at the same temperature, with a
relatively good correlation coefficient (0.9707).
0 5 10 15 20 250
20
40
60
80
100
120
140
[RS
H]/(
[H+ ]k
obs)
/ s
[H+]/[RSH] Figure III.4.10. Linear dependence described by eq.3.4.17, deduced from the suggested mechanism.
From the linear regression parameters (y = (4.9±0.4) + (4.95±0.079)x) it was possible
to compute K2 = 0.99±0.09 and kK1= 0.2 ±0.02s-1, thus proving that the advanced reaction
network seems to be probable.
Conclusions
As presented by the studied reaction, the experimental kinetic data obey one-plus rate
laws, with the integer exponents. A pre-equilibrium involving an outer-sphere complex
between the oxidant and the organic substrate is present and the electron transfer is the rate-
determining step. In acidic media, the involvement of hydrogen ion inhibits the oxidation of
hexacyanoferrate(III). Phenomenological rate coefficients and some intermediate formation
37

constants could be calculated. The data fit well with the rate law deduced from the reaction
schemes, thus supporting the suggested mechanisms. Extra-kinetic proofs also account for the
reaction network.
III.5. THE OXIDATION OF GLUTATHIONE BY CR(VI) IN AQUEOUS
PERCHLORIC ACID SOLUTIONS305
The oxidation reaction of glutathione has been studied under similar conditions as
those used for the reaction between thiolactic acid and chromate. Conventional
spectrophotometry could be employed because the redox process proceeds more slowly as
compared to the thiolactic acid oxidation.
Preliminary observations.
During the mixing of reactant solutions the color changes to a reddish-brown one,
which pales slowly to colorless within several hours. It means a long-lived intermediate is
rapidly formed. Figure III.5.1 presents comparative spectra of HCrO4− and of the mixture
during time of reaction, proving the formation of the intermediate.
0
0.9
0.2
0.4
0.6
0.8
300 500350 400 450
Abs
orba
nce
/ a.u
.
Wavelength / nm Figure III.5.1. Mixture spectra at various times after mixing as compared to HCrO4
- (4.7⋅10-4 M), T=293 K, [Cr(VI)]0 = 5⋅10-4 M, [GSH]0 = 3.33⋅10-3 M, [H+] = 3.67⋅10-2 M and μ ≈ 0.037 M.
Here, the abreviation of glutatione is GSH, as it is usual in literature. The maximum position
of the band is located at 435nm. The batochromic shift as compared to that of Cr(VI) proves
the formation af a S−Cr bond in an 1 : 1 complex , in accordance with literature
data176,177,179,183 and the findings in the previous section. This formation is quite rapid and
cannot be followed by classical spectrophotometry, and therefore this part of the reaction has
been approached using a stopped-flow technique.
38

KINETICS
Formation of the intermediate complex. If the reaction is monitored at very short
times (the conversion at most 2%300 ) the rate expressed by the modification of absorbance
A435, depends upon the initial reactant concentrations as:
cbanm VICrHGSH
dtdAr 000
435435 )]([][][ +α== 3.5.1
where α contains rate constant and molar absorbance, and the exponents are reaction order
with respect to the reactants. Now, experiments were carried out at constant concentration of
two species and the remaining one was varied in turn. Whether the rate measured was
represented as a function of varied species concentration, or double logarithmic plots were
made, straight lines were obtained, as exemplified by the figures below. The dependence
found is in agreement with first order in each of Cr(VI), GSH and the acidity
2,8 3,0 3,2 3,4 3,6 3,84,2
4,4
4,6
4,8
5,0
5,2
5,4
-lg(d
A/d
t)
-lg([Cr(VI)]0)
c = 1.00 ± 0.07R2 = 0.9908
1.6 1.8 2.0 2.2 2.4 2.6 2.8 3.04.2
4.4
4.6
4.8
5.0
5.2
5.4
5.6
-lg (d
A/d
t)
- lg [GSH]0
a = 0.91 ± 0.09R2 = 0.9372
Figure III.5.3 Determination of the reaction order with respect to Cr(VI). ([GSH]0 = 0.004 M; [H+]=0.0257 [Cr(VI)]0=0.0002 ÷ 0.0012 M)
Figure III.5.4. Determination of the reaction order with respect to GSH ([Cr(VI)]0=0.0004 M; [H+]=0.0257 M; [GSH]0=0.0012 ÷ 0.02 M)
1.0 1.2 1.4 1.6 1.8 2.0
4.4
4.6
4.8
5.0
5.2
5.4
-lg (d
A/d
t)
- lg [H+]
b = 0.95 ± 0.10R2 = 0.9229
0.0 0.4 0.8 1.2 1.6 2.0 2.4
0.00
0.01
0.02
0.03
0.04
0.05
0.06
dA/d
t
[HCrO-4][GSH][H+] / 10-7 M3
α = (2.4 ± 0.2) x 105
R2 = 0.8894
Figure III.5.5. Determination of the reaction order
with respect to [H+].([GSH]0 = 0.004 M; [Cr(VI)]0=0.0004; [H+]=0.0257 ÷ 0.1 M)
Figure III.5.6. Overall dependence of the rate ([GSH]=0.004 M; [Cr(VI)]0=0.0004 M; [H+]=0.01 ÷
0.1 M)
By taking into account the path lengths of the observation cell in the stopped-flow device of
0.336 cm, the molar absorptivity of Cr(VI) species is determined from the slope of the line
39

obtained by representing A0 as a function of [Cr(VI)]0. A value of ε= 227±4 M-1⋅cm-1 has
been obtained, in good agreement with literature data for HCrO4− species.
Decay of the intermediate complex. Studies on this redox process have been carried
out by monitoring the evolution of absorbance at 435 nm. The curve exhibits a bi-phasic
shape, with the first part progressing much more rapidly as compared to the disappearance of
the condensed complex, as shown in figure III.5.7
0 200 400 600 800 1000 12000.00
0.05
0.10
0.15
0.20
0.25
Abs
orba
nce
/ a.u
.
time / s Figure III.5.7. An experimental bi-phasic evolution of absorbance at 435 nm.
T = 293 K, [Cr(VI)]=1.33⋅10-4 M, [GSH]=1.33⋅10-2 M, [H+]=2.97⋅10-2 M and μ=0.5 M.
The second part of the reaction seemingly exhibits an exponential dependence. Indeed,
the logarithmic form gave straight lines with the slope k2obs proving the first-order dependence
upon GSCrO3−. When the concentration of substrate was varied at constant acidity, or the
hydrogen ion concentration was varied at constant glutathione concentration, complex
dependencies were found. A fractional order between zero and one (nearer to unity) has been
found from the double-logarithmic plot. The interpretation of this consists of either the
occurrence of two reaction paths, one of zero order and the other of first order with respect of
GSH, or a dependence of a one-plus type in the rate expression. This finding is similar to that
of the thiolactic acid – chromate system. The same similarity occurs with the effect of
hydrogen ion concentration. The double-logarithmic plot exhibits a fractional sub unitary and
increasing order with the acidity. It means that as the concentration of hydrogen was raised, a
reaction pathway involving H+ became more important. Therefore two concurrent reaction
paths, one without hydrogen ion, and another with it, are operating in the redox process.
An experimental activation energy of Ea = 40 ± 1 kJ⋅mol-1 has been obtained from the
k2obs values determined at 6 values of temperature in the range of 293 - 323 K.
40

The involvement of paramagnetic intermediates.
ESR measurements were made in a static regime at temperatures of 277 K and 293 K.
The results showed that several Cr(V)-Glutathione complexes are formed during the overall
process. The complex species and their lifetime depend upon the acidity. Figure III.5.11
presents these ESR signals.
3380 3400 3420 3440
Lit: 1.973Lit: 1.987
g=1.996
g=1.983
g=1.980g=1.978
g=1.972g=1.986
pH 3
pH 5
pH 8
pH 11
magnetic field / G
ES
R s
igna
l int
ensi
ty /
a.u.
(a)
3380 3400 3420 3440
40 min
32 min
25 min
17 min
10 min
2 min
T = 277 K
magnetic field / G
ES
R s
igna
l int
ensi
ty /
a.u.
(b)
3380 3400 3420 3440
55 min
40 min
25 min
17 min
10 min
2 min
T = 293 K
magnetic field / G
ES
R s
igna
l int
ensi
ty /
a.u.
(c)
3380 3400 3420 3440
40 min
32 min
25 min
17 min
10 min
2 min
T = 277 K
magnetic field / G
ES
R s
igna
l int
ensi
ty /
a.u. (d)
Figure III.5.11. Complexes Cr(V)-glutathione present in the reaction mixture at various acidities (a) and time evolution of the height of the ESR signal at pH 3 (b), 5 (c) and 8 (d).
The intermediates persist in solution at 293 K either by stabilization upon
complexation with the excess substrate, or reaching a steady-state concentration.
Organic radical intermediates fail to evidentiate, possibly because of very low steady-
state concentration due to their great reactivity.
Conclusions
Taking into account the similarities of this systerm with the one of thiolactic acid -
Cr(VI) concerning the dependence of the aparent first order rate constant on the substrate and
hydrogen ion concentration, as well as the involvement of Cr(V) species, there are enough
arguments to consider similar rate equation and sequence of elementary steps in the overall
process.
41

III.6. THE OXIDATION OF α-TOLUENETHIOL BY CHROMATE IN ACETIC
ACID306
This case involves a substrate with thiol function linked to a primary carbon atom,
which is bound to a phenyl radical. This bulky group, as well as the presence of the oxidizing
agent in the form of condensed species acetochromate110b) CH3COOCrO3− bring about the
involvement of electronic and steric effects on the rate, making the study of interest from this
point of view.
Preliminary observations.
The stoichiometry of the oxidation is 3 Toluenethiol : 1 Cr(VI) as confirmed by a
spectrophotometrical titration at 350 nm, using constant Cr(VI) concentration and increasing
thiol concentration.
In mixing the thiol solution and acetochromic acid solution, the yellow-orange color of
the Cr(VI) solution instantly turned to grey-green during the mixing time. Then, this color
vanished steadily and rapidly towards a colorless solution.
The electronic spectrum of the mixture was recorded point by point at 10 s after
mixing by means of a Zeiss Spekol spectrophotometer and compared to that of acetochromic
acid as presented in figure III.6.1
1,5
acetocromate
bsor
banc
e / a
.u.
1 intermediate
0,5
A
0 300 400 500 600 700 800
wavelength / nm
Figure III.6.1. The qualitative spectrum of the intermediate at 10 s after mixing . ([Cr(VI)]0 = 5⋅10-4 M and
[C6H5CH2SH]0 = 1.79⋅10-2 M), as compared to that of acetochromic acid (5⋅10-4 M).
The bonding of the central atom to a sulphur ligand, proving the formation of such position of
charge-transfer band from oxygen as ligand to Cr(VI) shifted largely from 348 to 680 nm by
an intermediate176,177,179,183
C6H5CH2SH + HOCrO2OAc C6H5CH2SCrO2OAc + H2O 3.6.2
42

To consider the formation and decay of this intermediate, some spectra of the mixture were
recorded during the reaction every 4.5 seconds by means of a photodiode-array
spectrophotometer as presented in figure III.6.2.
Figure III.6.2. Absorption spectra of the mixture containing initial concentration of 5⋅10-4 M Cr(VI) and
2.49⋅10-2 M C6H5CH2SH in acetic acid during time. The path length of the cuvette was 1 cm. Even the first spectrum is different than that of acetochromic acid, confirming the maximum
at 680 nm and the fast formation of the intermediate. The decay of this species is quite rapid,
in the order of one to two minutes.
The kinetics of the process.
All measurements make use of pseudo-first-order conditions (quite large excess of α-
toluenethiol). The process of diminishing absorbance either at 350 or 680 nm exhibits an
exponential profile, with the exception of the first several points. This first part corresponds
mainly to the formation of the intermediate.
Therefore, the linear form of the absorbance evolution gave straight lines according to
equation 3.6.3.
tkAAAA obs ⋅−−=− ∞∞ 20 )ln()ln( 3.6.3 The values A, A0 and A∞ stand for the actual reading, the initial and final reading of
absorbance, respectively.
The slope of the line is equal to the rate constant k2obs (s-1) of the redox process. Good
correlation coefficients were obtained with such linear regressions. Table III.6.1 collects
several means of the apparent first-order rate constants, each obtained from 4 - 5 individual
runs under identical conditions, at 680 nm.
43

Table III.6.1. Mean rate constants at the decay of the intermediate through electron transfer (at 680 nm).
102 ⋅[C6H5CH2SH] (M) 102 ⋅ k2obs (s-1) R2
1.12 2.89 ± 0.03 0.9988
0.56 2.75 ± 0.05 0.9910
0.28 2.96 ± 0.40 0.9823
0.224 3.04 ± 0.40 0.9831
The results were the same as seen with several kinetic runs followed at 350 nm, where
the decrease of absorbance is due to both the acetochromic acid and the intermediate thioester.
Here, as in the previous systems approached in the thesis, the rapid formation of the
condensed species in a pre-equilibrium is followed by its decay. Under a large excess of the
reducing agent, the overall process can be shown to be the sequence of two first order
processes in which k1obs = k1 [C6H5CH2SH] + k-1 and R, I and P stand
for acetochromic acid, the thioacetochromate intermediate and the final product, respectively.
This system has been treated classically, similar to the system thiolactic acid –chromate in
section III.2.4. Therefore, the absorbance evolution is described by the equation
A – A∞ = γ1e-k1obst + γ2e-k2obst. Its linear form, at the values of time where the first exponential
vanishes, becomes ln(A – A∞ ) = ln γ2 – k2obs⋅t. The apparent first-order rate constant for the
consumption of thioester was determined from the slope of the line (equation 3.6.3 rewritten
in this fashion). For the initial part of the run, where the decomposition of intermediate has
not yet an important contribution, another linear equation can be written, making use of the
parameters of the line describing the decay process
PIR obsobs kk ⎯⎯ →⎯⎯⎯→⎯ 21
ln(A – A∞– γ2e-k2obs) = ln γ1 – k1obs⋅t 3.6.8 Figure III.6.5 shows the linear dependence described by the equations 3.6.3 and 3.6.8, and the
results (as the slope of the lines) are collected in table III.6.2.
Table III.6.2. First-order rate constants for the two consecutive processes at 288 K and
[Cr(VI)] = 5.0⋅10-4 mol/L.
102 [C6H5CH2SH] (M) k1obs (s-1) R2 102 k2obs (s-1) R2
1.39 0.17 ± 0.02 0.9773 2.95 ± 0.04 0.9992
1.12 0.16 ± 0.01 0.9880 3.16 ± 0.07 0.9984
0.84 0.154 ± 0.003 0.9986 2.94 ± 0.07 0.9988
44

0 50 100 150-4
-3
-2
-1
0
ln (A
-A∞
)
time / s0 5 10 15 20 25
-4
-2
0
ln(A
-A∞
-g2ex
p(-k
2t)
tmean / s
Figure III.6.5. Linear dependence as described by the equations 3.6.3 and 3.6.8. [Cr(VI)] = 5,0 x 10⁻⁴ M and [C6H5CH2SH] = 1,12 x 10⁻² M, at 360 nm and 288 K. (The points exemplify the distribution of values, linear
regression was calculated with mean times in order to reach a particular absorbance value)
As seen in the tables III.6.1 and III.6.2, the rate coefficient k2obs does not depend on
the substrate concentration, the redox process of intermediate consumption exhibits
zero−order with respect to α-toluenethiol. On the other hand, it is seen that the condition for
applying the classic method k1obs ≥5 k2obs is fulfilled. A similar behavior has been found in the
case of thiophenol oxidation.109
A trend of increasing k1obs with increasing thiol concentration has been expected.
Although more data are necessary, a plot of k1obs as a function of α-toluenethiol concentration
exhibits a linear dependence with the intercept different of zero. From the parameters of the
line k1obs = k1 [C6H5CH2SH] + k-1, values of k1 ≈2.7±1.3 M−1s−1 and k−1 ≈0.13±0.02 s−1 have
been estimated at 288K as well as an apparent equilibrium constant of 21 ± 13 M−1.
The effect of temperature on k2obs was investigated at four temperature values
between 288 and 308 K, following the process at 680 nm. Excellent lines were obtained with
R2 between 0.9984 and 0.9986, and rate coefficients calculated. Using these values and the
linear form of the Arrhenius and Eyring equations, the following activation parameters were
obtained: Ea= 50.9±1.3 kJ.mol−1, ΔH≠ = 48.4± 1.3 kJ.mol−1 and ΔS≠ = −106 ±5 J.mol−1K−1.
The negative and relative large value of activation entropy is in agreement with the formation
of a condensed compound.
45

The equilibrium constant of thioester formation
Two methods were employed for the calculation of the apparent equilibrium constants
(a-x)(b-x)x
SHCHHOAc][CHOCrOOAcSCrOCHHC
O] [HK K' ===
][][
2562
2256
2 3.6.9
Recording the decay of thioester by means of absorbance at 680 nm, the kinetic curves
were used in their linear form to obtain the zero-time absorbance by extrapolation. It was
assumed that the formation is much more rapid than the disappearance. An iterative procedure
has been used to obtain K’. It was considered that at the largest concentration of thiol
employed, all Cr(VI) was in the form of the condensed compound. Thus, a first approximation
led to a molar absorbance for the complex. With this, for all the other concentrations used, the
amount of intermediate was estimated and the equilibrium constant calculated. Using this
approximated value of K’ one returned to the largest concentration, and computed a corrected
value of ε. With this new value the concentration of the intermediate and the equilibrium
constant were computed again. The procedure was repeated (8 to 30 iterations) to the
convergence of data. The obtained results are presented in table III.6.3.
An alternative way to compute K’ and ε is to use the apparent absorption coefficient
l).(/[0 VICrAap =ε , with l being the path length of the cuvette. From the equilibrium
constant the following equation has been derived:
ε+⋅
ε⋅=
ε1
][1
'11
0256 SHCHHCKap 3.6.12
From this, a value of K’ = 19±2 M-1 has been obtained.
Table III.6.3. The initial absorbances at 680 nm in the cell with path lengths of 5 cm, at T = 288 K,
[Cr(VI)] = 5.0⋅10-4 and computed values of K’ and molar absorptivity ε.
102 [C6H5CH2SH] (M) A0
105 [RSCrO2OAc] (M)
K’ (M-1)
ε (M-1⋅cm-1)
1.12 1.545 9.94 22.3
0.56 0.869 5.67 22.5 3066
0.28 0.437 2.85 21.9 3058
0.224 0.329 2.09 21.9 3142
0.168 0.250 1.56 19.5 3190
mean: 21.6 ± 3.0 3114 ± 100
46

Conclusions
The oxidation of α-toluenethiol by Cr(VI) starts with the rapid formation of an
intermediate complex in the ratio 1:1 consist with the equilibrium calculation. The steric
congestion around the Cr(VI), due to the acetyl group and the bulky benzyl group, hinders the
attack of another bulky molecule of the reducing agent in order to directly give the disulfide
in a bi-equivalent electron transfer or the disulfide radical anion in a one-equivalent electron
transfer. Therefore, a monomolecular decomposition takes place with the implication of new
intermediates, Cr(V) and free thiyl radical in the overall course of the reaction. The kinetics,
equilibrium and other extra-kinetic data are consistent with the following mechanism
C6H5-CH2SH + HOCrO2OAc C6H5-CH2SCrO2OAc + H2O 3.6.2
k1
k-1
C6H5-CH2SCrO2OAc C6H5-CH2S• + CrVOAc k2, e.d.v. 3.6.17
2 C6H5-CH2S• C6H5CH2SS CH2C6H5 3.6.18
CrVOAc + C6H5-CH2SH(excess) products 3.6.19
The more reactive species Cr(V) and free radicals, are consumed as they were formed.
47

48
GENERAL CONCLUSIONS
Five redox reaction systems involving three organic compounds in the class of thiols
and various oxidizing agents such as Cr(VI), V(V), and Fe(CN)63- were scrutinized,
concerning their kinetics and mechanisms. There are some common features of these
reactions and several differences, especially in the hydrogen-ion intervention.
• All the systems approached exhibit at least two distinguishable steps, which are
obvious from their kinetics.
• The first step implies the formation, in a pre-equilibrium, of a long-lived intermediate
between the oxidizing species and reducing species by a sulphur link. An exception is
hexacyanoferrate(III) which forms an outer-sphere complex instead, because of the
inertness to substitution of the Fe(III)-cyano complex.
• These long-lived complexes contain the oxidizing agent in its initial oxidation state
and their combination ratio is 1 : 1, with the exception of V(V) where a parallel
reaction pathway involves a 2 V(V) to 1 thiol intermediate complex.
• The intermediates were detected directly by spectrophotometry or indirectly from the
kinetic rate laws.
• Hydrogen ion intervenes as a catalyst in the complex formation in all Cr(VI)
oxidations of the various thiols, whereas with hexacyanoferrate and V(V) as oxidants
it has an inhibiting role.
• The decay of these intermediates takes place through electron transfer and obeys first-
order kinetics with respect to their concentration.
• The electron-transfer is always the rate determining step. It could involve either one-
equivalent or bi-equivalent electron transfer paths, the two being kinetically
indistinguishable.
• Generally, the decomposition of the intermediates is assisted by a second thiol
molecule, except for the oxidation of α-toluene thiol in acetic acid, where steric
effects hinder this involvement.
• The redox process as well can be catalyzed (Cr(VI)) or inhibited by hydrogen ion.

49
• Under the excess concentration of thiolic compound, the reaction products are always
disulfides. This does not exclude the formation of different products when the reactant
ratio is inversed.
• ESR or the initiation of polymerization with the redox systems proved the
involvement of short-lived free radicals in the overall process.
• The formation of disulfide-ion radical (RSSR-•) rather than of the thiyl radical (RS•) is
considered more probable, albeit the latter being considered in the literature. The
arguments for this comes from a stability calculation by MO theory, and the
intervention of a second thiol molecule in the electron-transfer process in the case of
hexacyanoferrate, a one electron oxidizing agent. Therefore there are no direct proofs
to exclude the path of reduction of Cr(VI) to Cr(V) .
• ESR spectroscopy bore witness of the formation of some paramagnetic species,
complexes of Cr(V) and V(IV). They behave as relatively long lived intermediates
(persist in the reaction mixture for a long time).
• ESR studies also gave evidence to the fact that V(IV) is not the final product of
reduction of V(V). Under the excess concentration of reducing agent, the final product
is V(III).
• The rate laws deduced from the mechanisms proposed agree well with the
experimental ones, providing solid arguments for the proposed reaction networks.
• The employment of the classical method of handling series of pseudo-monomolecular
steps in order to determinate rate coefficients for the two processes in the series, using
only one kinetic curve with a bi-phasic aspect, might be made with satisfactory results
even outside of the condition k1≥5k2 otherwise stipulated by literature, as
demonstrated by our parallel calculations by linear regression and two variants of non-
linear regression.

50
SELECTED REFERENCES
1. M. L. Tobe, “Inorganic Reaction Mechanisms”, Nelson and Sons, London, 1972, Ch. 9. 2. R. G. Wilkins, “The Study of Kinetics and Mechanism of Reactions of Transition Metal Complexes”, Allyn
and Bacon Inc., Boston, 1974, Cap. 5, p. 252. 5. H. Taube, H. Meyers, R. L. Rich, “Observations on the mechanism of electron transfer in solution” J. Am.
Chem. Soc., 1953, 75, 4118-4119. 8. R. A. Marcus, “Chemical and Electrochemical Electron-Transfer Theory”, Ann. Rev. Phys. Chem., 1964, 15,
155-196. 10. R. A. Marcus, “Tutorial on rate constants and reorganization energies”J. Electroanal. Chem., 2000, 483, 2-6. 13. M. Chou, C. Creutz, N. Sutin, „Rate constants and activation parameters for outer-sphere electron-transfer
reactions and comparisons with the predictions of Marcus theory“, J. Am. Chem. Soc., 1977, 99, 5615-5623. 14. M. J. Weaver, E. L. Yee, “Activation parameters for homogeneous outer-sphere electron-transfer reactions.
Comparisons between self-exchange and cross reactions using Marcus' theory”, Inorg. Chem., 1980, 19, 1936-1945.
15. R. D. Cannon, “Inorganic Reaction Mechanisms”, 1981, Ch. 7, p. 3. 16. R. Sarala, S. B. Rabin, D. M. Stanbury, “Oxidation of thiosulfate by tris(phenanthroline) osmium(3+) and
related complexes”, Inorg. Chem., 1991, 30, 3999-4007. 18. W. R. Fawcett, Yu. I. Kharkats, “Estimation of the free energy of activation for electron transfer reactions
involving dipolar reactants and products”, Electroanal. Chem., 1973, 47, 413-418. 19. a) B. S. Brunschwig, S. Ehrenson, N. Sutin, “Solvent reorganization in optical and thermal electron-transfer
processes“ J. Phys. Chem., 1986, 90, 3657-3668; b) B. S. Brunschwig, S. Ehrenson, N. Sutin, „Solvent reorganization in optical and thermal electron-transfer processes: solvatochromism and intramolecular electron-transfer barriers in spheroidal molecules“, J. Phys. Chem., 1987, 91, 4714-4719; c) B. S. Brunschwig, N. Sutin, „Energy surfaces, reorganization energies, and coupling elements in electron transfer“, Coord. Chem. Rev., 1999, 187, 233-254.
20. a) J. Jortner, I. Rips, M. Weaver, R. W. Fawcett, L. Blum, ”Application of the mean spherical approximation to describe the entropy of solvation of spherical ions in polar solvents”, J. Chem. Soc. Faraday Trans., 1992, 88, 3339-3344; b) I. Rips, J. Klafter, J. Jortner, ”Dynamics of ionic solvation”, J. Chem. Phys., 1988, 88, 3246-3252; c) I. Rips, J. Klafter, J. Jortner, ” Solvation Dynamics in Polar Liquids”, J. Chem. Phys., 1988, 89, 4288-4299.
21. a) G. Grampp, W. Jaenicke, ”ESR spectroscopic investigation of the homogeneous electron-transfer reactions between substituted p-phenylenediamines and quinonediimines, and the validity of Marcus' theory. I. Measurements at 293 K”, Ber. Bunsenges. Phys. Chem., 1984, 88, 325-334; b) G. Grampp, W. Jaenicke, ”ESR spectroscopic investigation of the homogeneous electron-transfer reactions between substituted p-phenylenediamines and quinonediimines, and the validity of Marcus' theory. II. Temperature dependence and activation parameters”, Ber. Bunsenges. Phys. Chem., 1984, 88, 335-340; c) G. Grampp, W. Jaenicke, ”Kinetics of diabatic and adiabatic electron exchange in organic systems. Comparison of theory and experiment”, Ber. Bunsenges. Phys. Chem., 1991, 95, 904-927.
27. G. Grampp, S. Landgraf, D. Sabou, D. Dvoranova, “Application of Marcus cross-relation to mixed inorganic-organic redox couples. A stopped-flow study of the oxidation of N,N,N',N'-tetramethyl-p-phenylenediamine with various oxidants“, J. Chem. Soc. Perkin Trans., 2002, 2, 178-180.
28. N. Sutin, “Electron Transfer in Chemical and Biological Systems”, Chem. in Britain, 1972, 148-151. 29. A. G. Sykes, “Kinetics of Inorganic Reactions”, Pergamon Press, Oxford, 1966, Ch.7. 37. H. Taube, “Electron Transfer Reactions of Complex Ions in Solution”, Academic Press, New York, 1970. 40. E. I. Heiba, R. M. Dessau, W. J. Koehl Jr., „Oxidation by metal salts. V. Cobaltic acetate oxidation of
alkylbenzenes“, J. Am. Chem. Soc., 1969, 91(24), 6830-6837. 41. E. I. Heiba, R. M. Dessau, W. J. Koehl Jr., „Oxidation by metal salts. III. Reaction of manganic acetate with
aromatic hydrocarbons and the reactivity of the carboxymethyl radical“, J. Am. Chem. Soc., 1969, 91(1), 138-145.
42. K. A. Gardner, L. L. Kuehnert, J. M. Mayer, „Hydrogen Atom Abstraction by Permanganate: Oxidations of Arylalkanes in Organic Solvents“, Inorg. Chem., 1997, 36, 2069-2078.
43. L. J. Simmandi, M. Jaky, C. R. Savage, Z. A. Schelly, “Kinetics and mechanism of the permanganate ion oxidation of sulfite in alkaline solutions. The nature of short-lived intermediates”, J. Am. Chem. Soc., 1985, 107, 4220-4224.
44. P. George, “The oxidation of ferrous perchlorate by molecular oxygen”, J. Chem. Soc., 1954, 4349-4359. 45. G. P. Haight, G. M. Jursich, M. T. Kelso, P. J. Merill, “Kinetics and mechanisms of oxidation of lactic acid
by chromium(VI) and chromium(V)”, Inorg. Chem., 1985, 24, 2740-2746.
51
46. C. Grant, P. Hambright, “Kinetics of electrophilic substitution reactions involving metal ions in metalloporphyrins”, J. Am. Chem. Soc., 1969, 91, 4195-4198.
47. M. D. Cohen, E. Fischer, „Isosbestic points“, J. Chem. Soc., 1962, 3044-3052. 48. I Bâldea, “Cinetică chimică şi mecanisme de reacţie. Baze teoretice şi aplicaţii.”, Presa Universitară
Clujeană, 2002, Ch. 11 and references therein. 56. I. Bâldea, “The reaction between chromate and thiols. IV. The effect of iron(II)-Fe(III) and copper(I)-Cu(II)
systems on the oxidation of thioglycolic acid”, Studia Univ. Babeş-Bolyai, Chem., 1989, 34(1), 80-88. 57. P. C. Bulman Page, S. Rosenthal, “A simple and general synthesis of α-keto esters” Tetrahedron Lett., 1986,
27(17), 1947-1950. 58. S. Sattar, K. Kustin, ”Role of osmium în the reacţion of the hydrazinium cation with chlorate în acid
soluţion”, Inorg. Chem., 1991, 30, 1668-1670. 59. a) E. Erdik, D. S. Matteson, ” Kinetics of osmium tetraoxide catalyzed trimethylamine N-oxide oxidations of
cyclohexene and alpha-pinene to diols”, J. Org. Chem., 1989, 54(11), 2742-2748; b) S. W. Kaldor, M. Hammond, “A mild, osmium tetraoxide-catalyzed method for the oxidation of sulfides to sulfones”, Tetrahedron Lett., 1991, 32(38), 5043-5046.
60. S. Ye, F. Han, S. Qu, Y. Wu, “Catalytic action of metal ions în liquid phase oxidation. III. Catalytic action of metal ions especially cerium ion, în the decomposition of tert-butyl hydroperoxide”, Ranilao Huaxne Xuebao, 1982, 10(2), 230-237
65. M. Mitewa, P. Bontchev, „Chromium(V) coordination chemistry”, Coord. Chem Rev., 1985, 61, 241-272. 66. S. Signorella, S. Garcia, L. Sala, ” Kinetics and mechanism of the oxidation of (±)-2-hydroxy-3-methyl
butanoic acid by chromium(VI) in perchloric acid medium”, Polyhedron, 1992, 11, 1391-1396. 67. S. Ramesh, S. Mahapatro, J. Lui, J. Roček, “Three-electron oxidations. 18. Carbon-13 and deuterium isotope
effects in the cooxidation of 2-hydroxy-2-methylbutyric acid and 2-propanol. Evidence for a two-step mechanism”, J. Am. Chem. Soc., 1981, 103, 5172-5175.
68. V. Srinivasan, J. Roček, „Three-electron oxidations. 13. Intramolecular cooxidation of 2,7-dihydroxyheptanoic acid. Structure of the transition state in the chromium(VI) oxidation of alcohols“, J. Am. Chem. Soc., 1978, 100, 2789-2795.
69. J. F. Perez-Benito, C. Arias, “A kinetic study of the oxidation of L-ascorbic acid by chromium(VI)”, Int. J. Chem Kinet., 1993, 25, 221-227.
70. L. Zhang, P. A. Lay, „EPR Spectroscopic Studies of the Reactions of Cr(VI) with l-Ascorbic Acid, l-Dehydroascorbic Acid, and 5,6-O-Isopropylidene-l-ascorbic Acid in Water.1 Implications for Chromium(VI) Genotoxicity”, J. Am. Chem. Soc., 1996, 118, 12624-12637.
73. P. H. Connett, K. E. Wetterhahn, „Metabolism of the carcinogen chromate by cellular constituents”, Struct. Bonding (Berlin.), 1983, 54, 93-124.
74. P. A. Lay, A. Levina, „Activation of Molecular Oxygen during the Reactions of Chromium(VI/V/IV) with Biological Reductants: Implications for Chromium-Induced Genotoxicities”, J. Am. Chem. Soc., 1998, 120, 6704-6714.
75. P. H. Connett, K. E. Wetterhahn, “In vitro reaction of the carcinogen chromate with cellular thiols and carboxylic acids“, J. Am. Chem. Soc., 1985, 107, 4282-4288.
76. P. H. Connett, K. E. Wetterhahn, “ Reaction of chromium(VI) with thiols: pH dependence of chromium(VI) thio ester formation“, J. Am. Chem. Soc., 1986, 108, 1842-1847.
77. J. F. Perez-Benito, D. Lamrhari, C. Arias, “Three Rate Constants from a Single Kinetic Experiment: Formation, Decomposition, and Reactivity of the Chromium(VI)-Glutathione Thioester Intermediate”, J. Phys. Chem., 1994, 98, 12621-12629.
78. P. A. Lay, A. Levina, “Kinetics and Mechanism of Chromium(VI) Reduction to Chromium(III) by l-Cysteine in Neutral Aqueous Solutions”, Inorg. Chem., 1996, 35, 7709-7717.
79. J. Darkwa, C. Mundoma, R. H. Simoyi, „Antioxidant chemistry. Reactivity and oxidation of DL-cysteine by some common oxidants”, J. Chem. Soc., Faraday Trans, 1998, 94(14), 1971-1978.
80. R. C. Smith, V. D. Reed, T. R. Webb, „Reversal of copper(II)-induced methemoglobin formation by thiols”, J. Inorg. Biochem., 1993, 52, 173-182.
81. G. Capozzi, G. Modena, The chemistry of the thiol group, in: “The Chemistry of Functional Groups”, S. Patai (Ed.), Wiley, New York, 1974.
99. N. N. Greenwood, A. Earnshaw, “Chemistry of the Elements”, 2nd edition, Butterworth-Heinemann, Oxford, UK, 1997.
100. a). H. Taube, “Mechanisms of oxidation-reduction reactions”, J. Chem. Educ., 1968, 45, 452-461; b). D. J. Hewkin, R. H. Prince, “The mechanism of octahedral complex formation by labile metal ions “, Coord. Chem. Rev., 1970, 5, 45-73.
102. a). A Levina, R. Codd, G. J. Foran, G. J. Hambley, T. W. Maschmeyer, T. Masters, P. A. Lay, „X-ray Absorption Spectroscopic Studies of Chromium(V/IV/III)-2-Ethyl-2-hydroxybutanoato(2-/1-) Complexes”, Inorg. Chem., 2004, 43, 1046-1055; b). J. T. Groves, W. J. Kruper Jr., R. C. Haushalter, W. M. Butler, Inorg. Chem., „Synthesis, characterization, and molecular structure of oxo(porphyrinato)chromium(IV)

52
complexes”, 1982, 21, 1363-1368; c). D. J. Liston, B. O. West, „Oxochromium compounds. 2. Reaction of oxygen with chromium(II) and chromium(III) porphyrins and synthesis of a μ-oxo chromium porphyrin derivative”, Inorg. Chem., 1985, 24, 1568-1576; d). J. W. Buchler, K. L. Lay, L. Castle, V. Ullrich, „Oxochromium(IV) porphyrins and their relationship to heme proteins”, Inorg. Chem., 1982, 21, 842-844; e). L.-C. Yuan, T. C. Bruice, „Mechanism of "oxygen atom" transfer to (tetraphenylporphinato)chromic chloride”, J. Am. Chem. Soc., 1985, 107, 512-513.
104. b). M. T. Dickman, M. T. Pope, “Peroxo and superoxo complexes of chromium, molybdenum, and tungsten”, Chem. Rev., 1994, 94, 569-584.
105. d). M. C. Ghosh, E. S. Gould, „Electron transfer. 114. Structure-reactivity relationships in the redox series chromium(V,IV,III) and vanadium(V,IV,III)”, J. Am. Chem. Soc., 1993, 115, 3167-3173.
108. J. Y. Tong, E. L. King, “A Spectrophotometric Investigation of the Equilibria Existing in Acidic Solutions of Chromium(VI)”, J. Am. Chem. Soc., 1953, 75, 6180-6186.
109. G. P. Haight jr., D. C. Richardson, N. H. Coburn, “A Spectrophotometric Study of Equilibria Involving Mononuclear Chromium(VI) Species in Solutions of Various Acids”, Inorg. Chem., 1964, 3(12), 1777-780.
110. b). U. Kläning, M. C. R. Symons, “Structure and reactivity of the oxyanions of transition metals. Part XI. Ultraviolet spectra of monosubstituted chromate ions”, J. Chem. Soc., 1961, 3204-3208.
111. I. Bâldea, D. M. Sabou, “A comparative study on the oxidation of hydroxy- and mercapto- compounds by Cr(VI)”, Studia Univ. Babeş-Bolyai, Chem, 2001, 46(1-2), 17-33.
115. A. McAuley, M. A. Olatunji, “Metal-ion oxidations in solution. Part XIX. Redox pathways in the oxidation of penicillamine and glutathione by chromium(VI)”, Can. J. Chem., 1977, 55, 3335-3340.
140. R. P. Farrell, P. A. Lay, A. Levina, I. A. Maxwell, R. Bramley, S. Brumby, J.-Y. Ji, “An EPR Spectroscopic Study of Chromium(V) Oxalato Complexes in Aqueous Solutions. Mechanism of the Chromium(VI) Oxidation of Oxalic Acid”, Inorg. Chem., 1998, 37, 3159-3166.
144. S. N. Mahapatro, M. Krumpolc, J. Roček, “Three-electron oxidations. 17. The chromium(VI) and chromium(V) steps in the chromic acid cooxidation of 2-hydroxy-2-methylbutyric acid and 2-propanol”, J. Am. Chem. Soc., 1980, 102, 3799-3806.
155. G. Barr-David, M. Charara, R. Codd, R. P. Farell, J. A. Irwin, P. A. Lay, R. Bramley, S. Brumby, J. Y. Ji, G. R. Hanson, “EPR characterisation of the CrV intermediates in the CrVI/V oxidations of organic substrates and of relevance to Cr-induced cancers”, J. Chem. Soc. Faraday Trans., 1995, 91, 1207-1216.
156. D. A. Dixon, T. P. Dasgupta, N. P. Sadler, “Mechanism of the oxidation of DL-penicillamine and glutathione by chromium(VI) in aqueous solution”, J. Chem. Soc., Dalton Trans., 1995(13), 2267-2271
172. J. P. McCann, A. McAuley, “Metal-ion oxidations in solution. Part XIII. The reaction of chromium(VI) with L-cysteine in perchlorate media”, J. Chem. Soc., Dalton Trans., 1975, 783-790.
173. A. McAuley, M. A. Olatunji, “Metal-ion oxidations in solution. Part XVIII. Characterization, rates, and mechanism of formation of the intermediates in the oxidation of thiols by chromium(VI)”, Can J. Chem., 1977, 55, 3328-3334.
176. I. Bâldea, “The reaction between chromate and thiols. V. The oxidation of mercaptosuccinic acid”, Studia Univ. Babeş-Bolyai, Chem., 1994, 39(1-2), 138-149.
177. I. Bâldea, “The reaction between chromate and thiols. III. The oxidation of thioglycolic acid“, Studia Univ. Babeş-Bolyai, Chem., 1987, 32(2), 42-49.
179. I. Bâldea, G. Niac, “The reaction between chromate and thiols. II. The oxidation of cysteine”, Studia Univ. Babeş-Bolyai, Chem., 1986, 31(2), 41-48.
180. I. Bâldea, G. Niac, “Reaction between chromate and thiosulfate. II. Kinetics of tetrathionate formation”, Inorg. Chem., 1970, 9, 110-114.
181. J. F. Perez-Benito, C. Arias, D. Lamrhari, “The determination of kinetic data for the reactions of chromium(VI) with glutathione and other thiols”, Int. J. Chem. Kinet., 1994, 26, 587-591.
183. G. Niac, S. Schön, I. Bâldea, “The reaction between chromate and thiols. I. The oxidation of ethanethiol “, Studia Univ. Babeş-Bolyai, Chem., 1986, 31(2), 31-40.
184. Z. M. Hoffman, E. Hayon, „One-electron reduction of the disulfide linkage in aqueous solution. Formation, protonation, and decay kinetics of the RSSR- radical“, J. Am. Chem. Soc., 1972, 94(23), 7950-7957.
185. M. T. Pope, B. W. Dale, “Isopolyvanadates, -niobates, and –tantalates”, Quart. Rev. Chem. Soc., 1968, 22, 527-548
186. M. T. Pope, „Heteropoly and Isopoly Oxometalates”, Springer Verlag, Berlin, Heidelberg, New York, Tokio, 1983, pp.34-38 şi referinţele incluse.
195. a) B. W. Clare, D. L. Kepert, D. W. Watts, “Kinetic study of the acid decomposition of decavanadate”, J. Chem. Soc. Dalton Trans., 1973, 2479-2480; b) B. W. Clare, D. L. Kepert, D. W. Watts, “Acid decomposition of decavanadate: specific salt effects”, J. Chem. Soc. Dalton Trans., 1973, 2481-2487
214. E. E. Kriss, K. B. Yatsimirskii, G. T. Kurbatova, A. S. Grigor’eva, “Reduction of vanadate by ascorbic acid studied by an EPR method”, Russ. J. Inorg. Chem., 1975, 20(1), 101-107
215. E. E. Kriss, G. T. Kurbatova, K. B. Yatsimirskii, ” Kinetics of the reduction of polyvanadate by ascorbic acid studied by an EPR method”, Russ. J. Inorg. Chem., 1975, 20, 108-111.

53
216. W. F. Pickering, A. McAuley, “Metal-ion oxidations in solution. Part III. The oxidation of 2-mercaptosuccinic acid by vanadium(V)”, J. Chem. Soc. (A), 1968, 1173-1176
217. A. McAuley, “The role of complexes in metal-ion oxidations in solution”, Coord. Chem. Rev., 1970, 5, 245-273
218. A. J. Tasiopoulos, A. N. Troganis, A. Evangelou, C. P. Raptopoulou, A. Terzis, Y. Deligiannakis, T. A. Kabanos, “Synthetic Analogues for Oxovanadium(IV)–Glutathione Interaction: An EPR, Synthetic and Structural Study of Oxovanadium(IV) Compounds with Sulfhydryl-Containing Pseudopeptides and Dipeptides”, Chem. Eur. J., 1999, 5(3), 910-921
219. M. T. Armas, A. Mederos, P. Gili, S. Dominguez, R. Hernandez-Molina, P. Lorenzo, E. J. Baran, M. L. Araujo, F. Brito, “Speciation in the oxovanadium(IV)/glutathione system”, Polyhedron, 2001, 20, 799-804
221. P. L. Domingo, B. García, J. M. Leal, „Acid–base behaviour of the ferricyanide ion in perchloric acid media. Spectrophotometric and kinetic study”, Can. J. Chem., 1990, 68, 228-235.
225. J. M. Leal, B. García, P. L. Domingo, “Outer-sphere Hexacyanoferrate(III) Oxidation of Organic Substrates”, Coord. Chem. Rev., 1998, 173, 79-131.
227. P. L. Domingo, B. García, J. M. Leal, „Acid–base behaviour of the ferrocyanide ion in perchloric acid media potentiometric and spectrophotometric study”, Can. J. Chem., 1987, 65, 583-589.
233. A. Messina, G. Gritzner, „Polarographic and voltammetric studies of tetrabutylammonium hexacyanoferrate(III) and tetrabutylammonium hexacyanomanganate(III) in non-aqueous “, J. Electroanal. Chem., 1979, 101, 201-209.
234. V. Gutmann, G. Gritzner, K. Danksagmüller, „Solvent effects on the redox potential of hexacyanoferrate(III)-Hexacyanoferrate(II)”, Inorg. Chim. Acta, 1976, 17, 81-86.
298. a) D.-M. Sabou, I Bâldea, “Cinetica reactiei de oxidare a acidului tiolactic cu Cr(VI) in mediu acid”, A XXVII-a Conferinta Nationala de Chimie, 23 - 25 octombrie 2002, Calimaneşti-Caciulata. (poster); b) D.-M. Sabou, I. Bâldea, “Cinetica si mecanismul oxidării acidului tiolactic cu Cr(VI) şi Fe(CN)6
3-. Studiu comparativ.”, Conferinta Nationala de Chimie, 7 - 9 mai 2003, Baia Mare. (oral communication); c) D.-M. Sabou, I. Bâldea, “A Comparative Kinetic Study on the Thiolactic Acid Oxidation by Cr(VI), V(V) and Fe(CN)6
3- in Acidic Medium”, 11th Physical Chemistry Conference (ROMPHYSCHEM 11), 2 - 5 septembrie 2003, Timişoara. (poster); d) D.-M. Sabou, I Bâldea, “On the Kinetics of Thiolactic Acid Oxidation by Cr(VI), V(V) and Fe(Cn)6
3- in Acidic Media”, A XIII-a Conferinta Internationala de Chimie si Inginerie Chimica, 13 - 15 septembrie 2003, Bucureşti. (poster)
299. a). R. N. Bose, S. Moghaddas, E. Gelerinter, „Long-lived chromium(IV) and chromium(V) metabolites in the chromium(VI)-glutathione reaction: NMR, ESR, HPLC, and kinetic characterization” Inorg. Chem, 1992, 31(11), 1987-1994; b). S. Moghaddas, E. Gelerinter, R. N. Bose, „Mechanisms of formation and decomposition of hypervalent chromium metabolites in the glutathione-chromium(VI) reaction” J. Inorg. Biochem., 1995, 57, 135-146.
300. T. Carrington, „Estimation of rate constants from growth and decay data” Int. J. Chem. Kinet., 1982, 14(5), 517-534.
301. a) I. Bâldea, D.-M. Sabou, A. Csavdari, “One-Plus Rate Equation, an Useful Tool to Elucidate the Reaction Mechanism”, Studia Universitatis Babeş-Bolyai, Ser. Chem., 2007, 52(1), 19-34; b) A. Csavdari, I. Bâldea, D.-M. Sabou, “Oxidation of DL-Methionine (2-Amino-4-ethylthiobutanoic Acid) by Chromate. Mechanistic Interpretation on the Base of an One-Plus Rate Equation”, Studia Universitatis Babeş-Bolyai, Ser. Chem., 2007, 52(3), 113-120.
302. a) J. H. Espenson, „Oxidation of transition metal complexes by chromium (VI)” Accounts Chem. Rev. 1970, 3, 347-353; b). A. Levina, L. Zhang, P. A. Lay, “Structure and Reactivity of a Chromium(V) Glutathione Complex” Inorg. Chem. 2003, 42(3), 767-784.
303. D.-M. Sabou, I. Bâldea, „Kinetics of thiolactic acid oxidation by decavanadate and VO2+ in acidic
media”, Studia Univ. Babeş-Bolyai, Ser. Chem., 2004, 49(1), 55-64. 304. Ioan Bâldea, Dana-Maria Sabou, Alexandra Csavdari „Oxidation of 2-mercaptopropionic acid by
hexacyanoferrate-(III). Mechanistic interpretation on the basis of one-plus rate equation.” Revue Roumaine de Chimie, 2009, 54(10), 791–798.
305. a) I. Bâldea, D. M. Sabou, „The Kinetic Study on the Oxidation of Glutathione by Cr(VI) in Acidic Media”, A 12-a Conferinta Internationala de Chimie şi Inginerie Chimica din Romania, Universitatea Politehnica Bucureşti, Facultatea de Chimie Industriala, 13 - 15 septembrie 2001. (poster); b) D.-M. Sabou, I Baldea, “Glutahione Oxidation by Chromate in Acidic Medium. Kinetic Aspects and some Reaction Intermediates.”, Conferinta internationala “Several aspects of Biology, Chemistry, Informatics, Mathematics and Physics”, 11-13 noiembrie 2005, Oradea. (poster)
306. I. Bâldea, D.-M. Sabou, „The reaction between chromate and thiols. VI. The oxidation of benzenethiol and α-toluenethiol in acetic acid solutions”, Rev. Roum. Chim., 2000, 45(6), 537-544.