B7: Tides, rotation and orbit B7.1 Tides - Page Not...
21
Geophysics 210 September 2008 1 B7: Tides, rotation and orbit B7.1 Tides • Tides on the Earth arise from the gravitational influence of the Moon and Sun. This results in motion of seawater and also in changes in gravity that can influence gravity surveys. • Effect of sun and moon are similar, so they will initially be considered separately. • Tidal range can exceed 18 m in coastal locations such as the Bay of Fundy in Nova Scotia. B7.1.1 Lunar tides in the ocean • Earth and moon revolve around their common centre of mass which is located a distance c from the centre of the Earth. • If M E = 5.97 10 24 kg, M M = 7.36 10 22 kg and R = 384400000 m Show that c = 4678 km • To simplify the computation, must choose an appropriate reference frame. Answer should be the same in any reference frame, so we can make life simple by choosing a reference frame that does not rotate and which is centered at the centre-of-mass of the Earth-Moon system. • In this frame of reference, the Earth translates and does not rotate. Thus all points on Earth move in a small circle with the same radius. See animation in Figure 7 at http://www.vialattea.net/maree/eng/index.htm for a clear demonstration. • Centrifugal motion is thus the same for all points on surface of Earth.
-
Upload
nguyenkhanh -
Category
Documents
-
view
216 -
download
1
Transcript of B7: Tides, rotation and orbit B7.1 Tides - Page Not...
Geophysics 210 September 2008
1
B7: Tides, rotation and orbit B7.1 Tides
• Tides on the Earth arise from the gravitational influence of the Moon and Sun. This results in motion of seawater and also in changes in gravity that can influence gravity surveys.
• Effect of sun and moon are similar, so they will initially be considered separately.
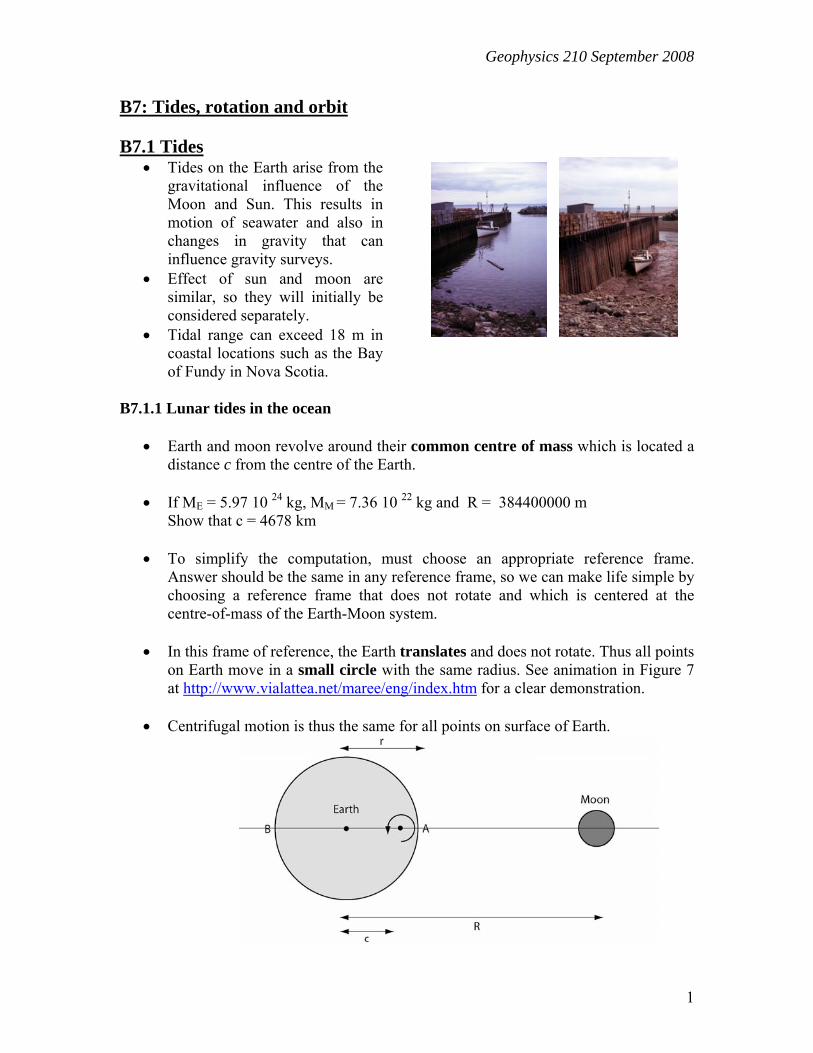
• Tidal range can exceed 18 m in coastal locations such as the Bay of Fundy in Nova Scotia.
B7.1.1 Lunar tides in the ocean
• Earth and moon revolve around their common centre of mass which is located a distance c from the centre of the Earth.
• If ME = 5.97 10 24 kg, MM = 7.36 10 22 kg and R = 384400000 m
Show that c = 4678 km
• To simplify the computation, must choose an appropriate reference frame. Answer should be the same in any reference frame, so we can make life simple by choosing a reference frame that does not rotate and which is centered at the centre-of-mass of the Earth-Moon system.
• In this frame of reference, the Earth translates and does not rotate. Thus all points
on Earth move in a small circle with the same radius. See animation in Figure 7 at http://www.vialattea.net/maree/eng/index.htm for a clear demonstration.
• Centrifugal motion is thus the same for all points on surface of Earth.
Geophysics 210 September 2008
2
• However, pull of gravity varies across the surface of the Earth. This can be illustrated by comparing pull of gravity at ‘A’ and ‘B’ with the value at the centre of the Earth. At point ‘A’ can show that the net acceleration due to the moon is :
22)( RGM
rRGM
A MMA −
−= = 0.113 milligals
Similarly at point B, 22)( RGM
rRGMA MM
B −+
= = -0.107 milligals
• Note the sign difference. This corresponds to a 6% reduction in the acceleration
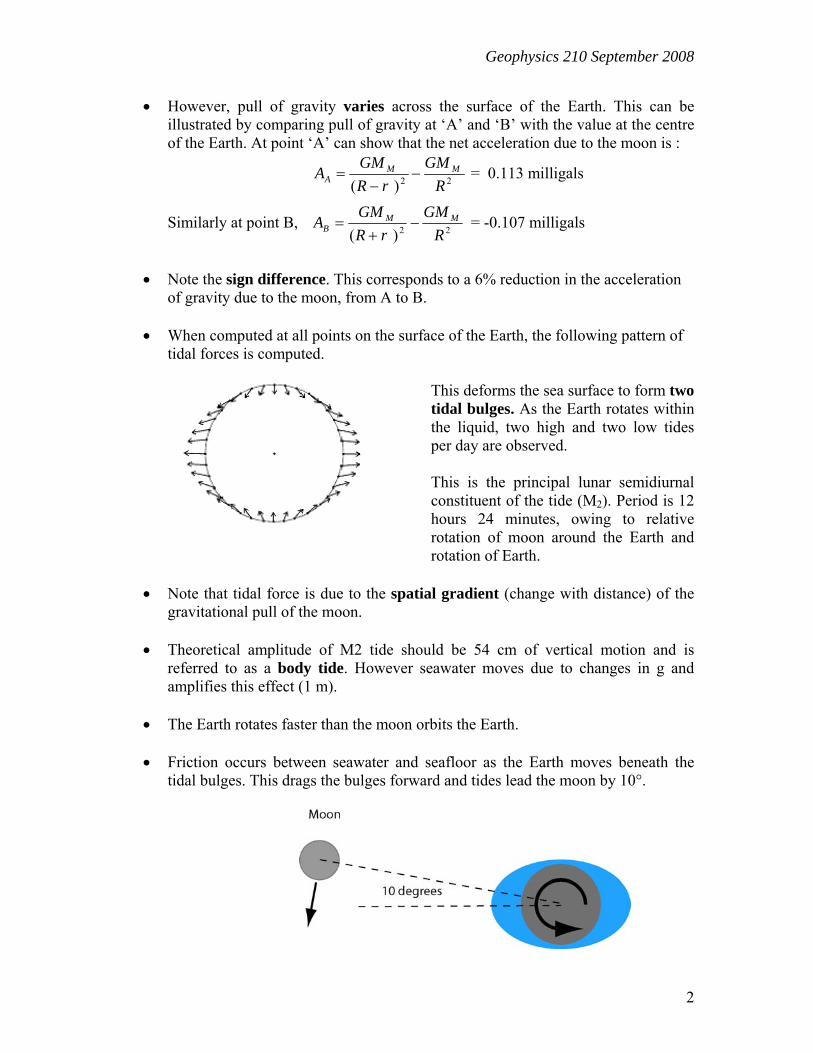
of gravity due to the moon, from A to B. • When computed at all points on the surface of the Earth, the following pattern of
tidal forces is computed.
This deforms the sea surface to form two tidal bulges. As the Earth rotates within the liquid, two high and two low tides per day are observed. This is the principal lunar semidiurnal constituent of the tide (M2). Period is 12 hours 24 minutes, owing to relative rotation of moon around the Earth and rotation of Earth.
• Note that tidal force is due to the spatial gradient (change with distance) of the gravitational pull of the moon.
• Theoretical amplitude of M2 tide should be 54 cm of vertical motion and is
referred to as a body tide. However seawater moves due to changes in g and amplifies this effect (1 m).
• The Earth rotates faster than the moon orbits the Earth. • Friction occurs between seawater and seafloor as the Earth moves beneath the
tidal bulges. This drags the bulges forward and tides lead the moon by 10°.

Geophysics 210 September 2008
3
• Energy loss slows the Earths rotation by 0.0023 seconds per century (i.e. days get
longer).
• Another effect is that the moon is accelerated and moves into a larger orbit. This lunar recession increases Earth-moon distance by 3.8 cm per year. This has been measured by laser ranging experiments from Apollo and Lunakhod missions to the moon.
B7.1.2 Solar tides in the ocean
• Similar physics to that considered above for the moon • Using mass of sun, Ms = 1.988 1030 kg and an average Earth-Sun distance
Rs = 1.5 1011 m can show that for the S2 tide:
22)( s
S
S
SA R
GMrR
GMA −
−= = 0.05012 milligals
and
22)( s
S
S
SB R
GMrR
GMA −
+= = -0.05011 milligals
• This corresponds to a 0.017 % reduction in the gravitational pull of the sun from
point A to point B.
• Note that the gravitational attraction of the sun is 180 times stronger than that of the moon. However, the attraction of the moon varies more rapidly with distance (higher spatial gradient), giving a larger tidal force.
Relative magnitude of M2 and S2 tides
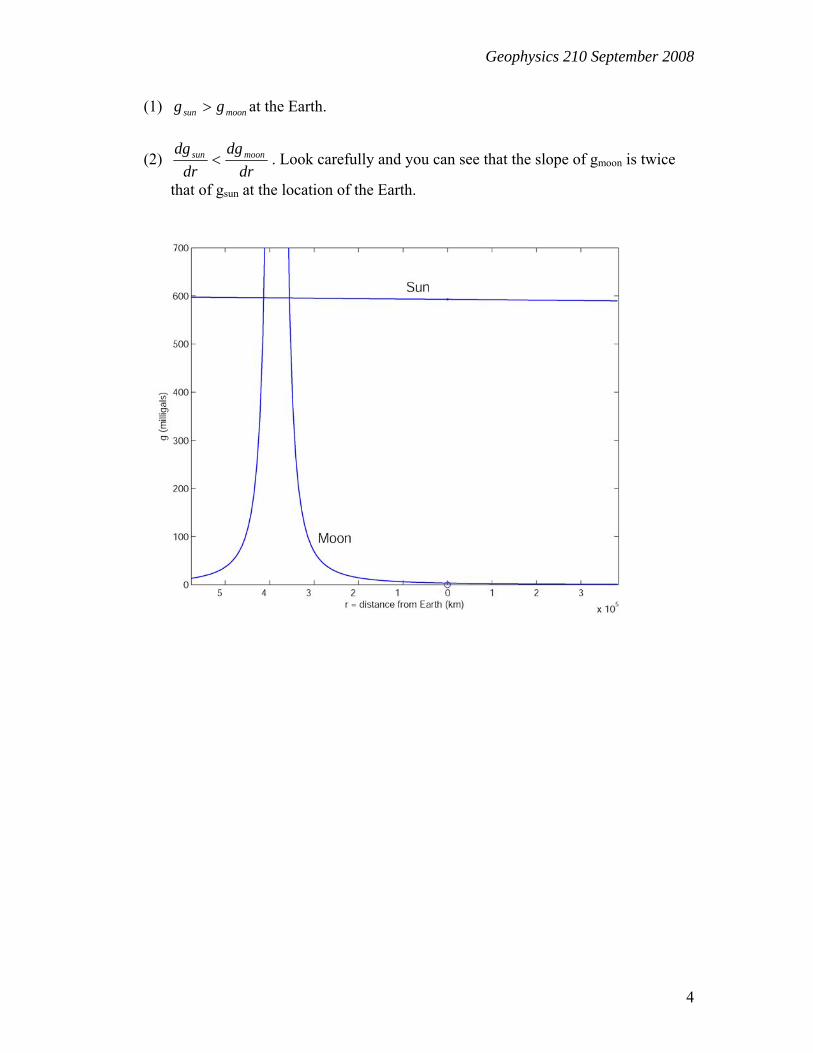
The tides are due to the gradient of gravity forces (i.e. how much they vary per metre). Illustrated below where the acceleration of gravity (g) produced by the moon and sun is shown as a function of distance from the Earth Note that:
Geophysics 210 September 2008
4
(1) moonsun gg > at the Earth.
(2) dr
dgdr
dg moonsun < . Look carefully and you can see that the slope of gmoon is twice
that of gsun at the location of the Earth.
Geophysics 210 September 2008
5
B7.1.3 Actual tides in the ocean
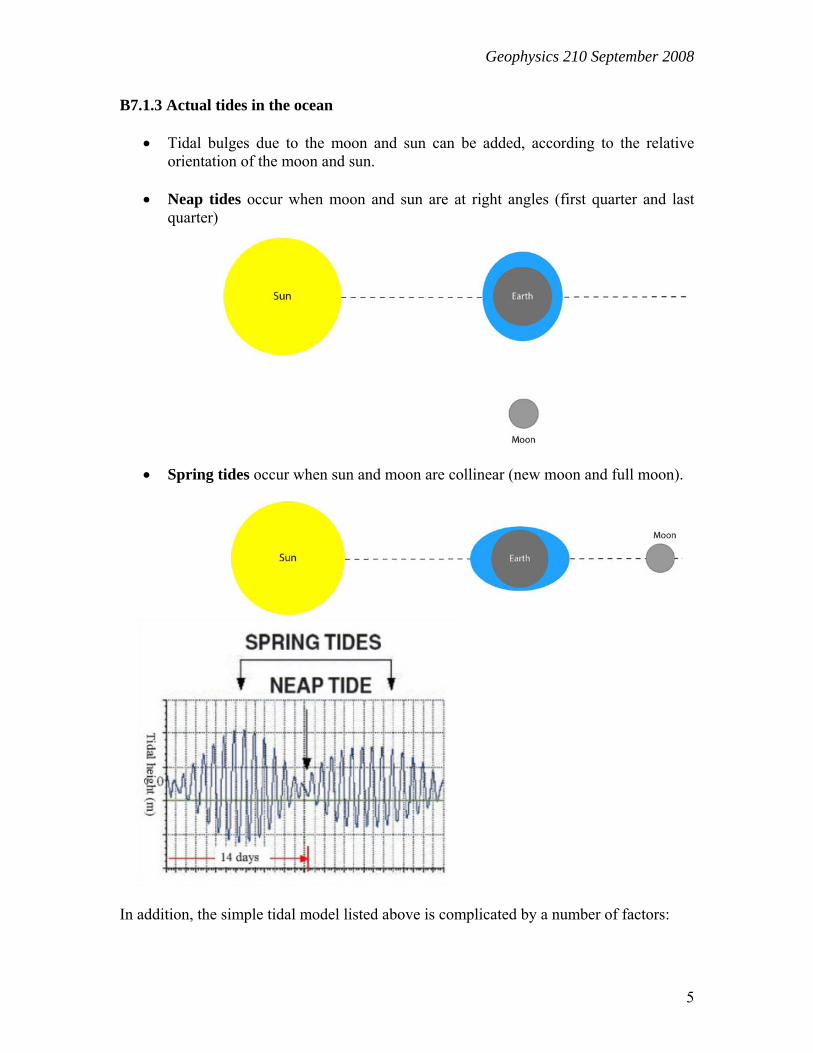
• Tidal bulges due to the moon and sun can be added, according to the relative orientation of the moon and sun.
• Neap tides occur when moon and sun are at right angles (first quarter and last
quarter)
• Spring tides occur when sun and moon are collinear (new moon and full moon).
In addition, the simple tidal model listed above is complicated by a number of factors:
Geophysics 210 September 2008
6
• axis of rotation is inclined at 23° • variable ocean depth, coastlines • Earth-moon and Earth-Sun distances vary, since both orbits are elliptical • Earth is an ellipsoid, not a sphere • Factors such as rotation of Earth, variable water depth and coastlines can amplify
this even more. • Coastlines result in a complicated pattern of tides and resonance effects (e.g.
Rossby waves) can develop.
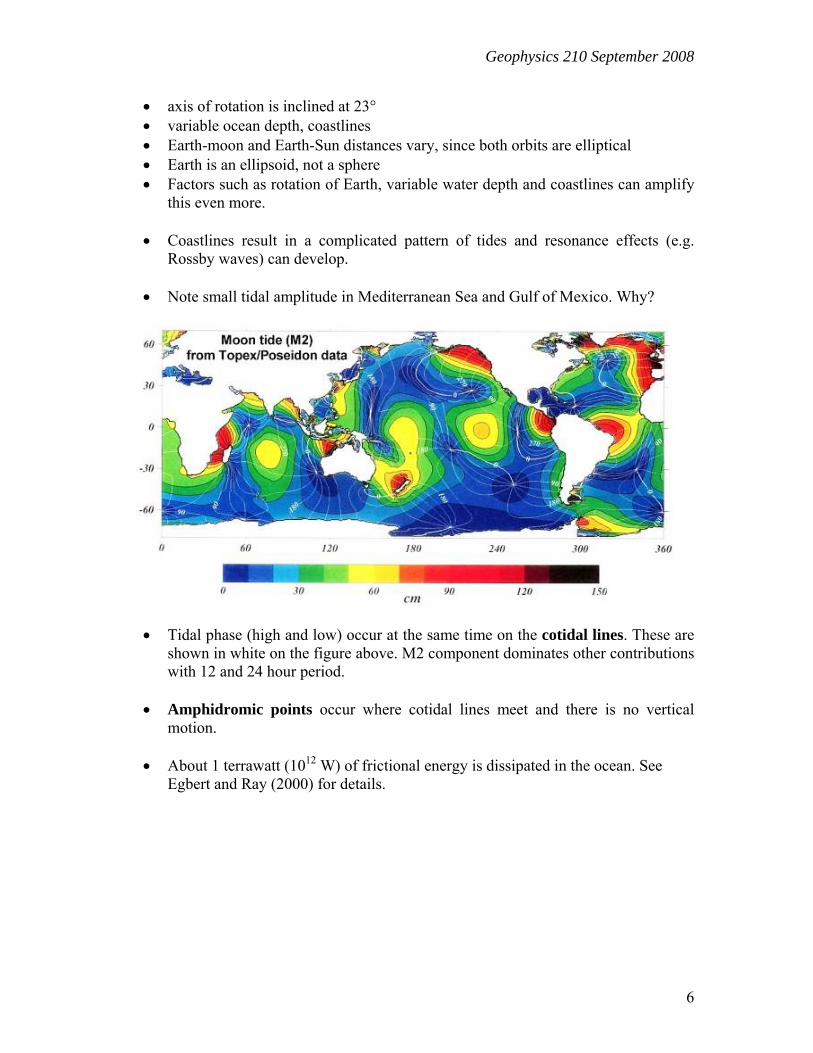
• Note small tidal amplitude in Mediterranean Sea and Gulf of Mexico. Why?
• Tidal phase (high and low) occur at the same time on the cotidal lines. These are shown in white on the figure above. M2 component dominates other contributions with 12 and 24 hour period.
• Amphidromic points occur where cotidal lines meet and there is no vertical
motion.
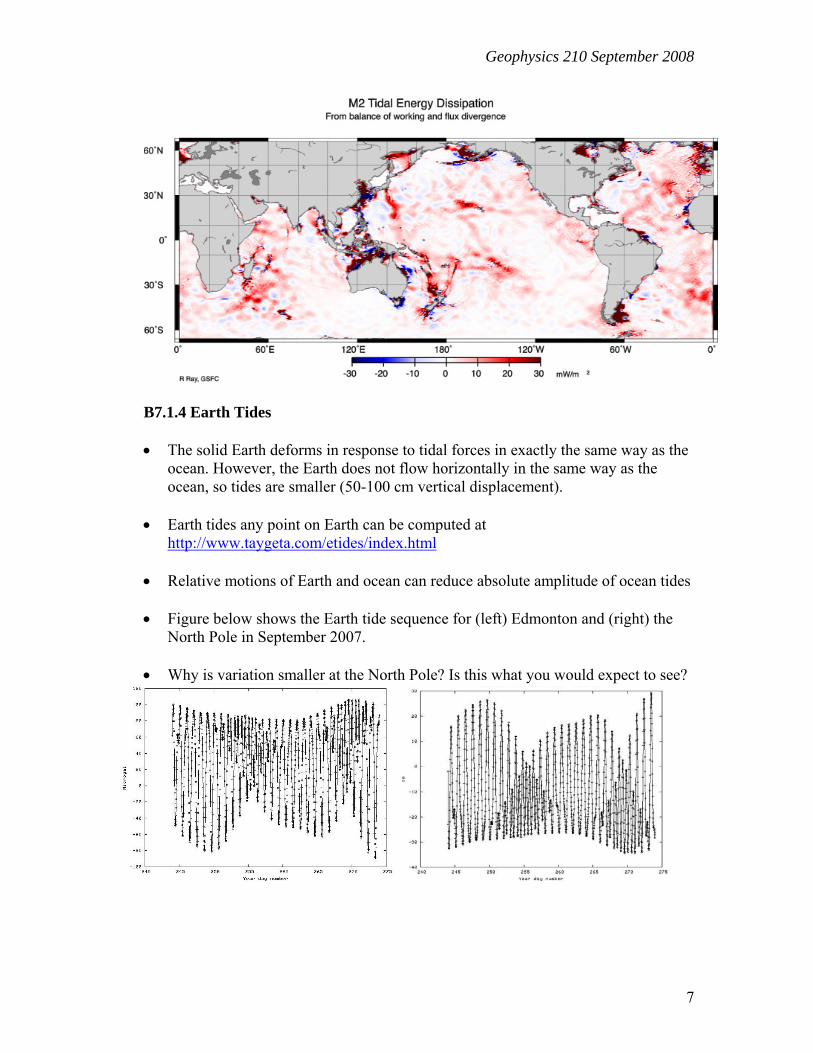
• About 1 terrawatt (1012 W) of frictional energy is dissipated in the ocean. See Egbert and Ray (2000) for details.
Geophysics 210 September 2008
7
B7.1.4 Earth Tides
• The solid Earth deforms in response to tidal forces in exactly the same way as the
ocean. However, the Earth does not flow horizontally in the same way as the ocean, so tides are smaller (50-100 cm vertical displacement).
• Earth tides any point on Earth can be computed at
http://www.taygeta.com/etides/index.html
• Relative motions of Earth and ocean can reduce absolute amplitude of ocean tides
• Figure below shows the Earth tide sequence for (left) Edmonton and (right) the North Pole in September 2007.
• Why is variation smaller at the North Pole? Is this what you would expect to see?
Geophysics 210 September 2008
8
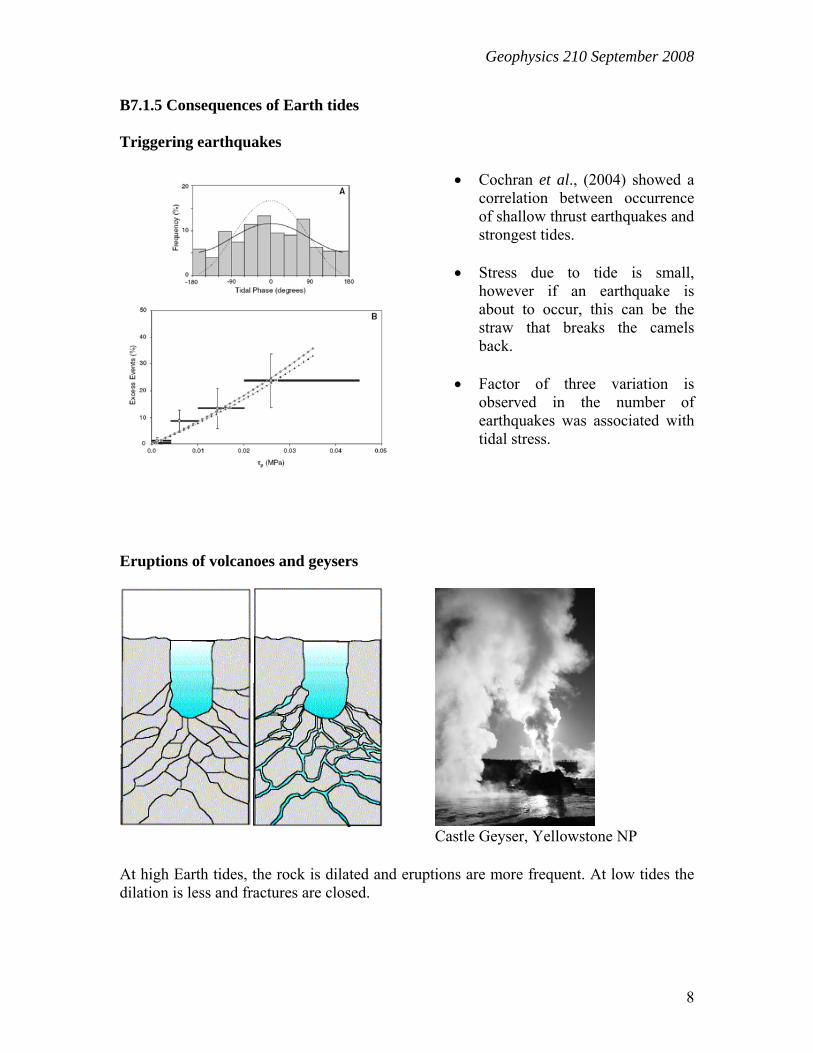
B7.1.5 Consequences of Earth tides Triggering earthquakes
• Cochran et al., (2004) showed a correlation between occurrence of shallow thrust earthquakes and strongest tides.
• Stress due to tide is small,
however if an earthquake is about to occur, this can be the straw that breaks the camels back.
• Factor of three variation is
observed in the number of earthquakes was associated with tidal stress.
Eruptions of volcanoes and geysers
Castle Geyser, Yellowstone NP
At high Earth tides, the rock is dilated and eruptions are more frequent. At low tides the dilation is less and fractures are closed.
Geophysics 210 September 2008
9
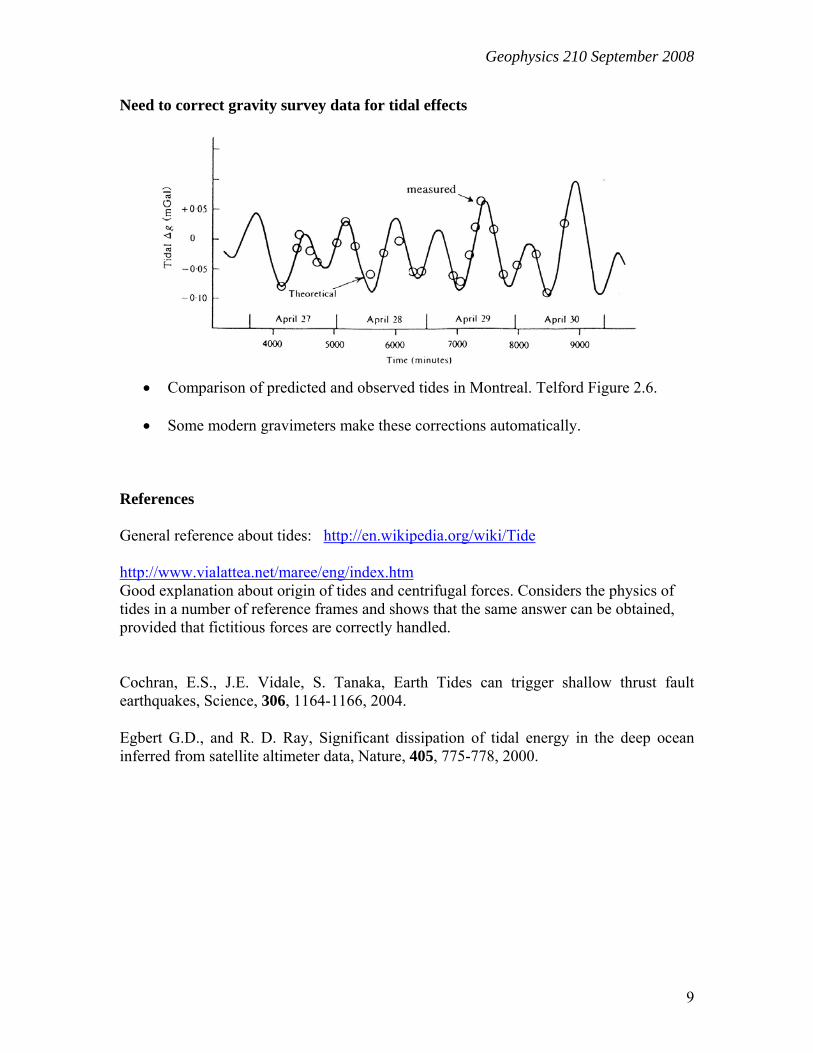
Need to correct gravity survey data for tidal effects
• Comparison of predicted and observed tides in Montreal. Telford Figure 2.6.
• Some modern gravimeters make these corrections automatically.
References General reference about tides: http://en.wikipedia.org/wiki/Tide http://www.vialattea.net/maree/eng/index.htm Good explanation about origin of tides and centrifugal forces. Considers the physics of tides in a number of reference frames and shows that the same answer can be obtained, provided that fictitious forces are correctly handled. Cochran, E.S., J.E. Vidale, S. Tanaka, Earth Tides can trigger shallow thrust fault earthquakes, Science, 306, 1164-1166, 2004.
Egbert G.D., and R. D. Ray, Significant dissipation of tidal energy in the deep ocean inferred from satellite altimeter data, Nature, 405, 775-778, 2000.
Geophysics 210 September 2008
10
B7.2 Changes in length of day (LOD) The Earth rotates because of angular momentum that was acquired by the solar system as it condensed from a rotating gas cloud into a protoplanetary disk and then individual planets and moons. This momentum has been conserved over the life of the solar system. B7.2.1 Present situation
Variation with latitude and Julian Day http://en.wikipedia.org/wiki/Day_length
Geographical extent of day and night as seasons vary: http://www.fourmilab.ch/cgi-bin/uncgi/Earth/action?opt=-p&img=learth.evif
B7.2.2 Variations over geological timescales
Archean Early Earth may have rotated every 8 hours
PreCambrian Tidal rhythmites can record number of days per year and per month. Rocks from Australia consistent with LOD = 21.9 hours at 620 Ma (Williams, 1997 and 2000). Record spanned 60 years.
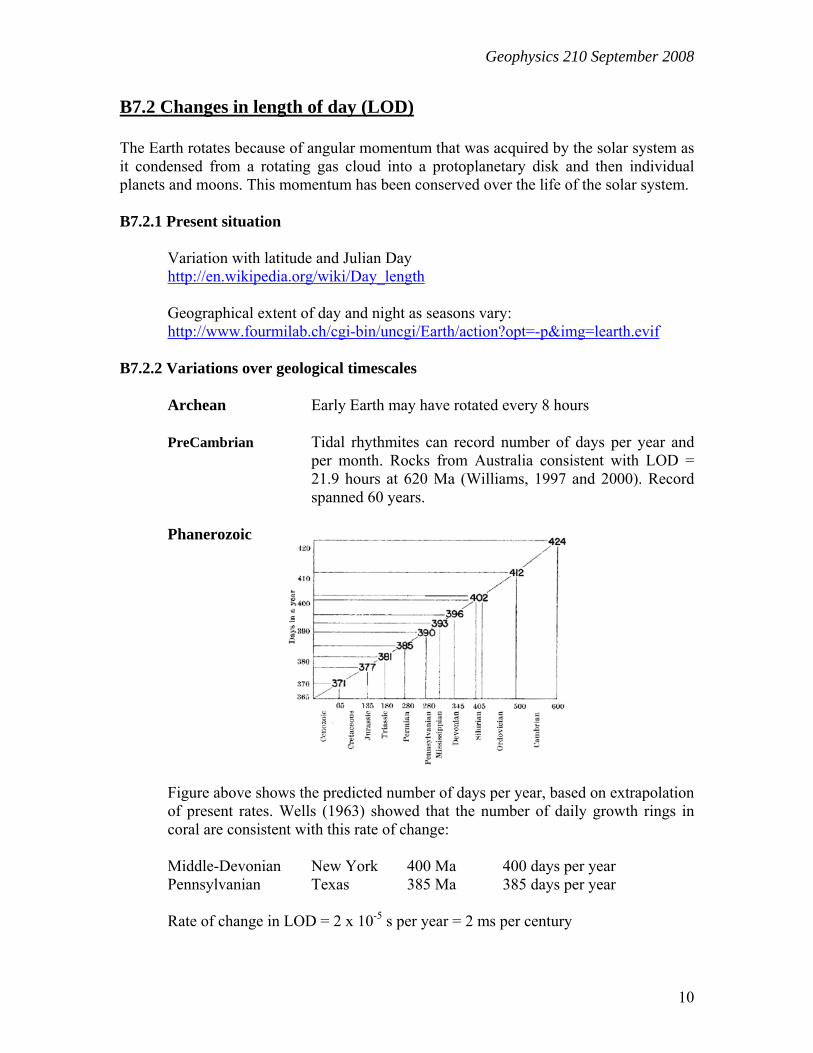
Phanerozoic
Figure above shows the predicted number of days per year, based on extrapolation of present rates. Wells (1963) showed that the number of daily growth rings in coral are consistent with this rate of change: Middle-Devonian New York 400 Ma 400 days per year Pennsylvanian Texas 385 Ma 385 days per year Rate of change in LOD = 2 x 10⁻⁵ s per year = 2 ms per century
Geophysics 210 September 2008
11
B7.2.3 variations over historical record
• Historical increase in the length of day (LOD) is around 2.4 ms per century.
• This rate of change seems small on a timescales of millennia, but the actual effect is significant because the change is integrated as shown below.
• Stephenson (2003) shows that this factor is needed to account for the astronomical records made by many ancient civilizations (Babylonians, Greeks, Chinese, Arabs).
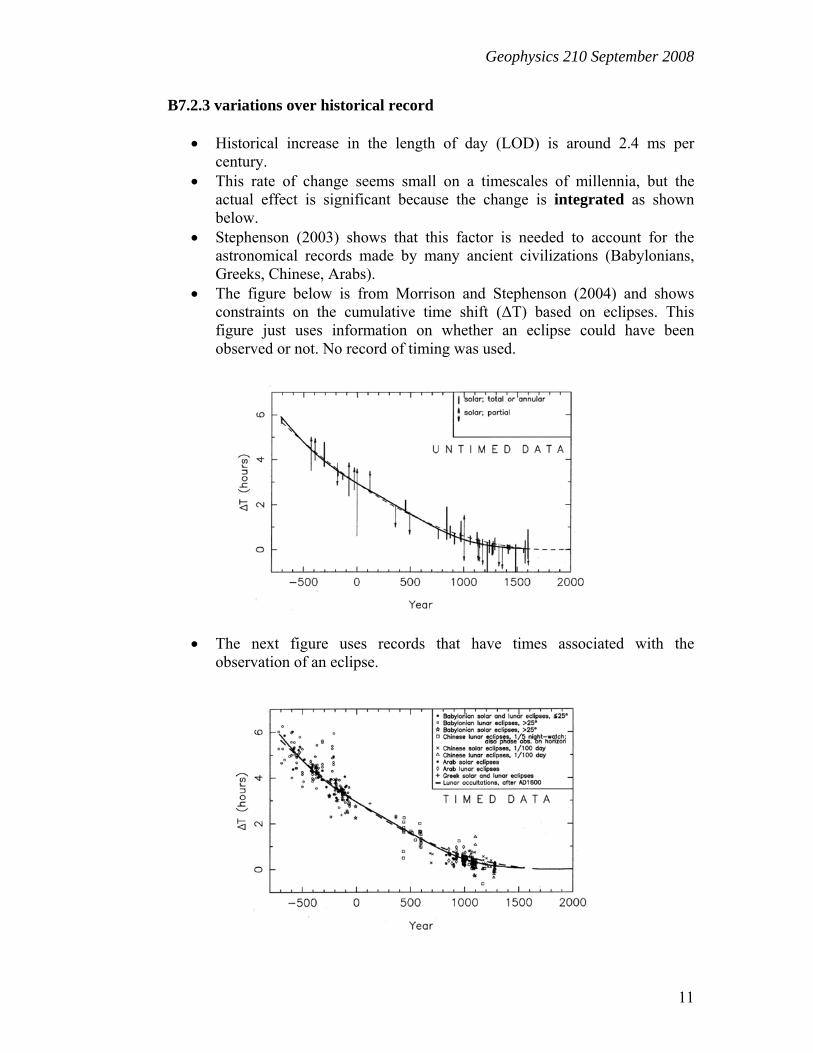
• The figure below is from Morrison and Stephenson (2004) and shows constraints on the cumulative time shift (ΔT) based on eclipses. This figure just uses information on whether an eclipse could have been observed or not. No record of timing was used.
• The next figure uses records that have times associated with the observation of an eclipse.
Geophysics 210 September 2008
12
• Assume LOD changes at rate, r = 2 x 10⁻⁵ s per year. Consider a year at a time T in the past. The time delay in that year = 365 T r seconds.
• Thus total time delay (seconds) from present day back to a time T is
2
0
2
1822
365365 rTtrdtrtTTt
t
Tt
ot
=⎥⎦
⎤⎢⎣
⎡==Δ
=
=
=
=∫
• Using a value of T = 2000 years gives a delay of 14000 seconds ( 4 hours), in agreement with observations above.
Explanation for change in length of day (long term trends)
• Angular momentum of the Earth-Moon system is conserved. • The tidal bulges are not collinear with the Moon (B7.1) and this results in
a torque which slows down the Earth's rotation, i.e. the days are getting longer.
• While kinetic energy (orbital motion) is dissipated and converted to heat, the angular momentum of the Earth-Moon system must be conserved. The loss of angular momentum from the Earth must be balanced by an increase in momentum for the moon. This results in the moon moving into a higher orbit at a rate of 3.7 cm per year. This is measured by satellite laser ranging and lunar laser ranging that measure the Earth-Moon distance to a precision of 1 part in 10 billion.
• This rate could not have persisted for the entire age of the Earth. Present day configuration of oceans and continents may be causing a high rate of tidal dissipation at present.
• The recent rate of change in LOD may be due to mass redistribution caused by isostatic rebound and sea level changes (see Peltier, 1988).
B7.2.4 Recent records
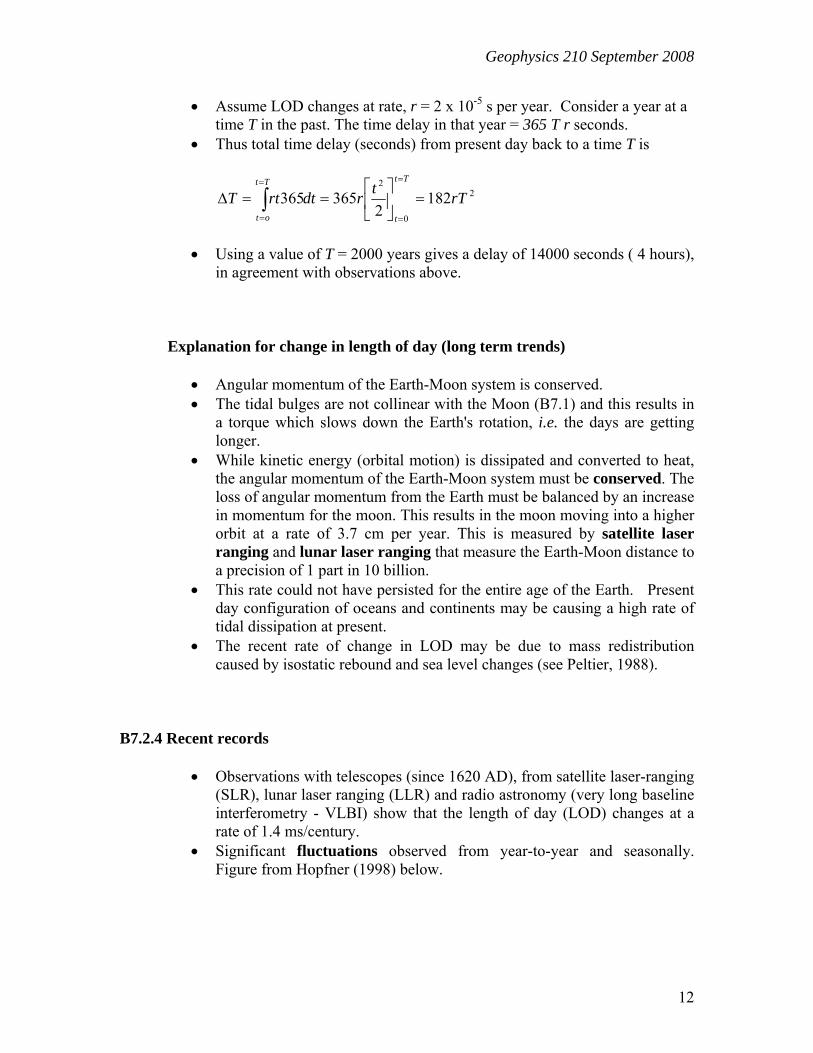
• Observations with telescopes (since 1620 AD), from satellite laser-ranging (SLR), lunar laser ranging (LLR) and radio astronomy (very long baseline interferometry - VLBI) show that the length of day (LOD) changes at a rate of 1.4 ms/century.
• Significant fluctuations observed from year-to-year and seasonally. Figure from Hopfner (1998) below.
Geophysics 210 September 2008
13
Explanation for short term changes in LOD
• Climatic effects - exchanges of angular momentum between the atmosphere and the solid earth. Average wind speed up - rotation rate down and vice versa.
• Effect of fluid flow in core? Angular momentum exchanged between core and mantle. Depends on coupling that is caused by topographic irregularities at the core-mantle boundary? Electromagnetic coupling?
• Change in LOD after the 2004 Sumatra earthquake (Chao and Gross, 2005)
Geophysics 210 September 2008
14
B7.3 Orbital changes B7.3.1 Basic orbital parameters http://www.phy.hk/wiki/englishhtm/Motion.htm B7.3.2 Temporal changes in orbital parameters
• The Earth’s orbit changes over time, mainly because of gravitational interactions between the Earth and the other planets.
• These orbital changes cause changes in the amount of solar energy received by the Earth.
• This insolation at high latitudes is believed to control the growth and retreat of polar ice sheets.
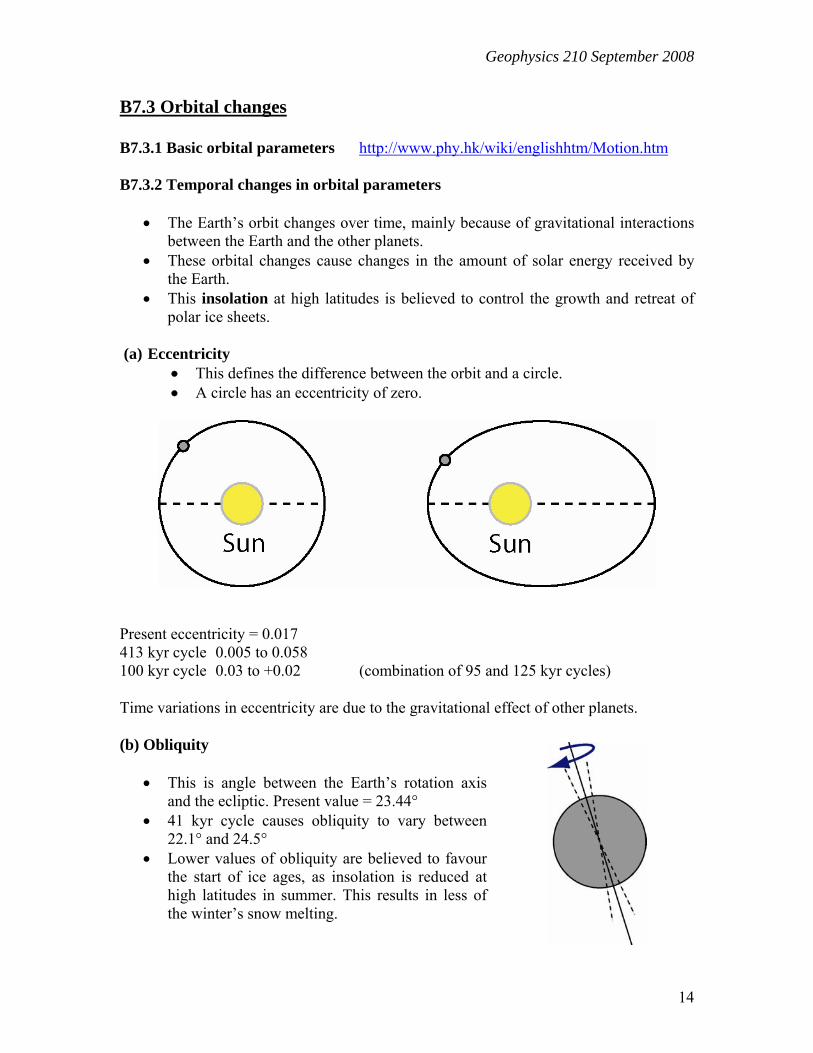
(a) Eccentricity • This defines the difference between the orbit and a circle. • A circle has an eccentricity of zero.
Present eccentricity = 0.017 413 kyr cycle 0.005 to 0.058 100 kyr cycle 0.03 to +0.02 (combination of 95 and 125 kyr cycles)
Time variations in eccentricity are due to the gravitational effect of other planets.
(b) Obliquity
• This is angle between the Earth’s rotation axis and the ecliptic. Present value = 23.44°
• 41 kyr cycle causes obliquity to vary between 22.1° and 24.5°
• Lower values of obliquity are believed to favour the start of ice ages, as insolation is reduced at high latitudes in summer. This results in less of the winter’s snow melting.
Geophysics 210 September 2008
15
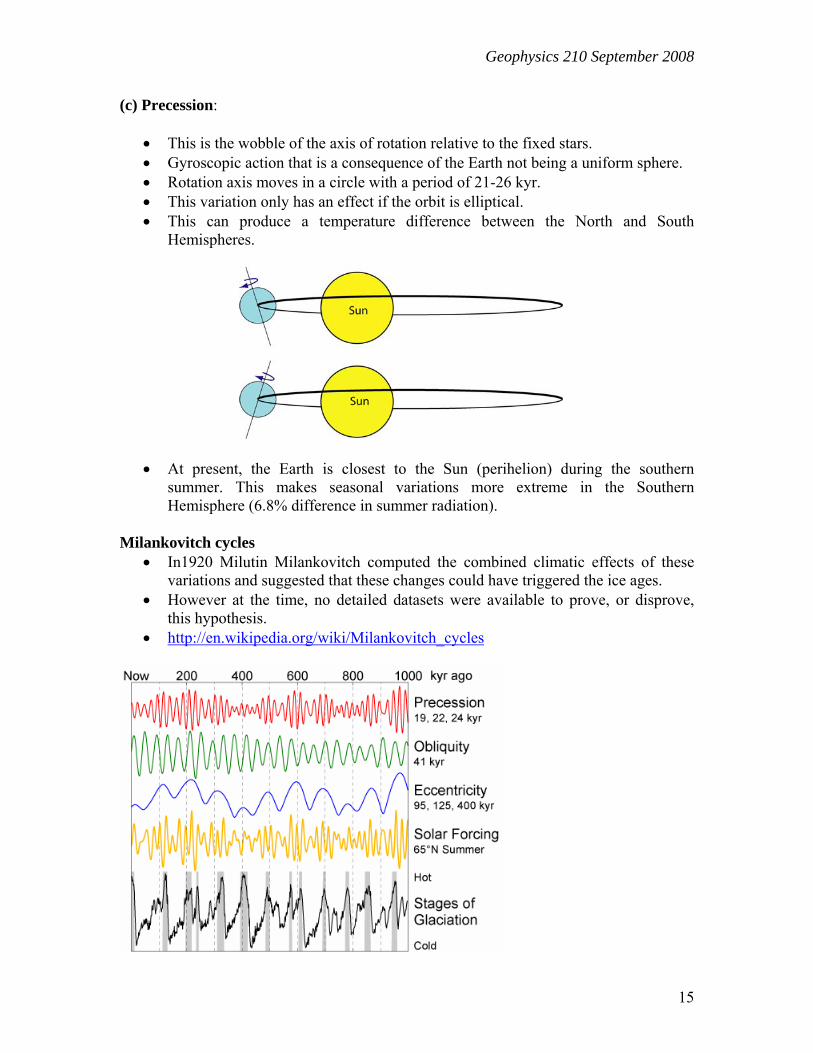
(c) Precession:
• This is the wobble of the axis of rotation relative to the fixed stars. • Gyroscopic action that is a consequence of the Earth not being a uniform sphere. • Rotation axis moves in a circle with a period of 21-26 kyr. • This variation only has an effect if the orbit is elliptical. • This can produce a temperature difference between the North and South
Hemispheres.
• At present, the Earth is closest to the Sun (perihelion) during the southern summer. This makes seasonal variations more extreme in the Southern Hemisphere (6.8% difference in summer radiation).
Milankovitch cycles • In1920 Milutin Milankovitch computed the combined climatic effects of these
variations and suggested that these changes could have triggered the ice ages. • However at the time, no detailed datasets were available to prove, or disprove,
this hypothesis. • http://en.wikipedia.org/wiki/Milankovitch_cycles
Geophysics 210 September 2008
16
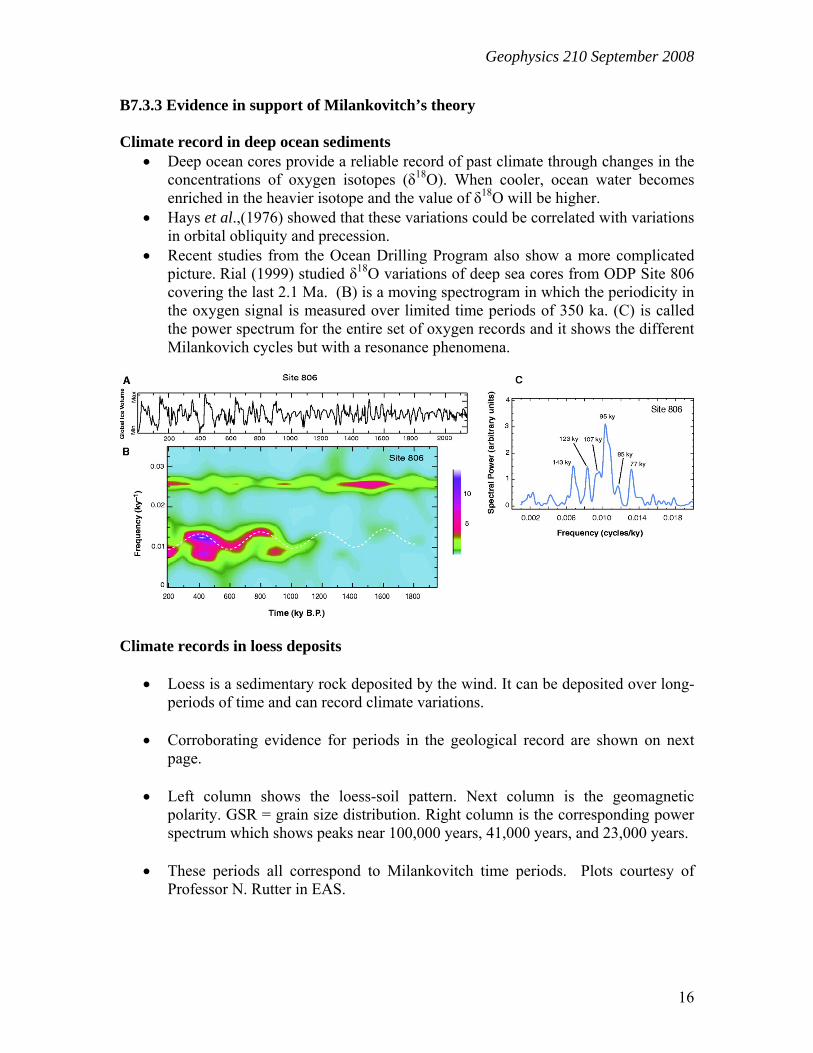
B7.3.3 Evidence in support of Milankovitch’s theory Climate record in deep ocean sediments
• Deep ocean cores provide a reliable record of past climate through changes in the concentrations of oxygen isotopes (δ18O). When cooler, ocean water becomes enriched in the heavier isotope and the value of δ18O will be higher.
• Hays et al.,(1976) showed that these variations could be correlated with variations in orbital obliquity and precession.
• Recent studies from the Ocean Drilling Program also show a more complicated picture. Rial (1999) studied δ18O variations of deep sea cores from ODP Site 806 covering the last 2.1 Ma. (B) is a moving spectrogram in which the periodicity in the oxygen signal is measured over limited time periods of 350 ka. (C) is called the power spectrum for the entire set of oxygen records and it shows the different Milankovich cycles but with a resonance phenomena.
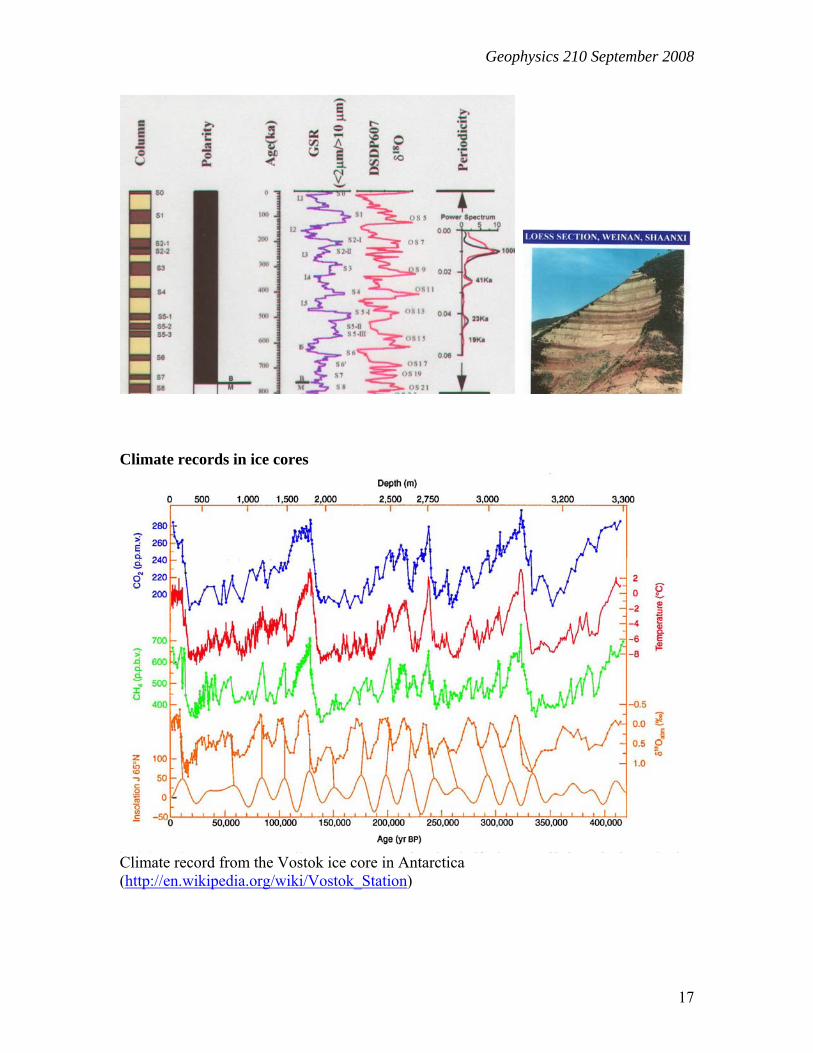
Climate records in loess deposits
• Loess is a sedimentary rock deposited by the wind. It can be deposited over long-periods of time and can record climate variations.
• Corroborating evidence for periods in the geological record are shown on next
page.
• Left column shows the loess-soil pattern. Next column is the geomagnetic polarity. GSR = grain size distribution. Right column is the corresponding power spectrum which shows peaks near 100,000 years, 41,000 years, and 23,000 years.
• These periods all correspond to Milankovitch time periods. Plots courtesy of
Professor N. Rutter in EAS.
Geophysics 210 September 2008
17
Climate records in ice cores
Climate record from the Vostok ice core in Antarctica (http://en.wikipedia.org/wiki/Vostok_Station)
Geophysics 210 September 2008
18
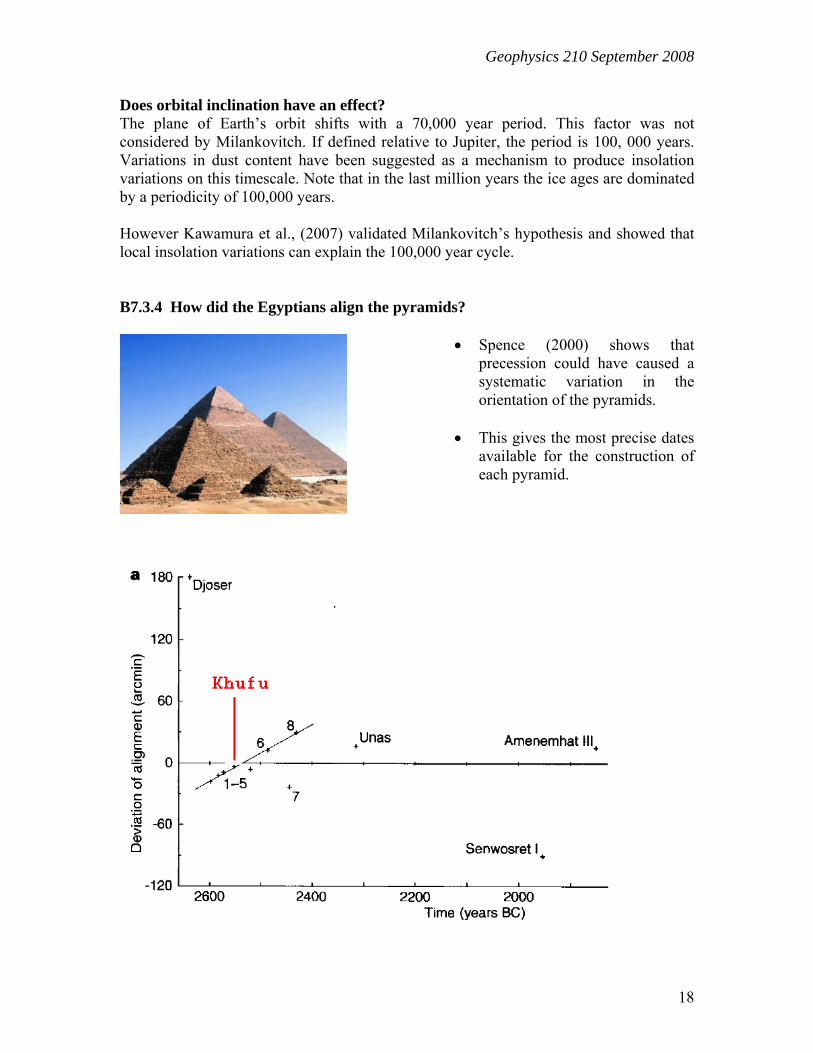
Does orbital inclination have an effect? The plane of Earth’s orbit shifts with a 70,000 year period. This factor was not considered by Milankovitch. If defined relative to Jupiter, the period is 100, 000 years. Variations in dust content have been suggested as a mechanism to produce insolation variations on this timescale. Note that in the last million years the ice ages are dominated by a periodicity of 100,000 years. However Kawamura et al., (2007) validated Milankovitch’s hypothesis and showed that local insolation variations can explain the 100,000 year cycle. B7.3.4 How did the Egyptians align the pyramids?
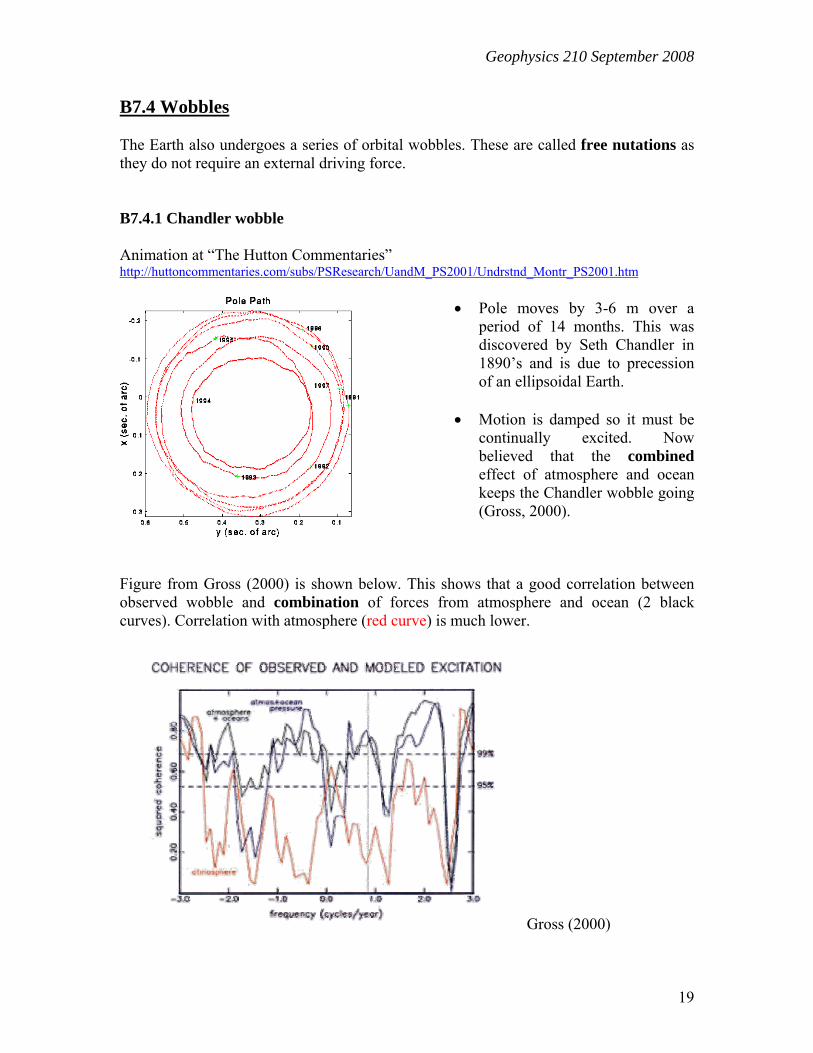
• Spence (2000) shows that precession could have caused a systematic variation in the orientation of the pyramids.
• This gives the most precise dates
available for the construction of each pyramid.
Geophysics 210 September 2008
19
B7.4 Wobbles The Earth also undergoes a series of orbital wobbles. These are called free nutations as they do not require an external driving force. B7.4.1 Chandler wobble Animation at “The Hutton Commentaries” http://huttoncommentaries.com/subs/PSResearch/UandM_PS2001/Undrstnd_Montr_PS2001.htm
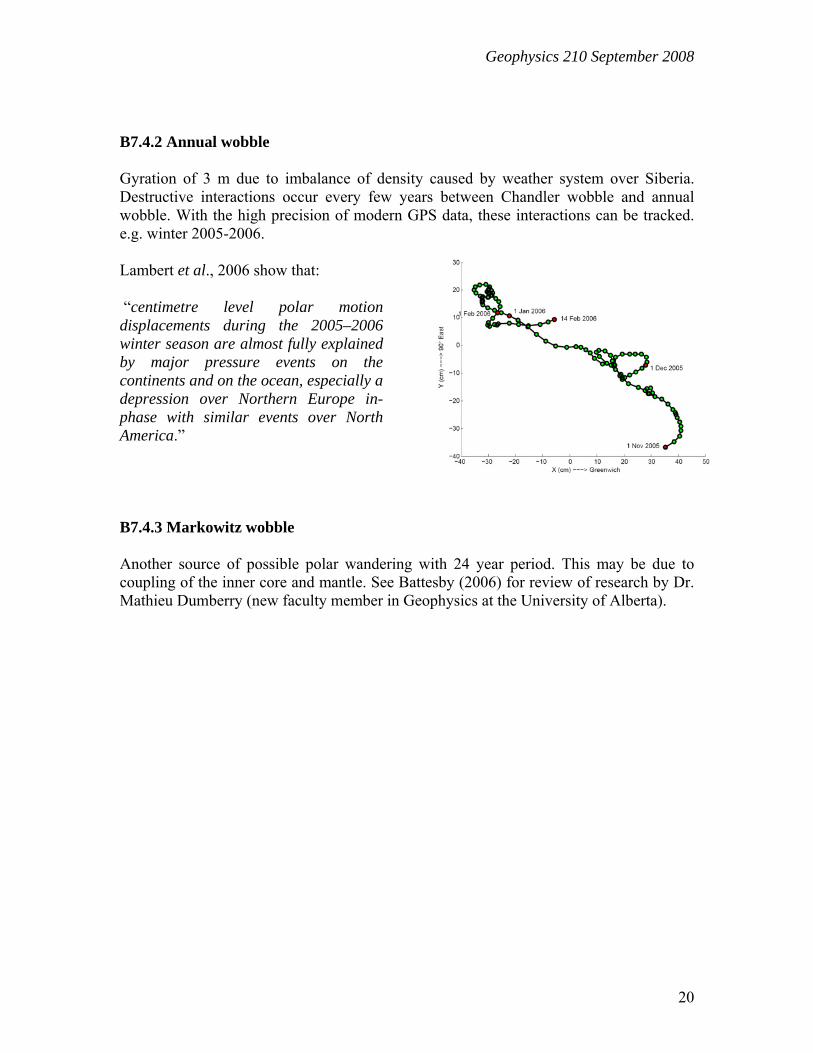
• Pole moves by 3-6 m over a period of 14 months. This was discovered by Seth Chandler in 1890’s and is due to precession of an ellipsoidal Earth.
• Motion is damped so it must be
continually excited. Now believed that the combined effect of atmosphere and ocean keeps the Chandler wobble going (Gross, 2000).
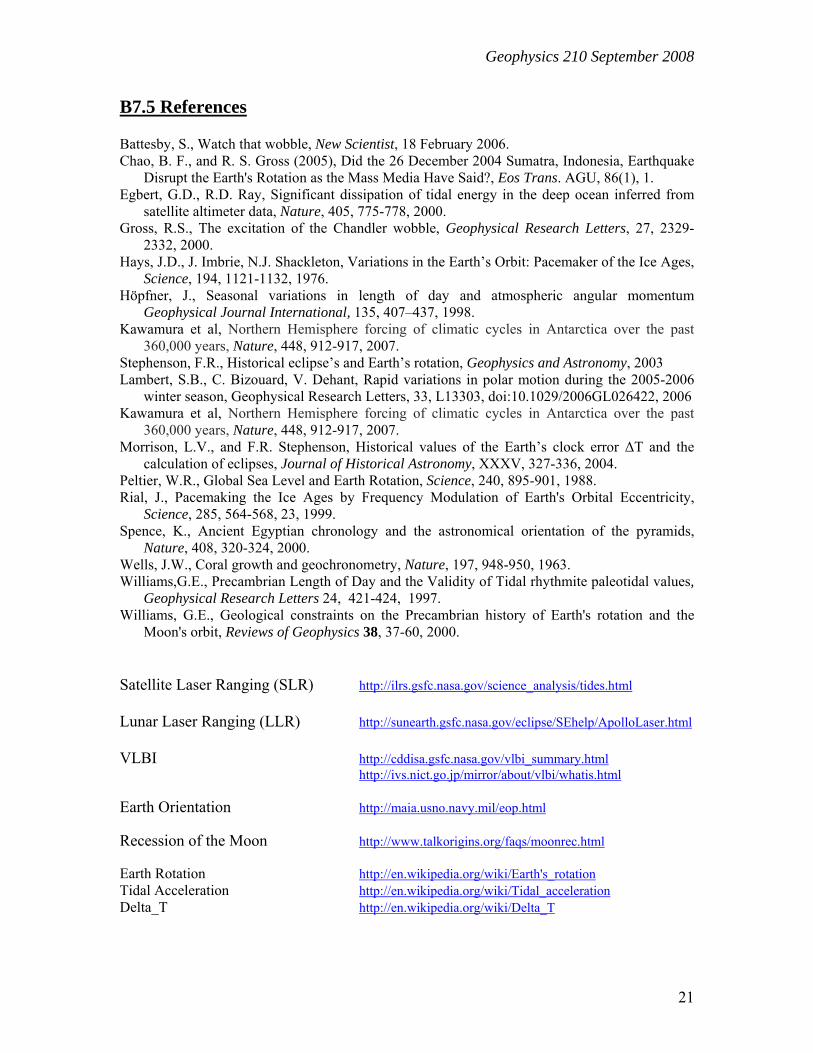
Figure from Gross (2000) is shown below. This shows that a good correlation between observed wobble and combination of forces from atmosphere and ocean (2 black curves). Correlation with atmosphere (red curve) is much lower.
Gross (2000)
Geophysics 210 September 2008
20
B7.4.2 Annual wobble Gyration of 3 m due to imbalance of density caused by weather system over Siberia.Destructive interactions occur every few years between Chandler wobble and annual wobble. With the high precision of modern GPS data, these interactions can be tracked. e.g. winter 2005-2006. Lambert et al., 2006 show that: “centimetre level polar motion displacements during the 2005–2006 winter season are almost fully explained by major pressure events on the continents and on the ocean, especially a depression over Northern Europe in-phase with similar events over North America.” B7.4.3 Markowitz wobble Another source of possible polar wandering with 24 year period. This may be due to coupling of the inner core and mantle. See Battesby (2006) for review of research by Dr. Mathieu Dumberry (new faculty member in Geophysics at the University of Alberta).
Geophysics 210 September 2008
21
B7.5 References Battesby, S., Watch that wobble, New Scientist, 18 February 2006. Chao, B. F., and R. S. Gross (2005), Did the 26 December 2004 Sumatra, Indonesia, Earthquake
Disrupt the Earth's Rotation as the Mass Media Have Said?, Eos Trans. AGU, 86(1), 1. Egbert, G.D., R.D. Ray, Significant dissipation of tidal energy in the deep ocean inferred from
satellite altimeter data, Nature, 405, 775-778, 2000. Gross, R.S., The excitation of the Chandler wobble, Geophysical Research Letters, 27, 2329-
2332, 2000. Hays, J.D., J. Imbrie, N.J. Shackleton, Variations in the Earth’s Orbit: Pacemaker of the Ice Ages,
Science, 194, 1121-1132, 1976. Höpfner, J., Seasonal variations in length of day and atmospheric angular momentum
Geophysical Journal International, 135, 407–437, 1998. Kawamura et al, Northern Hemisphere forcing of climatic cycles in Antarctica over the past
360,000 years, Nature, 448, 912-917, 2007. Stephenson, F.R., Historical eclipse’s and Earth’s rotation, Geophysics and Astronomy, 2003 Lambert, S.B., C. Bizouard, V. Dehant, Rapid variations in polar motion during the 2005-2006
winter season, Geophysical Research Letters, 33, L13303, doi:10.1029/2006GL026422, 2006 Kawamura et al, Northern Hemisphere forcing of climatic cycles in Antarctica over the past
360,000 years, Nature, 448, 912-917, 2007. Morrison, L.V., and F.R. Stephenson, Historical values of the Earth’s clock error ΔT and the
calculation of eclipses, Journal of Historical Astronomy, XXXV, 327-336, 2004. Peltier, W.R., Global Sea Level and Earth Rotation, Science, 240, 895-901, 1988. Rial, J., Pacemaking the Ice Ages by Frequency Modulation of Earth's Orbital Eccentricity,
Science, 285, 564-568, 23, 1999. Spence, K., Ancient Egyptian chronology and the astronomical orientation of the pyramids,
Nature, 408, 320-324, 2000. Wells, J.W., Coral growth and geochronometry, Nature, 197, 948-950, 1963. Williams,G.E., Precambrian Length of Day and the Validity of Tidal rhythmite paleotidal values,
Geophysical Research Letters 24, 421-424, 1997. Williams, G.E., Geological constraints on the Precambrian history of Earth's rotation and the
Moon's orbit, Reviews of Geophysics 38, 37-60, 2000. Satellite Laser Ranging (SLR) http://ilrs.gsfc.nasa.gov/science_analysis/tides.html Lunar Laser Ranging (LLR) http://sunearth.gsfc.nasa.gov/eclipse/SEhelp/ApolloLaser.html VLBI http://cddisa.gsfc.nasa.gov/vlbi_summary.html
http://ivs.nict.go.jp/mirror/about/vlbi/whatis.html
Earth Orientation http://maia.usno.navy.mil/eop.html Recession of the Moon http://www.talkorigins.org/faqs/moonrec.html Earth Rotation http://en.wikipedia.org/wiki/Earth's_rotation Tidal Acceleration http://en.wikipedia.org/wiki/Tidal_acceleration Delta_T http://en.wikipedia.org/wiki/Delta_T