B2B Marketing in 2014 - What's Changing? Joel Harrison, B2B Marketing
Copyright ©2017 NetLine Corporation. All rights reserved.B2B Marketers Start Here.
2017 State of B2B MarketingContent Consumption and Demand Report
B2B Research Report
For B2B Marketers Targeting Marketers
by NetLine Corporation
“We’ve set out on a journey to bring B2B marketers real content
insights they can’t find anywhere else. Our goal is to empower
content marketing and demand generation professionals with
powerful insights paired with sophisticated content-based lead
generation solutions to acquire more target prospects.”
Robert AlvinCEO and Founder,NetLine Corporation
“
”
2017 State of B2B Marketing Content Consumption and Demand Report for B2B Marketers NetLine Corporation
NetLine has assembled an impressive set of data in the “2017
State of B2B Marketing Content Consumption and Demand
Report.” If you need to understand the current trends in B2B
content consumption by marketing personas, including volume,
frequency, topics, etc., there is a wealth of information here.
One of the most powerful insights from the report is how the need
for a balanced content strategy at every stage of the buyer’s
journey is so important. It’s simply not good enough to have a
homogenous content creation and distribution strategy for all
aspects of the buyer’s journey. Each and every stage of that
journey now has unique content consumption behaviors and
personas involved.
Your strategy must account for the varying levels of influencers
within the buying committee who are now more commonly outside
the C-suite. Today’s content marketing is not just delivering the
right content to the right person, it’s understanding the context
of why, where, how and through what channels they want to be
reached at each stage of their journey.
Robert RoseFounder of The Content AdvisoryChief Strategy Advisor of Content Marketing Institute
“
”
2017 State of B2B Marketing Content Consumption and Demand Report for B2B MarketersNetLine Corporation
Table of Contents
1. Introduction to the Research
2. Methodology
3. Active Audience: Marketers
a. Persona Insights
b. Mobile Insights
4. In-Demand Audience: Marketers
a. Target Audience Insights
b. Account-Based Marketing
5. Consumption Journey
a. Consumption Volume
b. Consumption Frequency
c. Consumption Gap
6. Consumption Trends
a. Consumption Trends by Persona
7. Content Trends
a. Content Themes
b. Content Types
c. Trending Titles
8. Content Goals
9. Summary
a. Content Strategy
b. Target Strategy
c. Nurture Strategy
10. The NetLine Portal
11. About NetLine Corporation
12. Our Commitment to You
......................................5
...............................................................6
.........................................7
.....................................................8
.....................................................11
..............................12
.......................................12
.....................................14
...............................................15
............................................15
.......................................16
.................................................16
..............................................17
..........................18
.........................................................25
...................................................25
......................................................26
......................................................26
..........................................................27
...................................................................28
....................................................28
.......................................................28
.....................................................29
....................................................30
......................................31
..........................................31
2017 State of B2B Marketing Content Consumption and Demand Report for B2B Marketers NetLine Corporation
Introduction to the Research
Content marketers and demand generation
teams are being challenged even more this
year. They are faced with more aggressive
goals, steeper competition, and having to
keep pace with the constant evolution of the
MarTech Stack to achieve success. Just this
year, Sirius Decisions reinvented the buyer’s
journey with its newly unveiled Demand
Unit Waterfall. These evolutions are creating
new struggles for the B2B marketer—from
bandwidth and budget to performance-
based quotas, and sales and marketing
alignment. Marketers must advance their
thinking to optimize their 2017 demand
generation strategy.
In the business-to-business (B2B) world,
content marketing has been identified as a
leading tool contributing to B2B marketing
success. Content Marketing Institute
published its “B2B Content Marketing
2017: Benchmarks, Budgets, and Trends—
North America Report” stating that 85% of
marketers identified ‘high quality content
creation’ as their number one reason for
success last year. More than half of the
marketers stated that focusing on ‘content
strategy’ and ‘content distribution’ were
critical to their success.
Data provided by the NetLine Corporation B2B Content Syndication Lead Generation Network, May 1, 2016 to April 30, 2017
Additionally, Demand Gen Report published
the “2017 Demand Generation Benchmark
Survey” asking B2B marketers how they
would be measured this year. Of the
marketers surveyed, 54% reported having
a revenue-based quota included in their
goals, and 45% of marketers reported having
a lead-based quota included in their goals
to measure their marketing department’s
performance.
Marketers have concluded resoundingly that
content has the potential to be a top driver
of success for their organizations. However,
they are faced with the direct challenge of
connecting content to their performance
goals surrounding pipeline development.
To implement the most effective content
marketing strategy this year, marketers must
focus on executing content campaigns with
direct attribution to their lead-based and
revenue-based goals.
2017 State of B2B Marketing Content Consumption and Demand Report for B2B Marketers 5NetLine Corporation
6 2017 State of B2B Marketing Content Consumption and Demand Report for B2B Marketers NetLine Corporation
Methodology
The 2017 State of B2B Marketing Content
Consumption and Demand Report is an
in-depth research study of the content
consumption behavior of marketing
professionals. This research is intended to
offer B2B marketers deep insights on their
target prospects—marketers targeting
marketers. The research examines the real
content consumption activity taking place
across the NetLine Corporation Network
in the past 12 months with a thorough
review of the content requested and leads
processed.
NetLine analyzed the active audience
of marketing professionals researching
business-related topics in comparison to the
competitive landscape of target personas
that organizations are trying to reach to
extract meaningful insights. Demand
Data provided by the NetLine Corporation B2B Content Syndication Lead Generation Network, May 1, 2016 to April 30, 2017
generation and content marketing teams
should apply these insights to optimize their
strategy this year.
The NetLine Corporation Network is the largest B2B content syndication lead generation network available on the web today and features the largest data set for B2B marketers to use to achieve quality growth and scale for their organizations.
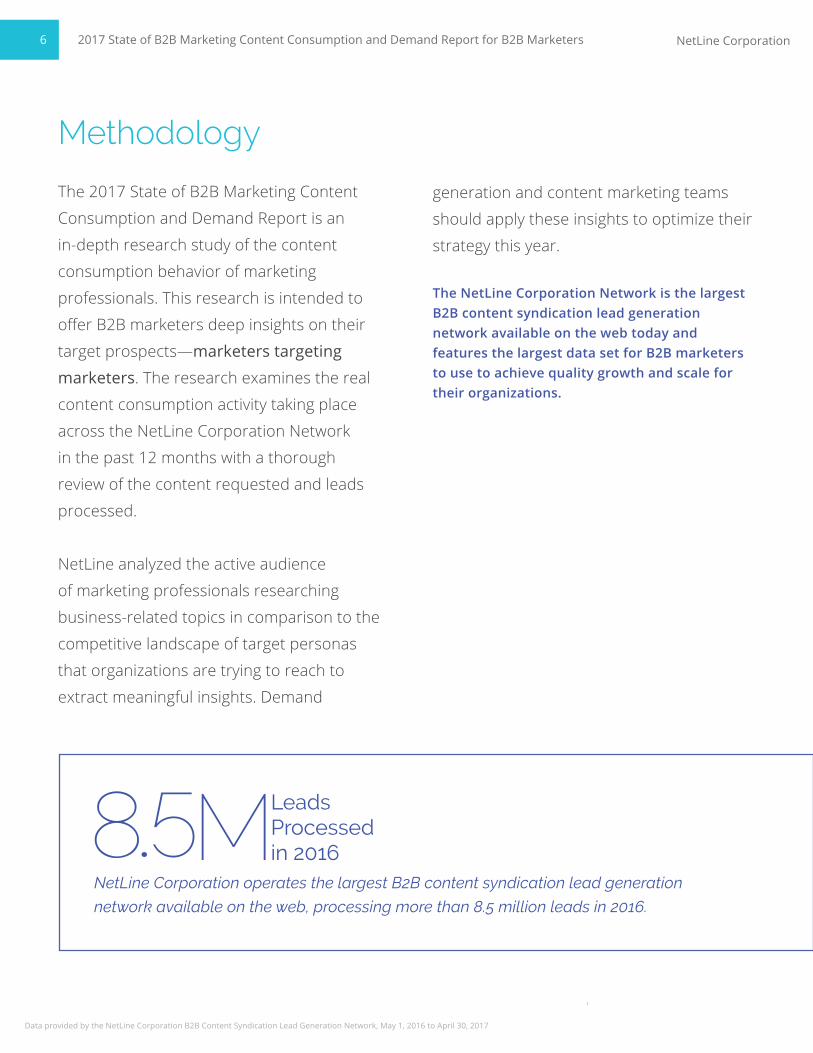
NetLine Corporation operates the largest B2B content syndication lead generation
network available on the web, processing more than 8.5 million leads in 2016.
LeadsProcessedin 2016
Data provided by the NetLine Corporation B2B Content Syndication Lead Generation Network, May 1, 2016 to April 30, 2017
2017 State of B2B Marketing Content Consumption and Demand Report for B2B Marketers 7NetLine Corporation
Active Audience:Marketers
First, we will identify the active audience of
marketing professionals who consumed
content across the NetLine Corporation
Network in the past 12 months. This section
analyzes millions of leads processed
by native content syndication and lead
generation tactics, across 300+ professional
industry sectors. The active marketing
audience is measured by each professional’s
self-identified job area, function, level,
industry, sub-industry, company size,
company revenue, geographic region, and
mobile device behavior.
Additionally, growth trends are cited in
comparison to the prior 12 months.
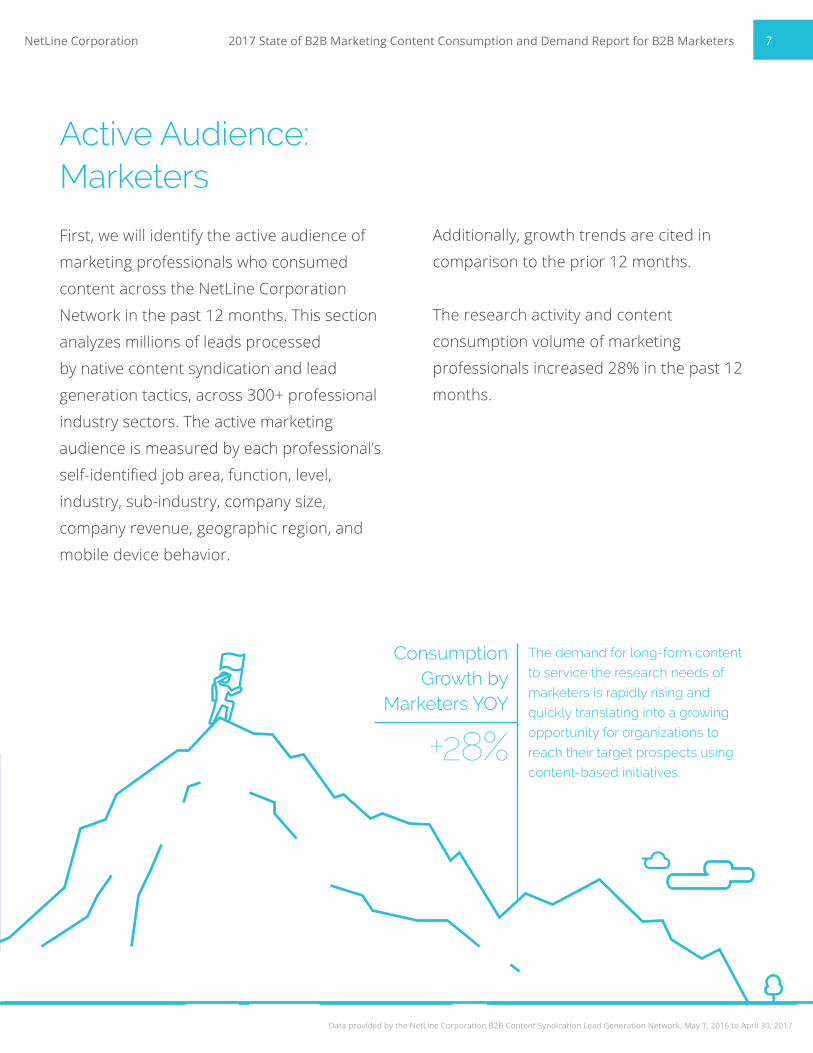
The research activity and content
consumption volume of marketing
professionals increased 28% in the past 12
months.
The demand for long-form content
to service the research needs of
marketers is rapidly rising and
quickly translating into a growing
opportunity for organizations to
reach their target prospects using
content-based initiatives.
ConsumptionGrowth by
Marketers YOY
+28%
Persona Insights
JOB AREA & FUNCTION
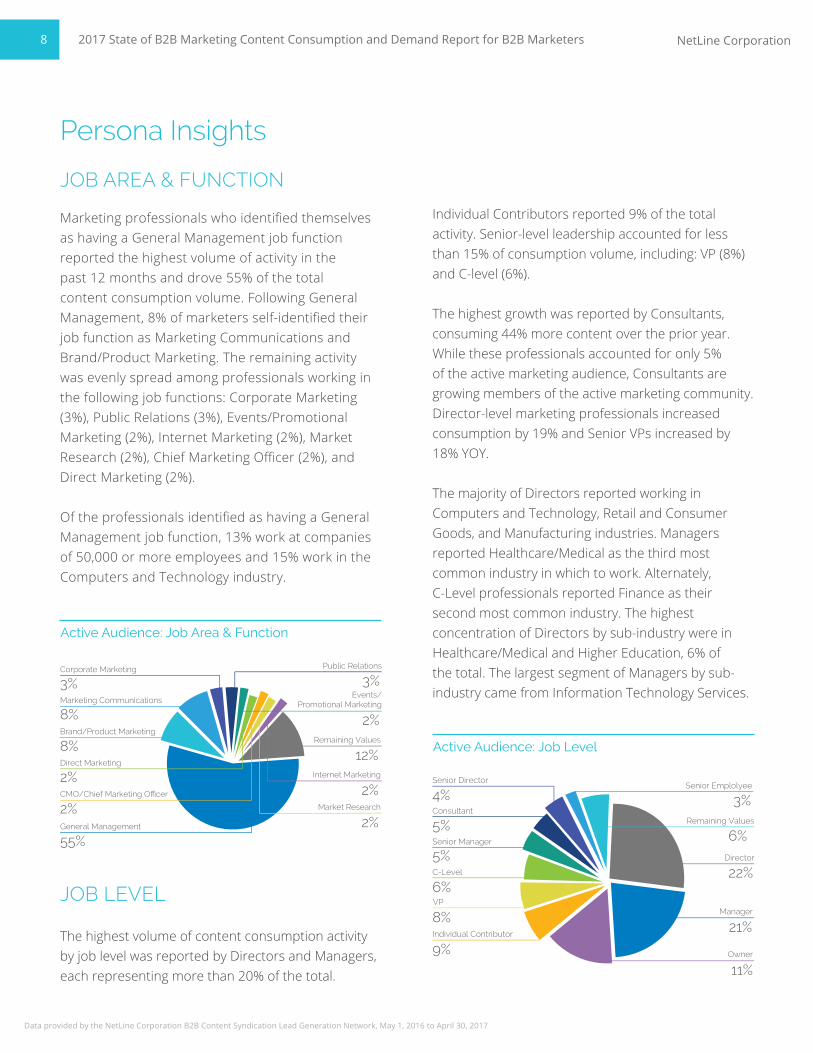
Marketing professionals who identified themselves as having a General Management job function reported the highest volume of activity in the past 12 months and drove 55% of the total content consumption volume. Following General Management, 8% of marketers self-identified their job function as Marketing Communications and Brand/Product Marketing. The remaining activity was evenly spread among professionals working in the following job functions: Corporate Marketing (3%), Public Relations (3%), Events/Promotional Marketing (2%), Internet Marketing (2%), Market Research (2%), Chief Marketing Officer (2%), and Direct Marketing (2%).
Of the professionals identified as having a General Management job function, 13% work at companies of 50,000 or more employees and 15% work in the Computers and Technology industry.
JOB LEVEL
The highest volume of content consumption activity by job level was reported by Directors and Managers, each representing more than 20% of the total.
Individual Contributors reported 9% of the total activity. Senior-level leadership accounted for less than 15% of consumption volume, including: VP (8%) and C-level (6%).
The highest growth was reported by Consultants, consuming 44% more content over the prior year. While these professionals accounted for only 5% of the active marketing audience, Consultants are growing members of the active marketing community. Director-level marketing professionals increased consumption by 19% and Senior VPs increased by 18% YOY.
The majority of Directors reported working in Computers and Technology, Retail and Consumer Goods, and Manufacturing industries. Managers reported Healthcare/Medical as the third most common industry in which to work. Alternately, C-Level professionals reported Finance as their second most common industry. The highest concentration of Directors by sub-industry were in Healthcare/Medical and Higher Education, 6% of the total. The largest segment of Managers by sub-industry came from Information Technology Services.
Active Audience: Job Area & Function
Active Audience: Job Level
8 2017 State of B2B Marketing Content Consumption and Demand Report for B2B Marketers NetLine Corporation
Data provided by the NetLine Corporation B2B Content Syndication Lead Generation Network, May 1, 2016 to April 30, 2017
VP
Senior Director
Consultant
8%
5%
4%
Individual Contributor
9%
Director
Manager
21%
22%
Senior Emplolyee
3%
Senior Manager
5%C-Level
6%
Owner
11%
Remaining Values
6%
Corporate Marketing
Marketing Communications
8%
3%
Brand/Product Marketing
8%
Events/Promotional Marketing
Remaining Values
12%
2%
Public Relations
3%
Internet Marketing
2%
Direct Marketing
2%
2% Market Research
2%General Management
55%
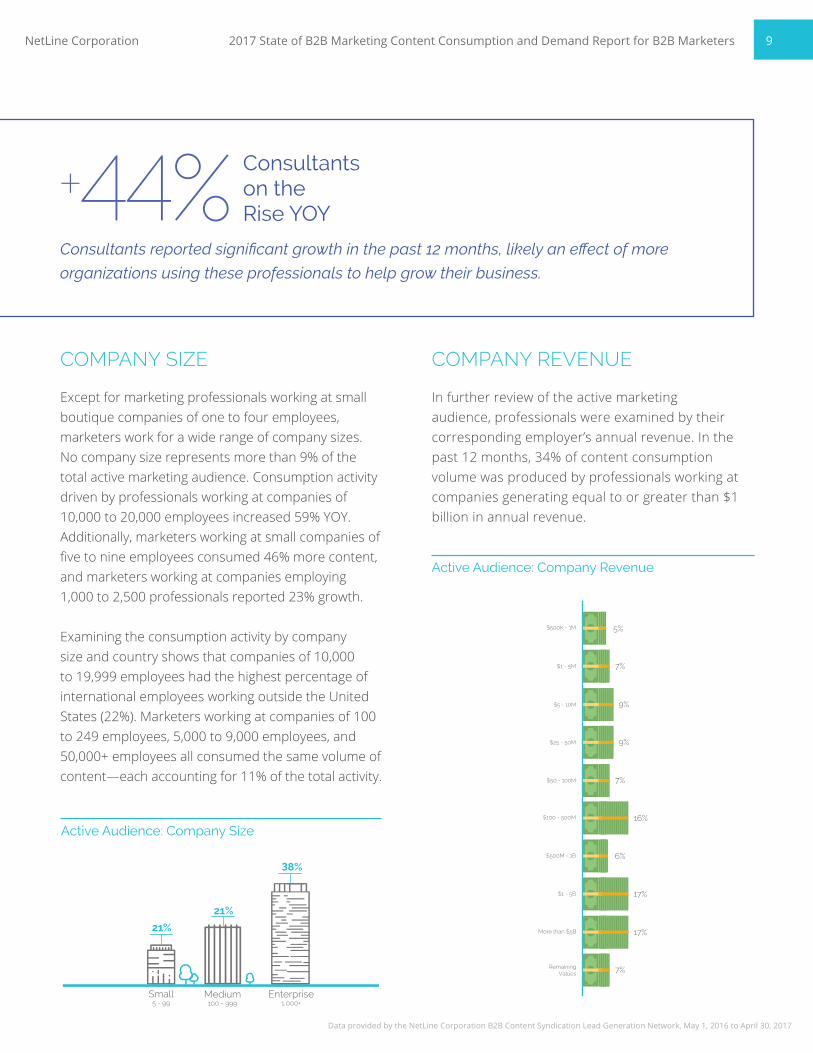
COMPANY SIZE
Except for marketing professionals working at small boutique companies of one to four employees, marketers work for a wide range of company sizes. No company size represents more than 9% of the total active marketing audience. Consumption activity driven by professionals working at companies of 10,000 to 20,000 employees increased 59% YOY. Additionally, marketers working at small companies of five to nine employees consumed 46% more content, and marketers working at companies employing 1,000 to 2,500 professionals reported 23% growth.
Examining the consumption activity by company size and country shows that companies of 10,000 to 19,999 employees had the highest percentage of international employees working outside the United States (22%). Marketers working at companies of 100 to 249 employees, 5,000 to 9,000 employees, and 50,000+ employees all consumed the same volume of content—each accounting for 11% of the total activity.
Active Audience: Company Revenue
COMPANY REVENUE
In further review of the active marketing audience, professionals were examined by their corresponding employer’s annual revenue. In the past 12 months, 34% of content consumption volume was produced by professionals working at companies generating equal to or greater than $1 billion in annual revenue.
Active Audience: Company Size
2017 State of B2B Marketing Content Consumption and Demand Report for B2B Marketers 9NetLine Corporation
21%
21%
38%
Consultants reported significant growth in the past 12 months, likely an effect of more
organizations using these professionals to help grow their business.
Consultantson theRise YOY
+44%
Data provided by the NetLine Corporation B2B Content Syndication Lead Generation Network, May 1, 2016 to April 30, 2017
16%
$500K - 1M 5%
$500M - 1B 6%
$1 - 5M 7%
$50 - 100M 7%
$25 - 50M
$1 - 5B 17%
$100 - 500M
More than $5B
$5 - 10M
RemainingValues
9%
17%
7%
9%
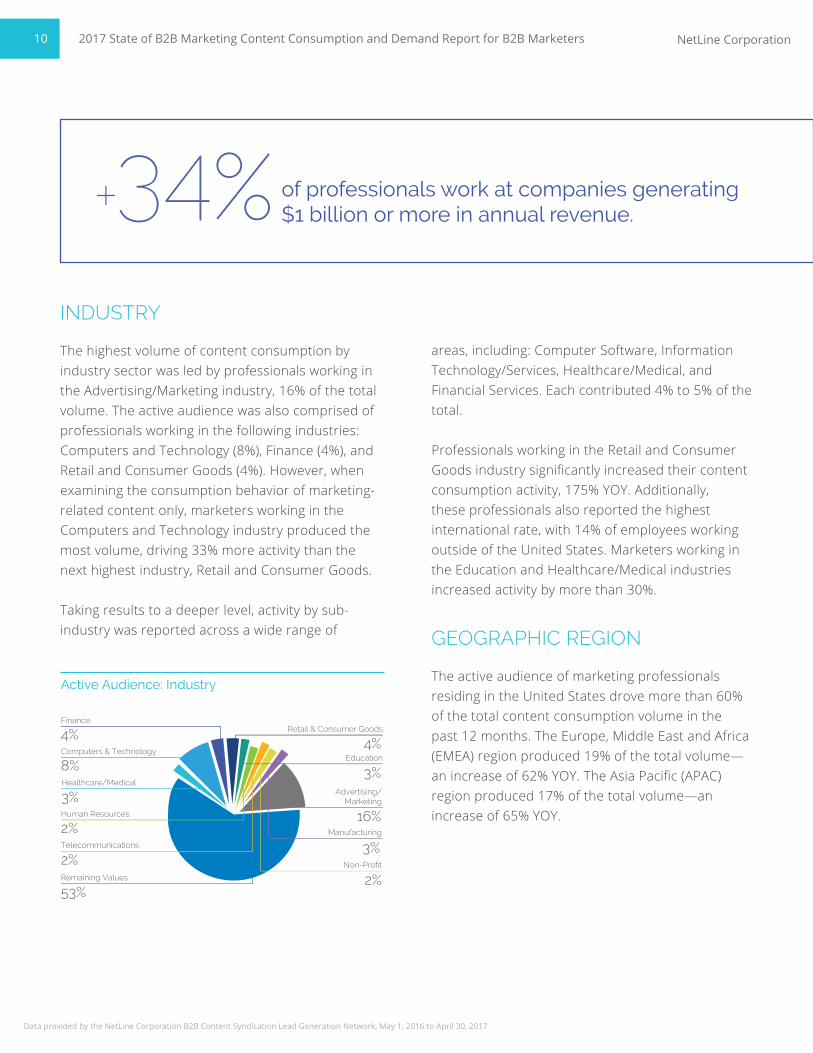
Active Audience: Industry
INDUSTRY
The highest volume of content consumption by industry sector was led by professionals working in the Advertising/Marketing industry, 16% of the total volume. The active audience was also comprised of professionals working in the following industries: Computers and Technology (8%), Finance (4%), and Retail and Consumer Goods (4%). However, when examining the consumption behavior of marketing- related content only, marketers working in the Computers and Technology industry produced the most volume, driving 33% more activity than the next highest industry, Retail and Consumer Goods.
Taking results to a deeper level, activity by sub-industry was reported across a wide range of
Data provided by the NetLine Corporation B2B Content Syndication Lead Generation Network, May 1, 2016 to April 30, 2017
+34% of professionals work at companies generating $1 billion or more in annual revenue.
areas, including: Computer Software, Information Technology/Services, Healthcare/Medical, and Financial Services. Each contributed 4% to 5% of the total.
Professionals working in the Retail and Consumer Goods industry significantly increased their content consumption activity, 175% YOY. Additionally, these professionals also reported the highest international rate, with 14% of employees working outside of the United States. Marketers working in the Education and Healthcare/Medical industries increased activity by more than 30%.
GEOGRAPHIC REGION
The active audience of marketing professionals residing in the United States drove more than 60% of the total content consumption volume in the past 12 months. The Europe, Middle East and Africa (EMEA) region produced 19% of the total volume—an increase of 62% YOY. The Asia Pacific (APAC) region produced 17% of the total volume—an increase of 65% YOY.
10 2017 State of B2B Marketing Content Consumption and Demand Report for B2B Marketers NetLine Corporation
Finance
Computers & Technology
8%
4%
Healthcare/Medical
3%
Education
Advertising/Marketing
16%
3%
Retail & Consumer Goods
4%
Manufacturing
3%
Human Resources
2%Telecommunications
2%2%Remaining Values
53%
Data provided by the NetLine Corporation B2B Content Syndication Lead Generation Network, May 1, 2016 to April 30, 2017
Content consumption activity driven by professionals in the EMEA and APAC regions
continues to show significant growth; 37% of activity was produced by professionals in
non-US regions.
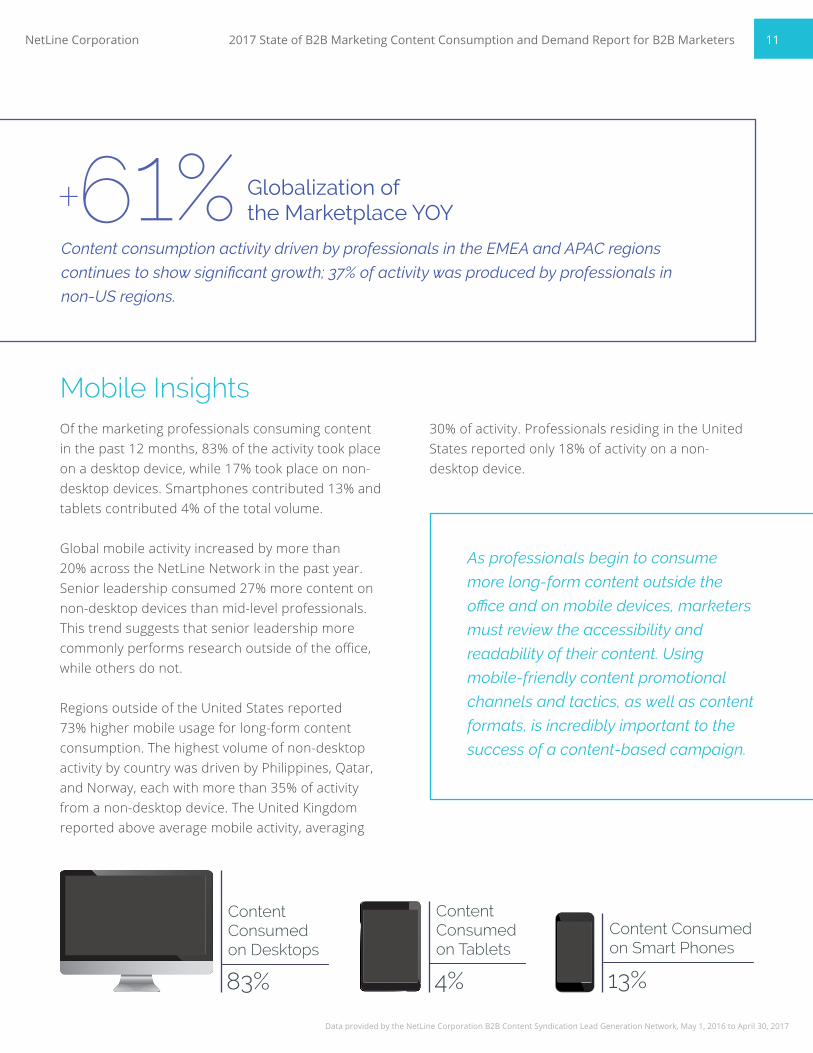
Globalization ofthe Marketplace YOY+61%
Mobile InsightsOf the marketing professionals consuming content in the past 12 months, 83% of the activity took place on a desktop device, while 17% took place on non-desktop devices. Smartphones contributed 13% and tablets contributed 4% of the total volume.
Global mobile activity increased by more than 20% across the NetLine Network in the past year. Senior leadership consumed 27% more content on non-desktop devices than mid-level professionals. This trend suggests that senior leadership more commonly performs research outside of the office, while others do not.
Regions outside of the United States reported 73% higher mobile usage for long-form content consumption. The highest volume of non-desktop activity by country was driven by Philippines, Qatar, and Norway, each with more than 35% of activity from a non-desktop device. The United Kingdom reported above average mobile activity, averaging
As professionals begin to consume
more long-form content outside the
office and on mobile devices, marketers
must review the accessibility and
readability of their content. Using
mobile-friendly content promotional
channels and tactics, as well as content
formats, is incredibly important to the
success of a content-based campaign.
30% of activity. Professionals residing in the United States reported only 18% of activity on a non-desktop device.
ContentConsumedon Desktops
83%
ContentConsumedon Tablets
4%
Content Consumedon Smart Phones
13%
2017 State of B2B Marketing Content Consumption and Demand Report for B2B Marketers 11NetLine Corporation
Data provided by the NetLine Corporation B2B Content Syndication Lead Generation Network, May 1, 2016 to April 30, 2017
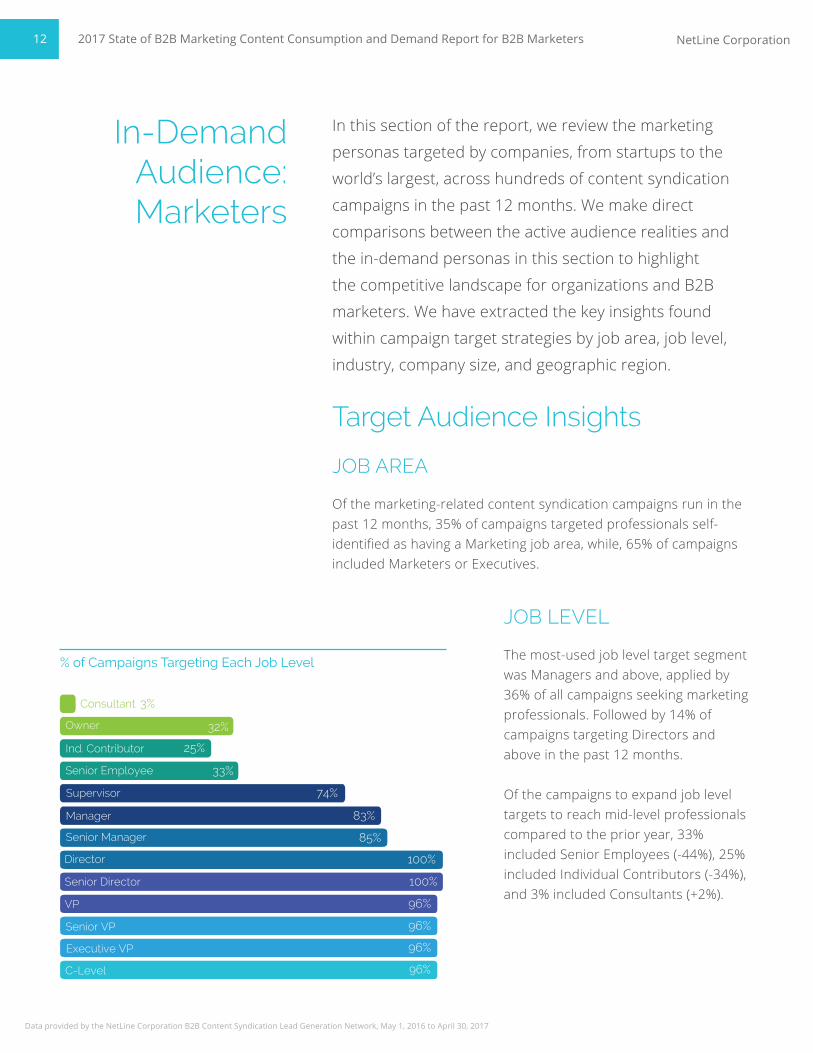
% of Campaigns Targeting Each Job Level
JOB LEVEL
The most-used job level target segment was Managers and above, applied by 36% of all campaigns seeking marketing professionals. Followed by 14% of campaigns targeting Directors and above in the past 12 months.
Of the campaigns to expand job level targets to reach mid-level professionals compared to the prior year, 33% included Senior Employees (-44%), 25% included Individual Contributors (-34%), and 3% included Consultants (+2%).
In this section of the report, we review the marketing
personas targeted by companies, from startups to the
world’s largest, across hundreds of content syndication
campaigns in the past 12 months. We make direct
comparisons between the active audience realities and
the in-demand personas in this section to highlight
the competitive landscape for organizations and B2B
marketers. We have extracted the key insights found
within campaign target strategies by job area, job level,
industry, company size, and geographic region.
Target Audience Insights
JOB AREA
Of the marketing-related content syndication campaigns run in the past 12 months, 35% of campaigns targeted professionals self-identified as having a Marketing job area, while, 65% of campaigns included Marketers or Executives.
In-DemandAudience:Marketers
12 2017 State of B2B Marketing Content Consumption and Demand Report for B2B Marketers NetLine Corporation
Consultant
Owner
Ind. Contributor
Senior Employee
Supervisor
Manager
Senior Manager
Director
Senior Director
VP
Senior VP
Executive VP
C-Level
3%
32%
25%
33%
74%
83%
85%
100%
100%
96%
96%
96%
96%
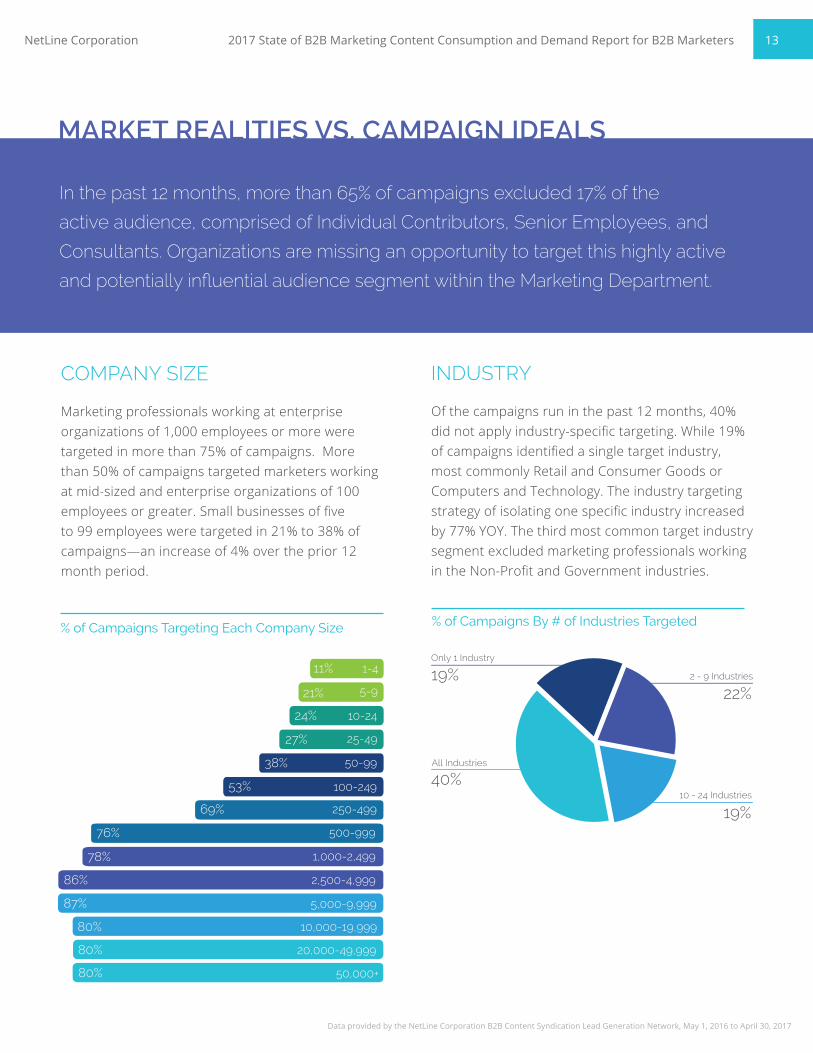
In the past 12 months, more than 65% of campaigns excluded 17% of the
active audience, comprised of Individual Contributors, Senior Employees, and
Consultants. Organizations are missing an opportunity to target this highly active
and potentially influential audience segment within the Marketing Department.
MARKET REALITIES VS. CAMPAIGN IDEALS
% of Campaigns Targeting Each Company Size
COMPANY SIZE
Marketing professionals working at enterprise organizations of 1,000 employees or more were targeted in more than 75% of campaigns. More than 50% of campaigns targeted marketers working at mid-sized and enterprise organizations of 100 employees or greater. Small businesses of five to 99 employees were targeted in 21% to 38% of campaigns—an increase of 4% over the prior 12 month period.
INDUSTRY
Of the campaigns run in the past 12 months, 40% did not apply industry-specific targeting. While 19% of campaigns identified a single target industry, most commonly Retail and Consumer Goods or Computers and Technology. The industry targeting strategy of isolating one specific industry increased by 77% YOY. The third most common target industry segment excluded marketing professionals working in the Non-Profit and Government industries.
% of Campaigns By # of Industries Targeted
Data provided by the NetLine Corporation B2B Content Syndication Lead Generation Network, May 1, 2016 to April 30, 2017
2017 State of B2B Marketing Content Consumption and Demand Report for B2B Marketers 13NetLine Corporation
1-4
5-9
10-24
25-49
50-99
100-249
250-499
500-999
1,000-2,499
2,500-4,999
5,000-9,999
10,000-19,999
20,000-49,999
50,000+
11%
21%
24%
27%
38%
53%
69%
76%
78%
86%
87%
80%
80%
80%
Only 1 Industry
All Industries
40%
19% 2 - 9 Industries
10 - 24 Industries
19%
22%
Australia5%
GEOGRAPHIC REGION
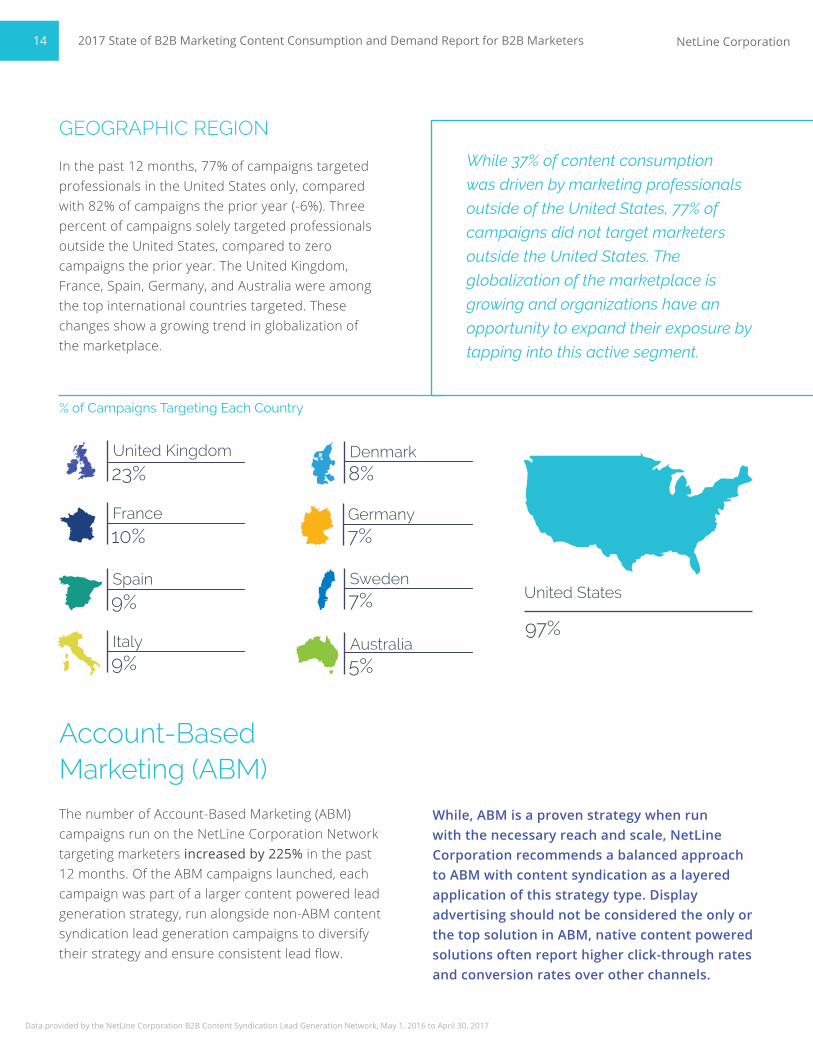
In the past 12 months, 77% of campaigns targeted professionals in the United States only, compared with 82% of campaigns the prior year (-6%). Three percent of campaigns solely targeted professionals outside the United States, compared to zero campaigns the prior year. The United Kingdom, France, Spain, Germany, and Australia were among the top international countries targeted. These changes show a growing trend in globalization of the marketplace.
United States
97%
United Kingdom
23%
France
10%
Spain
9%
Denmark8%
Germany7%
Italy9%
Sweden7%
Account-Based Marketing (ABM)The number of Account-Based Marketing (ABM) campaigns run on the NetLine Corporation Network targeting marketers increased by 225% in the past 12 months. Of the ABM campaigns launched, each campaign was part of a larger content powered lead generation strategy, run alongside non-ABM content syndication lead generation campaigns to diversify their strategy and ensure consistent lead flow.
While, ABM is a proven strategy when run with the necessary reach and scale, NetLine Corporation recommends a balanced approach to ABM with content syndication as a layered application of this strategy type. Display advertising should not be considered the only or the top solution in ABM, native content powered solutions often report higher click-through rates and conversion rates over other channels.
While 37% of content consumption
was driven by marketing professionals
outside of the United States, 77% of
campaigns did not target marketers
outside the United States. The
globalization of the marketplace is
growing and organizations have an
opportunity to expand their exposure by
tapping into this active segment.
14 2017 State of B2B Marketing Content Consumption and Demand Report for B2B Marketers NetLine Corporation
Data provided by the NetLine Corporation B2B Content Syndication Lead Generation Network, May 1, 2016 to April 30, 2017
% of Campaigns Targeting Each Country
In this section, we examine the journey of marketing
professionals consuming content on the NetLine
Corporation Network and the patterns that surround
their behavior. We have extracted important metrics on
consumption volume, frequency, and ‘the gap’ marketers
need to be knowledgeable about to optimize demand
generation and lead nurture strategies.
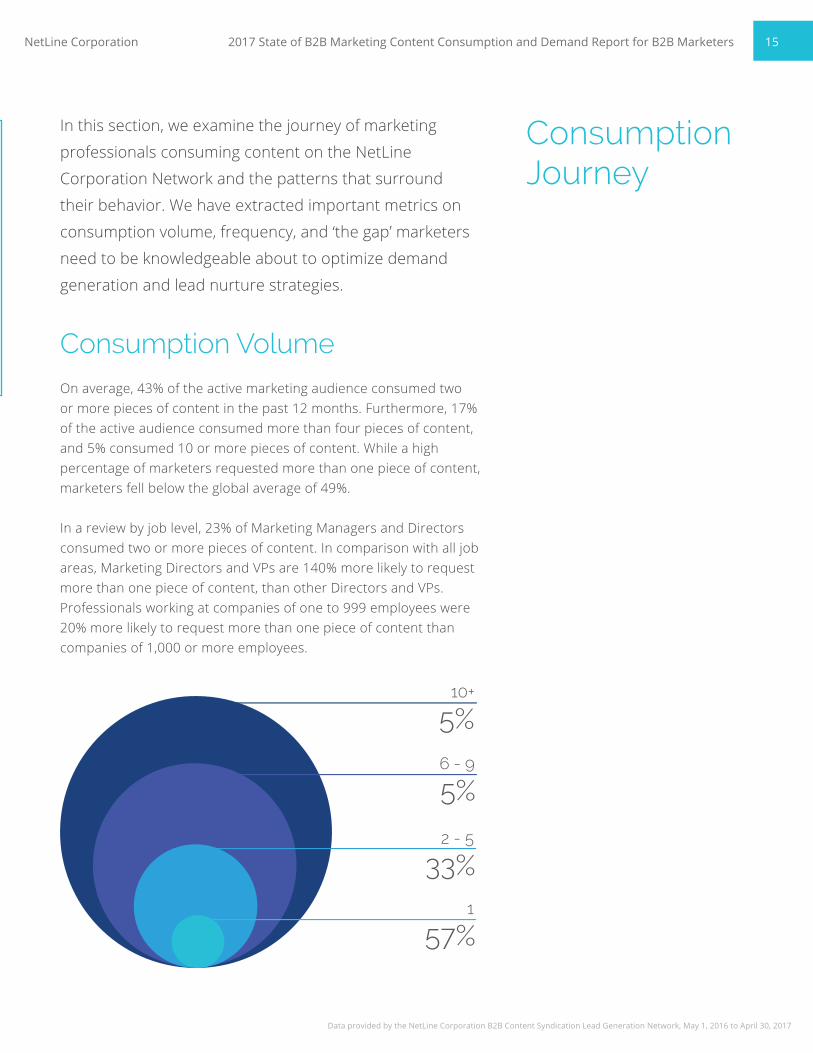
Consumption VolumeOn average, 43% of the active marketing audience consumed two or more pieces of content in the past 12 months. Furthermore, 17% of the active audience consumed more than four pieces of content, and 5% consumed 10 or more pieces of content. While a high percentage of marketers requested more than one piece of content, marketers fell below the global average of 49%.
In a review by job level, 23% of Marketing Managers and Directors consumed two or more pieces of content. In comparison with all job areas, Marketing Directors and VPs are 140% more likely to request more than one piece of content, than other Directors and VPs. Professionals working at companies of one to 999 employees were 20% more likely to request more than one piece of content than companies of 1,000 or more employees.
ConsumptionJourney
2017 State of B2B Marketing Content Consumption and Demand Report for B2B Marketers 15NetLine Corporation
Data provided by the NetLine Corporation B2B Content Syndication Lead Generation Network, May 1, 2016 to April 30, 2017
1
57%
2 - 5
33%
6 - 9
5%
10+
5%
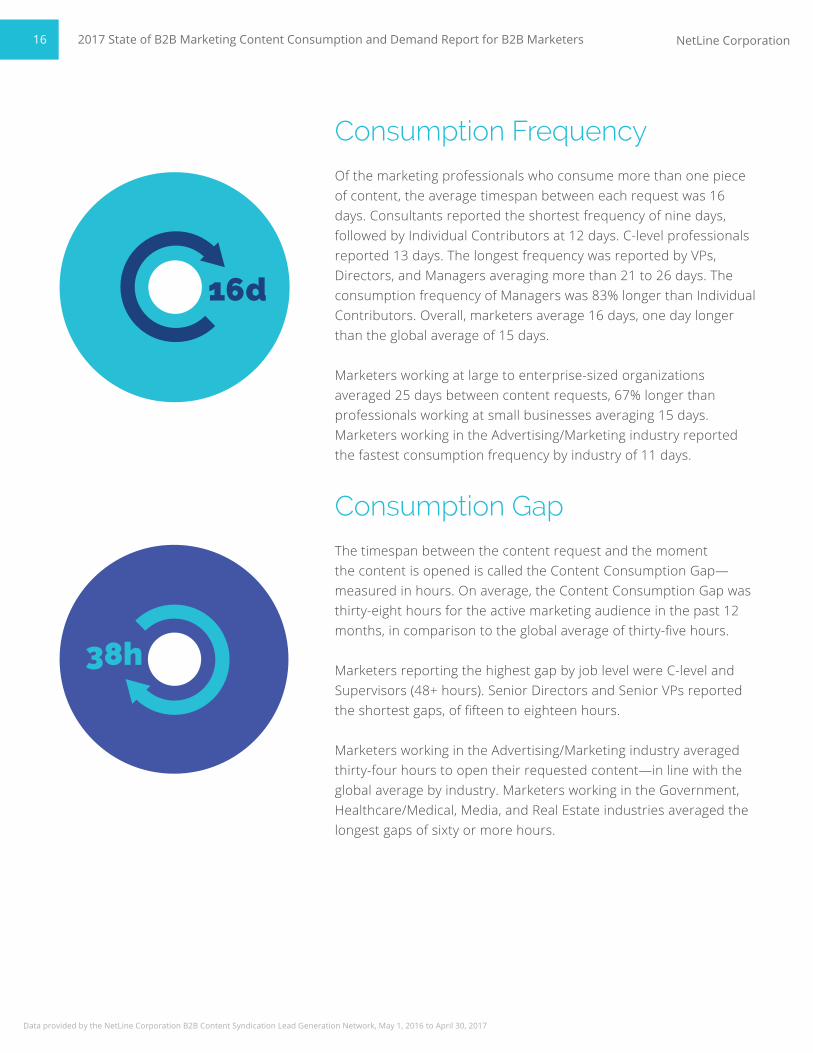
Consumption FrequencyOf the marketing professionals who consume more than one piece of content, the average timespan between each request was 16 days. Consultants reported the shortest frequency of nine days, followed by Individual Contributors at 12 days. C-level professionals reported 13 days. The longest frequency was reported by VPs, Directors, and Managers averaging more than 21 to 26 days. The consumption frequency of Managers was 83% longer than Individual Contributors. Overall, marketers average 16 days, one day longer than the global average of 15 days.
Marketers working at large to enterprise-sized organizations averaged 25 days between content requests, 67% longer than professionals working at small businesses averaging 15 days. Marketers working in the Advertising/Marketing industry reported the fastest consumption frequency by industry of 11 days.
Consumption GapThe timespan between the content request and the moment the content is opened is called the Content Consumption Gap—measured in hours. On average, the Content Consumption Gap was thirty-eight hours for the active marketing audience in the past 12 months, in comparison to the global average of thirty-five hours.
Marketers reporting the highest gap by job level were C-level and Supervisors (48+ hours). Senior Directors and Senior VPs reported the shortest gaps, of fifteen to eighteen hours.
Marketers working in the Advertising/Marketing industry averaged thirty-four hours to open their requested content—in line with the global average by industry. Marketers working in the Government, Healthcare/Medical, Media, and Real Estate industries averaged the longest gaps of sixty or more hours.
16 2017 State of B2B Marketing Content Consumption and Demand Report for B2B Marketers NetLine Corporation
16 d
Data provided by the NetLine Corporation B2B Content Syndication Lead Generation Network, May 1, 2016 to April 30, 2017
38h
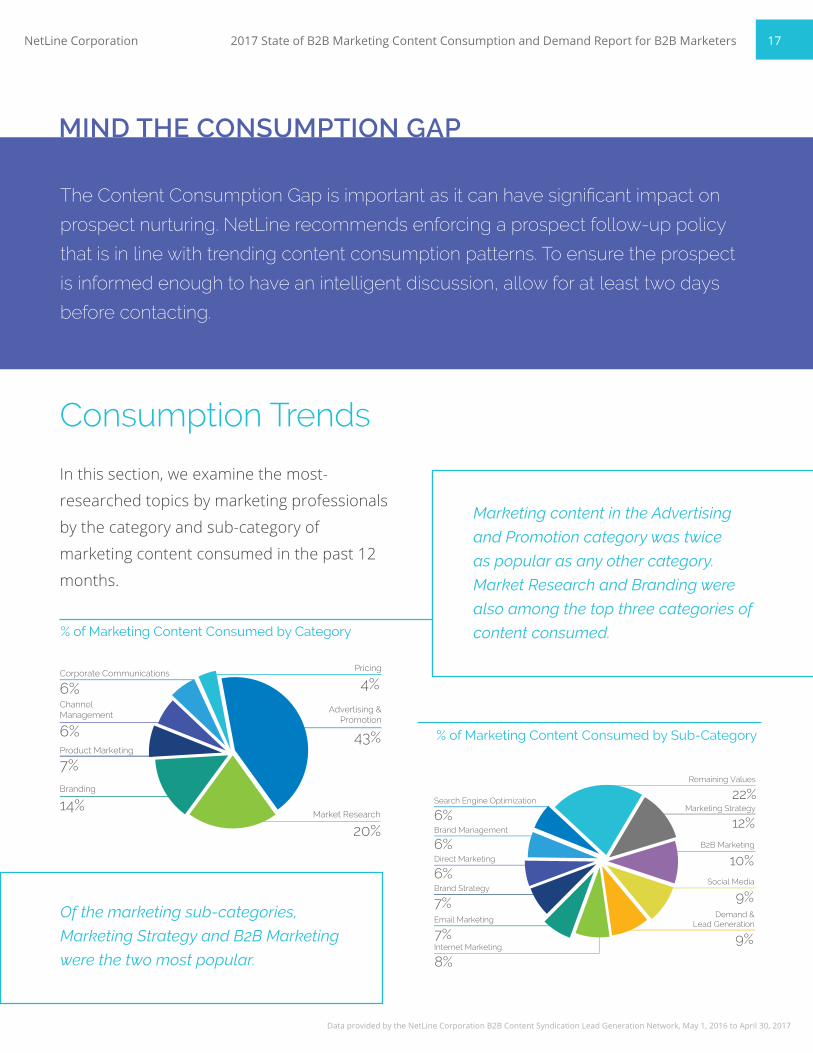
The Content Consumption Gap is important as it can have significant impact on
prospect nurturing. NetLine recommends enforcing a prospect follow-up policy
that is in line with trending content consumption patterns. To ensure the prospect
is informed enough to have an intelligent discussion, allow for at least two days
before contacting.
MIND THE CONSUMPTION GAP
Consumption Trends
In this section, we examine the most-
researched topics by marketing professionals
by the category and sub-category of
marketing content consumed in the past 12
months.
Marketing content in the Advertising
and Promotion category was twice
as popular as any other category.
Market Research and Branding were
also among the top three categories of
content consumed.
Of the marketing sub-categories,
Marketing Strategy and B2B Marketing
were the two most popular.
2017 State of B2B Marketing Content Consumption and Demand Report for B2B Marketers 17NetLine Corporation
Data provided by the NetLine Corporation B2B Content Syndication Lead Generation Network, May 1, 2016 to April 30, 2017
Corporate Communications
ChannelManagement
6%
6%
Product Marketing
7%Branding
14%
Advertising &Promotion
Market Research
20%
43%
Pricing
4%
Search Engine Optimization
6%Marketing Strategy
B2B Marketing
10%
12%
Remaining Values
22%
Social Media
9%
Brand Management
6%Direct Marketing
6%
Demand &Lead Generation
9%Internet Marketing
8%
Email Marketing
7%
Brand Strategy
7%
% of Marketing Content Consumed by Category
% of Marketing Content Consumed by Sub-Category
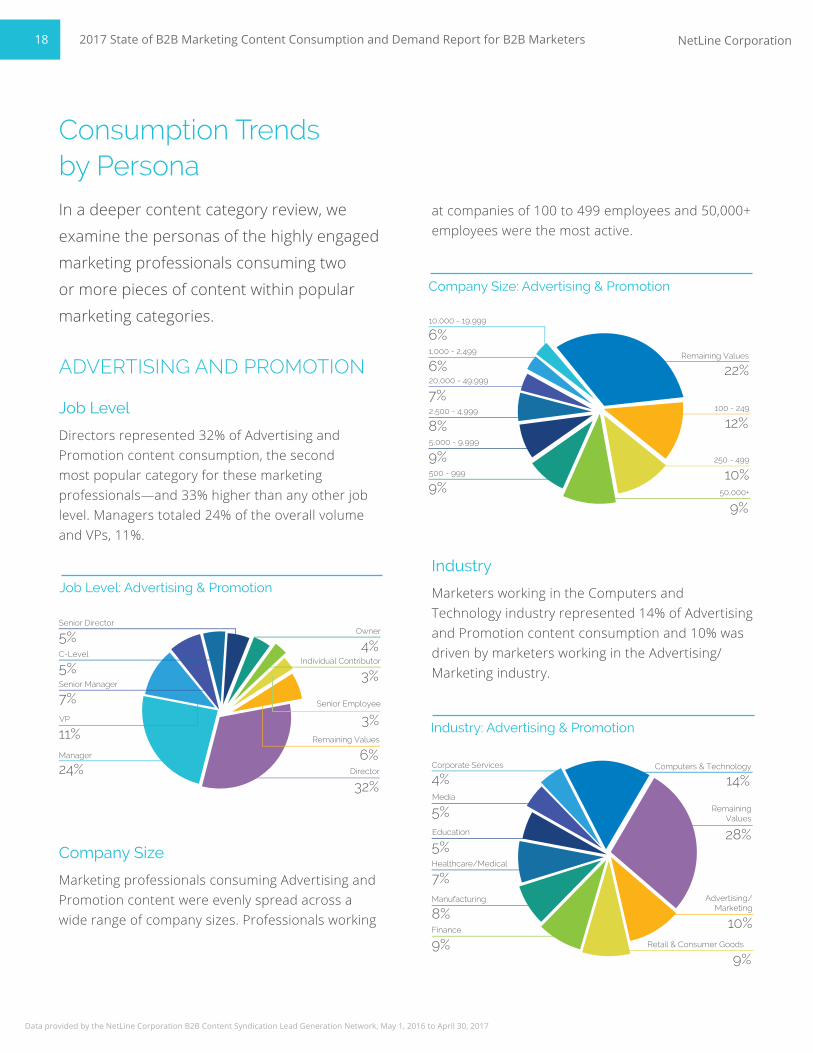
Consumption Trendsby PersonaIn a deeper content category review, we
examine the personas of the highly engaged
marketing professionals consuming two
or more pieces of content within popular
marketing categories.
ADVERTISING AND PROMOTION
Job Level
Directors represented 32% of Advertising and Promotion content consumption, the second most popular category for these marketing professionals—and 33% higher than any other job level. Managers totaled 24% of the overall volume and VPs, 11%.
Company Size
Marketing professionals consuming Advertising and Promotion content were evenly spread across a wide range of company sizes. Professionals working
Job Level: Advertising & Promotion
at companies of 100 to 499 employees and 50,000+ employees were the most active.
Industry
Marketers working in the Computers and Technology industry represented 14% of Advertising and Promotion content consumption and 10% was driven by marketers working in the Advertising/Marketing industry.
Company Size: Advertising & Promotion
Industry: Advertising & Promotion
18 2017 State of B2B Marketing Content Consumption and Demand Report for B2B Marketers NetLine Corporation
Media
Corporate Services
5%
4%
Healthcare/Medical
7%Manufacturing
8%Finance
9%
Education
5%
Retail & Consumer Goods
9%
RemainingValues
28%
Advertising/Marketing
10%
Computers & Technology
14%
Data provided by the NetLine Corporation B2B Content Syndication Lead Generation Network, May 1, 2016 to April 30, 2017
20,000 - 49,999
2,500 - 4,999
10%50,000+
22%
100 - 2497%
6%Remaining Values
250 - 499
6%
8%
500 - 999
9%5,000 - 9,999
12%
10,000 - 19,999
9%
1,000 - 2,499
9%
VP
11%Manager
24%
Senior Employee
Remaining Values
6%
3%
Individual Contributor
3%
Senior Director
5%C-Level
5%
Owner
4%
Senior Manager
7%
Director
32%
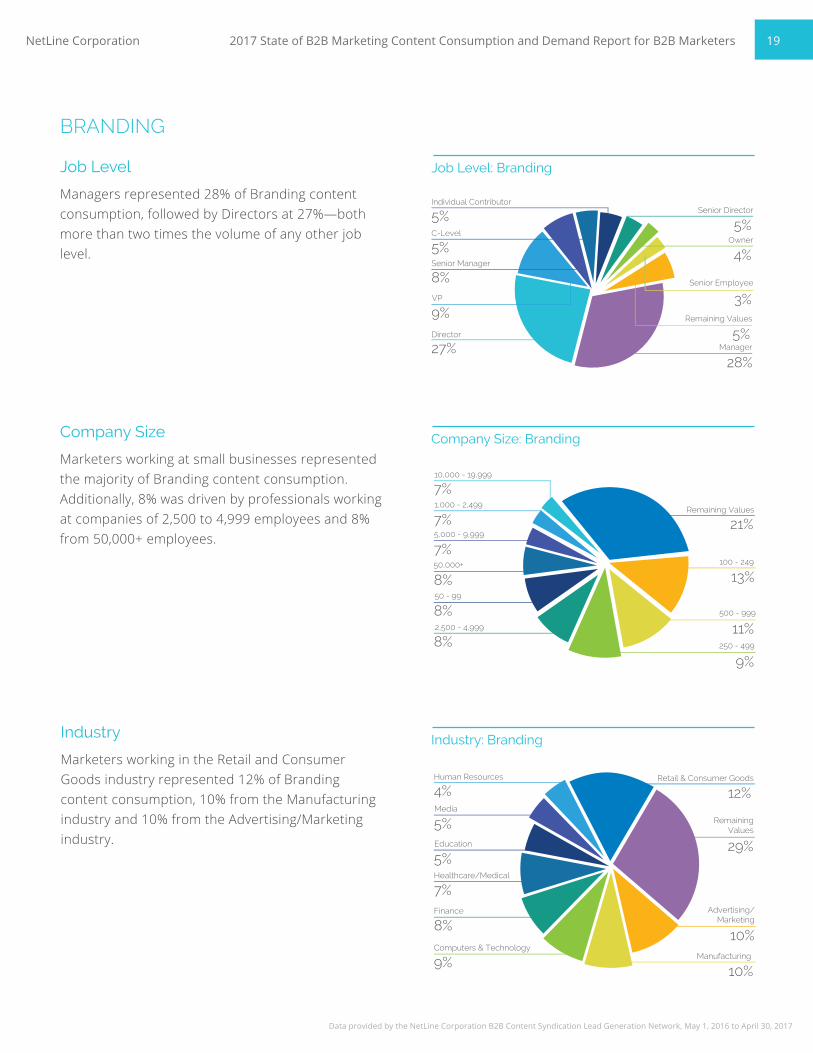
BRANDING
Job Level
Managers represented 28% of Branding content consumption, followed by Directors at 27%—both more than two times the volume of any other job level.
Industry
Marketers working in the Retail and Consumer Goods industry represented 12% of Branding content consumption, 10% from the Manufacturing industry and 10% from the Advertising/Marketing industry.
2017 State of B2B Marketing Content Consumption and Demand Report for B2B Marketers 19NetLine Corporation
Job Level: Branding
VP
9%Director
27%
Senior Employee
Remaining Values
5%
3%
Owner
4%
Individual Contributor
5%C-Level
5%
Senior Director
5%
Senior Manager
8%
Manager
28%
Industry: Branding
Company Size
Marketers working at small businesses represented the majority of Branding content consumption. Additionally, 8% was driven by professionals working at companies of 2,500 to 4,999 employees and 8% from 50,000+ employees.
Data provided by the NetLine Corporation B2B Content Syndication Lead Generation Network, May 1, 2016 to April 30, 2017
Company Size: Branding
50 - 99
2,500 - 4,999 11%
50,000+
21%
100 - 2497%
7%Remaining Values
250 - 499
7%
8%
500 - 9998%
5,000 - 9,999
13%
10,000 - 19,999
9%
1,000 - 2,499
8%
Media
Human Resources
5%
4%
Healthcare/Medical
7%Finance
8%Computers & Technology
9%
Education
5%
Manufacturing
10%
RemainingValues
29%
Advertising/Marketing
10%
Retail & Consumer Goods
12%

CHANNEL MANAGEMENT
Job Level
Managers represented 24% of Channel Management content consumption, followed by Directors at 18%. C-level and VP-level professionals each reported 8% of the total volume.
Industry
Marketers working in the Retail and Consumer Goods industry represented 17% of Channel Management content consumption, 15% from Advertising/Marketing industry and 12% from the Finance industry.
20 2017 State of B2B Marketing Content Consumption and Demand Report for B2B Marketers NetLine Corporation
Job Level: Channel Management
Company Size
Marketers working at small boutique-sized companies totaled 15% of overall Channel Management content consumption. Enterprise-level businesses totaled 14%.
Data provided by the NetLine Corporation B2B Content Syndication Lead Generation Network, May 1, 2016 to April 30, 2017
Owner
14%Director
18%
Executive VP
Remaining Values
7%
3%
Senior Director
5%
VP
8%C-Level
8%
Individual Contributor
6%
Senior Manager
9%
Manager
24%
Company Size: Channel Management
1 - 4
2,500 - 4,999
13%
10 - 2423%
100 - 249
6%
6%Remaining Values
250 - 499
6%
6%
500 - 9997%5 - 9
15%
20,000 - 49,999
11%
1,000 - 2,499
8%
Industry: Channel Management
Automotive
Healthcare/Medical
7%
5%
Media
8%
Human Resources
Remaining Values
19%
4%
Computers & Technology
4%
Manufacturing
9%Finance
12%
Retail &Consumer Goods
17%Advertising/Marketing
15%
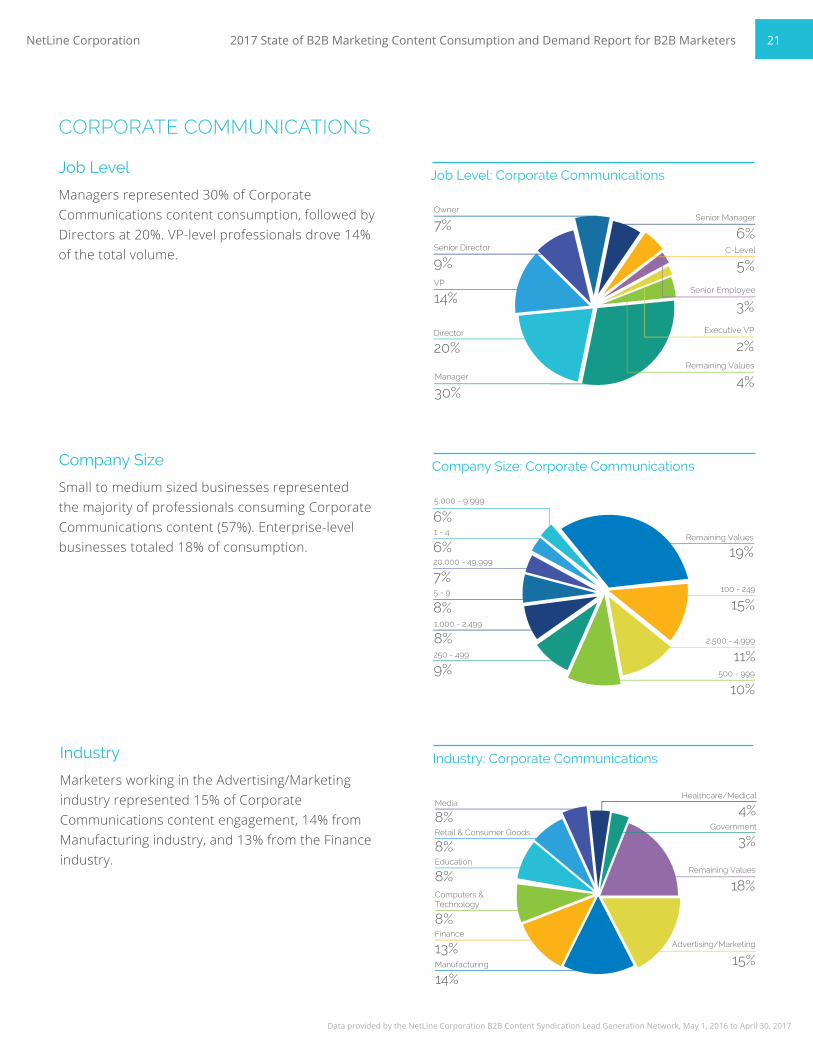
CORPORATE COMMUNICATIONS
Job Level
Managers represented 30% of Corporate Communications content consumption, followed by Directors at 20%. VP-level professionals drove 14% of the total volume.
Industry
Marketers working in the Advertising/Marketing industry represented 15% of Corporate Communications content engagement, 14% from Manufacturing industry, and 13% from the Finance industry.
2017 State of B2B Marketing Content Consumption and Demand Report for B2B Marketers 21NetLine Corporation
Company Size
Small to medium sized businesses represented the majority of professionals consuming Corporate Communications content (57%). Enterprise-level businesses totaled 18% of consumption.
Data provided by the NetLine Corporation B2B Content Syndication Lead Generation Network, May 1, 2016 to April 30, 2017
Company Size: Corporate Communications
1 - 4
500 - 999
5 - 9
2,500 - 4,999
11%
5,000 - 9,999
19%
100 - 2497%
6%Remaining Values
250 - 499
6%
8%
8%
15%
20,000 - 49,999
10%
1,000 - 2,499
9%
Job Level: Corporate Communications
Senior Employee
Executive VP
2%
3%
C-Level
5%
Senior Manager
6%
Remaining Values
4%Manager
30%
Director
20%
Owner
7%Senior Director
9%VP
14%
Industry: Corporate Communications
Media
Retail & Consumer Goods
8%
8%
Education
8%
Government
Remaining Values
18%
3%
Healthcare/Medical
4%
Computers &Technology
8%Finance
13% Advertising/Marketing
15%Manufacturing
14%
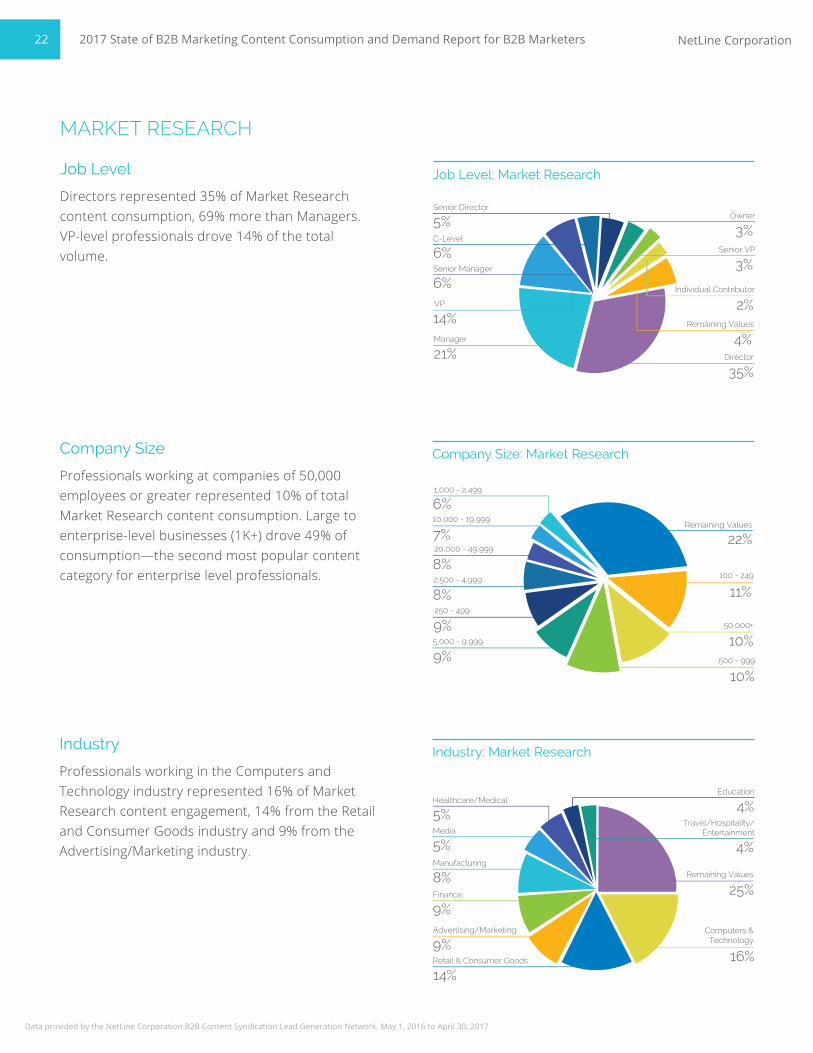
MARKET RESEARCH
Job Level
Directors represented 35% of Market Research content consumption, 69% more than Managers. VP-level professionals drove 14% of the total volume.
Industry
Professionals working in the Computers and Technology industry represented 16% of Market Research content engagement, 14% from the Retail and Consumer Goods industry and 9% from the Advertising/Marketing industry.
22 2017 State of B2B Marketing Content Consumption and Demand Report for B2B Marketers NetLine Corporation
Job Level: Market Research
VP
14%Manager
21%
Individual Contributor
Remaining Values
4%
2%
Senior VP
3%
Senior Director
5%C-Level
6%
Owner
3%
Senior Manager
6%
Director
35%
Company Size
Professionals working at companies of 50,000 employees or greater represented 10% of total Market Research content consumption. Large to enterprise-level businesses (1K+) drove 49% of consumption—the second most popular content category for enterprise level professionals.
Data provided by the NetLine Corporation B2B Content Syndication Lead Generation Network, May 1, 2016 to April 30, 2017
Company Size: Market Research
2,500 - 4,999
10%
22%
100 - 2498%
7%Remaining Values
250 - 499
6%
8%
500 - 999
9%5,000 - 9,999
11%
20,000 - 49,999
10%
1,000 - 2,499
9%
50,000+
10,000 - 19,999
Industry: Market Research
Healthcare/Medical
Media
5%
5%
Manufacturing
8%
Travel/Hospitality/Entertainment
Remaining Values
25%
4%
Education
4%
Finance
9%Advertising/Marketing
9%Computers &
Technology
16%Retail & Consumer Goods
14%
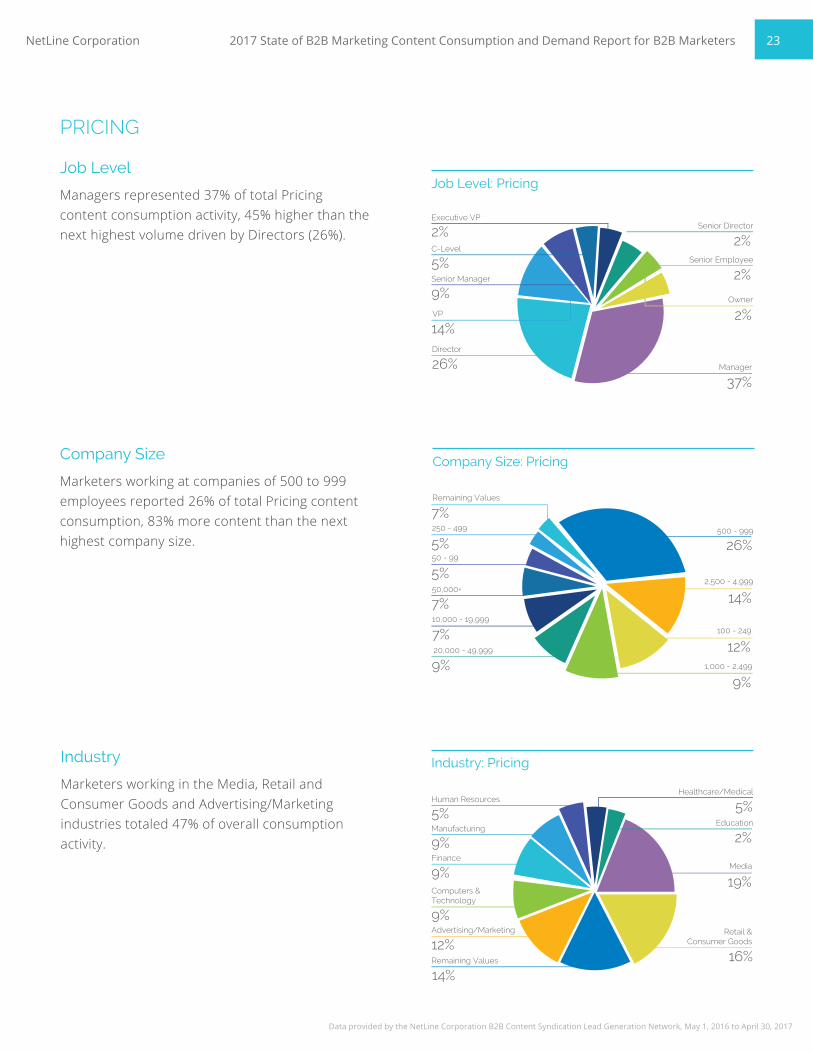
PRICING
Job Level
Managers represented 37% of total Pricing content consumption activity, 45% higher than the next highest volume driven by Directors (26%).
Industry
Marketers working in the Media, Retail and Consumer Goods and Advertising/Marketing industries totaled 47% of overall consumption activity.
2017 State of B2B Marketing Content Consumption and Demand Report for B2B Marketers 23NetLine Corporation
Industry: Pricing
Company Size
Marketers working at companies of 500 to 999 employees reported 26% of total Pricing content consumption, 83% more content than the next highest company size.
Data provided by the NetLine Corporation B2B Content Syndication Lead Generation Network, May 1, 2016 to April 30, 2017
Job Level: Pricing
Company Size: Pricing
2,500 - 4,999
12%
26%
100 - 249
5%
5%
Remaining Values
250 - 499
7%
7%
500 - 999
7%
50 - 99
14%
20,000 - 49,999
9%1,000 - 2,4999%
50,000+
10,000 - 19,999
Human Resources
Manufacturing
9%
5%
Finance
9%
Education
Media
19%
2%
Healthcare/Medical
5%
Computers &Technology
9%Advertising/Marketing
12%Retail &
Consumer Goods
16%Remaining Values
14%
VP
14%Director
26%
Owner
2%
Senior Employee
2%
Executive VP
2%C-Level
5%
Senior Director
2%
Senior Manager
9%
Manager
37%

PRODUCT MARKETING
Job Level
Unlike any other category, Owners surfaced as the highest job level consuming Product Marketing content, 23%. Managers, Directors, and C-level professionals followed at 11 to 18% of the total volume. Product Marketing reported the highest C-level activity rate.
Industry
Marketers working in the Advertising/Marketing industry represented 22% of Product Marketing content engagement, 14% from Retail and Consumer Goods industry and 8% Manufacturing industry.
24 2017 State of B2B Marketing Content Consumption and Demand Report for B2B Marketers NetLine Corporation
Job Level: Product Marketing
Director
15%Manager
18%
Executive VP
Remaining Values
7%
3%
Senior Director
4%
VP
6%Senior Manager
7%
Individual Contributor
6%
C-Level
11%
Owner
23%
Company Size
Professionals working at small boutique-sized companies totaled 26% of the total Product Marketing content consumption. Enterprise-level businesses drove 13% of the volume.
Data provided by the NetLine Corporation B2B Content Syndication Lead Generation Network, May 1, 2016 to April 30, 2017
Company Size: Product Marketing
12%
26%
100 - 249
6%
5%
RemainingValues
5%
6%500 - 999
6%
18%
25 - 49
9%
1,000 - 2,499
8%
50,000+ 1 - 4
50 - 99
5 - 9
10 - 24
Industry: Product Marketing
Human Resources
Finance
5%
5%
Healthcare/Medical
6%
Computers & Technology
Advertising/Marketing
22%
5%
5%
Media
8%Manufacturing
8%Remaining Values
22%Retail &Consumer Goods
14%
BoFu3%
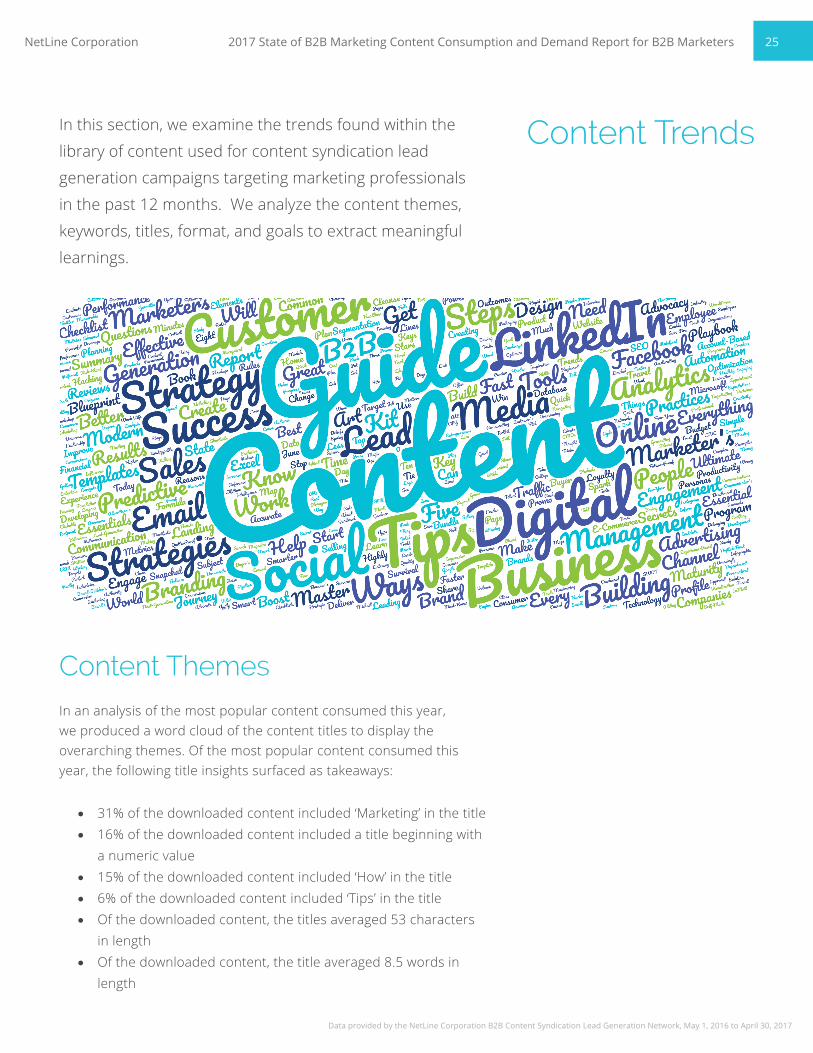
Content TrendsIn this section, we examine the trends found within the
library of content used for content syndication lead
generation campaigns targeting marketing professionals
in the past 12 months. We analyze the content themes,
keywords, titles, format, and goals to extract meaningful
learnings.
Content Themes In an analysis of the most popular content consumed this year, we produced a word cloud of the content titles to display the overarching themes. Of the most popular content consumed this year, the following title insights surfaced as takeaways:
• 31% of the downloaded content included ‘Marketing’ in the title• 16% of the downloaded content included a title beginning with
a numeric value• 15% of the downloaded content included ‘How’ in the title• 6% of the downloaded content included ‘Tips’ in the title• Of the downloaded content, the titles averaged 53 characters
in length• Of the downloaded content, the title averaged 8.5 words in
length
2017 State of B2B Marketing Content Consumption and Demand Report for B2B Marketers 25NetLine Corporation
Data provided by the NetLine Corporation B2B Content Syndication Lead Generation Network, May 1, 2016 to April 30, 2017
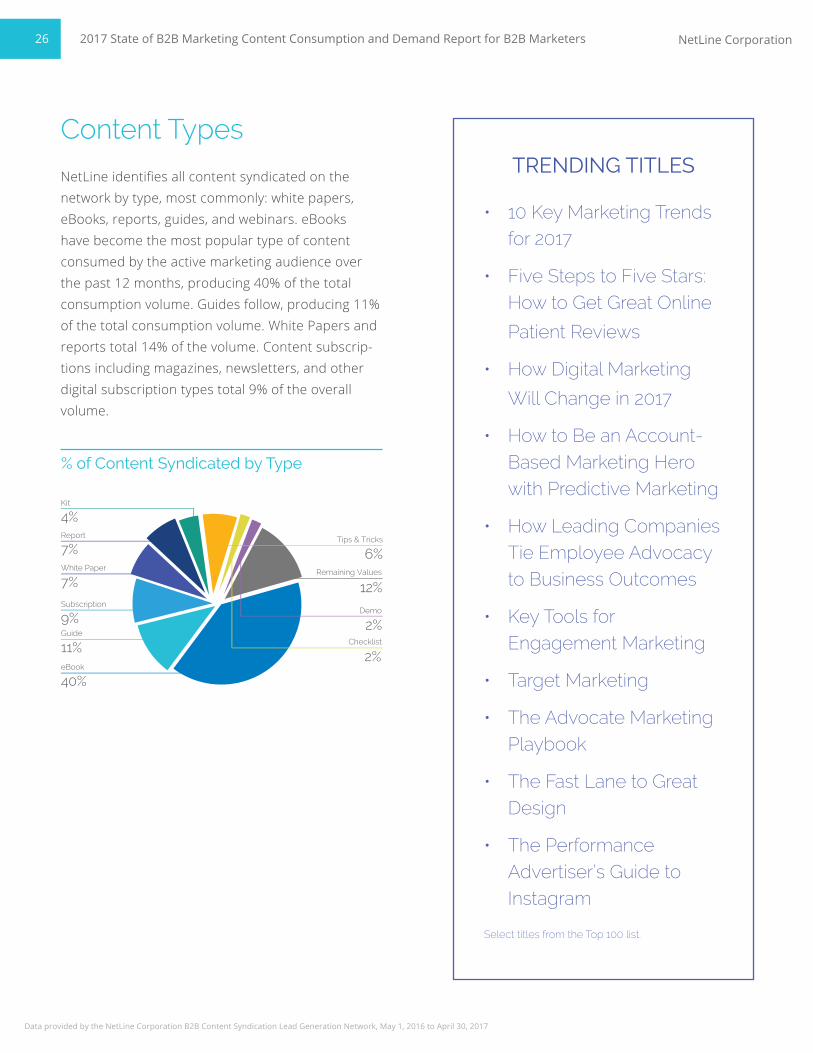
Content Types
NetLine identifies all content syndicated on the network by type, most commonly: white papers, eBooks, reports, guides, and webinars. eBooks have become the most popular type of content consumed by the active marketing audience over the past 12 months, producing 40% of the total consumption volume. Guides follow, producing 11% of the total consumption volume. White Papers and reports total 14% of the volume. Content subscrip-tions including magazines, newsletters, and other digital subscription types total 9% of the overall volume.
• 10 Key Marketing Trends for 2017
• Five Steps to Five Stars: How to Get Great Online
Patient Reviews
• How Digital Marketing
Will Change in 2017
• How to Be an Account-Based Marketing Hero with Predictive Marketing
• How Leading Companies Tie Employee Advocacy to Business Outcomes
• Key Tools for Engagement Marketing
• Target Marketing
• The Advocate Marketing Playbook
• The Fast Lane to Great Design
• The Performance Advertiser’s Guide to Instagram
Select titles from the Top 100 list.
TRENDING TITLES
% of Content Syndicated by Type
Data provided by the NetLine Corporation B2B Content Syndication Lead Generation Network, May 1, 2016 to April 30, 2017
26 2017 State of B2B Marketing Content Consumption and Demand Report for B2B Marketers NetLine Corporation
Kit
Report
7%
4%
White Paper
7%Subscription
9%Guide
11%eBook
40%
Tips & Tricks
Remaining Values
12%
6%
Demo
2%Checklist
2%
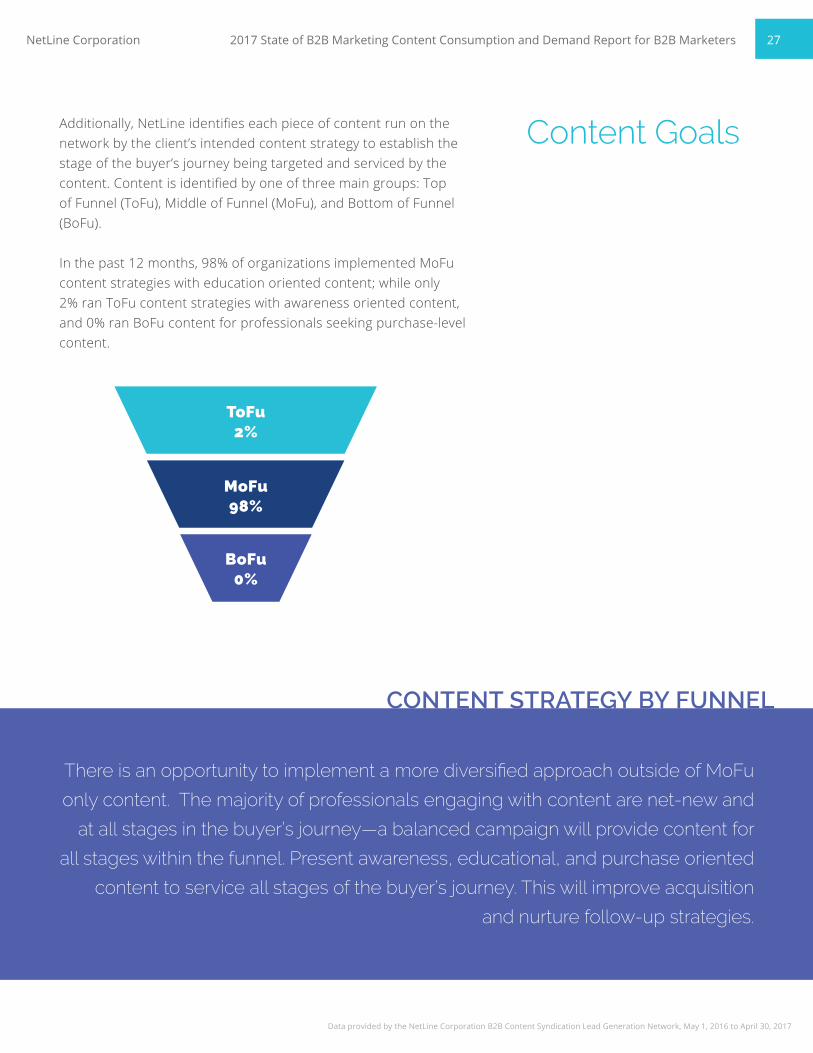
Additionally, NetLine identifies each piece of content run on the network by the client’s intended content strategy to establish the stage of the buyer’s journey being targeted and serviced by the content. Content is identified by one of three main groups: Top of Funnel (ToFu), Middle of Funnel (MoFu), and Bottom of Funnel (BoFu).
In the past 12 months, 98% of organizations implemented MoFu content strategies with education oriented content; while only 2% ran ToFu content strategies with awareness oriented content, and 0% ran BoFu content for professionals seeking purchase-level content.
MoFu98%
BoFu0%
ToFu2%
CONTENT STRATEGY BY FUNNEL
There is an opportunity to implement a more diversified approach outside of MoFu
only content. The majority of professionals engaging with content are net-new and
at all stages in the buyer’s journey—a balanced campaign will provide content for
all stages within the funnel. Present awareness, educational, and purchase oriented
content to service all stages of the buyer’s journey. This will improve acquisition
and nurture follow-up strategies.
Data provided by the NetLine Corporation B2B Content Syndication Lead Generation Network, May 1, 2016 to April 30, 2017
Content Goals
2017 State of B2B Marketing Content Consumption and Demand Report for B2B Marketers 27NetLine Corporation
Summary
Content marketing success in today’s
competitive environment is dependent
upon making smarter decisions driven
by actionable data. Increasingly, B2B
marketers will need to rely on insights
being discovered by third party marketing
technology stack solutions with direct
access to data (first and third party) versus
their own company’s internal stakeholders.
Performance-based goals have led to stricter
forms of measurement holding marketers
accountable for their budget and ROI,
emphasizing the importance of lead-based
and revenue-driving opportunities.
This year, marketers must optimize their
demand generation strategy to drive
meaningful and measurable results. NetLine
Corporation has identified three key
opportunities to leverage at each stage of
your strategy to drive success in 2017:
CONTENT STRATEGY | STAGES OF THE FUNNEL
The competitive landscape of long-form content has been heavily saturated by Middle of Funnel (MoFu) content—98% of marketing campaigns in the past 12 months. While the entire competitive landscape is seeding the market with MoFu content, take this opportunity to offer supplemental content that
1
2
speaks to the needs of professionals focused on more decision oriented topics. Implement a balanced content strategy with resources for all stages of the buyer’s journey. Pivot the target persona wisely for each asset within the campaign to specifically reach professionals known to be aligned with in-market and intent-driven positions. Doing so will allow marketers to translate anonymous personas into further down the funnel prospects.
TARGET STRATEGY | ATTACK THE INFLUENCERS
In the past year, 65% of campaigns excluded 17% of the active marketing audience. Do not continue to make this mistake. Senior leadership will remain an important target for lead generation campaigns; however, organizations must realize that senior leadership does not drive the same level of content consumption activity. Pivot focus to the influencers, the diverse profile of professionals within the marketing buying committee, including Managers, Senior Employees, and Individual Contributors—as well as Contractors and Consultants. Build deeper influence within the organization by expanding your target range outside marketing senior leadership and target the professionals that advise them. Deeper influence within the organization will directly build greater credibility, an often underestimated attribute associated to the vendor selection process.
28 2017 State of B2B Marketing Content Consumption and Demand Report for B2B Marketers NetLine Corporation
Data provided by the NetLine Corporation B2B Content Syndication Lead Generation Network, May 1, 2016 to April 30, 2017
NURTURE STRATEGY | MIND THE CONSUMPTION GAP
The average timespan between the moment a person requests your content and the moment your content is opened by the person is the Content Consumption Gap. In the past 12 months, the average Content Consumption Gap for marketing professionals was 38 hours. Nurturing a new lead is 100% as important as generating a net-new lead; therefore, NetLine’s recommendation is to allow for at least two days prior to lead follow-up on long-form content consumption to ensure effective conversations with prospects. Making the mistake of immediate contact will waste your team’s time and possibly alarm the prospect.
As reported by the 28% increase of content
consumption activity in the past 12 months,
marketing professionals are showing a growing
demand for long-form content. Content
syndication has become a proven solution for
organizations to reach decision makers actively
consuming content to generate quality
intent-based leads. Organizations must
capitalize on this opportunity by producing
the resources that the content consuming
marketing audience demands—to stay
top of mind, solve their problems, and aid
purchase decisions.
Finally, the “B2B Content Marketing 2017:
Benchmarks, Budgets, and Trends—North
America Report” by Content Marketing
Institute reported that 80% of marketers
3 cited ‘lead generation’ as their organization’s
goal for the next 12 months; however, when
questioned which paid methods marketers
will use to promote their content, zero cited
lead-based methods. Social promotion,
search engine marketing, and banner ads
each offer impression- or click-based pricing
models with no commitment to deliver
quality lead generation results. The findings
shared within the Content Marketing
Institute report show that marketers are
taking a disconnected approach.
Content syndication lead generation is a vital
solution for driving B2B marketing success.
Exceed your performance goals this year
by optimizing your approach with data
driven insights extracted from 8.5 million
leads processed by NetLine Corporation.
2017 State of B2B Marketing Content Consumption and Demand Report for B2B Marketers 29NetLine Corporation
Data provided by the NetLine Corporation B2B Content Syndication Lead Generation Network, May 1, 2016 to April 30, 2017
Implementing a campaign with a cost-
per-click (CPC) or cost-per-thousand
impressions (CPM) pricing model does
not equate to lead generation. In
addition to NetLine’s three takeaways
for 2017, it’s integral that marketers
position themselves to succeed by
running cost-per-lead campaigns
guaranteed to deliver leads and meet
performance-based goals.
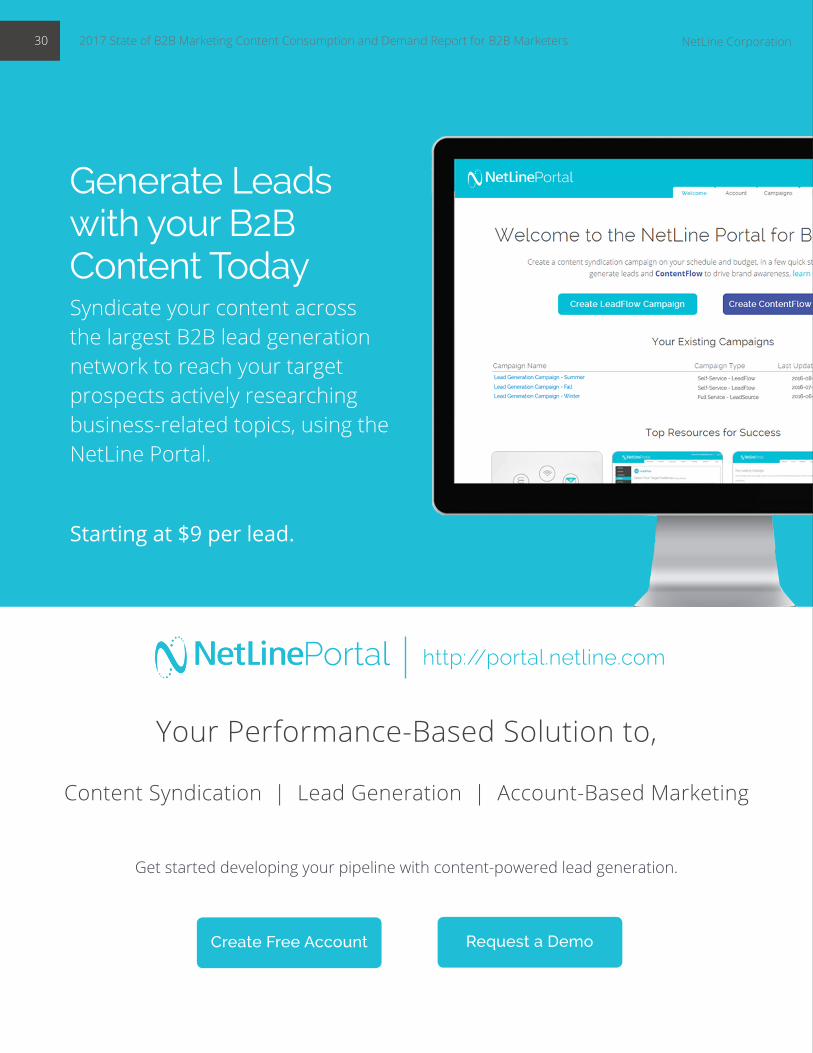
Your Performance-Based Solution to,
Content Syndication | Lead Generation | Account-Based Marketing
Generate Leadswith your B2BContent TodaySyndicate your content across the largest B2B lead generation network to reach your target prospects actively researching business-related topics, using the NetLine Portal.
Starting at $9 per lead.
http://portal.netline.com
Create Free Account Request a Demo
30 2017 State of B2B Marketing Content Consumption and Demand Report for B2B Marketers NetLine Corporation
Get started developing your pipeline with content-powered lead generation.
NetLine Corporation empowers B2B Marketers with
the reach, technology, and expertise required to drive
scalable lead generation results and accelerate the sales
funnel. Operating the largest B2B content syndication
lead generation network, NetLine reaches 125 million
unique visitors and processes more than 700 thousand
leads monthly across 300 industry sectors. NetLine’s
AudienceTarget™ technology drives prospect discovery,
quality customer lead acquisition, and buyer engagement
from real prospect intent as professionals consume
content directly across the network. Superior quality, on
demand access, and advanced campaign reports enable
all clients to achieve lead generation success. Founded
in 1994, NetLine is privately held and headquartered in
Los Gatos, California. Successful B2B Marketers Start with
NetLine, visit www.netline.com.
As the #1 B2B Content Syndication Lead Generation
Network we feel that it is important to share with you
how we do business. NetLine operates following five
core values: innovation, teamwork, integrity, customer
satisfaction, and accountability. Our advanced technology
and massive scale are uniquely positioned to achieve the
results marketers are looking for. NetLine’s performance-
based Portal and our dedicated team of experienced lead
generation experts ensure that you will only pay for leads
that meet your assigned campaign objectives – nothing
less. Expand your footprint and gain competitive market
share.
Read more about our commitment to you.
AboutNetLineCorporation
NetLine Corporation | Successful B2B Marketers Start Here.www.netline.com
OurCommitmentto You
2017 State of B2B Marketing Content Consumption and Demand Report for B2B Marketers 31NetLine Corporation