B U D G E T - wvwd.org
72
B U D G E T FISCAL YEAR 2017 - 2018
Transcript of B U D G E T - wvwd.org
WEST VALLEY WATER DISTRICTP a g e 1
B U D G E TFISCAL YEAR 2017 - 2018
T A B L E O F C O N T E N T S
BUDGET MESSAGE ............................................................................. 1 Our History ..................................................................................... 5 Organizational Structure ............................................................ 6 Vision • Mission • Values ............................................................. 7 FINANCIAL SUMMARY ....................................................................... 9 Operating Budget Summary .................................................... 10 Budget Summary by Object ...................................................... 11 Proposed FY 2017-18 Budget Per Division .......................... 13 DEPARTMENT SUMMARIES .............................................................. 15 Source of Supply ......................................................................... 16 Production - Pumping ............................................................... 18 Water Quality ............................................................................... 20 Water Treatment ........................................................................ 22 Maintenance - Transmission and Distribution .................... 26 External Affairs ............................................................................ 28 Grants & Rebates ....................................................................... 32 Customer Service ....................................................................... 34 Meter Reading ............................................................................ 36
Billing ............................................................................................. 38 Administration ............................................................................. 40 Accounting ................................................................................... 42 Engineering ................................................................................. 44 Information Technology ........................................................... 48 Board of Directors ..................................................................... 52 Human Resources ..................................................................... 54 Purchasing ................................................................................... 58 General Operations ................................................................... 60 Debt Service ................................................................................ 62 CAPITAL IMPROVEMENT PLAN ....................................................... 63 Projects Completed in FY 2016-17 ........................................ 64 Ongoing Capital Improvement Projects .............................. 65 Capital Improvement Plan Distribution ................................ 65 FY 2017-18 Capital Improvement Plan ................................. 66 Replacement / Rehabilitation of System Assets Project Descriptions ................................................................................ 67 New System Assets Project Descriptions ........................... 69
BUDGET FISCAL YEAR 2017 - 2018
WEST VALLEY WATER DISTRICT P a g e 1
BUDGET MESSAGE
To the Board of Directors of West Valley Water District:
I am pleased to present the Operating and Capital Improvement Budget for July 1, 2017 to June 30, 2018. The Fiscal Year (FY) 2017-18 Proposed Budget is balanced without rate increases, addressing the West Valley Water District’s (“District”) operating and capital improvement priorities for an aging infrastructure system.
Prior to adopting these budgets, a public workshop was held on June 5, 2017. The budget process this year was similar to last year’s process utilizing modified zero-based budgeting principles for all departments and included both management and staff in the process.
FY 2017-18 Revenue Highlights
• Monthly Service charges reflect the projection of a 4.8% increase due to an increase in service connections. Due to new building codes, all new service requests on new construction require 1” service connections.
• Water Consumption Sales reflect a 23% reduction in consumption from 2013 base year.
• Contract Revenue reflects the annual reimbursement from United Technologies Corporation (UTC) to fund the Groundwater Wellhead System Treatment Project Fluidized Bed Reactor (FBR) plant. FBR cost reimbursement is capped at $700,000 through December 31, 2017; however, effective January 1, 2018, actual operating costs for the FBR will be reimbursed per the terms of the UTC Agreement.
• Based on current projections, it is estimated that the District will have net revenues of $5.5 million at the end of FY 2016-17. These net revenues include debt service and can be used to fund critical capital improvement projects next fiscal year.
• Overall, revenues are projected to increase by 5% for a total of $26,829,073 in FY 2017-18.
Operational Budget Highlights
Personnel Salary and Benefits Included in the proposed budget are recommendations made by the Employee Salary Committee and Human Resources Committee, and approved by the Board of Directors. These recommendations include a 2.5% Cost of Living Adjustment (COLA) for all employees, a limited employer match to the District’s 457 Deferred Compensation Plan. These recommendations include the continuation of all current employee benefits and merit increases based on the existing salary schedule.
Source of Supply Decreased as additional deliveries of State Water Project water were adjusted to reflect more realistic delivery schedules.
WEST VALLEY WATER DISTRICT
WEST VALLEY WATER DISTRICT P a g e 2
Production Increased due to the addition of a full time Electrical and Supervisory Control and Data Acquisition System (SCADA) Technician position to address a long standing backlog of maintenance activities at all facilities and for succession planning. Water Quality Increased by 19% primarily due to the US Environmental Protection Agency (US EPA) mandated Fourth Unregulated Contaminant Monitoring Rule (UCMR-4), per the 1996 amendments to the Safe Drinking Water Act. Additionally, funding for the replacement of broken fire hydrant meters and various system blow-offs to support the distribution flushing program is included. Water Treatment Increased by 12% primarily due to the addition of the Fixed Bed (FXB) Perchlorate Treatment Plant line items in the budget. These are estimates until such time when actual operating costs can be quantified. External Affairs / Conservation Decreased by 40% primarily due to the transfer of rebate programs and grants to a new department unit titled Grants & Rebates (5020). Engineering Increased by 23.6% primarily due to the need to conduct a Capacity Fee Study upon conclusion of the 2017 Master Plan update later this year. A new full-time Assistant Engineer position was also added to bolster the Capital Improvement Plan (CIP) program.
Capital Improvement Plan Budget Highlights
Some notable accomplishments from FY 2016-17 included the procurement of two additional Granular Activated Carbon (GAC) lead-lag vessels that will allow the District to treat up to an additional 2,000 gallons per minute (2.9 million gallons per day) of State Water Project water at the Oliver P. Roemer Water Filtration Facility. This project is expected to be completed in Fall 2017. In addition, the District, in collaboration with Carollo Engineers under a design-build delivery contract, is in the final stages of the FXB Perchlorate Treatment Plant construction project, which will add 700 gallons per minute (1.0 MGD) of perchlorate removal capacity to the existing FBR capacity of 2.9 MGD, for a total plant capacity of 3.9 MGD. The District’s portion of the FXB construction was funded by the Cleanup and Abatement Account (CAA) grant awarded to the District by the State Water Resources Control Board in 2016. As noted above, net revenues are available to help supplement the CIP budget for FY 2017-18. The CIP totals $7.98 million and includes $2.2 million in new system infrastructure; $4.16 million in repairs, rehabilitation, and system maintenance; and $1.62 million in other projects. Some notable CIP projects are as follows:
Rehabilitation/Recoating of Reservoir 4-3 ($1.13 million) Reservoir 4-3 was taken out of service last year for maintenance and it was revealed that severe corrosion in the interior roof of the reservoir has occurred. Allowing this corrosion to continue will jeopardize the structural integrity of the reservoir. Recoating the interior and exterior of the reservoir will significantly extend the life of the asset. Highland Avenue 30” Transmission Main – Pepper Ave to Oakdale Ave ($1.45 million) This project is a critical link to provide additional water supply from the Bunker Hill Groundwater Basin via the Baseline Feeder to the District’s rapidly developing upper pressure zones. It will connect to the 30” Transmission Main at Pepper Avenue and the I-210 on and off ramp project, currently under construction. Zone 3 Distribution Pipeline Replacement – 8” in Valley/Pomona ($750,000) This project will replace aging pipelines in the community of Bloomington. Pipelines in this area have repeatedly been repaired due to leaks. This project will improve circulation for water quality, fire flow, and will provide a more reliable service to our customers in the area.
WEST VALLEY WATER DISTRICT P a g e 3
Other Critical Projects Funds various other critical projects such as the customer service foyer renovation, new enterprise system software, distribution and plant valve replacements, emergency generators the pumping stations for Zones 5 and 6, plastic service lateral replacements, filter media replacement, and other annual maintenance needs at District water infrastructure facilities.
Conclusion
In order to build upon the District’s Mission, Vision, and Values adopted by the Board of Directors in April 2017, a Request for Proposal is scheduled to be brought forward in early FY 2017-18 to develop a districtwide strategic plan. The Strategic Plan will include goals and objectives as well as measures of success that will further inform investments made in the current and future fiscal years.
In closing, I would like to offer a special thank you to the West Valley Water District Board Finance Committee who worked thoroughly to help develop this budget. I also want to thank District staff for the countless hours and diligent work to provide you with this document.
Respectfully,
Matthew H. Litchfield, P.E. GENERAL MANAGER
General Manager MATTHEW H. LITCHFIELD, P.E.
Board Secretary SHANAE SMITH
Chief Financial Officer MARIE RICCI
Human Resources Risk Manager KAREN LOGUE
External Affairs Manager WENDY STRACK
EXECUTIVE STAFF Assistant General Manager GREG GAGE

WEST VALLEY WATER DISTRICT P a g e 4
This page is intentionally left blank.
WEST VALLEY WATER DISTRICT P a g e 5
Our History
West Valley Water District serves approximately 80,000 people, spanning two counties in Southern California in a 29.5 square-mile area, including portions of the communities of Bloomington, Colton, Fontana, Rialto, San Bernardino, and Jurupa Valley. As defined by CalEnviroScreen, the majority of our service area is considered a Disadvantaged Community (DAC).
Our mission is to provide our customers with safe, high quality and reliable water service at a reasonable rate and in a sustainable manner. Our history began on February 28, 1952, when our forbearer, West San Bernardino County Water District, became the owner and operator of three local mutual water companies. This friendly acquisition saved the communities' water rights and assets from condemnation. It was in this acquisition that the District became the owner of water rights dating back to 1897. During those early years, the District supplied more water for agricultural purposes than for domestic use.
During the 1970's and 1980's, the District grew and homes, businesses and schools soon surpassed agricultural water use. There were other mergers where smaller water companies became a part of the District. By the end of the 1980's, our water facilities included 180 miles of pipeline, 12 reservoirs and 15 water wells. It was during this time that the District built its office and maintenance yard on Base Line Road in Rialto, where we are still located today.
In 1992, the District was a partner in building five miles of new pipeline to bring much needed water from the Bunker Hill Basin in San Bernardino to our area. Continuing the trend of working with our neighbors, in 1993, the District partnered with the City of Rialto to build a treatment facility for the water flowing from Lytle Creek. The Oliver P. Roemer Water Filtration Facility has been expanded twice and also accepts and treats State Project Water, which increases the amount of water available for our customers. In 2003, we changed our name to West Valley Water District.
Currently, we have five treatment plants, 360 miles of pipeline, 25 reservoirs, 23 wells, and over 20,000 service connections. Last year, the District made environmental clean-up history, delivering clean drinking water to our customers using our $23 million Groundwater Wellhead Treatment System, also known as a fluidized bed reactor (FBR), to remove perchlorate from previously contaminated supplies. Using innovative technologies, the District was able to create a safe and clean water supply that is delivered directly to customers, pioneering the future of water treatment.
This year, the District celebrated its 65th anniversary. Our customers continue to enjoy safe, affordable drinking water that is still less than a penny a gallon. The District looks forward to serving its customers and the community for the next 65 years and beyond.
EXCELLENCE IN WATER QUALITY, RELIABILITY, AND INNOVATION

WEST VALLEY WATER DISTRICT P a g e 6
Organizational Structure
WEST VALLEY WATER DISTRICT P a g e 7
Vision • Mission • Values
Vision
The West Valley Water District will continue to be a national model in the water industry for innovation, fiscal responsibility, sound conservation practices, and a relentless commitment to our employees and the community we serve.
Mission
The West Valley Water District provides our customers with safe, high quality and reliable water service at a reasonable rate and in a sustainable manner.
Values
Innovation West Valley Water District encourages innovation, creativity and ingenuity as we constantly seek to strengthen our services, programs and practices to ensure our customers receive clean, high quality and reliable water service at a competitive rate.
Exceptional Customer Service West Valley Water District demonstrates its daily commitment to exceptional service through respectful, prompt and courteous interactions with our customers and by engaging in partnerships with the community and other agencies that further the public good.
Employee Development As an agency that offers a diverse and transparent work environment, West Valley Water District encourages the personal and professional growth of our employees so that each can thrive and achieve their potential while earning a competitive compensation package.
Integrity & Transparency West Valley Water District will maintain the highest standards of ethical and honest business practices in all of our operations. We embrace transparency, openness and accountability to ensure clear communications with our customers and the public we have the privilege of serving.
Environmental Stewardship West Valley Water District is dedicated to preserving and enhancing the environment by complying with all regulations and following sound environmental practices. West Valley Water District will continue to educate the public on the role and importance of conservation in protecting nature's most precious resource, water.
P a g e 7

WEST VALLEY WATER DISTRICT P a g e 8
This page is intentionally left blank.
WEST VALLEY WATER DISTRICT P a g e 9
FINANCIAL SUMMARY P a g e 9
PROPOSED BUDGET FY 2017-18
WEST VALLEY WATER DISTRICT P a g e 10
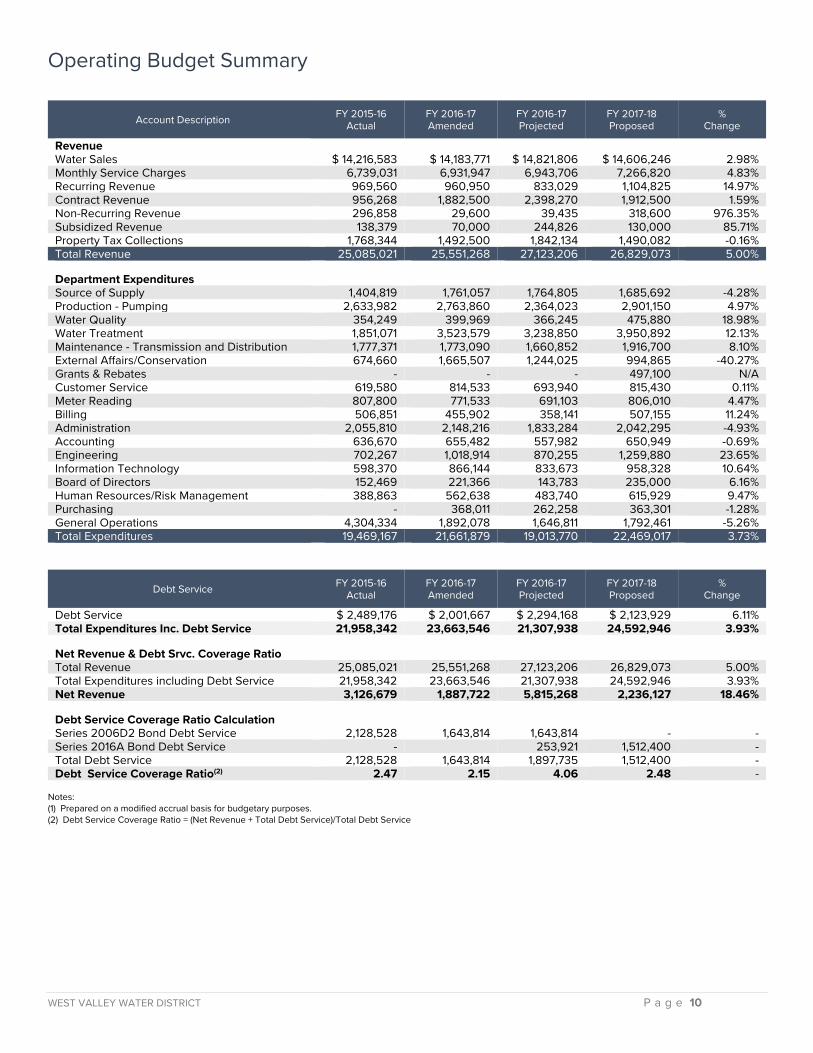
Operating Budget Summary
Account Description FY 2015-16 Actual
FY 2016-17 Amended
FY 2016-17 Projected
FY 2017-18 Proposed
% Change
Revenue Water Sales $ 14,216,583 $ 14,183,771 $ 14,821,806 $ 14,606,246 2.98% Monthly Service Charges 6,739,031 6,931,947 6,943,706 7,266,820 4.83% Recurring Revenue 969,560 960,950 833,029 1,104,825 14.97% Contract Revenue 956,268 1,882,500 2,398,270 1,912,500 1.59% Non-Recurring Revenue 296,858 29,600 39,435 318,600 976.35% Subsidized Revenue 138,379 70,000 244,826 130,000 85.71% Property Tax Collections 1,768,344 1,492,500 1,842,134 1,490,082 -0.16% Total Revenue 25,085,021 25,551,268 27,123,206 26,829,073 5.00% Department Expenditures Source of Supply 1,404,819 1,761,057 1,764,805 1,685,692 -4.28% Production - Pumping 2,633,982 2,763,860 2,364,023 2,901,150 4.97% Water Quality 354,249 399,969 366,245 475,880 18.98% Water Treatment 1,851,071 3,523,579 3,238,850 3,950,892 12.13% Maintenance - Transmission and Distribution 1,777,371 1,773,090 1,660,852 1,916,700 8.10% External Affairs/Conservation 674,660 1,665,507 1,244,025 994,865 -40.27% Grants & Rebates - - - 497,100 N/A Customer Service 619,580 814,533 693,940 815,430 0.11% Meter Reading 807,800 771,533 691,103 806,010 4.47% Billing 506,851 455,902 358,141 507,155 11.24% Administration 2,055,810 2,148,216 1,833,284 2,042,295 -4.93% Accounting 636,670 655,482 557,982 650,949 -0.69% Engineering 702,267 1,018,914 870,255 1,259,880 23.65% Information Technology 598,370 866,144 833,673 958,328 10.64% Board of Directors 152,469 221,366 143,783 235,000 6.16% Human Resources/Risk Management 388,863 562,638 483,740 615,929 9.47% Purchasing - 368,011 262,258 363,301 -1.28% General Operations 4,304,334 1,892,078 1,646,811 1,792,461 -5.26% Total Expenditures 19,469,167 21,661,879 19,013,770 22,469,017 3.73%
Debt Service FY 2015-16 Actual
FY 2016-17 Amended
FY 2016-17 Projected
FY 2017-18 Proposed
% Change
Debt Service $ 2,489,176 $ 2,001,667 $ 2,294,168 $ 2,123,929 6.11% Total Expenditures Inc. Debt Service 21,958,342 23,663,546 21,307,938 24,592,946 3.93% Net Revenue & Debt Srvc. Coverage Ratio Total Revenue 25,085,021 25,551,268 27,123,206 26,829,073 5.00% Total Expenditures including Debt Service 21,958,342 23,663,546 21,307,938 24,592,946 3.93% Net Revenue 3,126,679 1,887,722 5,815,268 2,236,127 18.46% Debt Service Coverage Ratio Calculation Series 2006D2 Bond Debt Service 2,128,528 1,643,814 1,643,814 - - Series 2016A Bond Debt Service - 253,921 1,512,400 - Total Debt Service 2,128,528 1,643,814 1,897,735 1,512,400 - Debt Service Coverage Ratio(2) 2.47 2.15 4.06 2.48 -
Notes: (1) Prepared on a modified accrual basis for budgetary purposes. (2) Debt Service Coverage Ratio = (Net Revenue + Total Debt Service)/Total Debt Service
WEST VALLEY WATER DISTRICT P a g e 11
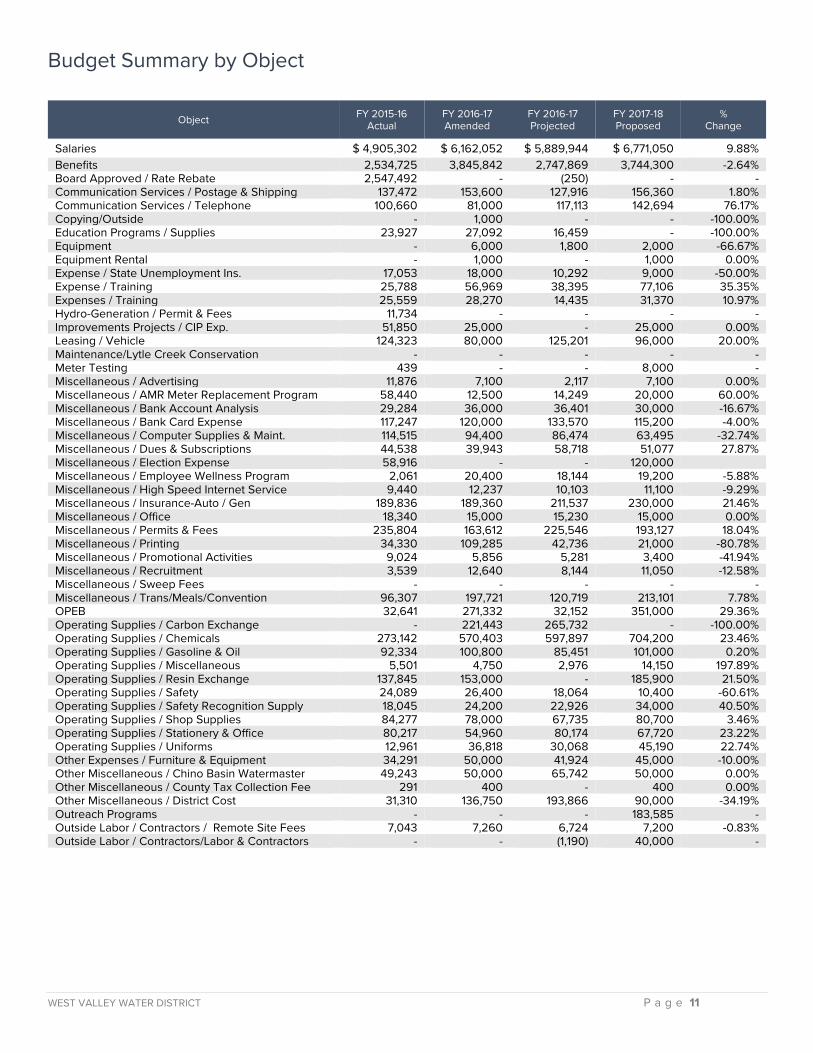
Budget Summary by Object
Object FY 2015-16 Actual
FY 2016-17 Amended
FY 2016-17 Projected
FY 2017-18 Proposed
% Change
Salaries $ 4,905,302 $ 6,162,052 $ 5,889,944 $ 6,771,050 9.88% Benefits 2,534,725 3,845,842 2,747,869 3,744,300 -2.64% Board Approved / Rate Rebate 2,547,492 - (250) - - Communication Services / Postage & Shipping 137,472 153,600 127,916 156,360 1.80% Communication Services / Telephone 100,660 81,000 117,113 142,694 76.17% Copying/Outside - 1,000 - - -100.00% Education Programs / Supplies 23,927 27,092 16,459 - -100.00% Equipment - 6,000 1,800 2,000 -66.67% Equipment Rental - 1,000 - 1,000 0.00% Expense / State Unemployment Ins. 17,053 18,000 10,292 9,000 -50.00% Expense / Training 25,788 56,969 38,395 77,106 35.35% Expenses / Training 25,559 28,270 14,435 31,370 10.97% Hydro-Generation / Permit & Fees 11,734 - - - - Improvements Projects / CIP Exp. 51,850 25,000 - 25,000 0.00% Leasing / Vehicle 124,323 80,000 125,201 96,000 20.00% Maintenance/Lytle Creek Conservation - - - - - Meter Testing 439 - - 8,000 - Miscellaneous / Advertising 11,876 7,100 2,117 7,100 0.00% Miscellaneous / AMR Meter Replacement Program 58,440 12,500 14,249 20,000 60.00% Miscellaneous / Bank Account Analysis 29,284 36,000 36,401 30,000 -16.67% Miscellaneous / Bank Card Expense 117,247 120,000 133,570 115,200 -4.00% Miscellaneous / Computer Supplies & Maint. 114,515 94,400 86,474 63,495 -32.74% Miscellaneous / Dues & Subscriptions 44,538 39,943 58,718 51,077 27.87% Miscellaneous / Election Expense 58,916 - - 120,000 Miscellaneous / Employee Wellness Program 2,061 20,400 18,144 19,200 -5.88% Miscellaneous / High Speed Internet Service 9,440 12,237 10,103 11,100 -9.29% Miscellaneous / Insurance-Auto / Gen 189,836 189,360 211,537 230,000 21.46% Miscellaneous / Office 18,340 15,000 15,230 15,000 0.00% Miscellaneous / Permits & Fees 235,804 163,612 225,546 193,127 18.04% Miscellaneous / Printing 34,330 109,285 42,736 21,000 -80.78% Miscellaneous / Promotional Activities 9,024 5,856 5,281 3,400 -41.94% Miscellaneous / Recruitment 3,539 12,640 8,144 11,050 -12.58% Miscellaneous / Sweep Fees - - - - - Miscellaneous / Trans/Meals/Convention 96,307 197,721 120,719 213,101 7.78% OPEB 32,641 271,332 32,152 351,000 29.36% Operating Supplies / Carbon Exchange - 221,443 265,732 - -100.00% Operating Supplies / Chemicals 273,142 570,403 597,897 704,200 23.46% Operating Supplies / Gasoline & Oil 92,334 100,800 85,451 101,000 0.20% Operating Supplies / Miscellaneous 5,501 4,750 2,976 14,150 197.89% Operating Supplies / Resin Exchange 137,845 153,000 - 185,900 21.50% Operating Supplies / Safety 24,089 26,400 18,064 10,400 -60.61% Operating Supplies / Safety Recognition Supply 18,045 24,200 22,926 34,000 40.50% Operating Supplies / Shop Supplies 84,277 78,000 67,735 80,700 3.46% Operating Supplies / Stationery & Office 80,217 54,960 80,174 67,720 23.22% Operating Supplies / Uniforms 12,961 36,818 30,068 45,190 22.74% Other Expenses / Furniture & Equipment 34,291 50,000 41,924 45,000 -10.00% Other Miscellaneous / Chino Basin Watermaster 49,243 50,000 65,742 50,000 0.00% Other Miscellaneous / County Tax Collection Fee 291 400 - 400 0.00% Other Miscellaneous / District Cost 31,310 136,750 193,866 90,000 -34.19% Outreach Programs - - - 183,585 - Outside Labor / Contractors / Remote Site Fees 7,043 7,260 6,724 7,200 -0.83% Outside Labor / Contractors/Labor & Contractors - - (1,190) 40,000 -
WEST VALLEY WATER DISTRICT P a g e 12
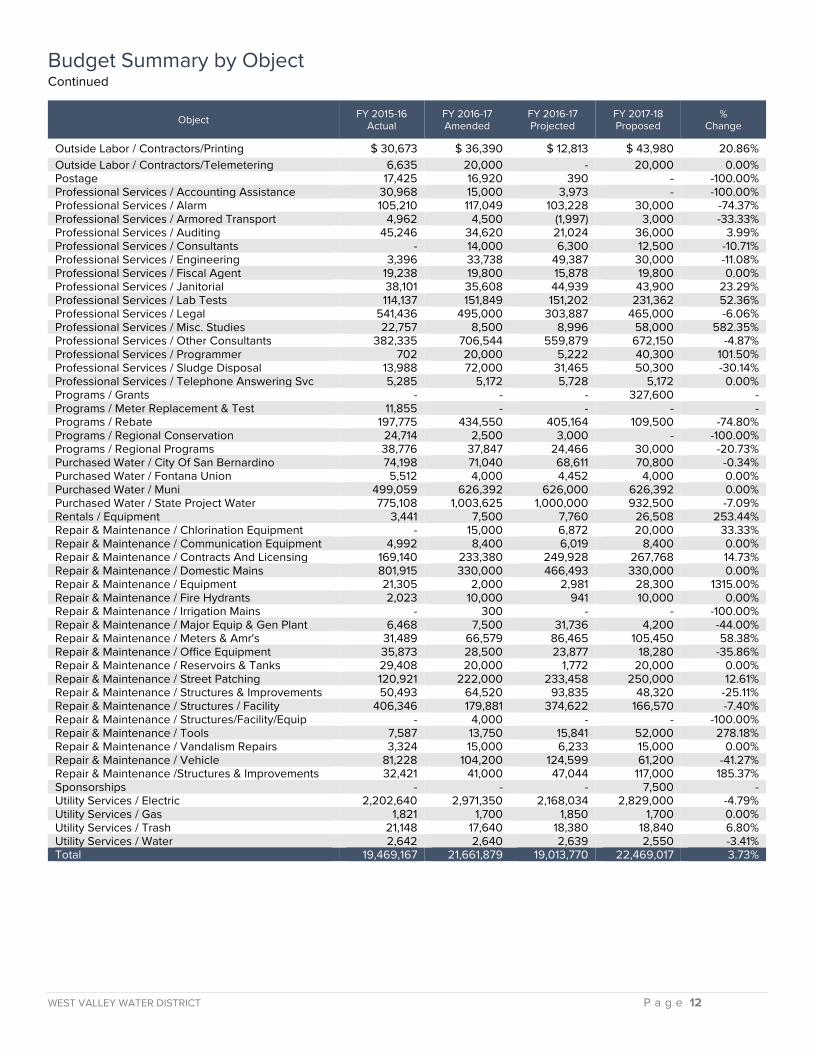
Budget Summary by Object Continued
Object FY 2015-16 Actual
FY 2016-17 Amended
FY 2016-17 Projected
FY 2017-18 Proposed
% Change
Outside Labor / Contractors/Printing $ 30,673 $ 36,390 $ 12,813 $ 43,980 20.86% Outside Labor / Contractors/Telemetering 6,635 20,000 - 20,000 0.00% Postage 17,425 16,920 390 - -100.00% Professional Services / Accounting Assistance 30,968 15,000 3,973 - -100.00% Professional Services / Alarm 105,210 117,049 103,228 30,000 -74.37% Professional Services / Armored Transport 4,962 4,500 (1,997) 3,000 -33.33% Professional Services / Auditing 45,246 34,620 21,024 36,000 3.99% Professional Services / Consultants - 14,000 6,300 12,500 -10.71% Professional Services / Engineering 3,396 33,738 49,387 30,000 -11.08% Professional Services / Fiscal Agent 19,238 19,800 15,878 19,800 0.00% Professional Services / Janitorial 38,101 35,608 44,939 43,900 23.29% Professional Services / Lab Tests 114,137 151,849 151,202 231,362 52.36% Professional Services / Legal 541,436 495,000 303,887 465,000 -6.06% Professional Services / Misc. Studies 22,757 8,500 8,996 58,000 582.35% Professional Services / Other Consultants 382,335 706,544 559,879 672,150 -4.87% Professional Services / Programmer 702 20,000 5,222 40,300 101.50% Professional Services / Sludge Disposal 13,988 72,000 31,465 50,300 -30.14% Professional Services / Telephone Answering Svc 5,285 5,172 5,728 5,172 0.00% Programs / Grants - - - 327,600 - Programs / Meter Replacement & Test 11,855 - - - - Programs / Rebate 197,775 434,550 405,164 109,500 -74.80% Programs / Regional Conservation 24,714 2,500 3,000 - -100.00% Programs / Regional Programs 38,776 37,847 24,466 30,000 -20.73% Purchased Water / City Of San Bernardino 74,198 71,040 68,611 70,800 -0.34% Purchased Water / Fontana Union 5,512 4,000 4,452 4,000 0.00% Purchased Water / Muni 499,059 626,392 626,000 626,392 0.00% Purchased Water / State Project Water 775,108 1,003,625 1,000,000 932,500 -7.09% Rentals / Equipment 3,441 7,500 7,760 26,508 253.44% Repair & Maintenance / Chlorination Equipment - 15,000 6,872 20,000 33.33% Repair & Maintenance / Communication Equipment 4,992 8,400 6,019 8,400 0.00% Repair & Maintenance / Contracts And Licensing 169,140 233,380 249,928 267,768 14.73% Repair & Maintenance / Domestic Mains 801,915 330,000 466,493 330,000 0.00% Repair & Maintenance / Equipment 21,305 2,000 2,981 28,300 1315.00% Repair & Maintenance / Fire Hydrants 2,023 10,000 941 10,000 0.00% Repair & Maintenance / Irrigation Mains - 300 - - -100.00% Repair & Maintenance / Major Equip & Gen Plant 6,468 7,500 31,736 4,200 -44.00% Repair & Maintenance / Meters & Amr's 31,489 66,579 86,465 105,450 58.38% Repair & Maintenance / Office Equipment 35,873 28,500 23,877 18,280 -35.86% Repair & Maintenance / Reservoirs & Tanks 29,408 20,000 1,772 20,000 0.00% Repair & Maintenance / Street Patching 120,921 222,000 233,458 250,000 12.61% Repair & Maintenance / Structures & Improvements 50,493 64,520 93,835 48,320 -25.11% Repair & Maintenance / Structures / Facility 406,346 179,881 374,622 166,570 -7.40% Repair & Maintenance / Structures/Facility/Equip - 4,000 - - -100.00% Repair & Maintenance / Tools 7,587 13,750 15,841 52,000 278.18% Repair & Maintenance / Vandalism Repairs 3,324 15,000 6,233 15,000 0.00% Repair & Maintenance / Vehicle 81,228 104,200 124,599 61,200 -41.27% Repair & Maintenance /Structures & Improvements 32,421 41,000 47,044 117,000 185.37% Sponsorships - - - 7,500 - Utility Services / Electric 2,202,640 2,971,350 2,168,034 2,829,000 -4.79% Utility Services / Gas 1,821 1,700 1,850 1,700 0.00% Utility Services / Trash 21,148 17,640 18,380 18,840 6.80% Utility Services / Water 2,642 2,640 2,639 2,550 -3.41% Total 19,469,167 21,661,879 19,013,770 22,469,017 3.73%
WEST VALLEY WATER DISTRICT P a g e 13
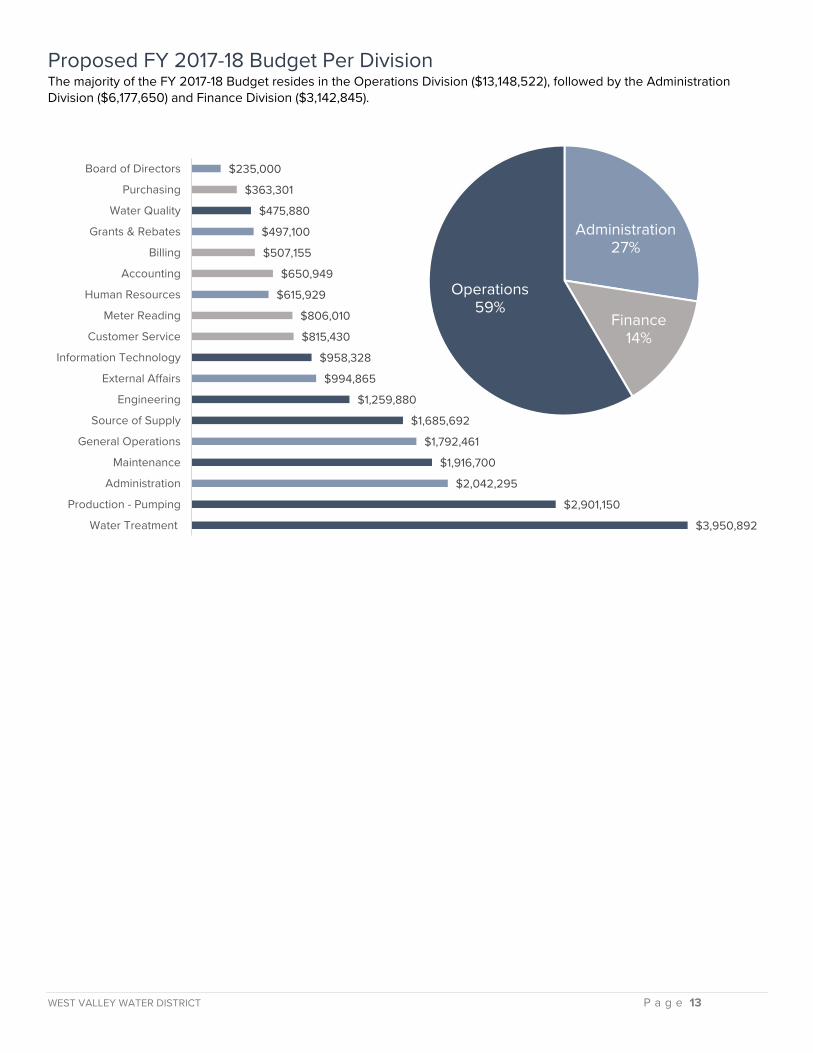
Proposed FY 2017-18 Budget Per Division The majority of the FY 2017-18 Budget resides in the Operations Division ($13,148,522), followed by the Administration Division ($6,177,650) and Finance Division ($3,142,845).
$3,950,892
$2,901,150
$2,042,295
$1,916,700
$1,792,461
$1,685,692
$1,259,880
$994,865
$958,328
$815,430
$806,010
$615,929
$650,949
$507,155
$497,100
$475,880
$363,301
$235,000
Water Treatment
Production - Pumping
Administration
Maintenance
General Operations
Source of Supply
Engineering
External Affairs
Information Technology
Customer Service
Meter Reading
Human Resources
Accounting
Billing
Grants & Rebates
Water Quality
Purchasing
Board of Directors
Administration27%
Finance14%
Operations59%

WEST VALLEY WATER DISTRICT P a g e 14
This page is intentionally left blank.
WEST VALLEY WATER DISTRICT P a g e 15
P a g e 15
PROPOSED BUDGET FY 2017-18
DEPARTMENT SUMMARIES
WEST VALLEY WATER DISTRICT P a g e 16
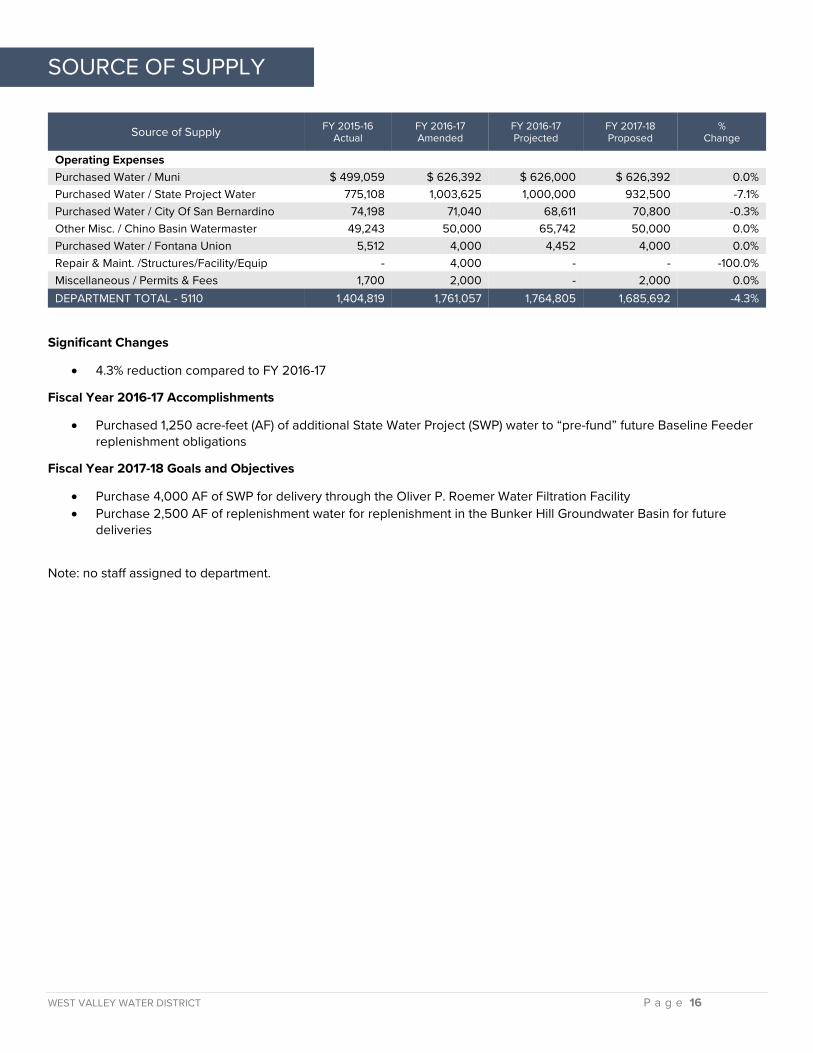
SOURCE OF SUPPLY
Significant Changes
• 4.3% reduction compared to FY 2016-17
Fiscal Year 2016-17 Accomplishments
• Purchased 1,250 acre-feet (AF) of additional State Water Project (SWP) water to “pre-fund” future Baseline Feeder replenishment obligations
Fiscal Year 2017-18 Goals and Objectives
• Purchase 4,000 AF of SWP for delivery through the Oliver P. Roemer Water Filtration Facility • Purchase 2,500 AF of replenishment water for replenishment in the Bunker Hill Groundwater Basin for future
deliveries
Note: no staff assigned to department.
Source of Supply FY 2015-16 Actual
FY 2016-17 Amended
FY 2016-17 Projected
FY 2017-18 Proposed
% Change
Operating Expenses Purchased Water / Muni $ 499,059 $ 626,392 $ 626,000 $ 626,392 0.0% Purchased Water / State Project Water 775,108 1,003,625 1,000,000 932,500 -7.1% Purchased Water / City Of San Bernardino 74,198 71,040 68,611 70,800 -0.3% Other Misc. / Chino Basin Watermaster 49,243 50,000 65,742 50,000 0.0% Purchased Water / Fontana Union 5,512 4,000 4,452 4,000 0.0% Repair & Maint. /Structures/Facility/Equip - 4,000 - - -100.0% Miscellaneous / Permits & Fees 1,700 2,000 - 2,000 0.0% DEPARTMENT TOTAL - 5110 1,404,819 1,761,057 1,764,805 1,685,692 -4.3%

WEST VALLEY WATER DISTRICT P a g e 17
This page is intentionally left blank.
WEST VALLEY WATER DISTRICT P a g e 18
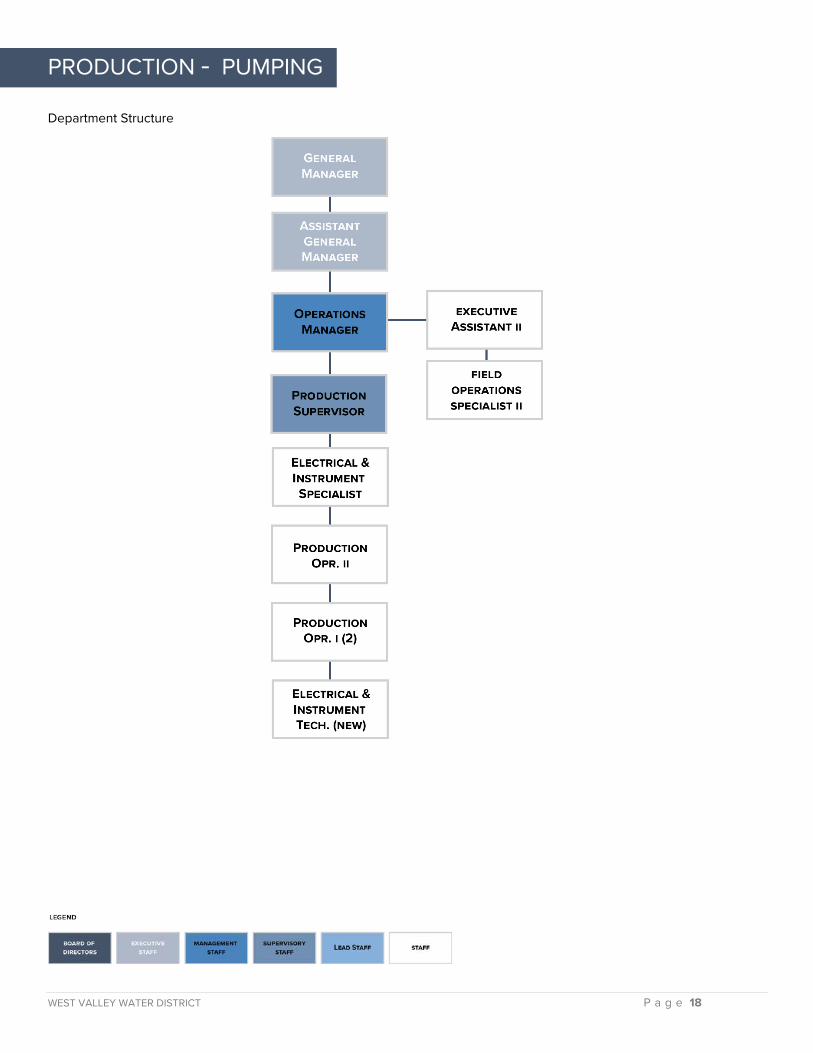
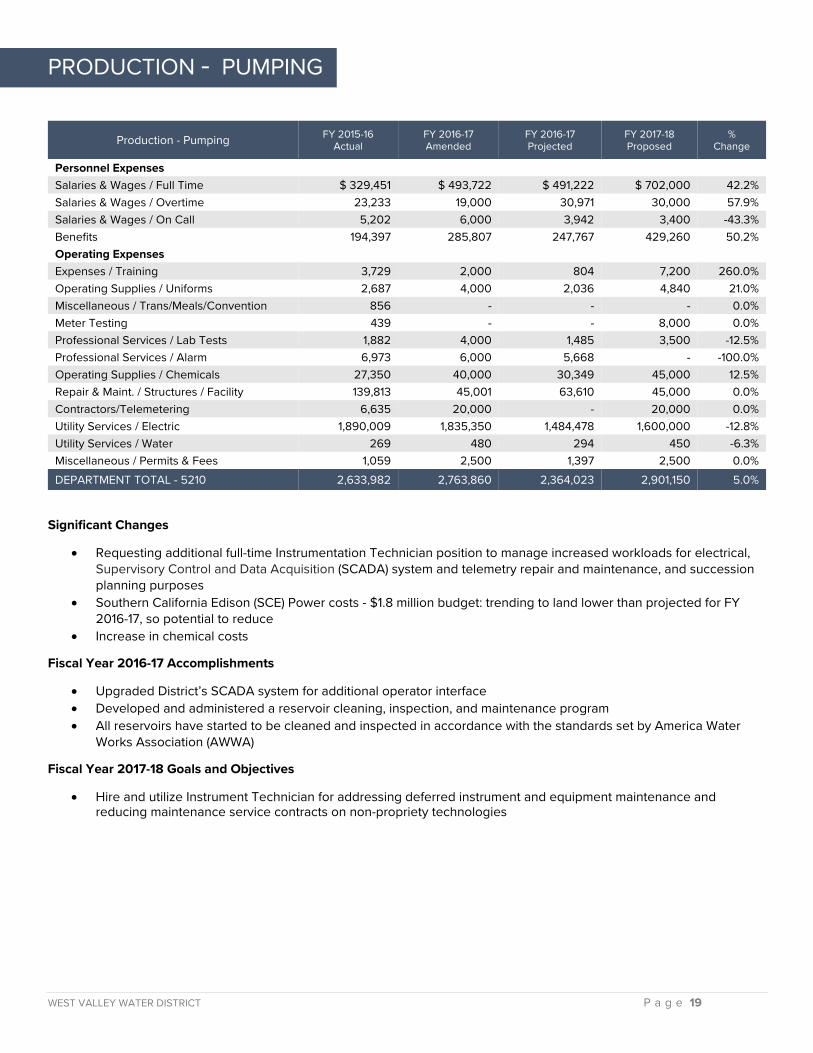
PRODUCTION - PUMPING
Department Structure
WEST VALLEY WATER DISTRICT P a g e 19
PRODUCTION - PUMPING
Production - Pumping FY 2015-16 Actual
FY 2016-17 Amended
FY 2016-17 Projected
FY 2017-18 Proposed
% Change
Personnel Expenses
Salaries & Wages / Full Time $ 329,451 $ 493,722 $ 491,222 $ 702,000 42.2% Salaries & Wages / Overtime 23,233 19,000 30,971 30,000 57.9% Salaries & Wages / On Call 5,202 6,000 3,942 3,400 -43.3% Benefits 194,397 285,807 247,767 429,260 50.2% Operating Expenses
Expenses / Training 3,729 2,000 804 7,200 260.0% Operating Supplies / Uniforms 2,687 4,000 2,036 4,840 21.0% Miscellaneous / Trans/Meals/Convention 856 - - - 0.0% Meter Testing 439 - - 8,000 0.0% Professional Services / Lab Tests 1,882 4,000 1,485 3,500 -12.5% Professional Services / Alarm 6,973 6,000 5,668 - -100.0% Operating Supplies / Chemicals 27,350 40,000 30,349 45,000 12.5% Repair & Maint. / Structures / Facility 139,813 45,001 63,610 45,000 0.0% Contractors/Telemetering 6,635 20,000 - 20,000 0.0% Utility Services / Electric 1,890,009 1,835,350 1,484,478 1,600,000 -12.8% Utility Services / Water 269 480 294 450 -6.3% Miscellaneous / Permits & Fees 1,059 2,500 1,397 2,500 0.0% DEPARTMENT TOTAL - 5210 2,633,982 2,763,860 2,364,023 2,901,150 5.0%
Significant Changes
• Requesting additional full-time Instrumentation Technician position to manage increased workloads for electrical, Supervisory Control and Data Acquisition (SCADA) system and telemetry repair and maintenance, and succession planning purposes
• Southern California Edison (SCE) Power costs - $1.8 million budget: trending to land lower than projected for FY 2016-17, so potential to reduce
• Increase in chemical costs
Fiscal Year 2016-17 Accomplishments
• Upgraded District’s SCADA system for additional operator interface • Developed and administered a reservoir cleaning, inspection, and maintenance program • All reservoirs have started to be cleaned and inspected in accordance with the standards set by America Water
Works Association (AWWA)
Fiscal Year 2017-18 Goals and Objectives
• Hire and utilize Instrument Technician for addressing deferred instrument and equipment maintenance and reducing maintenance service contracts on non-propriety technologies
WEST VALLEY WATER DISTRICT P a g e 20
WATER QUALITY
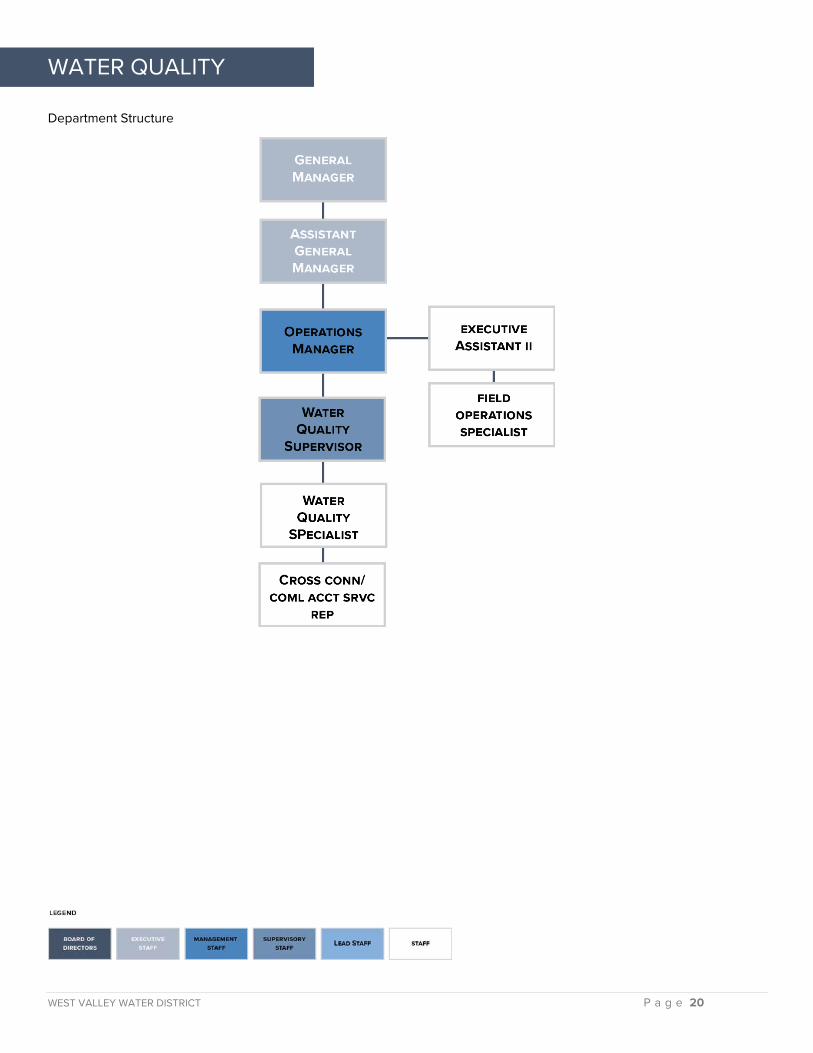
Department Structure
WEST VALLEY WATER DISTRICT P a g e 21
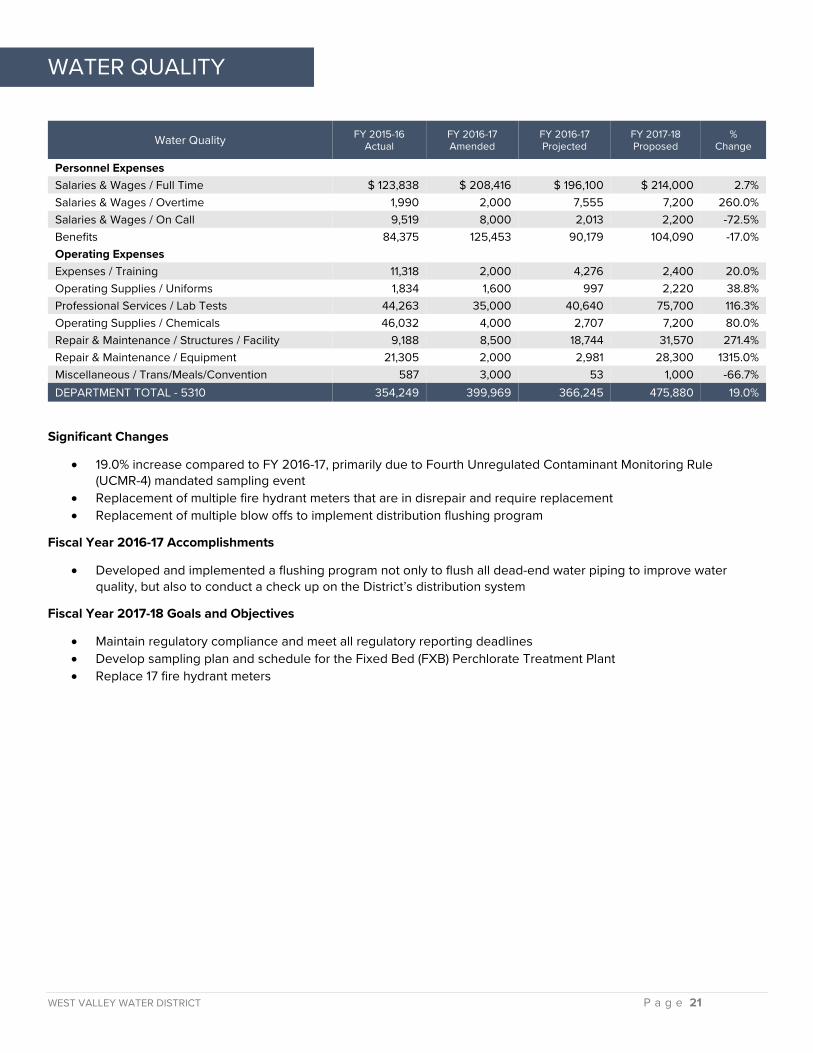
WATER QUALITY
Water Quality FY 2015-16 Actual
FY 2016-17 Amended
FY 2016-17 Projected
FY 2017-18 Proposed
% Change
Personnel Expenses Salaries & Wages / Full Time $ 123,838 $ 208,416 $ 196,100 $ 214,000 2.7% Salaries & Wages / Overtime 1,990 2,000 7,555 7,200 260.0% Salaries & Wages / On Call 9,519 8,000 2,013 2,200 -72.5% Benefits 84,375 125,453 90,179 104,090 -17.0% Operating Expenses
Expenses / Training 11,318 2,000 4,276 2,400 20.0% Operating Supplies / Uniforms 1,834 1,600 997 2,220 38.8% Professional Services / Lab Tests 44,263 35,000 40,640 75,700 116.3% Operating Supplies / Chemicals 46,032 4,000 2,707 7,200 80.0% Repair & Maintenance / Structures / Facility 9,188 8,500 18,744 31,570 271.4% Repair & Maintenance / Equipment 21,305 2,000 2,981 28,300 1315.0% Miscellaneous / Trans/Meals/Convention 587 3,000 53 1,000 -66.7% DEPARTMENT TOTAL - 5310 354,249 399,969 366,245 475,880 19.0%
Significant Changes
• 19.0% increase compared to FY 2016-17, primarily due to Fourth Unregulated Contaminant Monitoring Rule (UCMR-4) mandated sampling event
• Replacement of multiple fire hydrant meters that are in disrepair and require replacement • Replacement of multiple blow offs to implement distribution flushing program
Fiscal Year 2016-17 Accomplishments
• Developed and implemented a flushing program not only to flush all dead-end water piping to improve water quality, but also to conduct a check up on the District’s distribution system
Fiscal Year 2017-18 Goals and Objectives
• Maintain regulatory compliance and meet all regulatory reporting deadlines • Develop sampling plan and schedule for the Fixed Bed (FXB) Perchlorate Treatment Plant • Replace 17 fire hydrant meters

WEST VALLEY WATER DISTRICT P a g e 22
WATER TREATMENT
Department Structure
WEST VALLEY WATER DISTRICT P a g e 23
WATER TREATMENT
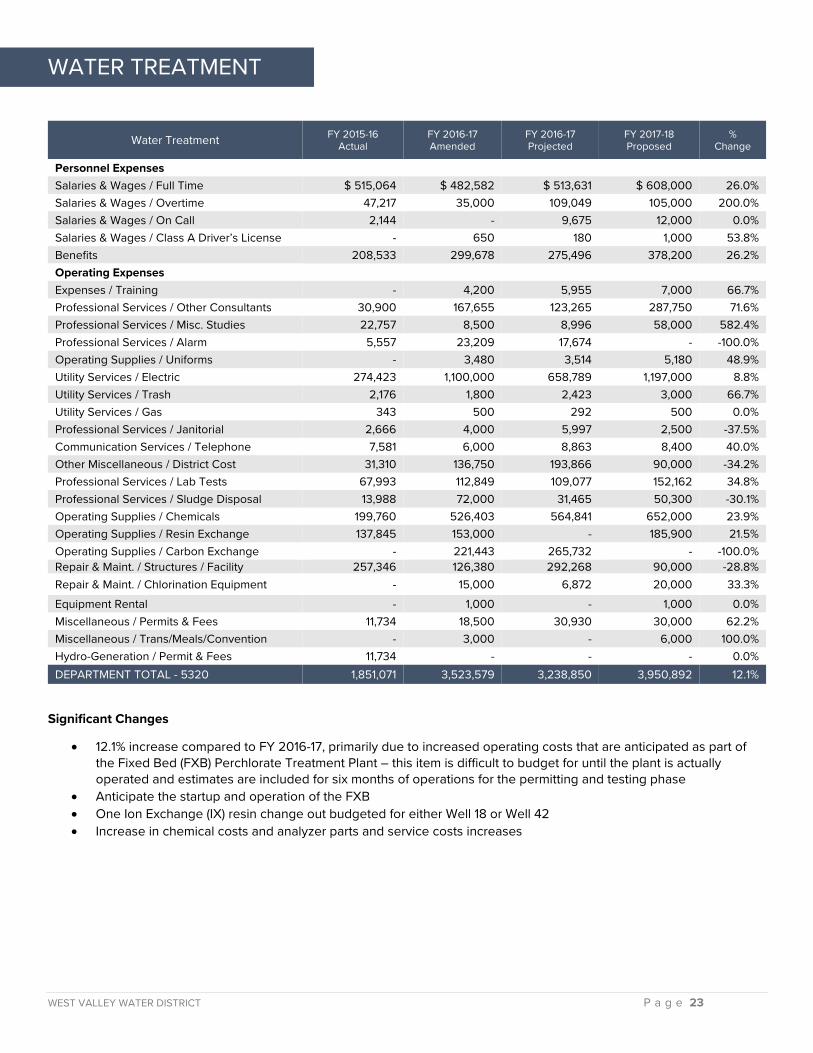
Water Treatment FY 2015-16 Actual
FY 2016-17 Amended
FY 2016-17 Projected
FY 2017-18 Proposed
% Change
Personnel Expenses Salaries & Wages / Full Time $ 515,064 $ 482,582 $ 513,631 $ 608,000 26.0% Salaries & Wages / Overtime 47,217 35,000 109,049 105,000 200.0% Salaries & Wages / On Call 2,144 - 9,675 12,000 0.0% Salaries & Wages / Class A Driver’s License - 650 180 1,000 53.8% Benefits 208,533 299,678 275,496 378,200 26.2% Operating Expenses
Expenses / Training - 4,200 5,955 7,000 66.7% Professional Services / Other Consultants 30,900 167,655 123,265 287,750 71.6% Professional Services / Misc. Studies 22,757 8,500 8,996 58,000 582.4% Professional Services / Alarm 5,557 23,209 17,674 - -100.0% Operating Supplies / Uniforms - 3,480 3,514 5,180 48.9% Utility Services / Electric 274,423 1,100,000 658,789 1,197,000 8.8% Utility Services / Trash 2,176 1,800 2,423 3,000 66.7% Utility Services / Gas 343 500 292 500 0.0% Professional Services / Janitorial 2,666 4,000 5,997 2,500 -37.5% Communication Services / Telephone 7,581 6,000 8,863 8,400 40.0% Other Miscellaneous / District Cost 31,310 136,750 193,866 90,000 -34.2% Professional Services / Lab Tests 67,993 112,849 109,077 152,162 34.8% Professional Services / Sludge Disposal 13,988 72,000 31,465 50,300 -30.1% Operating Supplies / Chemicals 199,760 526,403 564,841 652,000 23.9% Operating Supplies / Resin Exchange 137,845 153,000 - 185,900 21.5% Operating Supplies / Carbon Exchange - 221,443 265,732 - -100.0% Repair & Maint. / Structures / Facility 257,346 126,380 292,268 90,000 -28.8% Repair & Maint. / Chlorination Equipment - 15,000 6,872 20,000 33.3% Equipment Rental - 1,000 - 1,000 0.0% Miscellaneous / Permits & Fees 11,734 18,500 30,930 30,000 62.2% Miscellaneous / Trans/Meals/Convention - 3,000 - 6,000 100.0% Hydro-Generation / Permit & Fees 11,734 - - - 0.0% DEPARTMENT TOTAL - 5320 1,851,071 3,523,579 3,238,850 3,950,892 12.1%
Significant Changes
• 12.1% increase compared to FY 2016-17, primarily due to increased operating costs that are anticipated as part of the Fixed Bed (FXB) Perchlorate Treatment Plant – this item is difficult to budget for until the plant is actually operated and estimates are included for six months of operations for the permitting and testing phase
• Anticipate the startup and operation of the FXB • One Ion Exchange (IX) resin change out budgeted for either Well 18 or Well 42 • Increase in chemical costs and analyzer parts and service costs increases
WEST VALLEY WATER DISTRICT P a g e 24
WATER TREATMENT
Fiscal Year 2016-17 Accomplishments
• Oliver P. Roemer Water Filtration Facility (WFF) granular activated carbon (GAC) treatment change out • Eliminated sludge disposal fees from the Groundwater Wellhead Treatment System, Fluidized Bed Reactor (FBR):
$25,200 for six months, resulting in a $50,400 savings per year • City of Rialto granted a temporary permit to allow discharges of FBR/FXB beginning June 2017 for six months for
testing • San Bernardino County Flood Control agreed to increase the discharge volume into Cactus Basin No. 2 from the
Groundwater Wellhead Treatment System – anticipated approval in June 2017
Fiscal Year 2017-18 Goals and Objectives
• FXB startup and operation • Rehabilitate effluent pumps at the Oliver P. Roemer WFF to increase production from 10.4 million gallons per day
(MGD) to 14.4 MGD • Commission the Oliver P. Roemer WFF GAC Expansion project • Replace existing security alarm provider with a new service • Construction of the material bins in Vineyard and Linden plant sites to properly store and protect raw materials • Replacement of analyzers, equipment and instruments as many have started failing and reached the end of their
life cycle in all treatment plants • Continue to rehabilitate system assets to increase reliability and maintain a positive public image

WEST VALLEY WATER DISTRICT P a g e 25
This page is intentionally left blank.

WEST VALLEY WATER DISTRICT P a g e 26
MAINTENANCE - TRANSMISSION AND DISTRIBUTION
Department Structure

WEST VALLEY WATER DISTRICT P a g e 27
MAINTENANCE - TRANSMISSION AND DISTRIBUTION
Maintenance FY 2015-16 Actual
FY 2016-17 Amended
FY 2016-17 Projected
FY 2017-18 Proposed
% Change
Personnel Expenses Salaries & Wages / Full Time $ 469,754 $ 628,475 $ 538,944 $ 643,000 2.3% Salaries & Wages / Overtime 40,374 35,000 30,736 30,200 -13.7% Salaries & Wages / On Call 4,049 5,000 10,748 7,650 53.0% Salaries & Wages / Class A Driver’s License 3,835 3,250 3,481 4,000 23.1% Benefits 256,717 437,277 295,231 399,310 -8.7% Operating Expenses
Expenses / Training 2,179 2,400 1,720 2,400 0.0% Operating Supplies / Uniforms 2,316 8,138 5,642 8,140 0.0% Miscellaneous / Trans/Meals/Convention 1,086 1,500 166 6,500 333.3% Repair & Maintenance / Reservoirs & Tanks 29,408 20,000 1,772 20,000 0.0% Repair & Maintenance / Domestic Mains 801,915 330,000 466,493 330,000 0.0% Repair & Maintenance / Irrigation Mains - 300 - - -100.0% Repair & Maintenance / Fire Hydrants 2,023 10,000 941 10,000 0.0% Repair & Maintenance / Vandalism Repairs 3,324 15,000 6,233 15,000 0.0% Repair & Maintenance / Street Patching 120,921 222,000 233,458 250,000 12.6% Repair & Maintenance / Tools 7,049 11,250 15,183 52,000 362.2% Rentals / Equipment - 2,500 3,060 21,500 760.0% Repair & Maint. /Structures & Improvements 32,421 41,000 47,044 117,000 185.4% DEPARTMENT TOTAL - 5410 1,777,371 1,773,090 1,660,852 1,916,700 8.1%
Significant Changes
• 8.1% increase compared to FY 2016-17, primarily due to increased permitting costs for street cut permits. All cities now charging street cut permit fees and have adopted more stringent regulations requiring type 2 base and paving requirements, increasing material costs. Many tools and equipment are in need of replacement due to age and safety concerns.
Fiscal Year 2016-17 Accomplishments
• Administered the valve exercise and replacement programs • Developed and implemented a robust fire hydrant maintenance program
o Addressing deferred maintenance tasks of 1,000 hydrants such as coating, missing caps and leaking hydrants in FY 2017-18
o It is anticipated to have more than 2,000 hydrants completed by the end of the calendar year • Utilize on-call contractors to repair service lateral leaks to free up staff to address deferred maintenance at well,
booster station, and reservoir sites • Revamped both the after hours on-call schedule and procedures to reduce response time and improve efficiency • Implemented an emergency response functional exercise program
Fiscal Year 2017-18 Goals and Objectives
• Continue and expand the valve exercising program • Develop routine maintenance schedules for all District facilities • Assist Information Technology in the procurement of a work-order management system • Additional functional exercises for emergency response improvement
WEST VALLEY WATER DISTRICT P a g e 28
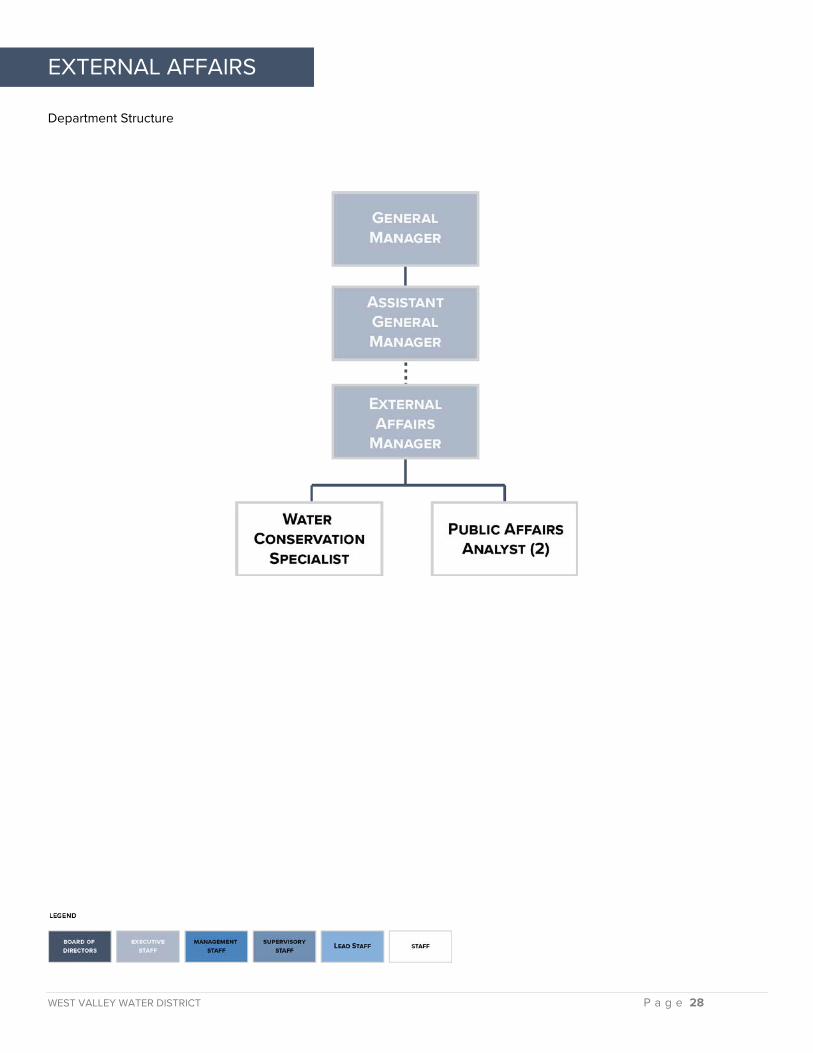
EXTERNAL AFFAIRS
Department Structure
WEST VALLEY WATER DISTRICT P a g e 29
EXTERNAL AFFAIRS
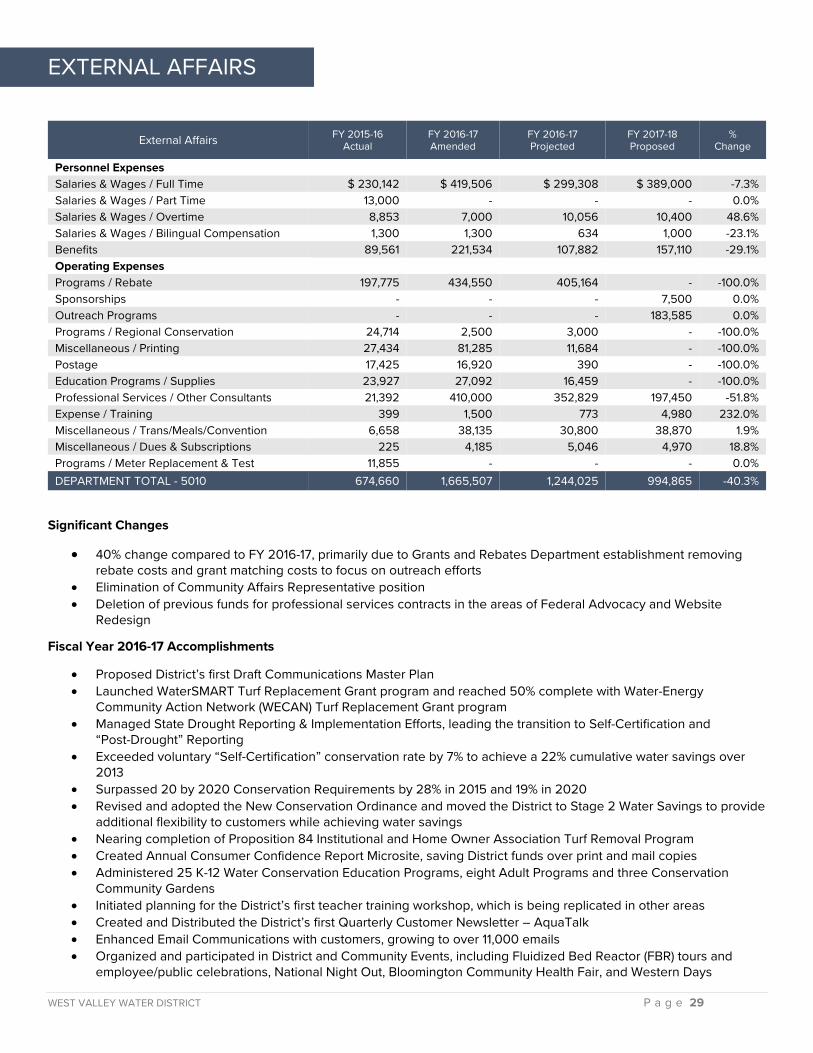
External Affairs FY 2015-16 Actual
FY 2016-17 Amended
FY 2016-17 Projected
FY 2017-18 Proposed
% Change
Personnel Expenses Salaries & Wages / Full Time $ 230,142 $ 419,506 $ 299,308 $ 389,000 -7.3% Salaries & Wages / Part Time 13,000 - - - 0.0% Salaries & Wages / Overtime 8,853 7,000 10,056 10,400 48.6% Salaries & Wages / Bilingual Compensation 1,300 1,300 634 1,000 -23.1% Benefits 89,561 221,534 107,882 157,110 -29.1% Operating Expenses
Programs / Rebate 197,775 434,550 405,164 - -100.0% Sponsorships - - - 7,500 0.0% Outreach Programs - - - 183,585 0.0% Programs / Regional Conservation 24,714 2,500 3,000 - -100.0% Miscellaneous / Printing 27,434 81,285 11,684 - -100.0% Postage 17,425 16,920 390 - -100.0% Education Programs / Supplies 23,927 27,092 16,459 - -100.0% Professional Services / Other Consultants 21,392 410,000 352,829 197,450 -51.8% Expense / Training 399 1,500 773 4,980 232.0% Miscellaneous / Trans/Meals/Convention 6,658 38,135 30,800 38,870 1.9% Miscellaneous / Dues & Subscriptions 225 4,185 5,046 4,970 18.8% Programs / Meter Replacement & Test 11,855 - - - 0.0% DEPARTMENT TOTAL - 5010 674,660 1,665,507 1,244,025 994,865 -40.3%
Significant Changes
• 40% change compared to FY 2016-17, primarily due to Grants and Rebates Department establishment removing rebate costs and grant matching costs to focus on outreach efforts
• Elimination of Community Affairs Representative position • Deletion of previous funds for professional services contracts in the areas of Federal Advocacy and Website
Redesign
Fiscal Year 2016-17 Accomplishments
• Proposed District’s first Draft Communications Master Plan • Launched WaterSMART Turf Replacement Grant program and reached 50% complete with Water-Energy
Community Action Network (WECAN) Turf Replacement Grant program • Managed State Drought Reporting & Implementation Efforts, leading the transition to Self-Certification and
“Post-Drought” Reporting • Exceeded voluntary “Self-Certification” conservation rate by 7% to achieve a 22% cumulative water savings over
2013 • Surpassed 20 by 2020 Conservation Requirements by 28% in 2015 and 19% in 2020 • Revised and adopted the New Conservation Ordinance and moved the District to Stage 2 Water Savings to provide
additional flexibility to customers while achieving water savings • Nearing completion of Proposition 84 Institutional and Home Owner Association Turf Removal Program • Created Annual Consumer Confidence Report Microsite, saving District funds over print and mail copies • Administered 25 K-12 Water Conservation Education Programs, eight Adult Programs and three Conservation
Community Gardens • Initiated planning for the District’s first teacher training workshop, which is being replicated in other areas • Created and Distributed the District’s first Quarterly Customer Newsletter – AquaTalk • Enhanced Email Communications with customers, growing to over 11,000 emails • Organized and participated in District and Community Events, including Fluidized Bed Reactor (FBR) tours and
employee/public celebrations, National Night Out, Bloomington Community Health Fair, and Western Days
WEST VALLEY WATER DISTRICT P a g e 30
EXTERNAL AFFAIRS
Fiscal Year 2016-17 Accomplishments Continued
• Modified turf replacement program requirements to better serve community • Designed and drafted all District Bill Inserts & Bill Messages • Boosted attendance at Landscape Classes by 117% over FY 2015-16 • Developed and launched first Customer Feedback Survey • Continued Annual Conservation Calendar and Poster Contest, working with a new vendor to reduce printing costs
by half • Promoted significant growth in District Digital Engagement/ Social Media Accounts, including a 182% growth in
Facebook • Received 2017 California Association of Public Information Officials (CAPIO) Award of Excellence for Media Focused
Messaging related to FBR Press Coverage • 91 rebates totaling $28,319.65 distributed to customers through Conservation Rebate Programs • Completed Website Redesign Request for Proposals (RFP) • Partnered with Colton Joint Unified School District to fund weather based irrigation controllers at schools in District
service area • Partnered with San Bernardino County on conservation landscaping in County owned rights-of-way • Provided Communications and Outreach Support to District Departments including the Flushing Program, Water
Valve Maintenance Program and Bloomington Alleyway Relocation • Organized the District’s Water Loss Audit, including collaborating with other departments to ensure accuracy of
data • Prepared, managed and executed contracts for on-call graphic design, website redesign, and grant writing services • Measured effectives of District messaging to inform future efforts • Secured membership on California Special Districts Association Legislative Committee • Proposed revised scopes of work for advocacy services
Fiscal Year 2017-18 Goals and Objectives
• Enhance public understanding of and facilitate public input into the District’s priorities and operations • Maintain District brand identity, clearly articulating and aligning messaging with the District’s adopted Mission
Vision and Values leading to increased funding for District priorities, improved services to the community, and enhanced employee recruitment and retention
• Create an informational District video • Redesign Customer Information Materials, including a new Customer Welcome Packet • Develop an Annual District Open House Event • Implement Website Redesign Project • Continued data-informed research efforts through the second annual Customer Feedback Survey • Development of District Style Guide and Brand Use • Initiate Elected Official Tours & Briefings of District Facilities • Advance State and Federal Legislative and Regulatory Advocacy programs • Build Industry Coalition Participation • Continue to provide communications support to District Departments • Introduce Bilingual Landscape Classes in partnership with the City of Rialto • Finalize completion of Proposition 84 Institutional and HOA Turf Removal Program • Adopt District Communications Master Plan • Complete Water Loss Audit by October 2017 • Hold first Teacher Training Day in Summer 2017 • Commence the District’s first Community Sponsorship Program

WEST VALLEY WATER DISTRICT P a g e 31
This page is intentionally left blank.
WEST VALLEY WATER DISTRICT P a g e 32
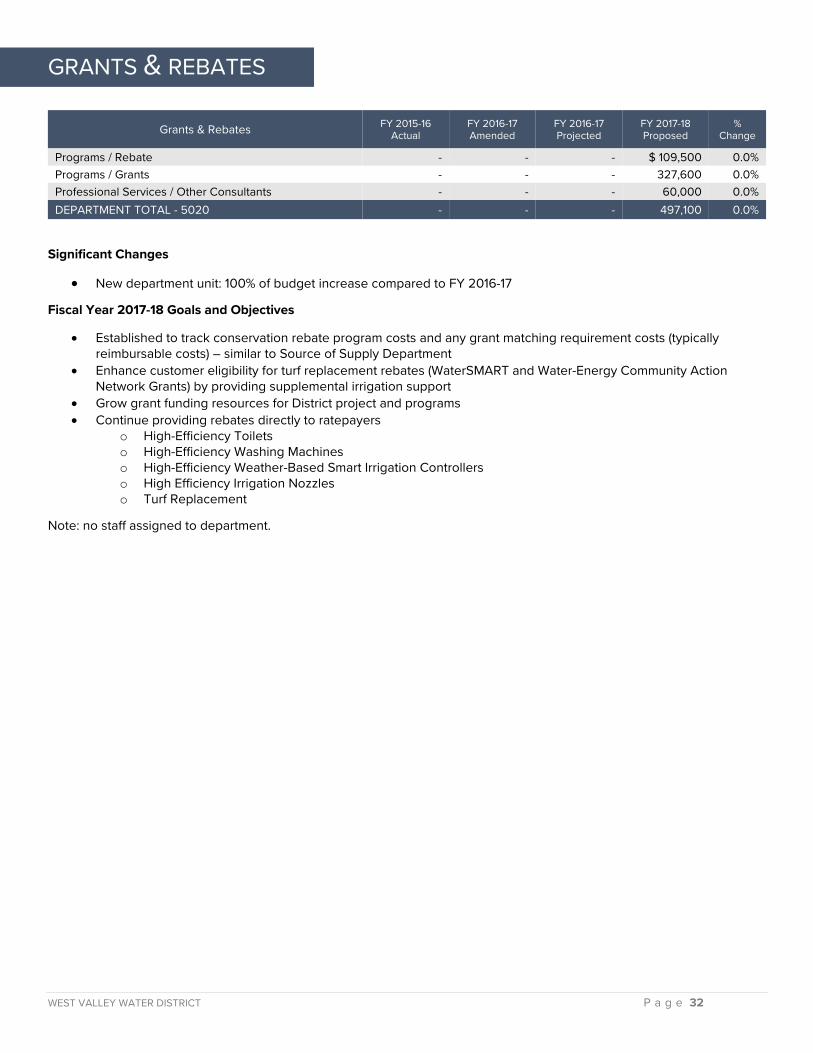
GRANTS & REBATES
Grants & Rebates FY 2015-16 Actual
FY 2016-17 Amended
FY 2016-17 Projected
FY 2017-18 Proposed
% Change
Programs / Rebate - - - $ 109,500 0.0% Programs / Grants - - - 327,600 0.0% Professional Services / Other Consultants - - - 60,000 0.0% DEPARTMENT TOTAL - 5020 - - - 497,100 0.0%
Significant Changes
• New department unit: 100% of budget increase compared to FY 2016-17
Fiscal Year 2017-18 Goals and Objectives
• Established to track conservation rebate program costs and any grant matching requirement costs (typically reimbursable costs) – similar to Source of Supply Department
• Enhance customer eligibility for turf replacement rebates (WaterSMART and Water-Energy Community Action Network Grants) by providing supplemental irrigation support
• Grow grant funding resources for District project and programs • Continue providing rebates directly to ratepayers
o High-Efficiency Toilets o High-Efficiency Washing Machines o High-Efficiency Weather-Based Smart Irrigation Controllers o High Efficiency Irrigation Nozzles o Turf Replacement
Note: no staff assigned to department.

WEST VALLEY WATER DISTRICT P a g e 33
This page is intentionally left blank.

WEST VALLEY WATER DISTRICT P a g e 34
CUSTOMER SERVICE
Department Structure
WEST VALLEY WATER DISTRICT P a g e 35
CUSTOMER SERVICE
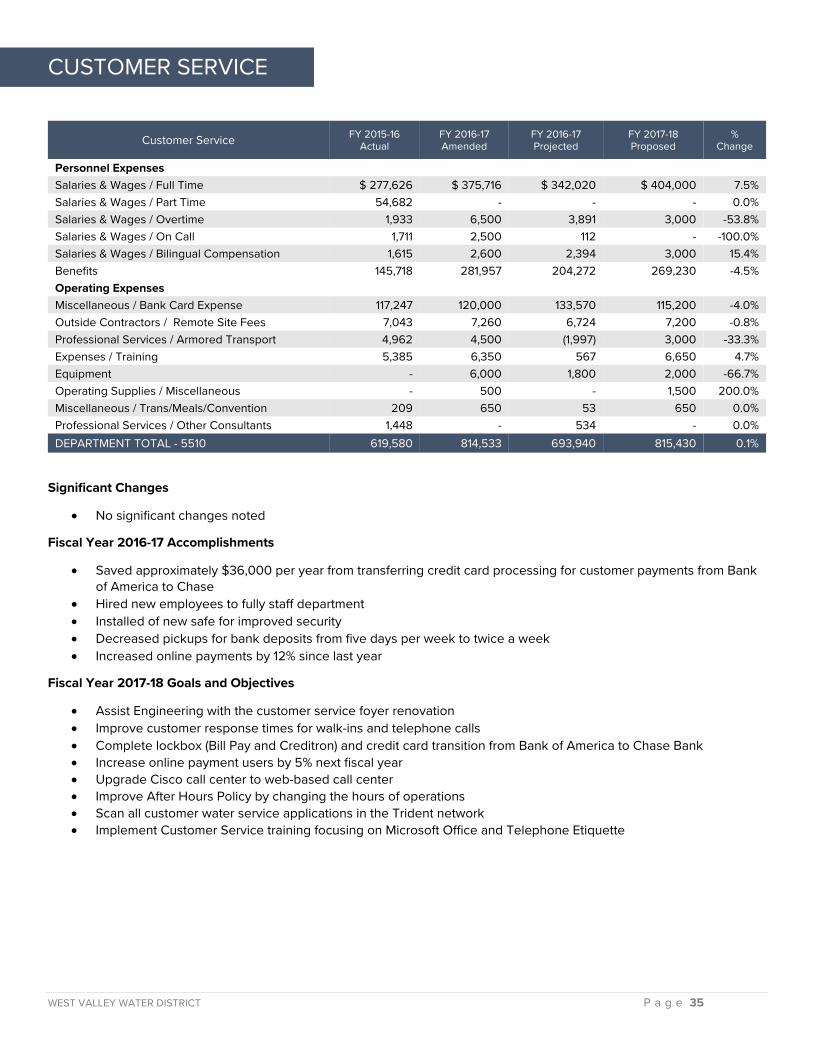
Customer Service FY 2015-16 Actual
FY 2016-17 Amended
FY 2016-17 Projected
FY 2017-18 Proposed
% Change
Personnel Expenses
Salaries & Wages / Full Time $ 277,626 $ 375,716 $ 342,020 $ 404,000 7.5% Salaries & Wages / Part Time 54,682 - - - 0.0% Salaries & Wages / Overtime 1,933 6,500 3,891 3,000 -53.8% Salaries & Wages / On Call 1,711 2,500 112 - -100.0% Salaries & Wages / Bilingual Compensation 1,615 2,600 2,394 3,000 15.4% Benefits 145,718 281,957 204,272 269,230 -4.5% Operating Expenses
Miscellaneous / Bank Card Expense 117,247 120,000 133,570 115,200 -4.0% Outside Contractors / Remote Site Fees 7,043 7,260 6,724 7,200 -0.8% Professional Services / Armored Transport 4,962 4,500 (1,997) 3,000 -33.3% Expenses / Training 5,385 6,350 567 6,650 4.7% Equipment - 6,000 1,800 2,000 -66.7% Operating Supplies / Miscellaneous - 500 - 1,500 200.0% Miscellaneous / Trans/Meals/Convention 209 650 53 650 0.0% Professional Services / Other Consultants 1,448 - 534 - 0.0% DEPARTMENT TOTAL - 5510 619,580 814,533 693,940 815,430 0.1%
Significant Changes
• No significant changes noted
Fiscal Year 2016-17 Accomplishments
• Saved approximately $36,000 per year from transferring credit card processing for customer payments from Bank of America to Chase
• Hired new employees to fully staff department • Installed of new safe for improved security • Decreased pickups for bank deposits from five days per week to twice a week • Increased online payments by 12% since last year
Fiscal Year 2017-18 Goals and Objectives
• Assist Engineering with the customer service foyer renovation • Improve customer response times for walk-ins and telephone calls • Complete lockbox (Bill Pay and Creditron) and credit card transition from Bank of America to Chase Bank • Increase online payment users by 5% next fiscal year • Upgrade Cisco call center to web-based call center • Improve After Hours Policy by changing the hours of operations • Scan all customer water service applications in the Trident network • Implement Customer Service training focusing on Microsoft Office and Telephone Etiquette
WEST VALLEY WATER DISTRICT P a g e 36
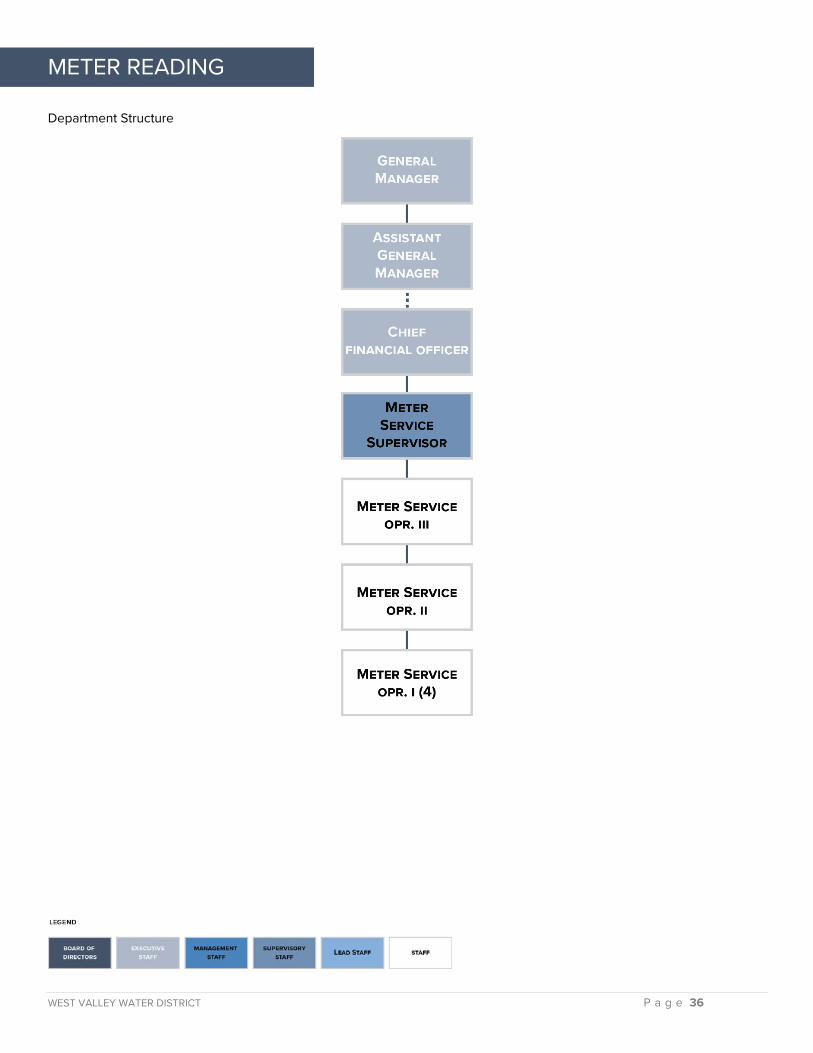
METER READING
Department Structure
WEST VALLEY WATER DISTRICT P a g e 37
METER READING
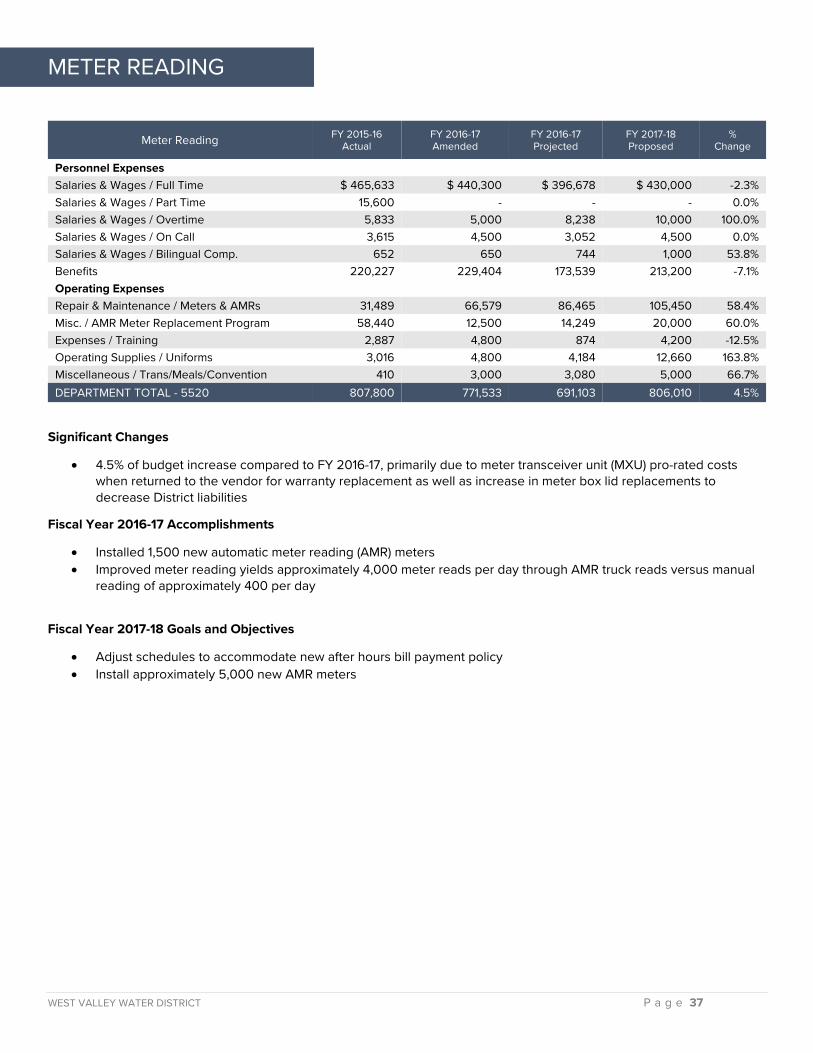
Meter Reading FY 2015-16 Actual
FY 2016-17 Amended
FY 2016-17 Projected
FY 2017-18 Proposed
% Change
Personnel Expenses
Salaries & Wages / Full Time $ 465,633 $ 440,300 $ 396,678 $ 430,000 -2.3% Salaries & Wages / Part Time 15,600 - - - 0.0% Salaries & Wages / Overtime 5,833 5,000 8,238 10,000 100.0% Salaries & Wages / On Call 3,615 4,500 3,052 4,500 0.0% Salaries & Wages / Bilingual Comp. 652 650 744 1,000 53.8% Benefits 220,227 229,404 173,539 213,200 -7.1% Operating Expenses
Repair & Maintenance / Meters & AMRs 31,489 66,579 86,465 105,450 58.4% Misc. / AMR Meter Replacement Program 58,440 12,500 14,249 20,000 60.0% Expenses / Training 2,887 4,800 874 4,200 -12.5% Operating Supplies / Uniforms 3,016 4,800 4,184 12,660 163.8% Miscellaneous / Trans/Meals/Convention 410 3,000 3,080 5,000 66.7% DEPARTMENT TOTAL - 5520 807,800 771,533 691,103 806,010 4.5%
Significant Changes
• 4.5% of budget increase compared to FY 2016-17, primarily due to meter transceiver unit (MXU) pro-rated costs when returned to the vendor for warranty replacement as well as increase in meter box lid replacements to decrease District liabilities
Fiscal Year 2016-17 Accomplishments
• Installed 1,500 new automatic meter reading (AMR) meters • Improved meter reading yields approximately 4,000 meter reads per day through AMR truck reads versus manual
reading of approximately 400 per day
Fiscal Year 2017-18 Goals and Objectives
• Adjust schedules to accommodate new after hours bill payment policy • Install approximately 5,000 new AMR meters

WEST VALLEY WATER DISTRICT P a g e 38
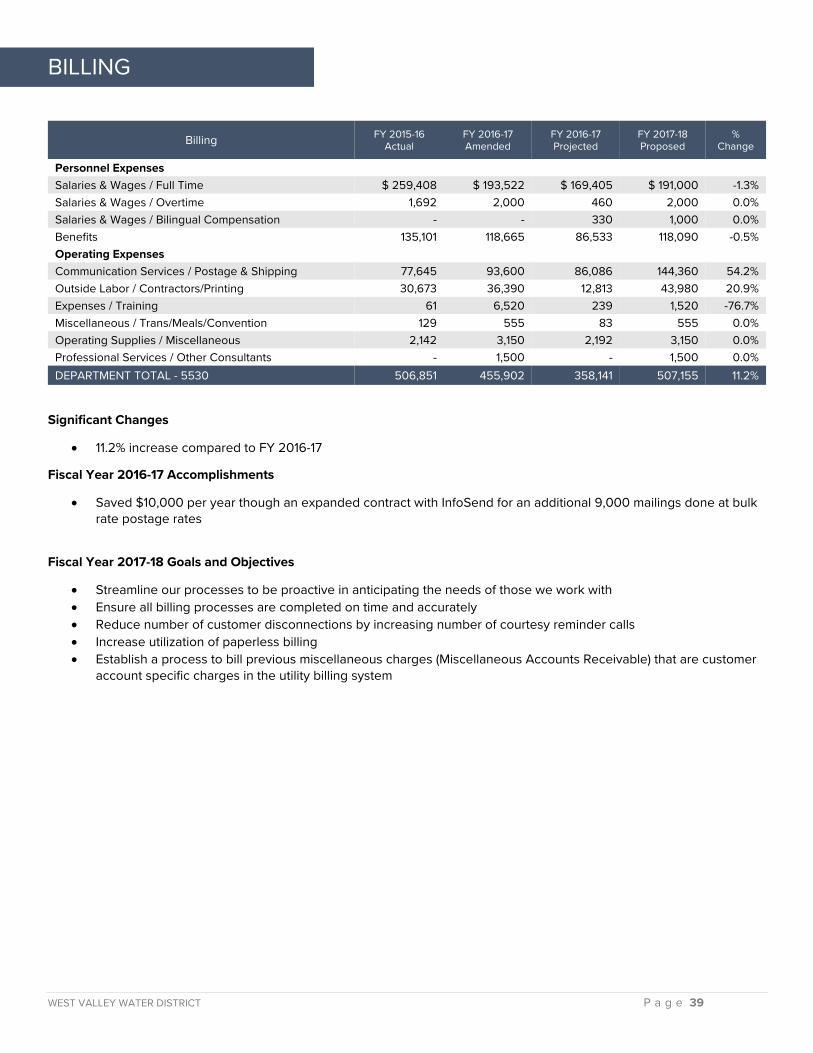
BILLING
Department Structure
WEST VALLEY WATER DISTRICT P a g e 39
BILLING
Billing FY 2015-16 Actual
FY 2016-17 Amended
FY 2016-17 Projected
FY 2017-18 Proposed
% Change
Personnel Expenses Salaries & Wages / Full Time $ 259,408 $ 193,522 $ 169,405 $ 191,000 -1.3% Salaries & Wages / Overtime 1,692 2,000 460 2,000 0.0% Salaries & Wages / Bilingual Compensation - - 330 1,000 0.0% Benefits 135,101 118,665 86,533 118,090 -0.5% Operating Expenses
Communication Services / Postage & Shipping 77,645 93,600 86,086 144,360 54.2% Outside Labor / Contractors/Printing 30,673 36,390 12,813 43,980 20.9% Expenses / Training 61 6,520 239 1,520 -76.7% Miscellaneous / Trans/Meals/Convention 129 555 83 555 0.0% Operating Supplies / Miscellaneous 2,142 3,150 2,192 3,150 0.0% Professional Services / Other Consultants - 1,500 - 1,500 0.0% DEPARTMENT TOTAL - 5530 506,851 455,902 358,141 507,155 11.2%
Significant Changes
• 11.2% increase compared to FY 2016-17
Fiscal Year 2016-17 Accomplishments
• Saved $10,000 per year though an expanded contract with InfoSend for an additional 9,000 mailings done at bulk rate postage rates
Fiscal Year 2017-18 Goals and Objectives
• Streamline our processes to be proactive in anticipating the needs of those we work with • Ensure all billing processes are completed on time and accurately • Reduce number of customer disconnections by increasing number of courtesy reminder calls • Increase utilization of paperless billing • Establish a process to bill previous miscellaneous charges (Miscellaneous Accounts Receivable) that are customer
account specific charges in the utility billing system
WEST VALLEY WATER DISTRICT P a g e 40
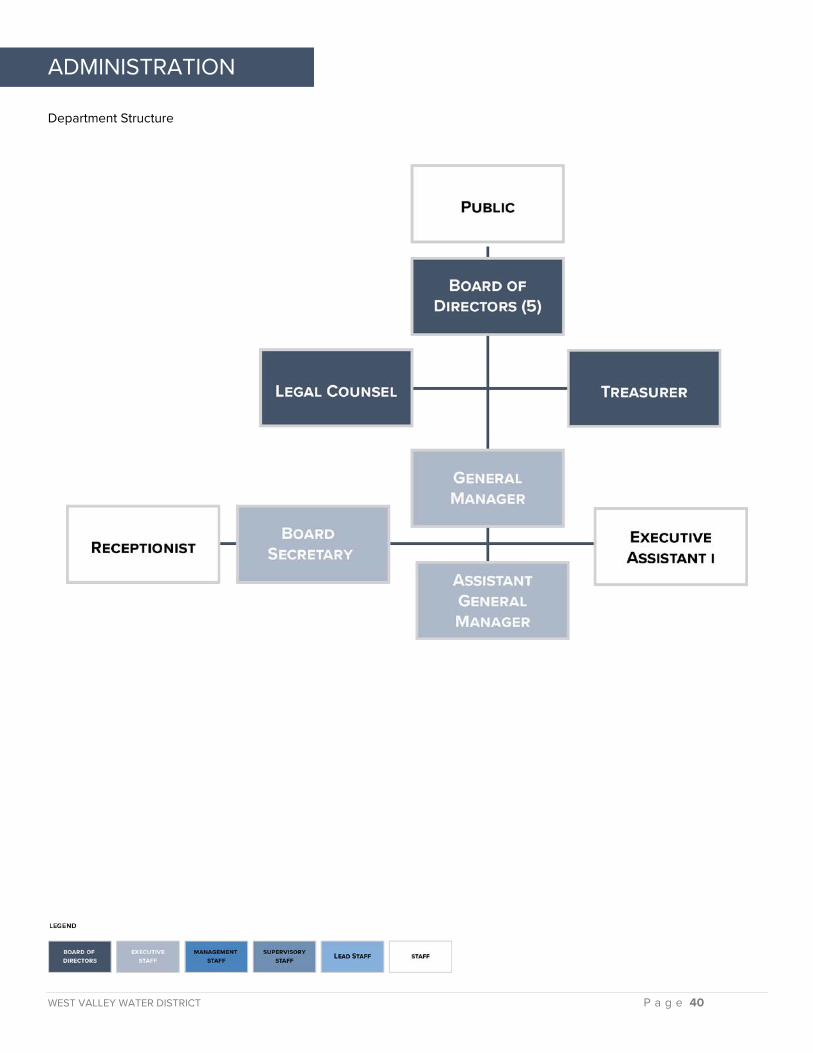
ADMINISTRATION
Department Structure

WEST VALLEY WATER DISTRICT P a g e 41
ADMINISTRATION
Administration FY 2015-16 Actual
FY 2016-17 Amended
FY 2016-17 Projected
FY 2017-18 Proposed
% Change
Personnel Expenses Salaries & Wages / Full Time $ 718,897 $ 904,033 $ 988,965 $ 816,000 -9.7% Salaries & Wages / Part Time 4,540 - - - 0.0% Salaries & Wages / Overtime 2,981 - 66 - 0.0% Salaries & Wages / Vehicle Allowance - - 5,100 6,000 0.0% Benefits 257,540 451,157 265,333 350,170 -103.9% Operating Expenses
Professional Services / Legal 540,735 495,000 303,887 465,000 -6.1% Programs / Regional Programs 38,776 37,847 24,466 30,000 -20.7% Miscellaneous / Dues & Subscriptions 36,701 31,514 44,406 36,305 15.2% Miscellaneous / Promotional Activities 9,024 5,856 5,281 3,400 -41.9% Miscellaneous / Trans/Meals/Convention 67,765 109,290 71,831 109,850 0.5% Miscellaneous / Printing 6,896 28,000 31,052 21,000 -25.0% Miscellaneous / Office 18,340 15,000 15,230 15,000 0.0% Professional Services / Other Consultants 277,965 50,000 63,527 50,000 0.0% Expense / Training 3,031 5,919 6,481 2,320 -60.8% Miscellaneous / Advertising 11,876 7,100 2,117 7,100 0.0% Copying/Outside - 1,000 - - -100.0% Operating Supplies / Uniforms 2,176 6,500 5,542 10,150 56.2% Miscellaneous / Election Expense 58,568 - - 120,000 0.0% DEPARTMENT TOTAL - 5610 2,055,810 2,148,216 1,833,284 2,042,295 -4.9%
Significant Changes
• Assistant General Manager appointed Interim General Manager in August 2016 • Interim General Manager appointed General Manager in November 2016
Fiscal Year 2016-17 Accomplishments
• Successfully administered and developed the reimbursement process for Groundwater Wellhead Treatment System, Fluidized Bed Reactor (FBR) operations with staff and United Technologies Corporation (UTC) staff
• Successfully administered Cleanup and Abatement Account reimbursements for the Fixed Bed (FXB) Perchlorate Treatment Plant construction
• Worked with Interim Chief Financial Officer on refinance of 2006D bonds and Standard & Poors credit rating • Hired Chief Financial Officer in May 2017 • Hired Assistant General Manager in June 2017
Fiscal Year 2017-18 Goals and Objectives
• Work with the Board on the development and execution of key policies in pursuit of District Excellence in Transparency Certificate
• Begin work with the Board on a revised Strategic Plan • Begin implementation of complete enterprise system change out to a new technology • Transition day to day operational oversight responsibilities to the Assistant General Manager • Continue to pursue additional groundwater supplies from Bunker Hill Groundwater Basin • Reach settlement on outstanding litigation
WEST VALLEY WATER DISTRICT P a g e 42
ACCOUNTING
Department Structure

WEST VALLEY WATER DISTRICT P a g e 43
ACCOUNTING
Accounting FY 2015-16 Actual
FY 2016-17 Amended
FY 2016-17 Projected
FY 2017-18 Proposed
% Change
Personnel Expenses Salaries & Wages / Full Time $ 330,798 $ 340,310 $ 319,554 $ 335,000 -1.6% Salaries & Wages / Overtime 5,327 7,000 9,893 8,000 14.3% Salaries & Wages / Bilingual Compensation - - - 2,000 0.0% Benefits 172,130 182,973 143,332 201,140 9.9% Operating Expenses
Professional Services / Auditing 45,246 34,620 21,024 36,000 4.0% Miscellaneous / Bank Account Analysis 29,284 36,000 36,401 30,000 -16.7% Professional Services / Fiscal Agent 19,238 19,800 15,878 19,800 0.0% Professional Services / Consultants - 14,000 6,300 12,500 -10.7% Expense / Training 2,751 3,880 1,262 3,880 0.0% Miscellaneous / Trans/Meals/Convention 109 291 54 291 0.0% Other Miscellaneous / County Tax Collection Fee 291 400 - 400 0.0% Miscellaneous / Dues & Subscriptions 529 1,008 311 938 -6.9% Operating Supplies / Miscellaneous - 200 - 1,000 400.0% Professional Services / Accounting Assistance 30,968 15,000 3,973 - -100.0% DEPARTMENT TOTAL - 5620 636,670 655,482 557,982 650,949 -0.7%
Significant Changes
• -0.7% decrease compared to FY 2016-17, primarily due to decreased banking fees as a result of contracting with Chase Bank for general banking services
Fiscal Year 2016-17 Accomplishments
• Annual audit completed with no significant findings • Changed auditing firms to a local, responsive firm • Changed general banking services from Bank of America to Chase Bank • New full-time Accountant added to assist in department workloads • Assisted Administration with the United Technologies Corporation (UTC) reimbursement process for Groundwater
Wellhead Treatment System, Fluidized Bed Reactor (FBR) operations costs • Prepared supporting documents for Grant reimbursements • Received Government Finance Officers Association (GFOA) Certificate for Excellence in Financial Reporting for
FY 2015-16 • Implemented Affordable Care Act reporting and ensured District compliance with regulations
Fiscal Year 2017-18 Goals and Objectives
• Finish the transfer of banking from Bank of America to Chase Bank • Implement a new Investment Policy that prioritizes risk management, liquidity and an increased rate of return on
District cash balances • Submit Comprehensive Annual Financial Report (CAFR) and annual budget for GFOA award consideration
WEST VALLEY WATER DISTRICT P a g e 44
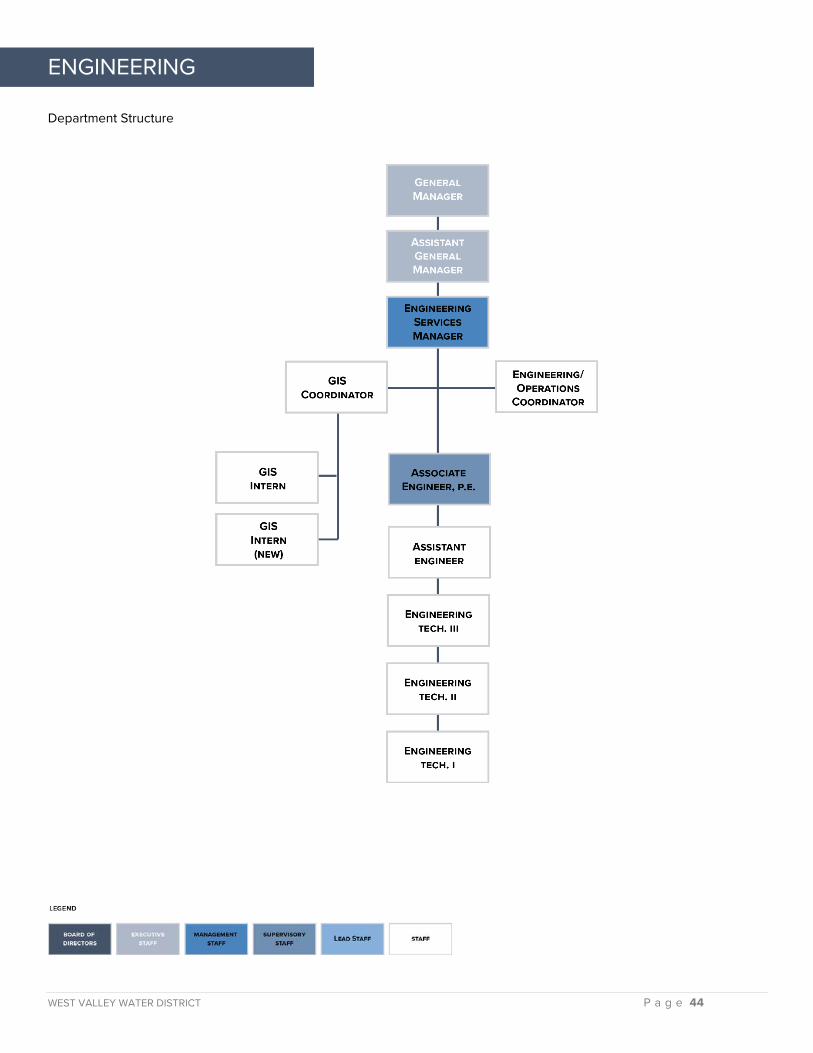
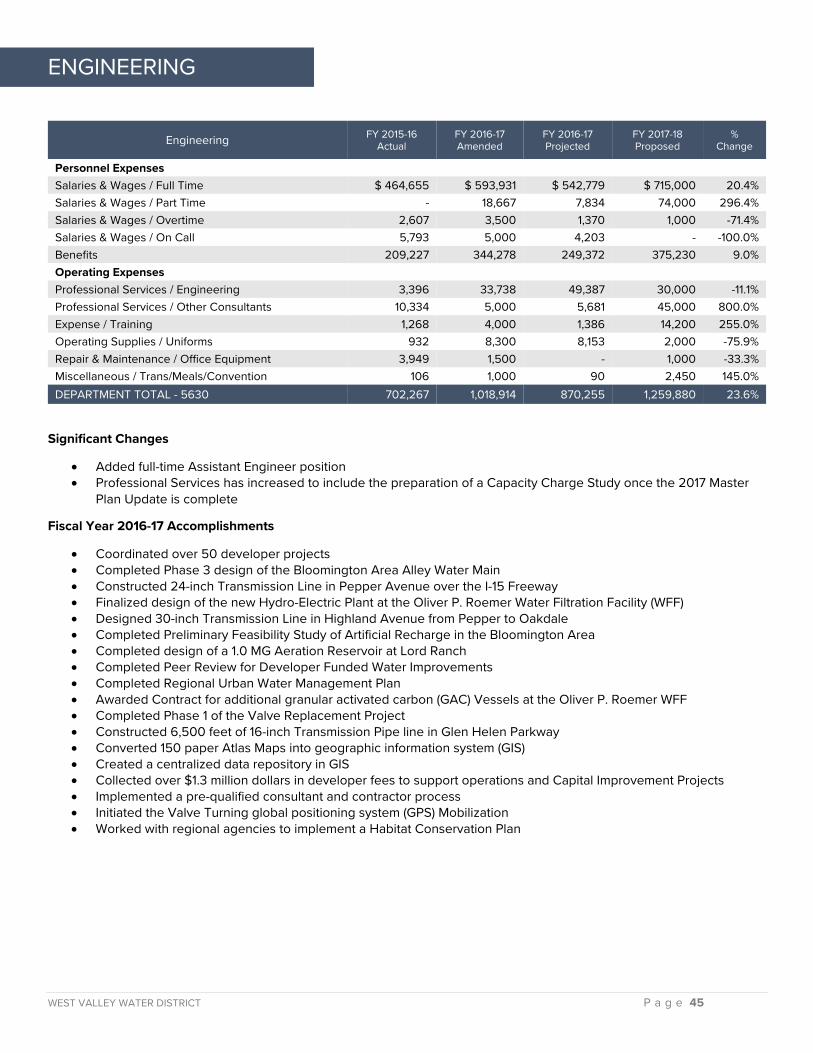
ENGINEERING
Department Structure
WEST VALLEY WATER DISTRICT P a g e 45
ENGINEERING
Engineering FY 2015-16 Actual
FY 2016-17 Amended
FY 2016-17 Projected
FY 2017-18 Proposed
% Change
Personnel Expenses Salaries & Wages / Full Time $ 464,655 $ 593,931 $ 542,779 $ 715,000 20.4% Salaries & Wages / Part Time - 18,667 7,834 74,000 296.4% Salaries & Wages / Overtime 2,607 3,500 1,370 1,000 -71.4% Salaries & Wages / On Call 5,793 5,000 4,203 - -100.0% Benefits 209,227 344,278 249,372 375,230 9.0% Operating Expenses
Professional Services / Engineering 3,396 33,738 49,387 30,000 -11.1% Professional Services / Other Consultants 10,334 5,000 5,681 45,000 800.0% Expense / Training 1,268 4,000 1,386 14,200 255.0% Operating Supplies / Uniforms 932 8,300 8,153 2,000 -75.9% Repair & Maintenance / Office Equipment 3,949 1,500 - 1,000 -33.3% Miscellaneous / Trans/Meals/Convention 106 1,000 90 2,450 145.0% DEPARTMENT TOTAL - 5630 702,267 1,018,914 870,255 1,259,880 23.6%
Significant Changes
• Added full-time Assistant Engineer position • Professional Services has increased to include the preparation of a Capacity Charge Study once the 2017 Master
Plan Update is complete
Fiscal Year 2016-17 Accomplishments
• Coordinated over 50 developer projects • Completed Phase 3 design of the Bloomington Area Alley Water Main • Constructed 24-inch Transmission Line in Pepper Avenue over the I-15 Freeway • Finalized design of the new Hydro-Electric Plant at the Oliver P. Roemer Water Filtration Facility (WFF) • Designed 30-inch Transmission Line in Highland Avenue from Pepper to Oakdale • Completed Preliminary Feasibility Study of Artificial Recharge in the Bloomington Area • Completed design of a 1.0 MG Aeration Reservoir at Lord Ranch • Completed Peer Review for Developer Funded Water Improvements • Completed Regional Urban Water Management Plan • Awarded Contract for additional granular activated carbon (GAC) Vessels at the Oliver P. Roemer WFF • Completed Phase 1 of the Valve Replacement Project • Constructed 6,500 feet of 16-inch Transmission Pipe line in Glen Helen Parkway • Converted 150 paper Atlas Maps into geographic information system (GIS) • Created a centralized data repository in GIS • Collected over $1.3 million dollars in developer fees to support operations and Capital Improvement Projects • Implemented a pre-qualified consultant and contractor process • Initiated the Valve Turning global positioning system (GPS) Mobilization • Worked with regional agencies to implement a Habitat Conservation Plan
WEST VALLEY WATER DISTRICT P a g e 46
ENGINEERING
Fiscal Year 2017-18 Goals and Objectives
• Complete the 2017 Water Master Plan Update • Construct Hydro Electric Plant to offset electrical costs at the Oliver P. Roemer WFF • Create a Hydraulic Water Model of the District’s distribution system • Prepare 5-year Capital Improvement Plan (CIP) • Administer designs and deliver CIP projects as identified in the Capital Improvement Budget • Prepare Capacity Charge Study • Complete geohydrology assessment of Inland Valley Development Agency (IVDA) Wells and Reach Agreement on
well purchase • Complete the designs of various pipeline replacement projects • Implement changes to the Customer Service and Administration Foyers • Prepare water facilities feasibility study for new development • Integrate GIS District wide – Asset Management and Field Based Solutions and workflows • Implement Web Viewing in GIS • Update District Standard Drawings and Specification • Update District Water Service Rules and Regulations Schedule of Rates and Charges

WEST VALLEY WATER DISTRICT P a g e 47
This page is intentionally left blank.
WEST VALLEY WATER DISTRICT P a g e 48
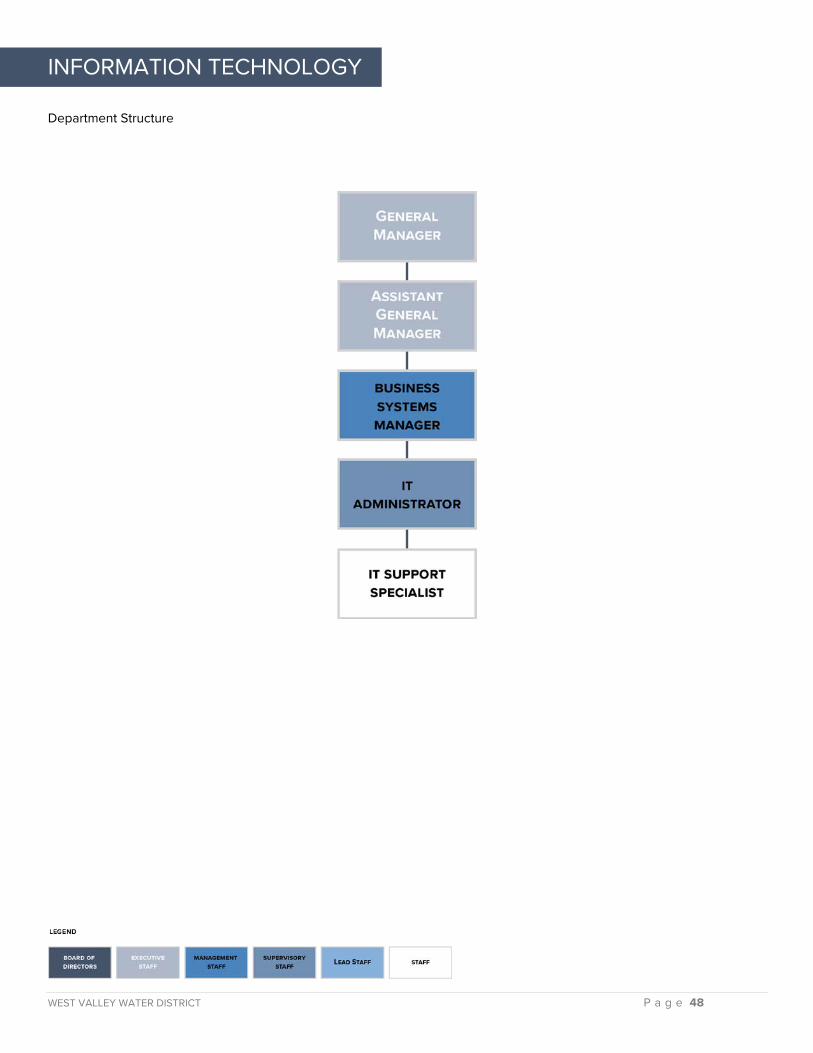
INFORMATION TECHNOLOGY
Department Structure
WEST VALLEY WATER DISTRICT P a g e 49
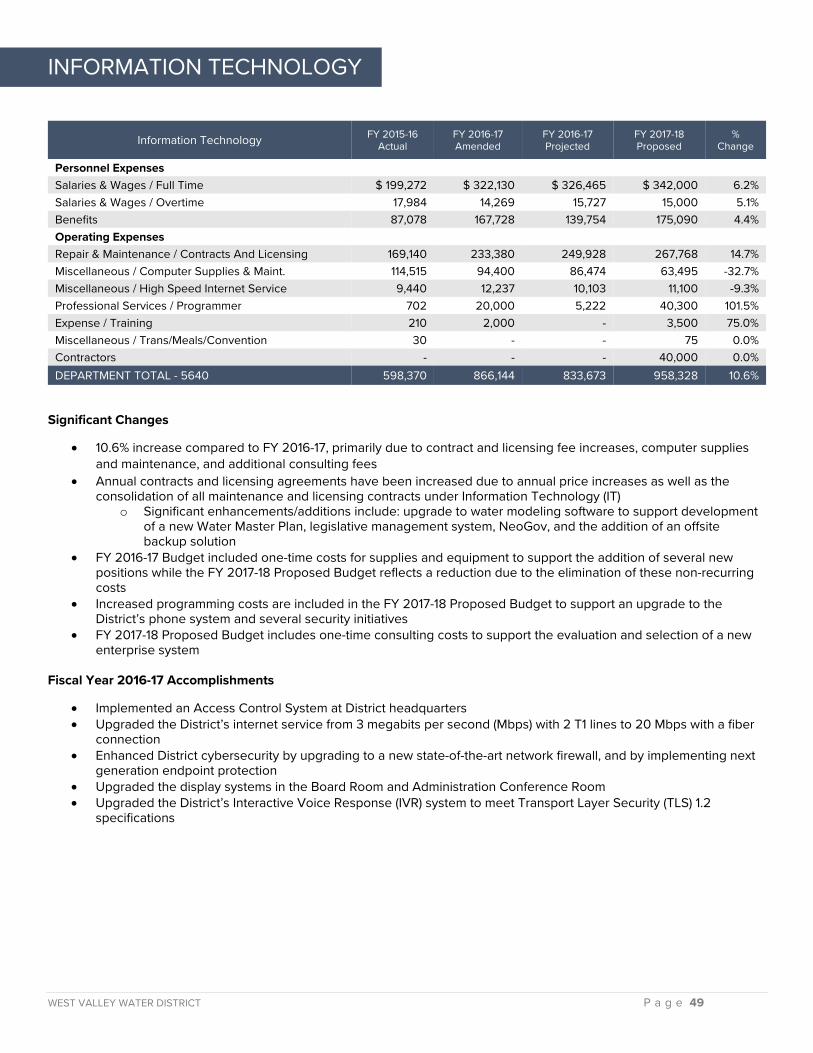
INFORMATION TECHNOLOGY
Information Technology FY 2015-16 Actual
FY 2016-17 Amended
FY 2016-17 Projected
FY 2017-18 Proposed
% Change
Personnel Expenses
Salaries & Wages / Full Time $ 199,272 $ 322,130 $ 326,465 $ 342,000 6.2% Salaries & Wages / Overtime 17,984 14,269 15,727 15,000 5.1% Benefits 87,078 167,728 139,754 175,090 4.4% Operating Expenses
Repair & Maintenance / Contracts And Licensing 169,140 233,380 249,928 267,768 14.7% Miscellaneous / Computer Supplies & Maint. 114,515 94,400 86,474 63,495 -32.7% Miscellaneous / High Speed Internet Service 9,440 12,237 10,103 11,100 -9.3% Professional Services / Programmer 702 20,000 5,222 40,300 101.5% Expense / Training 210 2,000 - 3,500 75.0% Miscellaneous / Trans/Meals/Convention 30 - - 75 0.0% Contractors - - - 40,000 0.0% DEPARTMENT TOTAL - 5640 598,370 866,144 833,673 958,328 10.6%
Significant Changes
• 10.6% increase compared to FY 2016-17, primarily due to contract and licensing fee increases, computer supplies and maintenance, and additional consulting fees
• Annual contracts and licensing agreements have been increased due to annual price increases as well as the consolidation of all maintenance and licensing contracts under Information Technology (IT)
o Significant enhancements/additions include: upgrade to water modeling software to support development of a new Water Master Plan, legislative management system, NeoGov, and the addition of an offsite backup solution
• FY 2016-17 Budget included one-time costs for supplies and equipment to support the addition of several new positions while the FY 2017-18 Proposed Budget reflects a reduction due to the elimination of these non-recurring costs
• Increased programming costs are included in the FY 2017-18 Proposed Budget to support an upgrade to the District’s phone system and several security initiatives
• FY 2017-18 Proposed Budget includes one-time consulting costs to support the evaluation and selection of a new enterprise system
Fiscal Year 2016-17 Accomplishments
• Implemented an Access Control System at District headquarters • Upgraded the District’s internet service from 3 megabits per second (Mbps) with 2 T1 lines to 20 Mbps with a fiber
connection • Enhanced District cybersecurity by upgrading to a new state-of-the-art network firewall, and by implementing next
generation endpoint protection • Upgraded the display systems in the Board Room and Administration Conference Room • Upgraded the District’s Interactive Voice Response (IVR) system to meet Transport Layer Security (TLS) 1.2
specifications
WEST VALLEY WATER DISTRICT P a g e 50
INFORMATION TECHNOLOGY
Fiscal Year 2017-18 Goals and Objectives
• Goal 1: Assess and evaluate technology solutions to improve District operations o Objectives:
1. Complete a draft I.T. Master Plan 2. Identify an ideal enterprise system capable of meeting business process needs, the need for
computerized maintenance management, field mobility requirements, and its requirements for systems integration
• Goal 2: Improve decision support capabilities by developing business intelligence and by making information more accessible
o Objectives: 1. Meet with executives, business unit managers, and supervisors to develop and document an
understanding of the desired reporting and analytics 2. Implement a document management system to consolidate historical and transactional documents
into a central repository that will be easily accessible 3. Work with the Operations staff to integrate data collected in the Supervisory Control and Data
Acquisition System (SCADA) into other key information systems and processes
• Goal 3: Maintain a secure and reliable technology infrastructure o Objectives:
1. Complete a comprehensive assessment of all technology assets and the related maintenance and support agreements
2. Continue enhancements of the cyber security program 3. Upgrade the District’s Unified Communications System (UCS) to enhance call center features and
reliability

WEST VALLEY WATER DISTRICT P a g e 51
This page is intentionally left blank.
WEST VALLEY WATER DISTRICT P a g e 52
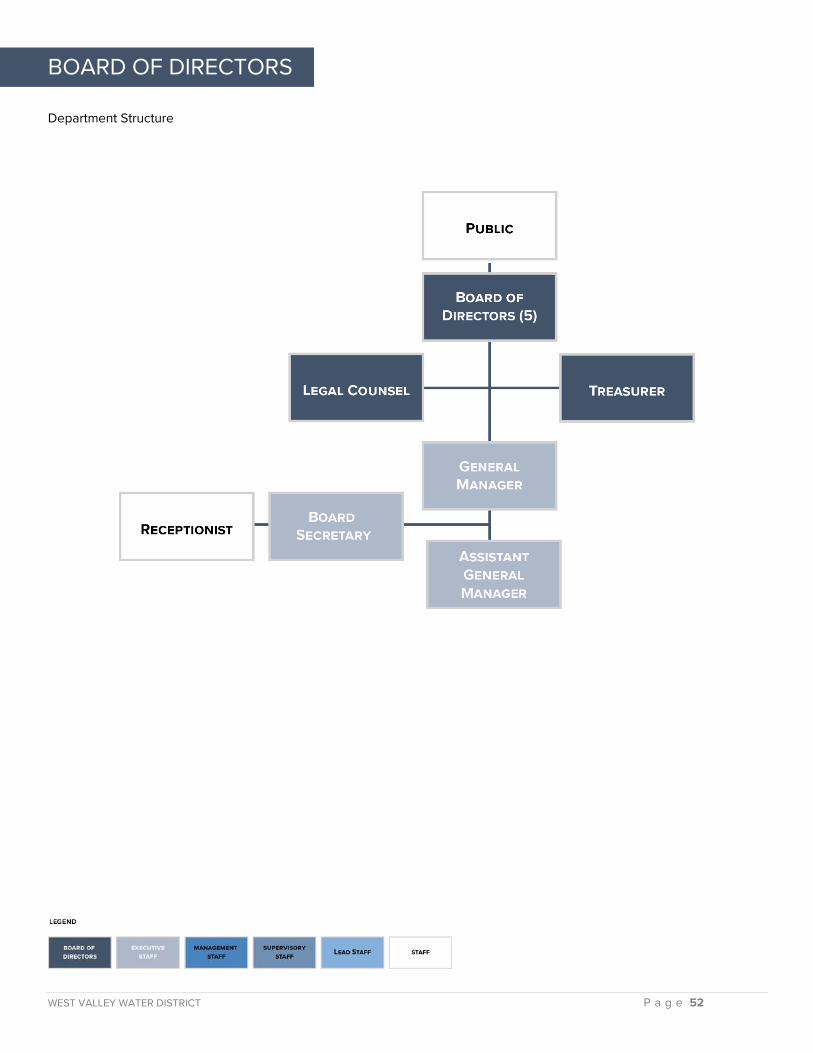
BOARD OF DIRECTORS
Department Structure
WEST VALLEY WATER DISTRICT P a g e 53
BOARD OF DIRECTORS
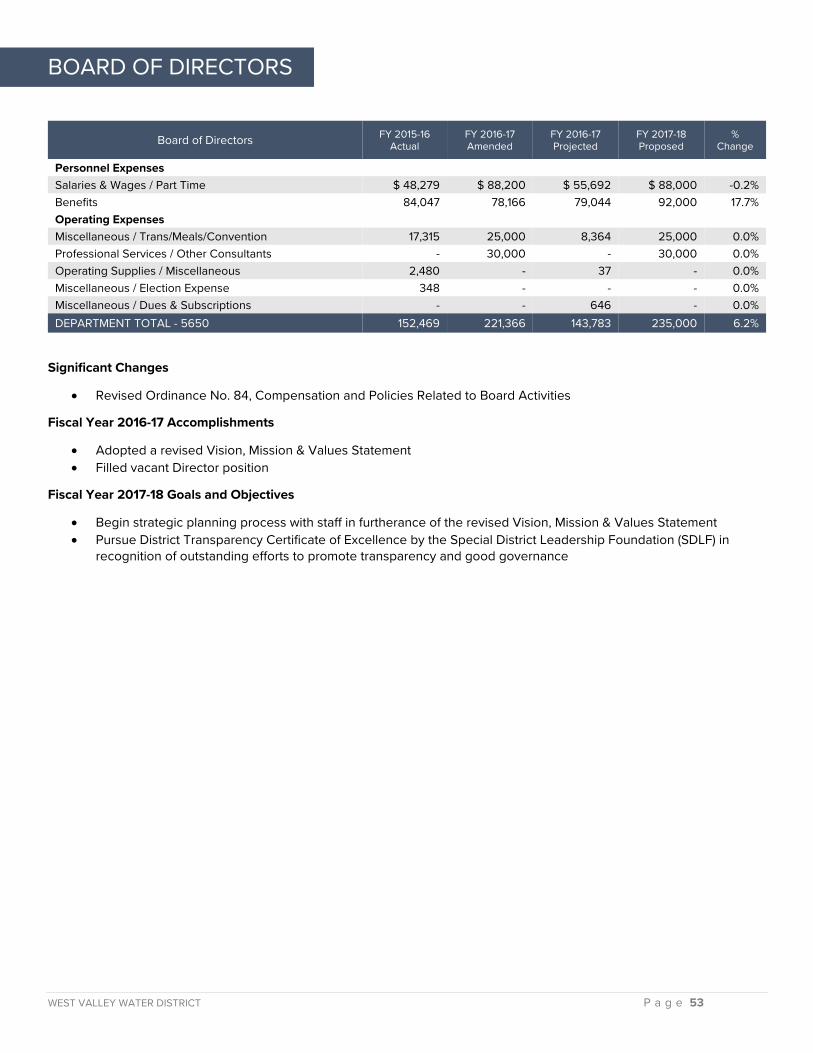
Board of Directors FY 2015-16 Actual
FY 2016-17 Amended
FY 2016-17 Projected
FY 2017-18 Proposed
% Change
Personnel Expenses Salaries & Wages / Part Time $ 48,279 $ 88,200 $ 55,692 $ 88,000 -0.2% Benefits 84,047 78,166 79,044 92,000 17.7% Operating Expenses
Miscellaneous / Trans/Meals/Convention 17,315 25,000 8,364 25,000 0.0% Professional Services / Other Consultants - 30,000 - 30,000 0.0% Operating Supplies / Miscellaneous 2,480 - 37 - 0.0% Miscellaneous / Election Expense 348 - - - 0.0% Miscellaneous / Dues & Subscriptions - - 646 - 0.0% DEPARTMENT TOTAL - 5650 152,469 221,366 143,783 235,000 6.2%
Significant Changes
• Revised Ordinance No. 84, Compensation and Policies Related to Board Activities
Fiscal Year 2016-17 Accomplishments
• Adopted a revised Vision, Mission & Values Statement • Filled vacant Director position
Fiscal Year 2017-18 Goals and Objectives
• Begin strategic planning process with staff in furtherance of the revised Vision, Mission & Values Statement • Pursue District Transparency Certificate of Excellence by the Special District Leadership Foundation (SDLF) in
recognition of outstanding efforts to promote transparency and good governance
WEST VALLEY WATER DISTRICT P a g e 54
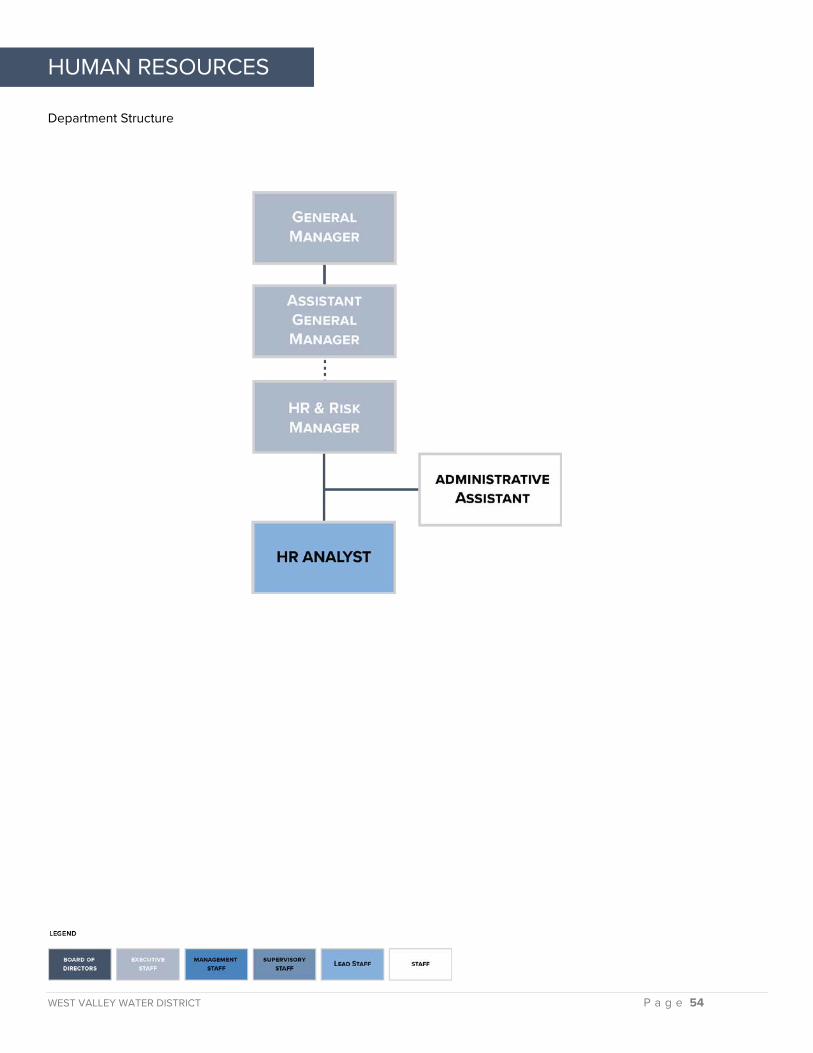
HUMAN RESOURCES
Department Structure
WEST VALLEY WATER DISTRICT P a g e 55
HUMAN RESOURCES
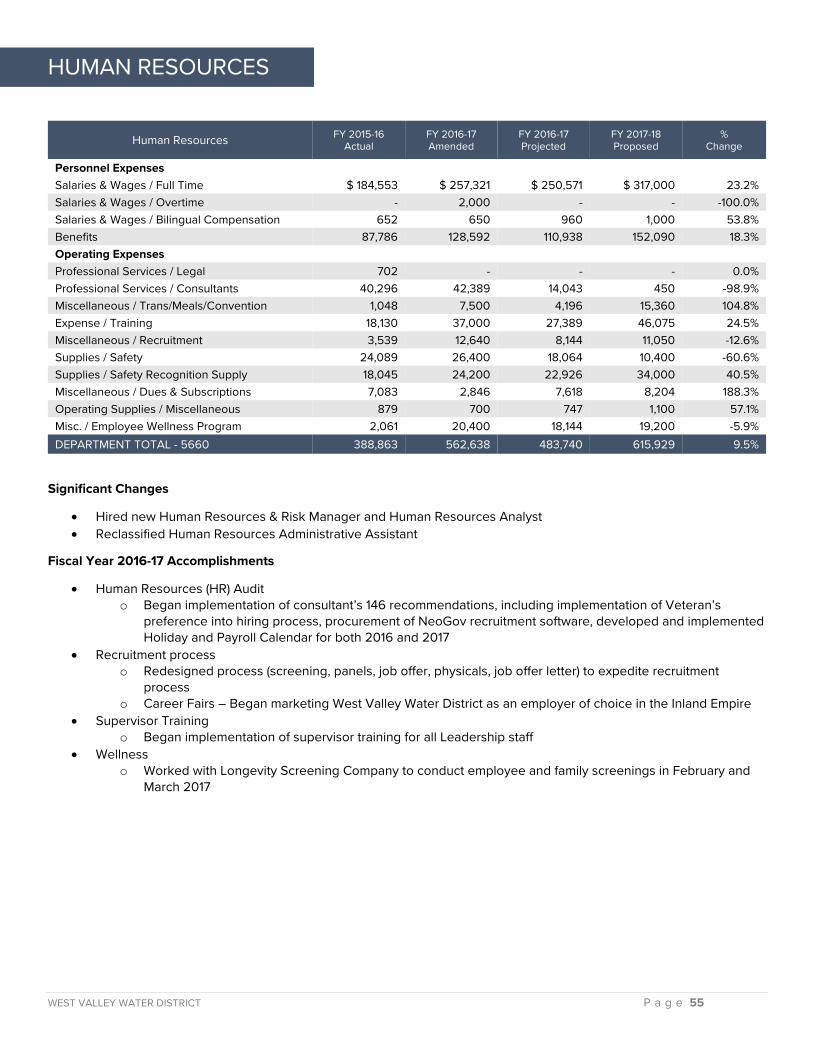
Human Resources FY 2015-16 Actual
FY 2016-17 Amended
FY 2016-17 Projected
FY 2017-18 Proposed
% Change
Personnel Expenses Salaries & Wages / Full Time $ 184,553 $ 257,321 $ 250,571 $ 317,000 23.2% Salaries & Wages / Overtime - 2,000 - - -100.0% Salaries & Wages / Bilingual Compensation 652 650 960 1,000 53.8% Benefits 87,786 128,592 110,938 152,090 18.3% Operating Expenses Professional Services / Legal 702 - - - 0.0% Professional Services / Consultants 40,296 42,389 14,043 450 -98.9% Miscellaneous / Trans/Meals/Convention 1,048 7,500 4,196 15,360 104.8% Expense / Training 18,130 37,000 27,389 46,075 24.5% Miscellaneous / Recruitment 3,539 12,640 8,144 11,050 -12.6% Supplies / Safety 24,089 26,400 18,064 10,400 -60.6% Supplies / Safety Recognition Supply 18,045 24,200 22,926 34,000 40.5% Miscellaneous / Dues & Subscriptions 7,083 2,846 7,618 8,204 188.3% Operating Supplies / Miscellaneous 879 700 747 1,100 57.1% Misc. / Employee Wellness Program 2,061 20,400 18,144 19,200 -5.9% DEPARTMENT TOTAL - 5660 388,863 562,638 483,740 615,929 9.5%
Significant Changes
• Hired new Human Resources & Risk Manager and Human Resources Analyst • Reclassified Human Resources Administrative Assistant
Fiscal Year 2016-17 Accomplishments
• Human Resources (HR) Audit o Began implementation of consultant’s 146 recommendations, including implementation of Veteran’s
preference into hiring process, procurement of NeoGov recruitment software, developed and implemented Holiday and Payroll Calendar for both 2016 and 2017
• Recruitment process o Redesigned process (screening, panels, job offer, physicals, job offer letter) to expedite recruitment
process o Career Fairs – Began marketing West Valley Water District as an employer of choice in the Inland Empire
• Supervisor Training o Began implementation of supervisor training for all Leadership staff
• Wellness o Worked with Longevity Screening Company to conduct employee and family screenings in February and
March 2017
WEST VALLEY WATER DISTRICT P a g e 56
HUMAN RESOURCES
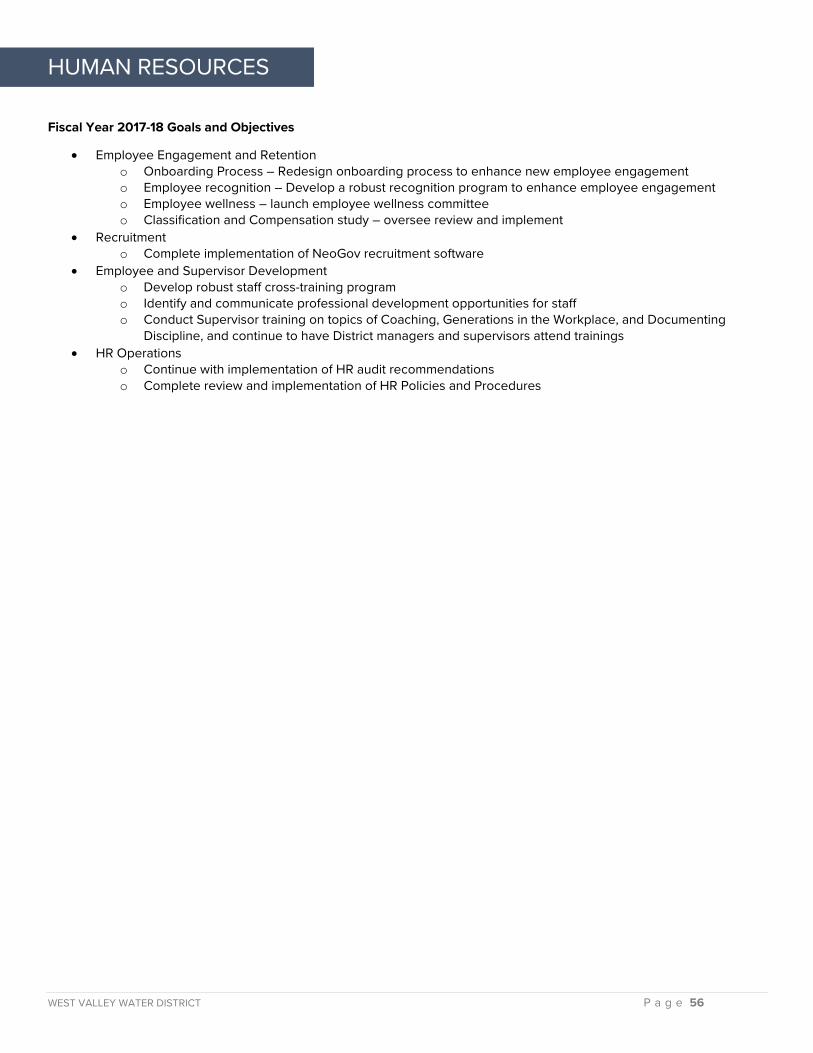
Fiscal Year 2017-18 Goals and Objectives
• Employee Engagement and Retention o Onboarding Process – Redesign onboarding process to enhance new employee engagement o Employee recognition – Develop a robust recognition program to enhance employee engagement o Employee wellness – launch employee wellness committee o Classification and Compensation study – oversee review and implement
• Recruitment o Complete implementation of NeoGov recruitment software
• Employee and Supervisor Development o Develop robust staff cross-training program o Identify and communicate professional development opportunities for staff o Conduct Supervisor training on topics of Coaching, Generations in the Workplace, and Documenting
Discipline, and continue to have District managers and supervisors attend trainings • HR Operations
o Continue with implementation of HR audit recommendations o Complete review and implementation of HR Policies and Procedures

WEST VALLEY WATER DISTRICT P a g e 57
This page is intentionally left blank.
WEST VALLEY WATER DISTRICT P a g e 58
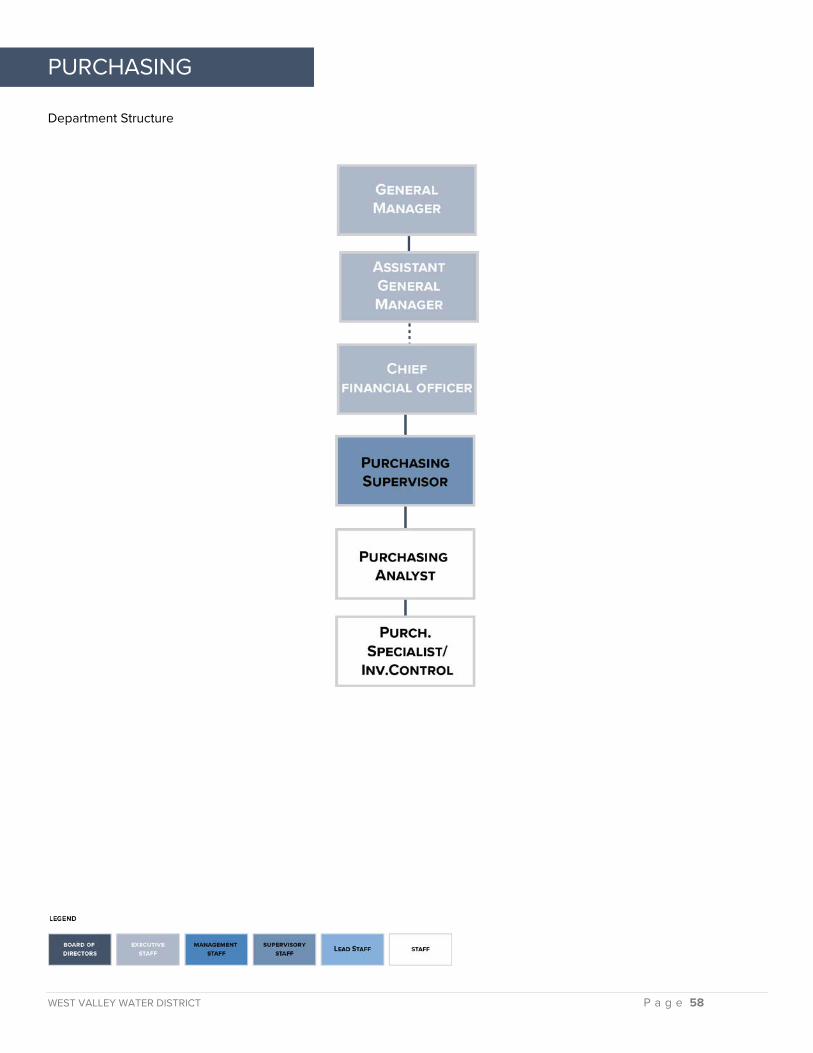
PURCHASING
Department Structure
WEST VALLEY WATER DISTRICT P a g e 59
PURCHASING
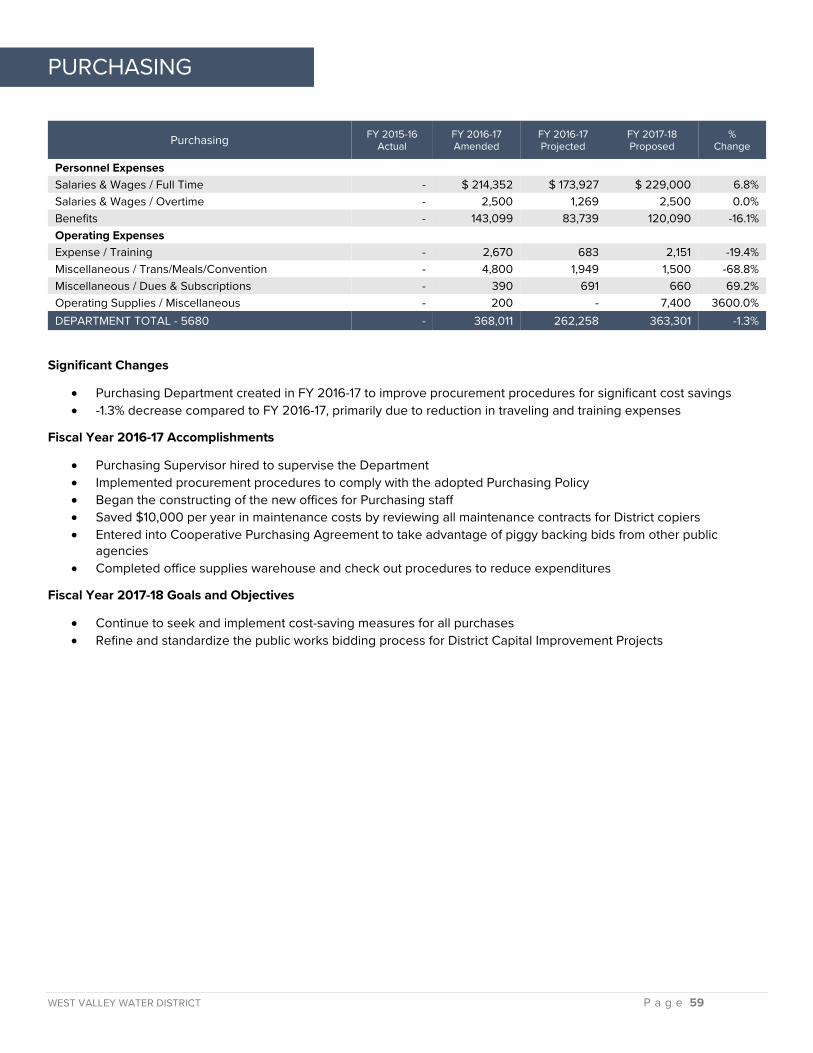
Purchasing FY 2015-16 Actual
FY 2016-17 Amended
FY 2016-17 Projected
FY 2017-18 Proposed
% Change
Personnel Expenses Salaries & Wages / Full Time - $ 214,352 $ 173,927 $ 229,000 6.8% Salaries & Wages / Overtime - 2,500 1,269 2,500 0.0% Benefits - 143,099 83,739 120,090 -16.1% Operating Expenses
Expense / Training - 2,670 683 2,151 -19.4% Miscellaneous / Trans/Meals/Convention - 4,800 1,949 1,500 -68.8% Miscellaneous / Dues & Subscriptions - 390 691 660 69.2% Operating Supplies / Miscellaneous - 200 - 7,400 3600.0% DEPARTMENT TOTAL - 5680 - 368,011 262,258 363,301 -1.3%
Significant Changes
• Purchasing Department created in FY 2016-17 to improve procurement procedures for significant cost savings • -1.3% decrease compared to FY 2016-17, primarily due to reduction in traveling and training expenses
Fiscal Year 2016-17 Accomplishments
• Purchasing Supervisor hired to supervise the Department • Implemented procurement procedures to comply with the adopted Purchasing Policy • Began the constructing of the new offices for Purchasing staff • Saved $10,000 per year in maintenance costs by reviewing all maintenance contracts for District copiers • Entered into Cooperative Purchasing Agreement to take advantage of piggy backing bids from other public
agencies • Completed office supplies warehouse and check out procedures to reduce expenditures
Fiscal Year 2017-18 Goals and Objectives
• Continue to seek and implement cost-saving measures for all purchases • Refine and standardize the public works bidding process for District Capital Improvement Projects
WEST VALLEY WATER DISTRICT P a g e 60
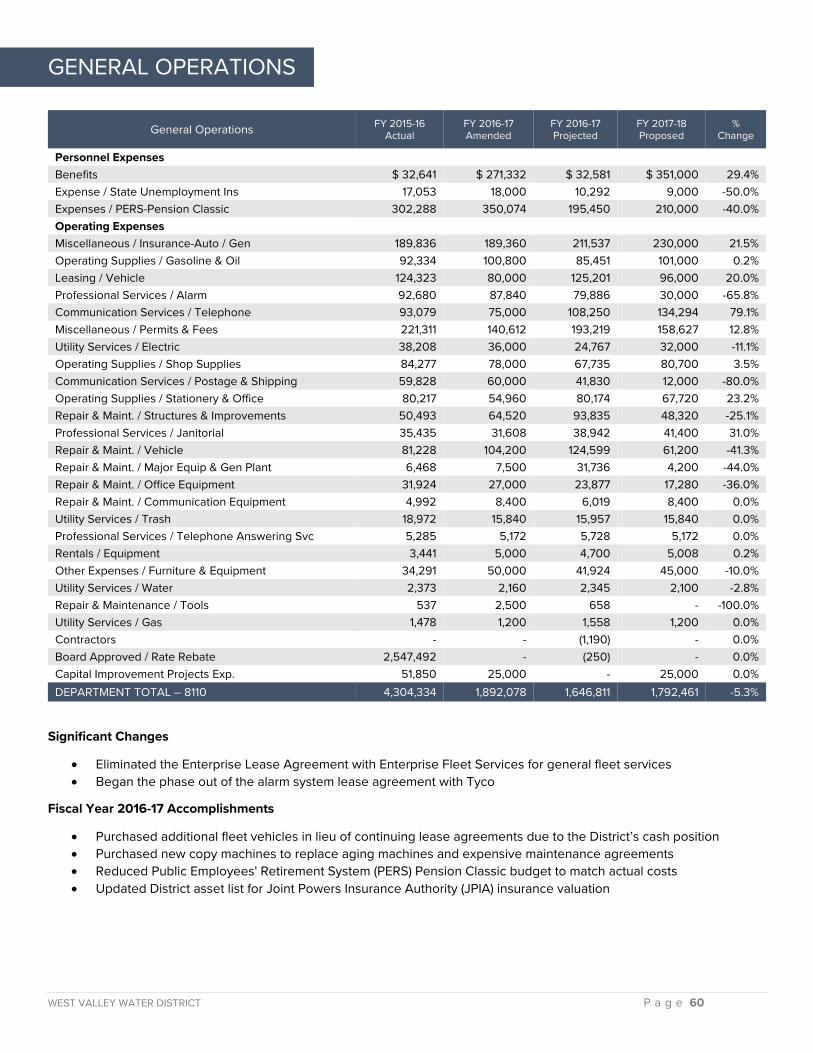
GENERAL OPERATIONS
General Operations FY 2015-16 Actual
FY 2016-17 Amended
FY 2016-17 Projected
FY 2017-18 Proposed
% Change
Personnel Expenses Benefits $ 32,641 $ 271,332 $ 32,581 $ 351,000 29.4% Expense / State Unemployment Ins 17,053 18,000 10,292 9,000 -50.0% Expenses / PERS-Pension Classic 302,288 350,074 195,450 210,000 -40.0% Operating Expenses
Miscellaneous / Insurance-Auto / Gen 189,836 189,360 211,537 230,000 21.5% Operating Supplies / Gasoline & Oil 92,334 100,800 85,451 101,000 0.2% Leasing / Vehicle 124,323 80,000 125,201 96,000 20.0% Professional Services / Alarm 92,680 87,840 79,886 30,000 -65.8% Communication Services / Telephone 93,079 75,000 108,250 134,294 79.1% Miscellaneous / Permits & Fees 221,311 140,612 193,219 158,627 12.8% Utility Services / Electric 38,208 36,000 24,767 32,000 -11.1% Operating Supplies / Shop Supplies 84,277 78,000 67,735 80,700 3.5% Communication Services / Postage & Shipping 59,828 60,000 41,830 12,000 -80.0% Operating Supplies / Stationery & Office 80,217 54,960 80,174 67,720 23.2% Repair & Maint. / Structures & Improvements 50,493 64,520 93,835 48,320 -25.1% Professional Services / Janitorial 35,435 31,608 38,942 41,400 31.0% Repair & Maint. / Vehicle 81,228 104,200 124,599 61,200 -41.3% Repair & Maint. / Major Equip & Gen Plant 6,468 7,500 31,736 4,200 -44.0% Repair & Maint. / Office Equipment 31,924 27,000 23,877 17,280 -36.0% Repair & Maint. / Communication Equipment 4,992 8,400 6,019 8,400 0.0% Utility Services / Trash 18,972 15,840 15,957 15,840 0.0% Professional Services / Telephone Answering Svc 5,285 5,172 5,728 5,172 0.0% Rentals / Equipment 3,441 5,000 4,700 5,008 0.2% Other Expenses / Furniture & Equipment 34,291 50,000 41,924 45,000 -10.0% Utility Services / Water 2,373 2,160 2,345 2,100 -2.8% Repair & Maintenance / Tools 537 2,500 658 - -100.0% Utility Services / Gas 1,478 1,200 1,558 1,200 0.0% Contractors - - (1,190) - 0.0% Board Approved / Rate Rebate 2,547,492 - (250) - 0.0% Capital Improvement Projects Exp. 51,850 25,000 - 25,000 0.0% DEPARTMENT TOTAL – 8110 4,304,334 1,892,078 1,646,811 1,792,461 -5.3%
Significant Changes
• Eliminated the Enterprise Lease Agreement with Enterprise Fleet Services for general fleet services • Began the phase out of the alarm system lease agreement with Tyco
Fiscal Year 2016-17 Accomplishments
• Purchased additional fleet vehicles in lieu of continuing lease agreements due to the District’s cash position • Purchased new copy machines to replace aging machines and expensive maintenance agreements • Reduced Public Employees' Retirement System (PERS) Pension Classic budget to match actual costs • Updated District asset list for Joint Powers Insurance Authority (JPIA) insurance valuation
WEST VALLEY WATER DISTRICT P a g e 61
GENERAL OPERATIONS
Fiscal Year 2017-18 Goals and Objectives
• Continue to purchase leased vehicles to further reduce leasing expenses • Continue to look for value added services for efficiencies and opportunities to reduced costs on general operating
expenses, i.e., competitively procuring fuels and office supplies
Note: no staff assigned to department.
WEST VALLEY WATER DISTRICT P a g e 62
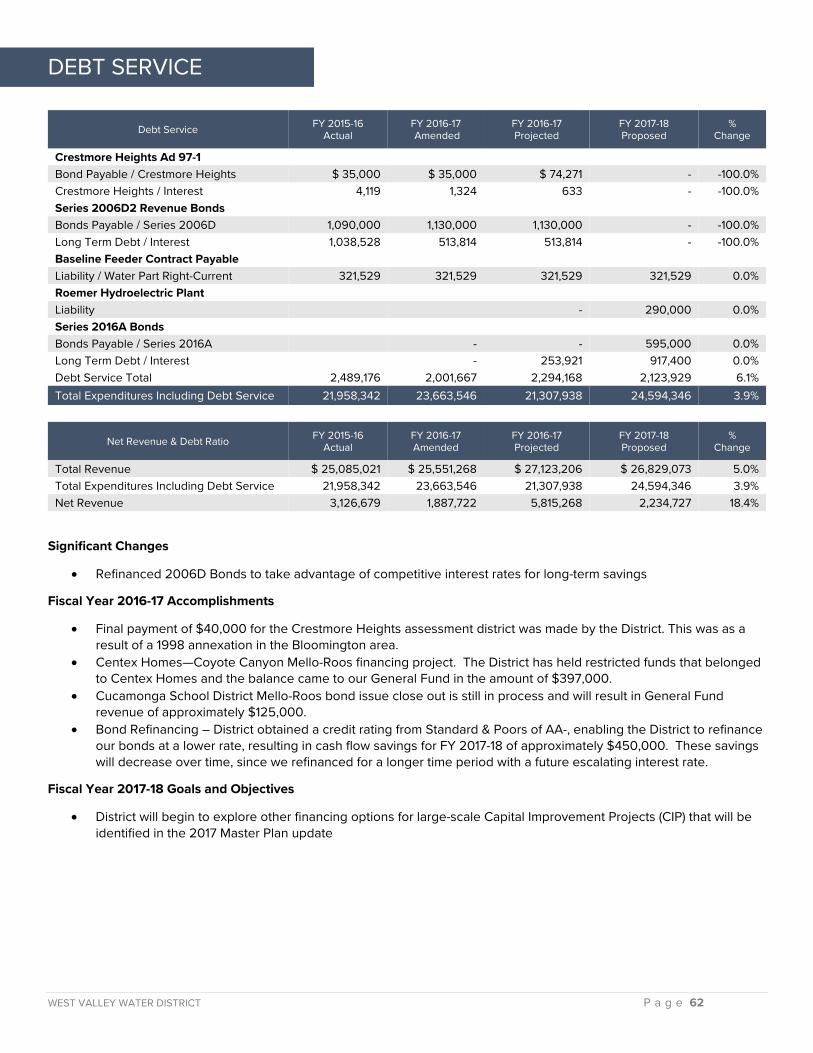
DEBT SERVICE
Debt Service FY 2015-16 Actual
FY 2016-17 Amended
FY 2016-17 Projected
FY 2017-18 Proposed
% Change
Crestmore Heights Ad 97-1
Bond Payable / Crestmore Heights $ 35,000 $ 35,000 $ 74,271 - -100.0% Crestmore Heights / Interest 4,119 1,324 633 - -100.0% Series 2006D2 Revenue Bonds
Bonds Payable / Series 2006D 1,090,000 1,130,000 1,130,000 - -100.0% Long Term Debt / Interest 1,038,528 513,814 513,814 - -100.0% Baseline Feeder Contract Payable
Liability / Water Part Right-Current 321,529 321,529 321,529 321,529 0.0% Roemer Hydroelectric Plant
Liability - 290,000 0.0% Series 2016A Bonds
Bonds Payable / Series 2016A - - 595,000 0.0% Long Term Debt / Interest - 253,921 917,400 0.0% Debt Service Total 2,489,176 2,001,667 2,294,168 2,123,929 6.1% Total Expenditures Including Debt Service 21,958,342 23,663,546 21,307,938 24,594,346 3.9%
Net Revenue & Debt Ratio FY 2015-16 Actual
FY 2016-17 Amended
FY 2016-17 Projected
FY 2017-18 Proposed
% Change
Total Revenue $ 25,085,021 $ 25,551,268 $ 27,123,206 $ 26,829,073 5.0% Total Expenditures Including Debt Service 21,958,342 23,663,546 21,307,938 24,594,346 3.9% Net Revenue 3,126,679 1,887,722 5,815,268 2,234,727 18.4%
Significant Changes
• Refinanced 2006D Bonds to take advantage of competitive interest rates for long-term savings
Fiscal Year 2016-17 Accomplishments
• Final payment of $40,000 for the Crestmore Heights assessment district was made by the District. This was as a result of a 1998 annexation in the Bloomington area.
• Centex Homes—Coyote Canyon Mello-Roos financing project. The District has held restricted funds that belonged to Centex Homes and the balance came to our General Fund in the amount of $397,000.
• Cucamonga School District Mello-Roos bond issue close out is still in process and will result in General Fund revenue of approximately $125,000.
• Bond Refinancing – District obtained a credit rating from Standard & Poors of AA-, enabling the District to refinance our bonds at a lower rate, resulting in cash flow savings for FY 2017-18 of approximately $450,000. These savings will decrease over time, since we refinanced for a longer time period with a future escalating interest rate.
Fiscal Year 2017-18 Goals and Objectives
• District will begin to explore other financing options for large-scale Capital Improvement Projects (CIP) that will be identified in the 2017 Master Plan update
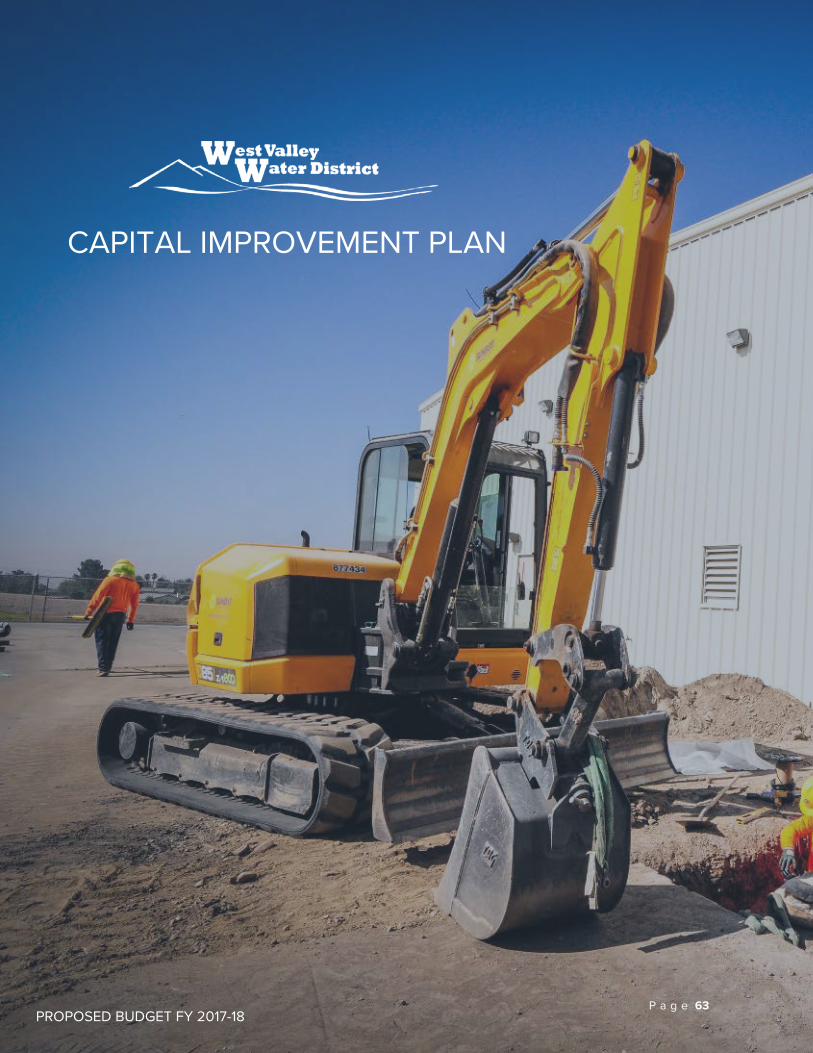
WEST VALLEY WATER DISTRICT P a g e 63
CAPITAL IMPROVEMENT PLAN
PROPOSED BUDGET FY 2017-18
P a g e 63
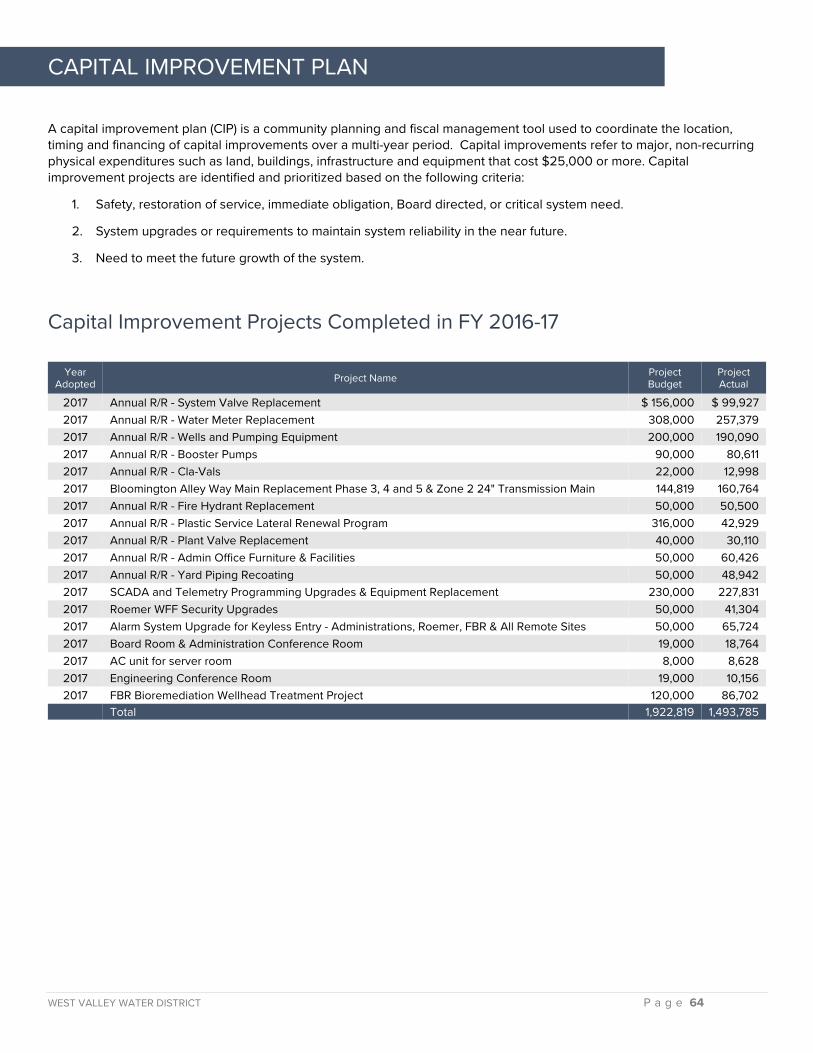
WEST VALLEY WATER DISTRICT P a g e 64
CAPITAL IMPROVEMENT PLAN
A capital improvement plan (CIP) is a community planning and fiscal management tool used to coordinate the location, timing and financing of capital improvements over a multi-year period. Capital improvements refer to major, non-recurring physical expenditures such as land, buildings, infrastructure and equipment that cost $25,000 or more. Capital improvement projects are identified and prioritized based on the following criteria:
1. Safety, restoration of service, immediate obligation, Board directed, or critical system need.
2. System upgrades or requirements to maintain system reliability in the near future.
3. Need to meet the future growth of the system.
Capital Improvement Projects Completed in FY 2016-17
Year Adopted Project Name Project
Budget Project Actual
2017 Annual R/R - System Valve Replacement $ 156,000 $ 99,927 2017 Annual R/R - Water Meter Replacement 308,000 257,379 2017 Annual R/R - Wells and Pumping Equipment 200,000 190,090 2017 Annual R/R - Booster Pumps 90,000 80,611 2017 Annual R/R - Cla-Vals 22,000 12,998 2017 Bloomington Alley Way Main Replacement Phase 3, 4 and 5 & Zone 2 24" Transmission Main 144,819 160,764 2017 Annual R/R - Fire Hydrant Replacement 50,000 50,500 2017 Annual R/R - Plastic Service Lateral Renewal Program 316,000 42,929 2017 Annual R/R - Plant Valve Replacement 40,000 30,110 2017 Annual R/R - Admin Office Furniture & Facilities 50,000 60,426 2017 Annual R/R - Yard Piping Recoating 50,000 48,942 2017 SCADA and Telemetry Programming Upgrades & Equipment Replacement 230,000 227,831 2017 Roemer WFF Security Upgrades 50,000 41,304 2017 Alarm System Upgrade for Keyless Entry - Administrations, Roemer, FBR & All Remote Sites 50,000 65,724 2017 Board Room & Administration Conference Room 19,000 18,764 2017 AC unit for server room 8,000 8,628 2017 Engineering Conference Room 19,000 10,156 2017 FBR Bioremediation Wellhead Treatment Project 120,000 86,702
Total 1,922,819 1,493,785

WEST VALLEY WATER DISTRICT P a g e 65
Ongoing Capital Improvement Projects
The CIP is a working document that is reviewed and updated by staff regularly to reflect changing community needs, priorities and funding opportunities.
Capital projects are categorized as follows:
1. New Water Supply: Facilities required to support new sources of water are funded from new supply fees or user rates.
2. Expansion: Facilities required to support new or future users are funded from capacity fees or user rates.
3. Betterment: Facilities required because of inadequate capacity or new requirements that benefit existing users are funded from rates, grants or loans.
4. Replacement: Facilities required to renew or replace existing facilities that have deteriorated or have exceeded their useful life are funded from user rates.
Capital Improvement Plan Distribution
Repair, Rehab & Maintenance of System
$4,166,250
New System Infrastructure$2,190,000
Other$1,624,000
Year Adopted Project Name Project
Budget Project
YTD
2014 Pepper Avenue @ I-10 Freeway Zone 2 - 24" Transmission Main - Construction $ 690,000 $ 633,938 2015 Lord Ranch 1.0 MG Aeration Tank 9,500 56,455 2015 Lord Ranch 4-3 Pump Station 80,000 58,588 2015 Lord Ranch - Grading, Piping and Site Work 55,000 98,036 2015 Highland Avenue 30" Transmission Main - Pepper Avenue to Oakdale - Design 15,000 41,038 2016 Water System Geographical Information Systems (GIS) Application Upgrades - Phase I 300,000 113,024 2016 Oliver P. Roemer GAC Vessel Expansion 1,138,500 118,408 2017 Well Characterization Study - Abandoned Wells 245,000 245,000 2017 Annual R/R - SCADA & Metering to Non-Metered Pumps/Wells 28,000 1,431 2017 Pump Station & Well Buildings Rehabilitation 82,500 45,100 2017 Fixed Bed Reactor Design and Equipment Procurement 3,000,000 2,066,594 2017 Oliver P. Roemer Hydroelectric Plant 100,000 103,809 2017 Annual - Water System & Administration Security Upgrades 45,000 15,750 2017 Customer Service Foyer Renovation 100,000 5,661
Total 5,888,500 3,602,831
Includes necessary expenditures to maintain, repair and replace infrastructure
$7.98 million
20%
52%
28%

WEST VALLEY WATER DISTRICT P a g e 66
FY 2017-18 Capital Improvement Plan
Replacement / Rehabilitation Of System Assets Capital Revenues
Capacity Charges
Grants/ Reimbs.
Project Total
Source Of Supply Well Characterization Study - Abandoned Wells TBD - - - Wells And Pumping Equipment Rehabilitation Annual R/R - Wells and Pumping Equipment $ 200,000 - - $ 200,000 Pumps, Boosters, & Cla-Val Rehabilitation & Replacement Annual R/R - Booster Pumps 165,000 - - 165,000 Annual R/R - Cla-Vals 50,000 - - 50,000 Roemer Effluent Pump Replacement 200,000 - - 200,000 Reservoir Rehabilitation Annual R/R - Reservoir Inspection, Cleaning, And Repairs. 250,000 - - 250,000 Rehabilitate Both The Interior And Exterior of Reservoir 4-3 1,125,000 - - 1,125,000 Reservoir R2-3 Site Upgrades & V-Ditch And Catch Basin Repairs. 50,000 - 200,000 250,000 Water Main Replacement Water Main Replacements - Unplanned 45,000 - - 45,000 Zone 3 Distribution Pipeline Replacement - 8" in Valley/Pomona 750,000 - - 750,000 System Appurtenances Rehabilitation & Replacement Annual R/R - Large Meter Vault Lid Replacement 15,000 - - 15,000 Annual R/R - Water Meter Replacement 329,250 - - 329,250 Annual R/R - System Valve Replacement 175,000 - - 175,000 Annual R/R - Fire Hydrant Replacement 75,000 - - 75,000 Facilities And Plants Rehabilitation & Replacement Annual R/R - Plant Valve Replacement 40,000 - - 40,000 Annual R/R - Upgrade Plant Gates To Auto Openers 50,000 - - 50,000 Annual R/R - Yard Piping Recoating 50,000 - - 50,000 Roemer WFF - Filter Media Replacement 180,000 - - 180,000 Roemer WFF - Valve Controller/Actuator Replacement 42,000 - - 42,000 Annual R/R - Roemer Facilities 95,000 - - 95,000 Pump Station & Well Buildings Rehabilitation 80,000 - - 80,000 District Headquarters 130,000 - - 130,000 Subtotal For Replacement / Rehabilitation Of System Assets 4,096,250 - 200,000 4,296,250
New System Assets Capital Revenues
Capacity Charges
Grants/ Reimbs.
Project Total
Source Of Supply 6.0 MGD Membrane Plant - 200,000 - 200,000 Pumps And Booster Plants Lord Ranch 4-3 Pump Station - - - - Pump Station 7-2 - Design - 140,000 - 140,000 Emergency Generators Zone 5 & 6 400,000 - - 400,000 Water Mains Highland Avenue 30" Transmission Main - Pepper Avenue to Oakdale - Design - 1,450,000 - 1,450,000 Facilities And Plants Metal Storage Building and Materials Bins - Vineyard And Linden Plant Site 100,000 - - 100,000 Annual - Water System & Administration Security Upgrades 161,000 - - 161,000 Roemer WFF Security Upgrades 45,000 - - 45,000 Alarm Upgrade For Keyless Entry - Administrations, Roemer, FBR & All Remote Sites 40,000 - - 40,000 FBR Offices Construction 40,000 - - 40,000 Fleet/Equipment Water Truck (2,000 Gallons) 75,000 - - 75,000 Scissor Lift 31,000 - - 31,000 Boom Lift 72,000 - - 72,000 Flat Deck Trailer 10,000 - - 10,000 Document Management/Archive System 135,000 - - 135,000 Fail Over Server/ Disaster Recovery System 35,000 - - 35,000 Customer Service Foyer Renovation 400,000 - - 400,000 New Enterprise System Software 350,000 - - 350,000 Subtotal For New System Assets 1,894,000 1,790,000 - 3,684,000 Total 5,990,250 1,790,000 200,000 7,980,250 Contingency 798,025
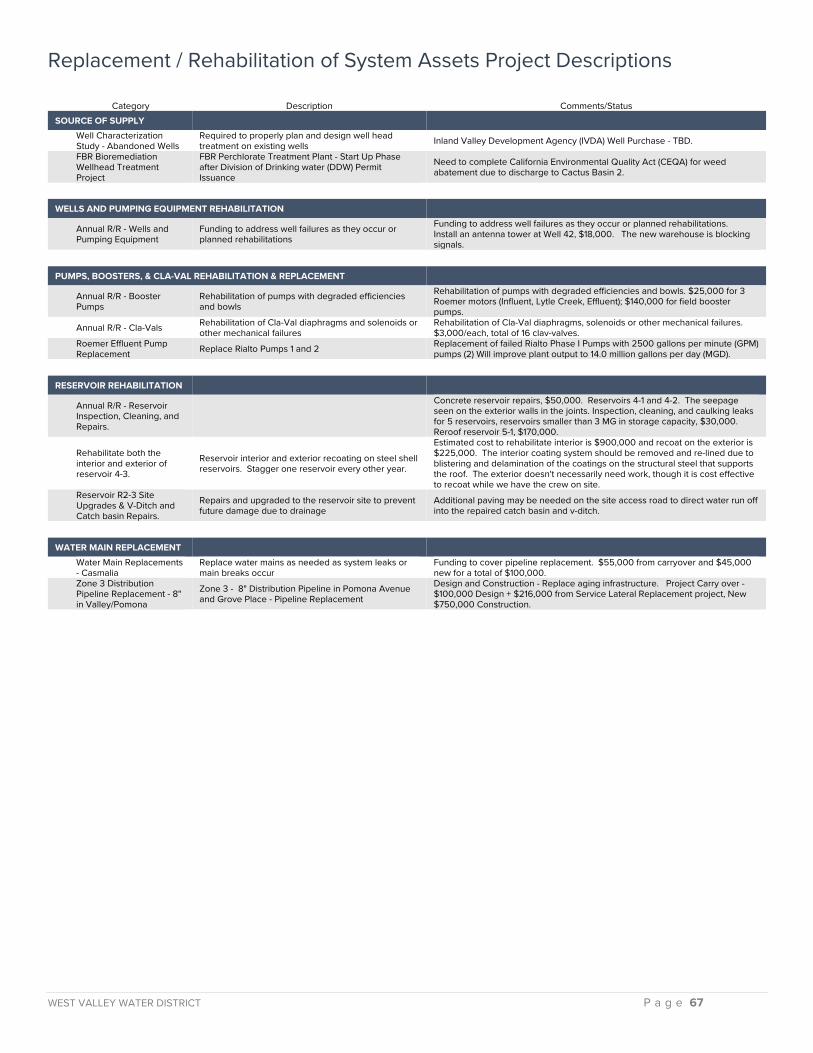
WEST VALLEY WATER DISTRICT P a g e 67
Replacement / Rehabilitation of System Assets Project Descriptions Category Description Comments/Status SOURCE OF SUPPLY Well Characterization
Study - Abandoned Wells Required to properly plan and design well head treatment on existing wells Inland Valley Development Agency (IVDA) Well Purchase - TBD.
FBR Bioremediation Wellhead Treatment Project
FBR Perchlorate Treatment Plant - Start Up Phase after Division of Drinking water (DDW) Permit Issuance
Need to complete California Environmental Quality Act (CEQA) for weed abatement due to discharge to Cactus Basin 2.
WELLS AND PUMPING EQUIPMENT REHABILITATION
Annual R/R - Wells and Pumping Equipment
Funding to address well failures as they occur or planned rehabilitations
Funding to address well failures as they occur or planned rehabilitations. Install an antenna tower at Well 42, $18,000. The new warehouse is blocking signals.
PUMPS, BOOSTERS, & CLA-VAL REHABILITATION & REPLACEMENT
Annual R/R - Booster Pumps
Rehabilitation of pumps with degraded efficiencies and bowls
Rehabilitation of pumps with degraded efficiencies and bowls. $25,000 for 3 Roemer motors (Influent, Lytle Creek, Effluent); $140,000 for field booster pumps.
Annual R/R - Cla-Vals Rehabilitation of Cla-Val diaphragms and solenoids or other mechanical failures
Rehabilitation of Cla-Val diaphragms, solenoids or other mechanical failures. $3,000/each, total of 16 clav-valves.
Roemer Effluent Pump Replacement Replace Rialto Pumps 1 and 2 Replacement of failed Rialto Phase I Pumps with 2500 gallons per minute (GPM)
pumps (2) Will improve plant output to 14.0 million gallons per day (MGD). RESERVOIR REHABILITATION
Annual R/R - Reservoir Inspection, Cleaning, and Repairs.
Concrete reservoir repairs, $50,000. Reservoirs 4-1 and 4-2. The seepage seen on the exterior walls in the joints. Inspection, cleaning, and caulking leaks for 5 reservoirs, reservoirs smaller than 3 MG in storage capacity, $30,000. Reroof reservoir 5-1, $170,000.
Rehabilitate both the interior and exterior of reservoir 4-3.
Reservoir interior and exterior recoating on steel shell reservoirs. Stagger one reservoir every other year.
Estimated cost to rehabilitate interior is $900,000 and recoat on the exterior is $225,000. The interior coating system should be removed and re-lined due to blistering and delamination of the coatings on the structural steel that supports the roof. The exterior doesn't necessarily need work, though it is cost effective to recoat while we have the crew on site.
Reservoir R2-3 Site Upgrades & V-Ditch and Catch basin Repairs.
Repairs and upgraded to the reservoir site to prevent future damage due to drainage
Additional paving may be needed on the site access road to direct water run off into the repaired catch basin and v-ditch.
WATER MAIN REPLACEMENT
Water Main Replacements - Casmalia
Replace water mains as needed as system leaks or main breaks occur
Funding to cover pipeline replacement. $55,000 from carryover and $45,000 new for a total of $100,000.
Zone 3 Distribution Pipeline Replacement - 8" in Valley/Pomona
Zone 3 - 8" Distribution Pipeline in Pomona Avenue and Grove Place - Pipeline Replacement
Design and Construction - Replace aging infrastructure. Project Carry over - $100,000 Design + $216,000 from Service Lateral Replacement project, New $750,000 Construction.

WEST VALLEY WATER DISTRICT P a g e 68
Replacement / Rehabilitation of System Assets Project Descriptions Continued Category Description Comments/Status
SYSTEM APPURTENANCES REHABILITATION & REPLACEMENT
Annual R/R - Large Meter Vault Lid Replacement
Replace meter vault lids on large meters - reduce liability to District from injury claims Placeholder for vault lids that require replacement to improve public safety
Annual R/R - Water Meter Replacement
Replace one book run per year with automatic meter reading (AMR) meters
Meter Department CI AMR project to complete routes 36, 51, and 58. 12-5/8" meters = $1320. 1032-3/4" Meters = $138,288. 8-1" meters = $1,326. 1052 MXU's = $142,020. 1052 Replacement lids = $46,288.
Annual R/R - System Valve Replacement
Numerous valves in distribution system inoperable. Need to replace on an annual basis
Numerous valves in distribution system inoperable. Need to replace on an annual basis.
Annual R/R - Fire Hydrant Replacement
Replacement of hydrants that are damaged or non-functioning
Replace hydrants that are damaged or non-functioning. Rehabilitate existing 1,000 hydrants.
FACILITIES AND PLANTS REHABILITATION & REPLACEMENT
Annual R/R - Plant Valve Replacement Numerous in plant valves inoperable or disrepair
Replace the 10" Bailey valve at booster station 4-1, $20,000. Replace the 24" butterfly valve at Reservoir 3A-1, current position is broken open, $20,000.
Annual R/R - Upgrade Plant Gates To Auto Openers
Numerous access gates require automation for employee safety and efficiency Install an actuator at Well 54, Reservoir 6-3 and Reservoir 6-4, $16,000/each.
Annual R/R - Yard Piping Recoating
Well and pump station above ground piping that requires repainting Paint Well Nos. 24, 4, 5, 23, and 1, 4-3 booster, and 2-3 booster stations.
Roemer WFF - Filter Media Replacement
Replace Trident Filter media as needed. Assume one every three years (6 Filters Total)
Sandblast & recoat Filter No. 4; remove & haul off old media; and replace with new media.
Roemer WFF - Valve Controller/Actuator Replacement
$3,500 each, including parts/labor. 2 actuators/filter; need to change out 12 actuators.
Annual R/R - Roemer Facilities
Purchase and spread new gravel at the Roemer plant, $20,000. $36,000 to repave, and stripe parking lot including stall, handicap stalls, loading areas, directional arrows, and "Stop" stencils at the Roemer facilities. $17,000 for the purchase of 4 new chlorine analyzers. Current analyzers are over 10 years old and started failing. $22,000 for the purchase of 5 turbidimeters. They are over 10 years old. Plan to purchase the remaining 5 turbidimeters in FY2018/2019.
Pump Station & Well Buildings Rehabilitation
Pump station and chlorine equipment buildings are in need of repainting, roof and skylight repairs, and corroded chlorine storage doors need replacement
Repair or replace old fences at well sites, booster station, and reservoir sites. Repair buildings, i.e., chlorine doors, roofs, drywalls, and skylights. Booster stations 4-1, 5-1, 6-1, and zone 7 reservoir.
District Headquarters Reroof the west end of Headquarters (HQs) and the warehouse due to multiple leaks, $85,000. Repave, and stripe parking lot including stall, handicap stalls, loading areas, directional arrows, "Stop" stencils at the HQs, and enhance existing traffic plan, $45,000.
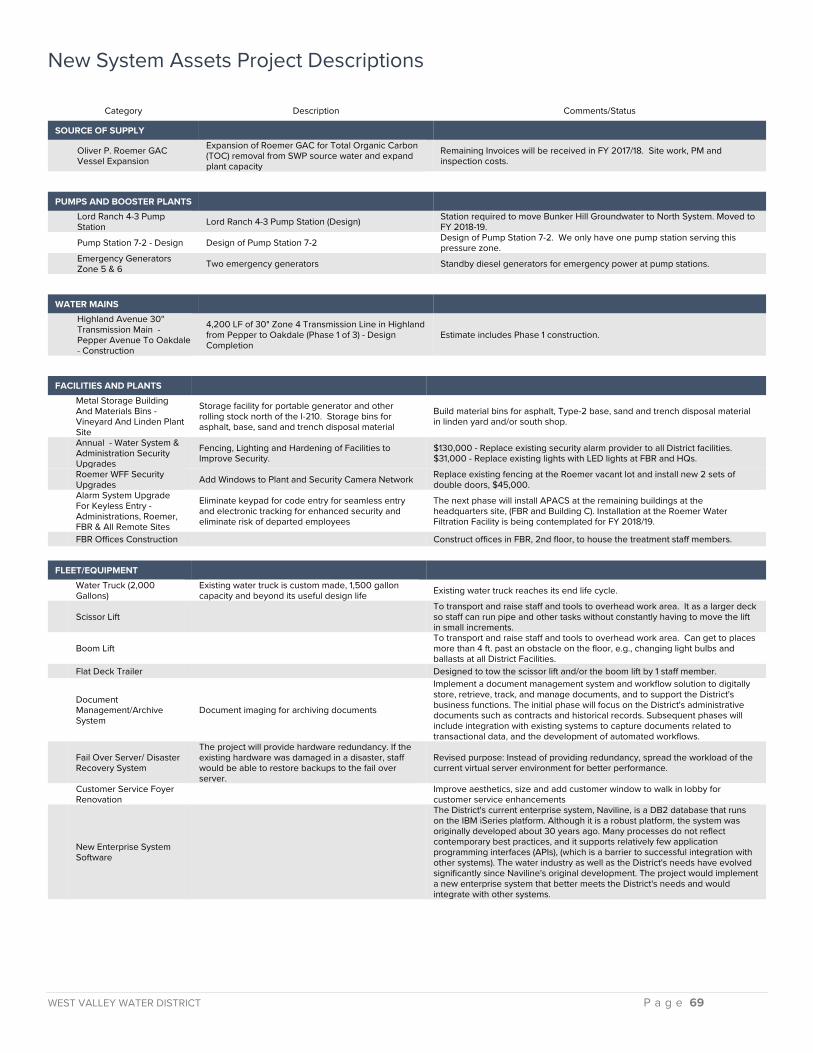
WEST VALLEY WATER DISTRICT P a g e 69
New System Assets Project Descriptions
Category Description Comments/Status
SOURCE OF SUPPLY
Oliver P. Roemer GAC Vessel Expansion
Expansion of Roemer GAC for Total Organic Carbon (TOC) removal from SWP source water and expand plant capacity
Remaining Invoices will be received in FY 2017/18. Site work, PM and inspection costs.
PUMPS AND BOOSTER PLANTS
Lord Ranch 4-3 Pump Station Lord Ranch 4-3 Pump Station (Design) Station required to move Bunker Hill Groundwater to North System. Moved to
FY 2018-19. Pump Station 7-2 - Design Design of Pump Station 7-2 Design of Pump Station 7-2. We only have one pump station serving this
pressure zone. Emergency Generators
Zone 5 & 6 Two emergency generators Standby diesel generators for emergency power at pump stations.
WATER MAINS
Highland Avenue 30" Transmission Main - Pepper Avenue To Oakdale - Construction
4,200 LF of 30" Zone 4 Transmission Line in Highland from Pepper to Oakdale (Phase 1 of 3) - Design Completion
Estimate includes Phase 1 construction.
FACILITIES AND PLANTS
Metal Storage Building And Materials Bins - Vineyard And Linden Plant Site
Storage facility for portable generator and other rolling stock north of the I-210. Storage bins for asphalt, base, sand and trench disposal material
Build material bins for asphalt, Type-2 base, sand and trench disposal material in linden yard and/or south shop.
Annual - Water System & Administration Security Upgrades
Fencing, Lighting and Hardening of Facilities to Improve Security.
$130,000 - Replace existing security alarm provider to all District facilities. $31,000 - Replace existing lights with LED lights at FBR and HQs.
Roemer WFF Security Upgrades Add Windows to Plant and Security Camera Network Replace existing fencing at the Roemer vacant lot and install new 2 sets of
double doors, $45,000.
Alarm System Upgrade For Keyless Entry - Administrations, Roemer, FBR & All Remote Sites
Eliminate keypad for code entry for seamless entry and electronic tracking for enhanced security and eliminate risk of departed employees
The next phase will install APACS at the remaining buildings at the headquarters site, (FBR and Building C). Installation at the Roemer Water Filtration Facility is being contemplated for FY 2018/19.
FBR Offices Construction Construct offices in FBR, 2nd floor, to house the treatment staff members. FLEET/EQUIPMENT
Water Truck (2,000 Gallons)
Existing water truck is custom made, 1,500 gallon capacity and beyond its useful design life Existing water truck reaches its end life cycle.
Scissor Lift To transport and raise staff and tools to overhead work area. It as a larger deck so staff can run pipe and other tasks without constantly having to move the lift in small increments.
Boom Lift To transport and raise staff and tools to overhead work area. Can get to places more than 4 ft. past an obstacle on the floor, e.g., changing light bulbs and ballasts at all District Facilities.
Flat Deck Trailer Designed to tow the scissor lift and/or the boom lift by 1 staff member.
Document Management/Archive System
Document imaging for archiving documents
Implement a document management system and workflow solution to digitally store, retrieve, track, and manage documents, and to support the District's business functions. The initial phase will focus on the District's administrative documents such as contracts and historical records. Subsequent phases will include integration with existing systems to capture documents related to transactional data, and the development of automated workflows.
Fail Over Server/ Disaster Recovery System
The project will provide hardware redundancy. If the existing hardware was damaged in a disaster, staff would be able to restore backups to the fail over server.
Revised purpose: Instead of providing redundancy, spread the workload of the current virtual server environment for better performance.
Customer Service Foyer Renovation
Improve aesthetics, size and add customer window to walk in lobby for customer service enhancements
New Enterprise System Software
The District's current enterprise system, Naviline, is a DB2 database that runs on the IBM iSeries platform. Although it is a robust platform, the system was originally developed about 30 years ago. Many processes do not reflect contemporary best practices, and it supports relatively few application programming interfaces (APIs), (which is a barrier to successful integration with other systems). The water industry as well as the District's needs have evolved significantly since Naviline's original development. The project would implement a new enterprise system that better meets the District's needs and would integrate with other systems.
WEST VALLEY WATER DISTRICT P a g e 61
855 W. BASE LINE RD • RIALTO • CA • 92376
![CONFERENCE OF THE PARTIES TO THE CONVENTION ON BIOLOGICAL … · Z U w U [ ` T O f l i U r c P W i [ T W g T ` i Y ] T h g g c g g w v W A s Z U T ~ g U p [ T w T g](https://static.fdocuments.us/doc/165x107/5ed5392e606e340b7a35e966/conference-of-the-parties-to-the-convention-on-biological-z-u-w-u-t-o-f-l-i.jpg)


![print job - primariabistrita.ro fileVIC c g: ee AOI. qecTgzg ASL] T CAL TTS ca # T q TIJ rsdeg T u g U CT acgT (bcc L T z -r L ryqGToz ± T n s rig T e as ; g COOT T egrr g TÇG](https://static.fdocuments.us/doc/165x107/5d598adb88c9933b318ba618/print-job-c-g-ee-aoi-qectgzg-asl-t-cal-tts-ca-t-q-tij-rsdeg-t-u-g-u-ct-acgt.jpg)


![g n v R | S | U g R ¾ d e Y R W S [ v R i e W e S n Y R …...(Franciscans) (94) S j j g } R-3 U g i s Y U ] x T Y g T Z U c)))) g T) g .))](https://static.fdocuments.us/doc/165x107/5e2b0ff1c91523374e6767e0/g-n-v-r-s-u-g-r-d-e-y-r-w-s-v-r-i-e-w-e-s-n-y-r-franciscans-94.jpg)