B Supplemental material - econ.uzh.ch
9
B Supplemental material B.1 Additional examples We provide a few additional examples of automation and non-automation patents. Fig- ure B.1 shows the example of a robot with a patent containing the IPC code B25J9. The patent describes a multi-axis robot with a plurality of tools which can change the working range of each arm. This essentially increases the flexibility of the robot. Figure B.2 shows an automation innovation used in the dairy industry. The patent contains the code A01J7 which is a high automation code (see Table 2). It describes a system involv- ing a robotic arm to disinfect the teats of cows after milking. The patent argues that this reduces the need for human labor and therefore saves costs. Figure B.3 describes an automated machining device, yet another example of a high automation innovation, which contains the code B23Q15 (a high automation code described in Table 2). The devices features a built-in compensation system to correct for errors thereby reducing the need for a “labor-intensive adjustment process”. Figure B.4 describes another high automation patent belonging to the same IPC code as well as to G05B19. This is also a machining device. The patent explains that innovations in machining have aimed at making the process as automated as possible by involving some feedback mechanism (as in the previous older patent). This invention aims at better predicting the machining requirements in the first place. In contrast Figure B.5 describes a low automation innovation in machinery (none of the codes are above the 90th percentile in the 6 digit C/IPC distribution). The innovation relates to a“conveying belt assembly for a printing device”’, which is about the circulation of paper in the printing machine. This innovation does not directly involve automation. Similarly Figure B.6 describes a winch to raise and lower people, another low-automation innovation in machinery. This innovation seems rather low-skill labor complementary as its goal is to enable workers to move in a plurality of directions. Finally Figure B.7 describes a harvester (which also counts as a machinery innovation since the code A01B63 belongs to other special machinery). This is also a low-automation innovation as its goal is to ensure that the harvester can both operate in the field and travel on roads. 70
Transcript of B Supplemental material - econ.uzh.ch

B Supplemental material
B.1 Additional examples
We provide a few additional examples of automation and non-automation patents. Fig-
ure B.1 shows the example of a robot with a patent containing the IPC code B25J9.
The patent describes a multi-axis robot with a plurality of tools which can change the
working range of each arm. This essentially increases the flexibility of the robot. Figure
B.2 shows an automation innovation used in the dairy industry. The patent contains the
code A01J7 which is a high automation code (see Table 2). It describes a system involv-
ing a robotic arm to disinfect the teats of cows after milking. The patent argues that
this reduces the need for human labor and therefore saves costs. Figure B.3 describes
an automated machining device, yet another example of a high automation innovation,
which contains the code B23Q15 (a high automation code described in Table 2). The
devices features a built-in compensation system to correct for errors thereby reducing
the need for a “labor-intensive adjustment process”. Figure B.4 describes another high
automation patent belonging to the same IPC code as well as to G05B19. This is also
a machining device. The patent explains that innovations in machining have aimed at
making the process as automated as possible by involving some feedback mechanism (as
in the previous older patent). This invention aims at better predicting the machining
requirements in the first place.
In contrast Figure B.5 describes a low automation innovation in machinery (none
of the codes are above the 90th percentile in the 6 digit C/IPC distribution). The
innovation relates to a “conveying belt assembly for a printing device”’, which is about
the circulation of paper in the printing machine. This innovation does not directly
involve automation. Similarly Figure B.6 describes a winch to raise and lower people,
another low-automation innovation in machinery. This innovation seems rather low-skill
labor complementary as its goal is to enable workers to move in a plurality of directions.
Finally Figure B.7 describes a harvester (which also counts as a machinery innovation
since the code A01B63 belongs to other special machinery). This is also a low-automation
innovation as its goal is to ensure that the harvester can both operate in the field and
travel on roads.
70
Figure B.1: Example of a high automation patent: an industrial robot
71
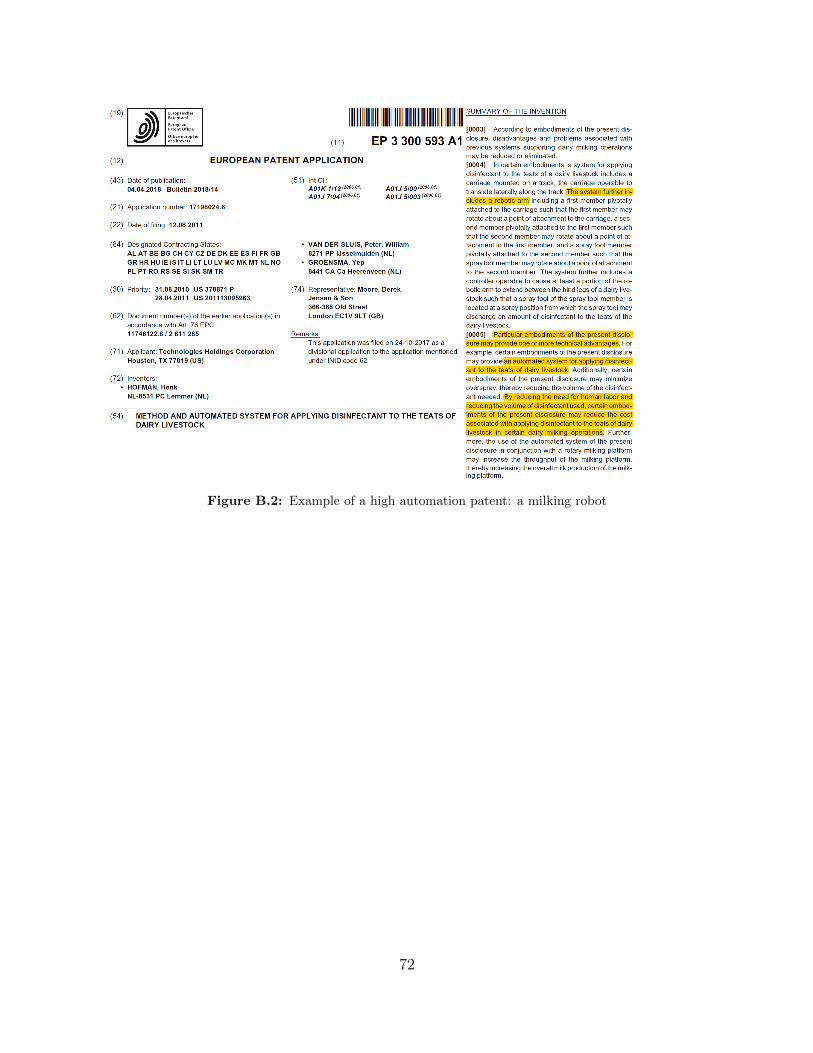
Figure B.2: Example of a high automation patent: a milking robot
72
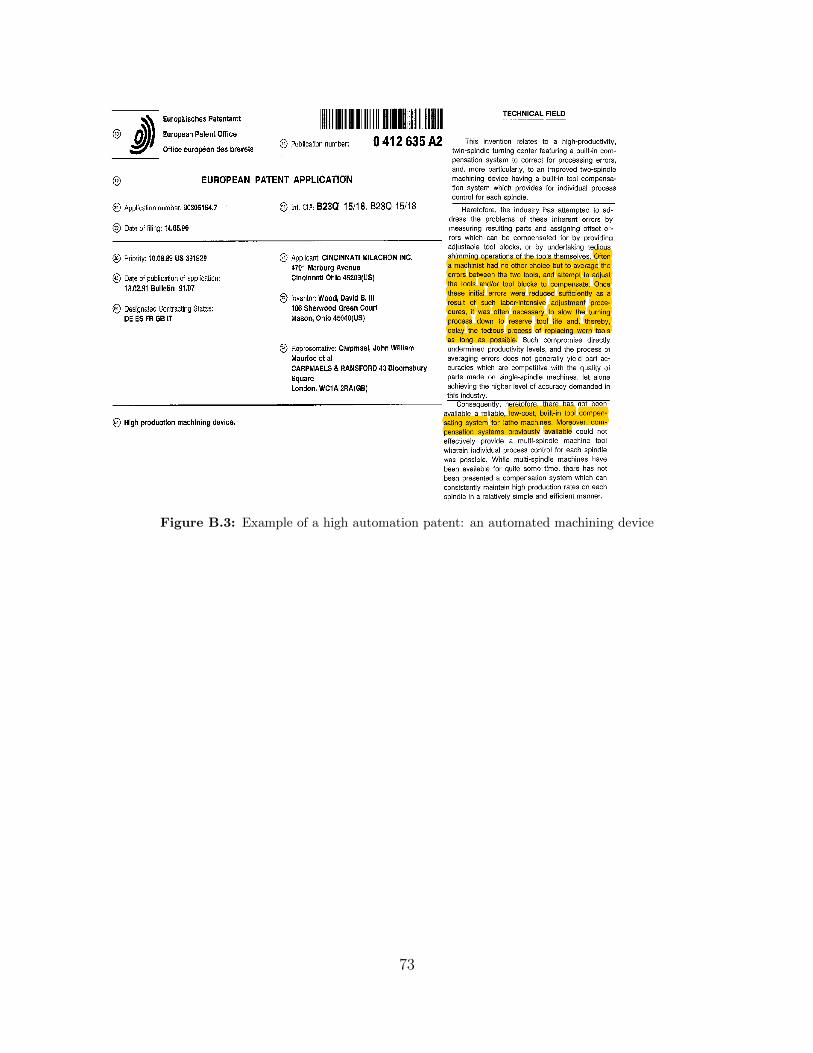
Figure B.3: Example of a high automation patent: an automated machining device
73
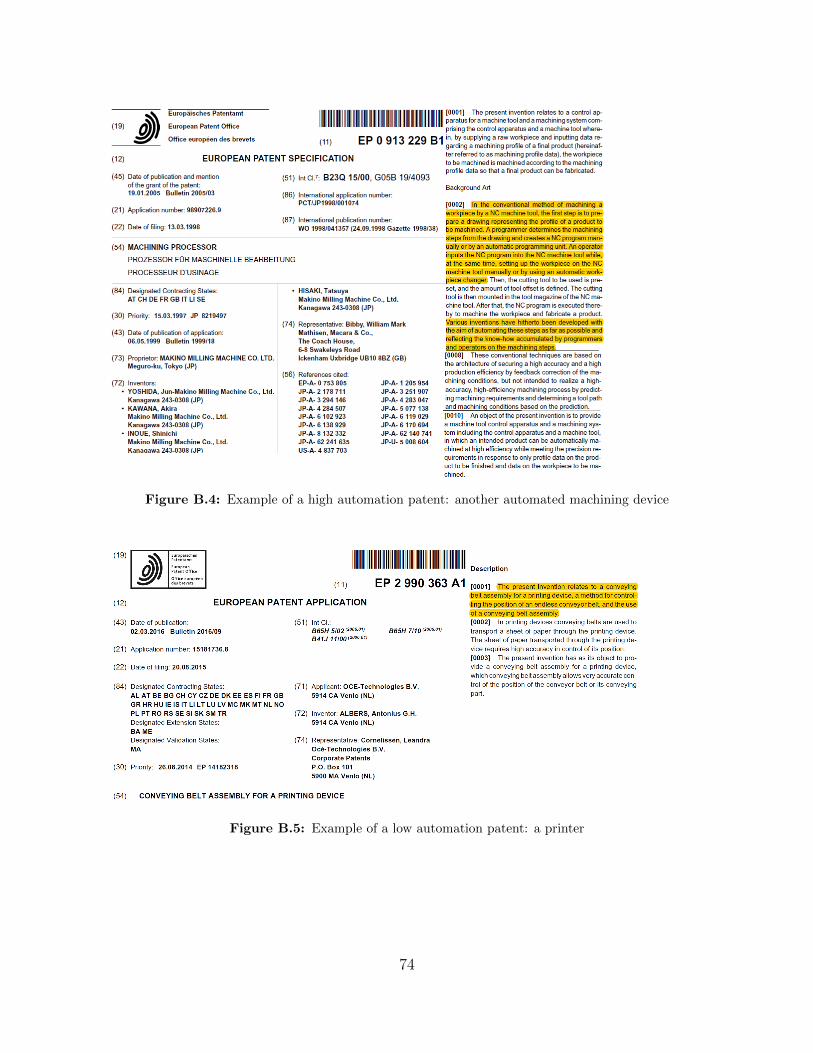
Figure B.4: Example of a high automation patent: another automated machining device
Figure B.5: Example of a low automation patent: a printer
74

Figure B.6: Example of a low automation patent: a winch
Figure B.7: Example of a low automation patent: a harvester
B.2 Validating our weights approach
We compare our firm-level weights to bilateral trade flows and show that they are
strongly correlated. The first step is to compute patent-based weights at the coun-
try level. For this exercise (and this exercise only), we define the home country d of
a firm based on the location of its headquarters (according to the country code of its
75
Coefficient: 0.95
−15
−10
−5
0Lo
g pa
tent
s ba
sed
wei
ghts
−15 −10 −5 0Log exports based weights
(a) All countries
ITBE
LU
ID
CAAU
DE
IN
GB
DK
HU
BG
CY
EE
MXFI
CZSK
TR
RO
JP
LVLT
NL
KR
ES
CN
RU
MT
AT BR
PL
SI
GRPT
CH
FR
SE
IE
−13
−9
−5
−1
Log
pate
nts
base
d w
eigh
ts
−13 −9 −5 −1Log exports based weights
US
LV
BR
PLMXHU
FI
SI
CN
ID
US
BG
AU
ESCHSEDK
CZ
CA
CY
AT
RU
FR
NL
LUIE
LT
PT
MT
RO
TR
ITGB
INGR
SK
KR
JP
EE
BE
−13
−9
−5
−1
Log
pate
nts
base
d w
eigh
ts
−13 −9 −5 −1Log exports based weights
DE
LT
LU
SE
DK
PTIN
NL
GR
LV
PL
CA
TR
DE
ID
CY
IE
CH
US
BR
RU
ES
SI
BG
MX
CN
CZ
KR
FI
IT
HU
AUBE
SK
FR
RO
AT
GB
−14
−10
−6
−2
Log
pate
nts
base
d w
eigh
ts
−14 −10 −6 −2Log exports based weights
JP
IT
CY
IE
BG
HUMX
GRBR
RO
LT
JP
RU
AUCH
EE
US
SI
LV
ID
TR
SECA
PLIN
FI PT
AT
DE
SK
BEDK
LU
NL
KRCN
GB
MT
ES
CZ
−13
−9
−5
−1
Log
pate
nts
base
d w
eigh
ts
−13 −9 −5 −1Log exports based weights
FR
BG
MX
US
CA
LT
PLHU
MT
BR
LV
AT
CN
CZ
GR
CYID
FR
BE
KRFI
ITJP
DK
IN
AU
SI
DE
NLSE
IE
RU
PT
EE
SK
TR
RO
LU
ESCH
−12
−8
−4
0Lo
g pa
tent
s ba
sed
wei
ghts
−12 −8 −4 0Log exports based weights
GB
NL
CY
TRIN
BE
FRES
RU
DK
PL
GB
MXKR
AU
AT
LT
HU
LU
SK
FI
GR
CZ
PT
RO
BRCH
DE
SI
SE
US
CA
CNIE
JP
MT
BG
−12
−8
−4
0Lo
g pa
tent
s ba
sed
wei
ghts
−12 −8 −4 0Log exports based weights
IT
(b) Trade from the 6 largest countries
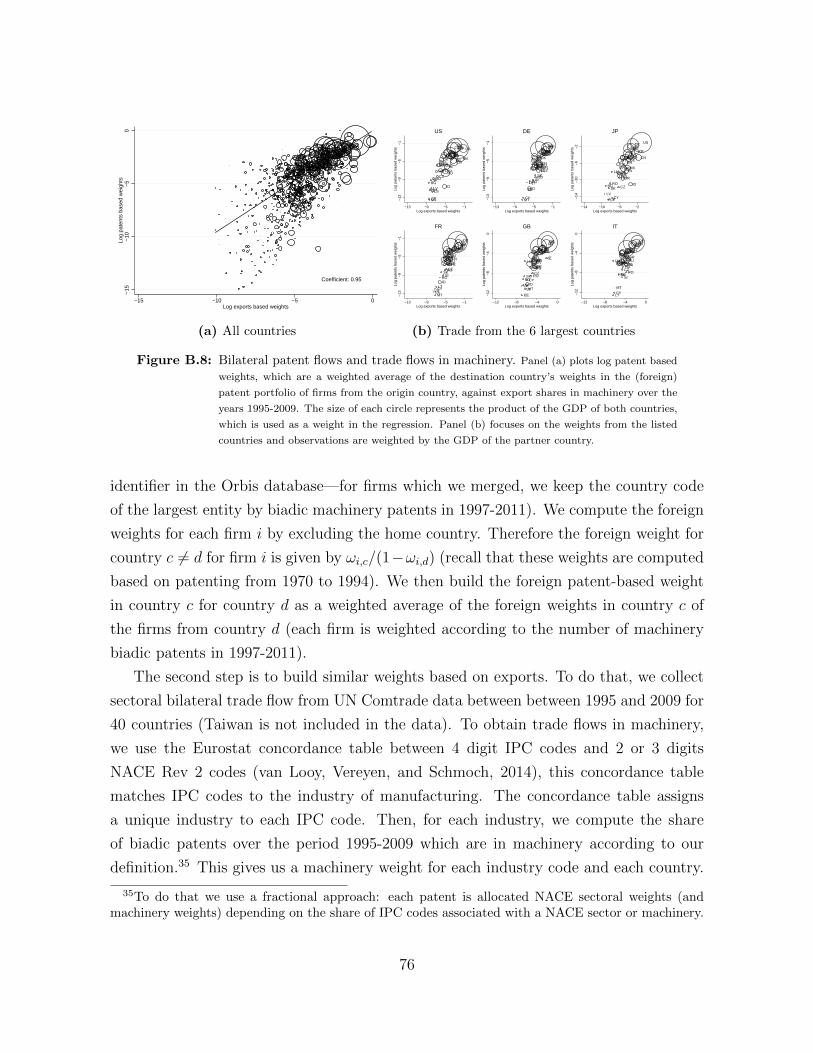
Figure B.8: Bilateral patent flows and trade flows in machinery. Panel (a) plots log patent based
weights, which are a weighted average of the destination country’s weights in the (foreign)
patent portfolio of firms from the origin country, against export shares in machinery over the
years 1995-2009. The size of each circle represents the product of the GDP of both countries,
which is used as a weight in the regression. Panel (b) focuses on the weights from the listed
countries and observations are weighted by the GDP of the partner country.
identifier in the Orbis database—for firms which we merged, we keep the country code
of the largest entity by biadic machinery patents in 1997-2011). We compute the foreign
weights for each firm i by excluding the home country. Therefore the foreign weight for
country c 6= d for firm i is given by ωi,c/(1−ωi,d) (recall that these weights are computed
based on patenting from 1970 to 1994). We then build the foreign patent-based weight
in country c for country d as a weighted average of the foreign weights in country c of
the firms from country d (each firm is weighted according to the number of machinery
biadic patents in 1997-2011).
The second step is to build similar weights based on exports. To do that, we collect
sectoral bilateral trade flow from UN Comtrade data between between 1995 and 2009 for
40 countries (Taiwan is not included in the data). To obtain trade flows in machinery,
we use the Eurostat concordance table between 4 digit IPC codes and 2 or 3 digits
NACE Rev 2 codes (van Looy, Vereyen, and Schmoch, 2014), this concordance table
matches IPC codes to the industry of manufacturing. The concordance table assigns
a unique industry to each IPC code. Then, for each industry, we compute the share
of biadic patents over the period 1995-2009 which are in machinery according to our
definition.35 This gives us a machinery weight for each industry code and each country.
35To do that we use a fractional approach: each patent is allocated NACE sectoral weights (andmachinery weights) depending on the share of IPC codes associated with a NACE sector or machinery.
76
Coefficient: 0.42
2.4
2.6
2.8
33.
23.
4Lo
w−
skill
wag
es (
pate
nts
base
d)
2.2 2.4 2.6 2.8 3 3.2Low−skill wages (exports based)
(a) Low-skill wages.
Coefficient: 0.56
−.1
−.0
50
.05
.1Lo
w−
skill
wag
es (
pate
nts
base
d re
sidu
als)
−.1 −.05 0 .05 .1Low−skill wages (exports based residuals)
(b) Residualized low-skill wages
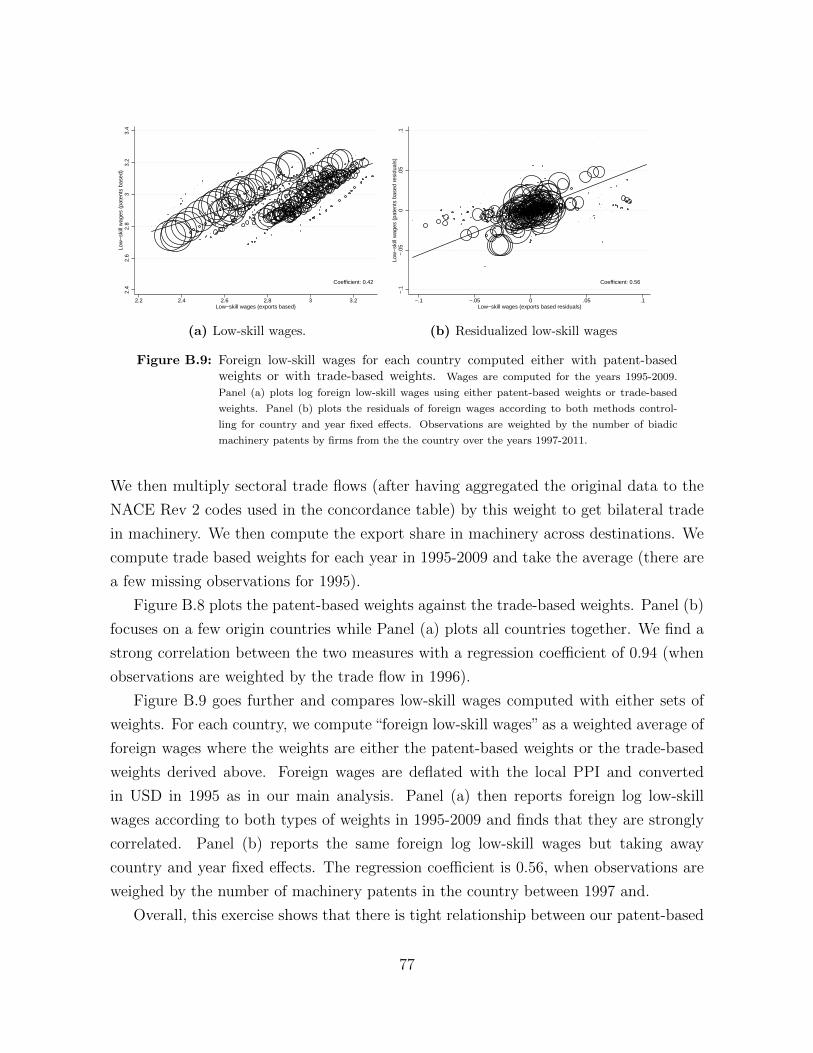
Figure B.9: Foreign low-skill wages for each country computed either with patent-basedweights or with trade-based weights. Wages are computed for the years 1995-2009.
Panel (a) plots log foreign low-skill wages using either patent-based weights or trade-based
weights. Panel (b) plots the residuals of foreign wages according to both methods control-
ling for country and year fixed effects. Observations are weighted by the number of biadic
machinery patents by firms from the the country over the years 1997-2011.
We then multiply sectoral trade flows (after having aggregated the original data to the
NACE Rev 2 codes used in the concordance table) by this weight to get bilateral trade
in machinery. We then compute the export share in machinery across destinations. We
compute trade based weights for each year in 1995-2009 and take the average (there are
a few missing observations for 1995).
Figure B.8 plots the patent-based weights against the trade-based weights. Panel (b)
focuses on a few origin countries while Panel (a) plots all countries together. We find a
strong correlation between the two measures with a regression coefficient of 0.94 (when
observations are weighted by the trade flow in 1996).
Figure B.9 goes further and compares low-skill wages computed with either sets of
weights. For each country, we compute “foreign low-skill wages” as a weighted average of
foreign wages where the weights are either the patent-based weights or the trade-based
weights derived above. Foreign wages are deflated with the local PPI and converted
in USD in 1995 as in our main analysis. Panel (a) then reports foreign log low-skill
wages according to both types of weights in 1995-2009 and finds that they are strongly
correlated. Panel (b) reports the same foreign log low-skill wages but taking away
country and year fixed effects. The regression coefficient is 0.56, when observations are
weighed by the number of machinery patents in the country between 1997 and.
Overall, this exercise shows that there is tight relationship between our patent-based
77
weights and (future) trade flows, suggesting that we can use these patent-based weights
as proxies for firms’ markets exposure.
References
van Looy, B., Vereyen, C., and Schmoch, U. (2014). Patent Statistics: Concordance IPC
V8 - NACE REV.2. Eurostat.
78