B Internal Assessment Criteria and Aspects...
10
IB Lab Report Suggestions-from http://www.physicsrocks.com /B Internal Assessment Criteria and Aspects Design Design ASPECTS Levels/Marks Defining the problem and Controlling variables Developing a method for selecting variables collection of data CompleteJ2 Formulates a focused Designs a method for the Develops a method that allows problem/research question and effective control of the vanableS'1 for the collection of sufficient identifies the relevant variables. relevant data. Partial/1 Formulates a problem/research Designs a method that makes I Develops a method that allows question that is incomplete or some attempt to control the for the collection of insufficient identifies only some relevant variables. Irelevant data. variables Not at alUO Does not identify a Designs a method that does not Develops a method that does problem/research question and control the variables. not allow for any relevant data to does not identify any relevant be collected variables. i Research Question/Problem This is a single sentence which clearly and specifically states the objective of your investigation. For a Design lab, the teacher cannot give you detailed information and guidance. Instead, you'll be given a general, open-ended problem such as "Investigate the factors that affect X" You must do some thinking to recognize the nature of the problem that has been set, the factors (variables) that will affect the outcome, and how they affect it (the hypothesis). So if a general question has been posed, make it more specific and relevant to your individual experiment. Your research question must clearly identify the manipulated and responding variables for your experiment. Hypothesis{ es) A hypothesis is like a prediction. It will often take the form of a proposed relationship between two or more variables that can be tested by experiment: "If X is done, then Y will occur." (Examples: "The rate of transpiration will increase as wind speeds and temperatures rise" or "Brand X toothpaste will be more effective in preventing the growth of the bacteria which causes plaque on your teeth"). You must also provide an explanation for your hypothesis. This should be a brief discussion (paragraph form) about the theory or 'why' behind your hypothesis and prediction. For example, why should raising the air temperature cause an increase in the speed of sound? Why do you think a more massive object going to accelerate faster than a less massive object? Note: there is no exact place in the Design criterion that addresses the hypothesis, but you WILL BE EXPECTED TO HAVE A COMPLETE ONE for any design lab in order to receive full credit for your class grade. Be sure your hypothesis is related directly to YOLirresearch question and that the manipulated and responding variables for your experiment are clearly written into your hypothesis.
Transcript of B Internal Assessment Criteria and Aspects...

IB Lab Report Suggestions-from http://www.physicsrocks.com
/B Internal Assessment Criteria and AspectsDesign
Design
ASPECTS
Levels/Marks Defining the problem and Controlling variables Developing a method forselecting variables collection of data
CompleteJ2 Formulates a focused Designs a method for the Develops a method that allowsproblem/research question and effective control of the vanableS'1 for the collection of sufficientidentifies the relevant variables. relevant data.
Partial/1 Formulates a problem/research Designs a method that makes IDevelops a method that allowsquestion that is incomplete or some attempt to control the for the collection of insufficientidentifies only some relevant variables. Irelevant data.variables
Not at alUO Does not identify a Designs a method that does not Develops a method that doesproblem/research question and control the variables. not allow for any relevant data todoes not identify any relevant be collectedvariables. i
Research Question/ProblemThis is a single sentence which clearly and specifically states the objective of your investigation. For aDesign lab, the teacher cannot give you detailed information and guidance. Instead, you'll be given ageneral, open-ended problem such as "Investigate the factors that affect X" You must do some thinking torecognize the nature of the problem that has been set, the factors (variables) that will affect the outcome,and how they affect it (the hypothesis). So if a general question has been posed, make it more specific andrelevant to your individual experiment.
Your research question must clearly identify the manipulated and responding variables for your experiment.
Hypothesis{ es)A hypothesis is like a prediction. It will often take the form of a proposed relationship between two or morevariables that can be tested by experiment: "If X is done, then Y will occur." (Examples: "The rate oftranspiration will increase as wind speeds and temperatures rise" or "Brand X toothpaste will be moreeffective in preventing the growth of the bacteria which causes plaque on your teeth").
You must also provide an explanation for your hypothesis. This should be a brief discussion (paragraphform) about the theory or 'why' behind your hypothesis and prediction. For example, why should raising theair temperature cause an increase in the speed of sound? Why do you think a more massive object goingto accelerate faster than a less massive object? Note: there is no exact place in the Design criterion thataddresses the hypothesis, but you WILL BE EXPECTED TO HAVE A COMPLETE ONE for any design labin order to receive full credit for your class grade.
Be sure your hypothesis is related directly to YOLirresearch question and that the manipulated andresponding variables for your experiment are clearly written into your hypothesis.

VariablesAll reasonable variables that might affect the outcome should be identified. State variables explicitly, andexplain why each is relevant. Indicate which variable(s) is/are manipulated variables (ones that you willchange) and which are the responding variables (ones that will respond to what you did). Indicate whichvariables must be controlled (kept consistent) and why those variables must be controlled.
Controlling VariablesAspect two refers to controlling variables, but this does not only refer to the actual controlled variable(s) foryour experiment. You must indicate how you plan to maintain the consistency of your manipulated andresponding variables as well.
You will have one manipulated variable and one responding variable. You must describe how you will bemeasuring each of those variables, and what you plan to do in order to minimize the systematic and randomerrors in those measurements. You will also be describing, for each variable you indicate is controlled, howyou intend to keep that variable consistent.
For example:Problem: "VVhat effect does the launch angle of a tennis ball have on the maximum horizontal
displacement it will land away from the launch position?"
(Hypothesis would go next, but I'm not going to write a sample here ~
Manipulated Variable: Launch AngleThe launch angle will be measured with the protractor that is located directly on the marble launcher. Theangle will always be measured to the nearest 0.50 by looking at where the tip of the point on the back end ofthe launch barrel is pointing to the protractor.
Responding Variable: Horizontal DisplacementA line of masking tape will be placed on the floor in order to mark the initial position of the marble launcher.The front of the marble launcher will always be placed so that it just touches the tape. A test marble will belaunched and, and one lab partner will be positioned to locate the general landing area of the marble. CarbonPaper will be placed under a piece of computer paper and both will be taped to the floor in the locationindicated by the first launch. After all launch trials are complete, a metric measuring tape will be used tomeasure the displacement from the initial launching position; the 0.00 m mark on the tape will always beplaced at the base of the marble launcher, and the position of each mark on the carbon paper will always bemeasured to its center.
Controlled Variables: Launch Velocity; Environmental Conditions; Vertical DisplacementThe launch velocity will be controlled by always using the same spring setting on the marble launcher and byalways releasing the spring mechanism in the same manner so that no extra force is given that will alter theinitial velocity of the marble. The environmental conditions will be controlled by doing all trials inside and in thesame hallway so there is no wind to alter the trajectory of the marble. The air temperature will remain asconstant as possible throughout the lab as well. which should help maintain consistency in the amount of airresistance the marble encounters. The vertical displacement will remain constant because both the marblelauncher and the floor will remain level throughout the experiment. The launcher is designed to launch themarble from a pivot point that remains at a constant position regardless of launch angle.
WOW-that seems like a lot of work! Well, maybe, but it's worth it. 8y thinking through all the factorsthat can affect your variables and by writing out how you will control those factors, you will be helpingyourself (by being certain you have a good rnethodl), and you will be helping anyone who is reading yourlab report! You won't necessarily need to write quite as I much as I did in the example, but you get an ideaof the format ©

Developing a method for collection of data
Aspect three is essentially for the actual procedure itself. You will need to include the following:
Apparatus and MaterialsConsider making a list of your experiment and materials needed. Be as specific as possible. (Example: "50 mLbeaker instead of 'beaker', type of lens with focal length, BRAND of equipment (manufacturer». Include Quantities ofmaterials as specifically as you can. If it is a measuring tool, you must include the precision of that tool.
A diagram of how you set up the experiment may be appropriate, especially for more complicated experiments. Besure your diagram follows the rules for lab drawings (i.e. have clear labels, make the diagram large enough to see andunderstand, etc.). You are not required to make a diagram, but if it will help clarify any part of your procedure, it is avery good idea.
Safety IList any safety precautionf that must be taken during the lab.• "Wear safety goggles throughout experiment.'• "Avoid breathing vapors of automobile exhaust."• "Avoid touching a vibrating tuning fori< to the glass resonance tube."
Method/ProcedureState or discuss the method (procedure) that you are going to use (or that you did use) in the experiment. This shouldbe in the form of a list of step-by-step directions. Provide enough detail so that another person could repeat your workby reading your report! (But you don't have to go into detail about standard, well-understood actions such as "gathermaterials")
If you do something in your procedure to minimize an anticipated error, mention this as well. (Example: "Carefullycutting plant stem under water to reduce affect of air on transpiration rate.")
In your method, clearly state how you will collect data. What measuring device will you use? What data will yourecord? When? Or what qualitative observations will you look for (such as color change) and what will you do whenyou see this happen?
The procedure must allow collection of sufficient relevant quantitative data. This means that you should considerdoing more than one trial where appropriate. A minimum of 5 trials per "position" or "setting" is advised; youshould adjust your manipulated variable at least 5 times (5 "positions/settings"), but it is always appropriate to do asmany "positions/settings" as possible. Most labs that are done in physics will require MORE than 5 positions/settings.You are also expected to space your positions out in an appropriate range for the lab that you are completing. Forexample, if you are changing the angle of a marble launcher, and the available angle settings are from 0.00 to 90.00
,
your method should include taking data throughout most of this range (say from 5.00 to 85.0°). Collecting a lot of data,but limiting your range, will not likely show you a true pattern from which you can draw an appropriate conclusion.
Your procedure is strictly for the steps you must take to collect the raw data. Do Not include steps for analysis of thatdata. You do not need to include a step that clarifies "calculate the average time" or "calculate the kinetic energy of themarble" or "create a graph". Although it IS likely you will do each of those steps, that is considered data analysis and,therefore, you will make those steps clear through your presentation of your raw and processed data.

IB Internal Assessment Criteria and AspectsData Collection and Processing
Data Collection and ProcessingASPECTS
Levels/Marks Recording raw data Processing raw data Presenting processed data
Complete/2 Records appropriate Processes the quantitative raw Presents processed dataquantitative and associated data correctly. appropriately and, wherequalitative raw data, including relevant, includes errors andunits and uncertainties where uncertainties.relevant
Partial/1 Records appropriate Processes quantitative raw Presents processed dataquantitative and associated data, but with some mistakes appropriately, but with some
I qualitative raw data, but with and/or omissions. mistakes and/or omissions.
I some mistakes or omissions.
Not at alllO Does not record any No processing of quantitative .Presents processed dataappropriate quantitative raw raw data is carried out or inappropriately ordata or raw data is major mistakes are made in incomprehensibly.incomprehensible processing.
There are two aspects to Data Collection. You must collect and record raw data accurately. But equallyimportant-you must present the raw data so the reader can easily interpret it. This means it must beorganized and legible. The best way to collect and present data is by using data tables.
Give an identifying, specific title to each data table. Number tables consecutively through the report.
Qualitative observations are just as important as quantitative measurements! Make sure you take note ofand record the physical characteristics of substances or solutions involved in the experiment, their changes,whether something is hot or cold, etc. Some researchers like to organize these qualitative observations in aseparate data table - intermingling them with quantitative data is often confusing and hard to read.
A measurement without units is meaningless! If you show the units ina column heading of a data table, youdo not have to write them again after each number in the table. Common ways of recording measurementsin biology are: volume in liters, mass in grams, length in meters, and time in seconds. The followingexample shows different ways to express the same unit.
Initial velocity (centimeters per second)Initial velocity (cmfs)Initial velocity (cm S·1)-7 note: this format is most appropriate
All measurements have uncertainties and you must indicate them in your data tables. This is best done bypaying attention to significant digits, and by using the 'plus-or-minus" (+/-) notation. Examples:
Mass of a penny on a centigram balance: 3.12g (+1- 0.01 g)Temperature using a typical lab thermometer: 25.5°C (+/- 0.5 "C)
For our purposes, the accuracy of a measurement device is one half of the smallest measurement possiblewith the device. So, for example, the rulers in class measure to the millimeter (0.1 em). So, the ruler'smeasurement uncertainty is +/- 0.05 em. If you ask, I will assist you in determining the accuracy of the labequipment we use. Just as for units, in a column of data you can show the uncertainty in the columnheading and then you don't have to keep re-writing if for every measurement in the table (unless for somereason it is different for various trials.

The integrity of raw data is important from a scientific standpoint and from an ethical standpoint! Raw dataand observations will always be recorded in a bound laboratory notebook (your physics journal!).
Aspect 2: Processing Raw Data
This is the part of the report in which you take your raw data and transform it into results that answer(hopefully!) your research question. Here you will show the calculations that give you a numerical result.Or it may involve making a graph of some type to show a trend or a relationship. It might involve both ofthese. But just as in Data Collection, there are two important aspects: processing the data correctly, andalso presenting the processed data effectively and legibly so the reader can clearly see the results.
In Physics labs, EXPECT TO GRAPH YOUR DATA!! If you cannot graph the data you are collecting, youeither need to rethink your analysis, or you need to go back and collect different data. We should always beable to graph our data in order to assist us in making connections. Graphs also allow us to easily makenote of the precision/accuracy of our results.
Calculations of Results• You will often have to show calculations. Use plenty of room; make sure they are clear and legible.
Show the units of measurements in all calculations.
• Pay attention to significant digits! Don't lose accuracy by carelessly rounding off.
• Identical, repetitive calculations do not have to be repeated. Show one sample calculation (labeling it assuch) and then you don't have to repeat it for all the trials, but only show the results obtained.
• When calculating an average value from repeated trials, don't average the raw data. Instead, calculatea result from each trial. Then average the results from each trial to get your final experimental average.
Presentation of Results• There are many ways to present and display results. Tables and graphs are typically what will be used
in physics. Your tables of processed data must be separate from your raw data tables, but created inthe same format (title, table number, appropriate headings, units, etc.)
• You will be expected to complete your graphs using LoggerPro software. Each student will get achance to check out a CD-ROM in order to install the program (from Vernier software) on your homecomputer, and the program is available on every computer in the school. It is located on the libraryserver's application folders for science.
• The axes of graphS must be clearly labeled with the variable and the units used. Additionally, eachgraph must have a descriptive title that specifically states what the graph depicts. (Examples: Time vs.Temperature; Length of mitosis stage (reported data) vs. Length of mitosis stage (student data); Theeffect of changing mass on specific heat capacity for copper; The rate of change in velocity for a carrolling down an incline.) "Statement" titles are more descriptive (and therefore better) than X vs. Y titles.
• Graphs must have a best-fit line with a slope, and after your graph you should write a statementexplaining what the slope is telling you If your graph is initial!y NON-linear, you must manipulate thevalues you put on the x and/or y axis in order to get a relationship that is visibly linear Do NOT simplyput a linear fit on your data if it is not obviously linear. (ie if you have a graph that very obviously isparabolic in shape, square the values you put on one of the axes-you'll "force" your data to be linear).We'll practice this in class ... no worries! (3)

IB Internal Assessment Criteria and Aspects
Uncertainties in measurements and in calculationsFor all measured data, you need to report a level of uncertainty, as we discussed earlier.\'llhen calculations are made with the data that already has some uncertainty, we must report anerror in your calculated result as well.To report your uncertainty on a graph, you must use Error Bars for at least one of the axes-most ofthe time it is perfectly acceptable to only put error bars for the value with the largest magnitudeuncertainty (usually, but not always, the responding variable (Y-axlsj)
o Error bars show the absolute uncertainty for that measurement or calculated value as a "+/-"range around the plotted data point:
The effect of current on the potential drop for a 100 ohm resistorI
IBJIII
i1!i6-{
~ j"~a;0; i-=6 I~ 41E'"'00.. I
!I
1J !Li eI
!1 '$iII!
0 I001
I003
I005
Electric Current (Amps)
I001
I0.09
o For the graph above, there are error bars for both axes, but only the x-axis errors are largeenough to really be concerned about. ..
o (note: the axis labels should include the uncertainty range along with the units, too)o Do NOT connect the data points! You must use a best-fit line on all graphs!

o Error bars give you an acceptable range for your data. When you create a best-fit line foryour graph, all data points SHOULD have the line at least pass through part of their error bar:
8~,,!,ii6i
2:?Q;0;'E0
4J~., !& !,
- ;L-;
OJ001
The effect of current on the potential drop for a 100 ohm resistor,//
/-'/1-1 -ji1¥II'---J!
rI /tt I
L~'\\,.- '\
I L ''\\/ ~ ----~"-------------------.-
,/ p'::1 Linear F 11 F or Data Set Potentia! Drlferenc€< :_/ 1 y == mx+b !
f---E--A' mfSIope) 99 21 Y/Amp$
//./ , b(Y-In.ercept)·O 9A79 V..- I Ccrretation.Il 9iJ67'_.-_'0. l __. .. .. . ...
I003
I005
Electric Current (Amps)
I007
Iom
(I If a data point does NOT hit the line with its error bars, then there is some significantexperimental error (more than likely a random error) that has occurred.
o Do NOT throw out that data point unless you have a substantial number of other data pointsto work with! You can keep the point, and be sure to talk about the random error that mayhave affected that piece of data when you complete your conclusion!!
Maximum and Minimum Slope: this is different than last year. For ALL graphs, you are required to haveboth a minimum and a maximum slope determined for your data.
the easiest way to do this is to look at your first and your last data point, and do the following:First, create a new data set-Rename this data set as "Maximum Slope"o for Maximum Slope:
• First (lowest) Data point:• SUBTRACT the uncertainty from the responding variable's value (y)• ADD the uncertainty to the Manipulated variable's value (x)
• Last (highest) Data Point:• ADD the uncertainty to the responding variable's value• SUBTRACT the uncertainty to the Manipulated variable's value
• Plot a linear fit through those two new data points

See the examples below:Example 1: Minimum Slope for the Potential VS. Current data we graphed above:
The effect of current on the potential drop for a 100 ohm resistor~ Ul ~
./0///
17e)Wo//
-:7/Ul -1
.....
-:i..7(,lii
./ "/// -,
/~ "".~ '\.~/ $ ,
/ '"./ -,~---l ' ,----.------------:......--- .--------.-- ...---.
./' .2:'!.::JLineal FII For !-.1inimum Slcne.Potenual Difference i/ . Y " mx+b . I
/ m(Slope) 91 18 V!Arnps I
/f-/-/,?::>-!:l!lt--II ,_ .....~~~~~~;~2t)~~1~7~_\l... J~ -'//$-It
Create another new data set-rename this one "Minimum Slope"o For Minimum Slope:
• First (lowest) Data point:• ADD the uncertainty from the responding variable's value (y)• SUBTRACT the uncertainty to the Manipulated variable's value (x)
• Last (highest) Data Point:• SUBTRACT the uncertainty to the responding variable's value• ADD the uncertainty to the Manipulated variable's value
• Plot a linear fit through those two new data points
8"";,
,2-;
o ' I0.07
I0.09
I0.03
I0.05
Electric Current (.A.mps)
I001
. . ... _ .. ~ . .... .._... .. .__. __.. ",."_... J

Example 2: Maximum slope for potential VS, current dataThe effect of current on the potential drop for a 100 ohm resistor
, G/~,/~.
////
7\$,/ "'\
// ""! 4 \,/ -.
/
/' y -,-- "-'-. ---,-~--,. _ ..... __...,.._--- ..,
!i:> f~~ Lmaar FIt For: Maxrmum SiopePulenllal DIfference i,,7 I Y = m •.+b .
// I m(Slope) 122 3 ViAmps
/ b(Y·\ntereepl) ·2100 V!--------GG---li / Correlation. 1 ()JJ
/'• s,/
6-1
J:
1j
~f
o t I0.05
Electnc Current (Amps)
I0.07
i0.09
I0030.01
(0~27?,:64) ._ ~ ..,,~ _..
You should be able to then discuss your confidence in your slope's accuracy based on the range of valuesyou obtain through this process,
You may choose to put all three lines on one graph, or you may print out (or copy/paste, which is ideal-itputs your graph right in your report where you're talking about it!) all 3 graphs-just make sure everything islabeled clearly!
IB Internal Assessment Criteria and AspectsConclusion and Evaluation
Conclusion and EvaluationASPECTS
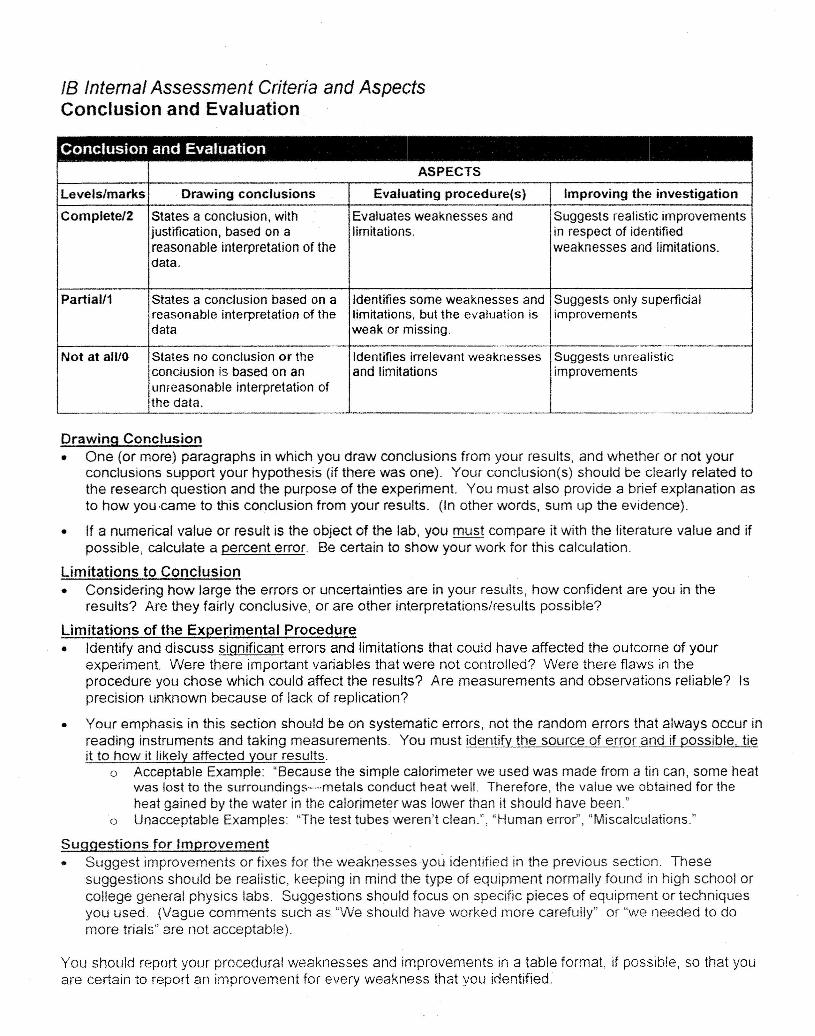
Levels/marks Drawing conclusions Evaluating procedure(s) Improving the investigation
Completel2 States a conclusion, with Evaluates weaknesses and Suggests realistic improvementsjustification, based on a limitations. in respect of identifiedreasonable interpretation of the weaknesses and limitations.data.
Partiall1 States a conclusion based on a Identifies some weaknesses and Suggests only superficialreasonable interpretation of the limitations, but the evaluation is improvementsdata weak or missing.
Not at alYO States no Conclusionor the Identifies irrelevant weaknesses Suggests unrealisticconclusion is based on an and limitations improvementsunreasonable interpretation ofthe data.
Drawing Conclusion• One (or more) paragraphs in which you draw conclusions from your results, and whether or not your
conclusions support your hypothesis (if there was one). Your conclusion(s) should be clearly related tothe research question and the purpose of the experiment. You must also provide a brief explanation asto how you came to this conclusion from your results. (In other words, sum up the evidence).
• If a numerical value or result is the object of the lab, you must compare it with the literature value and ifpossible, calculate a percent error. Be certain to show your work for this calculation.
Limitations to Conclusion• Considering how large the errors or uncertainties are in your results, how confident are you in the
results? Are they fairly conclusive, or are other interpretations/results possible?
Limitations of the Experimental Procedure• Identify and discuss significant errors and limitations that could have affected the outcome of your
experiment. Were there important variables that were not controlled? Were there flaws in theprocedure you chose which could affect the results? Are measurements and observations reliable? Isprecision unknown because of lack of replication?
• Your emphasis in this section should be on systematic errors, not the random errors that always occur inreading instruments and taking measurements. You must identify the source of error and if possible. tieit to how it likely affected your results.
o Acceptable Example: "Because the simple calorimeter we used was made from a tin can, some heatwas lost to the surroundings-metals conduct heat well. Therefore, the value we obtained for theheat gained by the water in the calorimeter was lower than it should have been"
o Unacceptable Examples: "The test tubes weren't clean.", "Human error", "Miscalculations."
Suggestions for Improvement• Suggest improvements or fixes for the weaknesses you identified in the previous section. These
suggestions should be realistic, keeping in mind the type of equipment normally found in high school orcollege general physics labs. Suggestions should focus on specific pieces of equipment or techniquesyou used. (Vague comments such as "We should have worked more carefully" or "we needed to domore trials" are not acceptable).
You should report your procedural weaknesses and improvements in a table format, if possible, so that youare certain to report an improvement for every weakness that you identified.