B. Gentry/GSFCSLWG 06/29/05 Scaling Ground-Based Molecular Direct Detection Doppler Lidar...
27
B. Gentry/GSFC SLWG 06/29/05 Scaling Ground-Based Molecular Direct Detection Doppler Lidar Measurements to Space Using Wind Profile Measurements from GLOW B. Gentry, J. Comer, M. McGill NASA / GSFC
-
Upload
ezra-fletcher -
Category
Documents
-
view
217 -
download
0
Transcript of B. Gentry/GSFCSLWG 06/29/05 Scaling Ground-Based Molecular Direct Detection Doppler Lidar...
B. Gentry/GSFC SLWG 06/29/05
Scaling Ground-Based Molecular Direct Detection Doppler Lidar
Measurements to Space Using Wind Profile Measurements from
GLOW
B. Gentry, J. Comer, M. McGillNASA / GSFC

B. Gentry/GSFC SLWG 06/29/05
Q: How can we use ground based measurements to refine and validate future space based lidar system designs?
1) Validate the instrument performance behaves predictably versus measurable quantity (signal photocounts; signal to noise) under a variety of conditions.
2) Establish reference system designs to examine impact of performance trades (e.g. spatial and temporal averaging schemes) or engineering trades
3) Scaling of ground based system performance to equivalent space-based system reveals where improvements are required and provides direction for technology and instrument system development programs
4) Scaling also provides a sanity check for space based designs
B. Gentry/GSFC SLWG 06/29/05
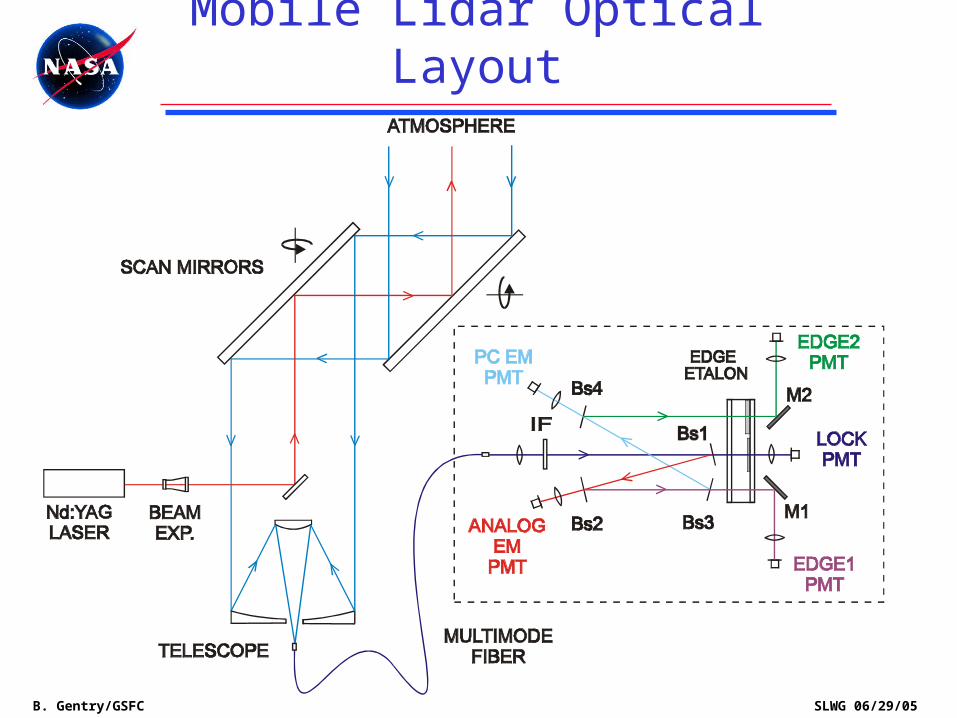
Mobile Lidar Optical Layout

B. Gentry/GSFC SLWG 06/29/05
-0.5
0
0.5
1
1.5
2
2.5
3
-6 -4 -2 0 2 4 6
Lidar Signal vs. Etalon Transmision
Frequency (GHz)
Edge2 Filter
Locking Filter
Edge1 Filter
Aerosol Spectrum
Rayleigh Spectrum
Double Edge Etalon Channels
B. Gentry/GSFC SLWG 06/29/05
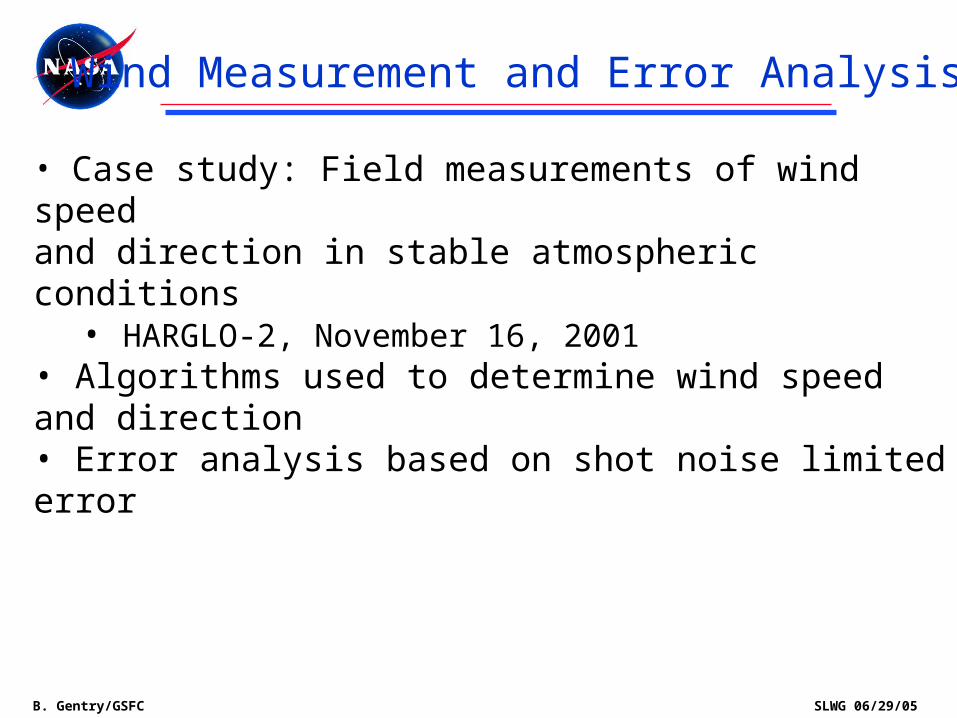
Wind Measurement and Error Analysis
• Case study: Field measurements of wind speedand direction in stable atmospheric conditions
• HARGLO-2, November 16, 2001 • Algorithms used to determine wind speed and direction• Error analysis based on shot noise limited error
B. Gentry/GSFC SLWG 06/29/05
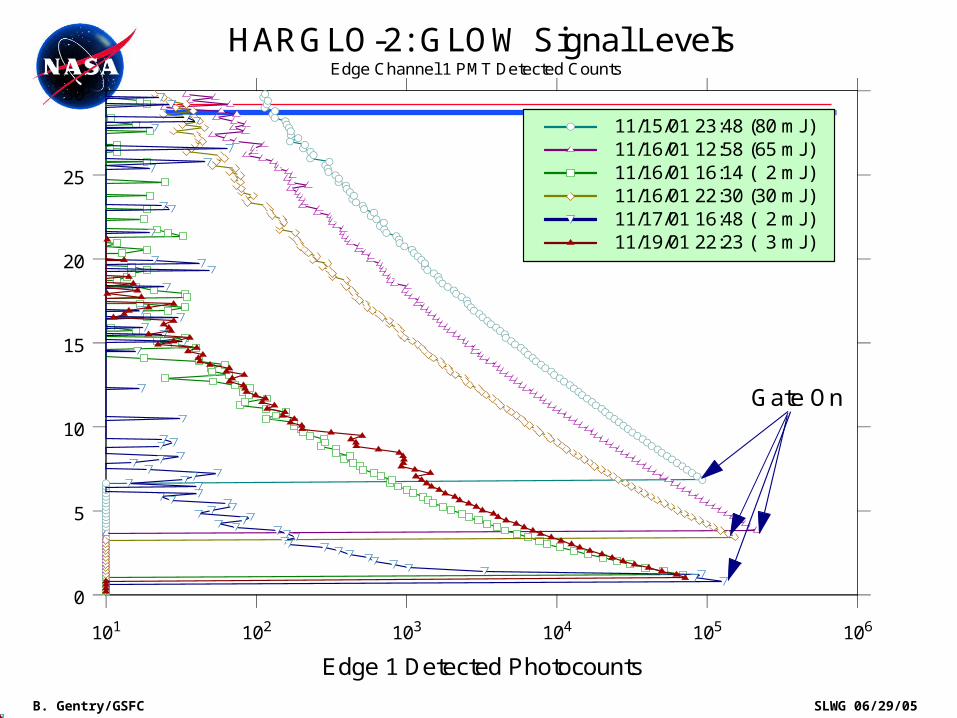
101 102 103 104 105 106
Edge 1 Detected Photocounts
0
5
10
15
20
25
30
Altitude (km)
11/15/01 23:48 (80 mJ)11/16/01 12:58 (65 mJ)11/16/01 16:14 ( 2 mJ)11/16/01 22:30 (30 mJ)11/17/01 16:48 ( 2 mJ)11/19/01 22:23 ( 3 mJ)
HARGLO-2: GLOW Signal LevelsEdge Channel 1 PMT Detected Counts
Gate On

B. Gentry/GSFC SLWG 06/29/05
Θ+−
=
Θ+−
=
+=
==
Θ
cos*
1*
)(
)(v
cos*
1*
)(
)(v
vv v
bygiven is vspeed windthe
,,,;2
1
ratios theand y sensitivit aGiven
degrees. ofelevation at EW,S,N, azimuths 4 from
obtained are from Edg2 and Edg1 signals Measured
y
x
2y
2x
SensRR
RR
SensRR
RR
where
WESNiEdg
EdgR
Sens
SN
SN
EW
EW
i
ii
1
2
3
4
5

B. Gentry/GSFC SLWG 06/29/05
Combined Molecular Sensitivity vs. T and vT= 150K to 350K , v = 0 to 100 m/s

B. Gentry/GSFC SLWG 06/29/05
0 10 20 30
Speed (m/s)
0
5
10
15
Height (km)
GLOWLoran Sonde
HARGLO-2 11/16/01 12:58Z
0 100 200 300
Direction (deg)
0
5
10
15
Height (km)
GLOWLoran Sonde
B. Gentry/GSFC SLWG 06/29/05
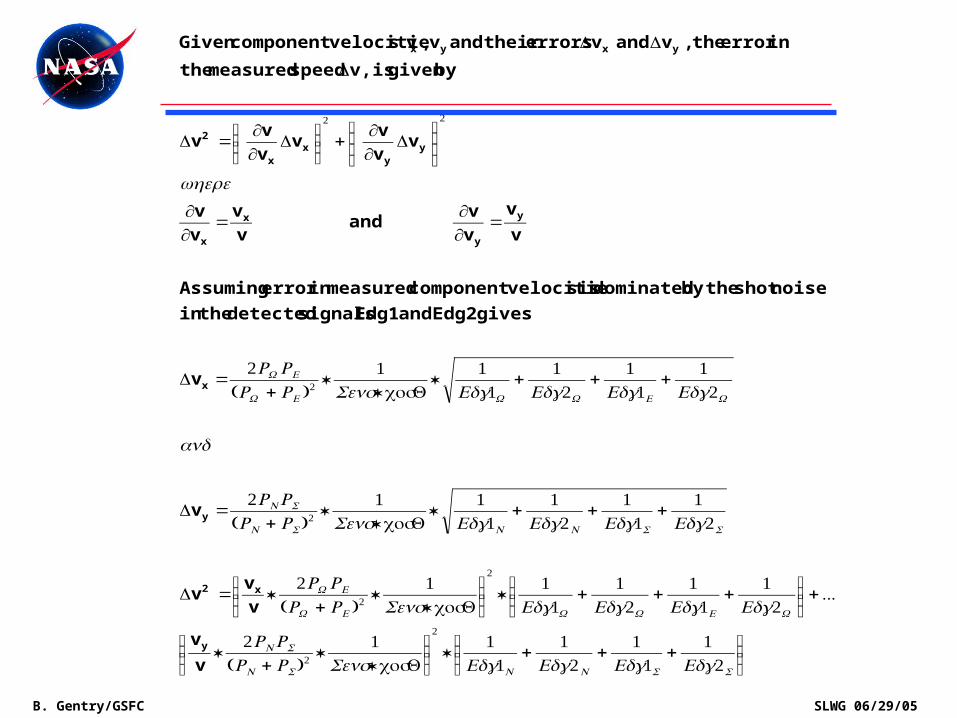
v
v
v
v v
v
v
gives Edg2 and Edg1 signals detected the in
noise shot the by dominated is s velocitiecomponent measured in error Assuming
v
v
v
v and
v
v
v
v
vv
v v
v
v v
by given is v, speed measured the
in error the ,v and v errors their andv, vs velocitiecomponent Given
y
x2
y
x
y
y
x
x
yy
xx
2
y x y x
⎟⎟⎠
⎞⎜⎜⎝
⎛+++⎟⎟
⎠
⎞⎜⎜⎝
⎛Θ+
+⎟⎟⎠
⎞⎜⎜⎝
⎛+++⎟⎟
⎠
⎞⎜⎜⎝
⎛Θ+
=Δ
+++Θ+
=Δ
+++Θ+
=Δ
=∂∂
=∂∂
⎟⎟⎠
⎞⎜⎜⎝
⎛Δ
∂∂
+⎟⎟⎠
⎞⎜⎜⎝
⎛Δ
∂∂
=Δ
Δ
ΔΔ
SSNNSN
SN
WEWWEW
EW
SSNNSN
SN
WEWWEW
EW
EdgEdgEdgEdgSensRRRR
EdgEdgEdgEdgSensRRRR
EdgEdgEdgEdgSensRRRR
and
EdgEdgEdgEdgSensRRRR
where
21
11
21
11
*cos*1
*)(
2*
...2
11
12
11
1*
cos*1
*)(
2*
21
11
21
11
*cos*1
*)(
2
21
11
21
11
*cos*1
*)(
2
2
2
2
2
2
2
22
B. Gentry/GSFC SLWG 06/29/05
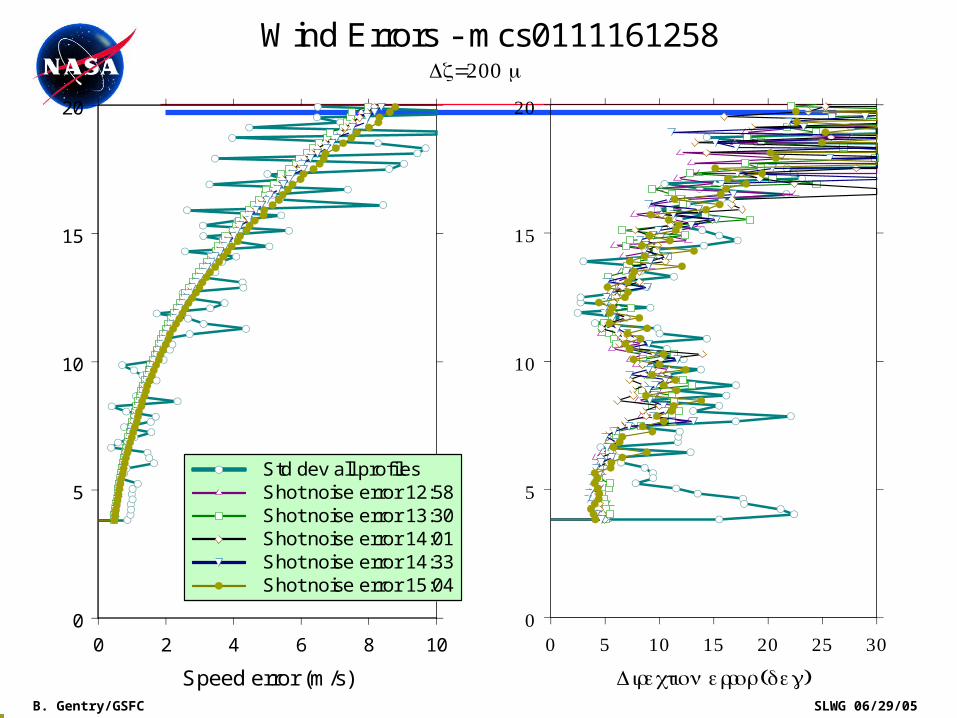
0 2 4 6 8 10
Speed error (m/s)
0
5
10
15
20
Altitude (km)
Std dev all profilesShot noise error 12:58Shot noise error 13:30Shot noise error 14:01Shot noise error 14:33Shot noise error 15:04
Wind Errors - mcs0111161258Δz=200 m
0 5 10 15 20 25 30
Direction error (deg)
0
5
10
15
20
( )Altitude km
B. Gentry/GSFC SLWG 06/29/05
Q: How can we use ground based measurements to refine and validate future space based lidar system designs?
1) Validate the instrument performance behaves predictably versus measurable quantity (signal photocounts; signal to noise).
2) Establish reference system designs to examine impact of performance trades (e.g. spatial and temporal averaging schemes) or engineering trades
3) Scaling of ground based system performance to equivalent space-based system reveals where improvements are required and provide direction for technology and instrument system development programs
4) Scaling also provides a sanity check for space based designs
B. Gentry/GSFC SLWG 06/29/05
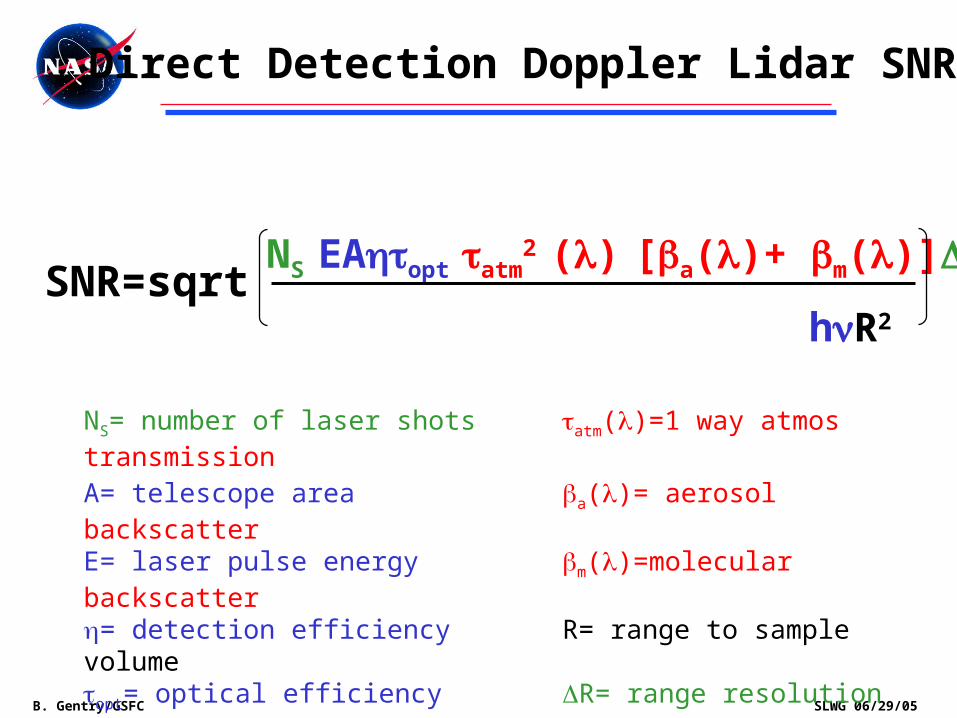
NS= number of laser shots atm()=1 way atmos transmission
A= telescope area a()= aerosol backscatter E= laser pulse energy m()=molecular backscatter= detection efficiency R= range to sample volumeopt= optical efficiency ΔR= range resolutionh= photon energy
Direct Detection Doppler Lidar SNR
NS EAopt atm2
() [a()+ m()]ΔR
hR2
SNR=sqrt
B. Gentry/GSFC SLWG 06/29/05
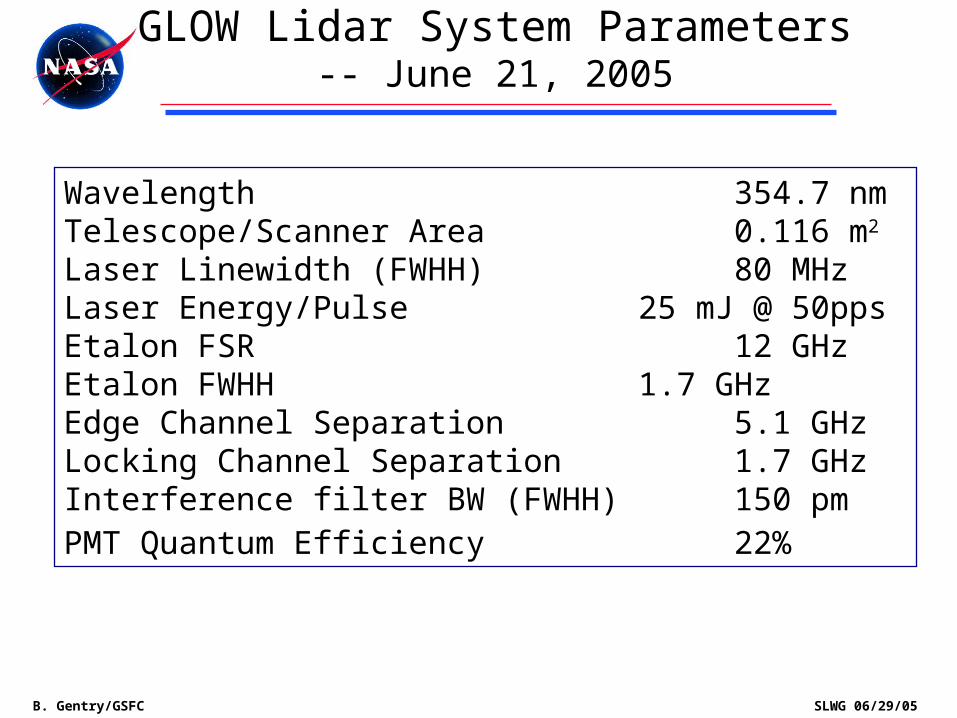
Wavelength 354.7 nmTelescope/Scanner Area 0.116 m2
Laser Linewidth (FWHH) 80 MHzLaser Energy/Pulse 25 mJ @ 50ppsEtalon FSR 12 GHzEtalon FWHH 1.7 GHzEdge Channel Separation 5.1 GHzLocking Channel Separation 1.7 GHzInterference filter BW (FWHH) 150 pmPMT Quantum Efficiency 22%
GLOW Lidar System Parameters-- June 21, 2005
B. Gentry/GSFC SLWG 06/29/05
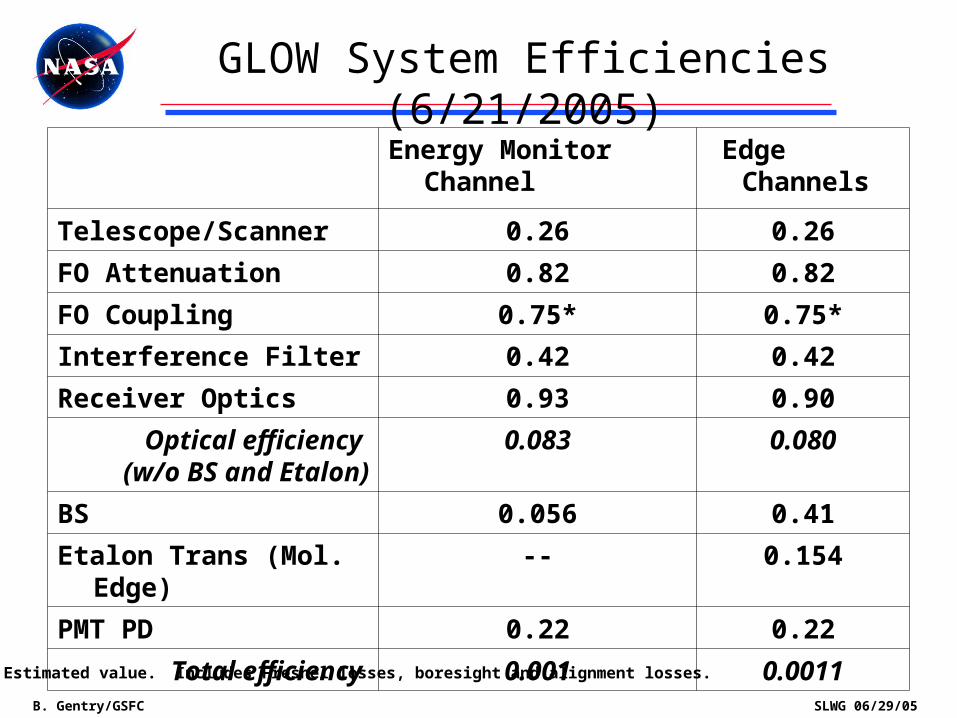
GLOW System Efficiencies (6/21/2005)
Energy Monitor Channel
Edge Channels
Telescope/Scanner 0.26 0.26
FO Attenuation 0.82 0.82
FO Coupling 0.75* 0.75*
Interference Filter 0.42 0.42
Receiver Optics 0.93 0.90
Optical efficiency (w/o BS and Etalon)
0.083 0.080
BS 0.056 0.41
Etalon Trans (Mol. Edge)
-- 0.154
PMT PD 0.22 0.22
Total efficiency 0.001 0.0011* Estimated value. Includes Fresnel losses, boresight and alignment losses.
B. Gentry/GSFC SLWG 06/29/05
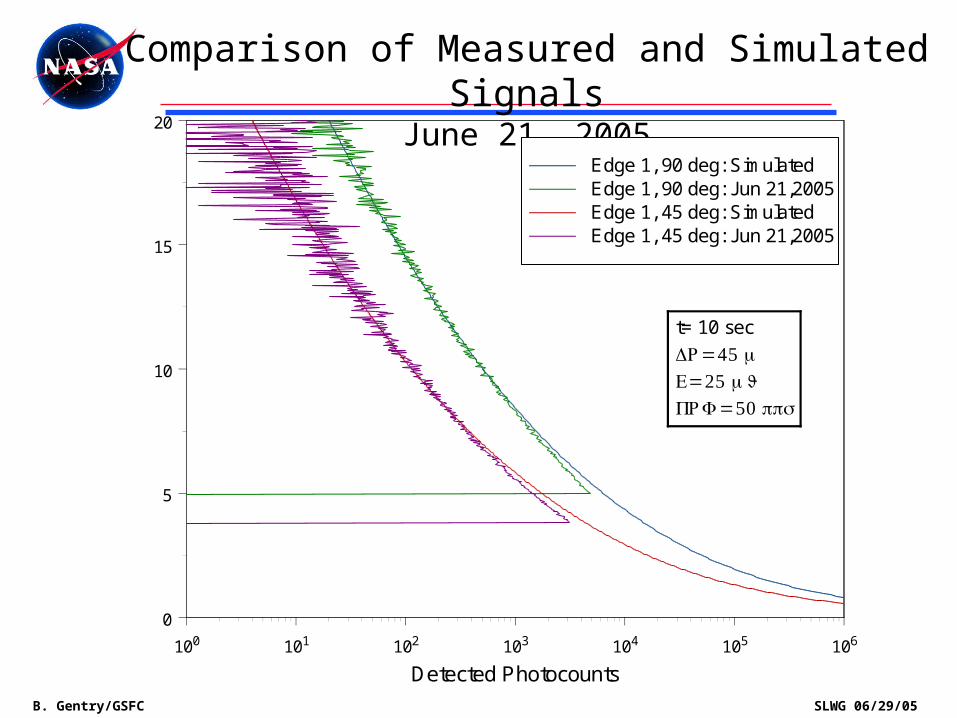
Comparison of Measured and Simulated SignalsJune 21, 2005
100 101 102 103 104 105 106
Detected Photocounts
0
5
10
15
20
Altitude (km)
Edge 1, 90 deg: Simulated Edge 1, 90 deg: Jun 21,2005Edge 1, 45 deg: Simulated Edge 1, 45 deg: Jun 21,2005
t= 10 sec
ΔR= 45 mE= 25 mJPRF = 50 pps

B. Gentry/GSFC SLWG 06/29/05
GLOW LOS Error Δz=0.5 km; t=1 min

B. Gentry/GSFC SLWG 06/29/05
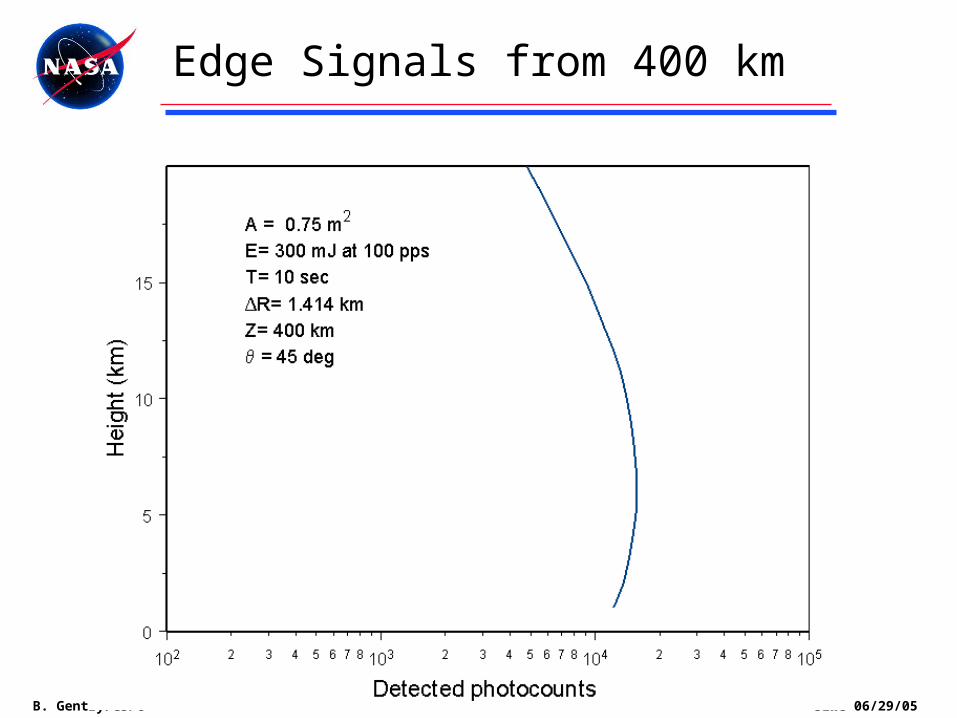
Scaling GLOW to 400 km at z=10km
Ground Space Scaling factor parameters
Integration Time (s) 60 10 6
Δz/cos (km) 0.707 1.41 0.5
Laser Power J/s 1.25 W(50 Hz, 0.025 J)
30W(100 Hz, 0.3 J)
0.0417
Telescope area (m2) 0.116 0.75 0.155
Atmospheric transmission 0.2 0.95 0.21
Detector quantum efficiency
0.22 0.3 0.73
Optics transmission 0.06 0.30 0.2
Range to Target Volume (km)
14.14 551.6 1522
Scale factor product = 0.9
B. Gentry/GSFC SLWG 06/29/05
Edge Signals from 400 km
B. Gentry/GSFC SLWG 06/29/05
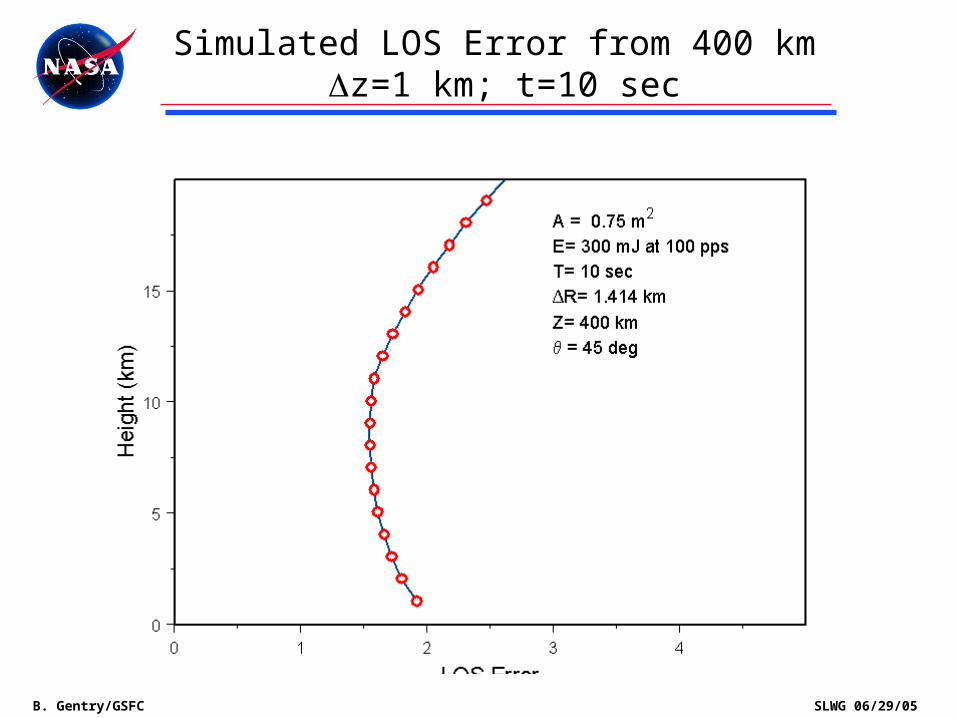
Simulated LOS Error from 400 km Δz=1 km; t=10 sec
B. Gentry/GSFC SLWG 06/29/05
Summary
• Ground based lidar measurements provide important insight into performance of future air and space based lidar systems– Measurements provide experimental validation of
atmospheric and instrument models– Inversion of lidar measurement performance can be
scaled to space for a single altitude/signal level – This information can be used to guide technology
development and explore sysetem trades for future designs

B. Gentry/GSFC SLWG 06/29/05
1.000e-8 1.000e-7 1.000e-6 1.000e-5 1.000e-42 3 4 5 2 3 4 5 2 3 4 5 2 3 4 5
Backscatter (m-1 sr-1)
0
5
10
15
Altitude (km)
MolecularAerosol
Model Backscatter Coefficient 355 nm
B. Gentry/GSFC SLWG 06/29/05
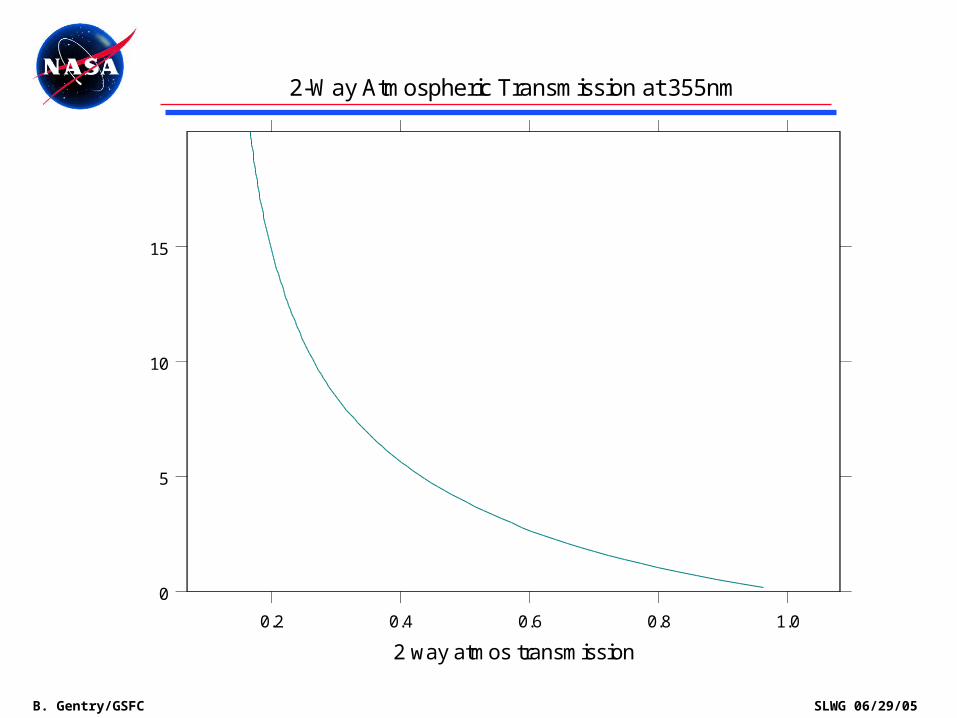
0.2 0.4 0.6 0.8 1.0
2 way atmos transmission
0
5
10
15
Altitude at 45 deg elevation
2-Way Atmospheric Transmission at 355nm

B. Gentry/GSFC SLWG 06/29/05
Incident Photon Count Rate

B. Gentry/GSFC SLWG 06/29/05
2-way atmospheric transmission

B. Gentry/GSFC SLWG 06/29/05
B. Gentry/GSFC SLWG 06/29/05
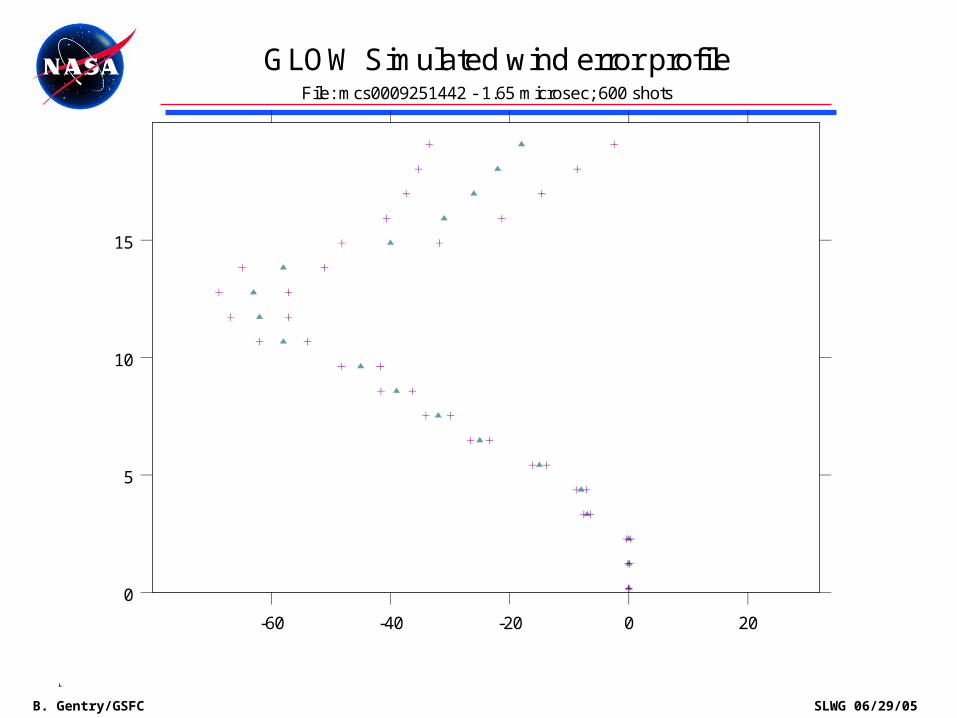
-60 -40 -20 0 20
0
5
10
15
Altitude (km)
GLOW Simulated wind error profile File: mcs0009251442 - 1.65 microsec; 600 shots


![Light pollution : zenithaloffshore sky glow measurements ... · 1 arXiv:1705.02508v 4 [astro-ph.IM] 07 Ma r 201 8 Light pollution : zenithaloffshore sky glow measurements in the Mediterranean](https://static.fdocuments.us/doc/165x107/5f85e84a46f43c5f9b138831/light-pollution-zenithaloffshore-sky-glow-measurements-1-arxiv170502508v.jpg)