
Azerbaijan presentation slides
87
BP in Azerbaijan Baku September 2006
Transcript of Azerbaijan presentation slides
BP in Azerbaijan
BakuSeptember 2006

Cautionary statement
Forward looking statements: This presentation and the associated slides and discussion contain forward-looking statements, particularly those regarding oil and gas prices; expected start-up of Thunderhorse; the timing of other projects and their contribution to expected production, their estimated reserves and production capacity; production; the expected movement of non-proven resources to proved reserves; divestments and their effect; capital expenditure; and cash flow. By their nature, forward-looking statements involve risks and uncertainties because they relate to events and depend on circumstances that will or may occur in the future. Actual results may differ from those expressed in such statements, depending on a variety of factors, including the timing of bringing new fields on stream; future levels of industry product supply; demand and pricing; operational problems; general economic conditions; political stability and economic growth in relevant areas of the world; changes in laws and governmental regulations; exchange rate fluctuations; development and use of new technology; changes in public expectations and other changes in business conditions; the actions of competitors; natural disasters and adverse weather conditions; wars and acts of terrorism or sabotage; and other factors discussed elsewhere in this presentation.
Cautionary Note to US Investors - The United States Securities and Exchange Commission permits oil and gas companies, in their filings with the SEC, to disclose only proved reserves that a company has demonstrated by actual production or formation tests to be economically and legally producible under existing economic and operating conditions. We use certain terms in this presentation, such as “resources” and “non-proven reserves”, that the SEC’s guidelines strictly prohibit us from including in our filings with the SEC. U.S. investors are urged to consider closely the disclosures in our Form 20-F, SEC File No. 1-6262, available from us at 1 St. James’s Square, London SW1Y 4PD. You can also obtain this form from the SEC by calling 1-800-SEC-0330.
September 2006

Introduction
Fergus MacLeodHead of Investor Relations

1989 Access Agenda1997 Baku Analyst Trip
E & W SiberiaE & W Siberia
CaspianCaspian
VietnamVietnam
NigeriaNigeriaVenezuela YemenVenezuela YemenLombokLombok
AngolaAngola
AlgeriaAlgeriaGOM GOM DeepwaterDeepwater

Current Environment1997 Baku Analyst Trip
Challenge to BPChallenge to BP
–– Keep ahead of pack Keep ahead of pack
–– Play to strengthsPlay to strengths–– Exploration track record Exploration track record –– Deepwater technologyDeepwater technology–– Relationship managementRelationship management–– Deepen existing posDeepen existing positionsitions–– Broaden into new posBroaden into new positionsitions
Competition Increasing
– Access competition
– New players
– Terms erosion
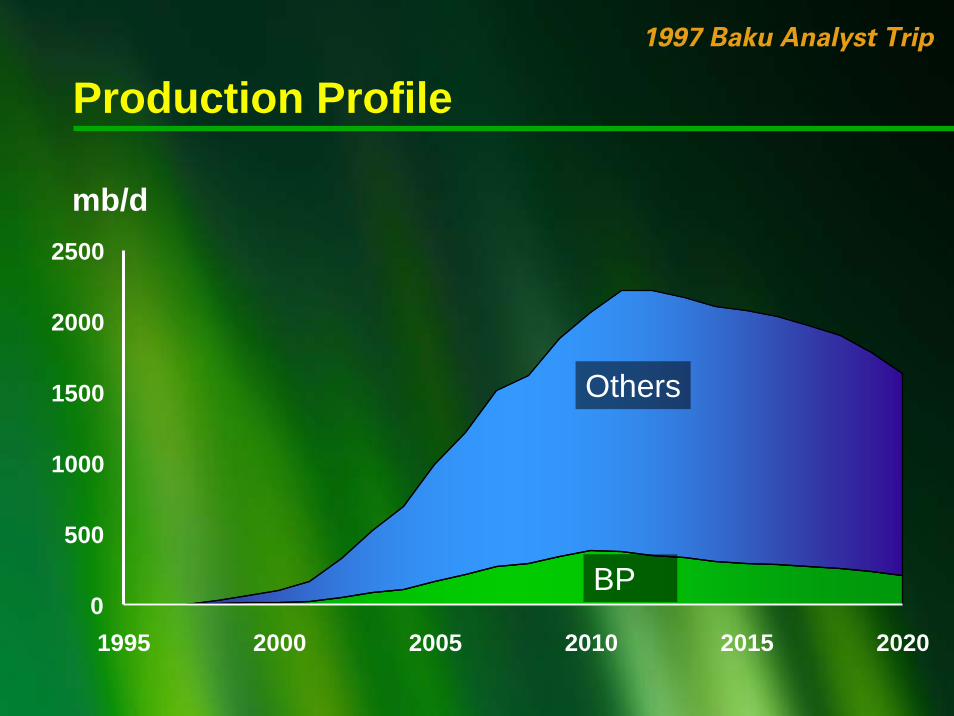
Production Profile
0
500
1000
1500
2000
2500
1995 2000 2005 2010 2015 2020
mb/d
BP
Others
1997 Baku Analyst Trip
E&P Strategy Update
Tony HaywardChief Executive, Exploration & Production

BP Azerbaijan organisation
Technical DirectorFereidoun Abbassian
BP Azerbaijan PresidentDavid Woodward / Bill Schrader*
Renewal VPPaul Clyne
Shah Deniz VPMike Skitmore
Major Projects VPBruce Luberski
Offshore Operations VPNeil McCleary
Onshore Operations VPRashid Javanshir
HR DirectorZarina Zeynalova
C&EA DirectorClare Bebbington
HSSE DirectorGunther Newcombe
Business Transformation
ManagerJudith Luberski*David Woodward will be retiring from BP on 1 January 2007,
Bill Schrader will be effective in this role from 10 November 2006
Commercial DirectorPhil Home
Georgia General ManagerHugh McDowell
Turkey E&P DirectorDjan Suphi
Chief of StaffErich Krumanocker
Executive AssistantKamala Husseynli

Project start-ups
2006Atlantis
King Sub-sea Pump
San Juan Coal Bed Methane
Greater Plutonio
Kizomba A Ph 2
Rosa
Red Mango
North West Area Development
Cannonball
TemsahRedevelopment
BTC
In Amenas
Wamsutter
Dalia
East Azeri
Shah Deniz
MagnusExtension
on stream in development under appraisal
Paz Flor
Egypt LNG T2
Browse
Io / Janz
Tangguh Phase 2
Vietnam Phase 2
Colombia Gas
Clair Ridge
Skarv
Kovykta Export
Rospan
North Rankin B
Kizomba D
Shah Deniz Phase 2
2007 2008 - 2009 2010 and beyondThunder HorseUrsa ExpansionKizomba CACG Phase 3AngelAustralia LNG T5Tangguh Phase 1SaqqaraDoradoGreat WhiteHorn Mountain NWMad Dog SW RidgeMars SouthCashimaChacalacaEgypt LNG T1Harding GasValhall RedevelopmentUvat (Demiansky Phase I)
Atlantis North Flank
Puma
Tubular Bells
Alaska Gas
Liberty
Point Thomson
Western Regional Development
Angola LNG
Block 18 West
Block 31 North
Block 31 South
Block 31 Central
2005Valhall Waterflood
Mad Dog
Central Azeri
Clair
Kizomba B
Trinidad LNG Train 4
Rhum
West Azeri
Mardi Gras Pipeline

Production to 2010
TNK-BP
New profit centres
Existing profit centres
Divestments closed in 2006
BP projection for ‘06-’10 updated to reflect closed ’06 divestments
mmboe/d
Actual prices and portfolio
Production at $40
0
1
2
3
4
5
2001 2002 2003 2004 2005 2010
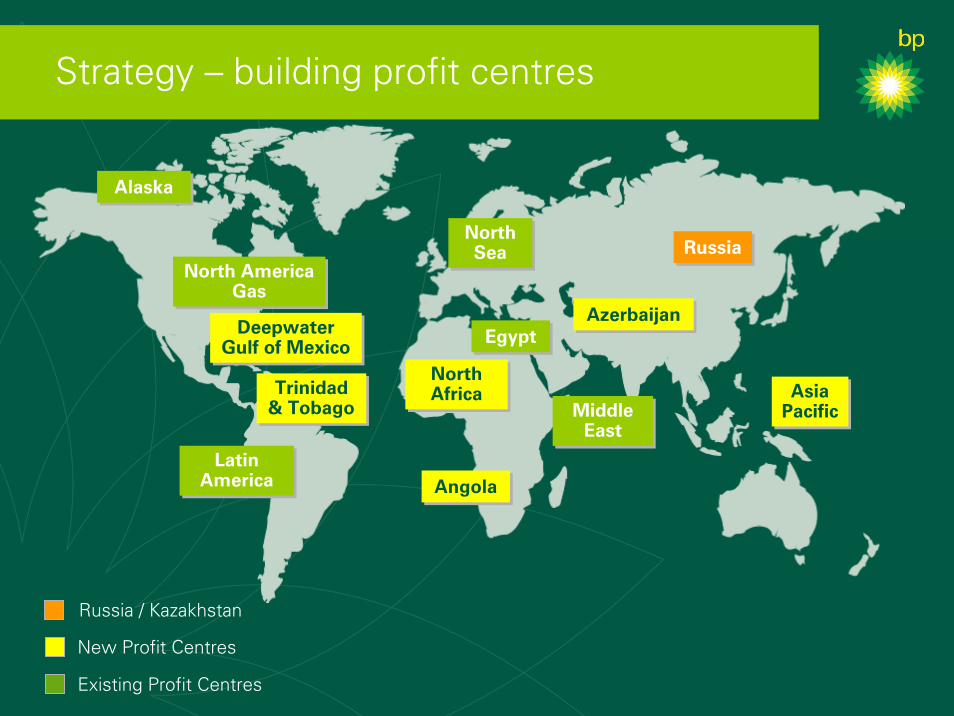
Strategy – building profit centres
Existing Profit Centres
New Profit Centres
Russia / Kazakhstan
AlaskaAlaska
North America Gas
North America Gas
North Sea
North Sea RussiaRussia
EgyptEgypt
Latin America
Latin America
Middle East
Middle East
DeepwaterGulf of Mexico
DeepwaterGulf of Mexico
AngolaAngola
North AfricaNorth Africa
AzerbaijanAzerbaijan
Trinidad & TobagoTrinidad
& TobagoAsia
PacificAsia
Pacific
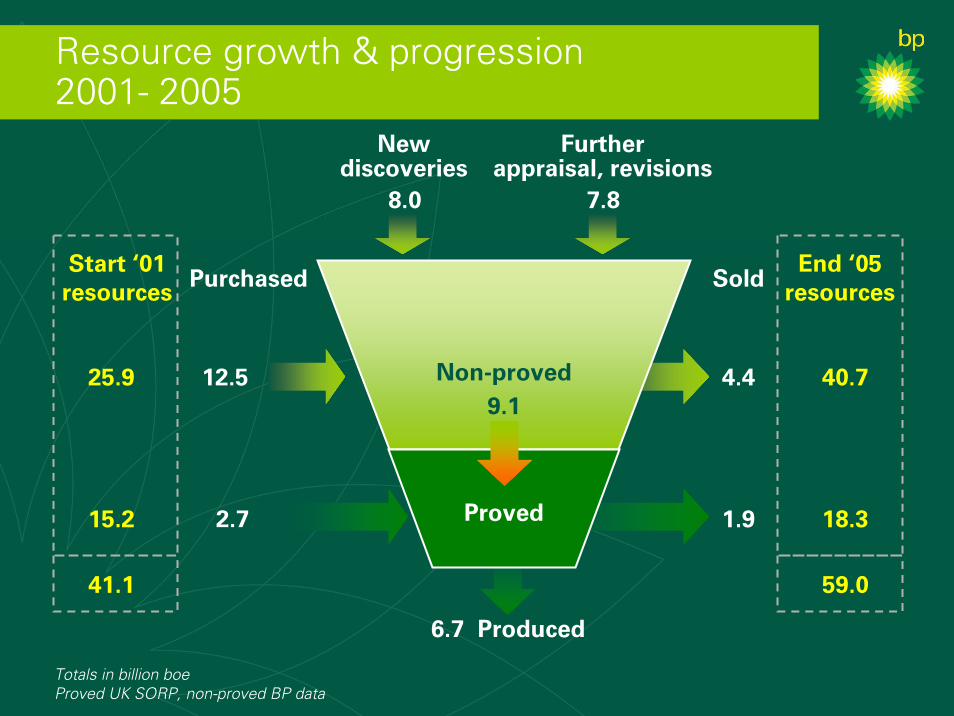
Resource growth & progression 2001- 2005
Non-proved
Proved
12.5
Newdiscoveries
2.7
9.1
6.7 Produced
7.88.0
Furtherappraisal, revisions
PurchasedStart ‘01
resources
25.9
15.2
41.1
Sold
4.4
1.9
End ‘05 resources
40.7
18.3
59.0
Totals in billion boeProved UK SORP, non-proved BP data

End 2005 resource by type
Between 2005 and 2010 11 bn boe of non-proved
resources are expected to be moved to proved reservesTotals in billion boe
Proved UK SORP, non-proved BP data
Non-Proved
Conventional Oil
Deepwater Oil
Water Flood Viscous and Heavy Oil
Conventional Gas
LNG Gas
Tight Gas
Coal Bed Methane
Proved
18 bn boe41 bn boe
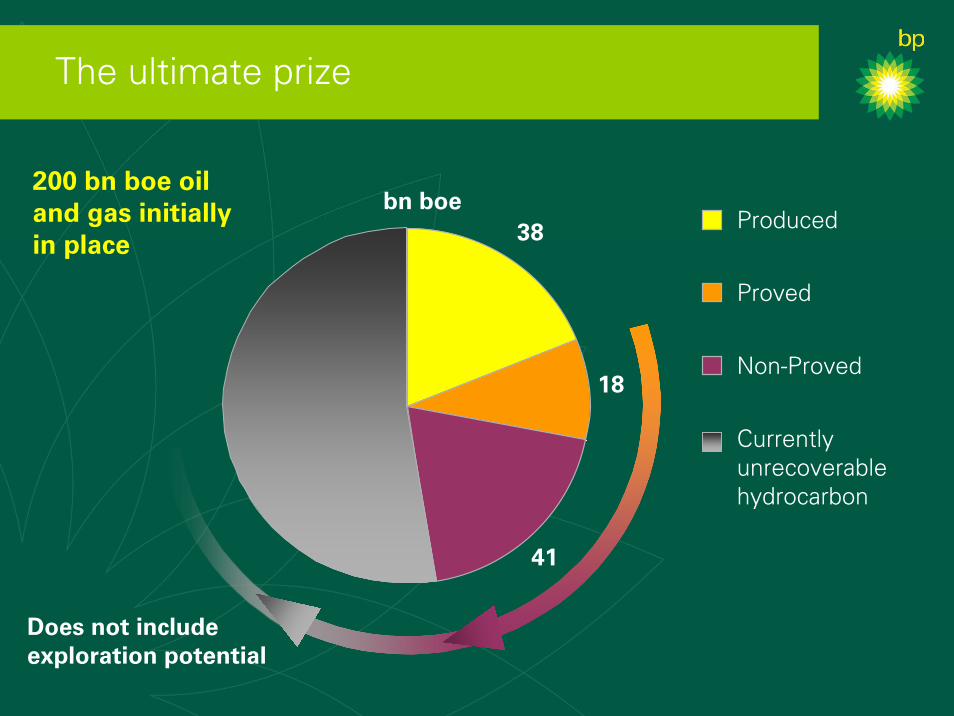
The ultimate prize
Does not include exploration potential
Produced
Proved
Non-Proved
Currently unrecoverable hydrocarbon
18
41
38bn boe
200 bn boe oil and gas initially in place

Summary
• New Profit Centres have arrived
− Major Projects underpin production growth through the end of the decade and beyond
• Power of incumbent positions
− Technology to unlock the resource base
Building a New Profit Centre:Azerbaijan
Andy InglisDeputy Chief Executive, Exploration & Production

Building a new profit centre: Azerbaijan
• Resource base
• Technology
• Project delivery
• Statecraft and diplomacy
• Sustainability through mutuality

Resource base: Azerbaijan
bn boe 0.4
6.1
7.6
ACG and Shah Deniz Gross Resource
Produced
Sanctioned
Non-Proved
Currently unrecoverable hydrocarbon
Source: BP data
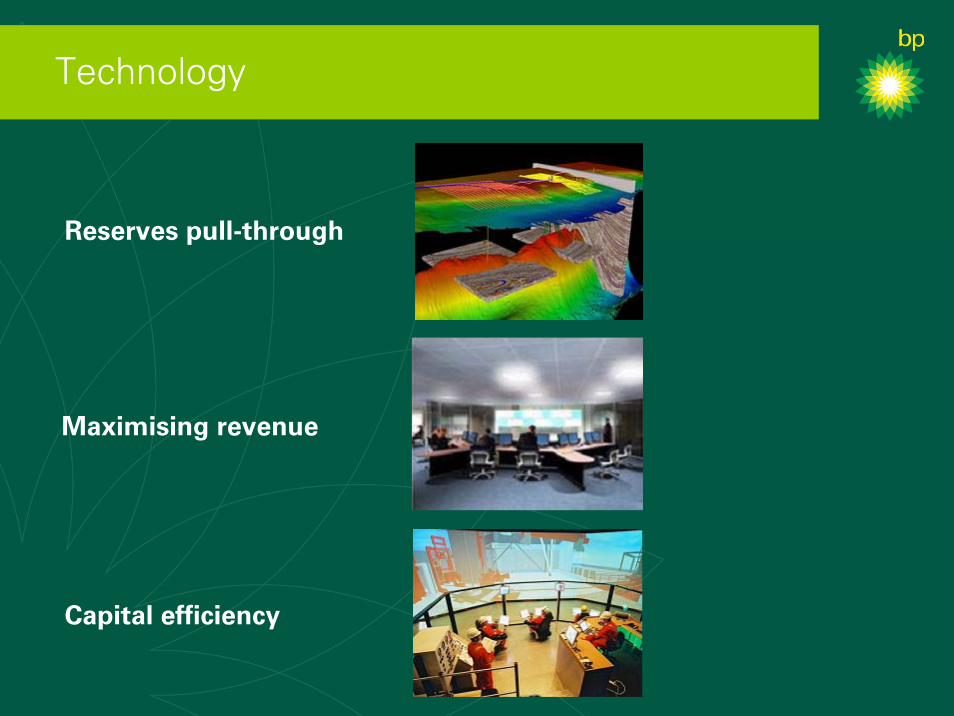
Technology
Reserves pull-through
Maximising revenue
Capital efficiency

Project delivery
Dorado 2008
Go
M
Horn MountainNW 2008
Mad Dog SW Ridge 2009
Atlantis North Flank 2010+
Eg
ypt
Train 1 Supply 2008 Train 2 Supply – Ph1 2010+ Train 2 Supply – Ph2 2010+
Tri
nid
ad
Cannonball – 2006 Cashima – 2008Red Mango – 2007 Chachalaca -2009
An
go
la
G. Plutonio - 2007 Bk31 North – 2010+ Bk31 Central – 2010+ Bk31 South – 2010+ Bk18 West – 2010+
Aze
rbai
jan
Central Azeri - 2004 West Azeri - 2005 East Azeri – 2006 ACG3 - 2008
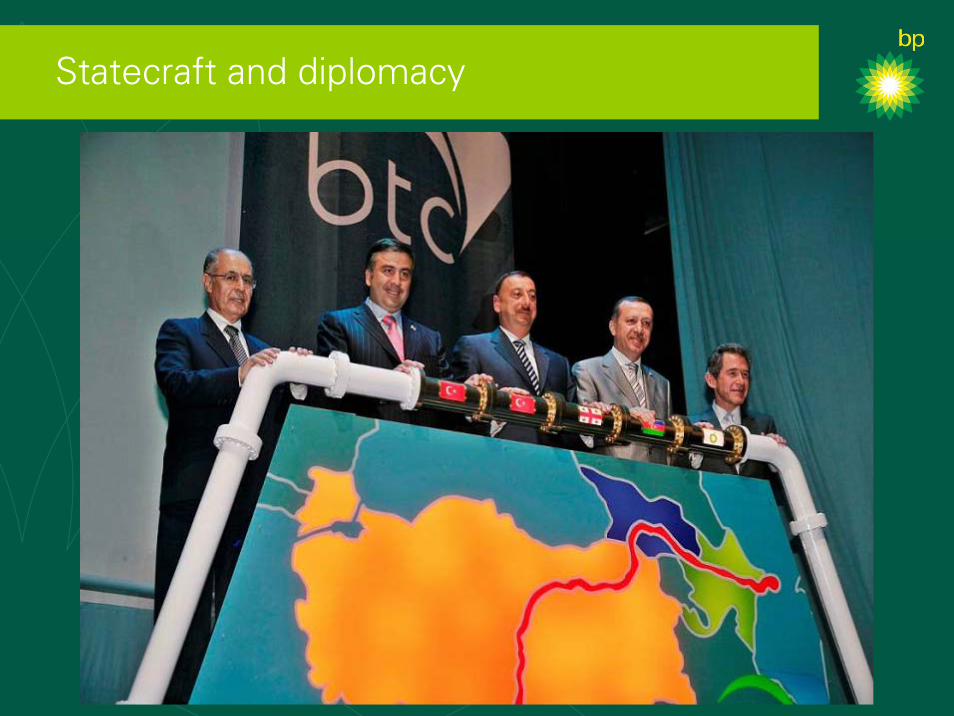
Statecraft and diplomacy
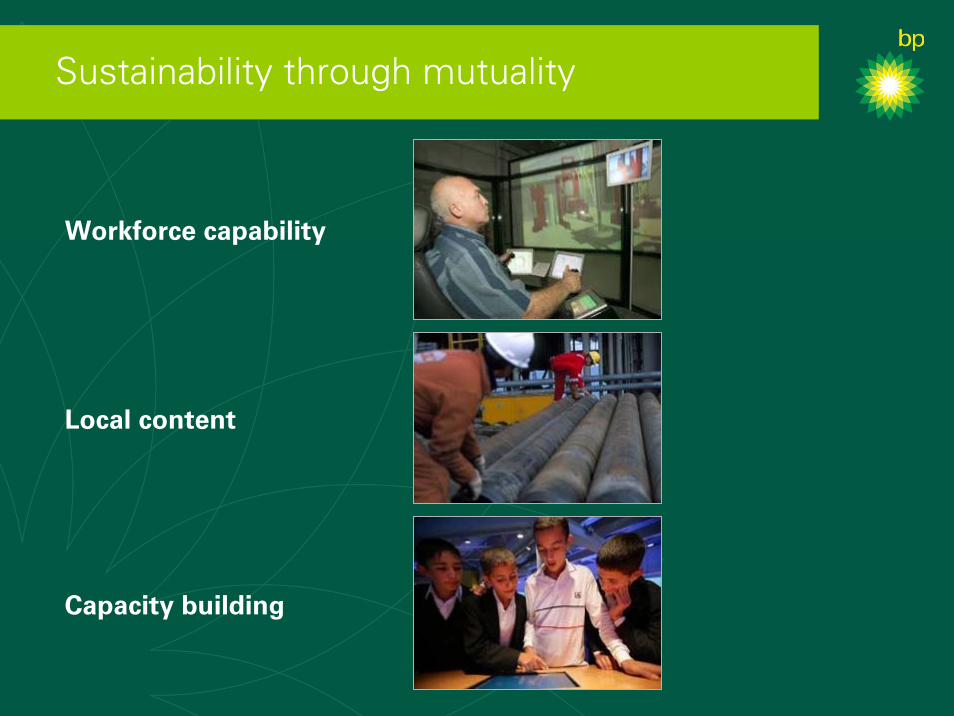
Sustainability through mutuality
Workforce capability
Local content
Capacity building
Overview of Azerbaijan and BP’s presence
Rashid JavanshirVice President, Onshore Operations
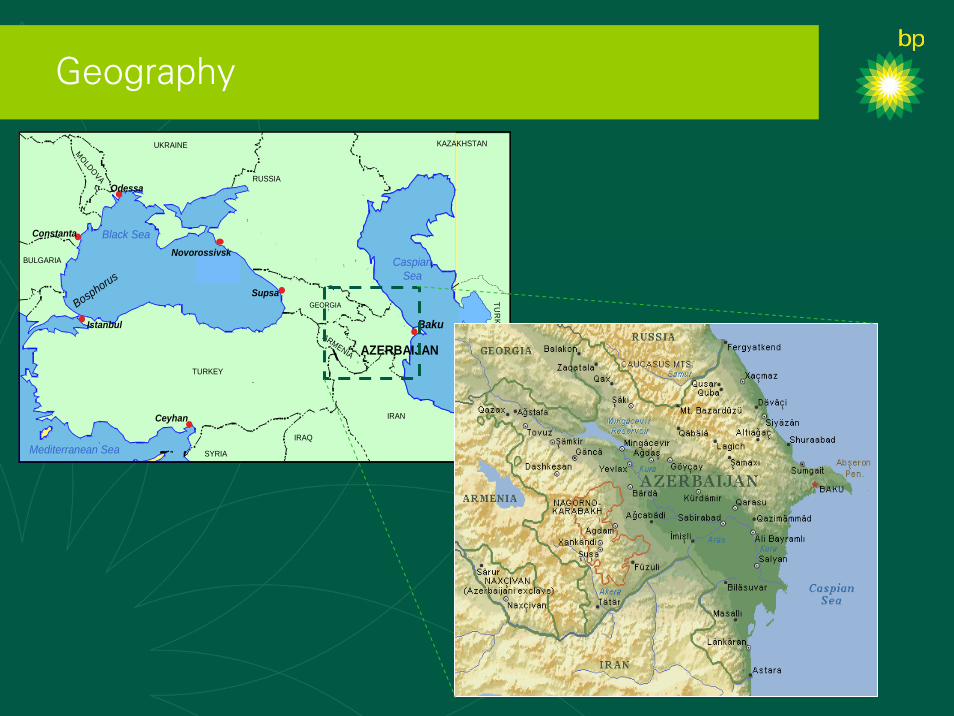
Geography
KAZAKHSTAN
RUSSIA
UKRAINE
AZERBAIJANTURKEY
SYRIA
IRAQ
IRAN
BULGARIA
MOLDOVA
Supsa
Novorossiysk
Ceyhan
Istanbul
Odessa
Constanta Black Sea
CaspianSea
Mediterranean Sea
Bosphorus
ARMENIA
TUR
KM
ENIST A
N
GEORGIA
Baku

150 years of oil production
0
200
400
600
800
1000
1200
1400
1870 1880 1890 1900 1910 1920 1930 1940 1950 1960 1970 1980 1990 2000 2010 2020
Historical peak 1941 (475 mmstb/d)
ACG 2010 (1200 mmb/d)
Future decline for other fields assumed 3% annual
Chirag online 1997
Azeri online 2005
Phase 3 online 2008
Oil
rate
(m
bd
)
Today
Chirag
Azeri
DW
G
Further Developments

Azerbaijan’s oil history
Oil wells in the vicinity of Baku pumping oil into reservoir lakes in 1880s.Photo: Azerbaijan National Archives.
The Nobel Brothers' oil wells in Balakhani, a suburb of Baku.
View of Oil Rocks c. 1950s 2006 Central Azeri platforms
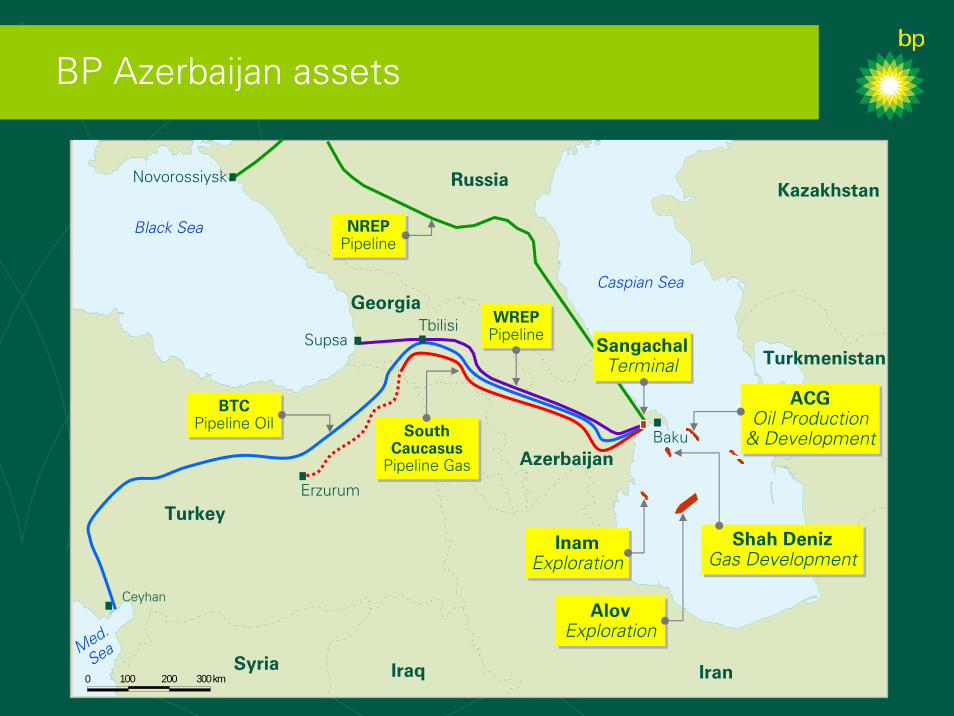
BP Azerbaijan assets
0 300 km200100
Turkey
IraqSyria
Russia
Georgia
Ceyhan
Erzurum
Black Sea
Tbilisi
Med.
Sea
South Caucasus
Pipeline Gas
South Caucasus
Pipeline Gas
WREPPipelineWREP
Pipeline
BTC Pipeline Oil
BTC Pipeline Oil
NREP PipelineNREP
Pipeline
Supsa
Novorossiysk
Caspian Sea
Iran
Kazakhstan
Turkmenistan
Azerbaijan
Inam Exploration
Inam Exploration
Shah Deniz Gas Development
Shah Deniz Gas Development
Alov Exploration
Alov Exploration
Baku
ACG Oil Production
& Development
ACG Oil Production
& Development
Sangachal Terminal
Sangachal Terminal
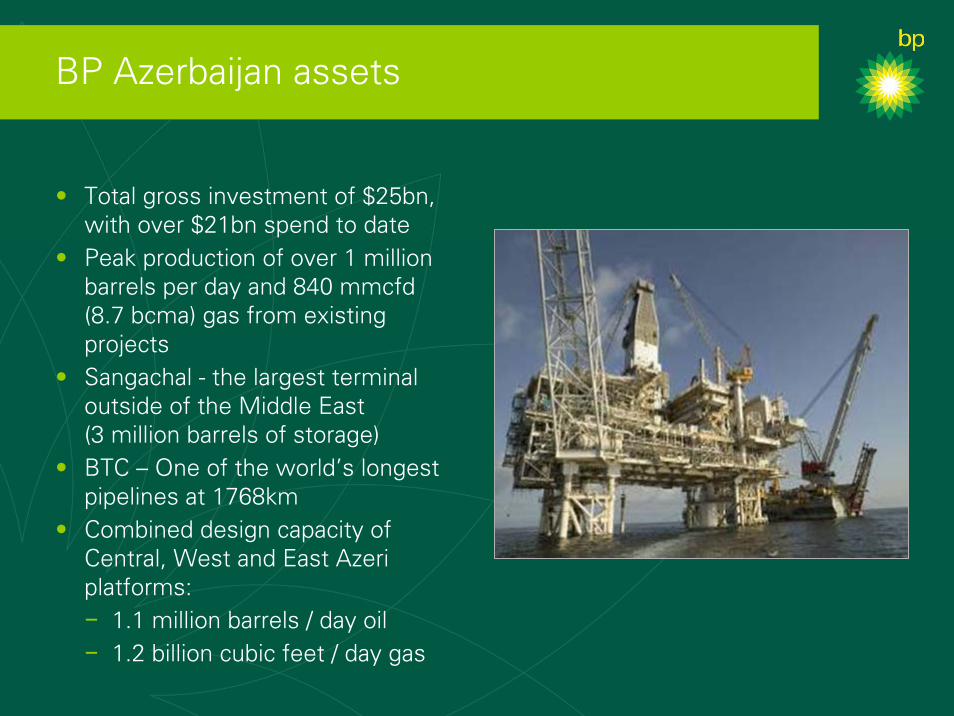
BP Azerbaijan assets
• Total gross investment of $25bn, with over $21bn spend to date
• Peak production of over 1 million barrels per day and 840 mmcfd (8.7 bcma) gas from existing projects
• Sangachal - the largest terminal outside of the Middle East (3 million barrels of storage)
• BTC – One of the world’s longest pipelines at 1768km
• Combined design capacity of Central, West and East Azeri platforms: − 1.1 million barrels / day oil − 1.2 billion cubic feet / day gas
Resources and Renewal
Paul ClyneVice President, Renewal

Resource base: Azerbaijan
Gross oil / gas resource potential
Non-proved
Sanctioned (incl. produced)
Exploration (risked)
1.1
5.4
2.2
3.1
4.5
0
1
2
3
4
5
6
7
8
9
ACG SD Exploration
Res
ou
rce
po
ten
tial
Bn
bo
e
Source: BP data (based on existing PSCs only)

BP Azerbaijan net resource progression 2001 - 2005
Non-proved
Proved
1.2
0.1 Produced
1.9
AdditionsCurrent PSC appraisal
and exploration
Start ‘01 resources
1.3
0.2
1.5
End ‘05 resources
2.0
1.3
3.3
*Totals in bn boeEnd ‘05 position based on UK SORP, non-proved BP data

Future potential
Potential gross oil + condensate production
0200400600800
1,0001,2001,4001,6001,800
2006 2009 2012 2015 2018 2021 2024 2027 2030
Oil
& c
on
den
sate
p
rod
uct
ion
(m
bd
)
PSC base production
Further develop existing PSCs
Further exploration & access
Potential gross gas production
2006 2009 2012 2015 2018 2021 2024 2027 20300123456789
Gas
pro
du
ctio
n (
bcf
d)
Forward projections: BP data

Major Projects Delivery (Offshore)
Bruce Luberski, Vice President, Major ProjectsMike Skitmore, Vice President, Shah Deniz

ACG field
ACG sanctioned resource 5.4 bn bbl
Peak production gross 1.2 mmbd
Capital cost gross $17 bn
BP working interest 34.1%
ACG gross production
Deepwater Gunashli
0
200
400
600
800
1000
1200
1400
2005 2008 2011 2014 2017 2020 2023
mb
d
Chirag
Azeri
Forward projections: BP data

BP Azerbaijan vision
The FutureSangachal
Chirag
East Azeri
Central Azeri
West Azeri
Shah Deniz 1
ACG Phase 32008
Inam Alov
Shah Deniz 2
End 2004
GROWTH Capital Spend 2004: $12m/ day
End 2006
Sangachal
Chirag l
Shah Deniz 1
Sangachal
West Azeri
ChiragCentral Azeri & C&WP
East Azeri2006
GROWTH Capital Spend 2006: $13m/day
Offshore: Chirag Chirag, CA/CWP, WA, SD,EA 8+ operating platforms + Projects
People: 4000 BP staff + agency >2000 BP staff3000 BP staff + agency
Infrastructure: ••
2 export pipelinesSangachal EOP Terminal
• 4 export pipelinesExpanded Sangachal Terminal•
• 4 export pipelinesOne of the biggest terminals in the world
•
Production:130 mbd
• 500 mbd Shah Deniz ramping up •
• 1 mmbd in 2009840 mmcfd in 2009•

Project schedule
1994 1995 1996 1997 1998 1999 2000 2001 2002 2003 2004 2005 2006 2007 2008 2009
Appraise Select Define Execute PSC signed / Sanction Operation
ACG PSC
Early Oil Project
Central Azeri & C&WP
West & East Azeri
ACG Phase 3 (DWG)
BTC
Shah Deniz PSC
Shah Deniz 1
First Oil WA
First Oil
First Gas to Turkey
Ceyhan Lifting
First Oil EA
First Oil C&WP Start-up
First Oil
First Oil WA
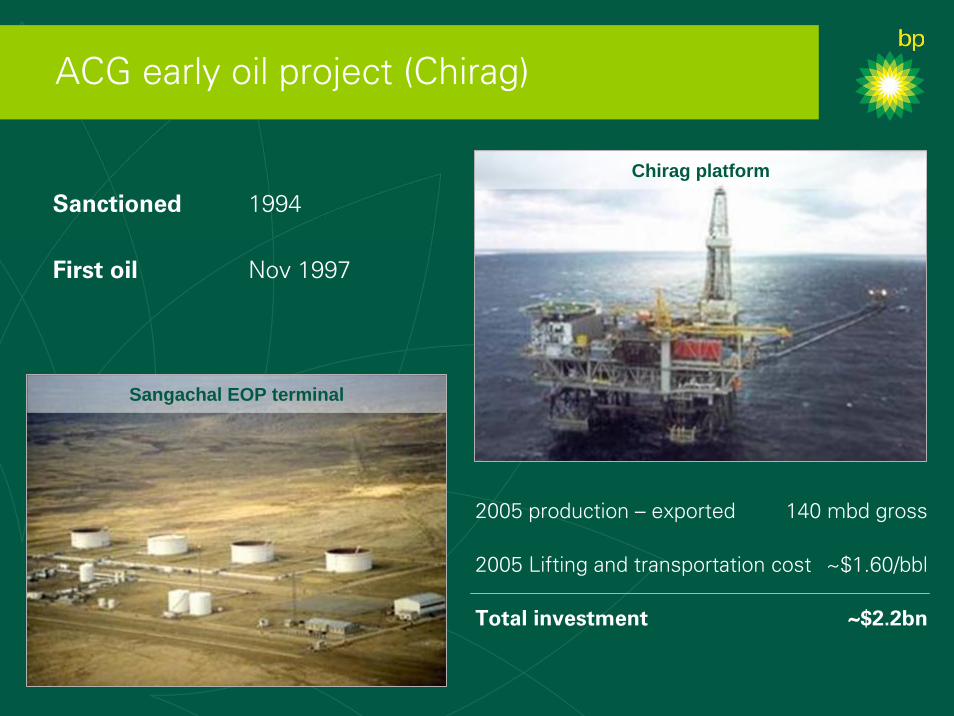
Chirag platform
Sangachal EOP terminal
ACG early oil project (Chirag)
Sanctioned 1994
First oil Nov 1997
2005 production – exported 140 mbd gross
2005 Lifting and transportation cost ~$1.60/bbl
Total investment ~$2.2bn

Sangachal Terminal
ACG full field development
Deepwater GunashliPhase 3
2008
ChiragEOP
Nov 1997
West AzeriPhase 2
Dec 2005
Central Azeri
Phase 1Mar 2005
East Azeri
Phase 24Q 2006
•••
90,000 te topsides90,000 te jackets1000 km offshore pipelines
••••
One of world’s largest terminals7 years of execute100 million man-hours to dateOver 3 million man-hours/month
•••
80% of man-hours in Azerbaijan20% across another 10 countriesNew Workforce - 8000 Azerbaijani

Sangachal history
Early Oil Project
2000

Sangachal history
Early Oil Project
2005
Shah Deniz

Projects production line
Production facilities engineering costs
Dir
ect
man
ho
urs
/te
CloneEA(15)CWP
(21)
CA(41)
WA(32)
Build duration
Mo
nth
s
30
28
27
26
25
CA
WA
29
EA

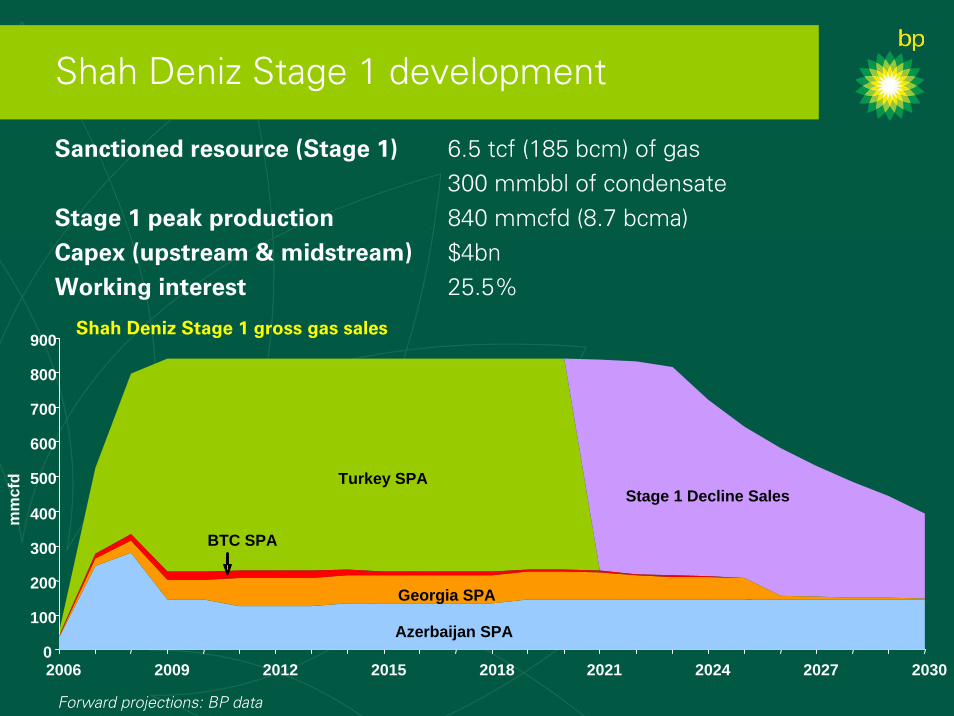
Shah Deniz Stage 1 development
Shah Deniz Stage 1 development
Sanctioned resource (Stage 1) 6.5 tcf (185 bcm) of gas 300 mmbbl of condensate
Stage 1 peak production 840 mmcfd (8.7 bcma) Capex (upstream & midstream) $4bnWorking interest 25.5%
BTC SPA
Turkey SPAStage 1 Decline Sales
0
100
200
300
400
500
600
700
800
900
2006 2009 2012 2015 2018 2021 2024 2027 2030
mm
cfd
Shah Deniz Stage 1 gross gas sales
Azerbaijan SPA
Georgia SPA
Forward projections: BP data
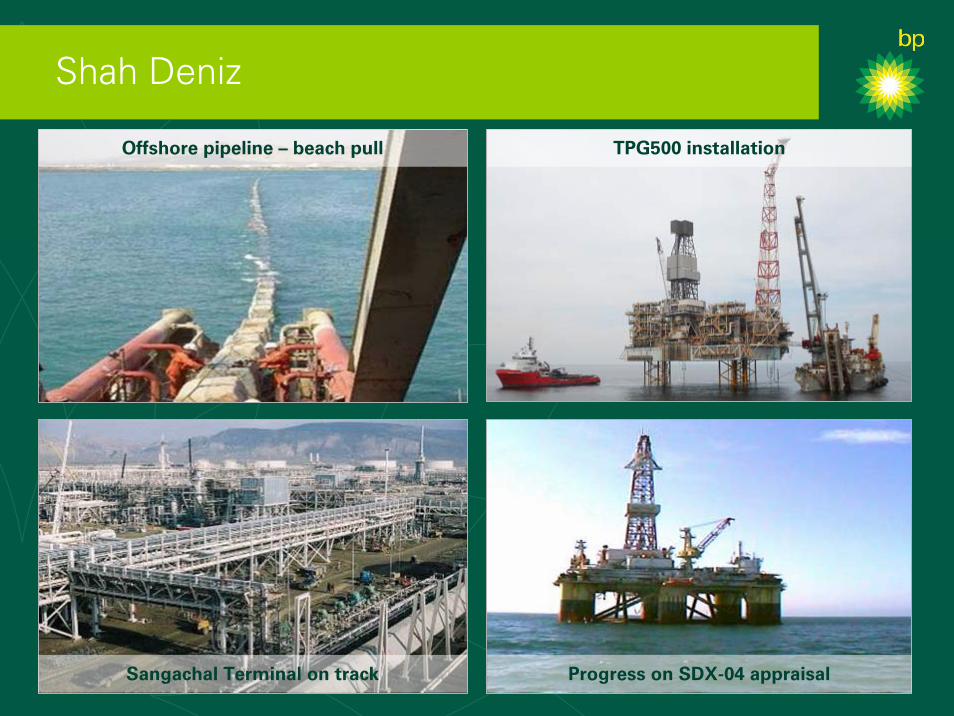
Shah Deniz
Sangachal Terminal on track
Offshore pipeline – beach pull
Progress on SDX-04 appraisal
TPG500 installation

Statecraft and Diplomacy:The Story of BTC
Michael TownshendFormer Vice President, Onshore Operations & Projects

Regional context
`
Kazakhstan
Russia
Turkey
SyriaIraq
Iran
CaspianSea
Armenia
Tu
rkmen
istan
Georgia
Ukraine
Bulgaria
Moldova
Black Sea
Mediterranean Sea
Bosphorus
Ceyhan
Istanbul
Supsa
Novorossiysk
Baku
Odessa
Constanta
Azerbaijan

The politics of welding
Golden Weld Azerbaijan /Georgia – Oct 04 1st Oil Azerbaijan – May 05
1st Oil Georgia – Oct 05 Golden Weld Azerbaijan /Georgia – Oct 04

Social
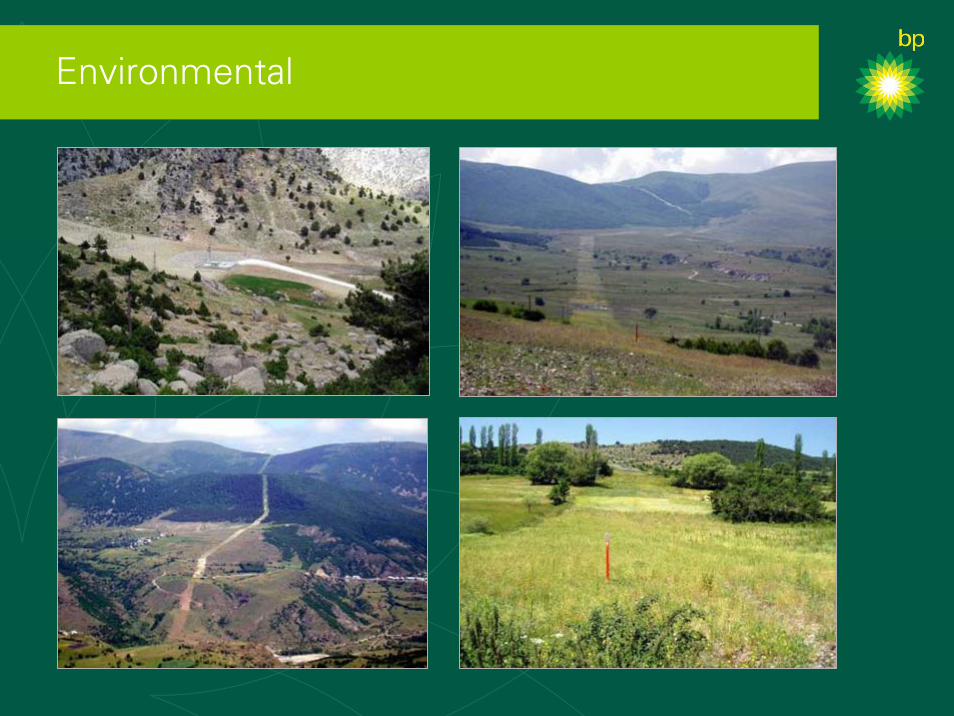
Environmental
Project financing and NGO scrutiny
Why external financing:
•
•
Ensured pipeline built to international standards
Provided political risk cover
Impacts of external financing:
•
•
•
Higher levels of NGO scrutiny
Significant media coverage
High standards set and audited by lenders
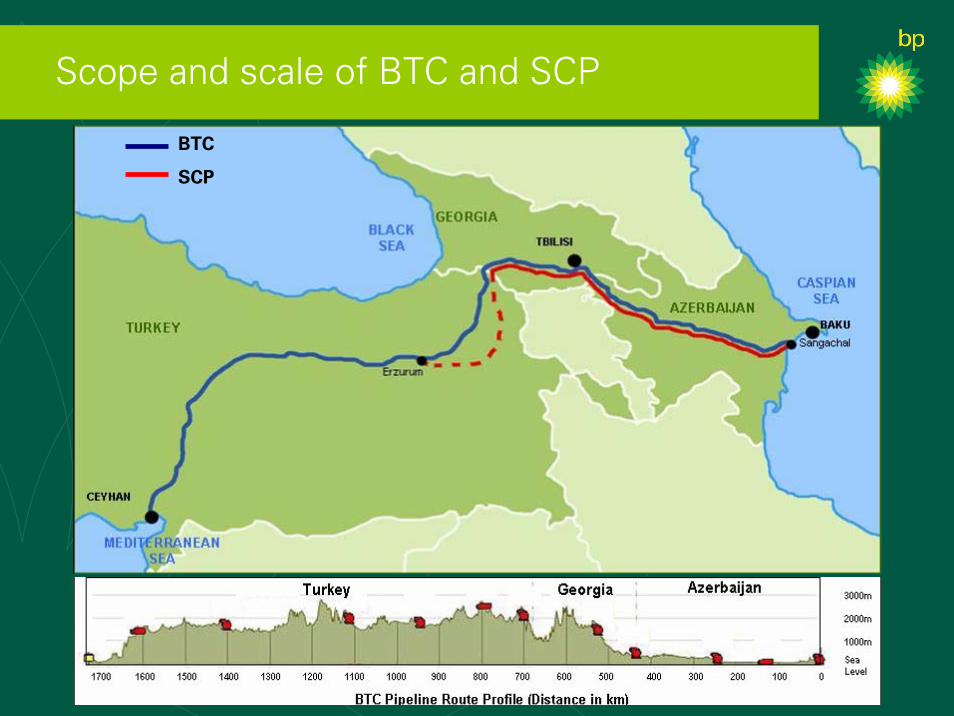
Scope and scale of BTC and SCP
BTC
SCP
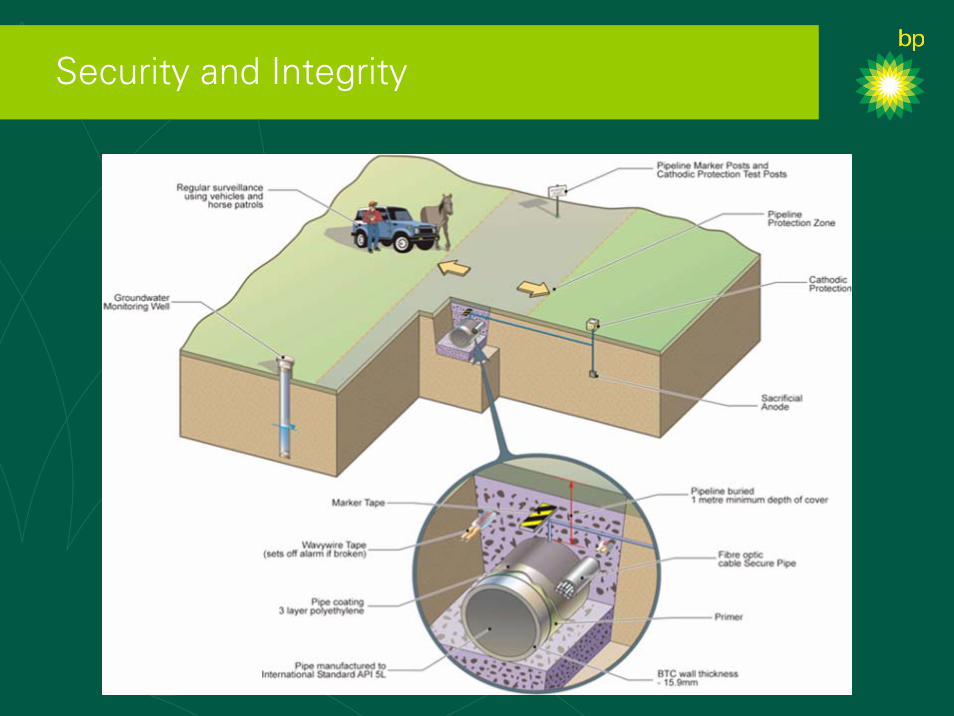
Security and Integrity

Unexploded ordinance on right of way
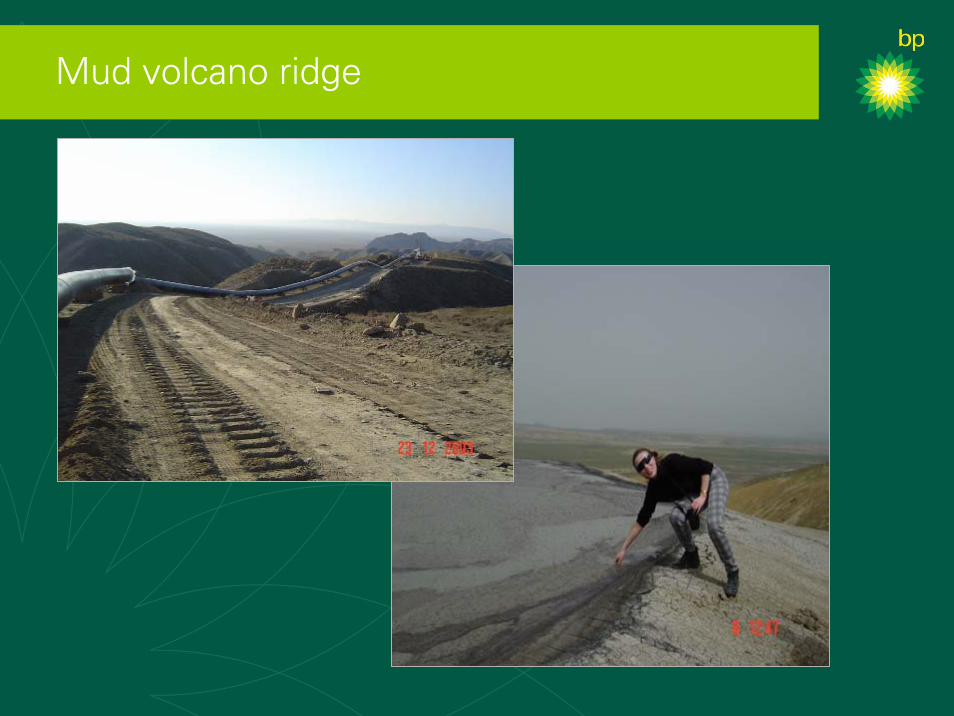
Mud volcano ridge

Digging for the pipe & block valve station
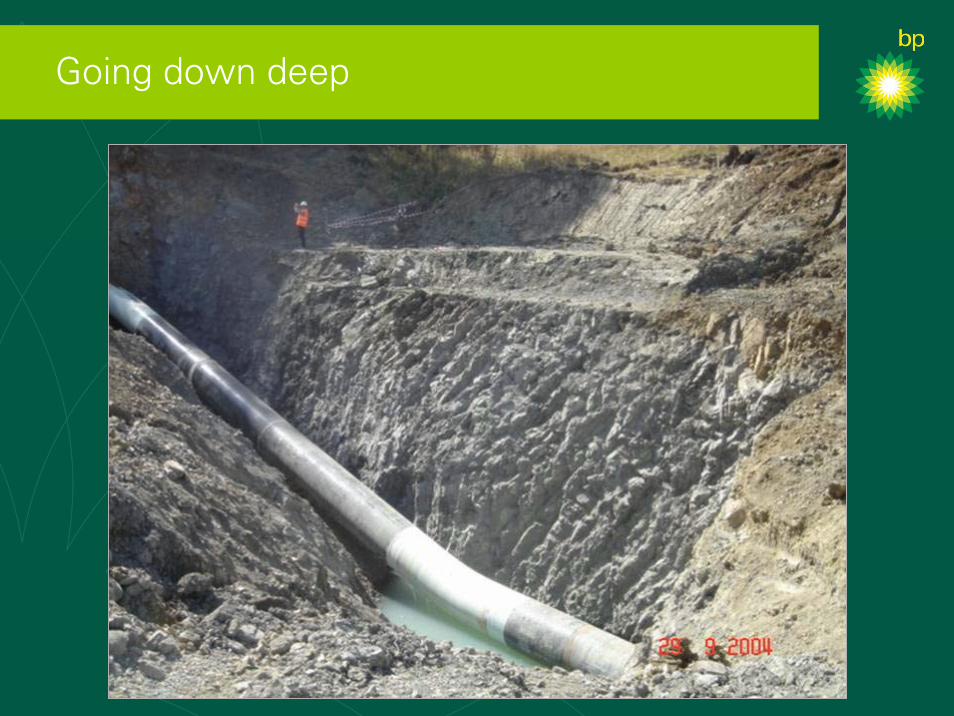
Going down deep
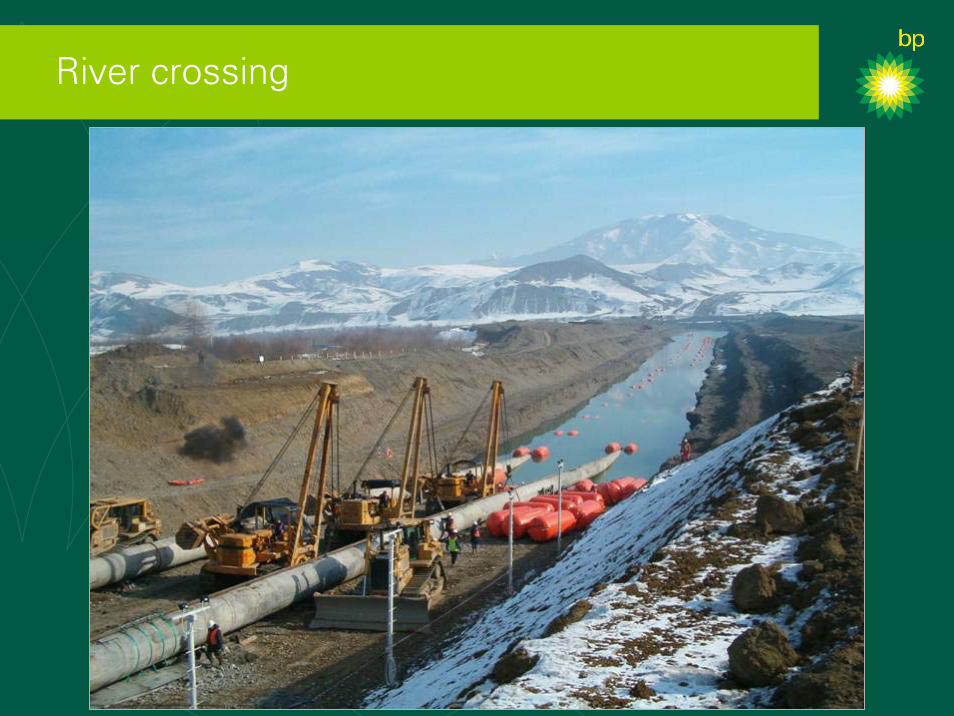
River crossing

Ridgeline construction – Turkey (and China)

Rock removal

Trench breakers and broken bones
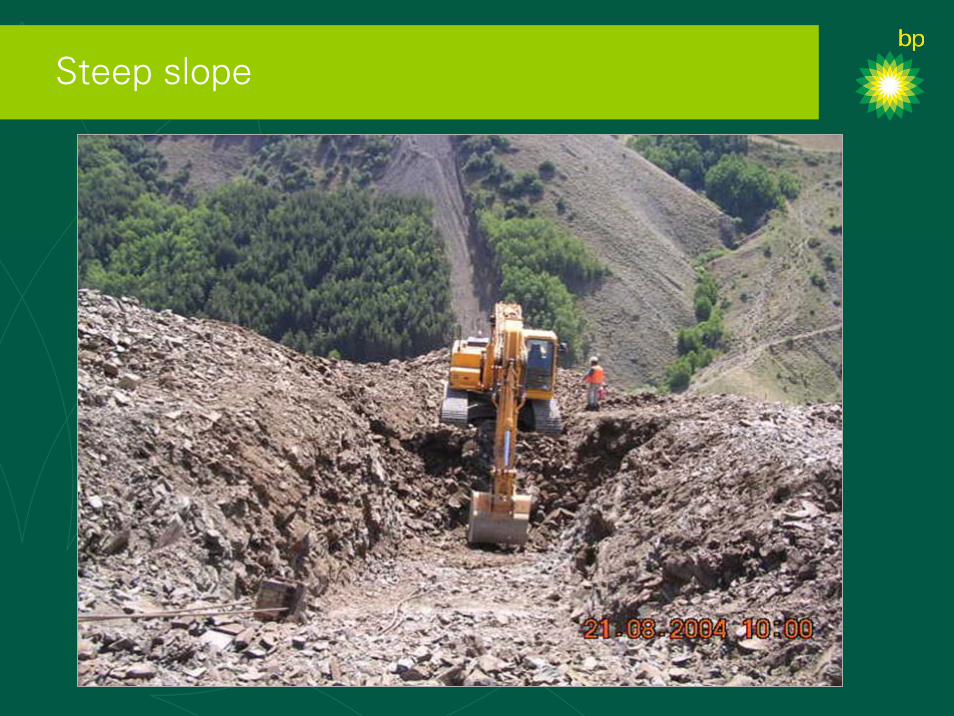
Steep slope

Moving down

Nearly there…

The end in sight
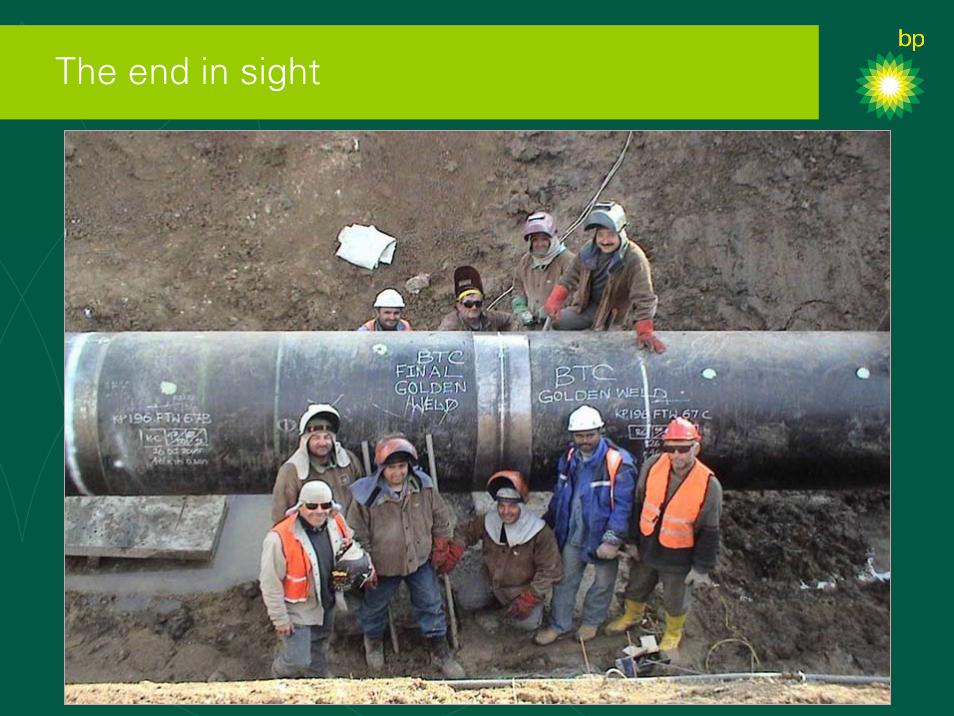
The end in sight
Value through Technology
Fereidoun AbbassianTechnical Director
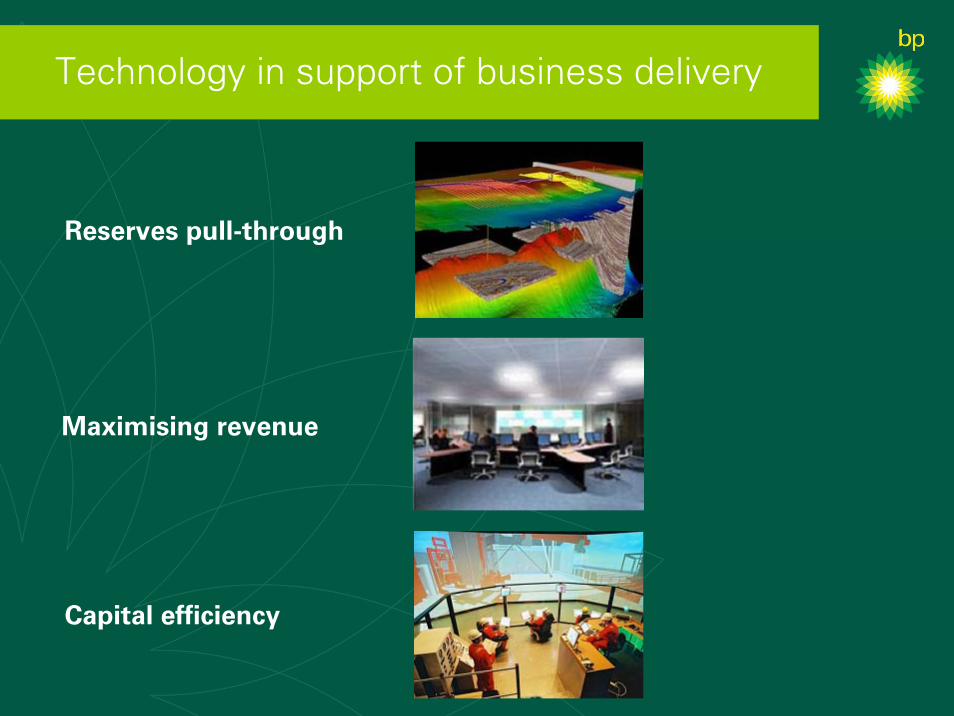
Technology in support of business delivery
Reserves pull-through
Maximising revenue
Capital efficiency
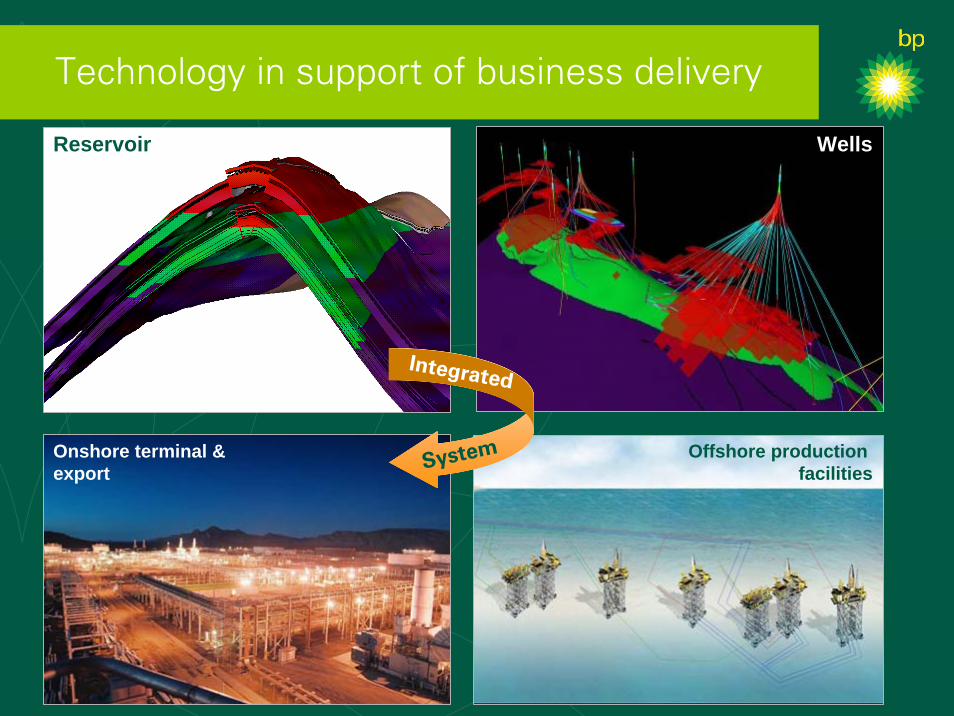
Technology in support of business delivery
Reservoir Wells
Onshore terminal &export
Offshore production facilities
Integrated
System
3500m
2000 -6000m
200-600 m
West Azeri Platform
Central Azeri Platform
Azeri reservoir structure
Well Trajectories3500m
2000 -6000m
200-600 m
West Azeri Platform
Central Azeri Platform
Azeri reservoir structure
Well Trajectories
Open hole gravel pack
Chirag 1 Platform ~ Well Profiles
A09zA06y
A12xA20 (plan)
A19 (plan)A18
A16 T3
A17 T2
A14zA09
A07
A11
A15z
A06
A08A10
A13
A05A12
A02A03
A04
0
500
1,000
1,500
2,000
2,500
3,000
3,500
4,0000 500 1,000 1,500 2,000 2,500 3,000 3,500 4,000 4,500 5,000 5,500 6,000 6,500 7,000 7,500 8,000
Equivalent Departure (m)
TVD
BR
T (m
)
Conventional Well (Drilled)Conventional Well (Planned)ERD Well (Drilled)ERD Well (Planned)
ERD WellConventional Well
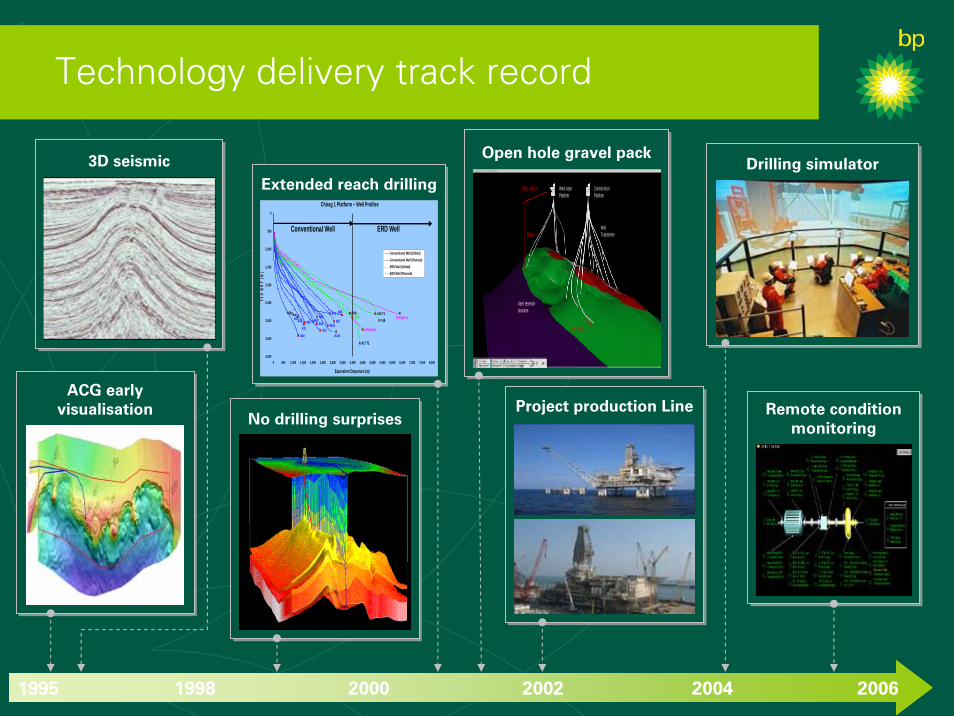
Extended reach drilling
ACG early visualisation
No drilling surprisesRemote condition
monitoring
Drilling simulator
Project production Line
1995 20061998 2000 2002 2004
3D seismic
Technology delivery track record

’’
Pereriv A
Pereriv B
Pereriv C
Pereriv D
Pereriv E
Water
Intelligent completions
Field of the Future™
ACE
Zonal flow monitoring
Zone ‘A’ Flow
Zone ‘B’ Flow
Zone ‘C’ Flow
Advanced seismic
Strategic technologies
Technology drivers
•
•
•
•
Reservoir management
New well delivery
D&C performance
Operating efficiency

Advanced seismic
Aim
• Monitor fluid movements inthe reservoir
BP’s position
• Technology leadership area
• Industry leader in 4-D life-of-field monitoring
Ocean bottom cable 4D seismic

Azeri reservoir management
CARSP: Phase 1Gas Cap
Water
OilDeep Water
Gunashli
Chirag Azeri
Depletion simulation for the Central Azeri
Water
Gas
Oil

’’
Down hole flow control valve
Expandable screen Pereriv A
Pereriv B
Pereriv C
Pereriv D
Pereriv E
Water
Intelligent completions
Aim
• Increased production with fewer wells
BP’s position
• Azerbaijan is leading BP and the Industry
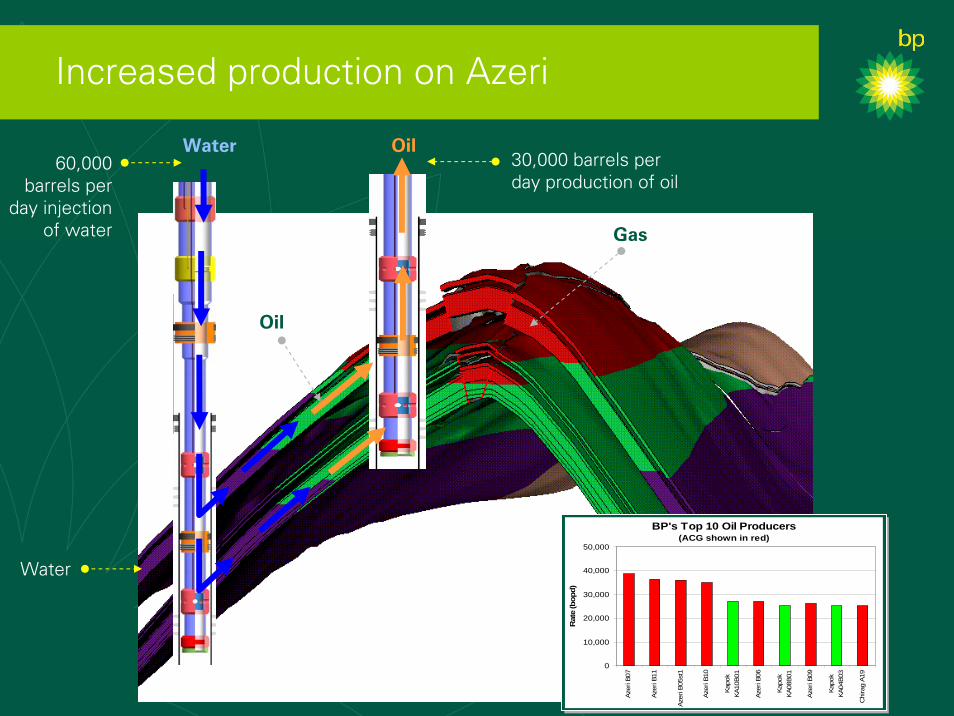
Increased production on Azeri
Expandable Sand Screen
30,000 barrels per day production of oil
60,000 barrels per
day injection of water
Water Oil
Water
Oil
BP's Top 10 Oil Producers(ACG shown in red)
0
10,000
20,000
30,000
40,000
50,000
Azer
i B07
Azer
i B11
Azer
i B05
st1
Azer
i B10
Kapo
kKA
10B0
1
Azer
i B06
Kapo
kKA
08B0
1
Azer
i B09
Kapo
kKA
04B0
3
Chi
rag
A19
Rat
e (b
opd)
Gas

Zonal flow monitoring
Aim
• Real time monitoring of reservoir flow
BP’s position
• World leader in development and implementation of technology
Fibre-optic sensor technology
Time
Temperature
Dep
th
Real-time temperature data from Central Azeri well B04
Zone ‘A’ flow
Zone ‘B’ flow
Zone ‘C’ flow

Field of the Future TM
Cross discipline
collaboration
Monitoring real time data
Analysis/modeling
Offshore productionfacilities
Onshore terminals & exports
Wells
Reservoirs
Integration
Advanced CollaborationEnvironment
Decision making/people

BP’s Distinctive Caspian Presence
Rashid JavanshirVice President, Onshore Operations

Workforce capability
Professional Roles
ExpatsNational
2500
2000
1500
1000
500
02006 2007 2008 2009 2010
Forward projections: BP data
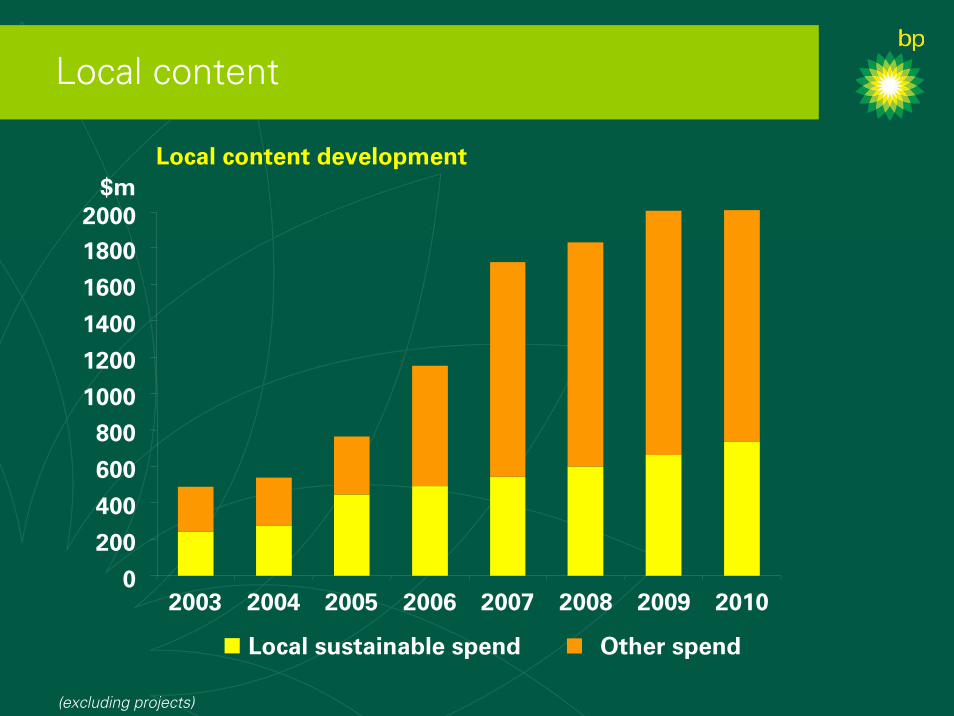
Local content
Other spend
$mLocal content development
Local sustainable spend
0
200
400
600
800
1000
1200
1400
1600
1800
2003 2004 2005 2006 2007 2008 2009 2010
2000
(excluding projects)
Capacity building

Commercial Structure &Financial Performance
Phil HomeCommercial Director

PSC terms – General principles
Duration• Exploration phase normally three years
with 2-3 well commitment• 25 year development phase with a five
year negotiable extension
Costs• FOCs (Foreign Oil Companies) pay all
costs, recovered as “cost oil”• Financing cost charged on unrecovered
Capex & Opex balances carried forward (e.g. @ LIBOR+4% in ACG PSC)
Production• “Profit oil” is shared between FOCs and
Azerbaijan State according to profit sharing mechanism [based on either RROR (Real rate of return) or R-factor]
• Unutilised associated gas is delivered at no cost to the State
Accounting & Fiscal• Accounting is in US Dollars• Azerbaijan profits tax rate is fixed for
duration of PSCs• No customs duty & VAT paid by FOCs
and contractors• PSCs contain Economic Stability clauses
Standards• PSCs apply international standards• Environmental and Social Impact
Assessments required for all projects
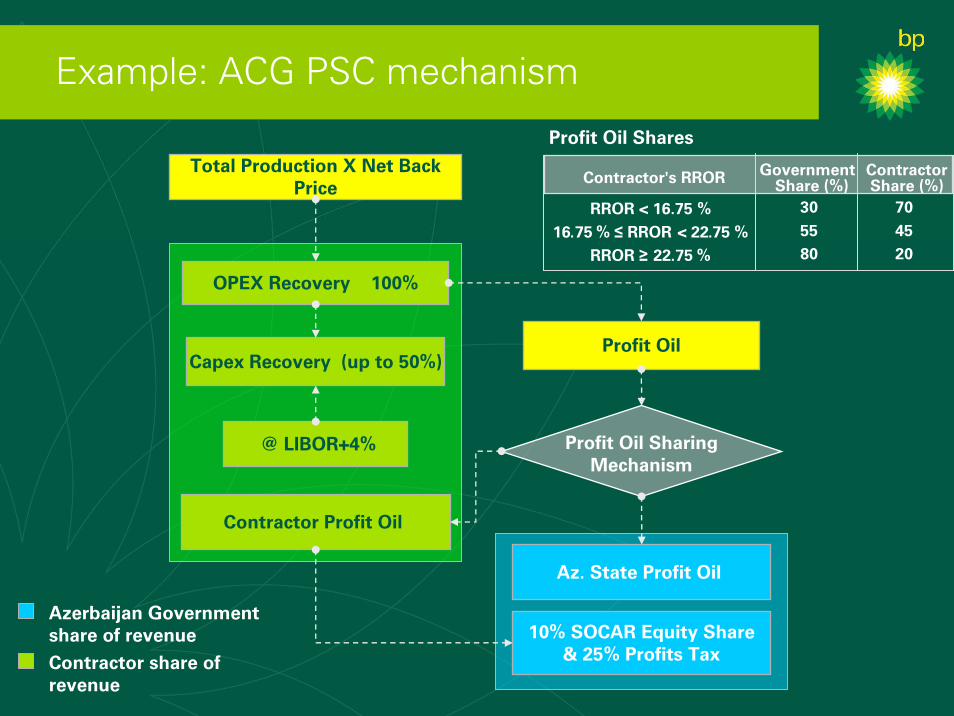
Example: ACG PSC mechanism
Total Production X Net Back Price
Profit Oil
@ LIBOR+4% Profit Oil SharingMechanism
Contractor Profit Oil
Az. State Profit Oil
10% SOCAR Equity Share& 25% Profits Tax
OPEX Recovery 100%
Capex Recovery (up to 50%)
Profit Oil Shares
Azerbaijan Government share of revenue
Contractor's RROR Government Share (%)
Contractor Share (%)
RROR < 16.75 % 30 70
16.75 % ≤ RROR < 22.75 % 55 45
RROR ≥ 22.75 % 80 20
Contractor share of revenue

Indicative price sensitivity: ACG
Gross production @ $25/bbl
FOC Profit Oil Share
Cost Oil
FOC Profit Oil
0
200
400
600
800
1000
1200
1400
1998 2001 2004 2007 2010 2013 2016 2019 2022
mb
d
0%
10%
20%
30%
40%
50%
60%
70%
80%
Az GovtProfit Oil
FOC Profit Oil
Cost Oil
Gross production @ $60/bbl
FOC Profit Oil Share
Cost Oil
FOC Profit Oil
0
200
400
600
800
1000
1200
1400
1998 2001 2004 2007 2010 2013 2016 2019 2022
mb
d
0%
10%
20%
30%
40%
50%
60%
70%
80%
Az GovtProfit Oil
FOC Profit Oil
Cost Oil
Source: BP data – indicative data based on current assumptions (currently sanctioned projects only)
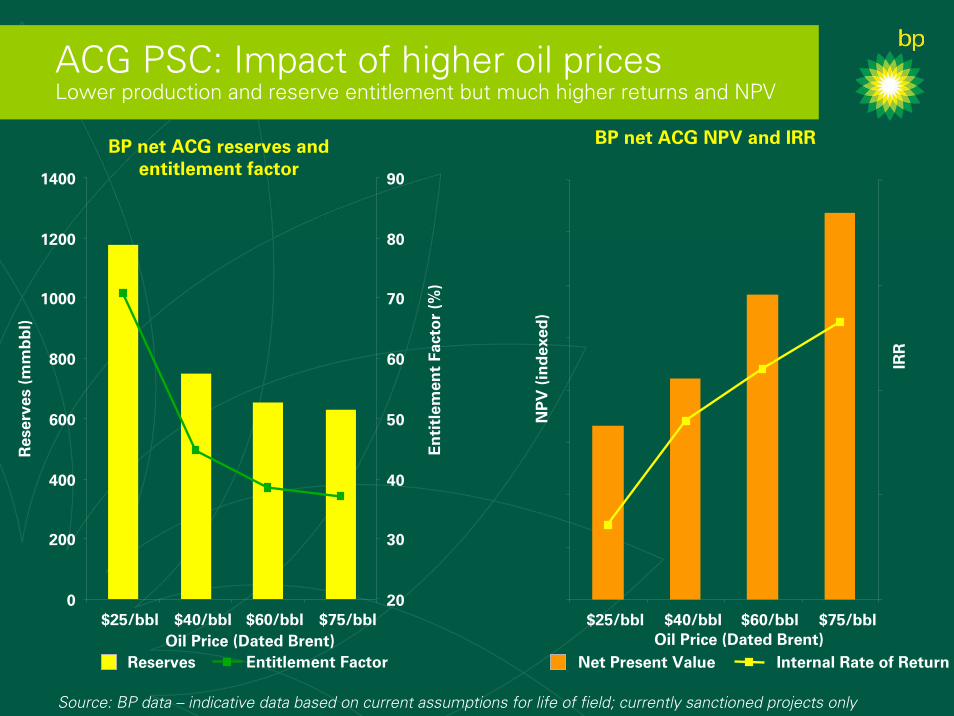
ACG PSC: Impact of higher oil pricesLower production and reserve entitlement but much higher returns and NPV
BP net ACG reserves and entitlement factor
$25/bbl $40/bbl $60/bbl $75/bblOil Price (Dated Brent)
Reserves Entitlement Factor
0
200
400
600
800
1000
1200
1400
Res
erve
s (m
mb
bl)
20
30
40
50
60
70
80
90
En
titl
emen
t Fa
cto
r (%
)
BP net ACG NPV and IRR
$25/bbl $40/bbl $60/bbl $75/bblOil Price (Dated Brent)
NP
V (
ind
exed
)
Net Present Value Internal Rate of Return
IRR
Source: BP data – indicative data based on current assumptions for life of field; currently sanctioned projects only

BP Azerbaijan net production
BP net production
@ $40/bbl @ $60/bbl
Production profiles include sanctioned developments only: Chirag, Central Azeri, West Azeri, East Azeri, Deep-Water Gunashli (DWG) and DWG East manifold in ACG, and Shah Deniz Stage 1
0
100
200
300
400
500
2005 2006 2007 2008 2009 2010
mbo
ed
Forward projections: BP data
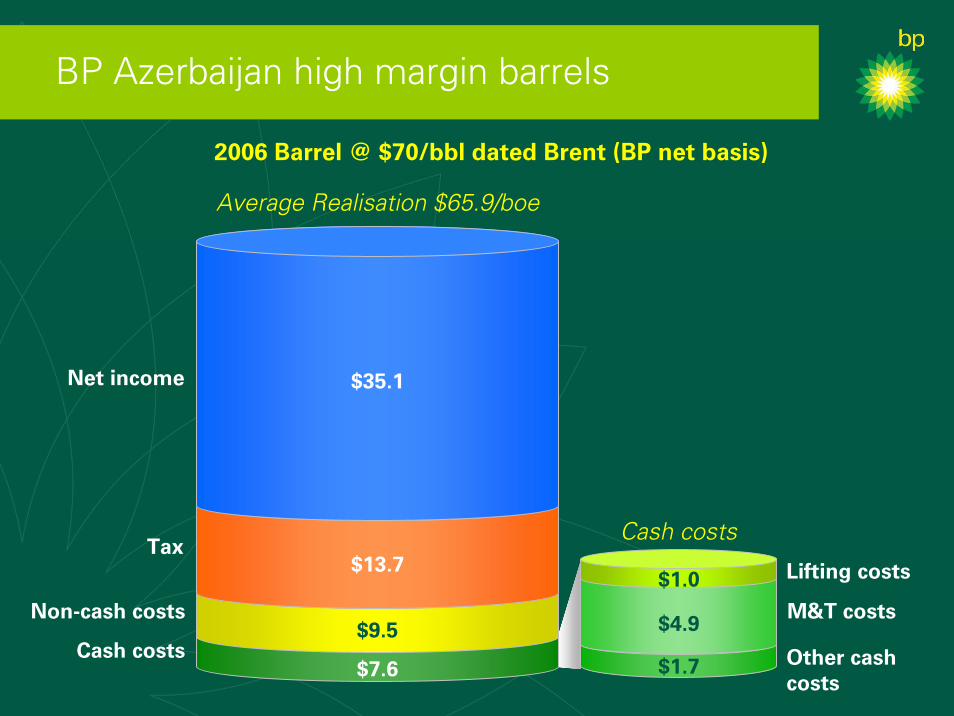
BP Azerbaijan high margin barrels
2006 Barrel @ $70/bbl dated Brent (BP net basis)
Net income
Tax
Non-cash costs
Cash costs$7.6
$9.5
$13.7
$35.1
Average Realisation $65.9/boe
$1.7
$4.9
$1.0 Lifting costs
M&T costs
Other cash costs
Cash costs


![[Waterworks] City Presentation - Baku(Azerbaijan)](https://static.fdocuments.us/doc/165x107/55862594d8b42a4c578b4632/waterworks-city-presentation-bakuazerbaijan.jpg)