AZEEZ, Nurudeen Oyebamiji PG/M.SC/09/54079 WORKING …...PG/M.SC/09/54079 WORKING CAPITAL MANAGEMENT...
112
1 AZEEZ, Nurudeen Oyebamiji PG/M.SC/09/54079 WORKING CAPITAL MANAGEMENT AND FIRMS PERFORMANCE: A STUDY OF MANUFACTURING COMPANIES IN NIGERIA FACULTY OF BUSINESS ADMINISTRATION DEPARTMENT OF ACCOUNTANCY Azuka Ijomah Digitally Signed by: Content manager’s Name DN : CN = Webmaster’s name O= University of Nigeria, Nsukka OU = Innovation Centre
Transcript of AZEEZ, Nurudeen Oyebamiji PG/M.SC/09/54079 WORKING …...PG/M.SC/09/54079 WORKING CAPITAL MANAGEMENT...

1
AZEEZ, Nurudeen Oyebamiji
PG/M.SC/09/54079
WORKING CAPITAL MANAGEMENT AND
FIRMS PERFORMANCE: A STUDY OF
MANUFACTURING COMPANIES IN NIGERIA
FACULTY OF BUSINESS ADMINISTRATION
DEPARTMENT OF ACCOUNTANCY
Azuka Ijomah
Digitally Signed by: Content manager’s Name
DN : CN = Webmaster’s name
O= University of Nigeria, Nsukka
OU = Innovation Centre

2
WORKING CAPITAL MANAGEMENT AND FIRMS PERFORMANCE: A
STUDY OF MANUFACTURING COMPANIES IN NIGERIA
BY
AZEEZ, Nurudeen Oyebamiji
PG/M.SC/09/54079

3
DEPARTMENT OF ACCOUNTANCY,
FACULTY OF BUSINESS ADMINISTRATION,
UNIVERSITY OF NIGERIA, ENUGU CAMPUS
AUGUST, 2015
WORKING CAPITAL MANAGEMENT AND FIRMS PERFORMANCE.
A STUDY OF MANUFACTURING COMPANIES IN NIGERIA.
4
AZEEZ, Nurudeen Oyebamiji
PG/M.SC/09/54079
BEING A DISSERTATION PRESENTED TO THE DEPARTMENT OF
ACCOUNTANCY, FACULTY OF BUSINESS ADMINISTRATION
UNIVERSITY OF NIGERIA, ENUGU CAMPUS.
IN PARTIAL FULFILMENT OF THE AWARD OF MASTERS OF SCIENCE IN
ACCOUNTANCY
SUPERVISOR: PROFESSOR (MRS.) UCHE MODUM
AUGUST, 2015

5
DECLARATION
This is to certify that this dissertation is an original work written by AZEEZ
NURUDEEN OYEBAMIJI Registration number: PG/MSc/09/54079. The
dissertation was submitted in partial fulfillment for the award of MSc in
Accounting in the department of Accountancy, University of Nigeria, Enugu
Campus and has not been submitted in part or full for any other diploma or degree
of this or any other University.
-------------------------------------------------------------------
AZEEZ, Nurudeen Oyebamiyi
PG/M.Sc/09/54079

6
APPROVAL PAGE
This is to certify that AZEEZ, Nurudeen Oyebamiji , a post graduate student in the
department of accountancy, faculty of Business administration, university of
Nigeria Enugu Campus (UNEC) with Registration Number PG/M.SC/09/54079,
has satisfactorily completed the requirements of Dissertation research in partial
fulfillment of the award of M.sc in accountancy of the University of Nigeria.
---------------------------- ---------------------------
Prof (Mrs.) Uche Modum Date
Supervisor
--------------------------- ---------------------------
Osita Aguolu (Reader) Date
(Head of Department)

7
DEDICATION
This work is dedicated to Allah (SWT) for His infinite mercies and grace.

8
ACKNOWLEDGEMENTS
I wish to express my profound gratitude to God almighty for His providence,
guidance and divine provision in making this educational sojourn a reality. To Him
be the glory.
I sincerely acknowledge the efforts of my supervisor, Prof (Mrs) Uche Modum for
her patience, advice, suggestions and constructive criticism which has not only led
to the completion of this work but has also improved my knowledge in research.
My appreciation goes to my uncle; engineer T.A Shittu for his immense
contribution towards my educational career. To my elder sister Mrs Kazeem Seidat
I. for her encouragement. To my friends and colleagues Mr Iorpev Luper of Benue
State University, Makurdi, Benjamin Yio and others for their support, I say many
thanks to you all.
Finally, I wish to acknowledge my dearest wife Hajia Azeez Dolapo Omowumi for
her steadfastness, support and prayers in making this struggle a success.
May God bless you all (Amen).

9
ABSTRACT
This study investigated the relationship between working capital management
measured by account receivable period (ACRP), inventory period (INVP), cash
conversion cycle (CCC) and sales Growth (SG) and profitability performance
measured by returns on assets (ROA). The study utilized secondary data obtained
from the annual financial statements of Nigerian Manufacturing companies listed
on the Nigerian Stock Exchange (NSE) for period 2008 – 2012. Multiple
regression model were adopted for testing all the hypotheses and the study result
reveals that there was a negative significant relationship between the account
receivable period and profitability of the Nigerian Manufacturing companies. It
also reveals that the profit is significantly influenced by the number of days
inventory were held (INVP) and that the profitability performance negatively and
significantly related to the cash conversion cycle (CCC). These results suggest that
effective policies must be formulated for the individual components of working
capital. Furthermore, efficient management and financing of working capital
(current assets and liabilities) can increase the operating profitability of
manufacturing firms
10
TABLE OF CONTENTS
Content Page
Title page - - - - - - - - - - i
Declaration - - - - - - - - - - ii
Approval - - - - - - - - - - iii
Dedication - - - - - - - - - - iv
Acknowledgements - - - - - - - - - v
Abstract - - - - - - - - - - vi
List of tables - - - - - - - - - xi
List of figure - - - - - - - - - xi
CHAPTER ONE : INTRODUCTION
1.1 Background to the Study - - - - - - 1
1.2 Statement of the Problem - - - - - - - 3
1.3. Objectives of the Study - - - - - - - 4
1.4 Research Questions - - - - - - - - 5
1.5 Research Hypotheses - - - - - - - 5
1.6 Scope of the Study - - - - - - - 6
1.7 Significance of the Study - - - - - - - 7
References - - - - - - - - - 8
CHAPTER TWO: REVIEW OF LITERATURE
2.0. Introduction - - - - - - - - 10
2.1. Conceptual Review - - - - - - - 10
2.1.0. Concepts of Working Capital Management - - - - 10

11
2.1.1. Working Capital - - - - - - - - 10
2.1.2. Working Capital Management - - - - - - 12
2.1.3 Working Capital Management Efficiency - - - - - 13
2.1.4. Policy of Working Capital - - - - - - - 13
2.1.5. Working Capital Cycle - - - - -- - - 16
2.1.6. Components of Working Capital Management (WCM) - - - 18
2.1.7. Cash Management - - - - - - - - 19
2.1.8 Cash Positioning - - - -- - - - - 22
2.1.9 Cash Flow Volatility, Earnings Volatility and Firm Value. - - 23
2.1.10 Cash Budget - - - - - - - - - 25
2.1.11. Management of Cash Receivables - - - - - 26
2.1.12. Credit Standards - - - - - - - - 26
2.1.13. Credit Extension Policy - - - - - - - 27
2.1.14. Credit Collection Policy - - - - - - - 28
2.1.15. Inventory (Inv) Management - - - - - - 29
2.1.16. Need to Hold Inventory - - - - - - - 30
2.1.17 Inventory Control - - - - - - - - 31
2.1.18. The Economic Order Quantity (EOQ) - - - - - 31
2.1.19. Re-Order Point - - - - - - - - 32
2.1.20. Relation to Financial Management - - - - - 32
2.1.20.1. Payables Management - - - - - - - 33
2.1.21. Receivables Management - - - - - - - 33
2.1.22. Cash Conversion Cycle (CCC) Management - - - - 34

12
2.1.23. Measures of Profitability - - - - - - - 34
2.1.24. Liquidity - - - - - - - - - 36
2.1.25. Nature of Working Capital - - - -- - - - 37
2.1.26. Trade-Off between Profitability and Risk - - - - 37
2.1.27. The Efficient Management of Firm’s Working Capital - - 38
2.1.29 . The Consequences of Inefficient Management of Working Capital 39
2.1.30. The Costs and Benefits of Firm’s Investments in Working Capital - 44
2.1.31. The Nigerian Economy and Working Capital Management of Quoted
Firms in Nigeria =- - - - - - - - 46
2.20. Theoretical Review - - - - - - - - 47
2.2.1. The Operating Cycle Theory - - - - - - 48
2.2.2. The Cash Conversion Cycle (CCC) Theory - - - - 48
2.2.3. The Pecking Order Theory - - - - - - - 49
2.2.4 Agency Theory - - -- - - - - - 50
2.2.5. The Risk –Return Trade-Off Theory - - - - - 51
2.3.0. Review of Empirical Studies - - - - - - 51
2.3.1. Summary of Literature Review - - - - - 57
References - - - - - - - - - - 58
CHAPTER THREE: METHODOLOGY
3.0 Introduction - - - - - - - - - 60
3.1 Research Design - - - - - - - - 60
3.2 Population of the Study - - - - - - - 61
3.3 Sampling Techniques and Sample Size - - - - - 61

13
3.4 Sources of Data Collection - - - - - - - 61
3.5 Variables Used for the Study - - - - - - 62
3.5.1 Dependent Variable - - - - - - - - 62
2.5.2 Independent Variables - - - - - - - 63
3.6 Data Analysis Techniques - - - - - - - 65
3.7 Model Specification - - - - - - - 66
3.8 Limitation of the Study - - - - - - - 66
References - - - - - - - - - 68
CHAPTER FOUR: DATA PRESENTATION, ANALYSIS AND
INTERPRETATION
4.0 Introduction - - - - - - - - 69
4.1. Presentation and Analysis of Multiple Regression Results - - 70
4.2. Data Validity Test - - - - - - - - 71
4.3. Summary of Regression Results - - - - - 72
4.4. Testing of Research Hypotheses - - - - - 73
4.5. Interpretation of results and discussion of findings - - - 75
4.5.1. The Impact of ACRP on Profitability - - - - 75
4.5.2. The Impact of Inventory Period (INVP) on Profitability - - - 75
4.5.3. The Impact of Cash Conversion Cycle (CCC) on Profitability - 76
4.5.4. The Impact of Sales Growth (SG) on Profitability - - - 76
CHAPTER FIVE: SUMMARY, CONCLUSIONS AND RECOMMENDATIONS
5.1. Introduction - - - - - - - - 78
5.2. Summary - - - - - - - - - 78
5.3. Conclusions - - - - - - - - - 80
5.3.1 Policy Implication - - - - - - - - 81
5.4. Recommendations - - - - - - - - 81
5.5. Suggestions for Further Research - - - - - - 82

14
Bibliography - - - - - - - - - 83
Appendices - - - - - - - - 86

15
LIST OF TABLES
3.1.1.1 Table 1: Measurement of variables and Abbreviation - - 65
Table 1: Regression results showing Data Estimate effects of WCM on ROA 70
Table 2: Summary of Regression Results for the Study Model - - 72

16
LIST OF FIGURES
Fig. 2.1 Working Capital Cycle: Source from JPMorgan (2003)
Fleming International Cash Management Survey in
conjunction with the ACT - - - - - - 17
17
CHAPTER ONE
INTRODUCTION
1.1 Background To The Study
Working Capital management of a firm, which deals with the management of
current assets and current liabilities, has been recognized as an important area in
financial management. Working capital (WC) refers to the firm’s investment in
short-term assets. Pandey, (2005) classified working capital into gross and net
concepts. He defined gross working capital as the firm’s investment in current
assets. Current assets are the assets which can be converted into cash within an
accounting year and these include; cash, short-term securities, debtors, bills
receivables and stocks. He described net working capital as the difference between
current assets and current liabilities. Current liabilities are those claims of
outsiders, which are expected to mature for payment within an accounting year.
These include trade creditors, bills payable, bank overdraft and short- term loan.
Home van, (2000) described working capital management as involving the
administration of these assets namely cash, marketable securities, receivables and
inventories and the administration of current liabilities.
Management of these short-term assets and liabilities is important to the financial
health of business of all sizes. This importance is hinged on the fact that the
amounts invested in working capital are often high in proportion to the total assets
employed and therefore warrants a careful investigation (Smith, 1980). Working
Capital therefore, should neither be more nor less, but just adequate for the smooth
running of a firm. While excess amount of working capital results in the reduction
of firm’s profitability, holding of inadequate amount of it leads to lower levels of
the firm’s liquidity and stock outs resulting in difficulties in maintaining smooth
operation (Krueger, 2002).

18
Business success, therefore, heavily depends on the ability of the financial
managers to effectively manage accounts receivable, inventory and account
payable (which are component of working capital) (Filbeck and Krueger, 2005).
Firm can reduce their financing costs and or increase the funds available for
expansion of project by minimizing the amount of investment tied up in current
assets (Home Van Wachowicz, 2004). For this reasons, most of the financial
manager’s time and efforts are spent in identifying the non-optimal levels of
current assets and liabilities and bringing them to optimal levels (Lamberson,
1995). An optimal level of working capital is the one in which a balance is
achieved between risk and efficiency. To maintain the optimal level of various
components of working capital, continuous monitoring is required (Afza and
Nazir, 2009).
A poor or inefficient working capital management leads to tie up funds in idle
assets and reduces the liquidity and profitability of a company (Reddy &
Kameswar, 2004). Siddart & Das (1993), states that the major reason for slow
progress of an undertaking is shortage or wrong management of working capital.
Deloot (2003: 573), states that “there is a significant relationship between gross
operating income and number of days of account receivable, inventories and
accounts payables”. The relationship between accounts payable and profitability is
consistent with the view that less profitable firms wait longer to pay their bills.
Considering the importance of Working Capital Management therefore, the
researcher focused on evaluating the Working Capital Management and
profitability relationship like other similar works such as Uyar, 2009; Samiloglu
and Demirgune 2008; Vishnani and Shah, 2007; Tervel and Solano, 2007;
Lazaridis and Tryfonidis, 2006; Padachi, 2006; Shin and Soenen, 1998; Smith et
al, 1997 and Jose et al, 1996. However, there are a few studies with reference to

19
Nigeria in respect of the subject. Like Akinsulire, 2005, Falope,, 2009, Ajilore,,
2009 etc.
Most of these studies focused on the Working Capital Management financing
policies. Shah and Sana (2006) concentrated on the oil and gas sector and
estimated the relationship using small sample of 7 firms. Raheman and Masr
(2007) analyzed profitability and Working Capital Management performance of
94 firms listed on Karachi Stock Exchange for the period 1999-2004 by using
ordinary least square and generalized least square. However, this study ignored the
fixed effect of each firm as each firm has its unique characteristics and also
ignores sector-wise analysis of Working Capital Management performance of
manufacturing firms. Insufficient evidences on the firm’s performance and
Working Capital management with reference to Nigeria therefore, provide a strong
motivation for evaluating the relationship between working capital management
and firm’s performance in detail. This study therefore, explores the various way of
measuring Working Capital components and relates them to the performance of
the Nigerian manufacturing sector.
1.2 Statement Of The Problem
There has been a growing number of studies that examined the relationship
between working capital and corporate profitability in the recent time (Shin and
Soenen, 1998; Deloof, 2003; Fildbeck and Krueger, 2005; Falope, 2009; .Jinadu,
2010). Justification for this common efforts centered on the relationship between
efficiency in working capital management and firms profitability and its
implications on shareholder’s value. Most of these studies were however, centered
on large firms operating within well developed money and capital market of
developed economies and did not consider the fact that the amount of working
capital required varies across industries and indeed firms depending on the nature
20
of business, scale of operation, production cycle, credit policy, availability of raw
materials etc (Ghosh and Maji; 2004).
It is regrettable to note that in spite of these huge literatures in this area, many
firms had crashed, more especially manufacturing sector of the Nigerian economy
in which application of working capital is more pronounced (Jinadu, 2009). In
addition, some promising investments with high rate of return are failing and
being frustrated out of business because of inadequacy of working capital. Many
factories had been either temporarily or completely shot down because they could
not meet their financial obligations as at when due because they were not liquid.
Many Nigerian workers had been forcefully thrown into unemployment market
and frustratingly became dependent on relations as a result of the aborted mission
of their organization caused by poor attention given to the management of working
capital . Unfortunately, Nigeria capital and money markets are not really helping
to ameliorate the problem, instead, more often than not; they compound the
problem by creating bottleneck with harsh conditions that could not be easily met
by the companies that are at the verge of collapse.
The problem then arises as to how managers of these manufacturing organization
could be encouraged to pay more attention to the management of their working
capital. In other words, how could working capital be managed in order to impact
positively on firms performance.
1.3 Objectives Of The Study
The main objective of this study is to investigate the relationship between working
capital management and the corporate performance (profitability) of the Nigerian
manufacturing companies. While the specific objectives of the study are to: -
i. investigate the relationship between the accounts receivable period (as a measure
of WCM) and profitability of manufacturing companies in Nigeria.

21
ii. investigate the relationship between inventory period (as a measure of WCM) and
profitability of manufacturing companies in Nigerian.
iii. investigate the relationship between cash conversion cycle period (as a
comprehensive measure of checking the efficiency of WCM) and profitability of
manufacturing companies in Nigeria.
1.4 Research Questions
In a bid to actualize the research objectives, the following research questions have
been formulated which serve as a guide in the researcher’s quest for answers.
These questions are;
i. What is the significant relationship between the accounts receivable period
(ACRP) and profitability of Nigerian manufacturing companies?
ii. What is the significant relationship between the inventory period (INVP)
and profitability of Nigerian manufacturing companies?
iii. To what extent is the relationship between cash conversion cycle (CCC)
and profitability of manufacturing companies in Nigeria?
iv. To what extent does the effective management of working capital affect the
profitability of the Nigerian manufacturing companies?
v. What level of working capital is optimal and desirable?
vi. To what extent has the inadequacy of working capital affect the profitability
of the Nigerian manufacturing companies
1.5 Research Hypotheses
A hypothesis is a conjecture or a prediction of what can be seen in the world of
reality and this prediction is made from the world of theory. It is a tentative
statement about the relationships that exist between two or among many variables
(Asika, 2005).
22
To provide an empirical support to the relationship between working capital
management and profitability of the Nigerian manufacturing companies, three
hypotheses have been formulated and stated in their null forms as follows:
HO1: There is no significant relationship between the accounts receivable
period (ACRP) and profitability of Nigerian Manufacturing
Companies
HO2: There is no significant relationship between the inventory period
(INVP) and profitability of Nigerian Manufacturing Companies
HO3: There is no significant relationship between the cash conventions
cycle (CCC) and profitability of Nigerian Manufacturing Companies
1.6 Scope Of Study
The scope of the study enables the researcher to circumscribe his/her research
within a manageable limit (Asika, 2005).
In this research work, an attempt is made to explore the relationship between
working capital management and firm’s performance for twenty (20)
manufacturing firms out of the 134 manufacturing firms listed on the Nigerian
stock exchange for the period 2008-2012. The twenty (20) manufacturing firms
were selected based on the following criteria:
Companies must remain listed on the Nigerian Stock Exchange (NSE)
during the 2008 – 2012 periods.
Companies must have complete financial statements for the period under
review.
Companies must be operational within the period under investigation.
Manufacturing organizations were so taken into consideration since they play a
very important role in the Nigerian economy.

23
1.7 Significance Of The Study
This study is very crucial as it will give the financial managers of these
manufacturing organizations, better insights on the need to pay particular attention
to the effective and efficient management of their working capital. They will be in
a better position to be able to design and implement strategies and policies that
are aim at stabilizing and managing the various components of working capital
especially as it significantly impact on the main aim of business which is creating
shareholders’ value.
The study would further, enable the management to know at what extend they
should increase their liquidity in order to make their performance up to the mark.
This is very important in improving the good will of their firms, since firms that
pay creditors as at when due are considered credit worthy and gains a good
reputation.
And for the academic purposes, the research work will contribute to the existing
body of knowledge on working capital management and firm’s performance.
Finally, it is expected that the study will serve as a source of information to
students undergoing research work of this nature in the future.
24
REFERENCES
Afza, T. and Nazir, M. (2009). “Impact of aggressive working capital management policy
on firm’s profitability”. The IUP Journal of Applied Finance, 15 (8), 20 – 30.
Akinsulire, O. (2005). Financial management. Lagos: El-Toda Ventures.
Deloof, M. (2003). “Does working capital management affect profitability of Belgium
firms”? Journal of Business Finance and Accounting, 30 (3), 573-588.
Falope, O.I. and Ajilore, O.T. (2009). “Working capital management and corporate
profitability: Evidence from Panel Data Analysis of selected quoted companies in
Nigeria”. Research Journal of Business Management, 3(3)73-84.
Filbeck, G. and Krueger, T. (2005). “Industry related differences in working capital
management”. Mid-American of Business, 20(2), 11-18.
Filbeck, G., Krueger, T. and Preece, D. (2007). “CFO magazine’s working capital
surveys: Do selected firms work for shareholders”? Quarterly Journal of Business
and Economics, 46(2)3-22.
Krueger, T. (2002). “An analysis of working capital management results across
industries”. Mid-American Journal of Business, 20(2), 11 – 18.
Lamberson, M. (1995). “Changes in working capital of small firms in relation to changes
in economic activity”. Journal of Business, 10(2), 45-50.
Lazaridis, I. and Tryfonidis, D. (2006). “Relationship between working capital
management and profitability of listed companies in the Athens Stock Exchange”.
Journal of Financial Management and Analysis, 19(1)26-35.
Ohikhena, P. (2006). Research methodology in the social and management sciences.
Lagos, Nigeria: Bunmico Publishers.
Oxford (2005). A dictionary of accounting, 3 ed. Oxford University Press.
Pandey, I.M. (2005). Financial management, 9 ed. New Delhi Vikas Publishing House
PVT Ltd.
Padachi, K. (2006). “Trends in working capital management and its impact on firm’s
performance: An analysis of Mauritian small manufacturing firms”. International
Review Business Research Papers, 2(1), 45-56.
25
Prasad, R.S. (2001). “Working capital management in the paper industry”. Finance India,
15(1),185-188.
Shin, H.H. and Soenen, L. (1998). “Impact of working capital and corporate
profitability”. Journal of Finance Practice and Education, 8(2)37-45.
Smith, K. (1980). Profitability versus liquidity trade offs in working capital management,
in readings on the management of working capital. New York, St. Paul: West
Publishing Company.
VanHorne, J.C. (1977). “A risk-return analysi8s of a firm’s working capital position”.
Financial Economics, 2(1)71-88.
VanHorne, J.C. and Wachowiez, J.M. (2004). Fundamentals of financial management, 12
ed. New York: Prentice Hall.
26
CHAPTER TWO
REVIEW OF RELATED LITERATURE
2.0. Introduction
The aim of this research work is to examine the impact of Working Capital
Management on the performance of Nigerian manufacturing companies listed on
the Nigerian Stock Exchange (MSE). This chapter reviews the related literature in
respect of the subject matter under investigation and it is divided into five (5)
sections as shown below:
2.0. Introduction
2.1. Conceptual Review
2.2. Theoretical Review
2.3. Empirical Review
2.4. Summary
2.1. Conceptual Review
2.1.0. Concepts of Working Capital Management
2.1.1. Working Capital
Many authors have different perceptions about the concept “Working Capital”.
Falope and Ajilore (2009) regard working capital as the firm’s investment in short
term assets. To Akinsulire (2005), working capital is viewed as the items that are
required for the day to day production of goods to be sold by a company.
An understanding of the concept of working capital cycle will give appreciation
for the study of relationship between capital and firm’s performance. Weston
(1998) described working capital or cash operating cycle as the total length of time
required to complete the following sequence of events:

27
Conversion of cash into raw materials
Conversion of raw materials into work in progress
Conversion of work in progress into finished goods
Conversion of finished goods into debtors through sales and
Conversion of debtors into cash
Pandey (2005), however argues that working capital is a tow faced concept- gross
and net WC. He defined gross WC as the firm’s investment in current assets while
the net WC is the difference between current assets and current liabilities. Net WC
can be positive or negative. It will be positive if current assets are more than
current liabilities and negative when current assets are less than current liabilities.
Efficient management of working capital is very essential in the overall corporate
strategy in creating shareholders value (Afza & Nazir, 2009). Agreeing with the
view of Afza and Nazir, Eljelly (2004) states that working capital management
involves planning and controlling current assets and current liabilities in a manner
that eliminates the risk of inability to meet due short term obligations on one hand
and avoid excessive investment in current assets on the other hand.
Padachi (2006) opines that the management of working capital is important to the
financial health of businesses of all sizes. This is because, first, the amounts
invested in working capital are often high in proportion to the total assets
employed and so it is vital that these amounts are used efficiently. Secondary, the
management of working capital directly affects the liquidity and the profitability
of firms and consequently their net worth (Smith, 1980).
Agreeing with the view of Padachi (2006), Raheman and Nasir (2007) consider
working capital management as striking a balance between the two objectives of a
firm, that is, profitability and liquidity. They posited that firms must strive to

28
maximize profits and enhance shareholders wealth but at the same time not
sacrifice their liquidity which is necessary for smooth operations and most
importantly, corporate survival. To achieve this dual objective of working capital
management, most of the financial manager’s time and efforts are consumed in
identifying the non-optimal levels of the various components of working capital
and bringing them to optimal levels (Lamberson, 1995). The optimal level of
working capital components, which is a balance between risk and efficiency, is
maintained by continuous monitoring of the various components of working
capital (Afza & Nazir, 2009).
The basic objective of working capital management therefore is to ensure that a
firm’s current assets and current liabilities are maintained at a satisfactory level.
That is, to avoid neither more nor less working capital but to ensure that is just
adequate (Dong & Su, 2010). Agreeing with the view of Dong and Su, VanHorne
and Wachomicz (2004) observed that excessive level of current assets may have a
negative effect on a firm’s profitability; where as a low level of current assets may
lead to low level of liquidity and stock-outs thereby resulting in difficulties in
maintaining smooth operations.
For this work, suffice it to state that working capital management is all managerial
decisions taken by financial managers in maintaining a balance between liquidity
and profitability while conducting the day to day operations of a business concern.
The task of maintaining this balance, however, requires continuous monitoring of
the optimal levels of the various components of working capital.
2.1.2. Working Capital Management
Working capital management is the functional area of finance that covers all the
current accounts of the firm. It is concerned with the management of the levels of
29
the individual components of the working capital (Loneux, 2004). The basic
objective of working capital management is to manage firms’ current assets and
current liabilities in such a way that working capital is maintained at a satisfactory
level (Dong & Su, 2010).
Therefore, in this study, working capital management can be referred to as actions
taken by managers in maintaining a balance between liquidity and profitability
while conducting the day-to-day operations of a business concern.
2.1.3 Working Capital Management Efficiency
Efficient management of working capital has been defined by Ghosh and Maji
(2004) as the management of various components of working capital in such a
way that an adequate amount of working capital is maintained for the smooth
running of a firm and for fulfillment of twin objectives of liquidity and
profitability.
Modern financial management aims at reducing the level of current assets without
ignoring the risk of stock outs, to an optimal level (Bhattacharya, 1997).
2.1.4. Policy of Working Capital
The policy of working capital in accordance to Weston et al position is concerned
with two sets of relationship among balance sheet items. Firstly, the policy
question about the degree of total current assets to be held. Though current assets
vary with sales, it should be noted that the ratio of current assets to sales becomes
a policy issue. A company may hold relatively little proportion of stocks of current
assets if it elects to operate aggressively. Such move is to lower the required level
of investment and enhance the expected rate of return on investment. Thus, due to
excessive tough credit policy, such aggressive policy may as well enlarge the
possibility of running out of inventories and cash or sales loss.

30
The connection/relationship between types of assets and means such assets are
financed is the second policy question. One policy requests for harmonizing asset
and liability maturities: financing short term assets with short term debt, and long
term assets with long term debt or equity. If such policy is implemented, the
maturity formation of debt is resolved by considering fixed versus current assets.
Meanwhile, short-term debt is often less expensive to long term debt. This implies
that the expected rate of return may be more if short term debt is employed.
By offsetting the return advantage shows that huge proportion of short term credit
amplifies the risks as follows:
First, having to renew this debt at much higher interest rates
Second, not being able to renew the debt at all whenever the company goes
through tough times.
Both areas of working capital policies entail risk/return tradeoffs. Therefore, the
need to work-out a modality to establish the best possible levels of each type of
current assets to hold, and the substitute methods to finance them is necessary. The
procedure of accomplishing these optimal conditions is what may be termed as
working capital management.
As pointed out by Shin and Soenen (1998) that Wal-Mart and K-Mart had
comparable capital formations in 1994, but K-Mart’s poor management of
working capital contributed to its going bankrupt. This is because K-Mart had a
cash conversion cycle of about 61 days whereas Wal-Mart had a shorter
conversion cycle of 40 days instead. K-Mart was with faced an extra $193.3
million per year financing costs arising from long-term conversion cycle.
31
As pointed out in their 2005 U.S. survey report, there is a high positive correlation
between the efficiency of a corporation’s working capital policies and its return on
invested capital.
Hence, Nunn (1981) employs the PIMS database to study the reason for some
product lines having small working capital requirements, whereas some product
lines are having large working capital requirements. Moreover, Nunn has much
interest in permanent rather than temporary working capital investment since he
employed data averaged over four years. By employing factor analysis, he’s able
to identify factors connected with the production, sales, competitive position and
industry.
While highlighting the function of industry practices on firm practices, Hawawini,
Viallet, and Vora (1986) observe the influence of a company’s industry on its
working capital management. They resolved that there is a greater industry
consequence on company working capital management practices which is stable
over time; having used data on 1,181 U.S companies over the period 1960 to 1979.
Their studies arrived at the conclusion that sales growth and industry practices are
essential issues that influence company’s investment in working capital.
The review above depicts that there are models to illustrate the way working
capital refers to a company’s investment in short term assets-cash, short-term
securities, accounts receivable, and inventories. Though, these assets are financed
by short- term liabilities. Thus, net working capital is current assets less current
liabilities.
Van Horne (1986) submitted that working capital management is a misnomer; if
the working capital of the company is not managed. The term he stressed describes
a set of management decisions that affect specific types of current assets and
32
current liabilities. In turn, those decisions should be rooted in the overall valuation
of the company.
This submission does not disagree with the substance of the postulations of
Weston et al. Thus, it strengthens their arguments that the idea of working capital
management must do with those management decisions which border on balancing
of risk/return tradeoffs for current asset holdings and the liabilities that create
those assets.
Weston et al then advised that working capital should be considered as an
investment no less important that equipment and materials. They both argued that
current assets embody more than half the total assets of a business, and since the
investment is relatively volatile, it is worthy of careful consideration.
They argued that it is even more so for the small business. The small business may
lower its investment in fixed assets by renting or leasing plant and equipment, but
there is no way it can avoid an investment in cash, inventories and receivables.
Further, since small and medium companies have relatively limited access to the
long-term capital markets, it must necessarily rely heavily on trade credit and
short- term bank loans, both of which affect net working capital by increasing
current liabilities
2.1.5. Working Capital Cycle
In a business cycle, cash flows into, around and out of the business. Cash is life
blood of a business, and a manager's key mission is to assist in keeping it to flow
and to take the advantage of the cash-flow in making profits. A business that is
operating profitably, in theory is generating cash surpluses. If it does not generate
surpluses, then the business ultimately will run out of cash and expire.
33
The more speedily the business gets bigger the further cash it will need for
working capital and investment. The cheapest and best sources of cash exist as
working capital right within business. Better management of working capital
generates cash, and will assist in improving profits and lessen risks. Hence, it is
imperative to note that the cost of offering credit to customers and holding stocks
may signify a significant percentage of a company's total profits.
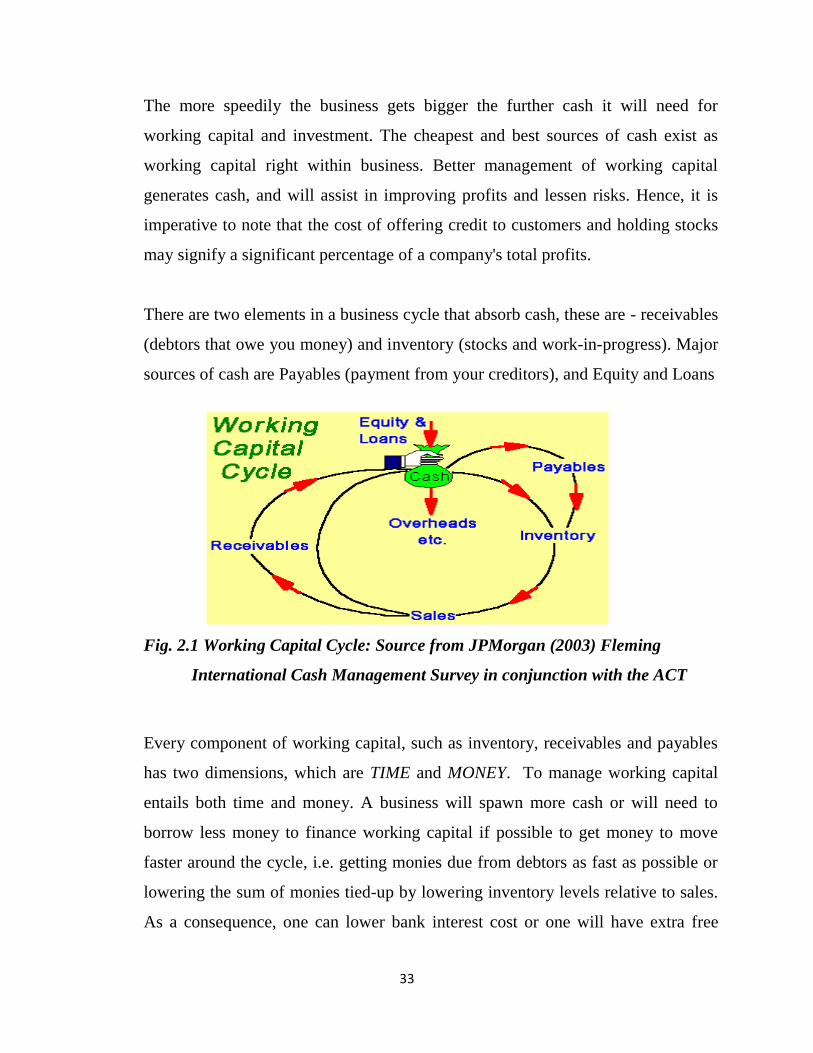
There are two elements in a business cycle that absorb cash, these are - receivables
(debtors that owe you money) and inventory (stocks and work-in-progress). Major
sources of cash are Payables (payment from your creditors), and Equity and Loans
Fig. 2.1 Working Capital Cycle: Source from JPMorgan (2003) Fleming
International Cash Management Survey in conjunction with the ACT
Every component of working capital, such as inventory, receivables and payables
has two dimensions, which are TIME and MONEY. To manage working capital
entails both time and money. A business will spawn more cash or will need to
borrow less money to finance working capital if possible to get money to move
faster around the cycle, i.e. getting monies due from debtors as fast as possible or
lowering the sum of monies tied-up by lowering inventory levels relative to sales.
As a consequence, one can lower bank interest cost or one will have extra free
34
money that will be available to enhance more sales growth or investment. In the
same way, negotiating improved terms with suppliers such as getting longer credit
or an increased credit limit will effectively create free finance to assist funding
future sales.
Working capital is referred to as the fuel powering global business activities, but
often a greater percentage of this fuel is constantly stuck in the pump; tied up in
aging invoices and lengthy Days Sales Outstanding (DSO) cycles. Those firms
that are looking to enhance cash flow have primarily focused on collections.
Whereas traditionally, collections have always been a reactive process i.e. picking
up on aging invoices after they are already late in payment, and then resolving the
underlying issues in an effort to collect. Since it is not easy to go up-stream and
systematically uncover and resolve the root causes of issues that actually drive the
delayed payments. Hence, most of the collections efforts normally end up squarely
emphasizing on dealing with symptoms, rather than addressing the real issues.
As a result of process automation built around innovative dispute prevention
technologies, it is now possible to take a more proactive approach to collections
that are proving to yield enormous dividends that include the unlocking of millions
in working capital, elimination of revenue leakage, and radical improvements in
overall customer satisfaction. Many companies have already seen significant
returns from their work in this area. As submitted by JP Morgan (2005); to
optimise working capital globally, payment and information components of a
transaction must be integrated.
2.1.6. Components of Working Capital Management (WCM)
Working capital management processes involve crucial decisions on multiple
aspects, including the investment of available cash, maintaining a certain level of
inventories, managing accounts receivable and accounts payable (Hadley, 2006).
35
However, WCM is not limited to these tasks, but is implicated in multiple levels of
interactions both internally and between external parties (supplier, customers,
distributors, bankers and retailers). For example, credit officers are required to
investigate credit history of their clients in order to understand their financial
worthiness.
For this study, WCM components can be narrowed to four important components,
namely; cash, receivables, inventory and payables management which are
explained as follows:
2.1.7. Cash Management
The purpose of cash management is to determine the optimal level of cash needed
for operations and investments in marketable securities, which is suitable for the
nature of business operations cycle (Hadley, 2006).
The challenge of cash management is to balance the appropriate level of cash and
marketable securities that will reduce the risk of insufficient funds for operations
and opportunity cost of holding excessively high level of these resources (Filbeck,
et al, 2007). Thus, a company’s competency to synchronize cash inflows with cash
out flows, by using cash budgeting and forecasting in formulating a cash
management strategy is important.
A consideration as to how organizations manage its current asset is quite
important. Though this did not cover marketable securities such as shares,
debentures etc rather, such current assets could be receivable (debtors) and
inventories (stock). Cash is known to be the most liquid of all current assets
needed to keep the business running while at the same time it is the ultimate
output expected to be selling services or products manufactured by the firm. Cash
is (legal tender) which the firm can disburse immediately without any restrictions.
36
The term “cash” include coins, currency notes and cheque held by the firm and
balance in its bank account. Sometimes near cash items such as marketable
securities are also included in cash. This is because near cash can readily be
converted into cash.
Generally, when a firm has excess cash, it invests it in marketable securities or
other investments. This kind of investment contributes some profit to the firm.
Cash management is concerned with management of the following;
i. Cash flow in and out of the firm.
ii. Cash flow within the firm
Cash management is assumed more important than most significant and
least productive assets that a firm holds. It is significant because it is used to pay
the firm obligations.
Therefore, the main aim of cash management is to maintain adequate cash position
to keep the firm sufficiently liquid, and to use excess cash in some profitable way.
It is also important because it is difficult to predict cash flow accurately and there
is no perfect coincidence between the inflows and outflow of cash. Thus during
some period, cash outflows will exceed cash inflows because of payment for taxes,
dividend, seasonal inventory buildup. Sometime because they may be large sums
promptly.
In order to resolve the uncertainty about cash flow prediction and lack of
synchronization between cash receipts and payments, some strategies for cash
management are developed. They include:
i. Cash Planning: This is planning of cash inflow and outflow to project cash
surplus or deficit for each period of the planning period. Cash budget is
prepare for this purpose

37
ii. Managing the Cash Inflow: The inflow and outflow of cash is properly
managed so as to delay the outflow of cash and for proper calculation of
cash flows.
iii. Optimal Cash Level: The firm decides about appointment level of cash
balance.
iv. Investing Idle Cash: Idle cash can be invested in marketable securities or
inform of bank deposit.
Reasons for Holding Cash
There are three major reasons for holding cash
i. Transaction Motive: Firm need cash to pay accounts payable, wages,
taxes, operating expenses, and other maturity current obligations. The
desire to hold cash to meet operating requirement is called the transaction
motive for holding cash. The amount of cash for transaction purpose is a
function of the viability of the firm’s cash flows. This cash flow is
principally affected by fluctuations in sale, the credit policies of raw
materials and the characteristics of the industry.
ii. Precautionary Motive: Cash is held under precautionary motive as a
buffer or cushion to meet unforeseen and unexpected cash requirements or
contingency. Firms with highly variable cash flow would generally have
cash reserves in excesses the need for transactions. Excess cash reserves
held to meet exceptional cash outflow requirements satisfies the
precautionary motive for holding cash reserves and thus allows the firm to
cope adequately with unexpected cash outflows. The need may however,
diminish whenever the cash flows of a business can be fairly predicted with
accuracy or where the business has the ready power to borrow to meet
contingency.
iii. Speculative Motive: This is relating to holding of cash in order to take
advantage of expected changes in security price. When interest rates are

38
expected to rise and security price to fall. The speculative motive would
suggest that the firm should wait until the rise in interest rate cease. When
interest rates are expected to fall, cash may be invested in securities; the
firm will benefit by any subsequent fall in interest rates and rise in security
prices.
There are some strategies for cash management, these include:
i. Cash disbursement should be based on plan and should be slow to avoid
shortage and production interruption.
ii. Loan negotiation and rescheduling of loan where appropriate.
iii. Accelerating collection from customers without adversely reducing future
sales and profit by requesting customers to pay promptly or through cash
discount or through a provided collection system.
iv. Idle or excess cash should be properly invested in short-term marketable
securities.
v. Prepayment should be avoided except in cases of insurance premium or
when necessary.
vi. Sound forecast for cash or short-term and long-term bases.
vii. There should be sound dividend policy
2.1.8 Cash Positioning
Whichever form of business and however volatile the cash flows, treasurers can
maximize the value of their cash holdings by more accurately identifying and
predicting positions throughout the day to enhance investment or borrowing
opportunities and therefore overall return.
Working capital expresses the liquidity of a business. A business with poor
liquidity will have difficulty in paying its everyday expenses, such as salaries and
wages, rent and telephone bills. If management refuses to constantly monitor,
39
control and manage a business's liquidity (its amount of working capital), then the
business may likely end up in a difficult situation with its creditors.
The following key points are important to working capital:
The current assets (cash, inventories/stock and accounts receivable/debtors)
in the business need to be monitored and kept at realistic levels.
Current liabilities constitute all the short-term payments that need to be met
by the business (obligations that need to be paid within one year). Short-
term loans and accounts payable are examples.
Most successful businesses keep the working capital ratio as low as
possible, and keep cash circulating, so as to maximize profit.
The size of the working capital ratio depends on the type of industry the
business operates in, and on financial arrangements such as overdrafts and
creditor policy. Ratios between 1.5:1 and 2:1 are acceptable for most
businesses.
2.1.9. Cash Flow Volatility, Earnings Volatility and Firm Value.
The theory of corporate risk management argues that shareholders are better off if
a firm maintains smooth cash flows. For instance, Froot, Scharfstein, and Stein
(1993) argued that smooth cash flows can add value by reducing a firm's reliance
on costly external finance. Empirically, Minton and Schrand (1999) showed that
cash flow volatility is costly as it affects a firm's investment policy by increasing
both the likelihood and the costs of raising external capital. One recurring theme in
this literature is that, all things being equal, firms with smoother financial
statements should be more highly valued. While previous research finds that cash
flow volatility is costly, no direct evidence exists linking financial statement
volatility to firm value. Such a link is important because, in order for risk
management to matter, smooth financials must be valued at a premium to more
40
volatile ones. Investors value firms with smooth cash flows at a premium relative
to firms with more volatile cash flows. Consistent with risk management theory,
strong evidence shows that cash flow volatility is negatively related to proxies for
firm value.
There are a number of reasons why earnings volatility may matter to the firm,
independent of cash flow volatility. For instance, prior empirical work suggests
that analysts tend to avoid covering firms with volatile earnings, as it increases the
likelihood of forecast errors Similarly, it is imperative that institutional investors
avoid companies that experience large variations in earnings. High earnings
volatility also increases the likelihood of negative earnings surprises; in response,
managers have engaged in extensive earnings smoothing. It should be noted that
earnings smoothing may likely reduce a company's perceived probability of
default and therefore a firm's borrowing costs. Goel and Thakor (2003) suggest
that a firm may smooth earnings so as to reduce the informational advantage of
informed investors over uninformed investors, and therefore protect these
investors who may need to trade for liquidity reasons. Last but not the least,
Francis, Lafond, Olsen, and Schipper (2004) find firms with greater earnings
smoothing have a lower cost of capital even after accounting for cash flow
volatility.
In fact, under certain specifications the market appears to punish firms for
undertaking smoothing behavior preferring earnings volatility mirror cash flow
volatility. These results are important and suggest Managers focus their actions on
smoothing cash flows rather than necessarily utilizing accruals to smooth earnings.
Of course, there are a number of other ways in which financial uncertainty
interacts with firm value. According to the CAPM, systematic risk should be
41
negatively related to value, since higher discount rates yield a lower value, all
things being equal.
Further, recent empirical work suggests that not only does systematic risk affect
value, but also idiosyncratic risk may be priced (Shin and Stulz, 2000). Empirical
evidence suggests that there is a negative relation between systematic risk and firm
value, as well as a negative and significant association between unsystematic risk
and firm value.
The two alternative types of risk, namely, cash flow and earnings volatility are of
primary importance since unlike financial market variables they reflect the actual
stability of the firms' financial statements and are directly affected by managerial
decisions and the firms' risk management policies.
2.1.10 Cash Budget
Cash budget is the most significant device to plan for control of cash receipt and
payment. Cash is summary statement of the firm expected cash inflows and
outflows over projected cash time period. It gives information on the timing and
magnitude of expected cash flows and cash balances over the projected period.
This information is helpful to the financial manager to determine the future cash
need of the firm, plan for financing for those need and exercise control over cash
and liquidity of the firm. In preparing a cash budget, the financial manger has to
forecast receipts and payments.
The most important source of cash receipts is sales. Developing forecast is the first
step in preparing the cash budget. All precautions are taken to forecast sales as
accurately as possible, sales can be for cash or on credit.
42
Once the cash budget has been prepared and appropriate net cash flow is
established, the financial manger ensures that there does not exists a significant
deviation between projected cash flows and actual cash flows. To achieve this,
through collections and cash disbursement, this forms the objective of managing
the cash flow. One of the techniques used by companies to accelerate their cash
collections is concentration banking.
2.1.11. Management of Cash Receivables
Trade credit is known to be the most prominent force of the modern business. It is
considered as essential marketing tools, acting as a bridge for the movement of
goods through production and distribution stages to consumers. A firm grants
trade credit to protect its sales from the competitors and to attract potential
customers to buy its product at favorable terms. When a firm sells its product or
services and does not receive cash from it immediately, the firm is said to have
granted trade credit to customer. Trade credit, thus create receivables or book debt
and receivable arising from the credit had three characteristics which include
involvement of an element of risk which should be carefully analyzed.
Cash sales are totally risk less, but not credit sale, as the cash payments are yet to
be received.
2.1.12. Credit Standards
Credit standards are criteria that determine which customer will be granted credit
and to what event. First attempting to implement ideal credit standard may result
in a too stringent or too light policy that may eliminate the risk non-payment, but
also eliminate potential sales to those rejected customers who would have paid
their bill. At the other extreme, an excessively liberal policy may lead to higher
sales, but greater bad debt losses and collection cost would follow. Therefore, the
tradeoff between managerial benefit and cost dictate the balance between two
extremes.

43
Nevertheless, credit standards often revolve round five C’S of credit analysis.
i. Character: Has to do with the probability that a customer will try to honor
his/her obligation. This factor is of considerable importance between every
credit transaction which implies a promise to pay. Experience credit
managers frequently insist that character, is the most important issue in a
credit evaluation.
ii. Capital: This is measured by the general financial position of the firm as
indicated by a financial ratio analysis with a special emphasis on the
tangible net worth of the enterprises.
iii. Collateral: This is represented by assets the customers offer as a pledge for
security of the credit extends.
iv. Condition: This have to do with impact of general economic trends on the
firm or special development in certain area of the economy that affect the
customers’ ability to meet the obligation.
v. Capacity: This describes a subjective judgment of the customers’ ability to
pay. It is gauged by the customers past business performance record
supplemented by physical observation of the plant.
2.1.13. Credit Extension Policy
Credit extension policies provide guide lines for granting credit, the terms of
payment and amount of credit to extend to a customer. The cost of a credit
extension policy can be grouped into the following categories:
i. Cash Discount: A percentage of sales deducted as an incentive to
encourage early payment. Early payment not only reduces capital
requirement but also saves administrative cost of pursuing outstanding
debtors and may reduce the overall risk of bad debts as well. Cash discount
are a relative expensive way of improving the inflow of cash and most
companies would prefer to avoid them by raising extra working capital at a
44
more advantageous market rate. There may sometime be an element of
price reduction in the cash discount. It is a concealed way of offering lower
price to a sector of the market, which might otherwise go to competitions
(Brockingtion; 1287:273).
ii. Bad Debt Losses: These are usually accounts that are uncollectible and
written off as a charge against sales.
iii. Credit and Collection Expenses: Administrative cost for conducting in-
house credit operations are also charge against sales.
iv. Financing Cost: The opportunity cost of capital of funds tied up in a
receivable investment.
2.1.14. Credit Collection Policy
The overall debt collection policy of the firm should be that, the administrative
cost and other cost incurred in debt collection should not exceed the benefit
received from incurring those cost. The following are some of the best method to
be adopted in a debt collection department.
i. Polite reminder: This is done when a bad debt matured but the debtor has
done nothing about it.
ii. Strongly Worded Reminder: This is usually send when the debtor is
presumed to have received the polite reminder but still remains adamant.
iii. Tele-phone Call: This is a person to person contact employed as a step on
the debtor’s collection policy when the debtor does not need polite and
strongly worded reminder.
iv. Personal Call: When all the steps enumerated above fail to produce result,
staff of the credit company should be dispatched to the debtor to personally
persuade him/her to pay.
v. Collection Agencies: Collection agencies employ almost unlimited means
of collecting their customer’s funds, so businesses do not employ it readily
for fear of losing customers goodwill.
45
vi. Legal Action: This is last resort because it is costly both in terms of time
and money.
vii. Withdrawal of credit facilities: This is a situation whereby such credit
facilities are been withdrawn from the debtor’s form or possession for
default in payment.
2.1.15. Inventory (Inv) Management
Inventories are the product a company is manufacturing for sale and the
components that make up the product (Pandey, 2005). He classified the various
forms in which inventories exist in a manufacturing company as: raw materials,
work-in-progress facilitate production, while stock of finished goods is required
for smooth marketing operations (Hadley, 2006). Similarly the Oxford Dictionary
of Accounting (2005) defined inventory (stock) as the products or supplies of an
organization on hand or in transit at any point in time.
In the context of inventory management, Pandey (2005) opined that a firm is faced
with the problem of meeting two conflicting needs. First, to maintain a large size
of inventories of raw materials and work-in-progress for efficient and smooth
production and of finished goods for uninterrupted sales operations. Secondary, to
maintain a minimum investment in inventories to maximize profitability. The
objective of inventory management should be to determine and maintain optimum
level of inventory investment which should normally lie between the two danger
points of excessive and inadequate inventories.
According to Pandey (2005), the major dangers of over-investment are: the
unnecessary tie-up of the firm’s funds and loss of profit; the excessive carrying
costs (such as the costs of storage, handling, insurance, recording and inspection),
and the risk of liquidity. While the consequences of under-investment in
46
inventories are: the production hold-ups and the failure to meet delivery
commitments.
Inventory, therefore, plays an important role to determine the activities in
producing, marketing and purchasing. Since inventory determines the level of
activities in a company, managing it strategically contributes to profitability
(Filbeck, Krueger & Preece, 2007). A company’s ability to respond to demand is
largely dependent on how efficient the company manages inventories and how
committed its suppliers are to support a company’s production lines (Rafuse,
1996).
The number of days inventory are held (DINV) is used as a proxy for the
inventory policy and is calculated as (INV×365)/cost of goods sold (Dong & Su,
2010). DINV reflects the average number of days stock are held by the firm.
Longer storage days represent a greater investment in inventory for a particular
level of operations.
2.1.16. Need to Hold Inventory
There are three general reasons why inventory is held in manufacturing firms.
i. To maintain inventories to facilitate smooth sale operations.
ii. To guide against risk of unpredictable change in demand and supply forces
and factors.
iii. To take advantage of price fluctuation, which influence the decisions to
increase or reduce inventory level. Supply of raw materials may be delayed
due to such factors as transport disruption, short supply etc. Therefore, it is
necessary for a firm to maintain sufficient stock of raw materials at a given
streamline production.

47
2.1.17. Inventory Control
For a given level of inventory, the affectability of inventory control affects the
flexibility of the firm, inefficient inventory control result to unbalance inventory
and rigidity. The firm may sometimes be out of stock and sometimes pile up
unnecessary stock. This makes the firm unprofitable.
Better management of inventory has the following:
i. How much of the inventory should be order
ii. When should it be ordered?
The first problem relates to the problem of determining the economy order
quantity (EOQ) and is explain with analysis of the cost of maintaining certain
level inventories. On the other hand, when to order because of uncertainties and is
a problem of determining the re-order point.
2.1.18. The Economic Order Quantity (EOQ)
The problem of how much inventory should be added when inventory is
replenished or in case of raw materials, the lot which it has to purchase on each
replenishment are called “order quantity problem” and the task of the firm is to
determine optimum or economic order quantity and to determining the optimum
carrying cost.
Carrying costs are cost incurred for holding a given level of inventory they include
opportunity cost of funds invested in inventories, Insurance, Taxes, storage cost
and cost of deterioration. The carrying cost move in direct proportion to inventory
size. The optimum inventory size is commonly referred to as economic order
quantity (EOQ). It is that order size at which annual total cost of ordering and
holding are at minimum.
Economic order quantity is calculated by using the formulae below:
EOQ = √2𝐴𝑄
𝐶
48
Where: EOQ = Economic Order Quantity
A = Total Annual Requirement
O = Ordering cost per order
C = Carrying Cost per order
2 = Constant
2.1.19. Re-Order Point
This is the inventory level at which an order should be place to replenish the
inventory. To determine the re-order point under certainty, we should know the
lead time, the average usage and the economic order quantity. The lead time is the
time normally taken in receiving delivery of inventory after the order had been
placed.
Re-order Point = Lead Time + Average Usage
It is difficult to predict usage and the lead time accurately. Demand for materials
may be different from the normal lead time. These might lead to stock-out. To
guard against stock-out safety may be maintained. There are some minimum or
buffer inventories as cushion against expected increase usage and or delay in
delivery time.
When all uncertainties are taken into consideration, it means re-order point is
determined under uncertainty which thus give the following formulae.
Re-order Point (when safety is maintained) = Lead Time x Average usage + Safety
stock.
2.1.20. Relation to Financial Management
Techniques of inventory management are very useful in determining the optimum
level of inventory and finding solution to the problem of the economic order
quantity, the re-order point and the safety stock.
49
The investment of fund in an inventory is a very important aspect of financial
management therefore; the financial manager must be familiar with way to control
inventories effectively so that the allocation of capital will be done effectively.
When demand or usage of inventory is uncertain, the financial manager may try
lead time when an order is placed. The lower the average lead time, the lower the
safety stock needed and the lower the total investment.
In the case of purchases, the purchases department may look for a new vendor that
promise quicker delivery or put pressure in the case of finished goods. The
production runs may be scheduled by the production by producing smaller runs or
fast delivery. The greater the efficiency with which the firm manages its inventory,
the lower the inventory in it.
2.1.21. Payables Management
Falope and Ajilore (2009) view accounts payable (AP) as supplies whose invoices
for goods or services have been processed but have not yet been paid. While the
Oxford Dictionary of Accounting (2005) defined accounts payable, which is also
called trade creditors, as the amount owed by a business to suppliers. Accounts
payable are classed as current liabilities on the balance sheet but distinguished
from accruals and other non-trade creditors. Organizations often regard the
amount owing to creditors as a source of free credit because it has no identifiable
interest charges. It is in view of this that accounts payable are always regarded as a
major source of working capital financing for firms (Pandey, 2005). Therefore,
strong alliance between company and its suppliers will strategically improve
production lines and strengthen credit record for future expansion.
The number of days accounts payable (DAP) is used as a proxy for payment
policy. It reflects the average days it takes firms to pay their suppliers. DAP is
calculated as (AP×365)/cost of goods sold (Dong & Su, 2010).

50
2.1.22. Receivables Management
Refuse (1996) view accounts receivable (AR) as customers who have not yet made
payment for goods or services, which the firm has provided. While the Oxford
Dictionary of Accounting (2005) defined accounts receivable, which is also called
trade debtors, as the amounts owing to a business from customers for invoiced
amounts. AR are classed as current assets on the balance sheet, but distinguished
from prepayments and other non trade debtors.
The objective of debtors (receivables) management is to minimize the time-lapse
between completion of sales and receipt of payments (Hadley, 2006). Profits may
be called real profits after the receivables are turned into cash (Srivastarva, 2004)
refuse (1996) posited that the management of accounts receivable is largely
influence by the credit policy and collection procedure.
He maintained that a credit policy specifies requirements to value the worthiness
of customers and a collection procedure provides guidelines to collect unpaid
invoices that will reduce delays in outstanding receivables.
The number of days accounts receivable (DAR) is used as a proxy for the
collection policy. DAR is calculated as (AR×365)/sales (Dong Su, 2010), which
represents the average number of day that the firm takes to collect payments from
its customers. The shorter the DAR, the better the quality of debtors, since a short
DAR implies prompt payments by debtors. The DAR should be compared against
the firm’s credit terms and policy to ascertain its credit and collection efficiency
(Pandey, 2005).
2.1.23. Cash Conversion Cycle (CCC) Management
Working capital are the funds which are used to operate in the short term. If
receivables are postponed, there can be delays in payments and these could be

51
suspended causing a situation of illiquidity for the firm. Therefore, aligning the
receivables management between cash, inventory and payable management is
relatively challenging and important (Richards & Langhhin, 1980). In this context,
CCC is an important tool of analysis that enables us to establish more easily why
and how the business needs more cash to operate and when and how it will be in a
position to refund the negotiated resources (Elizalde, 2003). For Dong and Su
(2010), CCC is considered as a comprehensive measure of checking the efficiency
of working capital management. In their seminar paper, Richards and Laughhin
(1980) devised this method of working capital cycle which is considered as the
period between the payments of cash to creditors (cash out-flow) and the receipt of
cash from debtors (cash in-flow). They claimed that the method is superior to
other forms of working capital analysis that rely on ratio analysis.
A business can generate losses during a number of different periods, but it cannot
go on indefinitely with poor CCC Management. The activities that are directly
related to CCC management are:
i. The determination of the effective number of days to collect receivables.
ii. Determining the inventory needs and
iii. Determining the future growth of sales.
These activities must be integrated in such a way that the period of time in which
the cash is not being used to fund the working capital is minimized (Deloof, 2003).
The three activities are carried out through the implementation of credit policy,
inventory policy and cash management policy.
The CCC is calculated by subtracting the number of days accounts payable
(accounts payable×365/cost of goods sold) from the sum of the number of days
accounts receivable (accounts receivable×365/sales) and the number of days
inventory are held (inventories ×365/cost of goods sold). CCC has been

52
interpreted as a time interval between the cash outlays that arise during the
production of output and the cash inflows that result from the sale of the output
and the collection of accounts receivable (Falope & Ajilore, 2009). Padachi (2006)
posited that CCC is either negative or positive. A positive result indicates that a
company must borrow while awaiting payments from cutomers, if it must meet up
with its due obligations. A negative result indicates the number of days a company
has to receive cash from sales before it must pay its suppliers (Harris, 2005).
However, the ultimate goal is having low CCC, if possible negative, because the
shorter the CCC, the more efficient the company in managing its cash flows and
the better a firm profitability (Padachi, 2006).
2.1.24. Measures of Profitability
According to Eljelly (2004), profitability is the ability to create an excess of
revenue over expenses in order to attract and hold investment capital.
Four useful measures of firm’s profitability are the rate of return on firm’s assets
(ROA), the rate of return on firm’s equity (ROE), operating profit margin and net
firm income. The ROA measures the return to all firm’s assets and is often used as
an overall index of profitability, and the higher the value, the more profitable the
firm. ROA is an indicator of managerial efficiency and also shows how the firm’s
management converted the institution’s assets under its control into earnings
(Falope & Ajilore, 2009).
The ROE measures the rate of return on the owners equity employed in the firm
(Pandey, 2005). ROE indicates how well the firm has used the resources of
owners.
The operating profit margin measures the returns to capital per naira of gross firm
revenue. It focuses on the per unit produced component or earned profit and the
asset turnover ratio.
53
The net income comes directly on the income statement and it is calculated by
matching firm revenue with expenses incurred to create revenue, plus the gain or
loss on the sale of firm capital assets (Gitman, 2006).
2.1.25. Liquidity
Liquidity has been defined by Eljelly (2004) as the ability to convert an asset to
cash with relative speed and without significant loss in value. Liquidity measures
the ability of the firm to meet financial obligations as they fall due, without
disrupting the normal, ongoing operations of the business (Smith, 1980).
A frequent cause of liquidity problems occurs when debt maturities are not
matched with the rate at which the business assets are converted to cash (Eljelly,
2004).
Liquidity ratios measures the firm’s ability to meet current obligations, and are,
calculated by establishing relationships between current assets and current
liabilities (Pandey, 2005).
2.1.26. Nature of Working Capital
Working capital management is centred on problems arising in attempting to
manage the current assets, the current liabilities and the interrelationship that
exists between them. As explained earlier, the term current assets refer to those
assets which business will be converting into cash within one year without
experiencing a dwindling in value and upsetting the operations of the company.
Most major current assets are cash, marketable securities, accounts receivable and
inventory.
Current liabilities are referred to those liabilities that are intended at the beginning,
payable in the ordinary course of business, within a year, out of the current assets
54
or earnings of the concern. Among the essential current liabilities are accounts
payable, bills payable, bank overdraft, and outstanding expenses. The Principal
objective of working capital management is to manage the company’s current
assets and liabilities in such a way that a satisfactory level of working capital is
maintained. It is so due to the fact that if the company cannot sustain an acceptable
level of working capital, it is certainly may lead into what is termed insolvency
and may end up into bankruptcy.
Current assets must be large as much as necessary to be able to cover its current
liabilities to guarantee a reasonable margin of safety. All of the current assets are
to be managed efficiently so as to maintain the liquidity of the company; while not
keeping too high a level of any one of them. Every of the short-term bases of
financing must be managed continuously to guarantee the possible best way usage.
Hence, the interaction between current assets and current liabilities is the main
premise of the theory of working management.
The central elements of the theory of working capital management includes its
definition, need, optimum level of current assets, the trade-off between
profitability and risk which is associated with the level of current assets and
liabilities. In addition to financing mix strategies and so on.
2.1.27. Trade-Off between Profitability and Risk
While carrying out the evaluation of a company NWC position, one important
consideration is the trade-off between profitability and risk. This is to say that the
level of NWC has a bearing on profitability and also on risk. The term profitability
employed in this framework is a measure of profits after expense. Risk is the
probability that a company will develop into technically insolvent so as not be able
to meet its obligations whenever they are due for payment The risk of becoming
technically insolvent is measured using NWC. It is assumed that the greater the
amount of NWC, the less risk prone the company is. Or, the greater the NWC, the
55
more liquid is the company and, therefore, the less likely it is to become
technically insolvent. On the contrary, lower of NWC and liquidity are connected
with rising levels of risk. The correspondence between liquidity, NWC and risk is
such that if either NWC or liquidity increases, the Company’s risk decreases
If a company is to increase its profitability, it risk must also be increased.
Similarly, if it is to decrease risk, it must decrease profitability. The tradeoff
between these variables is that in spite of how the company increases its
profitability in the course of the manipulation of working capital, the effect is a
corresponding increase of a related increase in risk as determined by the level of
NWC. The consequences of changing current assets and current liabilities on
profitability-risk trade-off are discussed first and afterwards they have been
integrated into an overall theory of working capital management.
While evaluating the profitability-risk trade-off related to the level of NWC, three
basic assumptions, which are generally true, are:
that we are dealing with a manufacturing company
that current assets are less profitable than fixed assets; and
that short-term funds are less expensive than long-term funds
2.1.28. The Efficient Management of Firm’s Working Capital
Decisions relating to working capital and short-term financing are referred to as
working capital management. It involves managing relationships between a firm’s
short-term assets and its short-term liabilities. Its goal is to ensure that a firm is
able to continue its operations and that it has sufficient cash flow to satisfy both
maturing and short-term debts, and upcoming operational expenses (Nwankwo &
Osho, 2010). Working capital decisions are reversible and based on cash flows and
profitability. Measurement of a firm’s cash flow is by the cash conversion cycle,
56
the net of days from the outlay of cash for raw materials, to receiving payments
from customers. This metric makes explicit the inter-relatedness of decisions
relating to inventories, accounts receivables and payable, and cash. This
effectively corresponds to the time the firm’s cash is tied up in operations and
unavailable for other activities (Vedavinayagan, 2007).
The profitability measure of a firm’s working capital compares the returns on
capital (ROC) which results from working capital management, with the cost of
capital, resulting from investment decisions (Barine, 2012). Firm value is
enhanced when ROC exceeds cost of capital. In combination of these criteria,
firm’s management combines policies and techniques for managing of working
capital. These policies aim to mange current assets, cash and its equivalents,
inventories, debtors, and short-term financing such that cash flows and returns are
acceptable (Akinlo, 2011). Cash management identifies the cash balance which
allows for the business to meet day-to-day expenses while reducing cash holding
costs. Inventory management identifies the level of inventory which allows for
uninterrupted production while reducing investments in raw materials and
minimizing re-ordering costs, and hence increasing cash flow (Teruel & Solano,
2007).
Debtor’s management identifies appropriate credit policy i.e. credit terms which
will attract customers, such that any impact on cash flows and the conversion
cycle will be offset by increased revenue and hence return on capital. Short-term
financing management identifies the appropriate sources of financing given the
cash conversion cycle. Though it is agreed in financial theory that inventory is
ideally financed by credit granted by the supplier, firms may need to utilize
overdraft or convert debtors to cash through factoring (Pandey, 2005).

57
Investments in customers credit in the form of accounts receivables and
inventories of goods or materials are long-term resource commitments.
Minimization of these investments relative to the level and pattern of a firm’s
operation is crucial in the total management of operating funds. The key to a
successful management of customer’s credit and inventories according to Helfert
(2003), is a clear understanding of the economies of trade-off involved in it. Credit
terms are a function of the competitive environment as well as of a careful
assessment of the nature and credit worthiness of the customers.
Involved in this is the decision on whether extended credit terms, and the resulting
rise in receivables outstanding are compensated for by the contribution from any
incremental sales gained (Mathuva, 2009). Similarly, extending normal credit to
marginal customers need to be carefully assessed in terms of risk of delayed
payments or default, compared with contribution from sales gained (Wang, 2002).
To forestall adverse effects of credit on firms operations, working capital
efficiency require constant updating of credit performance, and developing sound
criteria for credit extension. Efficiency in credit management ensures that a firm’s
is able to pay its bills on time and carry sufficient stocks (Elizalde, 2003).
Inventory management in successful firms, according to Hadley (2006), evolved
into a rigorous process of maximizing assets. This he added is made possible by
advances in information technology, leading to reduction inventory levels. Efforts
to reduce investments in inventory yielded the just-in time deliveries by suppliers
to customers and carefully rescheduled restocking triggered by instantaneous
purchase data from supplies available in the press and the internet (Barine, 2012).
In effect, these techniques have created a close relationship between major
suppliers and customers usually with electronic linkages of inventories, order,
processing and production scheduling. This allows for timely co-ordination of

58
schedules and minimization of firm’s inventories and associated investments costs
(Samiloglu & Derimirgunes, 2008).
Efficiency in working capital management requires a firm to make use of credit
terms extended to it, balancing such with favourable trade-offs for early payments
from customers with discounts. Accounts payable, a form of working capital
finance to this end should be maximally used by firms (Kulter & Dermirgunes,
2007).
Pandey (2005) suggested the exceeding of normal credit terms deliberately, as
such making the interest pay-off more favourable; cautioning of the risk of
affecting the company’s credit standing if delays beyond the credit terms granted,
become habitual. Sound management of supplier’s credit, thus requires current up-
to-date information on accounts and aging of payables to ensure proper payments
(Mona, 2012).
Firms are going concerns requiring working capital for its day-to-day operations.
Though current, their investments should be considered a long-term commitment
to ensure proper planning and commitment of resources, unless the firm is
characterized by significant seasonal or cyclical fluctuations. This central
importance of working capital to the operational efficiency has co-opted firm’s to
put much emphasis on adequate planning, co-ordination and control of its working
capital to reduce associated costs and increase revenue and profitability
(Appuhami, 2008).
Management of working capital in financing theory is possible using ratios. The
ratios used to analyze components of working capital; attempts to express the
relative effectiveness with which inventories and receivables are managed. They
aid in detecting signs of deterioration in value, or excessive accumulation of
inventories and receivables. Inventories are related to sales and cost of sales to

59
determine changes in relationship overtime. Accounts receivables are also related
to sales to determine changes overtime (Gitman, 2006). The debtors-to-credit
sales; and creditors-to-purchases ratio to establish the length of time it takes a firm
to pay its suppliers (Uyar, 2009).
The liquidity ratios, of current and acid-test, are used to determine the
responsiveness of a firm to pay for its liabilities. According to Pandey (2005), the
ideal levels of these ratios are 2:1 for current ratio, and 1:1 for acid-test ratio.
Working capital turnover ratio focuses on working capital items only, relating
sales revenue to working capital. The cash conversion cycle determines the length
of time for cash to complete the operating cycle, from time of purchase of
materials with cash to time of sales and recovery of cash. This cycle which is a
measure of firm’s liquidity, according to Richards and Laughlin (1980), indicates
the time interval for which additional short term financing might be needed to
support sales. These measures of turnover, gives an indication of how well a firm
managers particular subsets of its assets, and regular analysis ensures early
detection of signs of deterioration in value or excessive accumulation of
inventories and receivables (Barine, 2012).
2.1.29 . The Consequences of Inefficient Management of Working Capital
Firms acquire fixed assets with which it intends carrying on its business. These are
long-term and capital in nature. They require consumable inputs to yield the
desired purpose for their acquisition. The consumables are necessary for the
operation of fixed capital assets of the firm. These consumables are raw materials,
finance, labour and overheads. The combination of these for production and
service delivery, outputs finished products and services to meet customer needs
and firm sales and profit objectives. These consumable their absence causes
embarrassment to the firm (Block & Hirt, 2005).

60
Illiquidity makes a firm unable to meet its cash requirements: payment for raw
materials, salaries, overheads and debts. Non-availability of raw materials will
result in a firm being unable to meet production runs, with resultant production
shut down; and inability to meet customer demand. This is more pronounced in
period of expanding sales (Barine, 2012). Insufficient cash results in delay in
payment to suppliers, lenders, labour and payment for overheads; resulting in
withdrawal of input supplies by suppliers. These affect production, cause labour
strike and turnover, absence of necessary overheads for production and operation’
and finished goods supply shortage. Insufficient finished goods to meet customer
demands cause customer disappointment, loss of their goodwill and patronage, lost
sales and profit. The non-availability of these consumables-components of
working capital results in disruption of production and disappointment of
customers (Akinlo, 2011).
Carrying out the day-to-day business of a firm is essential for achieving the
operational, sales and profit objectives of the firm. Prompt execution of production
and sales schedules is a function of prompt delivery of raw materials inputs,
provision of overheads, payment for labour services and availability of finished
goods (Pandey, 2005). The profit level of a firm is a measure of efficiency in the
use of firm resources in operation, measured as the difference between cost of
operation and sales (Howorth, 2003).
The lower the cost expended on operations in a firm, the higher will be the profit
of the firm, a measure of operational efficiency. Input materials, overheads, labour
and finished goods quality should be high and cheap to achieve production
efficiency, high patronage and profit (Singh & Pandey, 2008).
2.1.30. The Costs and Benefits of Firm’s Investments in Working Capital
61
Working capital component are controllable y firms management. Empirical
studies reveal that investments in firm’s working capital have attendant costs and
benefits. Firms reduce investments in inventories of raw materials to accumulate
cash, with the risk of running out of inventories and production halt.
Reduction in money tied up in receivables, by reducing credit to customers result
in their patronizing the firm’s competitors. Cost of firm’s investment in
receivables is the interest that would have been earned if customers had paid up
quickly or interest paid on finance borrowed to acquire the current assets (Pandey,
2005). The firm also forgoes interest of investing such in marketable securities.
The cost of holding inventory is the storage cost, insurance costs, and risks of
spoilage, obsolescence and the opportunity of cost of capital (Barine, 2012). These
costs encourage firms to hold current assets to a minimum. Carrying costs
discourages large investments in inventories; and low level of inventories make it
more likely that the firm will face shortage costs. Running out of inventory will
result in inability of the firm fulfilling orders (Eljelly, 2004).
Holding little cash will require the firm selling securities to meet up its cash, and
incurring capital market trading costs. Minimization of accounts receivables,
restrict credit sales and loss of customers. These according to Brealey, Myers and
Allen (2008), suggest the need for striking a balance between the cost and benefits
of current assets thereby findings the level of current assets that minimizes the
sum of carrying costs and shortage costs.
Firms are going concerns requiring working capital for its day-to-day operation.
Though current, their investment should be considered a long-term commitment to
ensure proper planning and commitment of resources, unless the firm is
characterized by significant seasonal or cyclical fluctuations. This central
importance of working capital to the operational efficiency thus require firm’s to

62
put much emphasis on adequate planning, co-ordination and control of its working
capital to reduce associated costs and increase revenues.
2.1.31. The Nigerian Economy and Working Capital Management of Quoted
Firms in Nigeria
Nigerian firms as others the world over, utilize working capital for smooth
operation. They plan for and manage their inventories, cash, receivables and
payables, to ensure that requirements in these items are met (Barine, 2012). Raw
materials are needed for production; finished goods inventory to meet customers
demand, sales and profit objectives of firms. Cash is necessary to meet the
liquidity of Nigerian firms. Considering the low per-capital income and disposable
income of Nigerian consumers, Nigerian firms offer trade credit to customers,
creating accounts receivables (Akinlo, 2011). These firms also take advantage of
trade credit from other firms, creating accounts payables. The little working
capital available to Nigerian firms is managed by them to avoid operational
embarrassments (Akinlo, 2011).
The Nigerian economy characterized by low capacity utilization of firms,
infrastructural breakdown, unstable monetary policies, lack of local raw materials
inputs, unstable foreign exchange market, multiple taxation, low level of
disposable income and purchasing power of citizens, and high cost of finance, has
negatively impacted on the working capital situation of Nigerian firms (Barine,
2012). He stated further that liquidity situations of these firms are negative due to
the high interest charged on bank loans obtained by them to meet short-term
financial obligations, also necessitated by failed trade credit policies to customers.

63
Multiple taxes by the three tiers of governments have worsened the financial
situations of Nigerian firms.
Raw materials inputs, mostly imported, are affected by unstable foreign exchange
market and monetary policies of the government. Raw materials inventory are thus
affected by inadequate foreign exchange for importation, delays in clearing at the
Nigerian port, and poor transportation network. These affect the production runs
of Nigerian firms and delivery of finished goods to customers (Jinadu, 201).
Retailers importing finished goods are also affected by these factors. Local
delivery of raw materials to firms and delivery of finished goods to customers, are
hampered by poor transport infrastructures in the country. Low level of disposable
income and purchasing power of citizens affect patronage of firm’s products. This
does not favour holding of large inventories with attendant costs. Thus firms opt
for the just-in-time system which is negatively affected by poor infrastructure.
High cost of debts ad overdraft in Nigeria limits the short-term finance of Nigerian
firms to collections on sales, hampering growth in net working capital (Nwankwo
& Osho, 2010).
These factors have negatively affected the working capital positions, planning,
management, and the operational efficiencies of Nigerian firms, exposing them to
operational embarrassments, though improvements in working capital positions of
quoted firms have been recorded since increase in capital base of bank to N25
billion (Barine, 2012).
2.20. Theoretical Framework
There have been various opinions on working capital management which has
generated some theories that are used in explaining the relationship that exist
between some guiding concepts in working capital management (Ramachandran
& Janakiramank, 2007). Beaumont & Begemann (1997), for instance, emphasized

64
that the major concepts of the working capital management are profitability and
liquidity. They pointed out that there exist a trade-off between profitability and
liquidity. Thus, the relationship between profitability and working capital helps to
understand the relationship between profitability and liquidity, the dual goals of
the working capital management (Ghosh and Maji, 2004). Although, it is viewed
by many that, the scholars who have written on this relationship have not
completely synthesized their various hunches into a theory. However, there is a
noticeable consistency in the use of few guiding concepts in working capital
management literature (Falope & Ajilore, 2009). These concepts constitutes what
is here labeled the theoretical framework, after all, a theory is a supposedly tenable
explanation about a relationship.
The relevant working capital theories identified in the literature and used for this
study are: the operating cycle theory, the cash conversion cycle theory, the
pecking order theory, agency theory and the risk-return trade off theory and are
explained as follows:
2.2.1. The Operating Cycle Theory
This theory looks explicitly at one side of working capital (that of current asset
accounts) and therefore gives income statement measures of firm’s operating
activities, that is, about production, distribution and collection (Falope & Ajilore,
2009). Receivables, for instance, are directly affected by the credit collection
policy of the firm and the frequency of converting these receivables into cash
matters in the working capital management. By granting the customers more
liberal credit policy, the profitability will be increased but at the same time
liquidly will be scarified (Smith 1980). The same analysis goes for other
components of current assets account. However, the operating cycle theory tends o
be deceptive in that it suggests that current liabilities are not important in the
course of firm’s operation (Falopre & Ajilore 2009) Our understanding of

65
accounts payable as the source of financing the firm’s activities can be assailed as
a result. The operating cycle theory therefore has a shortcoming of not including
current liabilities in its analysis.
2.2.2. The Cash Conversion Cycle (CCC) Theory
This theory integrates both sides of working capital. It infuses current liabilities in
the working capital in order to enhance analysis and to overcome the inadequacies
of the operating cycle theory. In their seminar paper, Richards & Laughlin (1980)
devised this method of working capital as part of a broader framework of analysis
known as the working capital cycle. They claimed that the method is superior to
other forms of working capital analysis that rely on ratio analysis or a
decomposition of working capital as claimed in the operating cycle theory.
Therefore CCC is the length of time between actual cash expenditures on
productive resources and actual cash receipts from the sale of products or services
(Elijelly, 2004). The cash conversation cycle has been interpreted as a time
interval between the cash outlays that arises during the production of output and
the collection of accounts receivable (Dong & Su, 2010). The cash conversion
cycle is calculated by subtracting the accounts payable deferral period from the
sum of the inventory conversation period and the accounts receivable conversion
period (Falope & Ajilore, 2009). CCC is likely to be negative as well as positive
(Padachi, 2006).
A positive result indicates the number of days a company must borrow or tie up
capital while awaiting payments. A negative result indicates the number of days a
company has received cash from sales before it must pay its suppliers. (Haris,
2005). However, the ultimate goals is having low CCC, if possible negative,
because the shorter the CCC, the more efficient the company in managing its cash
flows and the better a firm’s profitability (Padachi, 2006). This means that the firm
uses less of external financing and less of time for cash tied up in current assets.
66
2.2.3. The Pecking Order Theory
The pecking order theory takes into consideration the information asymmetry
which indicates that managers know more about the firm’s value than potential
investors (Myers & Majluf, 1984).
Jensen (1994) opined that the order is based on the consideration that resources
generated internally do not have transaction costs and the fact that issuing new
bonds tend to send positive information about the company while issues of new
stock signal negative information about the issuing company. This explainS why
more profitable companies usually prefer to hold less debts and why the less
profitable companies issue bonds to finance investment decisions in fact, the less
profitable companies also prefer issuing debts before the decision to issue new
stocks.
In support of the pecking order theory, Brealey, Myers and Allen (2008) posited
that not only managers of less profitable companies but also managers of more
profitable companies would choose a more aggressive working capital policy,
pressuring for lower level of current assets and higher level of financing through
suppliers, in order to source internally the needed funds to finance their companies
and to avoid issuing debts and equity.
2.2.4 Agency Theory
Jensen and Meckling (1976) asserts that a firm can be seen as a nexus of a set of
contracting relationships among individuals by means of which shareholders
(principal) delegate every day decisions about the firm to managers (agent) who
should use their specific knowledge and the firm’s resources to maximize
principal agent’s return. However, the interest and decisions of mangers do not
always align to the shareholders interest, resulting in agency costs or problem
(Jensen, 1994). Jensen and Meckling 91976) defined agency cost as the sum of the
67
expenses in monitoring by the principal, the bonding expenditures by the agent
and the inevitable residual loss derived from the separation of ownership and
control. The cause of agency problems is the separation of ownership and control
(Jensen, 1994).
Shareholders must therefore encourage management to utilize internal funds to
their benefit. Easterbrook (1984) suggest that when managers have a substantial
part of their human capital allocated in company’s share, they tend to take
decisions to enhance the profitability of company’s survival. These decisions can
be reflected n a conservative management of working capital, reducing the risk
involved in the business operation, such as: to keep high level of inventories
beyond the process cycle needs, to offer credit terms above the product turnover,
to accept low payment terms not aligned to the market practices, and so on. These
investment decisions would be translated in excess of working capital (Jensen,
1994).
2.2.5. The Risk –Return Trade-Off Theory
This theory is concerned with how firms avoid taking additional risk unless
compensated with additional returns. Working capital decisions provide a classic
example of the risk-return nature of financial decision making. Increasing a firm’s
net working capital, current assets less current liabilities, reduces the risk of a firm
not being able to pay its bills on time. This at the same time reduces the overall
profitability of the firm. Working capital management involves the risk-return
trade-off: not taking additional risk unless compensated with additional returns
(Akinlo, 2011).
The existence of a firms according to Barine (2012), depend on the ability of its
management to manage the firm’s working capital. He stated further that working
capital management involves the process of converting investment in inventories
and accounts receivable and finally into cash for the firm to use in paying its
68
operational bills. As such, working capital management he added, is thus at the
very heart of the firm’s day-to-day operating environment, and improving
corporate profitability.
2.30. Review of Empirical Studies
The study on the relationship between working capital management efficiency and
profitability has attracted great attention from both academic and financial
practitioner for many years and is still ongoing. This is evident in the number of
studies conducted in this area over the years. In fact, many previous studies have
indicated the relationship between working capital management efficiency and
profitability of firms in different firms across industries as well as in different
environments. Shin & Soenen (1998) used a sample of 58,985 firms listed in the
Unite State Stock Exchange during the period spanning from 1975-1994 in order
to investigate the relationship between CCC and the profitability of the firms.
They found a significant negative relationship between the lengths of the firm’s
CCC and its profitability. The result suggests that WCM has an important impact
on the profitability of the firms.
Deloof, (2003) in turn investigated the relationship between working capital
management and corporate profitability for a sample of 1,009 large Belgian non-
financial firms for the period 1992-1996. The result from his analysis showed that
there was a significant negative relationship between profitability that was
measure by gross operation income and cash conversion cycle as well as the
number of days accounts receivable, accounts payable and inventories. The results
suggest that managers can increase corporate profitability by reducing the number
of days account receivables and inventories while less profitable firms waited
longer to pay their bills. These results show that there is a certain level of WC that
maximizes the value of the firms.

69
In the Mauritian context, Padachi (2006) analyzed the trends in working capital
management and its impact on firm’s performance using 16 manufacturing firms
in Mauritian for the period of five years spanning from 2000-2004. His study
revealed that inventory and accounts receivable periods were negatively correlated
with the profitability, indicating that managers of firms can create value by
reducing the firm’s outstanding periods of accounts receivable and inventories.
Contrary to results of similar works which shows negative relationship between
CCC and profitability, his results from CCC shows positive relationship between
CC C and profitability measured by ROA. This result indicates that resources are
blocked at different stages of supply chain, thus prolonging the operating cycle
which could lead to increase in sales and higher profits. However, this is possible
only if the benefit of keeping more inventories is greater than the cost of tied up
capital.
Lazaridis & Tryfonidis, (2006) investigated the relationship between working
capital management and corporate profitability listed companies in the Athens
Stock Exchange. A sample of 131 listed companies for the period of 2001-2004
was used to examine this relationship. The result from regression analysis
indicated that there was a statistical significant negative relationship between
profitability, measured through gross operating profit, and the cash conversion
cycle. From those results, they claimed that the managers could create value for
shareholders by handling correctly the cash conversion cycle and keeping each
difference component to an optimum level.
Raheman & Nasr, (2007) used a sample of 94 Pakistani firms listed on Karachi
Stock Exchange (KSE) for a period 6 years from 1999-2004 to study the effect of
different components of working capital management on the net operating profits.
From the result of the study, they showed that there was negative relationship
between variables of working capital management including the average collection

70
period, inventory turnover in days, average payment period, cash conversion cycle
and profitability. Besides, they also indicated that size of the firm measured by
natural logarithm of sales and profitability had a positive relationship.
Ramachandran & Habjurabnab (2007) investigated the relationship between
working capital management efficiency and earnings before interest and taxes of
the paper industry in India listed on BSE. A sample of 30 listed companies for the
period of 1997-1998 to 2005-2006 was used to examine this relationship. The
result revealed that the paper industry has managed working capital satisfactorily.
The accounts payable days has a significant negative relationship with earnings
before interest and taxes (EBIT), which indicates that by deploying payment to
suppliers they improve the EBIT. They concluded that even though the paper
industry in India performs remarkably well during the period, les profitable firms,
however, wait longer to pay their bills, and pursue a decrease in cash conversion
cycle.
Singh & Pandey, (2008) had examined the working capital components and the
impact of working capital management on profitability of Hindalco Industry
Limited for the period of 1900-2007. Results of their study showed that current
ratio, liquidity ratio, receivables turnover ratio and working capital to total assets
ratio had statistically significant impact on the profitability of Hindalco Industries
Limited.
Gill, Bigger and Mathur (2010) investigated the relationship between working
capital management and profitability of 88 American manufacturing firms listed
on New York Stock Exchange for a period of 3 years (2005 to 2007). Using
weighted least square (WLS) regression analysis for data analysis, the study
revealed that cash conversion cycle and number of days inventory were positively
related to profitability whole number of days accounts receivable and number of
days accounts payable had a negative relationship with profitability.
71
Hayajneh and Yassine (2011) investiaged the relationship between working capital
management efficiency and the profitability of 53 Jordanian manufacturing firms
listed on Amman Stock Exchange for the period (2000 to 2006). The data for the
study was analyzed using simple regression analysis. The study revealed that
profitability had a significant negative relationship with number of days inventory
and number of days accounts payable while number of days accounts receivable
had a significant positive relationship with profitability.
Afza & Nazir (2009) investigated the traditional relationship between working
capital management policies and a firm’s profitability for a sample of 204 non-
financial firms listed on Karachi Stock Exchange (KSE) for the period 1998-2005.
Study found significant differences among their working capital requirements and
financing policies across different industries. Moreover, regression result found a
negative relationship between the profitability of firms and degree of
aggressiveness of working capital investment and financing policies. They
suggested that managers could create value if they adopt a conservative approach
towards working capital investment and working capital financing policies.
In Nigeria, Falope & Ajilore (2009) investigated the effect of working capital
management on profitability performance for a panel made up of a sample of 55
Nigerian quoted non-financial firms for the period of 1996-2005. They found a
negative relationship between net operating profitability and the average collection
period, inventory turnover in days, average payment period and cash conversion
cycle. They concluded that managers can create value for their shareholders if they
can manage their working capital in more efficient ways by reducing the number
of days account receivable and inventories to a reasonable minimum.
Akinlo (2011) investigated the effect of working capital on profitability of 66
firms in Nigeria for the period 1999 to 2007. Using the dynamic panel general
method of moments in analyzing the data, the study revealed that sales growth,
72
cash conversion cycle, number of days accounts receivable and number of days
inventory period had positive relationship with profitability while leverage and
number of days accounts payable had negative relationship with profitability.
Finally, Dong & Su (2010) investigated the relationship between working capital
management and profitability for a sample of 130 firms listed on Vietnam Stock
Market for the period of three years spanning from 2006-2008. Their study shows
that there is a strong negative relationship between profitability measured through
gross operating profit, and the cash conversion cycle. This means that as the cash
conversion cycle is increases, it will lead to declining of profitability of firm. They
concluded that managers can create a positive value for the shareholders by
handling adequate cash conversion cycle and keeping each different component to
an optimal level.
A survey of the empirical review presented above shows different opinions on the
Impacts of Working Capital Management on the profitability of firms in different
environments. It can also be observed from the review of empirical studies that
the few studies from Nigeria on the subject have all focused on the aggregate
study of non-financial firms across industries in Nigeria.
They did not present a sectorial approach to the study that may allow for sectorial
comparism. Lack of empirical evidence on the impact of working capital
management on the profitability of firms within a specific industry in Nigeria
coupled with lack of consensus among researchers on which of the explanatory
variables of WCM that will impact, either positively or negatively on the
profitability of firms, as shown in the empirical studies have therefore, made this
study imperative. The researcher also extends his study by making use of recent
data to permit the analysis of trend in working capital management need of firms
in Nigeria.

73
It is in view of this lack of empirical studies on the impact of WCM on the
profitability of firms in specific industry in Nigeria that the present study examine
the impact of WCM on the profitability of Nigerian manufacturing companies in
order to identify those measures of WCM that have significant impact on the
profitability of manufacturing companies in Nigeria and thereby narrowing the
existing gap in the literature on the study.
2.31. Summary of Literature Review
Management of Working Capital is important to the financial health of business of
all sizes. This is so, because the amount invested in WC is often high in proportion
to the total assets employed and it is vital that these amounts are used in an
efficient and effective way (Padachi, 2006).
This chapter therefore, presents the review of work previously done by researchers
or scholars in different industries and firms on the subject matter with study design
and research methods similar to this researcher’s work.
Most of the empirical studies support the traditional belief that there is
statistically, a significant relationship between profitability and measures of
Working Capital. They explained that a well designed and implemented WCM is
expected to contribute positively to the creation of firm’s value. Managers can
create profit by correctly handling the individual components of working capital to
an optimal level. However, divergent to traditional belief, other researchers are of
the view that more investments in WC (conservative policy) might also increase
profitability. When high inventory is maintained, it reduces the cost of
interruptions in the production process, decrease in supply cost, protection against
price fluctuation and loss of business due to scarcity of products. (Blinders and
Maccini, 1991)
74
Measures of WC such as the cash conversion cycle, inventory period, cash
management, receivables e.t.c. are as well extensively analysed in the chapter.
REFERENCES
Afza, T. and Nazir, M. (2009). “Impact of aggressive working capital management policy
on firm’s profitability”. The IUP Journal of Applied Finance, 15 (8), 20 – 30.
Akinsulire, O. (2005). Financial management. Lagos: El-Toda Ventures.
Deloof, M. (2003). “Does working capital management affect profitability of Belgium
firms”? journal of Business Finance and Accounting, 30 (3), 573-588.
Dong, H.P. and Su, J. (2010). “The relationship between working capital management
and profitability: A Vietnam Case”. International Research Journal of finance and
Economics, 49(3),62-70.
Ejelly, A.M. (2004). “Liquidity-profitability trade off: An Empirical Investigation in an
emerging market”. International Journal of Commerce and Management, 14 (2)
48-61.
Falope, O.I. and Ajilore, O.T. (2009). “Working capital management and corporate
profitability: Evidence from Panel Data Analysis of selected quoted companies in
Nigeria”. Research Journal of Business Management, 3(3)73-84.
Filbeck, G. and Krueger, T. (2005). “Industry related differences in working capital
management”. Mid-American of Business, 20(2), 11-18.
Filbeck, G., Krueger, T. and Preece, D. (2007). “CFO magazine’s working capital
surveys: Do selected firms work for shareholders”? Quarterly Journal of Business
and Economics, 46(2)3-22.
Hadley, L. (2006). “International working capital management”. The Business Review
Cambridge, 5 (1)233-239.

75
KPMG, (2005). Working capital management survey: How do European companies
manage their working capital? KPMG LLP.
Krueger, T. (2002). “An analysis of working capital management results across
industries”. Mid-American Journal of Business, 20(2), 11 – 18.
Lamberson, M. (1995). “Changes in working capital of small firms in relation to changes
in economic activity”. Journal of Business, 10(2), 45-50.
Lazaridis, I. and Tryfonidis, D. (2006). “Relationship between working capital
management and profitability of listed companies in the Athens Stock Exchange”.
Journal of Financial Management and Analysis, 19(1)26-35.
Ohikhena, P. (2006). Research methodology in the social and management sciences.
Lagos, Nigeria: Bunmico Publishers.
Oxford (2005). A dictionary of accounting, 3 ed. Oxford University Press.
Pandey, I.M. (2005). Financial management, 9 ed. New Delhi Vikas Publishing House
PVT Ltd.
Padachi, K. (2006). “Trends in working capital management and its impact on firm’s
performance: An analysis of Mauritian small manufacturing firms”. International
Review Business Research Papers, 2(1), 45-56.
Prasad, R.S. (2001). “Working capital management in the paper industry”. Finance India,
15(1),185-188.
Rahaman, A. and Nasr, M. (2007). “Working capital management and profitability: Case
of Pakistani firms”. International Review of Business Research, 3 (2)275-296.
Ramachandran, A. and Janakirma, M. (2007). “The relationship between working capital
management efficiency and earnings before interest and taxes (EBIT)”. Journal of
Managing Global Transitions, 7 (1), 61-74.
Shin, H.H. and Soenen, L. (1998). “Impact of working capital and corporate
profitability”. Journal of Finance Practice and Education, 8(2)37-45.
Smith, K. (1980). Profitability versus liquidity trade offs in working capital management,
in readings on the management of working capital. New York, St. Paul: West
Publishing Company.

76
VanHorne, J.C. (1977). “A risk-return analysi8s of a firm’s working capital position”.
Financial Economics, 2(1)71-88.
VanHorne, J.C. and Wachowiez, J.M. (2004). Fundamentals of financial management, 12
ed. New York: Prentice Hall.

77
CHAPTER THREE
METHODOLOGY
4.0 Introduction
The main objectives of this study is to ascertain the relationship between working
capital management and the corporate performance of Nigerian manufacturing
companies listed on the Nigerian stock exchange (NSE). This chapter focuses on
the following key areas; research design, population of the study, sampling
technique and sample size, sources of data collection, variables of study, data
analysis techniques, model specification an limitation of the study.
4.1 Research Design
The concept of research design refers to the specification of relevant procedures
for collecting and analyzing data, which would help solve the problem under study
(Prasad, 2001).
This study adopts an ex-post facto design and uses only secondary data from the
financial statement of manufacturing companies listed on the Nigerian stock
exchange (NSE) from 2008 to 2012. The ex-post facto design is adopted because
the variables used in this study are readily available and obtained in the audited
financial statements of the sampled manufacturing companies without being
manipulated or controlled and the variable cannot be studied experimentally but
the effect of relationship between the independent variables and the dependent
variable can be established. Similarly, the availability of these data underlines the
choice of time period to the study. Therefore, the data used for the analysis relate
to the ten sampled manufacturing companies listed on the Nigerian stock exchange
for the period of five years spanning from 2008 to 2012.
78
4.2 Population Of The Study
The population of this study is made-up of the 134 manufacturing companies
listed on the Nigerian stock exchange during the period of study and the reason for
the choice of this market is primarily due to the reliability of the financial
statements. Audited financial statements are reliable as auditors certify them.
4.3 Sampling Techniques And Sample Size
The study uses judgmental sampling techniques to select the sample based on the
following criteria:
Companies must remain listed on the Nigerian Stock Exchange (NSE)
during the 2008 – 2012 periods.
Companies must have complete financial statements for the period under
review.
Companies must be operational within the period under investigation.
Twenty (20) manufacturing firms met the criteria set out and they cut across all
sectors. Please Appendix I.
4.4 Sources of Data Collection
In obtaining the necessary information for this study, compiled data (secondary
data) were used which (Miller, 1999) described as data which has received some
forms of selection. The choice of documentary secondary data which (Imonitie,
2004) termed as archival research was informed by the nature and objectives of
the study to establish relationship that subsists between working capital
management and corporate performance of manufacturing firms in Nigeria.
Therefore, relevant documents and records which are used for the study are from
the annual audited accounts of the 20 sampled companies and are obtained from
the NSE library. Various libraries such as the University of Nigeria library are all
visited for proper information and understanding of the study.
79
Finally, relevant academic research journals for the study were accessed on the
internet, downloaded and used with due care as per the requirement of the study.
4.5 Variables Used For The Study
The choice of the variables used for the study was primarily guided by previous
empirical studies and availability of data. Thus, the variables are defined to be
consistent with those of Falope and Ajilore (2009) and Dong and Su, 2010) as well
as other empirical literature cited in section 2.3 of this study.
Therefore, the variables used in this study based on previous researches, about the
relationship between WCM and firm’s performances are as follows:
4.5.1 Dependent Variable
The dependent variable is the variable that is been predicted or projected. In this
study, the dependent variable is the firm’s performance (profitability) measured by
the return on the assets (ROA). In order to investigate the relationship between
WCM and performance of the Nigerian manufacturing companies, Return on
Assets (ROA) is used as the dependent variable.
Return on assets (ROA) is an indicator of managerial efficiency and it shows how
the firm’s management converted the institution’s assets under their control into
earnings (Pandey, 2005). ROA is defined in this study as earnings before interest
and taxes (EBIT) divided by total book value of assets (TA) (Falope and Ajilore,
2009).
80
4.5.2 Independent Variables
Independent variable also known as the predictor or explanatory is the variable
that causes the change to happen anytime it is concomitantly manipulated with the
dependent variable. This study used three independent variables namely; accounts
receivable period, inventory period and cash conversion cycle, while sales growth
is used as control variable. Accounts payable was also used as an independent
variable but was excluded because it did not fit in the model. However, it is
defined in the study to explain the calculation of cash conversion cycle. The
variables are defined as follows:
a) Accounts Receivable Period (ACRP): This is the time between sales of
inventory and collection of receivables. It measures how long an
organization collects accounts receivable after sales. It is measured in days.
It can be expressed as Accounts receivables (AR) multiply by 365, divided
by sales.
b) Inventory period (INVP): Inventory period otherwise known as day’s sales
in inventory gives us a rough idea of how long stocks or inventory remain
in the store on average, before being sold. Closely related to the inventory
period is the inventory turnover which measures physical turnover of
trading stock during the period. The higher the turnover, the higher will be
the reported profits or vice versa, Cateris paribus but the higher or longer
the INVP, the lower the reported profits or vice versa. INVP is measured in
days while inventory turnover is given in times.
The INVP is the inverse of inventory turnover ratio. It is expressed as
inventories divided by cost of sales multiplied by 365. Inventory turnover
can be expressed as cost of sales divided by inventories (Igben, 2000 and
Ross, waster field and Jordan, 2003)
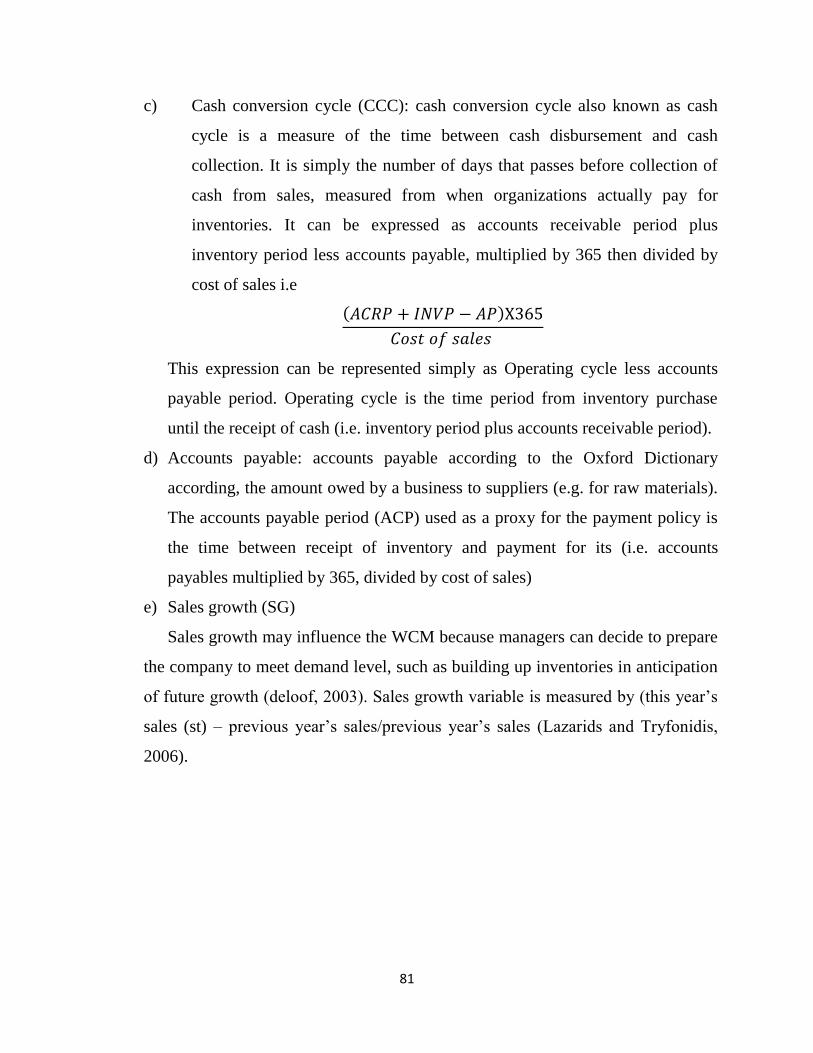
81
c) Cash conversion cycle (CCC): cash conversion cycle also known as cash
cycle is a measure of the time between cash disbursement and cash
collection. It is simply the number of days that passes before collection of
cash from sales, measured from when organizations actually pay for
inventories. It can be expressed as accounts receivable period plus
inventory period less accounts payable, multiplied by 365 then divided by
cost of sales i.e
(𝐴𝐶𝑅𝑃 + 𝐼𝑁𝑉𝑃 − 𝐴𝑃)X365
𝐶𝑜𝑠𝑡 𝑜𝑓 𝑠𝑎𝑙𝑒𝑠
This expression can be represented simply as Operating cycle less accounts
payable period. Operating cycle is the time period from inventory purchase
until the receipt of cash (i.e. inventory period plus accounts receivable period).
d) Accounts payable: accounts payable according to the Oxford Dictionary
according, the amount owed by a business to suppliers (e.g. for raw materials).
The accounts payable period (ACP) used as a proxy for the payment policy is
the time between receipt of inventory and payment for its (i.e. accounts
payables multiplied by 365, divided by cost of sales)
e) Sales growth (SG)
Sales growth may influence the WCM because managers can decide to prepare
the company to meet demand level, such as building up inventories in anticipation
of future growth (deloof, 2003). Sales growth variable is measured by (this year’s
sales (st) – previous year’s sales/previous year’s sales (Lazarids and Tryfonidis,
2006).
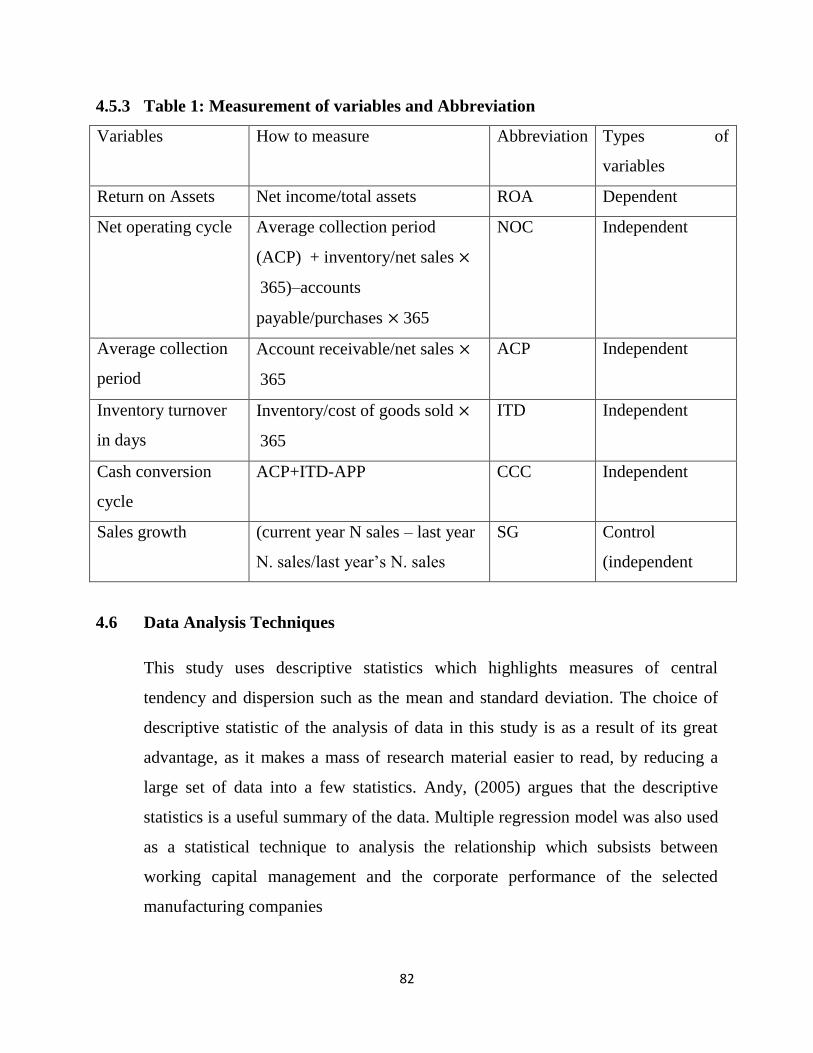
82
4.5.3 Table 1: Measurement of variables and Abbreviation
Variables How to measure Abbreviation Types of
variables
Return on Assets Net income/total assets ROA Dependent
Net operating cycle Average collection period
(ACP) + inventory/net sales ×
365)–accounts
payable/purchases × 365
NOC Independent
Average collection
period
Account receivable/net sales ×
365
ACP Independent
Inventory turnover
in days
Inventory/cost of goods sold ×
365
ITD Independent
Cash conversion
cycle
ACP+ITD-APP CCC Independent
Sales growth (current year N sales – last year
N. sales/last year’s N. sales
SG Control
(independent
4.6 Data Analysis Techniques
This study uses descriptive statistics which highlights measures of central
tendency and dispersion such as the mean and standard deviation. The choice of
descriptive statistic of the analysis of data in this study is as a result of its great
advantage, as it makes a mass of research material easier to read, by reducing a
large set of data into a few statistics. Andy, (2005) argues that the descriptive
statistics is a useful summary of the data. Multiple regression model was also used
as a statistical technique to analysis the relationship which subsists between
working capital management and the corporate performance of the selected
manufacturing companies
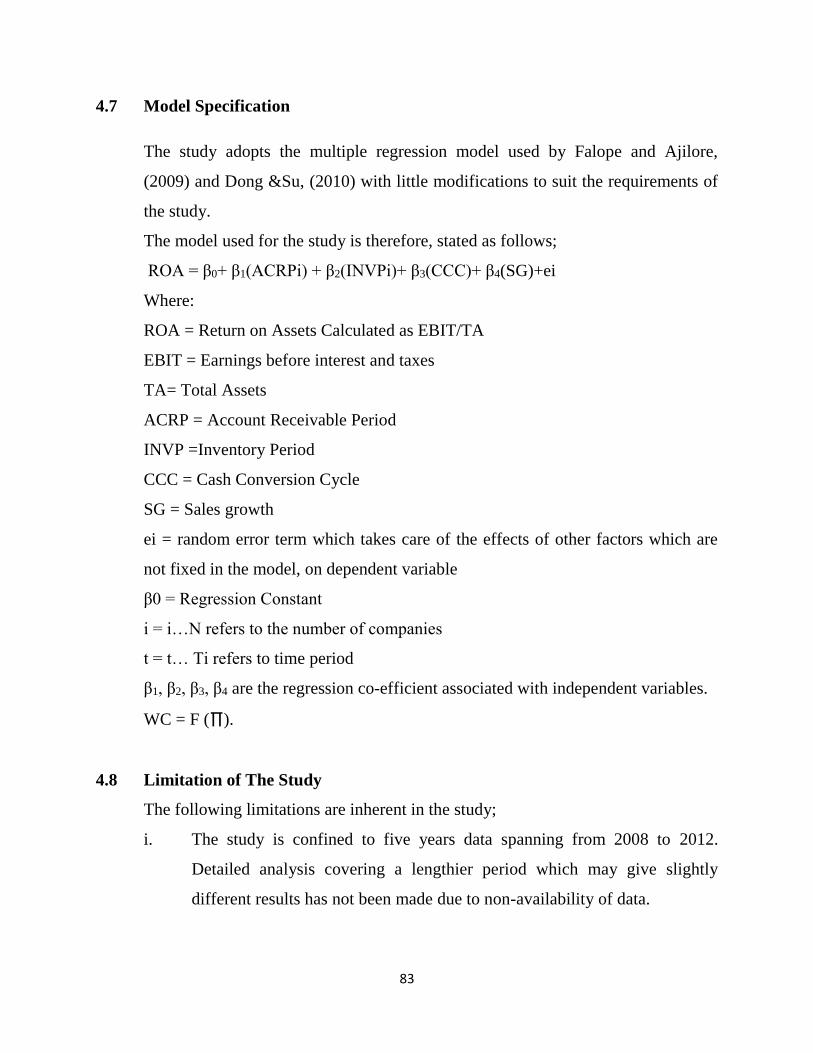
83
4.7 Model Specification
The study adopts the multiple regression model used by Falope and Ajilore,
(2009) and Dong &Su, (2010) with little modifications to suit the requirements of
the study.
The model used for the study is therefore, stated as follows;
ROA = β0+ β1(ACRPi) + β2(INVPi)+ β3(CCC)+ β4(SG)+ei
Where:
ROA = Return on Assets Calculated as EBIT/TA
EBIT = Earnings before interest and taxes
TA= Total Assets
ACRP = Account Receivable Period
INVP =Inventory Period
CCC = Cash Conversion Cycle
SG = Sales growth
ei = random error term which takes care of the effects of other factors which are
not fixed in the model, on dependent variable
β0 = Regression Constant
i = i…N refers to the number of companies
t = t… Ti refers to time period
β1, β2, β3, β4 are the regression co-efficient associated with independent variables.
WC = F (∏).
4.8 Limitation of The Study
The following limitations are inherent in the study;
i. The study is confined to five years data spanning from 2008 to 2012.
Detailed analysis covering a lengthier period which may give slightly
different results has not been made due to non-availability of data.

84
ii. This study is confined to only manufacturing companies listed on the NSE,
the accuracy of the result is therefore, purely based on the data obtained
from these companies. If more samples are taken, and manufacturing
companies not listed on the NSE were included in the sample, the results
would have been slightly different.
iii. The study is based on secondary data collected from the NSE, the study
therefore, depends purely upon the accuracy, reliability and quality of the
secondary data source. Besides, approximations and relative measures with
respect to the data source might impact the results.
iv. The multiple repression models used for this study may not have captured
all the predictors of financial performance. In other words, there may be
unmeasured variables that are affecting the relationship between working
capital management policies and the financial performance of the
manufacturing companies.
85
REFERENCES
Berenson, I. and Levine, M. (1999). Basic business statistics: Concepts and applications.
7 ed. Prentice Hall, Inc.
Dong, H.P. and Su, J. (2010). “The relationship between working capital management
and profitability: A Vietnam Case”. International Research Journal of finance and
economics, 49(3)62-70.
Falope, O.I. and Ajilore, O.T. (2009). “Working capital management and corporate
profitability: Evidence from Panel Data Analysis of selected quoted companies in
Nigeria”. Research Journal of Business Management, 3(3)73-84.
Krueger, T. (2002). “An analysis of working capital management results across
industries”. Mid-American Journal of Business, 20(2), 11 – 18.
Lazaridis, I. and Tryfonidis, D. (2006). “Relationship between working capital
management and profitability of listed companies in the Athens Stock Exchange”.
Journal of Financial Management and Analysis, 19(1)26-35.
Martin, J.D. (1991). Basic financial management, 2nd ed. New Jersey: Prentice Hall.
Ohikhena, P. (2006). Research methodology in the social and management sciences.
Lagos, Nigeria: Bunmico Publishers.
Oxford (2005). A dictionary of accounting, 3 ed. Oxford University Press.
Padachi, K. (2006). “Trends in working capital management and its impact on firm’s
performance: An analysis of Mauritian small manufacturing firms”. International
Review Business Research Papers, 2(1), 45-56.
Pandey, I.M. (2005). Financial management, 9 ed. New Delhi Vikas Publishing House
PVT Ltd.
Prasad, R.S. (2001). “Working capital management in the paper industry”. Finance India,
15(1),185-188.
86
CHAPTER FOUR
DATA PRESENTATION, ANALYSIS AND INTERPRETATION
4.0 Introduction
The main objective of this study is to examine the relationship between Working
Capital Management and the Corporate Performance of Nigerian Manufacturing
Companies quoted on the Nigerian Stock Exchange (NSE). In order to achieve this
objective, this chapter focused on data presentation, analysis and interpretation of
results based on the analytical technique (multiple regressions) adopted for the
study.
Test of research hypotheses is also carried out in this chapter in an attempt to
provide answers to the research questions stated in chapter one.
The dependent variable for the study is the firm’s profitability (measured by
Return on Assets-ROA) while the independent variables are the Accounts
Receivable period (ACRP), Inventory period (INVP) and the Cash Conversion
Cycle (CCC) while Sales Growth (SG) is used as control variable.
The data for this study has been presented with the use of tables and the
presentations made possible with the aid of statistical packages for social sciences
(SPSS) version 1.5 which uses the summarized data in appendix 2 that was
calculated using the data in appendix1.

87
4.1. Presentation and Analysis of Multiple Regression Results
Table 1: Regression results showing Data Estimate effects of WCM on ROA
Variable Coefficient T-values Sig Collinearity Statistics
(B) Stad error Tolerance VIF
Constant 0.588 0.212 2.771 0.007
ACRP -0.003 0.001 -6.995 0.000 0.775 1.291
INVP -0.001 0.000 -22.945 0.126 0.759 1.318
CCC -0.002 0.001 -1.973 0.052 0.640 1.862
SG 0.020 0.008 2.489 0.015 0.889 1.128
SOURCE: Regression Output based on the data generated from Appendix i.
a. Dependent Variable: ROA
b. Predictors: (constant), SG, ACRP, INVP and CCC
R2 = 0.775
R2 = 0.767
Sig f change = 0.020
Duration Watson = 1.708
The table above presents the results of the regression analysis on the impact of the
measures of working capital management viz: Account Receivable Period
(ACRP), Inventory Period (INVP) and Cash Conversion Cycle (CCC) respectively
on profitability of Nigerian Manufacturing Companies listed on the Nigerian Stock
Exchange (NSE). (See appendixes 1 to 2 for data used).
The estimation result shows that ACRP has a negative coefficient of -0.003,
indicating that firm’s profitability is reduced by 0.30% point by a day lengthening
of the numbers of days it takes debtor to settle their accounts. This result is
consistent with several previous empirical studies such as Deloof (2003) and
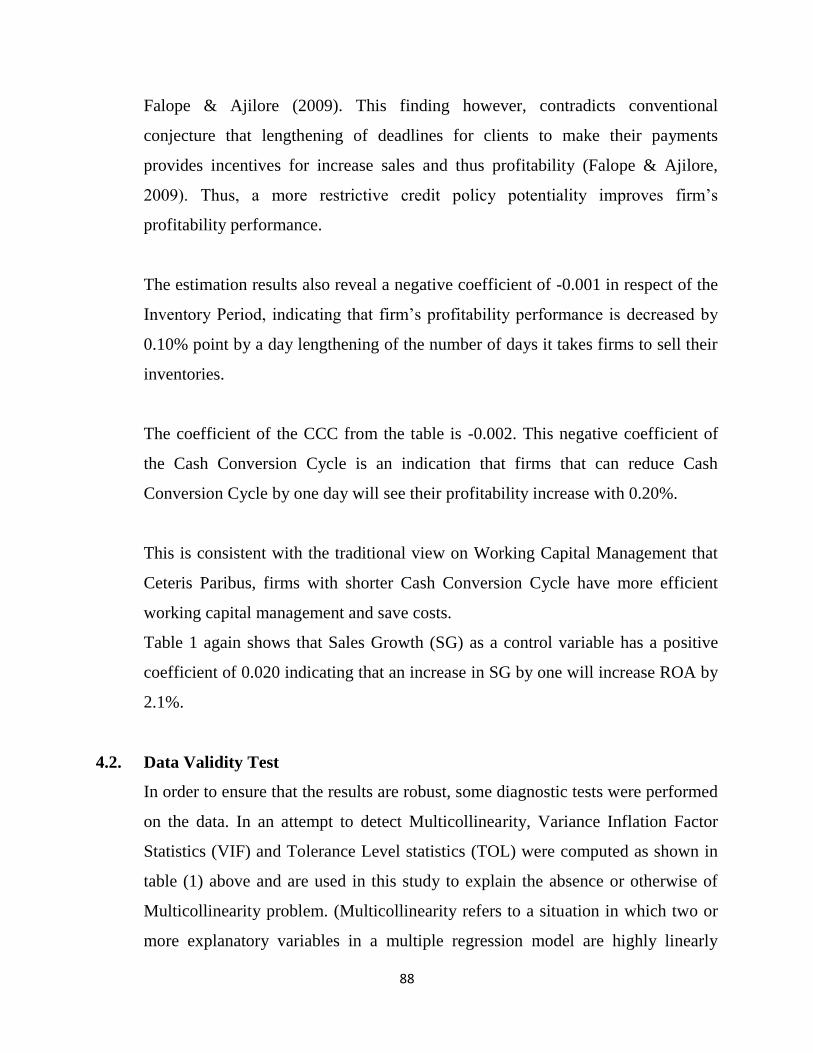
88
Falope & Ajilore (2009). This finding however, contradicts conventional
conjecture that lengthening of deadlines for clients to make their payments
provides incentives for increase sales and thus profitability (Falope & Ajilore,
2009). Thus, a more restrictive credit policy potentiality improves firm’s
profitability performance.
The estimation results also reveal a negative coefficient of -0.001 in respect of the
Inventory Period, indicating that firm’s profitability performance is decreased by
0.10% point by a day lengthening of the number of days it takes firms to sell their
inventories.
The coefficient of the CCC from the table is -0.002. This negative coefficient of
the Cash Conversion Cycle is an indication that firms that can reduce Cash
Conversion Cycle by one day will see their profitability increase with 0.20%.
This is consistent with the traditional view on Working Capital Management that
Ceteris Paribus, firms with shorter Cash Conversion Cycle have more efficient
working capital management and save costs.
Table 1 again shows that Sales Growth (SG) as a control variable has a positive
coefficient of 0.020 indicating that an increase in SG by one will increase ROA by
2.1%.
4.2. Data Validity Test
In order to ensure that the results are robust, some diagnostic tests were performed
on the data. In an attempt to detect Multicollinearity, Variance Inflation Factor
Statistics (VIF) and Tolerance Level statistics (TOL) were computed as shown in
table (1) above and are used in this study to explain the absence or otherwise of
Multicollinearity problem. (Multicollinearity refers to a situation in which two or
more explanatory variables in a multiple regression model are highly linearly
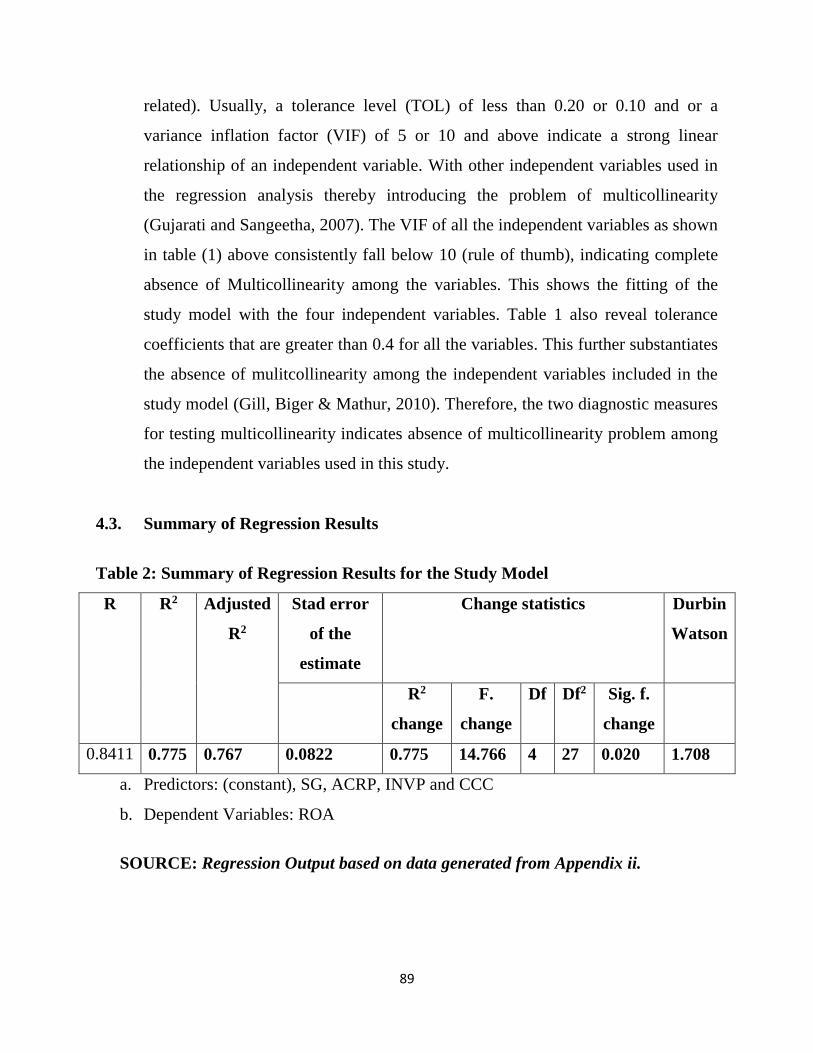
89
related). Usually, a tolerance level (TOL) of less than 0.20 or 0.10 and or a
variance inflation factor (VIF) of 5 or 10 and above indicate a strong linear
relationship of an independent variable. With other independent variables used in
the regression analysis thereby introducing the problem of multicollinearity
(Gujarati and Sangeetha, 2007). The VIF of all the independent variables as shown
in table (1) above consistently fall below 10 (rule of thumb), indicating complete
absence of Multicollinearity among the variables. This shows the fitting of the
study model with the four independent variables. Table 1 also reveal tolerance
coefficients that are greater than 0.4 for all the variables. This further substantiates
the absence of mulitcollinearity among the independent variables included in the
study model (Gill, Biger & Mathur, 2010). Therefore, the two diagnostic measures
for testing multicollinearity indicates absence of multicollinearity problem among
the independent variables used in this study.
4.3. Summary of Regression Results
Table 2: Summary of Regression Results for the Study Model
R R2 Adjusted
R2
Stad error
of the
estimate
Change statistics Durbin
Watson
R2
change
F.
change
Df Df2 Sig. f.
change
0.8411 0.775 0.767 0.0822 0.775 14.766 4 27 0.020 1.708
a. Predictors: (constant), SG, ACRP, INVP and CCC
b. Dependent Variables: ROA
SOURCE: Regression Output based on data generated from Appendix ii.

90
The summary of regression results is shown in table 2 above for the study model.
In the table, ROA was regressed against three independent variables; Account
Receivable Period (ACRP), Inventory Period (INVP), Cash Conversion Cycle
(CCC) and one control variable; Sales Growth (SG). The regression result shows a
significant F. change of 0.020 indicating the fitness of the model. (The F. test is
used for testing the overall significance of the regression and is normally
compared with the theoretical F (table). The results also produced a coefficient of
determination (R2) of 77.5% which was sufficiently high indicating that the
independent variables in the model account for 77.5% in the variability of
profitability (measured by ROA) of the sampled manufacturing companies in
Nigeria for the study period. The remaining 22.5% of the variation in profitability
of the Nigerian manufacturing firms is explained by factors not captured in the
study model. (The coefficient of determination denoted usually by R2 indicates
how well data points fit a statistical model, it is a statistic that will give some
information about the goodness of fit of a model. It is usually between 0 and 1
with 0 denoting that the model does not explain any variation and 1 denoting that
it perfectly explained the observed variation. Similarly, Durbin Watson statistics
(DW) of 1.708 also indicates the absence of auto correlation for all the variables.
(Durbin Watson test is a popular test to detect autocorrelation, named after the
developers, statisticians Durbin and Watson (1951). It has been established that
once DW = 2, then there is no problem of autocorrelation). Therefore, with the
results of the regression coefficients revealed in table 2, an ideal model values for
the relationship between WCM and Profitability of the Nigerian manufacturing
companies can be states thus:
𝑅𝑂𝐴 = 0.583 + (−0.003𝐴𝐶𝑅𝑅) + (−0.001𝐼𝑁𝑉𝑃) + (−0.002𝐶𝐶𝐶) + (0.20𝑆𝐺) + 𝑒
4.4. Testing of Research Hypothesis
To test the hypothesis as formulated in section 1.5 of this study, calculated t-
values shown in Table 1 of the study are compared with critical-value using the
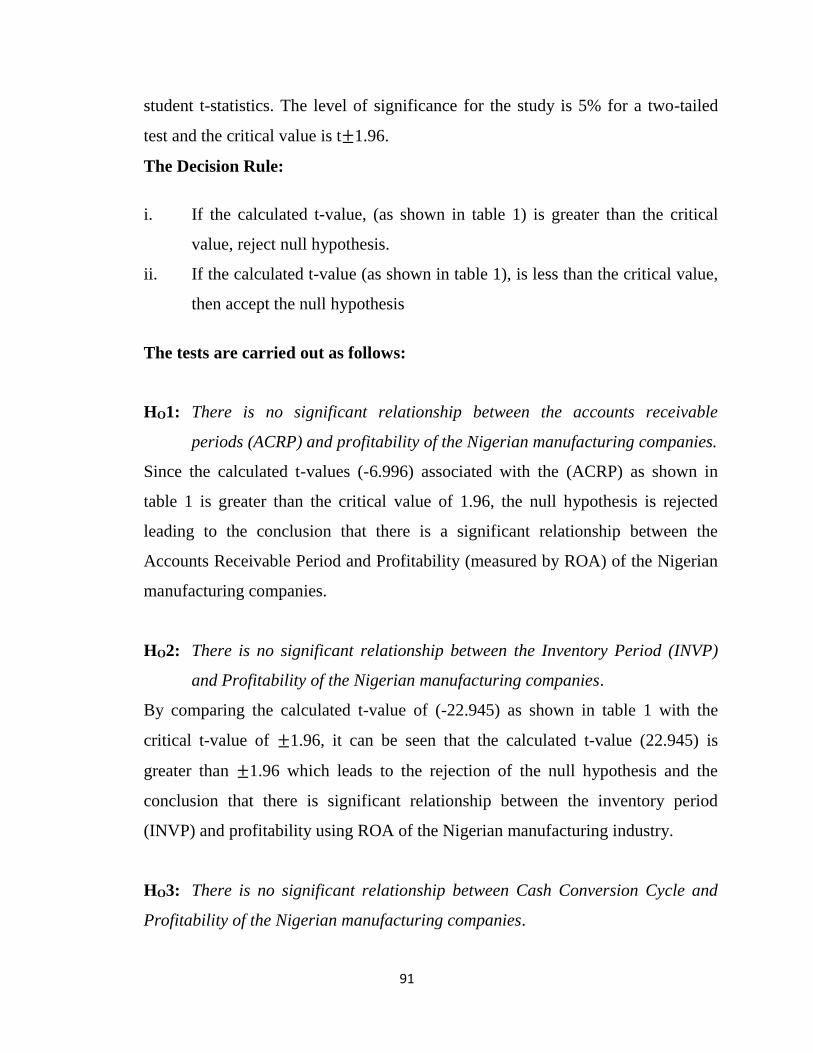
91
student t-statistics. The level of significance for the study is 5% for a two-tailed
test and the critical value is t±1.96.
The Decision Rule:
i. If the calculated t-value, (as shown in table 1) is greater than the critical
value, reject null hypothesis.
ii. If the calculated t-value (as shown in table 1), is less than the critical value,
then accept the null hypothesis
The tests are carried out as follows:
HO1: There is no significant relationship between the accounts receivable
periods (ACRP) and profitability of the Nigerian manufacturing companies.
Since the calculated t-values (-6.996) associated with the (ACRP) as shown in
table 1 is greater than the critical value of 1.96, the null hypothesis is rejected
leading to the conclusion that there is a significant relationship between the
Accounts Receivable Period and Profitability (measured by ROA) of the Nigerian
manufacturing companies.
HO2: There is no significant relationship between the Inventory Period (INVP)
and Profitability of the Nigerian manufacturing companies.
By comparing the calculated t-value of (-22.945) as shown in table 1 with the
critical t-value of ±1.96, it can be seen that the calculated t-value (22.945) is
greater than ±1.96 which leads to the rejection of the null hypothesis and the
conclusion that there is significant relationship between the inventory period
(INVP) and profitability using ROA of the Nigerian manufacturing industry.
HO3: There is no significant relationship between Cash Conversion Cycle and
Profitability of the Nigerian manufacturing companies.
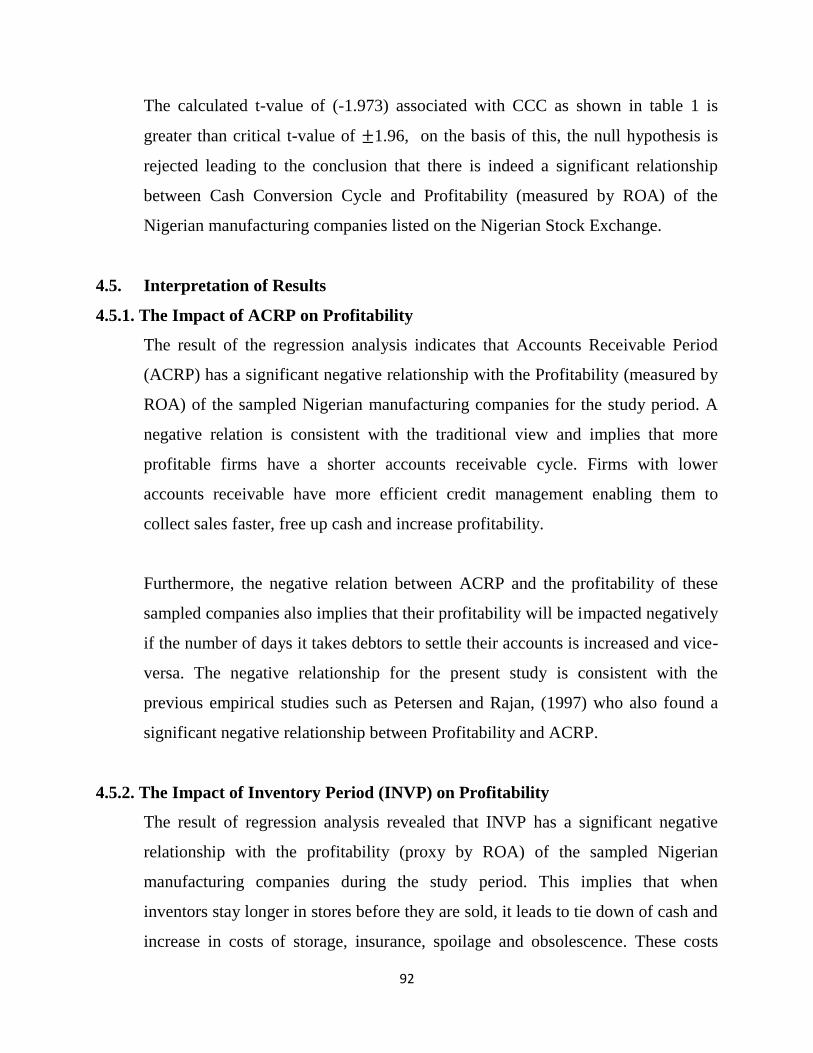
92
The calculated t-value of (-1.973) associated with CCC as shown in table 1 is
greater than critical t-value of ±1.96, on the basis of this, the null hypothesis is
rejected leading to the conclusion that there is indeed a significant relationship
between Cash Conversion Cycle and Profitability (measured by ROA) of the
Nigerian manufacturing companies listed on the Nigerian Stock Exchange.
4.5. Interpretation of Results
4.5.1. The Impact of ACRP on Profitability
The result of the regression analysis indicates that Accounts Receivable Period
(ACRP) has a significant negative relationship with the Profitability (measured by
ROA) of the sampled Nigerian manufacturing companies for the study period. A
negative relation is consistent with the traditional view and implies that more
profitable firms have a shorter accounts receivable cycle. Firms with lower
accounts receivable have more efficient credit management enabling them to
collect sales faster, free up cash and increase profitability.
Furthermore, the negative relation between ACRP and the profitability of these
sampled companies also implies that their profitability will be impacted negatively
if the number of days it takes debtors to settle their accounts is increased and vice-
versa. The negative relationship for the present study is consistent with the
previous empirical studies such as Petersen and Rajan, (1997) who also found a
significant negative relationship between Profitability and ACRP.
4.5.2. The Impact of Inventory Period (INVP) on Profitability
The result of regression analysis revealed that INVP has a significant negative
relationship with the profitability (proxy by ROA) of the sampled Nigerian
manufacturing companies during the study period. This implies that when
inventors stay longer in stores before they are sold, it leads to tie down of cash and
increase in costs of storage, insurance, spoilage and obsolescence. These costs
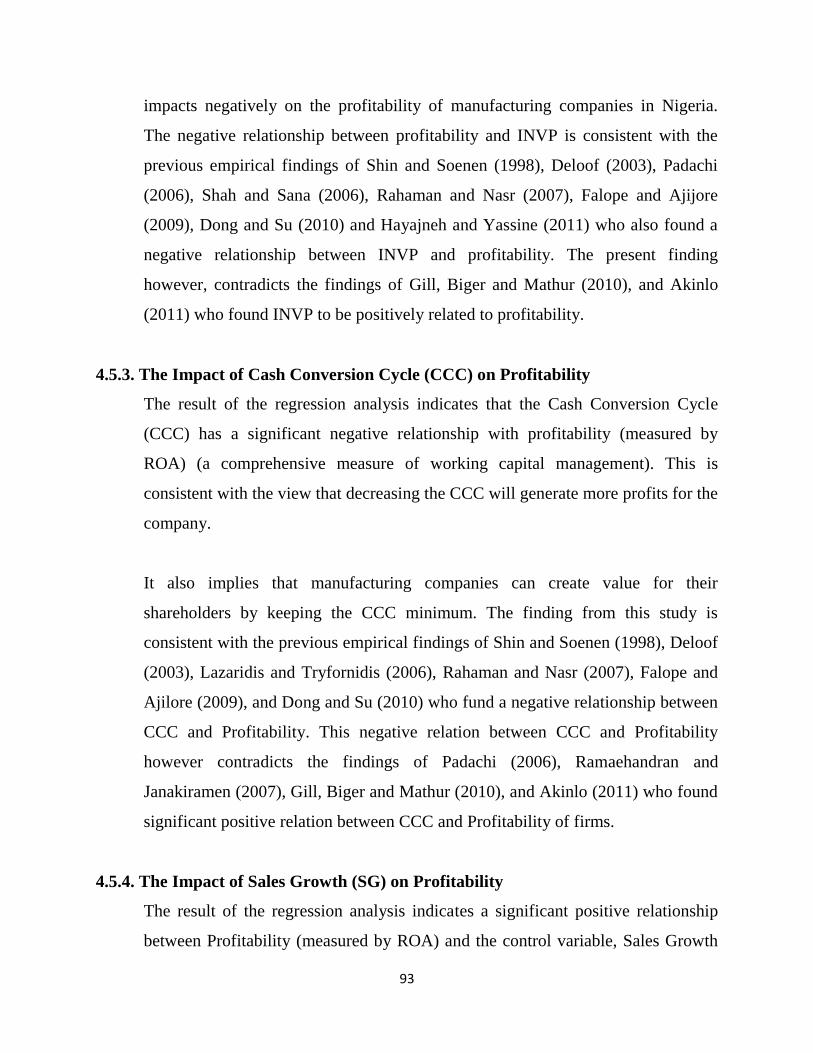
93
impacts negatively on the profitability of manufacturing companies in Nigeria.
The negative relationship between profitability and INVP is consistent with the
previous empirical findings of Shin and Soenen (1998), Deloof (2003), Padachi
(2006), Shah and Sana (2006), Rahaman and Nasr (2007), Falope and Ajijore
(2009), Dong and Su (2010) and Hayajneh and Yassine (2011) who also found a
negative relationship between INVP and profitability. The present finding
however, contradicts the findings of Gill, Biger and Mathur (2010), and Akinlo
(2011) who found INVP to be positively related to profitability.
4.5.3. The Impact of Cash Conversion Cycle (CCC) on Profitability
The result of the regression analysis indicates that the Cash Conversion Cycle
(CCC) has a significant negative relationship with profitability (measured by
ROA) (a comprehensive measure of working capital management). This is
consistent with the view that decreasing the CCC will generate more profits for the
company.
It also implies that manufacturing companies can create value for their
shareholders by keeping the CCC minimum. The finding from this study is
consistent with the previous empirical findings of Shin and Soenen (1998), Deloof
(2003), Lazaridis and Tryfornidis (2006), Rahaman and Nasr (2007), Falope and
Ajilore (2009), and Dong and Su (2010) who fund a negative relationship between
CCC and Profitability. This negative relation between CCC and Profitability
however contradicts the findings of Padachi (2006), Ramaehandran and
Janakiramen (2007), Gill, Biger and Mathur (2010), and Akinlo (2011) who found
significant positive relation between CCC and Profitability of firms.
4.5.4. The Impact of Sales Growth (SG) on Profitability
The result of the regression analysis indicates a significant positive relationship
between Profitability (measured by ROA) and the control variable, Sales Growth

94
(SG). Sales Growth is included in the model to see the impact of growth on the
performance of Nigerian manufacturing firms. It indicates a firm’s business
opportunities. The findings imply that the growth in sales of Nigerian
manufacturing firms increased their performances. The positive association
between sales growth and ROA is consistent with the findings of Shin and Soenen
(1998) and Deloof (2003) who concluded that sales growth had a positive relation
to changes in accounting measure of Profitability.

95
CHAPTER FIVE
SUMMARY, CONCLUSIONS AND RECOMMENDATIONS
5.1. Introduction
This chapter presents: summary of the study findings, conclusions and possible
policy implications of the results, recommendations of the study as well as areas of
further research.
5.2. Summary
This study examined the Impact of Working Capital Management on the
Profitability of Nigerian manufacturing companies quoted on the Nigerian Stock
Exchange (NSE) for the period of five years spanning from 2008-2012. The
specific objectives of the study were to examine the relationship between the
various measures of WCM, which includes the Account Receivable Period
(ACRP), the Inventory Period (INVP) and the Cash Conversion Cycle (CCC) on
the profitability of the Nigerian manufacturing concern. To achieve these
objectives, Ex-post Facto research design was adopted for the study after the
previous relevant empirical literatures on the Impact of Working Capital
Management on Profitability of manufacturing firms were reviewed. The choice of
Ex-post Facto research design was because the explanatory factors (independent
variables) have existed in the data without being manipulated or controlled and the
study is out to see their effects on the dependent variable.
The data collected for the study were obtained through the secondary source. The
study used five (5) variables with their choice being primarily guided by previous
empirical studies. For the dependent variable, firm’s profitability was measured by
using the returns on assets (ROA) and with regards to the independents variables,
Working Capital Management was measured by using ACRP, INVP and CCC
while Sales Growth was used as a control variable in the model.
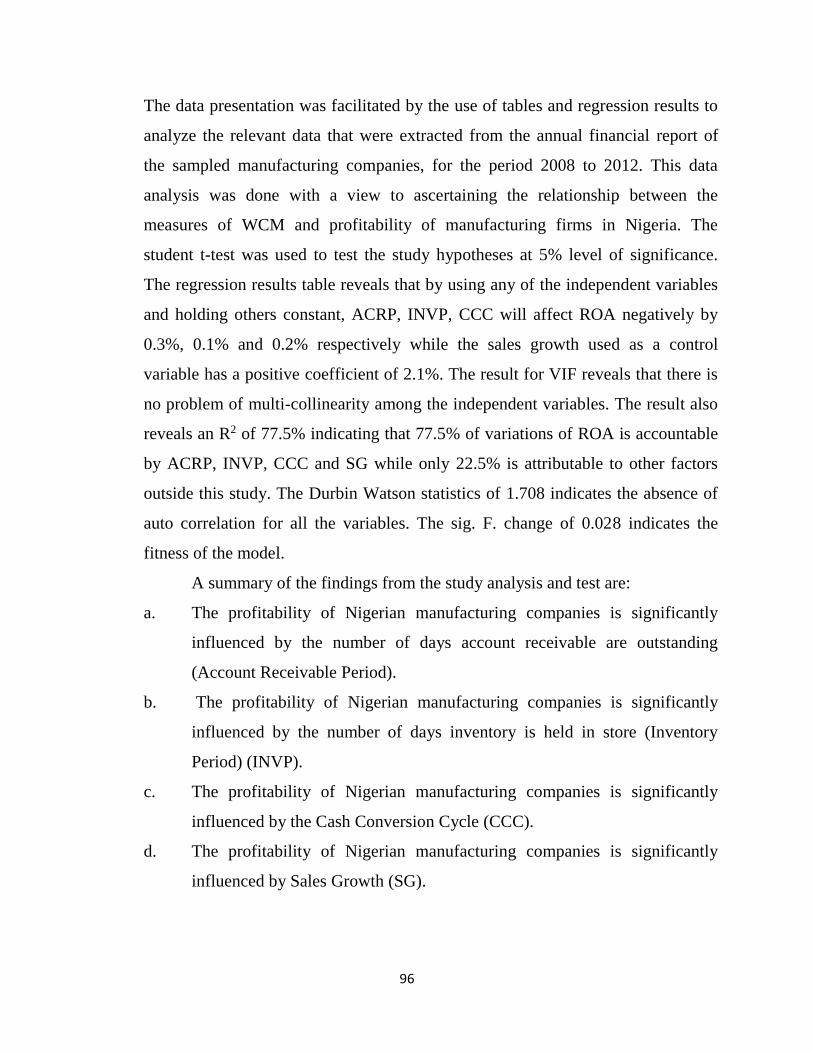
96
The data presentation was facilitated by the use of tables and regression results to
analyze the relevant data that were extracted from the annual financial report of
the sampled manufacturing companies, for the period 2008 to 2012. This data
analysis was done with a view to ascertaining the relationship between the
measures of WCM and profitability of manufacturing firms in Nigeria. The
student t-test was used to test the study hypotheses at 5% level of significance.
The regression results table reveals that by using any of the independent variables
and holding others constant, ACRP, INVP, CCC will affect ROA negatively by
0.3%, 0.1% and 0.2% respectively while the sales growth used as a control
variable has a positive coefficient of 2.1%. The result for VIF reveals that there is
no problem of multi-collinearity among the independent variables. The result also
reveals an R2 of 77.5% indicating that 77.5% of variations of ROA is accountable
by ACRP, INVP, CCC and SG while only 22.5% is attributable to other factors
outside this study. The Durbin Watson statistics of 1.708 indicates the absence of
auto correlation for all the variables. The sig. F. change of 0.028 indicates the
fitness of the model.
A summary of the findings from the study analysis and test are:
a. The profitability of Nigerian manufacturing companies is significantly
influenced by the number of days account receivable are outstanding
(Account Receivable Period).
b. The profitability of Nigerian manufacturing companies is significantly
influenced by the number of days inventory is held in store (Inventory
Period) (INVP).
c. The profitability of Nigerian manufacturing companies is significantly
influenced by the Cash Conversion Cycle (CCC).
d. The profitability of Nigerian manufacturing companies is significantly
influenced by Sales Growth (SG).
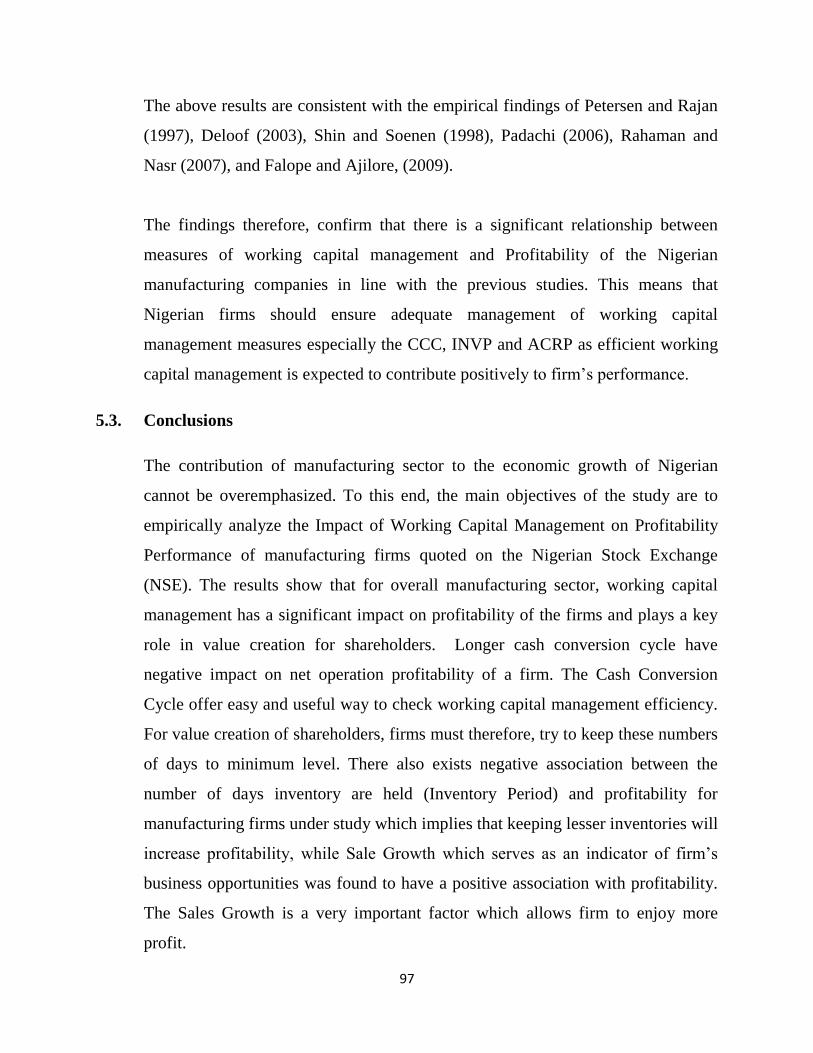
97
The above results are consistent with the empirical findings of Petersen and Rajan
(1997), Deloof (2003), Shin and Soenen (1998), Padachi (2006), Rahaman and
Nasr (2007), and Falope and Ajilore, (2009).
The findings therefore, confirm that there is a significant relationship between
measures of working capital management and Profitability of the Nigerian
manufacturing companies in line with the previous studies. This means that
Nigerian firms should ensure adequate management of working capital
management measures especially the CCC, INVP and ACRP as efficient working
capital management is expected to contribute positively to firm’s performance.
5.3. Conclusions
The contribution of manufacturing sector to the economic growth of Nigerian
cannot be overemphasized. To this end, the main objectives of the study are to
empirically analyze the Impact of Working Capital Management on Profitability
Performance of manufacturing firms quoted on the Nigerian Stock Exchange
(NSE). The results show that for overall manufacturing sector, working capital
management has a significant impact on profitability of the firms and plays a key
role in value creation for shareholders. Longer cash conversion cycle have
negative impact on net operation profitability of a firm. The Cash Conversion
Cycle offer easy and useful way to check working capital management efficiency.
For value creation of shareholders, firms must therefore, try to keep these numbers
of days to minimum level. There also exists negative association between the
number of days inventory are held (Inventory Period) and profitability for
manufacturing firms under study which implies that keeping lesser inventories will
increase profitability, while Sale Growth which serves as an indicator of firm’s
business opportunities was found to have a positive association with profitability.
The Sales Growth is a very important factor which allows firm to enjoy more
profit.
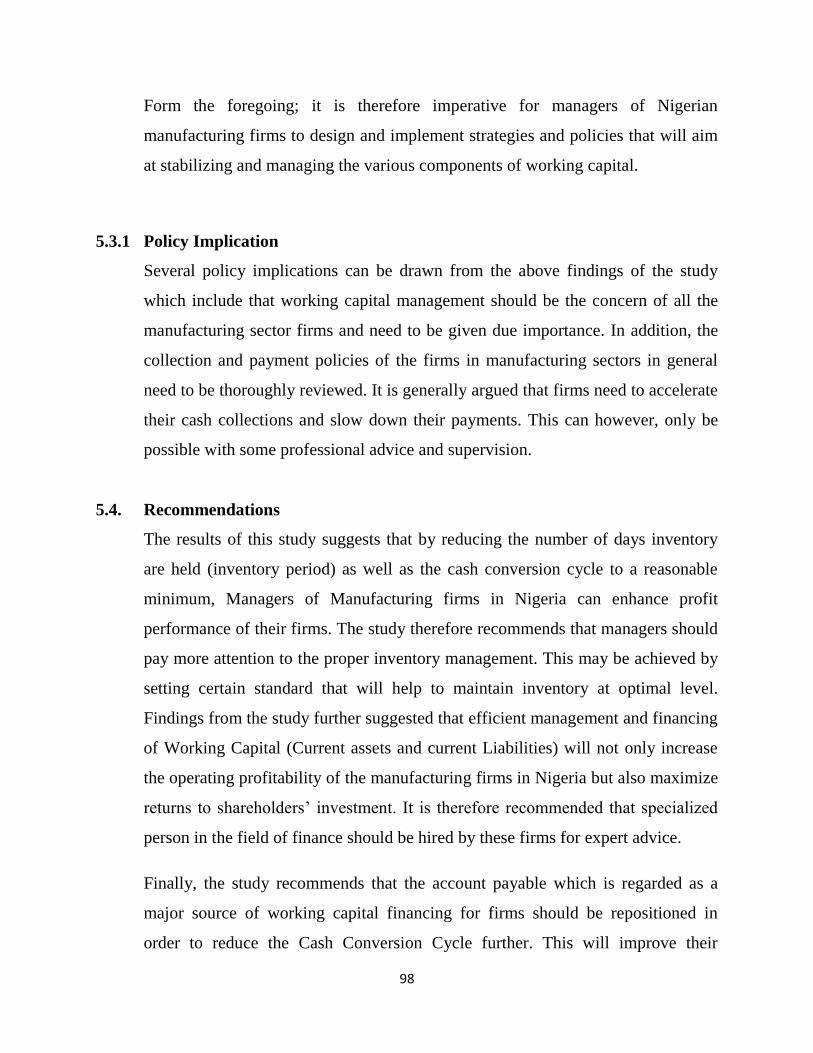
98
Form the foregoing; it is therefore imperative for managers of Nigerian
manufacturing firms to design and implement strategies and policies that will aim
at stabilizing and managing the various components of working capital.
5.3.1 Policy Implication
Several policy implications can be drawn from the above findings of the study
which include that working capital management should be the concern of all the
manufacturing sector firms and need to be given due importance. In addition, the
collection and payment policies of the firms in manufacturing sectors in general
need to be thoroughly reviewed. It is generally argued that firms need to accelerate
their cash collections and slow down their payments. This can however, only be
possible with some professional advice and supervision.
5.4. Recommendations
The results of this study suggests that by reducing the number of days inventory
are held (inventory period) as well as the cash conversion cycle to a reasonable
minimum, Managers of Manufacturing firms in Nigeria can enhance profit
performance of their firms. The study therefore recommends that managers should
pay more attention to the proper inventory management. This may be achieved by
setting certain standard that will help to maintain inventory at optimal level.
Findings from the study further suggested that efficient management and financing
of Working Capital (Current assets and current Liabilities) will not only increase
the operating profitability of the manufacturing firms in Nigeria but also maximize
returns to shareholders’ investment. It is therefore recommended that specialized
person in the field of finance should be hired by these firms for expert advice.
Finally, the study recommends that the account payable which is regarded as a
major source of working capital financing for firms should be repositioned in
order to reduce the Cash Conversion Cycle further. This will improve their

99
liquidity position and also reduce their over-dependence on high interest loans for
financing of the day-to-day operations. Managers of these companies can achieve
this by re-negotiating with their regular and important suppliers for further
increase in the number of days account payable are due for payment (Pandey,
2005).
5.5. Suggestions for Further Research
This study examined the Impact of Working Capital Management on Profitability
Performance of Nigeria manufacturing Companies quoted on the Nigerian Stock
Exchange (NSE) for the period 2008 – 2012. Further research could be conducted
to include companies not quoted on the Nigerian Stock Exchange in order to have
an in-depth assessment of the impact of WCM on the Profitability of
manufacturing companies in Nigeria. In addition, an exploratory study could also
be carried out on how global best practices in working capital management can be
implemented in Nigerian manufacturing firms.
100
BIBLIOGRAPHY
Afza, T. and Nazir, M. (2009). “Impact of aggressive working capital management policy
on firm’s profitability”. The IUP Journal of Applied Finance, 15 (8), 20 – 30.
Akinsulire, O. (2005). Financial management. Lagos: El-Toda Ventures.
Berenson, I. and Levine, M. (1999). Basic business statistics: Concepts and applications.
7 ed. Prentice Hall, Inc.
Deloof, M. (2003). “Does working capital management affect profitability of Belgium
firms”? journal of Business Finance and Accounting, 30 (3), 573-588.
Dong, H.P. and Su, J. (2010). “The relationship between working capital management
and profitability: A Vietnam Case”. International Research Journal of finance and
Economics, 49(3),62-70.
Ejelly, A.M. (2004). “Liquidity-profitability trade off: An Empirical Investigation in an
emerging market”. International Journal of Commerce and Management, 14 (2)
48-61.
Falope, O.I. and Ajilore, O.T. (2009). “Working capital management and corporate
profitability: Evidence from Panel Data Analysis of selected quoted companies in
Nigeria”. Research Journal of Business Management, 3(3)73-84.
Filbeck, G. and Krueger, T. (2005). “Industry related differences in working capital
management”. Mid-American of Business, 20(2), 11-18.
Filbeck, G., Krueger, T. and Preece, D. (2007). “CFO magazine’s working capital
surveys: Do selected firms work for shareholders”? Quarterly Journal of Business
and Economics, 46(2)3-22.
Hadley, L. (2006). “International working capital management”. The Business Review
Cambridge, 5 (1)233-239.
KPMG, (2005). Working capital management survey: How do European companies
manage their working capital? KPMG LLP.
Krueger, T. (2002). “An analysis of working capital management results across
industries”. Mid-American Journal of Business, 20(2), 11 – 18.

101
Krueger, T. (2002). “An analysis of working capital management results across
industries”. Mid-American Journal of Business, 20(2), 11 – 18.
Lamberson, M. (1995). “Changes in working capital of small firms in relation to changes
in economic activity”. Journal of Business, 10(2), 45-50.
Lazaridis, I. and Tryfonidis, D. (2006). “Relationship between working capital
management and profitability of listed companies in the Athens Stock Exchange”.
Journal of Financial Management and Analysis, 19(1)26-35.
Martin, J.D. (1991). Basic financial management, 2nd ed. New Jersey: Prentice Hall.
Ohikhena, P. (2006). Research methodology in the social and management sciences.
Lagos, Nigeria: Bunmico Publishers.
Ohikhena, P. (2006). Research methodology in the social and management sciences.
Lagos, Nigeria: Bunmico Publishers.
Oxford (2005). A dictionary of accounting, 3 ed. Oxford University Press.
Padachi, K. (2006). “Trends in working capital management and its impact on firm’s
performance: An analysis of Mauritian small manufacturing firms”. International
Review Business Research Papers, 2(1), 45-56.
Pandey, I.M. (2005). Financial management, 9 ed. New Delhi Vikas Publishing House
PVT Ltd.
Prasad, R.S. (2001). “Working capital management in the paper industry”. Finance India,
15(1),185-188.
Rahaman, A. and Nasr, M. (2007). “Working capital management and profitability: Case
of Pakistani firms”. International Review of Business Research, 3 (2)275-296.
Ramachandran, A. and Janakirma, M. (2007). “The relationship between working capital
management efficiency and earnings before interest and taxes (EBIT)”. Journal of
Managing Global Transitions, 7 (1), 61-74.
Shin, H.H. and Soenen, L. (1998). “Impact of working capital and corporate
profitability”. Journal of Finance Practice and Education, 8(2)37-45.
Smith, K. (1980). Profitability versus liquidity trade offs in working capital management,
in readings on the management of working capital. New York, St. Paul: West
Publishing Company.

102
VanHorne, J.C. (1977). “A risk-return analysi8s of a firm’s working capital position”.
Financial Economics, 2(1)71-88.
VanHorne, J.C. and Wachowiez, J.M. (2004). Fundamentals of financial management, 12
ed. New York: Prentice Hall.

103
APPENDIX I
DATA FROM THE ANNUAL FINANCIAL REPORTS OF THE SAMPLED
MANUFACTURING COMPANIES IN NIGRIA FOR ANALYSIS
Manufacturin
g
Company
Study
year
Inventory
(INV)
N,000
Cost of
Sales
(COGS)
N,000
Sales
N,000
Trade
Debtors
(AR)
N,000
Trade
Creditors
(AP)
N,000
Ebit
N,000
Net Assets
(NA) N,000
Short
term loan
(STL)
N,000
Long-term
loan (LTL)
N,000
BERGER
PAINT (NIG)
PLC
2008 416679 1267949 2139252 307330 19695 313967 1214395 5720 162365
2009 307504 1396432 2379786 206332 164786 322896 2281236 8000 203256
2010 543321 1532123 2756565 2070615 150223 519895 2605441 3788 137443
2011 575221 1605223 2574443 107333 249456 369256 2675000 6455 207785
2012 537899 1536566 2513675 110887 313110 284456 2906561 6678 237676
CADBURY
NIG PLC
2008 3512456 1897002 2467656 1207546 14127651 1278961 22016782 199876 207785
2009 3027786 19159891 25585561 1407455 1702676 -2379342 25246891 261444 3669673
2011 26767722 221951443 34110457 3470457 2111443 50825666 33711111 1500000 3192000
2012 3576133 22453000 33550000 3780543 1923129 55105677 36466771 176573 54331132

104
WAPCO NIG
PLC
2008 8571757 23323115 38664793 17179657 157488127 11665291 34847805 4712880 221332134
2009 10083280 26606616 43273809 18587114 18099375 12708896 43669041 7112544 32324200
2010 12517380 32089034 45589698 185277 2521613 9237328 87163067 2331677 24793394
2011 9728455 30535332 43841256 569566 2113675 8464354 100715789 14114577 12230066
2012 10315896 42898332 62502255 688455 5330675 10219222 127904677 5551100 49707679
CEMENT
COMPANY
OF
NORTHERN
NIG. PLC
2008 3015829 5759223 8042946 645045 2182673 559986 9118564 533175 478812
2009 2913756 5923443 9123736 683013 232298113 311465 93274566 600245 633333
2010 3158565 6704378 11868787 712673 2567899 2317265 9804232 670875 506667
2011 4723467 7629098 13915005 589154 2217197 3294043 11323086 401898 223450
AFRICAN
PAINTS NIG.
PLC
2007 7.7 234.0 50.9 1.5 35.1 -31.1 377.7 117.6 113555
2009 6.0 43.0 52.0 3.76 34.0 -14.0 357.0 116.0 345421
2010 4.0 54.0 59.0 5.0 34.0 -50.0 348.0 154.0 89665
2011 65.11 34.0 23.0 3234.09 12.07 28.0 545.05 22131 1132556
2012 32477.9 119035.9 298454.1 3407.5 26502.9 135647.6 673666.2 1777.2 112462.5
NIGERIAN
GERMANY
CHEMICALS
PLC
2008 851150 1477785 263089 418711 129672 194044 336767 615651 464223
2009 942224 1456000 2845010 461801 155255 411500 4901560 1686782 622342
2010 879825 1523632 2765020 396821 146534 400324 5817175 182301 2543206
2011 784880 1779610 2967210 293000 336781 -360788 7460015 1580311 539150
2012 721331 1962001 324000 534455 466782 383455 8375630 257000 43210
ASHAKA
CEMENT
PLC.
2008 4220235 10867691 16473955 385826 1151489 2514625 22259692 16907 16907
2009 4706692 14039116 21376197 139355 1920957 3430941 24995945 17705 17705
2010 4707390 11770820 171940 876188 2296110 2365181 256185 256513 282816
2011 5330.0 11916 19153.0 35200 1786000 4388000 28124101 200123 1019210
2012 4930898 87937880 16771564 152259 8886843 4951464 18474436 15996 31992
DANGOTE 2008 2041932 3016814 3473439 995121 3826877 1870302 9607188 11081692 341006

105
CEMENT
PLC.
2009 1219265 8252101 16453711 209333 5014473 4733990 137513395 6088178 41006
2010 13374.1 105872.4 189621.0 6825.7 4715.0 63775.9 291779.3 3759.3 49619.8
2011 14404.0 8138.0 202565.7 11378.2 3834.4 100051.5 398699.6 528.9 98251.14
2012 14350.5 98026.4 241406.0 7242.7 17529.2 113719.6 526483.4 5034.9 116766.4
DANGOTE
FLOUR
MILLS PLC.
2008 8703565 32734114 45823222 6934121 4008178 2670455 59687355 19020145
5
876500
2009 9910456 38288111 47927334 7410143 4387380 3167566 61897278 20111551 2110056
2010 8248897 48561000 61388115 9402898 6408275 5374118 6388244713 868258 2050065
2011 8257456 54398332 67601005 11643789 10875567 4911995 696107 1449045
5
1980022
2012 12021879 56582444 66281332 8597457 4701566 396677 83453.6 2968647
7
21840755
FLOUR
MILLS
INDUSTRIAL
PLC.
2008 2073960
0
156993.0 180068.2 5347.6 1002.21 3595444 137520.4 18396.6 27240.3
2009 31310.2 160541.6 206608.0 6355.3 8637.8 24439.5 143520.2 17613.9 28220.8
2010 46634.4 198611.6 238796.9 8623.7 7637.4 16445.4 163261.9 9855.6 45919.2
2011 50565.4 218702.4 258268.3 8173.5 8668.2 12048.8 232857.4 33643.1 62562.9
2012 32477.9 119035.9 298454.1 3407.5 26502.9 135647.6 673666.2 1777.2 112462.5
NESTLE NIG.
PLC.
2008 5225829 27805162 44027325 777722 2394634 8463788 21252320 8236796 66779003
2009 6415165 31300680 51742302 3118863 3001440 11862213 29159522 11093617 9034695
2010 10697567 39956771 68317303 1951039 3123137 13783244 44250372 1901096
0
14695469
2011 8494039 43877896 80108730 8410169 4085379 18244454 60347062 3398377 7904762
2012 9902238 57168571 97961260 8585072 7543859 185396669 76945793 6780417 8372414
VITAL
FOAM PLC.
2008 1585119 4473236 6149520 275151 542530 652284 1401588 552293 64911
2009 2088337 5774289 8172005 350262 583686 1013719 1895134 400716 278599
2010 2280.2 6853.2 9758.5 335.2 808.8 780.9 5436.0 859.3 132.9
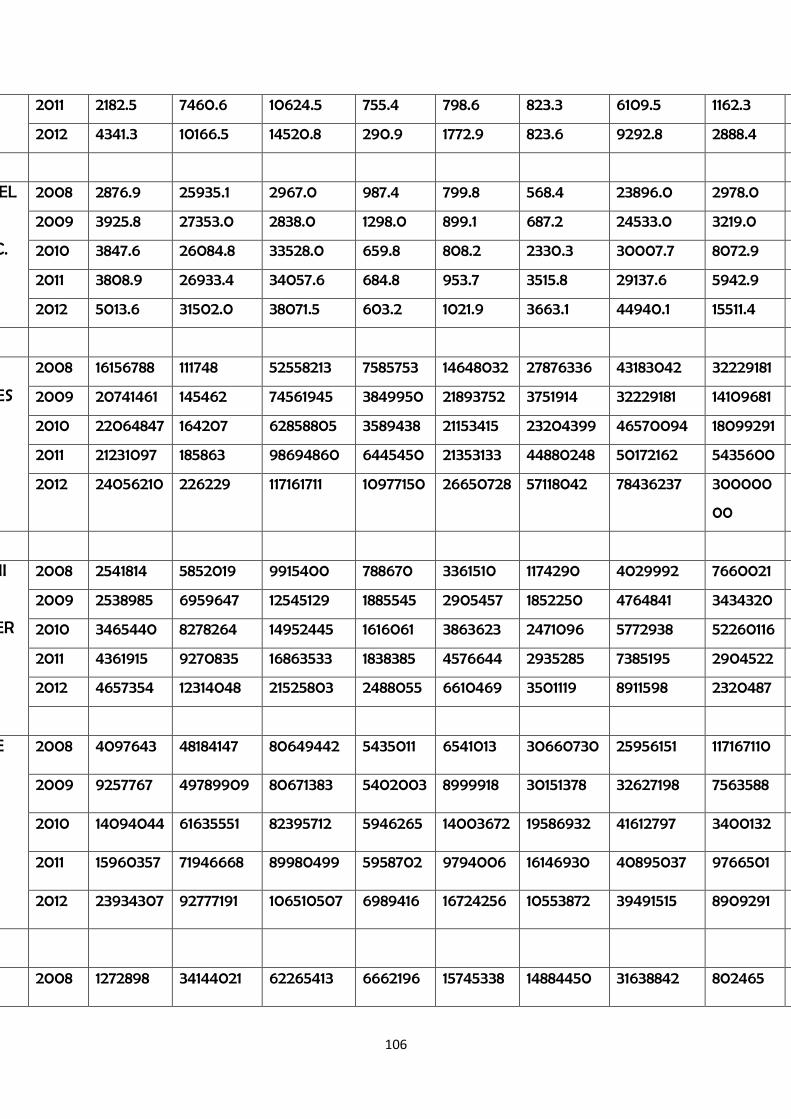
106
2011 2182.5 7460.6 10624.5 755.4 798.6 823.3 6109.5 1162.3 22.8
2012 4341.3 10166.5 14520.8 290.9 1772.9 823.6 9292.8 2888.4 300.0
HONEYWEL
L FLOUR
MILLS PLC.
2008 2876.9 25935.1 2967.0 987.4 799.8 568.4 23896.0 2978.0 3721.1
2009 3925.8 27353.0 2838.0 1298.0 899.1 687.2 24533.0 3219.0 2466.2
2010 3847.6 26084.8 33528.0 659.8 808.2 2330.3 30007.7 8072.9 2377.1
2011 3808.9 26933.4 34057.6 684.8 953.7 3515.8 29137.6 5942.9 1358.6
2012 5013.6 31502.0 38071.5 603.2 1021.9 3663.1 44940.1 15511.4 6243.8
NIG
BREWERIES
2008 16156788 111748 52558213 7585753 14648032 27876336 43183042 32229181 17946249
2009 20741461 145462 74561945 3849950 21893752 3751914 32229181 14109681 25862961
2010 22064847 164207 62858805 3589438 21153415 23204399 46570094 18099291 42318498
2011 21231097 185863 98694860 6445450 21353133 44880248 50172162 5435600 32983271
2012 24056210 226229 117161711 10977150 26650728 57118042 78436237 300000
00
9000000
GLAXOSMI
TH
CONSUMER
PLC
2008 2541814 5852019 9915400 788670 3361510 1174290 4029992 7660021 3849950
2009 2538985 6959647 12545129 1885545 2905457 1852250 4764841 3434320 3589438
2010 3465440 8278264 14952445 1616061 3863623 2471096 5772938 52260116 6445450
2011 4361915 9270835 16863533 1838385 4576644 2935285 7385195 2904522 1272898
2012 4657354 12314048 21525803 2488055 6610469 3501119 8911598 2320487 185863
DANGOTE
SUGAR
2008 4097643 48184147 80649442 5435011 6541013 30660730 25956151 117167110 4473236
2009 9257767 49789909 80671383 5402003 8999918 30151378 32627198 7563588 652284
2010 14094044 61635551 82395712 5946265 14003672 19586932 41612797 3400132 6934121
2011 15960357 71946668 89980499 5958702 9794006 16146930 40895037 9766501 652284
2012 23934307 92777191 106510507 6989416 16724256 10553872 39491515 8909291 17490412
GUINESS 2008 1272898 34144021 62265413 6662196 15745338 14884450 31638842 802465 3500000

107
NIG. PLC. 2009 12867442 35611016 69172852 6528920 15368671 17092950 36862557 3705076 7886414
2010 16847699 46509596 89148207 9104844 17957642 18991762 31524701 6897234 8093952
2011 16152706 61672051 109366975 16152706 23628073 19988735 47748499 2675541 765990
2012 17433924 68619520 123663125 17433924 26342948 26176966 55639184 2114564 511005
UNILEVER
NIG. PLC.
2008 5083483 22557945 33990848 5066930 8215777 2013148 5030844 4035570 747248
2009 4632184 24360549 37377492 7097871 10177373 4144849 6681553 2615000 3013504
2010 4927265 27092437 44481277 6798481 9135337 5661052 3202734 1500000 3074336
2011 6286744 29361666 46807860 5231304 11678176 6151855 8335227 730809 3204941
2012 7706348 34723123 54724749 5611356 16068411 7983312 9664678 5445631 9767564
PZ
CUSSIONS
PLC.
2008 17490412 45710321 54216824 5811728 772752 2976585 28098218 963210 196836
2009 16618499 54266049 65945174 6928488 721453 4553426 29036715 1540678 2454067
2010 15079505 6824644 80974071 6489272 503852 4375703 30073307 7739 2770216
2011 11925600 50139515 62667910 8091245 1194677 6599905 13073027 1278003 3776581
2012 11978715 54129454 65877984 8865618 176592 4766551 17224610 4556730 6575540
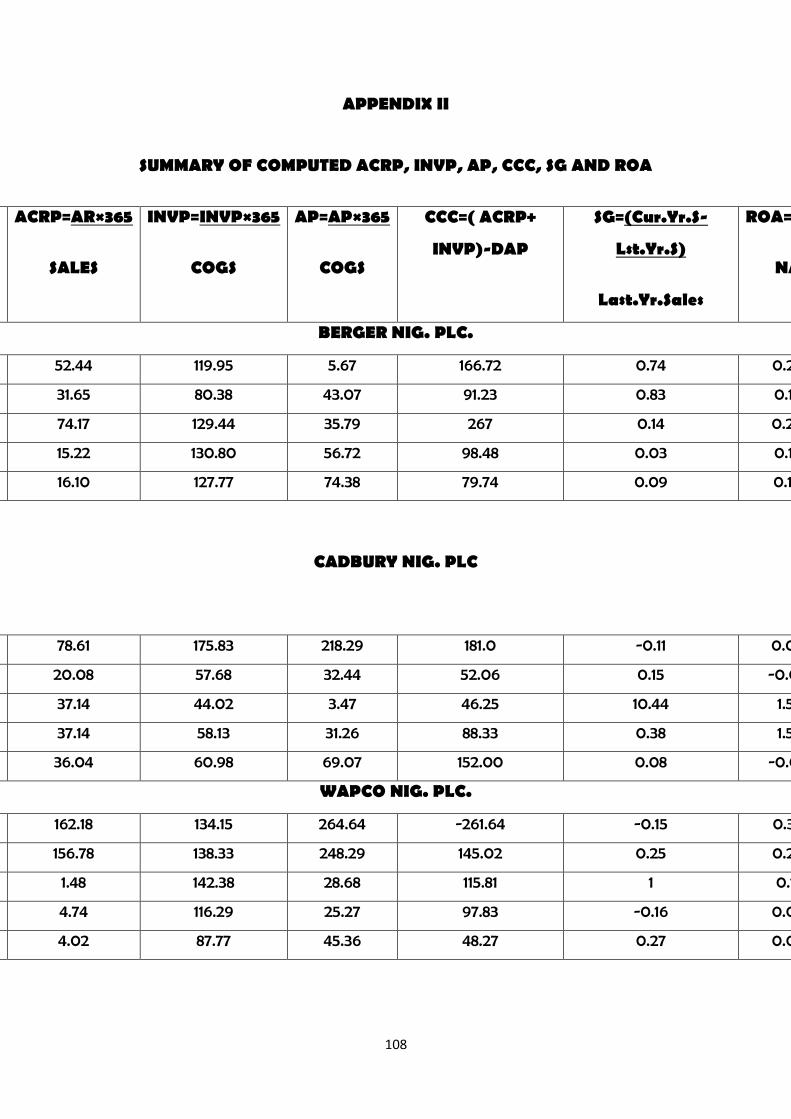
108
APPENDIX II
SUMMARY OF COMPUTED ACRP, INVP, AP, CCC, SG AND ROA
Year ACRP=AR×365
SALES
INVP=INVP×365
COGS
AP=AP×365
COGS
CCC=( ACRP+
INVP)-DAP
SG=(Cur.Yr.S-
Lst.Yr.S)
Last.Yr.Sales
ROA=EBIT
NA
BERGER NIG. PLC.
2008 52.44 119.95 5.67 166.72 0.74 0.26
2009 31.65 80.38 43.07 91.23 0.83 0.14
2010 74.17 129.44 35.79 267 0.14 0.20
2011 15.22 130.80 56.72 98.48 0.03 0.14
2012 16.10 127.77 74.38 79.74 0.09 0.10
CADBURY NIG. PLC
2008 78.61 175.83 218.29 181.0 -0.11 0.06
2009 20.08 57.68 32.44 52.06 0.15 -0.09
2010 37.14 44.02 3.47 46.25 10.44 1.51
2011 37.14 58.13 31.26 88.33 0.38 1.51
2012 36.04 60.98 69.07 152.00 0.08 -0.05
WAPCO NIG. PLC.
2008 162.18 134.15 264.64 -261.64 -0.15 0.33
2009 156.78 138.33 248.29 145.02 0.25 0.29
2010 1.48 142.38 28.68 115.81 1 0.11
2011 4.74 116.29 25.27 97.83 -0.16 0.08
2012 4.02 87.77 45.36 48.27 0.27 0.08

109
7UP BOTTLING CO. PLC.
2008 2.40 191.13 138.33 93.68 -0.24 0.06
2009 2.35 179.54 214.11 -292.48 0.1 0.00
2010 0.21 171.96 139.80 70.96 0.05 0.24
2011 15.45 225.99 106.08 148.09 0.2 0.29
2012 4.17 99.59 8.27 28.77 0.1 1.00
CCNN PLC.
2008 10.76 12.01 54.75 -40.40 -0.12 -0.08
2009 26.39 50.93 288.60 -205.76 0.12 -0.04
2010 30.93 27.04 229.81 -168.98 -0.99 -0.14
2011 3.31 98.98 129.58 188.31 -108.78 0.05
2012 4.17 99.59 81.27 28.77 -0.34 0.20
AFRICAN PAINTS NIG. PLC
2008 280.90 210.23 32.03 181.62 -0.14 0.58
2009 59.25 136.20 38.92 113.05 0.22 0.08
2010 52.38 210.77 35.10 170.73 -1 0.07
2011 36.04 160.98 69.07 152.00 0.37 -0.05
2012 62.09 134.19 86.84 146.78 0.32 0.05
CGN PLC.
2008 8.55 141.74 38.67 116.02 -0.28 0.11
2009 2.38 122.37 49.94 76.05 0.74 0.14
2010 260.00 145.97 71.20 101.94 -0.88 9.23
2011 270.81 63.6 207.12 165.64 -0.14 0.16
2012 3.31 20.47 36.89 -15.79 -0.03 0.27
ASHAKA CEMENT PLC.
2008 104.57 247.05 263.01 -95.56 -0.09 0.19
2009 4.64 53.93 221.80 -158.61 0.11 0.03

110
2010 13.14 46.11 16.26 53.38 -0.15 0.22
2011 20.50 246.04 171.98 284.39 10.44 0.25
2012 10.95 53.43 65.27 15.13 -0.88 0.22
DANGOTE CEMENT PLC.
2008 55.23 97.05 44.69 129.67 -0.08 0.04
2009 56.43 94.48 41.82 123.29 0.15 0.05
2010 55.91 62.00 48.17 84.51 0.25 0.00
2011 62.87 55.41 72.97 60.56 1 7.06
2012 47.34 77.55 30.33 102.68 -0.16 4.75
DANGOTE FLOURMILLS PLC.
2008 10.84 218.42 2.33 228.52 -0.27 26.14
2009 11.23 71.19 19.64 66.00 0.24 0.17
2010 13.18 85.70 14.04 87.52 0.1 0.10
2011 11.55 84.39 14.47 83.56 0.05 0.05
2012 4.17 99.59 81.27 28.77 0.2 0.20
FLOURMILLS INDUSTRIAL PLC.
2008 6.45 68.60 31.43 47.37 -0.1 0.40
2009 22.00 74.81 35.00 76.18 0.12 0.41
2010 10.42 97.72 28.53 87.01 0.12 0.31
2011 38.32 70.66 33.98 106.63 -0.99 0.30
2012 31.99 63.22 48.16 69.87 108.78 2.41
NESTLE NIG. PLC.
2008 16.33 129.34 44.27 107.52 -0.34 0.47
2009 15.64 132.01 36.90 117.25 0.14 0.53

111
2010 12.54 121.44 43.08 96.22 0.22 0.14
2011 25.95 106.78 39.07 104.66 -1 0.13
2012 7.31 155.86 63.65 102.66 0.37 0.09
VITAL FOAM PLC.
2008 121.47 40.49 11.26 43.13 -0.32 0.02
2009 166.94 52.39 12.00 57.71 -0.28 0.03
2010 7.18 53.84 11.31 51.76 -0.23 0.08
2011 7.34 51.62 12.92 47.97 0.04 0.12
2012 5.78 58.09 11.84 53.24 102.21 0.08
NIG. BREWERIES
2008 29.03 158.54 209.66 -1.94 -1 0.29
2009 54.86 133.16 152.38 79.67 -0.88 0.39
2010 39.45 152.80 170.35 53.70 0.21 0.43
2011 39.79 171.73 180.19 63.92 0.04 0.40
2012 42.19 138.05 195.94 15.86 0.14 0.39
GLAXOSMITH CONSUMER PLC.
2008 24.60 31.04 49.55 22.66 -0.43 1.18
2009 24.44 67.87 65.98 41.49 0.00 0.92
2010 26.34 83.46 82.93 35.75 0.37 0.47
2011 24.17 80.97 49.69 61.51 0.52 0.39
2012 23.95 94.16 65.80 55.86 0.36 0.27
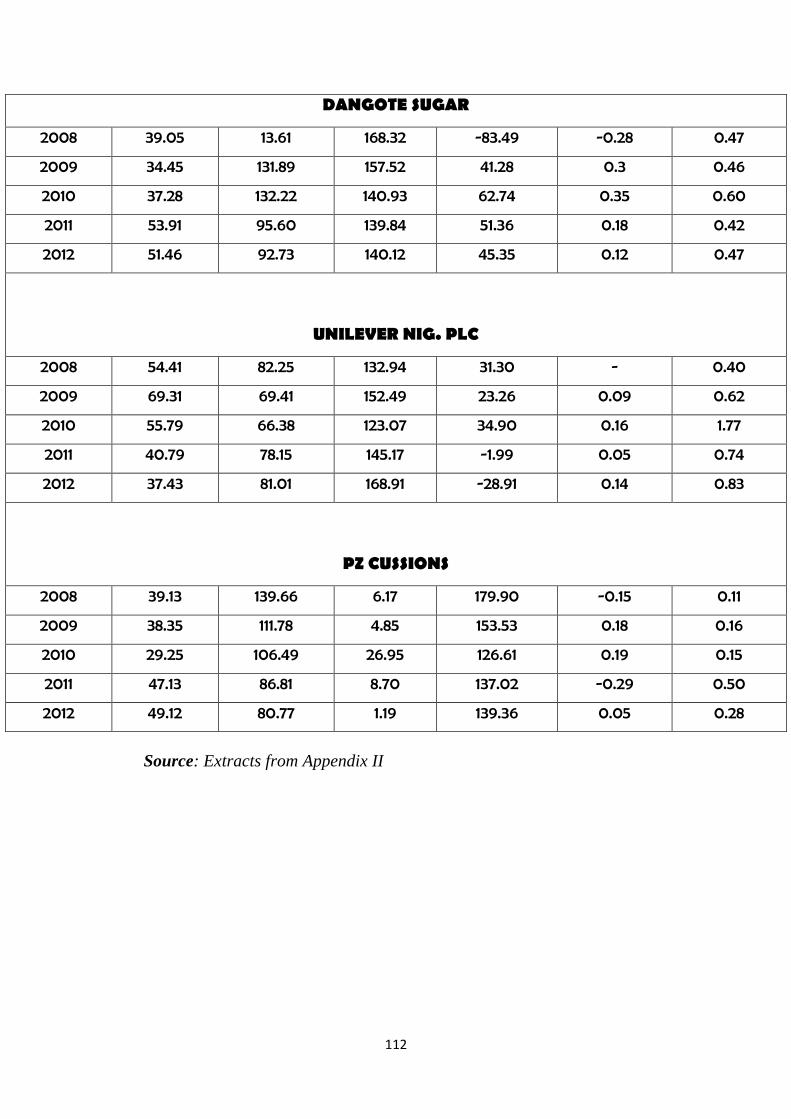
112
DANGOTE SUGAR
2008 39.05 13.61 168.32 -83.49 -0.28 0.47
2009 34.45 131.89 157.52 41.28 0.3 0.46
2010 37.28 132.22 140.93 62.74 0.35 0.60
2011 53.91 95.60 139.84 51.36 0.18 0.42
2012 51.46 92.73 140.12 45.35 0.12 0.47
UNILEVER NIG. PLC
2008 54.41 82.25 132.94 31.30 - 0.40
2009 69.31 69.41 152.49 23.26 0.09 0.62
2010 55.79 66.38 123.07 34.90 0.16 1.77
2011 40.79 78.15 145.17 -1.99 0.05 0.74
2012 37.43 81.01 168.91 -28.91 0.14 0.83
PZ CUSSIONS
2008 39.13 139.66 6.17 179.90 -0.15 0.11
2009 38.35 111.78 4.85 153.53 0.18 0.16
2010 29.25 106.49 26.95 126.61 0.19 0.15
2011 47.13 86.81 8.70 137.02 -0.29 0.50
2012 49.12 80.77 1.19 139.36 0.05 0.28
Source: Extracts from Appendix II