AYP Consequences and Erasure Behavior Vincent Primoli Data Recognition Corporation.
16
AYP Consequences and Erasure Behavior Vincent Primoli Data Recognition Corporation
-
Upload
carly-buckman -
Category
Documents
-
view
225 -
download
0
Transcript of AYP Consequences and Erasure Behavior Vincent Primoli Data Recognition Corporation.
AYP Consequences and Erasure Behavior
Vincent Primoli Data Recognition Corporation
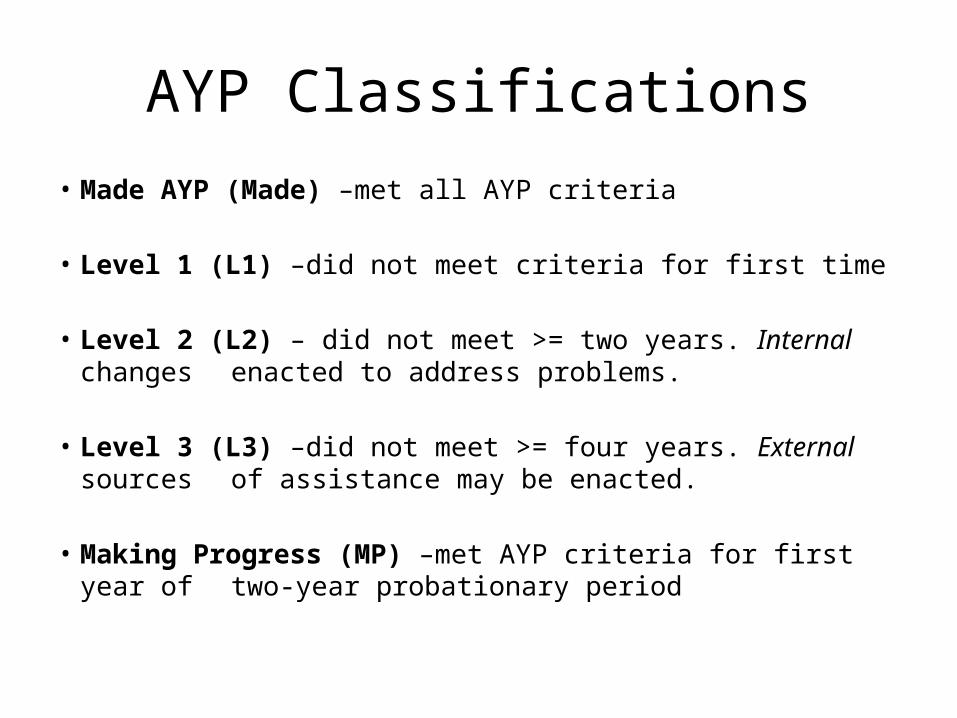
AYP Classifications• Made AYP (Made) –met all AYP criteria
• Level 1 (L1) –did not meet criteria for first time
• Level 2 (L2) – did not meet >= two years. Internal changes enacted to address problems.
• Level 3 (L3) –did not meet >= four years. External sources of assistance may be enacted.
• Making Progress (MP) –met AYP criteria for first year of two-year probationary period
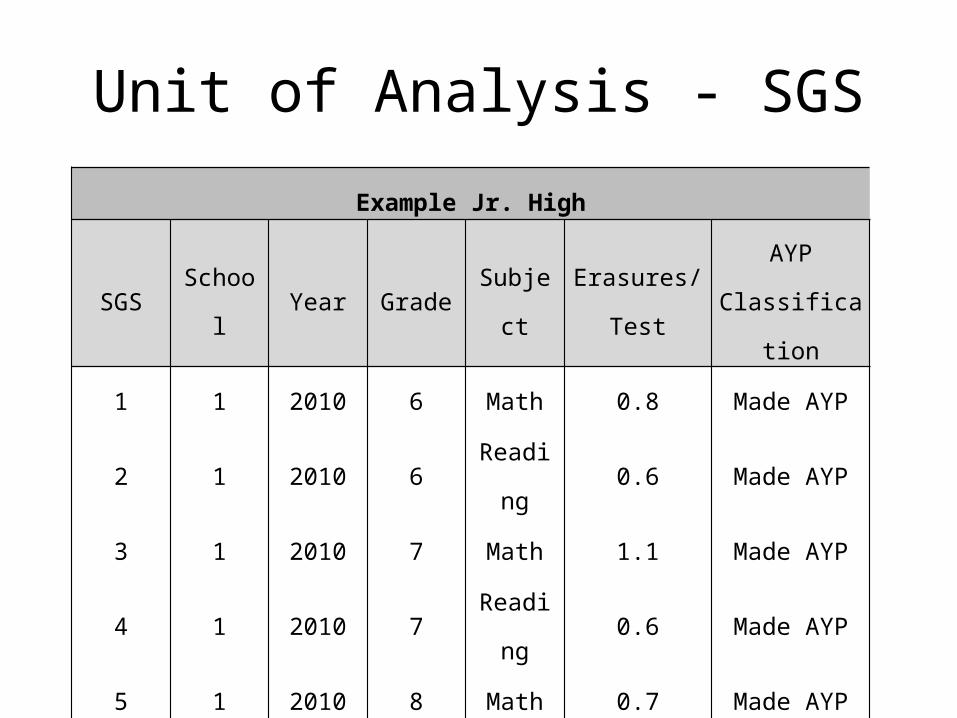
Unit of Analysis - SGS
Example Jr. High
SGS School Year Grade Subject Erasures/TestAYP
Classification
1 1 2010 6 Math 0.8 Made AYP
2 1 2010 6 Reading 0.6 Made AYP
3 1 2010 7 Math 1.1 Made AYP
4 1 2010 7 Reading 0.6 Made AYP
5 1 2010 8 Math 0.7 Made AYP
6 1 2010 8 Reading 1.0 Made AYP
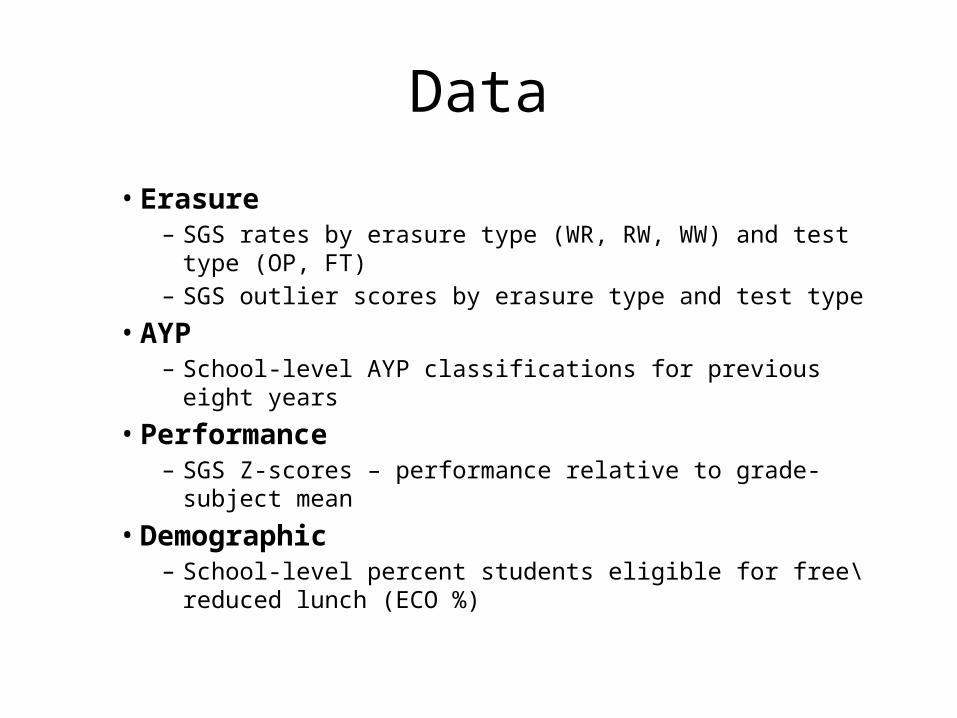
Data
• Erasure– SGS rates by erasure type (WR, RW, WW) and test type (OP, FT) – SGS outlier scores by erasure type and test type
• AYP– School-level AYP classifications for previous eight years
• Performance– SGS Z-scores – performance relative to grade-subject mean
• Demographic– School-level percent students eligible for free\reduced lunch
(ECO %)
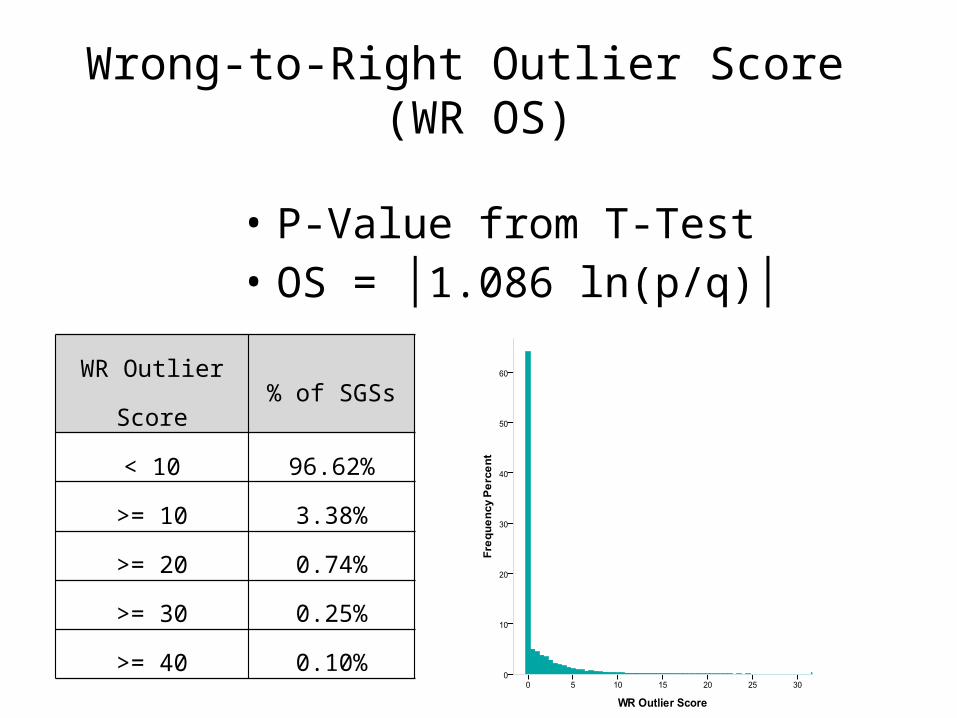
Wrong-to-Right Outlier Score (WR OS)
• P-Value from T-Test• OS = │1.086 ln(p/q)│
WR Outlier Score % of SGSs
< 10 96.62%
>= 10 3.38%
>= 20 0.74%
>= 30 0.25%
>= 40 0.10%
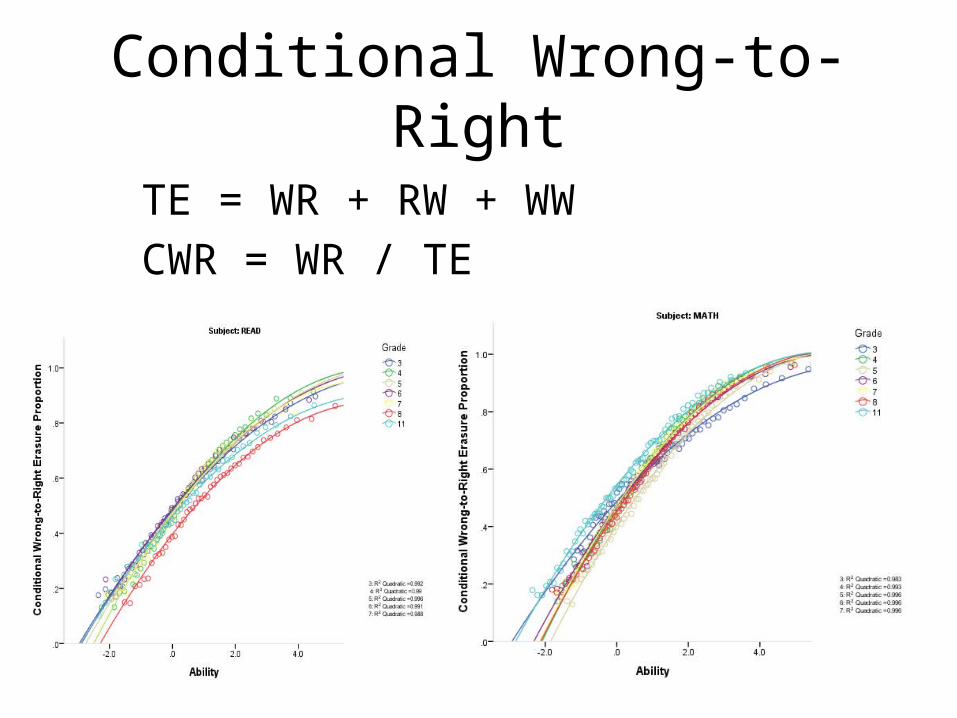
Conditional Wrong-to-Right
TE = WR + RW + WWCWR = WR / TE
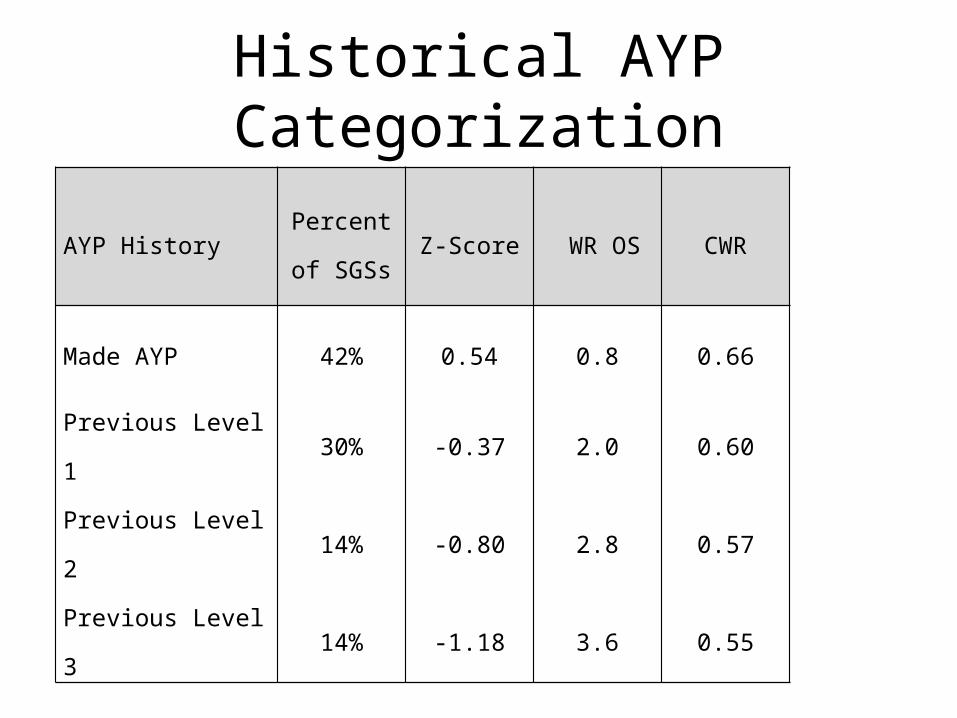
Historical AYP Categorization
AYP HistoryPercent of
SGSsZ-Score WR OS CWR
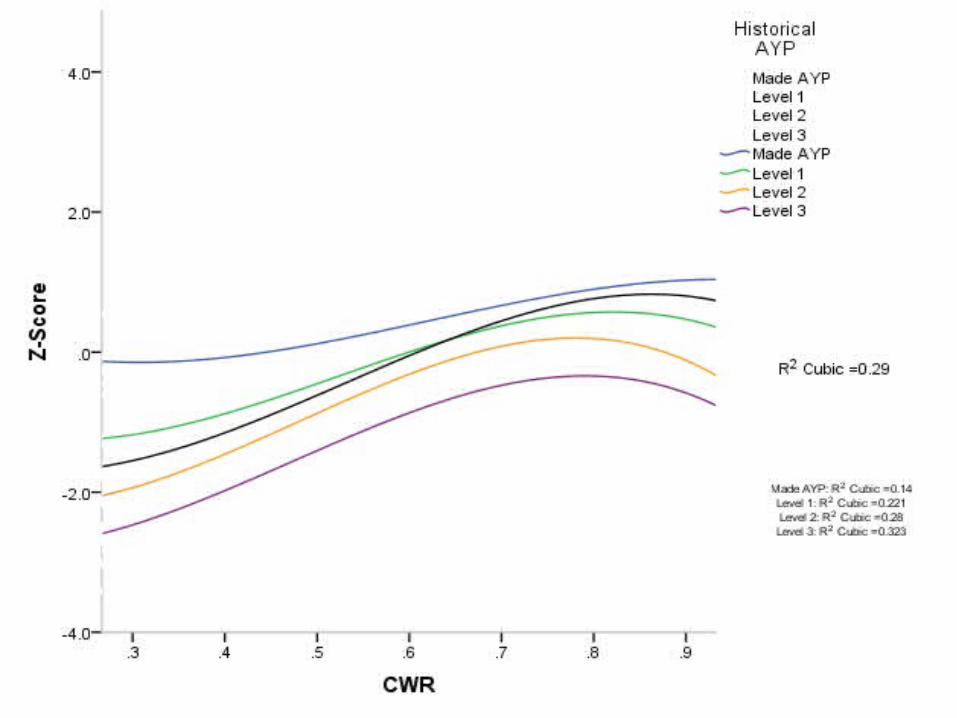
Made AYP 42% 0.54 0.8 0.66
Previous Level 1 30% -0.37 2.0 0.60
Previous Level 2 14% -0.80 2.8 0.57
Previous Level 3 14% -1.18 3.6 0.55
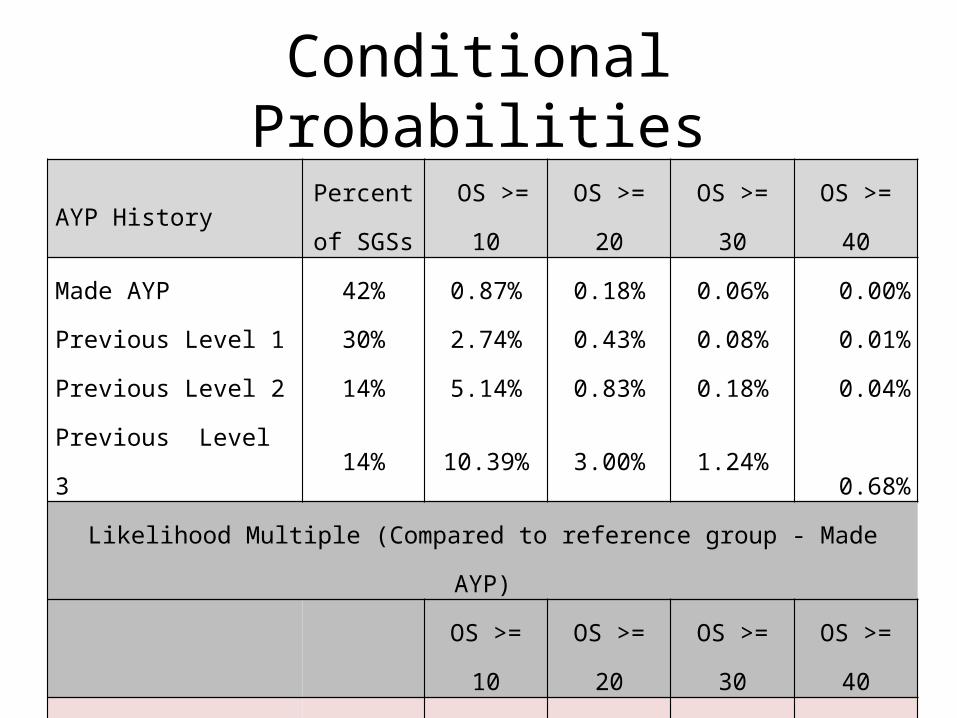
Conditional Probabilities
AYP HistoryPercent of
SGSs OS >= 10 OS >= 20 OS >= 30 OS >= 40
Made AYP 42% 0.87% 0.18% 0.06% 0.00%
Previous Level 1 30% 2.74% 0.43% 0.08% 0.01%
Previous Level 2 14% 5.14% 0.83% 0.18% 0.04%
Previous Level 3 14% 10.39% 3.00% 1.24% 0.68%
Likelihood Multiple (Compared to reference group - Made AYP)
OS >= 10 OS >= 20 OS >= 30 OS >= 40
Previous Level 1 3.2 2.4 1.4
Previous Level 2 5.9 4.6 3.3
Previous Level 3 12.0 16.6 22.3
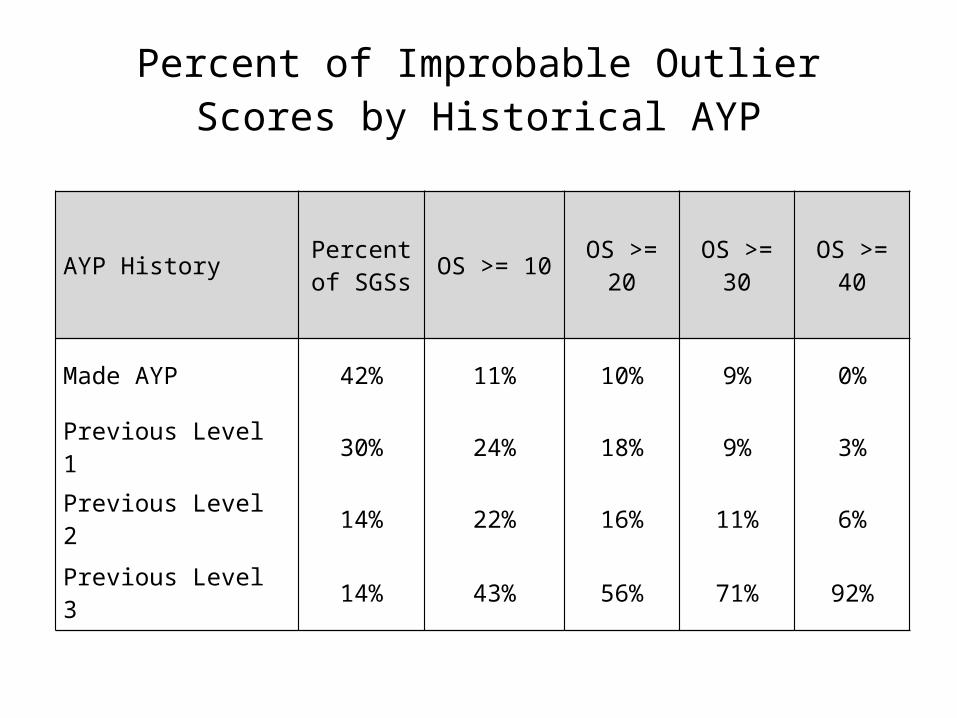
Percent of Improbable Outlier Scores by Historical AYP
AYP History Percent of SGSs OS >= 10 OS >= 20 OS >= 30 OS >= 40
Made AYP 42% 11% 10% 9% 0%
Previous Level 1 30% 24% 18% 9% 3%
Previous Level 2 14% 22% 16% 11% 6%
Previous Level 3 14% 43% 56% 71% 92%
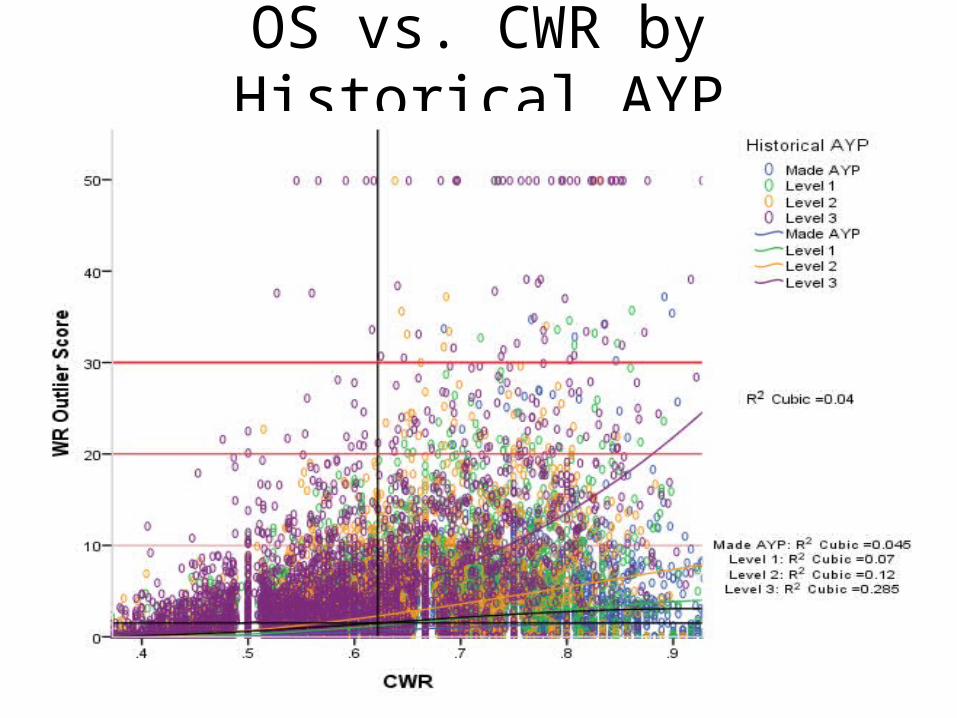
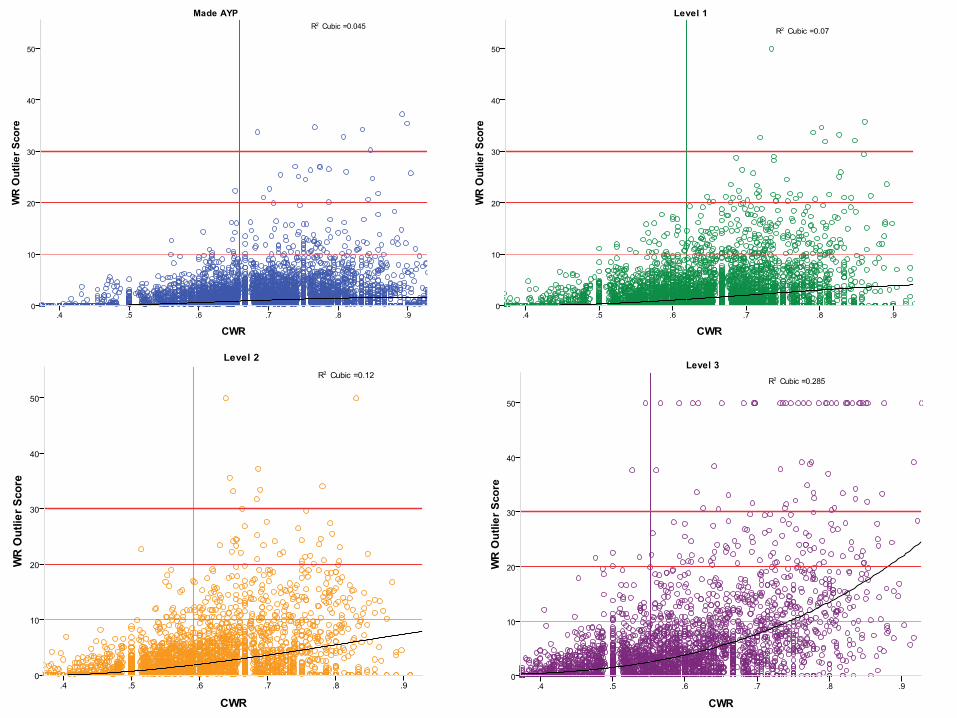
OS vs. CWR by Historical AYP
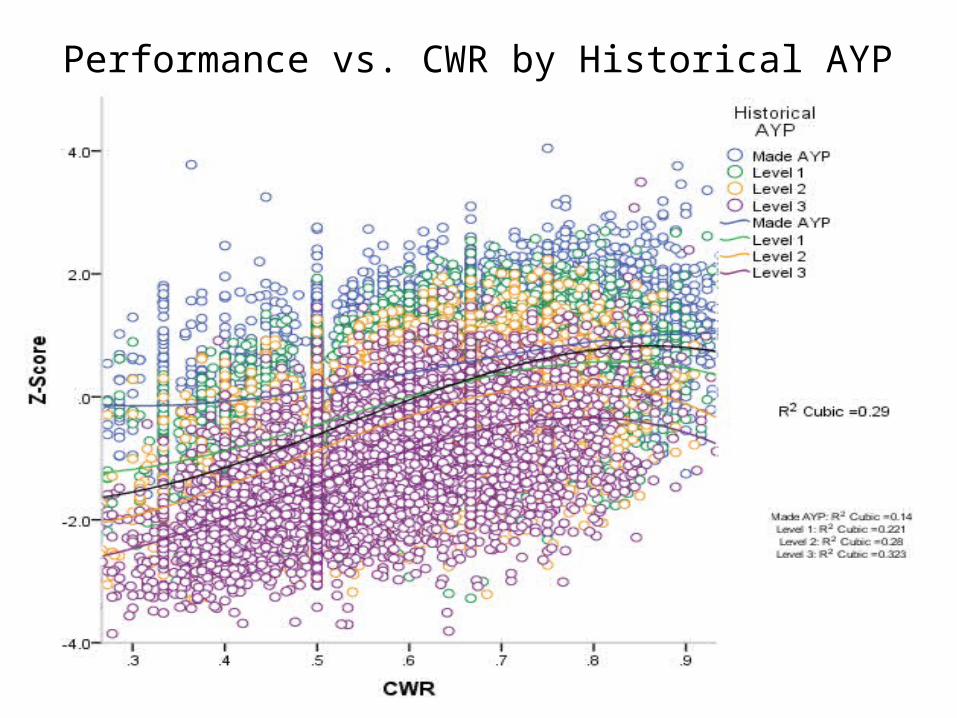
Performance vs. CWR by Historical AYP
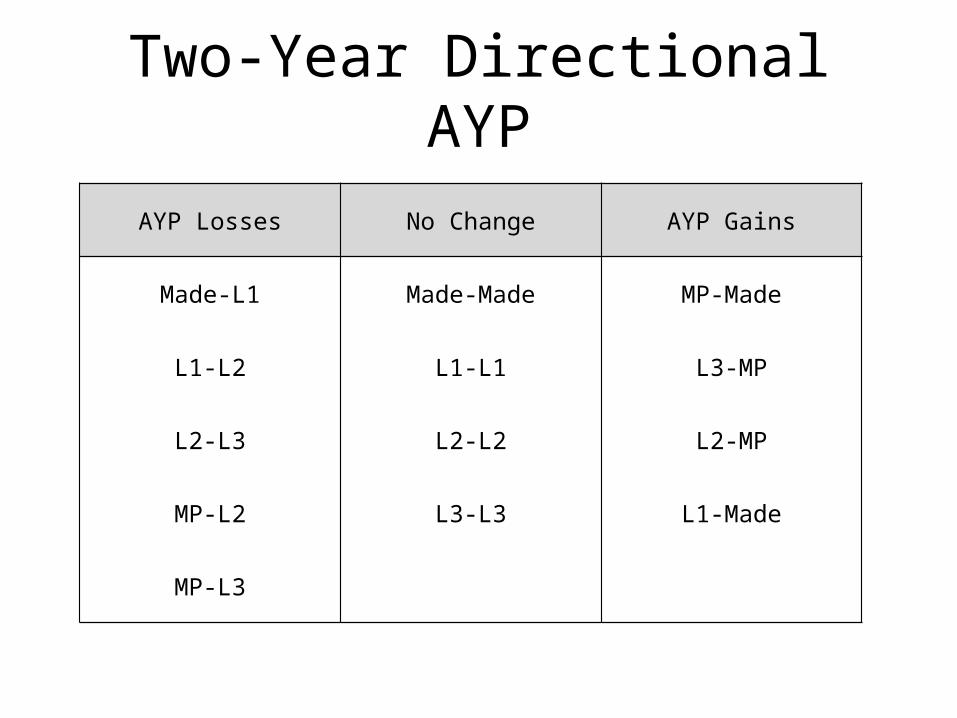
Two-Year Directional AYP
AYP Losses No Change AYP Gains
Made-L1 Made-Made MP-Made
L1-L2 L1-L1 L3-MP
L2-L3 L2-L2 L2-MP
MP-L2 L3-L3 L1-Made
MP-L3
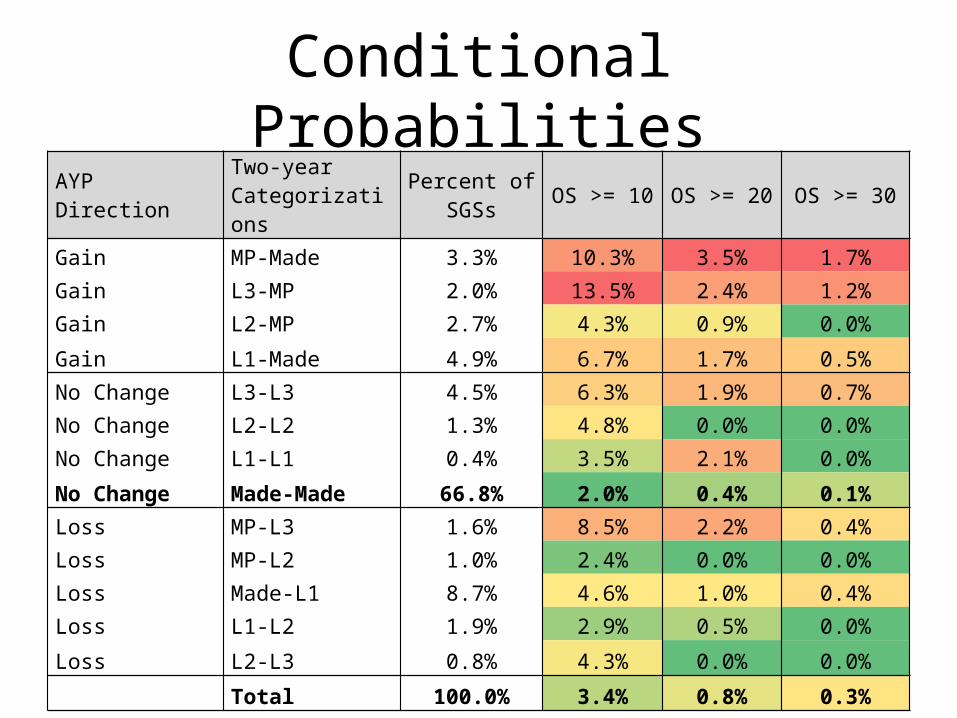
Conditional ProbabilitiesAYP Direction Two-year
CategorizationsPercent of
SGSs OS >= 10 OS >= 20 OS >= 30
Gain MP-Made 3.3% 10.3% 3.5% 1.7%
Gain L3-MP 2.0% 13.5% 2.4% 1.2%
Gain L2-MP 2.7% 4.3% 0.9% 0.0%
Gain L1-Made 4.9% 6.7% 1.7% 0.5%
No Change L3-L3 4.5% 6.3% 1.9% 0.7%
No Change L2-L2 1.3% 4.8% 0.0% 0.0%
No Change L1-L1 0.4% 3.5% 2.1% 0.0%
No Change Made-Made 66.8% 2.0% 0.4% 0.1%
Loss MP-L3 1.6% 8.5% 2.2% 0.4%
Loss MP-L2 1.0% 2.4% 0.0% 0.0%
Loss Made-L1 8.7% 4.6% 1.0% 0.4%
Loss L1-L2 1.9% 2.9% 0.5% 0.0%
Loss L2-L3 0.8% 4.3% 0.0% 0.0%
Total 100.0% 3.4% 0.8% 0.3%
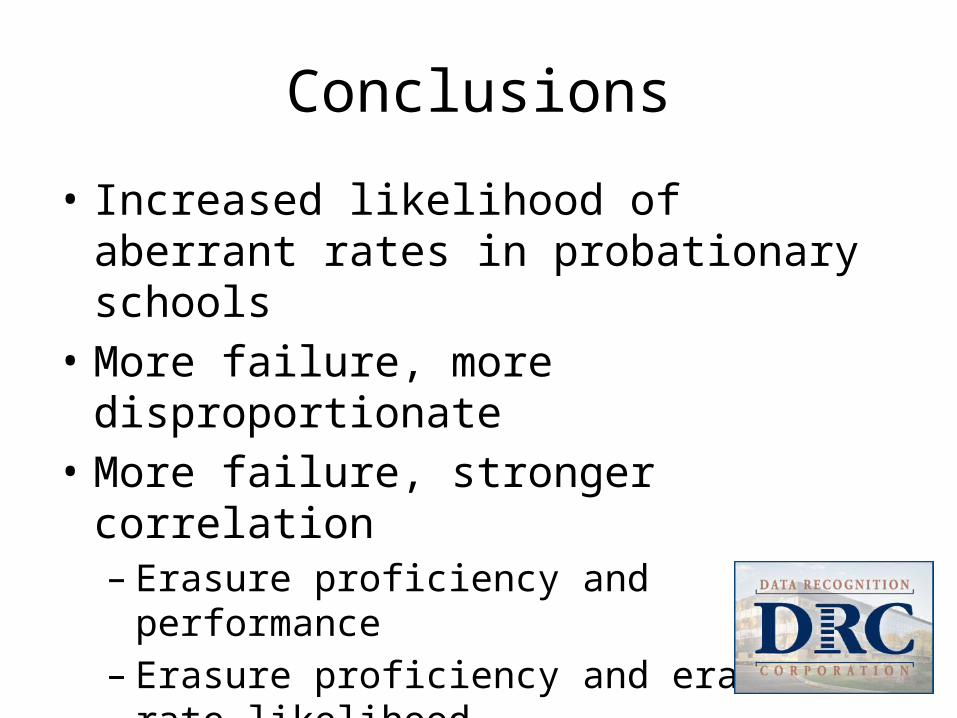
Conclusions
• Increased likelihood of aberrant rates in probationary schools
• More failure, more disproportionate• More failure, stronger correlation
– Erasure proficiency and performance– Erasure proficiency and erasure rate likelihood
• Directional AYP differences