AYALA LAND, INC. · Alveo Land Corporation (Alveo) 100% 100% Serendra, Inc. 39 39 Solinea, Inc....
50
SEC Number: 152-747 File Number: ________ AYALA LAND, INC. ___________________________________ (Company’s Full Name) 31F, Tower One, Ayala Triangle Ayala Avenue, Makati City 1226 ___________________________________ (Company Address) (632) 750-6974 ___________________________________ (Telephone Number) June 30, 2018 ___________________________________ (Quarter Ending) SEC Form 17-Q Quarterly Report ___________________________________ (Form Type) - ___________________________________ (Amendments)
Transcript of AYALA LAND, INC. · Alveo Land Corporation (Alveo) 100% 100% Serendra, Inc. 39 39 Solinea, Inc....
SEC Number: 152-747 File Number: ________
AYALA LAND, INC. ___________________________________
(Company’s Full Name)
31F, Tower One, Ayala Triangle Ayala Avenue, Makati City 1226
___________________________________ (Company Address)
(632) 750-6974 ___________________________________
(Telephone Number)
June 30, 2018 ___________________________________
(Quarter Ending)
SEC Form 17-Q Quarterly Report ___________________________________
(Form Type) -
___________________________________ (Amendments)
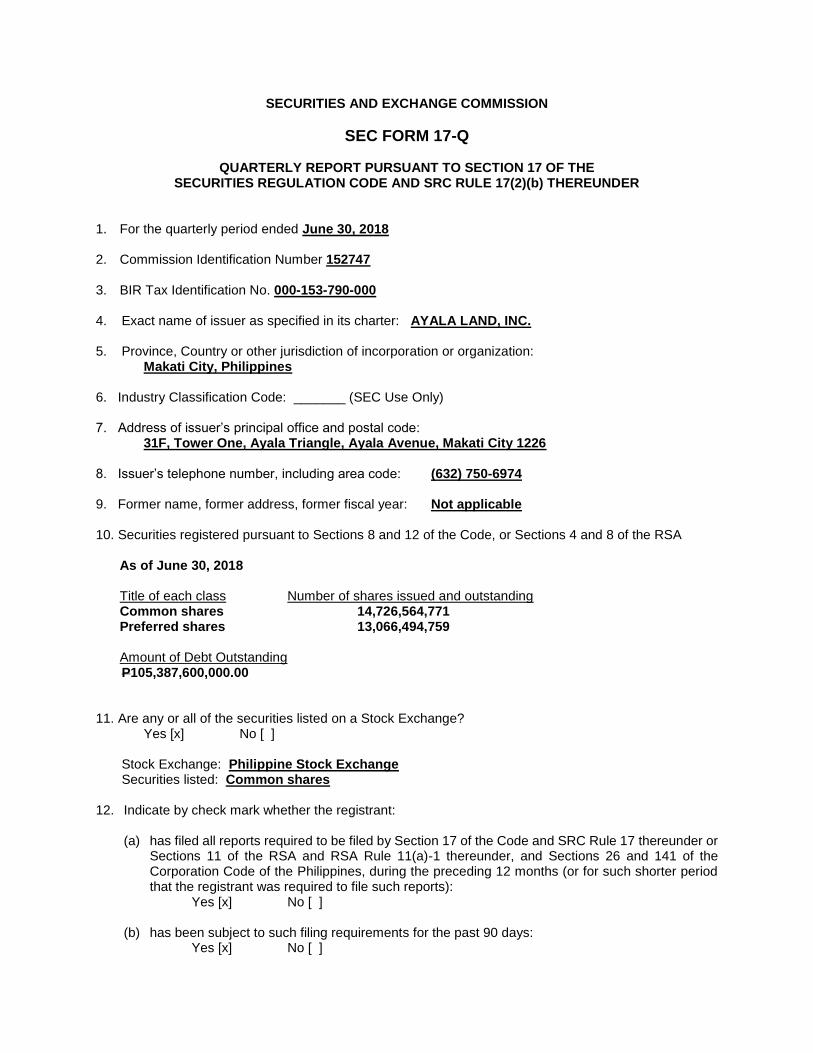
SECURITIES AND EXCHANGE COMMISSION
SEC FORM 17-Q
QUARTERLY REPORT PURSUANT TO SECTION 17 OF THE SECURITIES REGULATION CODE AND SRC RULE 17(2)(b) THEREUNDER
1. For the quarterly period ended June 30, 2018 2. Commission Identification Number 152747 3. BIR Tax Identification No. 000-153-790-000 4. Exact name of issuer as specified in its charter: AYALA LAND, INC. 5. Province, Country or other jurisdiction of incorporation or organization: Makati City, Philippines 6. Industry Classification Code: _______ (SEC Use Only) 7. Address of issuer’s principal office and postal code:
31F, Tower One, Ayala Triangle, Ayala Avenue, Makati City 1226 8. Issuer’s telephone number, including area code: (632) 750-6974 9. Former name, former address, former fiscal year: Not applicable 10. Securities registered pursuant to Sections 8 and 12 of the Code, or Sections 4 and 8 of the RSA
As of June 30, 2018 Title of each class Number of shares issued and outstanding Common shares 14,726,564,771 Preferred shares 13,066,494,759 Amount of Debt Outstanding
P105,387,600,000.00 11. Are any or all of the securities listed on a Stock Exchange? Yes [x] No [ ] Stock Exchange: Philippine Stock Exchange Securities listed: Common shares 12. Indicate by check mark whether the registrant:
(a) has filed all reports required to be filed by Section 17 of the Code and SRC Rule 17 thereunder or Sections 11 of the RSA and RSA Rule 11(a)-1 thereunder, and Sections 26 and 141 of the Corporation Code of the Philippines, during the preceding 12 months (or for such shorter period that the registrant was required to file such reports):
Yes [x] No [ ]
(b) has been subject to such filing requirements for the past 90 days: Yes [x] No [ ]

TABLE OF CONTENTS
Page No.
PART I - FINANCIAL STATEMENTS Item 1. Financial Statements
• Unaudited Consolidated Statements of Financial Position as of 1 June 30, 2018 and December 31, 2017
• Unaudited Consolidated Statements of Income for the First Half 2 ended June 30, 2018 and 2017
• Unaudited Consolidated Statements of Comprehensive Income for 3 the First Half ended June 30, 2018 and 2017
• Unaudited Consolidated Statement of Changes in Equity for 4 the First Half Ended June 30, 2018 and 2017
• Unaudited Consolidated Statements of Cash Flows for the First Half 5 Ended June 30, 2018 and 2017
• Notes to Interim Consolidated Financial Statements 6 Item 2. Management’s Discussion and Analysis of the Financial Condition 36
and Results of Operations PART II - OTHER INFORMATION Item 3. Developments as of June 30, 2018 42
Item 4. Other Notes to 1H 2018 Operations and Financials 43 Item 5. Performance Indicators 46
Signature 47
1
PART I – FINANCIAL INFORMATION
Item 1. Financial Statements
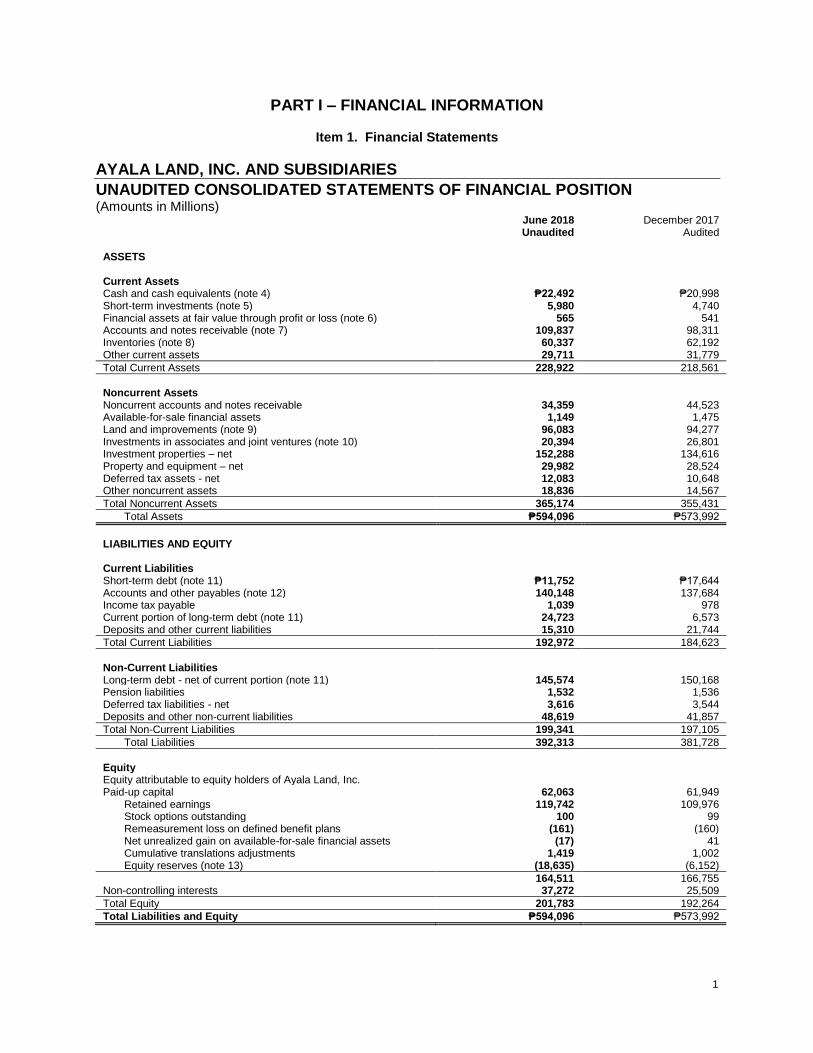
AYALA LAND, INC. AND SUBSIDIARIES
UNAUDITED CONSOLIDATED STATEMENTS OF FINANCIAL POSITION (Amounts in Millions)
June 2018 December 2017 Unaudited Audited ASSETS Current Assets Cash and cash equivalents (note 4) ₱22,492 ₱20,998
Short-term investments (note 5) 5,980 4,740 Financial assets at fair value through profit or loss (note 6) 565 541 Accounts and notes receivable (note 7) 109,837 98,311 Inventories (note 8) 60,337 62,192 Other current assets 29,711 31,779
Total Current Assets 228,922 218,561
Noncurrent Assets Noncurrent accounts and notes receivable 34,359 44,523 Available-for-sale financial assets 1,149 1,475 Land and improvements (note 9) 96,083 94,277 Investments in associates and joint ventures (note 10) 20,394 26,801 Investment properties – net 152,288 134,616 Property and equipment – net 29,982 28,524 Deferred tax assets - net 12,083 10,648 Other noncurrent assets 18,836 14,567
Total Noncurrent Assets 365,174 355,431
Total Assets ₱594,096 ₱573,992
LIABILITIES AND EQUITY Current Liabilities Short-term debt (note 11) ₱11,752 ₱17,644
Accounts and other payables (note 12) 140,148 137,684 Income tax payable 1,039 978 Current portion of long-term debt (note 11) 24,723 6,573 Deposits and other current liabilities 15,310 21,744
Total Current Liabilities 192,972 184,623
Non-Current Liabilities Long-term debt - net of current portion (note 11) 145,574 150,168 Pension liabilities 1,532 1,536 Deferred tax liabilities - net 3,616 3,544 Deposits and other non-current liabilities 48,619 41,857
Total Non-Current Liabilities 199,341 197,105
Total Liabilities 392,313 381,728
Equity Equity attributable to equity holders of Ayala Land, Inc. Paid-up capital 62,063 61,949
Retained earnings 119,742 109,976 Stock options outstanding 100 99 Remeasurement loss on defined benefit plans (161) (160) Net unrealized gain on available-for-sale financial assets (17) 41 Cumulative translations adjustments 1,419 1,002 Equity reserves (note 13) (18,635) (6,152)
164,511 166,755 Non-controlling interests 37,272 25,509
Total Equity 201,783 192,264
Total Liabilities and Equity ₱594,096 ₱573,992
2
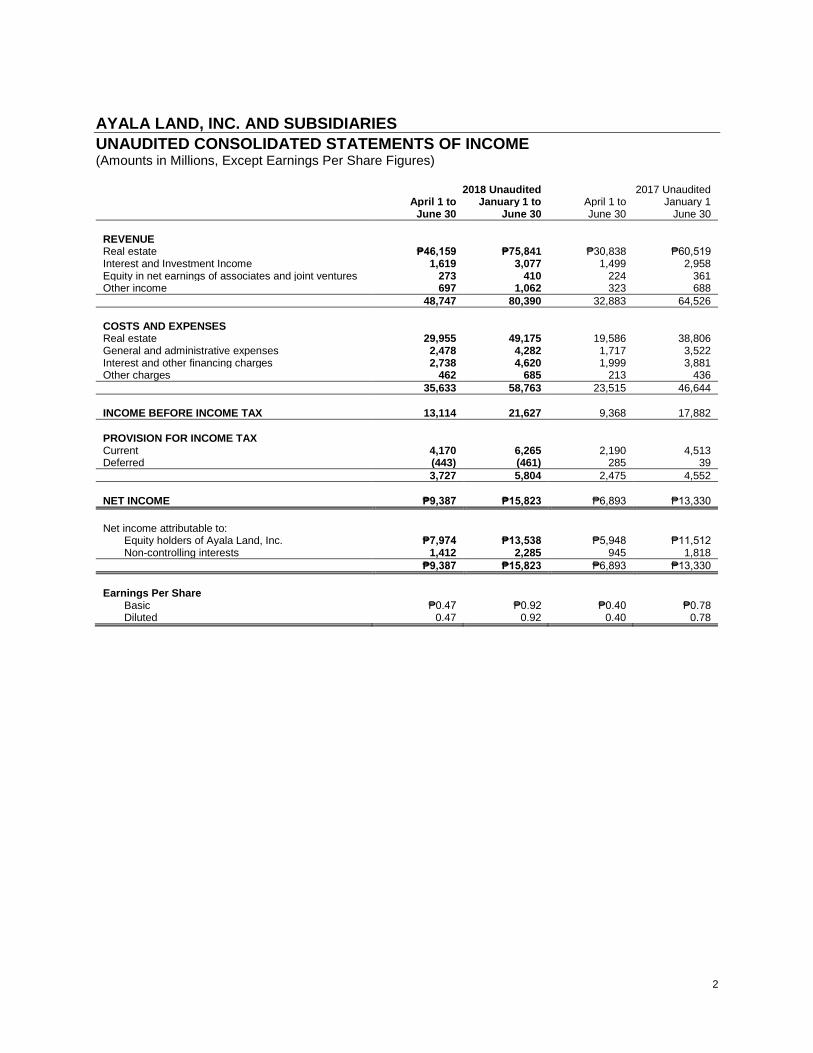
AYALA LAND, INC. AND SUBSIDIARIES
UNAUDITED CONSOLIDATED STATEMENTS OF INCOME (Amounts in Millions, Except Earnings Per Share Figures)
2018 Unaudited 2017 Unaudited April 1 to January 1 to April 1 to January 1 June 30 June 30 June 30 June 30
REVENUE Real estate ₱46,159 ₱75,841 ₱30,838 ₱60,519 Interest and Investment Income 1,619 3,077 1,499 2,958 Equity in net earnings of associates and joint ventures 273 410 224 361 Other income 697 1,062 323 688
48,747 80,390 32,883 64,526
COSTS AND EXPENSES Real estate 29,955 49,175 19,586 38,806 General and administrative expenses 2,478 4,282 1,717 3,522 Interest and other financing charges 2,738 4,620 1,999 3,881 Other charges 462 685 213 436
35,633 58,763 23,515 46,644
INCOME BEFORE INCOME TAX 13,114 21,627 9,368 17,882
PROVISION FOR INCOME TAX Current 4,170 6,265 2,190 4,513 Deferred (443) (461) 285 39
3,727 5,804 2,475 4,552
NET INCOME ₱9,387 ₱15,823 ₱6,893 ₱13,330
Net income attributable to:
Equity holders of Ayala Land, Inc. ₱7,974 ₱13,538 ₱5,948 ₱11,512 Non-controlling interests 1,412 2,285 945 1,818
₱9,387 ₱15,823 ₱6,893 ₱13,330
Earnings Per Share
Basic ₱0.47 ₱0.92 ₱0.40 ₱0.78 Diluted 0.47 0.92 0.40 0.78

3
AYALA LAND, INC. AND SUBSIDIARIES
UNAUDITED CONSOLIDATED STATEMENTS OF COMPREHENSIVE INCOME (Amounts in Millions)
2018 Unaudited 2017 Unaudited April 1 to January 1 to April 1 to January 1 to June 30 June 30 June 30 June 30
NET INCOME ₱8,242 ₱15,823 ₱7,900 ₱13,330
Other comprehensive income/loss
Net unrealized gain (loss) on available-for-sale financial assets (74) (59) (55) (42)
Total comprehensive income for the period ₱8,168 ₱15,764 ₱7,845 ₱13,288
Total comprehensive income attributable to:
Equity holders of Ayala Land, Inc. ₱6,947 ₱13,479 ₱6,748 ₱11,470 Non-controlling interests 1,221 2,285 1,097 1,818
₱8,168 ₱15,764 ₱7,845 ₱13,288

4
AYALA LAND, INC. AND SUBSIDIARIES
UNAUDITED CONSOLIDATED STATEMENTS OF CHANGES IN EQUITY (Amounts in Thousands)
AYALA LAND, INC. AND SUBSIDIARIES
CONSOLIDATED STATEMENTS OF CHANGES IN EQUITY
(Amounts in Thousands)
Net Unrealized
Remeasurement Gain (Loss)
Gain (Loss) on Availablefor-
Additional Appropriated Unappropriated Stock on Defined Sale Cumulative
Paid-in Subscriptions Retained Retained Options Benefit Financial Translation Equity Non-Controlling
Capital Stock Capital Receivable Earnings Earnings Outstanding Plans Assets Adjustments Reserves Total Interests Total Equity
As of January 1, 2018 16,031,596 47,454,241 (1,537,126) 8,000,000 101,976,450 99,064 (160,015) 40,530 1,001,986 (6,152,115) 166,754,611 25,508,747 192,263,358
Net income 13,538,330 13,538,330 2,284,835 15,823,165
Other comprehensive income (loss) (1,349) (57,205) 416,950 358,396 358,396
Total comprehensive income 16,031,596 47,454,241 (1,537,126) 8,000,000 115,514,780 99,064 (161,364) (16,675) 1,418,936 (6,152,115) 180,651,337 27,793,582 208,444,919
Cost of stock options 64,502 64,502 64,502
Collection of subscription receivable 48,339 48,339 48,339
Stock options exercised 1,617 1,421 3,038 3,038
Acquisition of non-controlling interest - -
Increase in non-controlling interest - 9,533,250 9,533,250
Net change in non-controlling interest (12,482,965) (12,482,965) (12,482,965)
Cash dividends declared (3,772,725) (3,772,725) (55,232) (3,827,957)
As of June 30, 2018 16,033,213 47,518,743 (1,488,787) 8,000,000 111,742,055 100,485 (161,364) (16,675) 1,418,936 (18,635,080) 164,511,526 37,271,599 201,783,126
As of January 1, 2017 16,019,332 46,928,521 (1,385,682) 8,000,000 83,798,555 89,697 (356,918) 43,594 - (5,432,003) 147,705,096 24,978,092 172,683,188
Net income 5,564,096 5,564,096 872,556 6,436,652
Other comprehensive income (loss) 27,408 (1,232) 26,176 26,176
Total comprehensive income 16,019,332 46,928,521 (1,385,682) 8,000,000 89,362,651 89,697 (329,510) 42,362 - (5,432,003) 153,295,368 25,850,648 179,146,016
Cost of stock options 25,348 25,348 25,348
Collection of subscription receivable - -
Stock options exercised 1,565 1,565 1,565
Acquisition of non-controlling interest - -
Increase in non-controlling interest - 191,394 191,394
Net change in non-controlling interest (2,196) (2,196) (2,196)
Cash dividends declared (3,531,044) (3,531,044) (3,531,044)
As of June 30, 2017 16,019,332 46,953,869 (1,385,682) 8,000,000 85,831,607 91,262 (329,510) 42,362 - (5,434,199) 149,789,041 26,042,042 175,831,083
Attributable to equity holders of Ayala Land, Inc.

5
AYALA LAND, INC. AND SUBSIDIARIES
UNAUDITED CONSOLIDATED STATEMENTS OF CASH FLOWS (Amounts in Millions)
June 2018 June 2017 Unaudited Unaudited
CASH FLOWS FROM OPERATING ACTIVITIES Income before income tax ₱21,627 ₱17,882
Adjustments for: Depreciation and amortization 3,635 3,166 Interest and other charges - net of amount capitalized 5,304 4,297 Equity in net earnings of investees (410) (361) Interest and other income (3,077) (3,349) Unrealized gain on financial assets (57) (55) Provision for doubtful accounts 1 19
Operating income before changes in working capital 27,023 21,599
Decrease (increase) in: Accounts and notes receivable – trade 7,703 10,231 Real estate inventories 1,855 4,412 Other current assets 2,068 (5,280)
Increase (decrease) in: Accounts and other payables 2,119 1,170 Pension liabilities (5) 38 Other current liabilities (6,434) (4,638)
Cash generated from operations 34,329 27,532 Interest received 3,050 3,338 Income tax paid (5,386) (4,373) Interest paid - net of amount capitalized (5,316) (4,194)
Net cash provided by (used in) operating activities 26,677 22,303
CASH FLOWS FROM INVESTING ACTIVITIES Disposals of (additions to):
Land and improvements (1,806) 301 Investments (26,318) (14,067) Property and equipment (1,773) (2,802) Short term investments (1,265) (4,676)
Decrease (increase) in: Noncurrent accounts and notes receivable - non-trade (9,040) (812) Other assets (5,716) (3,216)
Net cash provided by (used in) investing activities (45,918) (25,273)
CASH FLOWS FROM FINANCING ACTIVITIES Proceeds from short-term / long-term loans 18,150 15,785 Payments of short-term / long-term loans (10,486) (13,203)
Increase (decrease) in: Deposits and other noncurrent liabilities 6,833 1,888 Minority interest in consolidated subsidiaries 9,533 (685)
Proceeds from capital stock subscriptions 116 69 Purchase of treasury shares - - Other Comprehensive Income 417 - -Dividends paid to equity holders of Ayala Land, Inc. (3,828) (3,613)
Net cash provided by (used in) financing activities 20,735 241
NET INCREASE (DECREASE) IN CASH AND CASH EQUIVALENTS 1,494 (2,728) CASH AND CASH EQUIVALENTS AT BEGINNING OF PERIOD 20,998 20,904
CASH AND CASH EQUIVALENTS AT END OF PERIOD ₱22,492 ₱18,176
6
AYALA LAND, INC. AND SUBSIDIARIES
NOTES TO INTERIM CONSOLIDATED FINANCIAL STATEMENTS
1. Corporate Information
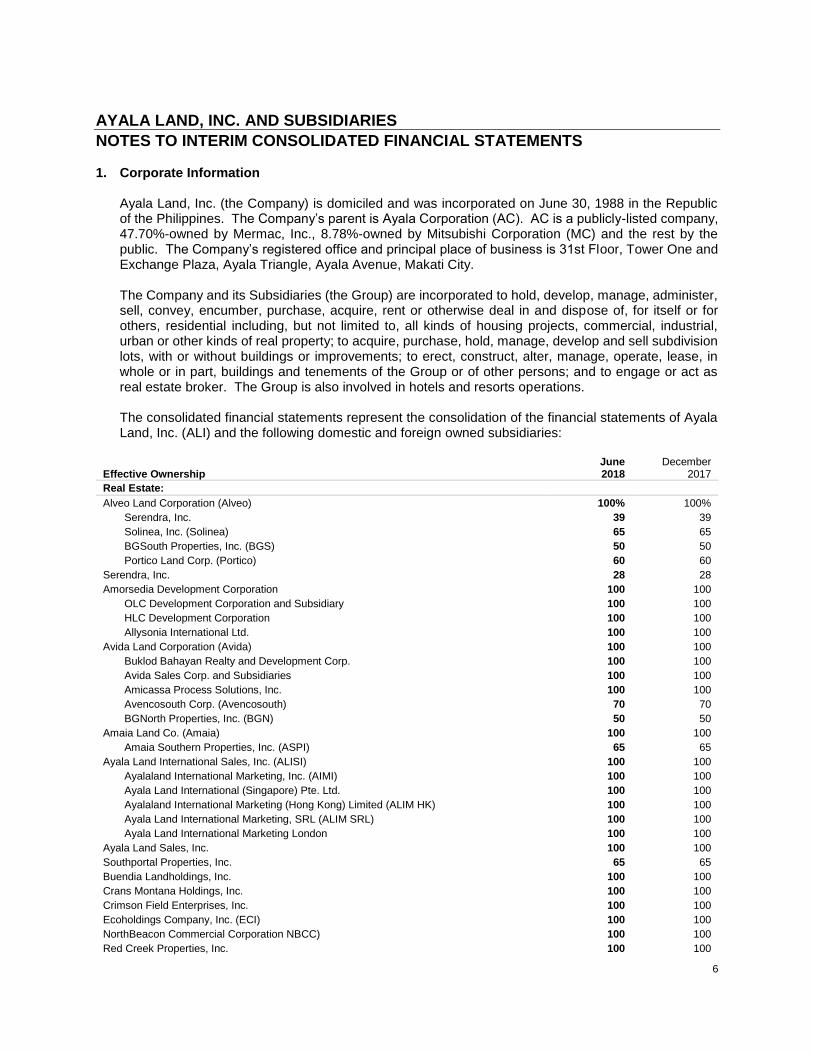
Ayala Land, Inc. (the Company) is domiciled and was incorporated on June 30, 1988 in the Republic of the Philippines. The Company’s parent is Ayala Corporation (AC). AC is a publicly-listed company, 47.70%-owned by Mermac, Inc., 8.78%-owned by Mitsubishi Corporation (MC) and the rest by the public. The Company’s registered office and principal place of business is 31st Floor, Tower One and Exchange Plaza, Ayala Triangle, Ayala Avenue, Makati City. The Company and its Subsidiaries (the Group) are incorporated to hold, develop, manage, administer, sell, convey, encumber, purchase, acquire, rent or otherwise deal in and dispose of, for itself or for others, residential including, but not limited to, all kinds of housing projects, commercial, industrial, urban or other kinds of real property; to acquire, purchase, hold, manage, develop and sell subdivision lots, with or without buildings or improvements; to erect, construct, alter, manage, operate, lease, in whole or in part, buildings and tenements of the Group or of other persons; and to engage or act as real estate broker. The Group is also involved in hotels and resorts operations. The consolidated financial statements represent the consolidation of the financial statements of Ayala Land, Inc. (ALI) and the following domestic and foreign owned subsidiaries:
Effective Ownership June 2018
December 2017
Real Estate:
Alveo Land Corporation (Alveo) 100% 100%
Serendra, Inc. 39 39
Solinea, Inc. (Solinea) 65 65
BGSouth Properties, Inc. (BGS) 50 50
Portico Land Corp. (Portico) 60 60
Serendra, Inc. 28 28
Amorsedia Development Corporation 100 100
OLC Development Corporation and Subsidiary 100 100
HLC Development Corporation 100 100
Allysonia International Ltd. 100 100
Avida Land Corporation (Avida) 100 100
Buklod Bahayan Realty and Development Corp. 100 100
Avida Sales Corp. and Subsidiaries 100 100
Amicassa Process Solutions, Inc. 100 100
Avencosouth Corp. (Avencosouth) 70 70
BGNorth Properties, Inc. (BGN) 50 50
Amaia Land Co. (Amaia) 100 100
Amaia Southern Properties, Inc. (ASPI) 65 65
Ayala Land International Sales, Inc. (ALISI) 100 100
Ayalaland International Marketing, Inc. (AIMI) 100 100
Ayala Land International (Singapore) Pte. Ltd. 100 100
Ayalaland International Marketing (Hong Kong) Limited (ALIM HK) 100 100
Ayala Land International Marketing, SRL (ALIM SRL) 100 100
Ayala Land International Marketing London 100 100
Ayala Land Sales, Inc. 100 100
Southportal Properties, Inc. 65 65
Buendia Landholdings, Inc. 100 100
Crans Montana Holdings, Inc. 100 100
Crimson Field Enterprises, Inc. 100 100
Ecoholdings Company, Inc. (ECI) 100 100
NorthBeacon Commercial Corporation NBCC) 100 100
Red Creek Properties, Inc. 100 100

7
Regent Time International, Limited (Regent Time) (British Virgin Islands) 100 100
Asterion Technopod, Incorporated (ATI) 100 100
Westview Commercial Ventures Corp. (formerly Crestview E-Office Corporation) (Westview) 100 100
North Ventures Commercial Corp. (formerly Fairview Prime Commercial Corp. (formerly Gisborne Property Holdings, Inc.)
100 100
Hillsford Property Corporation (HPC) 100 100
Primavera Towncentre, Inc. (PTI) 100 100
Summerhill E-Office Corporation (Summerhill) 100 100
Sunnyfield E-Office Corporation (Sunnyfield) 100 100
Subic Bay Town Centre, Inc. 100 100
Regent Wise Investments Limited (Regent Wise) (Hongkong company) 100 100
AyalaLand Real Estate Investments Inc. 100 100
AyalaLand Advisory Broadway Inc. 100 100
AyalaLand Development (Canada) Inc. 100 100
AyalaLand OpenAsia Holdings PTE, Limited 100 100
Blue Horizons Holdings PTE, Limited 100 100
Modular Construction Technology (MCT) Bhd. 66 -
AyalaLand Commercial REIT, Inc. (ALCRI) 100 100
Arvo Commercial Corporation (Arvo) 100 100
BellaVita Land Corporation (BellaVita) 100 100
Nuevo Centro, Inc. (Nuevo Centro) 55 55
Alviera Country Club, Inc. 46 47
Prow Holdings Inc 55 55
Cavite Commercial Town Center, Inc. 100 100
AyalaLand Offices, Inc. (ALO) (formerly ALI Property Partners Corp. (APPCo)) 100 100
One Dela Rosa Property Development, Inc. 100 100
First Gateway Real Estate Corp. 100 100
Glensworth Development, Inc. (Glensworth) 100 100
UP North Property Holdings, Inc. 100 100
ALO Prime Realty Corporation 100 100
Aurora Properties Incorporated 80 80
Soltea Commercial Corp. 16 16
Vesta Property Holdings, Inc. 70 70
Station Square East Commercial Corporation (SSECC) 69 69
Next Urban Alliance Development Corp. 100 100
Accendo Commercial Corp. (Accendo) 67 67
Avencosouth Corp. 20 20
Aviana Development Corporation 7 7
Aviana Development Corporation 50 50
Cagayan de Oro Gateway Corp. (CDOGC) 70 70
Ceci Realty, Inc. (Ceci) 60 60
Soltea Commercial Corp. 12 12
Soltea Commercial Corp. 60 60
CMPI Holdings, Inc. 60 60
CMPI Land, Inc. 36 36
ALI-CII Development Corporation (ALI-CII) 50 50
Roxas Land Corporation (RLC) 50 50
Adauge Commercial Corporation (Adauge) 60 60
Southgateway Development Corp. (SDC) 100 100
Ayalaland MetroNorth, Inc. (AMNI) 100 100
North Triangle Depot Commercial Corporation (NTDCC) 73 73
Verde Golf Development Corporation 100 100
BGWest Properties, Inc. (BGW) 50 50
Lagdigan Land Corporation 60 60
Central Block Developers, Inc. 45 35
Cebu Holdings, Inc. (CHI) 75 72
Cebu Property Ventures Development Corp and Subsidiaries 57 63
Cebu Leisure Company, Inc. 75 72
CBP Theatre Management Inc. 75 72
Taft Punta Engaño Property Inc. (TPEPI) 41 40
8
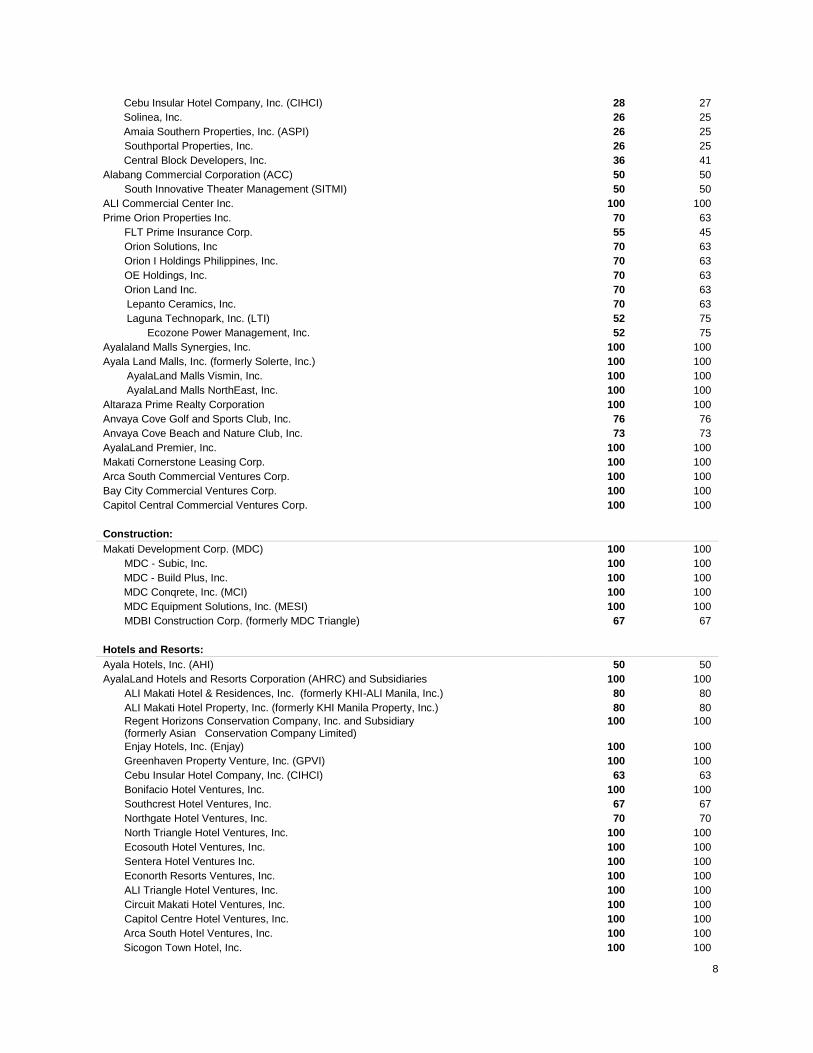
Cebu Insular Hotel Company, Inc. (CIHCI) 28 27
Solinea, Inc. 26 25
Amaia Southern Properties, Inc. (ASPI) 26 25
Southportal Properties, Inc. 26 25
Central Block Developers, Inc. 36 41
Alabang Commercial Corporation (ACC) 50 50
South Innovative Theater Management (SITMI) 50 50
ALI Commercial Center Inc. 100 100
Prime Orion Properties Inc. 70 63
FLT Prime Insurance Corp. 55 45
Orion Solutions, Inc 70 63
Orion I Holdings Philippines, Inc. 70 63
OE Holdings, Inc. 70 63
Orion Land Inc. 70 63
Lepanto Ceramics, Inc. 70 63
Laguna Technopark, Inc. (LTI) 52 75
Ecozone Power Management, Inc. 52 75
Ayalaland Malls Synergies, Inc. 100 100
Ayala Land Malls, Inc. (formerly Solerte, Inc.) 100 100
AyalaLand Malls Vismin, Inc. 100 100
AyalaLand Malls NorthEast, Inc. 100 100
Altaraza Prime Realty Corporation 100 100
Anvaya Cove Golf and Sports Club, Inc. 76 76
Anvaya Cove Beach and Nature Club, Inc. 73 73
AyalaLand Premier, Inc. 100 100
Makati Cornerstone Leasing Corp. 100 100
Arca South Commercial Ventures Corp. 100 100
Bay City Commercial Ventures Corp. 100 100
Capitol Central Commercial Ventures Corp. 100 100
Construction:
Makati Development Corp. (MDC) 100 100
MDC - Subic, Inc. 100 100
MDC - Build Plus, Inc. 100 100
MDC Conqrete, Inc. (MCI) 100 100
MDC Equipment Solutions, Inc. (MESI) 100 100
MDBI Construction Corp. (formerly MDC Triangle) 67 67
Hotels and Resorts:
Ayala Hotels, Inc. (AHI) 50 50
AyalaLand Hotels and Resorts Corporation (AHRC) and Subsidiaries 100 100
ALI Makati Hotel & Residences, Inc. (formerly KHI-ALI Manila, Inc.) 80 80
ALI Makati Hotel Property, Inc. (formerly KHI Manila Property, Inc.) 80 80
Regent Horizons Conservation Company, Inc. and Subsidiary (formerly Asian Conservation Company Limited)
100 100
Enjay Hotels, Inc. (Enjay) 100 100
Greenhaven Property Venture, Inc. (GPVI) 100 100
Cebu Insular Hotel Company, Inc. (CIHCI) 63 63
Bonifacio Hotel Ventures, Inc. 100 100
Southcrest Hotel Ventures, Inc. 67 67
Northgate Hotel Ventures, Inc. 70 70
North Triangle Hotel Ventures, Inc. 100 100
Ecosouth Hotel Ventures, Inc. 100 100
Sentera Hotel Ventures Inc. 100 100
Econorth Resorts Ventures, Inc. 100 100
ALI Triangle Hotel Ventures, Inc. 100 100
Circuit Makati Hotel Ventures, Inc. 100 100
Capitol Centre Hotel Ventures, Inc. 100 100
Arca South Hotel Ventures, Inc. 100 100
Sicogon Town Hotel, Inc. 100 100

9
Sicogon Island Tourism Estate, Corp. 100 100
Bay Area Hotel Ventures, Inc. 100 100
Makati North Hotel Ventures, Inc. 100 100
One Makati Hotel Ventures, Inc. 100 100
ALI Makati Hotel & Residences, Inc. (formerly KHI-ALI Manila, Inc.) 20 20
ALI Makati Hotel Property, Inc. (formerly KHI Manila Property, Inc.) 20 20
Ten Knots Phils., Inc. (TKPI) 60 60
Bacuit Bay Development Corporation 60 60
Lio Resort Ventures Inc. 60 60
North Liberty Resort Ventures Inc. 60 60
Paragua Eco-Resort Ventures Inc. 60 60
Lio Tourism Estate Management Corp. 60 60
Ten Knots Development, Corp. (TKDC) 60 60
Chirica Resorts Corp. 60 60
Kingfisher Capital Resources Corp. 60 60
Pangalusian Island Resort Corporation 60 60
Property Management:
Ayala Property Management Corporation (APMC) 100 100
Prime Support Services, Inc. 100 100
Ayala Theatres Management, Inc. and Subsidiaries 100 100
DirectPower Services, Inc. (DirectPower) 100 100
Philippine Integrated Energy Solutions, Inc. (PhilEnergy) 100 100
Entertainment:
Five Star Cinema, Inc. 100 100
Leisure and Allied Industries Philippines, Inc. (LAIP) 50 50
Others:
ALInet.com, Inc. (ALInet) 100 100
First Longfield Investments Limited (First Longfield) (Hongkong company) 100 100
Green Horizons Holdings Limited 100 100
Aprisa Business Process Solutions, Inc. (Aprisa) 100 100
AyalaLand Club Management, Inc. 100 100
ALI Capital Corp. (formerly Varejo Corp.) 100 100
Integrated Eco-resort Inc. 100 100
Island Transvoyager, Inc. 100 100
Ayalaland Medical Facilities Leasing Inc. (Ayala Land Healthcare Leasing Inc.) 100 100
Whiteknight Holdings, Inc. (WHI) 100 100
Arca South Integrated Terminal, Inc. 100 100
AC owns the other 50.0% of AHI. The Company exercises control over AHI. Likewise, the Company, through its 50.0% effective ownership and by virtue of a management contract or shareholders’ agreement, exercises control over the operations and management of ACC, BGWest, BGNorth, BGSouth, RLC, ALI-CII and LAIP. Accordingly, the accounts of AHI, ACC, BGWest, BGNorth, BGSouth, RLC, ALI-CII and LAIP are consolidated to the accounts of the Company.
10
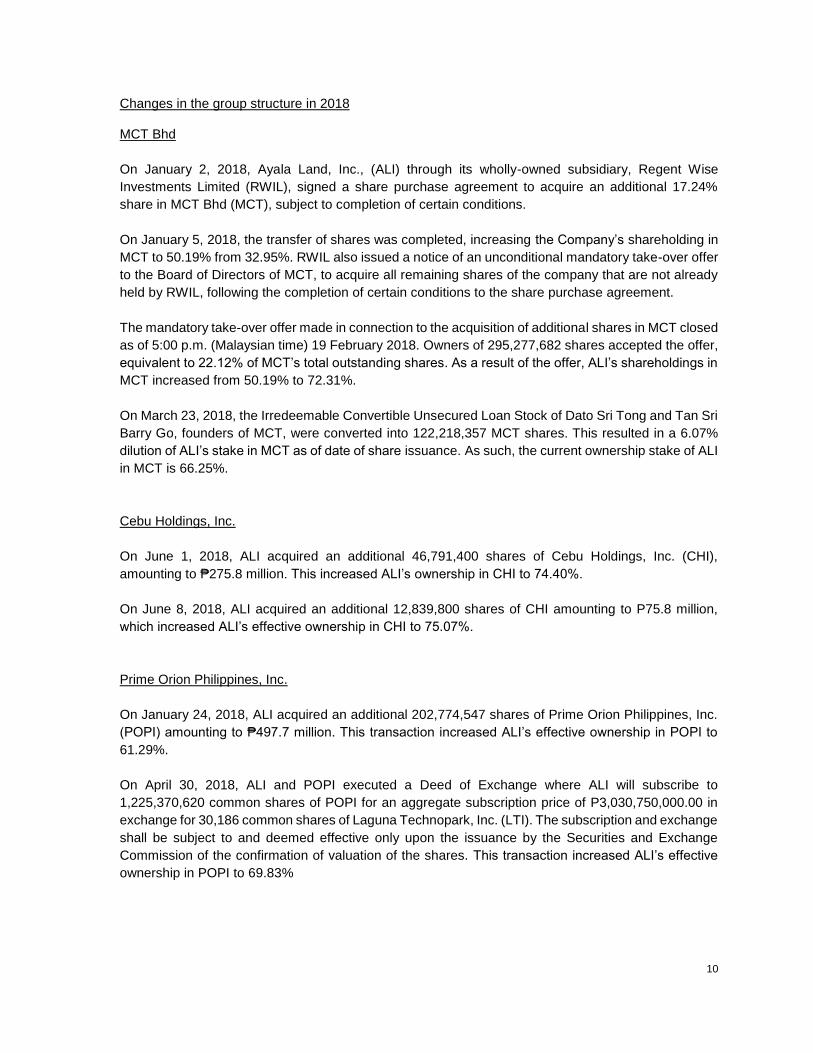
Changes in the group structure in 2018 MCT Bhd
On January 2, 2018, Ayala Land, Inc., (ALI) through its wholly-owned subsidiary, Regent Wise
Investments Limited (RWIL), signed a share purchase agreement to acquire an additional 17.24%
share in MCT Bhd (MCT), subject to completion of certain conditions.
On January 5, 2018, the transfer of shares was completed, increasing the Company’s shareholding in
MCT to 50.19% from 32.95%. RWIL also issued a notice of an unconditional mandatory take-over offer
to the Board of Directors of MCT, to acquire all remaining shares of the company that are not already
held by RWIL, following the completion of certain conditions to the share purchase agreement.
The mandatory take-over offer made in connection to the acquisition of additional shares in MCT closed
as of 5:00 p.m. (Malaysian time) 19 February 2018. Owners of 295,277,682 shares accepted the offer,
equivalent to 22.12% of MCT’s total outstanding shares. As a result of the offer, ALI’s shareholdings in
MCT increased from 50.19% to 72.31%.
On March 23, 2018, the Irredeemable Convertible Unsecured Loan Stock of Dato Sri Tong and Tan Sri
Barry Go, founders of MCT, were converted into 122,218,357 MCT shares. This resulted in a 6.07%
dilution of ALI’s stake in MCT as of date of share issuance. As such, the current ownership stake of ALI
in MCT is 66.25%.
Cebu Holdings, Inc.
On June 1, 2018, ALI acquired an additional 46,791,400 shares of Cebu Holdings, Inc. (CHI),
amounting to ₱275.8 million. This increased ALI’s ownership in CHI to 74.40%.
On June 8, 2018, ALI acquired an additional 12,839,800 shares of CHI amounting to P75.8 million,
which increased ALI’s effective ownership in CHI to 75.07%.
Prime Orion Philippines, Inc.
On January 24, 2018, ALI acquired an additional 202,774,547 shares of Prime Orion Philippines, Inc.
(POPI) amounting to ₱497.7 million. This transaction increased ALI’s effective ownership in POPI to
61.29%.
On April 30, 2018, ALI and POPI executed a Deed of Exchange where ALI will subscribe to
1,225,370,620 common shares of POPI for an aggregate subscription price of P3,030,750,000.00 in
exchange for 30,186 common shares of Laguna Technopark, Inc. (LTI). The subscription and exchange
shall be subject to and deemed effective only upon the issuance by the Securities and Exchange
Commission of the confirmation of valuation of the shares. This transaction increased ALI’s effective
ownership in POPI to 69.83%
11
2. Basis of Financial Statement Preparation The accompanying unaudited condensed consolidated financial statements have been prepared in accordance with Philippine Accounting Standard (PAS) 34, Interim Financial Reporting. Accordingly, the unaudited condensed consolidated financial statements do not include all of the information and disclosures required in the December 31, 2017 annual audited consolidated financial statements and should be read in conjunction with the Group’s annual consolidated financial statements, as of, and for the year ended December 31, 2017. The preparation of the financial statements in compliance with Philippine Financial Reporting Standards (PFRS) requires management to make estimates and assumptions that affect the amounts reported in the financial statements and accompanying notes. The estimates and assumptions used in the accompanying unaudited condensed consolidated financial statements are based upon management’s evaluation of relevant facts and circumstances as of the date of the unaudited condensed consolidated financial statements. Actual results could differ from such estimates. The unaudited condensed consolidated financial statements include the accounts of Ayala Land, Inc. (herein referred to as “the Company) and its subsidiaries collectively referred to as “Group.” The unaudited condensed consolidated financial statements are presented in Philippine peso (Php), the Group’s functional currency, and rounded to the nearest thousands (₱000) except when otherwise indicated. On August 06, 2018, the Audit Committee approved and authorized the release of the accompanying unaudited condensed consolidated financial statements of Ayala Land, Inc. and subsidiaries.
3. Summary of Significant Accounting Policies
Basis of Consolidation The consolidated financial statements represent the consolidation of the financial statements of the Group as of December 31, 2017 and June 30, 2018. Control is achieved when the Group is exposed, or has rights, to variable returns from its involvements with the investee and has the ability to affect the return through its power over the investee. Specifically, the Group controls an investee if and only if the Group has: • Power over the investee (i.e. existing rights that give it the current ability to direct the relevant
activities of the investee) • Exposure or rights, to variable return from the involvement with the investee, and • The ability to use its power over the investee to affect its returns. When the Group has less than a majority of the voting or similar rights of an investee, the Group considers all relevant facts and circumstances in assessing whether it has power over an investee, including: • The contractual arrangement with the other vote holders of the investee, • Rights arising from the other contractual arrangements, and • The Groups’ voting rights and potential voting rights. The Group re-assesses whether or not it controls an investee if facts and circumstances indicate that there are changes to one or more of the three elements of control. Consolidation of a subsidiary begins when the Group obtains control over the subsidiary and ceases when the Group loses control of the subsidiary. Assets, liabilities, income and expenses of a subsidiary acquired or disposed of during the

12
year are included or excluded in the consolidated financial statements from the date the Group gains control or until the date the Group ceases to control the subsidiary. The financial statements of the subsidiaries are prepared for the same reporting period as the Company, using consistent accounting policies. All intra-group balances, transactions, unrealized gains and losses resulting from intra-group transactions and dividends are eliminated in full. Non-controlling interests represent the portion of profit or loss and net assets in subsidiaries not wholly owned and are presented separately in the consolidated statement of income, consolidated statement of comprehensive income and consolidated statement of changes in equity and within equity in the consolidated statements of financial position, separately from the Company’s equity. Total comprehensive income within a subsidiary is attributed to the non-controlling interests even if that results in a deficit balance. A change in the ownership interest of a subsidiary, without loss of control, is accounted for as an equity transaction. If the Group loses control over a subsidiary, it: • Derecognizes the assets (including goodwill) and liabilities of the subsidiary, the carrying amount
of any non-controlling interest and the cumulative translation differences recorded in equity, • Recognizes the fair value of the consideration received, the fair value of any investment retained
and any surplus or deficit in profit or loss, and • Reclassifies the parent’s share of components previously recognized in other comprehensive
income to profit or loss or retained earnings, as appropriate. Changes in Accounting Policies The accounting policies adopted in the preparation of the unaudited condensed consolidated financial statements are consistent with those of the previous Group’s annual financial statements for the year ended December 31, 2017, except for the adoption of the following new Standards and amended PFRS which became effective January 1, 2018.
• Amendments to PFRS 2, Share-based Payment, Classification and Measurement of Share-based Payment Transactions The amendments to PFRS 2 address three main areas: the effects of vesting conditions on the measurement of a cash-settled share-based payment transaction; the classification of a share-based payment transaction with net settlement features for withholding tax obligations; and the accounting where a modification to the terms and conditions of a share-based payment transaction changes its classification from cash settled to equity settled.
On adoption, entities are required to apply the amendments without restating prior periods, but retrospective application is permitted if elected for all three amendments and if other criteria are met. Early application of the amendments is permitted.
The Group is assessing the potential effect of the amendments on its consolidated financial statements.
• Amendments to PFRS 4, Insurance Contracts, Applying PFRS 9, Financial Instruments, with PFRS 4 The amendments address concerns arising from implementing PFRS 9, the new financial instruments standard before implementing the forthcoming insurance contracts standard. They allow entities to choose between the overlay approach and the deferral approach to deal with the transitional challenges. The overlay approach gives all entities that issue insurance contracts the
13
option to recognize in other comprehensive income, rather than profit or loss, the volatility that could arise when PFRS 9 is applied before the new insurance contracts standard is issued. On the other hand, the deferral approach gives entities whose activities are predominantly connected with insurance an optional temporary exemption from applying PFRS 9 until the earlier of application of the forthcoming insurance contracts standard or January 1, 2021.
The overlay approach and the deferral approach will only be available to an entity if it has not previously applied PFRS 9. The amendments are not applicable to the Group since none of the entities within the Group have activities that are predominantly connected with insurance or issue insurance contracts.
• PFRS 15, Revenue from Contracts with Customers PFRS 15 establishes a new five-step model that will apply to revenue arising from contracts with customers. Under PFRS 15, revenue is recognized at an amount that reflects the consideration to which an entity expects to be entitled in exchange for transferring goods or services to a customer. The principles in PFRS 15 provide a more structured approach to measuring and recognizing revenue.
The new revenue standard is applicable to all entities and will supersede all current revenue recognition requirements under PFRSs. Either a full or modified retrospective application is required for annual periods beginning on or after January 1, 2018.
• PFRS 9, Financial Instruments PFRS 9 reflects all phases of the financial instruments project and replaces PAS 39, Financial Instruments: Recognition and Measurement, and all previous versions of PFRS 9. The standard introduces new requirements for classification and measurement, impairment, and hedge accounting. PFRS 9 is effective for annual periods beginning on or after January 1, 2018, with early application permitted. Retrospective application is required, but providing comparative information is not compulsory. For hedge accounting, the requirements are generally applied prospectively, with some limited exceptions. The adoption of PFRS 9 will have an effect on the classification and measurement of the Group’s financial assets and impairment methodology for financial assets, but will have no impact on the classification and measurement of the Group’s financial liabilities. The adoption will also have an effect on the Group’s application of hedge accounting and on the amount of its credit losses. The Group is currently assessing the impact of adopting this standard.
• Amendments to PAS 28, Measuring an Associate or Joint Venture at Fair Value (Part of Annual Improvements to PFRSs 2014 - 2016 Cycle) The amendments clarify that an entity that is a venture capital organization, or other qualifying entity, may elect, at initial recognition on an investment-by-investment basis, to measure its investments in associates and joint ventures at fair value through profit or loss. They also clarify that if an entity that is not itself an investment entity has an interest in an associate or joint venture that is an investment entity, the entity may, when applying the equity method, elect to retain the fair value measurement applied by that investment entity associate or joint venture to the investment entity associate’s or joint venture’s interests in subsidiaries. This election is made separately for each investment entity associate or joint venture, at the later of the date on which (a) the investment entity associate or joint venture is initially recognized; (b) the associate or joint venture becomes

14
an investment entity; and (c) the investment entity associate or joint venture first becomes a parent. The amendments should be applied retrospectively, with earlier application permitted.
The Group does not expect the amendments to have material impact on its consolidated financial statements.
• Amendments to PAS 40, Investment Property, Transfers of Investment Property The amendments clarify when an entity should transfer property, including property under construction or development into, or out of investment property. The amendments state that a change in use occurs when the property meets, or ceases to meet, the definition of investment property and there is evidence of the change in use. A mere change in management’s intentions for the use of a property does not provide evidence of a change in use. The amendments should be applied prospectively to changes in use that occur on or after the beginning of the annual reporting period in which the entity first applies the amendments. Retrospective application is only permitted if this is possible without the use of hindsight.
The Group does not expect the amendments to have material impact on its consolidated financial statements.
• Philippine Interpretation IFRIC-22, Foreign Currency Transactions and Advance Consideration The interpretation clarifies that in determining the spot exchange rate to use on initial recognition of the related asset, expense or income (or part of it) on the derecognition of a non-monetary asset or non-monetary liability relating to advance consideration, the date of the transaction is the date on which an entity initially recognizes the nonmonetary asset or non-monetary liability arising from the advance consideration. If there are multiple payments or receipts in advance, then the entity must determine a date of the transactions for each payment or receipt of advance consideration. The interpretation may be applied on a fully retrospective basis. Entities may apply the interpretation prospectively to all assets, expenses and income in its scope that are initially recognized on or after the beginning of the reporting period in which the entity first applies the interpretation or the beginning of a prior reporting period presented as comparative information in the financial statements of the reporting period in which the entity first applies the interpretation.
The Group does not expect the amendments to have material impact on its consolidated financial statements.
Effective beginning on or after January 1, 2019
• PFRS 16, Leases Under the new standard, lessees will no longer classify their leases as either operating or finance leases in accordance with PAS 17, Leases. Rather, lessees will apply the single-asset model. Under this model, lessees will recognize the assets and related liabilities for most leases on their balance sheets, and subsequently, will depreciate the lease assets and recognize interest on the lease liabilities in their profit or loss. Leases with a term of 12 months or less or for which the underlying asset is of low value are exempted from these requirements.
The accounting by lessors is substantially unchanged as the new standard carries forward the principles of lessor accounting under PAS 17. Lessors, however, will be required to disclose more information in their financial statements, particularly on the risk exposure to residual value.

15
Entities may early adopt PFRS 16 but only if they have also adopted PFRS 15. When adopting PFRS 16, an entity is permitted to use either a full retrospective or a modified retrospective approach, with options to use certain transition reliefs. The Group is currently assessing the impact of adopting PFRS 16.
Deferred effectivity
• Amendments to PFRS 10 and PAS 28, Sale or Contribution of Assets between an Investor and its Associate or Joint Venture The amendments address the conflict between PFRS 10 and PAS 28 in dealing with the loss of control of a subsidiary that is sold or contributed to an associate or joint venture. The amendments clarify that a full gain or loss is recognized when a transfer to an associate or joint venture involves a business as defined in PFRS 3, Business Combinations. Any gain or loss resulting from the sale or contribution of assets that does not constitute a business, however, is recognized only to the extent of unrelated investors’ interests in the associate or joint venture.
On January 13, 2016, the Financial Reporting Standards Council postponed the original effective date of January 1, 2016 of the said amendments until the International Accounting Standards Board has completed its broader review of the research project on equity accounting that may result in the simplification of accounting for such transactions and of other aspects of accounting for associates and joint ventures.
4. Cash and Cash Equivalents
This account consists of the following: Cash in banks earns interest at the respective bank deposit rates. Cash equivalents are short term, highly liquid investments that are made for varying periods of up to three (3) months depending on the immediate cash requirements of the Group, and earn interest at the respective short-term investment rates.
5. Short-term Investments
Short-term investments consist of money market placements made for varying periods of more than three (3) months and up to one (1) year and earn interest at the respective short-term investment rates. The annual interest rates of the short-term investments are as follows:
(in million pesos) June 30, 2018
(Unaudited) December 31, 2017
(Audited)
Cash on Hand ₱60 ₱52 Cash in Banks 11,977 10,108 Cash Equivalents 10,455 10,838
TOTAL ₱22,492 ₱20,998
June 30, 2018 (Unaudited)
December 31, 2017 (Audited)
Philippine Peso 2.6% to 3.8% 2.3% to 3.7% US Dollar 2.4% to 3.02% 2.0% to 2.2%

16
6. Financial Assets at FVPL This account consists of the following: Investment in ARCH Capital Fund pertains to monetary interest in a fund in which the management takes the view that these are held for trading and it is a portfolio of identified property funds invested and managed by professional managers. The Group invests in money market Unit Investment Trust Funds (UITF) which aims to generate liquidity and stable income by investing in a diversified portfolio of primarily short-term fixed income instruments and with no minimum holding period requirement.
7. Accounts and Notes Receivables The account consists of:
(in million pesos June 30, 2018
(Unaudited) December 31, 2017
(Audited)
Trade: Residential and office development ₱82,556 ₱89,199 Shopping centers 2,703 2,709 Construction contracts 1,054 2,495 Corporate business 1,876 1,606 Management fees 307 329 Others 2,711 1,377 Advances to other companies 20,777 22,394 Advances to contractors and suppliers 20,317 16,185 Accrued receivables 5,460 4,700 Receivables from related parties (Note 13) 6,305 1,734 Receivables from employees 970 832
145,038 143,560 Less allowance for impairment losses 840 726
144,198 142,834 Less noncurrent portion 34,359 44,523
₱109,837 ₱98,311
The classes of trade receivables of the Group are as follows:
• Residential and office development - pertain to receivables from the sale of high-end, upper middle-income and affordable residential lots and units; economic and socialized housing units and sale of commercial lots; sale of office units; and leisure community developments
• Construction contracts - pertain to receivables from third party construction projects
• Shopping centers - pertain to lease receivables from retail spaces
• Corporate business - pertain to lease receivables from office and factory buildings; and receivables from the sale of office buildings and industrial lots
• Management fees - pertain to receivables from facilities management services
• Others - pertain to receivables from hotel operations and other support services
Receivables from shopping centers, construction contracts and management fees are due within 30 days upon billing.
Corporate business receivables are collectible on a monthly or quarterly basis depending on the terms of the lease contracts.
(in million pesos) June 30, 2018
(Unaudited) December 31, 2017
(Audited)
Investment in Arch Capital Fund 446 458 Investment in Unit Investment Trust Fund (UITF) ₱119 ₱83
TOTAL ₱565 ₱541

17
Advances to other companies includes advances made to joint venture partners that have been made in consideration of project costs and purchases of land that are still subject to completion. The Group does not intend that these advances will be repaid, but will instead be recorded as part of the project costs upon development or as part of consideration for purchases of land. The documentation for these advances provides that these will be payable over a fixed term or on demand in order to allow for repayment of the advances when closing does not occur. Advances to other companies also includes Receivables from MRT Development Corporation (MRTDC) shareholders which pertains to interest-bearing advances to MRTDC equivalent to the Pre-2006 Development Rights Payment (DRP) Payables and the Residual Depot DRP which is due more than one year, in relation to the funding and repayment agreement.
Set off shall be effective as of the beginning of every calendar month, commencing January 30, 2015 and shall result in the settlement of the portion of the Total DRP Payables to the extent of the amount of the commercial center royalties then the balance will fall due to the relevant MRTDC Shareholders.
Advances to contractors and suppliers are recouped upon every progress billing payment depending on the percentage of accomplishment or delivery.
Accrued receivables and receivables from related parties are due and demandable. Receivables from employees pertain to housing, car, salary and other loans granted to the Group’s employees which are collectible through salary deduction, are interest-bearing and payable on various maturity dates. The Group entered into agreements with BPI Asset Management and Trust Corporation in 2017 for the assignment of interest-bearing employee receivables amounting to ₱69.0 million, respectively. The transactions were without recourse and did not result to any gain or loss.
The Group sold real estate receivables on a without recourse basis to partner mortgage banks, which include BPI Family Savings Bank, a related party, totaling to ₱3,136 million in 2018 and ₱7,711 million in 2017. These were sold at discount with total proceeds of ₱3,022 million and ₱7,321 million, respectively. The Group recognized loss on sale, under “Other Charges” amounting to ₱114 million and ₱391 million in 2018 and 2017, respectively.
Below is the aging analysis of receivables based on collectability.
Aging of Receivables
As of June 30, 2018 Up to 6 Over 6 mos. Over (in million pesos) months to One Year One Year Past Due Total
Trade Receivables ₱66,186 ₱10,188 ₱34,133 ₱4,532 ₱115,039 Non-trade Receivables 15,183 13,641 226 107 29,157
Total ₱81,369 ₱23,829 ₱34,359 ₱4,639 ₱144,196
8. Inventories Property acquired or being constructed for sale in the ordinary course of business, rather than to be held for rental or capital appreciation, is held as inventory and is measured at the lower of cost and net realizable value (NRV). NRV is the estimated selling price in the ordinary course of business based on market prices at the reporting date less estimated costs of completion and the estimated costs of sale.

18
9. Land and Improvements
On April 4, 2018, Ayala Land, Inc. (ALI) signed a Deed of Absolute Sale with Central Azucarera de Tarlac, Inc. for the acquisition of several parcels of land with an aggregate area of approximately 290 hectares located in Barangay Central, City of Tarlac, Province of Tarlac.
10. Investment in Associates and Joint Ventures
Details of the group’s investments in associates and joint ventures and the related percentages of ownership are shown below:
Percentages of Ownership Carrying Amounts
(in thousand pesos)
As of June 30
2018
As of Dec 31
2017
As of June 30
2018
As of Dec 31
2017
Joint Ventures:
Emerging City Holdings, Inc. (ECHI) 50% 50% 4,070,993 3,916,375 Berkshires Holdings, Inc. (BHI) 50% 50% 1,976,404 1,910,360 Cebu District Property Enterprise, Inc. (CDPEI) 35% 42% 1,468,361 1,476,052 Alveo-Federal Land Communities, Inc. 50% 50% 721,775 661,201 ALI-ETON Property Development Corporation 50% 50% 831,545 603,719 AyaGold Retailers, Inc. (AyaGold) 50% 50% 123,426 95,842 BYMCW, Inc. 30% 31% 55,500 51,000 SIAL Specialty Retailers, Inc. (SIAL Specialty) 50% 50% 24,462 26,462 SIAL CVS Retailers, Inc. - 50% - -
9,272,466 8,741,011
Associates:
OCLP Holdings, Inc. (OHI) 21% 21% 7,844,635 7,737,712 Modular Construction Technology Bhd (MCT) 0% 33% - 7,471,123 Bonifacio Land Corp. (BLC) 10% 10% 1,455,467 1,395,035 Rize-Ayalaland (Kingsway) GP, Inc. (Rize-Ayalaland) 49% 49% 1,072,362 673,769 Tianjin Eco-City Ayala Land Development Co., Ltd (Tianjin Eco-City)
40% 40% 467,828 464,977
Mercado General Hospital, Inc. (MGHI) 33% 33% 240,143 279,274 Lagoon Development Corporation 30% 30% 40,314 34,991 BIB Aurora Insurance Corp. 10% 10% 1,132 2,931
11,121,881 18,059,812
Total 20,394,347 26,800,823
Sial CVS Retailers, Inc. On Jan 11, 2018, SIAL CVS Retailers, Inc., FamilyMart Co., Ltd., and ITOCHU Corporation have concluded the transaction to sell 100% of the outstanding shares of Philippine FamilyMart CVS, Inc. (PFM) to P-H-O-E-N-I-X Petroleum Philippines, Inc. (PNX), further to a Memorandum of Agreement (MOA) entered into by the parties last October 30, 2017.
MCT BHd
On January 2, 2018, Ayala Land, Inc., (ALI) through its wholly-owned subsidiary, Regent Wise
Investments Limited (RWIL), signed a share purchase agreement to acquire an additional 17.24%
share in MCT Bhd (MCT), subject to completion of certain conditions.
On January 5, 2018, the transfer of shares was completed, increasing the Company’s shareholding in
MCT to 50.19% from 32.95%. RWIL also issued a notice of an unconditional mandatory take-over offer
to the Board of Directors of MCT, to acquire all remaining shares of the company that are not already
held by RWIL, following the completion of certain conditions to the share purchase agreement.

19
The mandatory take-over offer made in connection to the acquisition of additional shares in MCT closed
as of 5:00 p.m. (Malaysian time) 19 February 2018. 295,277,682 shares accepted the offer, equivalent
to 22.12% of MCT’s total outstanding shares. As a result of the offer, ALI’s shareholdings in MCT
increased from 50.19% to 72.31%.
On March 23, 2018, the Irredeemable Convertible Unsecured Loan Stock of Dato Sri Tong and Tan Sri
Barry Go, founders of MCT, were converted into 122,218,357 MCT shares. This resulted in a 6.07%
dilution of ALI’s stake in MCT as of date of share issuance. As such, current ownership stake of ALI in
MCT is 66.25%.
The Company considers a subsidiary with material NCI, an associate and a joint venture with material interest if its net assets exceed 5% of its total consolidated net assets as of the reporting period. There are no significant restrictions on the Company’s ability to use assets and settle liabilities of the Group. Financial information of the associates with material interest: OCLP Holdings, Inc. (OHI) OHI owns 99.5% interest in Ortigas & Company Limited Partnership (OCLP), an entity engaged in real estate development and leasing businesses. In 2016, ALI acquired a 21.1% stake in OHI consistent with its thrust of expanding its operations to other areas within and outside of Metro Manila through partnerships. The acquisition was made possible via the purchase of shares from existing OHI shareholders and this was recorded under “Investments in associates and joint ventures” account. Below is the summarized financial information for OHI:
(in thousand pesos) As of As of OCLP Holdings, Inc. June 30, 2018 Dec 31, 2017
Current assets 19,547,848 14,885,750 Noncurrent assets 12,057,435 11,733,438 Current liabilities 8,515,733 6,816,078 Noncurrent liabilities 17,087,443 14,350,692
Equity 6,002,107 5,452,418 Proportion of Group’s ownership 21.0% 21.1%
Group’s share in identifiable net assets 1,260,442 1,150,460 Carrying amount of the investment 7,844,635 7,737,712
Fair value adjustments 6,584,193 6,587,252
Negative Goodwill - 148,046
Dividends received - 34,865
Revenue 2,736,165 6,738,000 Cost and expenses 2,174,994 (5,283,000)
Net income (continuing operations) 561,171 1,455,000 Group’s share in net income for the year 117,846 305,550 Total comprehensive income 555,146 1,455,000 Group’s share in total comprehensive income for the year 116,581 305,550
Bonifacio Land Corporation (BLC) The Group has 10% interest in BLC, which is involved in the purchase, subscription or otherwise disposal of real and personal properties. Bonifacio Land Corp. is a private company incorporated on October 20, 1994 and there is no quoted market price available for its shares. Its registered office and principal place of business is Taguig, Philippines.

20
Below is the summarized financial information of BLC:
(in thousand pesos) As of As of Bonifacio Land Corporation June 30, 2018 Dec 31, 2017
Current assets 7,866,204 8,253,289 Noncurrent assets 37,296,196 37,357,443 Current liabilities 4,029,255 4,606,258 Noncurrent liabilities 6,462,318 7,332,631
Equity 34,670,826 33,671,843 Less: noncontrolling interest 15,772,914 15,324,979
Equity attributable to Parent Company 18,897,911 18,346,864 Proportion of Group’s ownership 10.1% 10.1%
Group’s share in identifiable net assets 1,908,689 1,853,033 Carrying amount of the investment 1,455,420 1,395,035
Negative Goodwill (453,269) (457,998)
Dividends received - 26,610
Revenue 2,320,953 6,207,544 Cost and expenses 1,236,386 (3,766,383)
Net income (continuing operations) 1,084,567 2,441,161 Net income attributable to minority interest 505,570 (1,119,548)
Net income attributable to parent 578,996 1,321,613 Group’s share in net income for the year 58,479 133,483 Total comprehensive income attributable to parent 578,996 1,321,613 Group’s share in total comprehensive income for the year 58,479 133,483
Aggregate financial information on associates with immaterial interest: Rize-Ayalaland, Tianjin Eco-City, LDC, MGHI and others
(in thousand pesos) As of As of Rize-Ayalaland, Tianjin Eco-City, LDC, MGHI, others June 30, 2018 Dec 31, 2017
Carrying amount 1,821,779 1,455,942 Share in net income (loss) from continuing operations (33,923) (75,995) Share in total comprehensive income (loss) (33,923) (75,995)
Emerging City Holdings, Inc. (ECHI) The Group has 50% interest in ECHI, which serves as The Group’s corporate vehicle in the acquisition of a controlling stake in Bonifacio Land Corp./ Fort Bonifacio Development Corp. (FBDC) through Columbus Holdings, Inc. in 2003. FBDC continues to sell commercial lots and condominium units and leases out retail and office spaces in Bonifacio Global City. Below is the summarized financial information of ECHI:
(in thousand pesos) As of As of Emerging City Holdings, Inc. June 30, 2018 Dec 31, 2017
Current assets 13,946,436 13,980,028 Noncurrent assets 31,583,377 30,806,231 Current liabilities 3,379,496 4,313,401 Noncurrent liabilities 7,470,272 7,396,186
Equity 34,680,045 33,076,672 Less: minority interest 25,340,189 23,833,518
Equity 9,339,855 9,243,154 Proportion of Group’s ownership 50.0% 50.0%
Group’s share in identifiable net assets 4,669,928 4,621,577 Carrying amount of the investment 4,070,993 3,916,375
Fair value adjustments 598,935 705,202
Dividends received - 350,000
Revenue 2,322,977 6,167,341 Cost and expenses 1,240,785 (3,806,627)

21
Net income (continuing operations) 1,082,192 2,360,714 Net income attributable to minority interest 797,705 (1,730,425)
Net income attributable to parent 284,487 630,829 Group’s share in net income for the year 142,243 315,145 Total comprehensive income attributable to parent 285,772 629,819 Group’s share in total comprehensive income for the year 142,886 314,910
BHI, CDPEI, Alveo-Federal, ALI-Eton, SIAL CVS, SIAL Specialty, AyaGold and BYMCW, Inc
(in thousand pesos) As of As of BHI, CDPEI, Alveo-Federal, ALI-Eton, SIAL CVS, SIAL Specialty, AyaGold and BYMCW, Inc
June 30 2018
Dec 31 2017
Carrying amount 5,201,473 4,824,636 Share in net income (loss) from continuing operations 112,788 (18,985) Share in total comprehensive income (loss) 112,788 (18,985)
11. Short-Term and Long-Term Debt The short-term debt of P11.75 billion and P17.6 billion as of June 30, 2018 and December 31, 2017, respectively, represents both peso and dollar denominated bank loans for March 2018 and peso-denominated bank loans. In compliance with BSP rules on directors, officers, stockholders and related interests, certain short-term and long-term debt with a carrying value of P12,135.8 million and P17,697.5 million as of June 30, 2018 and December 31, 2017 are secured by a real estate mortgages dated September 2, 2014 and March 14, 2016 covering both land and building of the Greenbelt Mall. Peso-denominated short-term loans had a weighted average cost of 3.31% and 2.64% per annum in June 30, 2018 and December 31, 2017, respectively.
Long-term debt consists of:
(in thousand pesos) June 30, 2018 December 31, 2017
Company: Bonds:
Due 2019 12,337,600 12,340,950 Due 2020 4,000,000 4,000,000 Due 2022 12,650,000 12,650,000 Due 2023 7,000,000 7,000,000 Due 2024 15,000,000 15,000,000 Due 2025 15,000,000 15,000,000 Due 2026 8,000,000 8,000,000 Due 2027 7,000,000 7,000,000 Due 2028 10,000,000 - Due 2033 2,000,000 2,000,000 Short-dated notes 7,400,000 7,100,000
Fixed Rate Corporate Notes (FXCNs) 5,795,000 9,064,000 PHP-denominated long-term loan 29,701,848 24,873,145 USD-denominated long-term loan 1,348,950 1,516,624
137,233,398 125,544,719
Subsidiaries:
Bonds Due 2021 P=5,000,000 P=5,0000,000 Bank Loans – Philippine Peso 25,368,281 23,578,229 FXCNs 3,231,250 3,275,000
33,599,531 31.853,229
170,832,929 157,397,948
Less: Unamortized Transaction Costs 535,530 656,542
170,297,399 156,741,406
Less: Current Portion 24,723,232 6,572,775
145,574,167 150,168,631

22
Company
Philippine Peso 10-year Bonds due 2028 On April 27, 2018, the company issued and listed on the Philippine Dealing & Exchange Corp. a P10,000.0 million bond due April 2028 with a coupon rate of 5.9203% p.a. for the initial five-year period of the ten-year term of the bond. The coupon rate will reprice on April 27, 2023, the fifth anniversary of the Issue Date, at the higher of (a) 5.9203% or (b) the prevailing 5-year benchmark plus 75 bps which shall apply to all interest payments thereafter. The Bond was assigned an issue credit rating of PRS AAA, with a Stable Outlook, by Philratings, the highest investment grade indicating minimal credit risk. The issuance is the fifth tranche of the Fixed Rate Bond series of the Company’s P50,000.0 million Debt Securities Program as approved by the Securities and Exchange Commission (SEC) in March 2016. Philippine Peso 15-month Notes due 2019 In November 2017, the Company issued and listed on the Philippine Dealing & Exchange Corp. a P=3,100.0 million Corporate Note. This Note issue is the second SEC-registration exempt transaction of the Company under Section 10.1(I) of the Securities Regulation Code (SRC) and in reliance upon Sections 10.1.3 and 10.1.4 of the Implementing Rules and Regulations of the SRC. Similar to the Company’s prior Notes issuance in July, these Notes were offered exclusively to Qualified Institutional Buyers as defined under 10.1(l) of the SRC. The Notes bear a fixed interest rate of 3.25% p.a. and will mature in on February 2019. Philippine Peso 21-month Note due 2019 In July 2017, the Company issued and listed on the Philippine Dealing & Exchange Corp. a P=4,300.0 million Corporate Note. This Note issue is an SEC-registration exempt transaction under Section 10.1(l) of the Securities Regulation Code (SRC) and Section 10.1.3 of the 2015 Implementing Rules and Regulations of the SRC. Thus, the Note was offered on a limited basis to juridical persons or entities who, at the point of offer or sale, were Qualified Buyers. The Notes bear a fixed interest rate of 2.75% p.a. The Corporate Notes will mature in April 2019. Philippine Peso Homestarter Bond due 2019 In October 2016, the Company issued at an aggregate principal amount of P=3,000.0 million of bonds representing the first tranche of the Homestarter Bond series registered under the Company’s P=50 Billion Debt Securities Program as approved by the SEC in March 2016. The bonds have a term of three (3) years from the issue date, and bear interest on its principal amount at a fixed rate of 3.00% p.a. Interest is payable semi-annually or on the date of effectivity of an Early Downpayment Application, as may be applicable, less the amount of any applicable withholding taxes. The bond was the first Homestarter Bond listed on the PDEx. Philippine Peso 7-Year and 10-year Bonds due 2019 and 2022 In April 2012, the Company issued a total of P=15,000.0 million bonds, broken down into a P=9,350.0 million bond due 2019 at a fixed rate equivalent to 5.625% p.a. and a P=5,650.0 million bond due 2022 at a fixed rate equivalent to 6.000% p.a. The Philippine Rating Services Corporation (“PhilRatings”) assigned a PRS AAA rating on the bonds indicating that it has the smallest degree of investment risk. Interest payments are protected by a large or by an exceptionally stable margin and principal is assured. While the various protective elements are likely to change, such changes as can be visualized are most unlikely to impair the fundamentally strong position of such issues. PRS AAA is the highest credit rating possible on PhilRatings’ rating scales for long-term issuances.
Philippine Peso 7-Year and 20-year Bonds due 2020 and 2033 In October 2013, the Company issued a total of P=6,000.0 million bonds, broken down into a P=4,000.0 million bond due 2020 at a fixed rate equivalent to 4.625% p.a. and a P=2,000.0 million bond due 2033 at a fixed rate equivalent to 6.000% p.a. CRISP assigned a "AAA" rating on the bonds indicating that it has a minimal credit risk owing to the Company’s capacity to repay its debt obligations. AAA is the highest rating assigned by CRISP.

23
Philippine Peso 10-year Note due 2022 In December 2012, the Company executed a P=5,000.0 million committed Corporate Note facility with a local bank, of which an initial P=3,500.0 million was drawn in 2012. The balance of P=1,500.0 million was subsequently drawn in January 2013. Notes currently bear a fixed interest rate of 4.50%. The Corporate Notes will mature on the third month succeeding the tenth anniversary of the initial drawdown date.
Philippine Peso 7.0 Billion Fixed Rate Bonds due 2022 In April 2015, the Company issued a total of P=7,000.0 million bonds due 2022 at a fixed rate equivalent to 4.5% p.a. The Bonds have been rated PRS Aaa by PhilRatings, indicating that obligor’s capacity to meet its financial commitment on the obligation is extremely strong. Philippine Peso 7-year Fixed Rate Bonds due 2023 In October 2016, the Company issued a total of P=7,000.0 million bonds due 2023 at a fixed rate equivalent to 3.8915% p.a. The Bonds have been rated PRS Aaa by PhilRatings, indicating that obligor’s capacity to meet its financial commitment on the obligation is extremely strong. The bond issue is the third tranche of the Fixed Rate Bond series registered under the Company’s P=50 Billion Debt Securities Program as approved by the SEC in March 2016. Philippine Peso 10-year and 6-month Bonds due 2024 In July 2013, the company issued a total of P=15,000.0 million bonds due 2024 at a fixed rate equivalent to 5.0% p.a. Credit Rating and Investors Services Philippines, Inc. (CRISP) assigned a "AAA" on the bonds indicating that it has a minimal credit risk owing to the Company’s capacity to repay its debt obligations. AAA is the highest rating assigned by CRISP. Philippine Peso 8.0 Billion Fixed Rate Bonds due 2025 In April 2014, the Company issued a total of P=8,000.0 million bonds due 2025 at a fixed rate equivalent to 5.625% p.a. The Bonds have been rated PRS Aaa by PhilRatings, indicating that obligor’s capacity to meet its financial commitment on the obligation is extremely strong.
Philippine Peso 9.5-year Fixed Rate Bonds due 2025 In April 2016, the Company issued a total of P=7,000.0 million bonds due 2025 at a fixed rate equivalent to 4.75% p.a. The Bonds have been rated PRS Aaa by PhilRatings, indicating that obligor’s capacity to meet its financial commitment on the obligation is extremely strong. The bond issue is the second tranche of the Fixed Rate Bond series registered under the Company’s P=50 Billion Debt Securities Program as approved by the SEC in March 2016.
Philippine Peso 10-year Fixed Rate Bonds due 2026 In March 2016, a registration statement filed by the Company covering the P=50 Billion Debt Securities Program was rendered effective by the SEC. Under which, the Company issued the first tranche of Fixed Rate Bond series amounting to P=8,000.0 million due 2026 at a rate equivalent to 4.85% p.a. The Bonds have been rated PRS Aaa by PhilRatings, indicating that obligor’s capacity to meet its financial commitment on the obligation is extremely strong.
Philippine Peso 10-year Fixed Rate Bonds due 2027 In May 2017, the Company issued a total of P=7,000.0 million bonds due 2027 at a fixed rate equivalent to 5.2624% p.a. The Bonds have been rated PRS Aaa by PhilRatings, which is considered the highest quality with minimal credit risk. The bond issue is the fourth tranche of the Fixed Rate Bond series registered under the Company’s P=50 Billion Debt Securities Program as approved by the SEC in March 2016.
Philippine Peso 5-, 10-, 15-Year FXCN due on 2016, 2021 and 2026 In January 2011, the Company issued P=10,000.0 billion FXCNs to various financial institutions and retail investors. The notes will mature on various dates up to 2026. The FXCNs bear fixed interest rates ranging from 5.62% to 7.50% p.a. depending on the term of the notes. The Company prepaid P=

24
1.95 billion of notes due in 2016 on January 19, 2013. In 2014, the Company paid P=50.8 million for the matured portion of the loan.
US Dollar-denominated Long-term Loan In October 2012, the Company executed and had fully withdrawn a US$58.5 million long-term facility. The loan bears a floating interest rate based on a credit spread over the three-month US Dollar London Interbank Offered Rate (LIBOR), repriceable quarterly. The loan will mature on the third month succeeding the tenth anniversary of the initial drawdown date. In January 2014 and October 2015, the Company made partial prepayments on the loan in the amount of US$5.75 million and US$12.785 million, respectively. In March 2016, a total of US$25.0 million in principal were prepaid.
Peso-denominated Long-term Loans In August to September 2015, the Company assumed an aggregate of P=15,442.3 million various long-term facilities of some Subsidiaries from various banks. The loans bear fixed interest rates ranging from 4.5% to 4.725% p.a. and terms ranging from 4.4 years to 10.5 years. In March 2016, the Company additionally assumed from ALI Makati Hotel Property, Inc. US$30.0 million in long-term loans from the Bank of the Philippine Islands. The loan bears a floating interest rate based on a credit spread over the three-month US Dollar London Interbank Offered Rate (LIBOR) and is repriceable quarterly. In March 2017, the Company executed a P=10,000.0 billion long-term facility and had an initial drawdown of P=5,000.0 billion. The loan has a fixed interest rate of 4.949% for 10 years inclusive of Gross Receipt Tax (GRT). The balance of P=5,000.0 billion was drawn in April 2017. Subsidiaries The subsidiaries’ loans will mature on various dates up to 2023. Peso-denominated loans bear various floating interest rates at 60 bps to 80 bps spread over the benchmark 91-day PDST-R1/R2 or and fixed interest rates ranging from 3.8869% to 5.5282% p.a. Certain loans which are subject to floating interest rates are subject to floor floating interest rates equivalent to 95% or par of the Overnight Reverse Repurchase Agreement Rate of the Bangko Sentral ng Pilipinas (BSP Overnight Rate) or at the BSP Overnight Rate plus a spread of 20 bps to 75 bps p.a. In compliance with BSP ruling on directors, officers, stockholders and related interests, certain credit facilities with a total carrying value of P=9,849.5 million and P=11,746.9 million as of June 30, 2018 and December 31, 2017, respectively, are secured by a real estate mortgage dated September 2, 2014 covering certain properties of the Company. Philippine Peso 5.0 Billion Fixed Rate Bonds due 2021 In September 2014, Cebu Holdings, Inc. issued a total of P=5,000.0 million bonds due 2021 at a fixed rate equivalent to 5.32% p.a. The Bonds have been rated PRS Aaa by PhilRatings, indicating that obligor’s capacity to meet its financial commitment on the obligation is extremely strong.
The loan agreements contain some or all of the following restrictions: material changes in nature of business; maintenance of debt-to-equity ratio; payment of dividends and additional loans maturing beyond a year which will result in a violation of the required debt-to-equity ratios; merger or consolidation where the Company/subsidiary is not the surviving corporation; guarantees or advances; encumbrance for borrowed money; and sale of substantially all assets. These restrictions and requirements were complied with by the Group as of June 30, 2018 and December 31, 2017.

25
12. Accounts and Other Payables The accounts and other payables as of June 30, 2018 is broken down as follows:
Accounts and other payables (in million pesos)
As of June 30, 2018
As of December 31, 2017
Accounts payable 68,761 76,977 Taxes payable 17,794 19,336 Accrued project costs 19,652 15,947 Accrued salaries & employee benefits 5,198 5,485 Accrued professional & management fees 6,937 3,994 Liability for purchased land 6,201 3,710 Accrued utilities 2,791 2,299 Interest payable 2,465 1,908 Accrued repairs and maintenance 2,045 1,765 Accrued rentals 1,289 1,567 Accrued advertising and promotions 1,227 1,076 Payable to related parties 659 640 Dividends payable 411 360 Retention payable 531 335 DRP obligation - 230 Other accrued expenses 4,187 2,055
Total ₱140,148 ₱137,684
Below is the aging analysis of payables.
Aging of Payables
As of June 30, 2018 Up to 6 Over 6 mos. Over (in million pesos) months to One Year One Year Past Due Total
Trade Payables ₱44,696 ₱8,092 ₱36,964 - ₱89,752 Non-trade Payables 67,627 36,082 16,803 - 120,512
Total ₱112,323 ₱44,174 ₱53,767 - ₱210,264
13. Equity
Declaration of Cash Dividends
On February 20, 2018, the Board of Directors during its meeting approved the declaration the
declaration of cash dividends of P0.252 per outstanding common share. This first half regular cash
dividends, together with the planned second semester cash dividends, will bring our annual dividend
payout ratio to 29% of prior year’s earnings. The cash dividend was paid on April 3, 2018 to stockholders
of common shares as of record date March 12, 2018. The declaration of the annual cash dividends of
4.74786% per annum or P0.00474786 per share to all shareholders of the Company’s unlisted voting
preferred shares. The payment date was made on June 29, 2018 to stockholders of said preferred
shares on record as of June 18, 2018.
Employee Stock Ownership Plan
On February 20, 2018, the Board of Directors approved the grant to qualified executives, stock options
pursuant to the company’s Employee Stock Ownership Plan (the “Plan”), covering up to 13,677,052
common shares at a subscription price of P45.07 per share equivalent to the average closing price of
ALI common shares at the Philippine Stock Exchange for 30 consecutive trading days ending February
5, 2018.
26
On July 23, 2018, 125 stock option grantees subscribed to 8,316,310 common shares at P45.07 per
share and became effective on the same day. As a result of the subscription of the 125 stock option
grantees, the number of ALI outstanding common shares increased to 14,734,881,081.
MCT BHd
On January 2, 2018, Ayala Land, Inc., (ALI) through its wholly-owned subsidiary, Regent Wise
Investments Limited (RWIL), signed a share purchase agreement to acquire an additional 17.24%
share in MCT Bhd (MCT), subject to completion of certain conditions.
On January 5, 2018, the transfer of shares was completed, increasing the Company’s shareholding in
MCT to 50.19% from 32.95%. RWIL also issued a notice of an unconditional mandatory take-over offer
to the Board of Directors of MCT, to acquire all remaining shares of the company that are not already
held by RWIL, following the completion of certain conditions to the share purchase agreement.
The mandatory take-over offer made in connection to the acquisition of additional shares in MCT closed
as of 5:00 p.m. (Malaysian time) 19 February 2018. 295,277,682 shares accepted the offer, equivalent
to 22.12% of MCT’s total outstanding shares. As a result of the offer, ALI’s shareholdings in MCT
increased from 50.19% to 72.31%.
On March 23, 2018, the Irredeemable Convertible Unsecured Loan Stock of Dato Sri Tong and Tan Sri
Barry Go, founders of MCT, were converted into 122,218,357 MCT shares. This resulted in a 6.07%
dilution of ALI’s stake in MCT as of date of share issuance. As such, current ownership stake of ALI in
MCT is 66.25%.
Cebu Holdings, Inc.
In May 2018, ALI acquired an additional 46,791,400 shares of Cebu Holdings, Inc. (CHI), amounting to
₱275.8 million. This increased ALI’s ownership in CHI to 74.40%.
In June 2018, ALI acquired an additional 12,839,800 shares of CHI amounting to P75.8 million, which
increased ALI’s effective ownership in CHI to 75.07%.
Prime Orion Philippines, Inc.
On January 24, 2018, ALI acquired an additional 202,774,547 shares of Prime Orion Philippines, Inc.
(POPI) amounting to ₱497.7 million. This transaction increased ALI’s effective ownership in POPI to
61.29%.
On April 30, 2018, ALI and POPI executed a Deed of Exchange where ALI will subscribe to
1,225,370,620 common shares of POPI for an aggregate subscription price of P3,030,750,000.00 in
exchange for 30,186 common shares of Laguna Technopark, Inc. (LTI). The subscription and exchange
shall be subject to and deemed effective only upon the issuance by the Securities and Exchange
Commission of the confirmation of valuation of the shares. This transaction increased ALI’s effective
ownership in POPI to 69.83%

27
The movements within Equity Reserves are as follows:
Consideration paid
Carrying value of Non-
Controlling interests
Difference recognized
within Equity
3.11% in CHI 352,760 255,878 96,882
4.14% in POPI 497,652 315,951 181,701
850,412 571,829 278,583
Inclusion of MCT Equity Reserve 12,868,219
Inclusion of ALI & POPI-LTI share swap (663,838)
TOTAL 12,482,964
14. Business Combinations and Acquisition of Non-Controlling Interests
On April 30, 2018, ALI and POPI executed a Deed of Exchange where ALI will subscribe to
1,225,370,620 common shares of POPI for an aggregate subscription price of P3,030,750,000.00 in
exchange for 30,186 common shares of Laguna Technopark, Inc. (LTI). The subscription and exchange
shall be subject to and deemed effective only upon the issuance by the Securities and Exchange
Commission of the confirmation of valuation of the shares. This transaction increased ALI’s effective
ownership in POPI to 69.83%.
15. Related Party Transactions
Parties are considered to be related if one party has the ability, directly or indirectly, to control the other party or exercise significant influence over the other party in making financial and operating decisions. Parties are also considered to be related if they are subject to common control or common significant influence which include affiliates. Terms and Conditions of Transactions with Related Parties In its regular conduct of business, the Group has entered into transactions with associates and other related parties principally consisting of advances and reimbursement of expenses, purchase and sale of real estate properties, construction contracts, development, management, underwriting, marketing, leasing and administrative service agreements. Transactions with related parties are made at normal market prices. There have been no guarantees provided or received for any related party receivables or payables. The Group does not provide any allowance relating to receivable from related parties. This assessment is undertaken each financial year through examining the financial position of the related parties and the markets in which the related parties operate.

28
The following provide the total amount of transactions that have been entered into with related party for the relevant financial year:
a. Transactions with BPI, an associate of AC
As of June 30, 2018, and December 31, 2017, the Group maintains current and savings account, money market placements and short/long-term debt payable with BPI broken down as follows:
June 30, 2018 December 31, 2017 (in million pesos) Unaudited Audited
Cash in bank ₱4,879 ₱3,887 Cash equivalents 4,415 4,363 Investment in FVPL 144 83 Short-term debt 1,160 5,405 Long-term debt 11,551 12,292
b. Outstanding balances from/to related parties
Receivables from Related Parties Payables to Related Parties
In million pesos June 2018 December 2017 June 2018 December 2017
Parent Company ₱136 ₱101 ₱73 ₱73
Associates 4,752 1,155 235 222
Other related parties: Globe Telecom 129 126 4 4 BPI 31 123 44 44 Columbus - - 267 267 Others 1,257 229 36 30
1,417 478 351 345
Total ₱6,305 ₱1,734 ₱659 ₱640
c. Revenues and expenses from/to related parties Revenues from Related Parties Expenses to Related Parties
In million pesos June 2018 June 2017 June 2018 June 2017
Parent Company ₱22 ₱4 ₱7 ₱4
Associates 1,160 214 103 63
Other related parties: AG Counsellors Corp. - - 39 91 Bank of the Philippine Islands 115 90 265 107 Globe Telecom, Inc. 28 57 23 22 Psi Technologies - 62 - - Panay Medical Ventures Inc. - - - - Manila Water Company, Inc. 1 1 124 106 Laguna AAA Waterworks Corp 1 1 3 3 Michigan Holdings, Inc. - - - - Manila Water Philippine Ventures, Inc. 15 - 34 9 Innove Communications - - 20 22 Others - - 90 24
160 ₱211 ₱598 ₱384
Total ₱1,342 ₱429 ₱708 ₱451

29
16. Financial Risk Management Objectives and Policies The Group’s principal financial instruments comprise of cash and cash equivalents, short-term investment, financial assets at FVPL, AFS quoted and unquoted equity securities, investments in bonds, bank loans, corporate notes and bonds. The financial debt instruments were issued primarily to raise financing for the Group’s operations. The Group has various financial assets such as trade receivables and trade payables which arise directly from the conduct of its operations. Exposure to liquidity, credit, interest rate, currency and equity risks arise in the normal course of the Group’s business activities. The main objectives of the Group’s financial risk management are as follows:
• to identify and monitor such risks on an ongoing basis;
• to minimize and mitigate such risks; and
• to provide a degree of certainty about costs. The use of derivative financial instruments, if any, is solely for management of the Group’s financial risk exposures. It is the Group’s policy not to enter into derivative transactions for speculative purposes. The Group’s financing and treasury function operates as a centralized service for managing financial risks and activities as well as providing optimum investment yield and cost-efficient funding for the Group. There were no changes in the Group’s financial risk management objectives and policies as of June 30, 2018. Liquidity risk Liquidity risk is defined by the Group as the risk of losses arising from funding difficulties due to deterioration in market conditions and/or the financial position of the Group that make it difficult for the Group to raise the necessary funds or that forces the Group to raise funds at significantly higher interest rates than usual. This is also the possibility of experiencing losses due to the inability to sell or convert marketable securities into cash immediately or in instances where conversion to cash is possible but at loss due to wider than normal bid-offer spreads. The Group employs scenario analysis and contingency planning to actively manage its liquidity position and guarantee that all operating, investing and financing needs are met. The Group has come up with a three-layered approach to liquidity through the prudent management of sufficient cash and cash equivalents, the potential sale of accounts receivables and the maintenance of short-term revolving credit facilities. Cash and cash equivalents are maintained at a level that will enable it to fund its general and administrative expenses as well as to have additional funds as buffer for any opportunities or emergencies that may arise. Management develops viable funding alternatives through a continuous program for the sale of its receivables and ensures the availability of ample unused short-term revolving credit facilities from both local and foreign banks as back-up liquidity. The Group ascertains that its cash is invested in short-term bank placements and special deposit accounts, as well as in high-quality and marketable government and corporate securities.

30
Credit risk The Group’s credit risks are primarily attributable to installments receivable, rental receivables and other financial assets. To manage credit risks, the Group maintains defined credit policies and monitors its exposure to credit risks on a continuous basis. In respect of installments receivable from the sale of properties, credit risk is managed primarily through credit reviews and an analysis of receivables on a continuous basis. The Group also undertakes supplemental credit review procedures for certain installment payment structures. The Group’s stringent customer requirements and policies in place contribute to lower customer default than its competitors. Customer payments are facilitated through various collection modes including the use of postdated checks and auto-debit arrangements. Exposure to bad debts is not significant as title to real estate properties are not transferred to the buyers until full payment has been made and the requirement for remedial procedures is minimal given the profile of buyers. Credit risk arising from rental income from leasing properties is primarily managed through a tenant selection process. Prospective tenants are evaluated on the basis of payment track record and other credit information. In accordance with the provisions of the lease contracts, the lessees are required to deposit with the Group security deposits and advance rentals which helps reduce the Group’s credit risk exposure in case of defaults by the tenants. For existing tenants, the Group has put in place a monitoring and follow-up system. Receivables are aged and analyzed on a continuous basis to minimize credit risk associated with these receivables. Regular meetings with tenants are also undertaken to provide opportunities for counseling and further assessment of paying capacity. Other financial assets are comprised of cash and cash equivalents excluding cash on hand, short-term investments, financial assets at FVPL and AFS financial assets. The Group adheres to fixed limits and guidelines in its dealings with counterparty banks and its investment in financial instruments. Bank limits are established on the basis of an internal rating system that principally covers the areas of liquidity, capital adequacy and financial stability. The rating system likewise makes use of available international credit ratings. Given the high credit standing of its accredited counterparty banks, management does not expect any of these financial institutions to fail in meeting their obligations. Nevertheless, the Group closely monitors developments over counterparty banks and adjusts its exposure accordingly while adhering to pre-set limits. Interest rate risk The Group’s interest rate risk management policy centers on reducing the overall interest expense and exposure to changes in interest rates. Changes in market interest rates relate primarily to the Group’s interest-bearing debt obligations with floating interest rate as it can cause a change in the amount of interest payments. The Group manages its interest rate risk by leveraging on its premier credit rating and increasing the fixed interest component of its debt portfolio. Foreign currency risk Financial assets and credit facilities of the Group, as well as major contracts entered into for the purchase of raw materials, are mainly denominated in Philippine Peso. The Group’s placements in foreign currencies is more than the amount of foreign currency-denominated debt.

31
Equity price risk Quoted AFS financial assets are acquired at a certain price in the market. Such investment securities are subject to price risk due to changes in market values of instruments arising either from factors specific to individual instruments or their issuers or factors affecting all instruments traded in the market. Depending on several factors such as interest rate movements, country’s economic performance, political stability, domestic inflation rates, these prices change, reflecting how market participants view the developments. Fair Value Information The following tables set forth the carrying values and estimated fair values of the Groups financial assets and liabilities recognized as of June 30, 2018 and December 31, 2017. The methods and assumptions used by the Group is estimating the fair value of the financial instruments are as follows:
Cash & Cash equivalents, short term investments and current receivables, accounts and other payables, current payables and short-term debt- Carrying amounts approximate fair values due to relatively short-term maturities of these financial instruments. Financial assets at FVPL- UITF - These are investments in fund. Fair value is based on the net asset value as of reporting dates. Noncurrent accounts and notes receivables- The fair values of residential accounts and notes receivable from employees, are based on the discounted value of future cash flow using the applicable rates for similar types of instruments. The discount rates used ranged from 3.28% to 7.24% and 4.53% to 7.20% as of June 30, 2018 and December 31, 2017. AFS quoted equity securities- Fair values are based on the quoted prices published in markets. AFS unquoted equity securities - These are carried at cost less allowance for impairment losses because fair values cannot be measured reliably due to lack of reliable estimates of future cash flows and discount rates necessary to calculate the fair value. Liabilities - the fair value of noncurrent unquoted instruments (long term debt and deposits) are estimated using the discounted cash flow methodology using the Group's current incremental borrowing rates for similar borrowings with maturities consistent with those remaining for the liability being valued. The discount rates used ranged from 2.43% to 5.69% and 3.89% to 5.25% as of June 30, 2018 and December 31, 2017, respectively. The fair value of non-current unquoted debt instruments with floating rates as estimated using the discounted cash flow- last pricing method.
17. Fair Value Hierarchy The group uses the following hierarchy for determining and disclosing the fair value of the financial instruments by valuation technique: Level 1. Quoted (unadjusted prices) in actives markets for identical assets and liabilities Level 2. Other techniques for which all inputs which have significant effect of the recorded fair value are observable, either directly or indirectly. Level 3. Techniques which use inputs which have significant effect on the recorded fair value that are not based on observable market data.

32
The company categorizes trade receivable, investment in bonds classified as loans and receivables, receivables from employees, long term debt and deposits and other non-current liabilities under level 3. The fair value of these financial instruments is determined by discounting future cash flows using the applicable rates of similar types of instruments plus a certain spread. This spread is the un-observable input and the effect of changes to this is that the higher spread, the lower the fair value. There have been no reclassifications from level 1 to Level 2 categories in June 30, 2018 and December 31, 2017.
June 30, 2018 December 31, 2017
(in millions) Carrying Value Fair Value Carrying Value Fair Value
Financial Asset at FVPL 565 565 541 541 Available-for-Sale Financial Assets
Unquoted equity securities 284 284 524 524 Quoted equity securities 865 865 951 951
Total ₱1,714 ₱1,714 ₱2,016 ₱2,016
Loans and Receivables
Trade residential and office development 82,556 83,876 89,198 89,356 Receivables from employees 970 970 832 832
Total ₱83,526 ₱84,846 ₱90,030 ₱90,188
Other Financial Liabilities
Long-term debt 170,297 170,648 156,741 149,527 Deposits and other noncurrent liabilities 27,983 27,940 21,710 17,937
Total ₱198,281 ₱198,588 ₱178,451 ₱167,464
The following table provides the fair value hierarchy of the Group’s financial assets which are measured at fair value as of June 30, 2018 and December 31, 2017:
(in millions)
Quoted prices in
Active markets
Significant observable
inputs
Significant observable
inputs June 30, 2018 Date of valuation Total (Level 1) (Level 2) (Level 3)
Financial assets as fair value through profit and loss
Investment in Unit Investment Trust Fund Jun 30, 2018 ₱119 - ₱119 - Investment in Arch Capital Fund Jun 30, 2018 446 - - 446
₱565 - ₱119 ₱446 Available for sale financial assets
Quoted Jun 30, 2018 ₱865 ₱865 - - Unquoted Jun 30, 2018 284 - - 284
1,149 865 - 284
Total ₱1,714 ₱865 ₱119 ₱730
(in millions)
Quoted prices in
Active markets
Significant observable
inputs
Significant observable
inputs December 31, 2017 Date of valuation Total (Level 1) (Level 2) (Level 3)
Financial assets as fair value through profit and loss
Investment in Unit Investment Trust Fund Dec 31, 2017 ₱83 - ₱83 - Investment in Arch Capital Fund Dec 31, 2017 458 - - 458
₱541 - ₱83 ₱458 Available for sale financial assets
Quoted Dec 31, 2017 ₱951 ₱951 - - Unquoted Dec 31, 2017 524
- 524
1,475 951 - 524
Total ₱2,016 ₱951 ₱83 ₱982
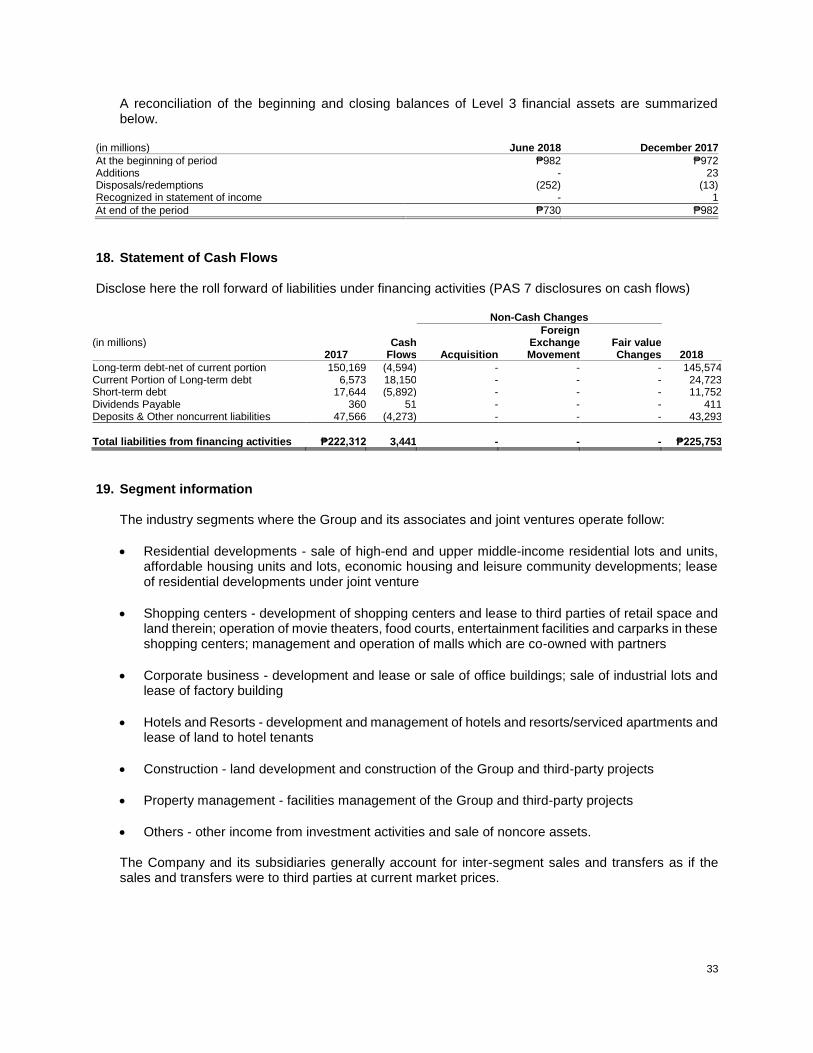
33
A reconciliation of the beginning and closing balances of Level 3 financial assets are summarized below.
(in millions) June 2018 December 2017
At the beginning of period ₱982 ₱972 Additions - 23 Disposals/redemptions (252) (13) Recognized in statement of income - 1
At end of the period ₱730 ₱982
18. Statement of Cash Flows
Disclose here the roll forward of liabilities under financing activities (PAS 7 disclosures on cash flows)
Non-Cash Changes
(in millions) Cash Foreign
Exchange Fair value 2017 Flows Acquisition Movement Changes 2018
Long-term debt-net of current portion 150,169 (4,594) - - - 145,574 Current Portion of Long-term debt 6,573 18,150 - - - 24,723 Short-term debt 17,644 (5,892) - - - 11,752 Dividends Payable 360 51 - - - 411 Deposits & Other noncurrent liabilities 47,566 (4,273) - - - 43,293
Total liabilities from financing activities ₱222,312 3,441
-
- - ₱225,753
19. Segment information
The industry segments where the Group and its associates and joint ventures operate follow:
• Residential developments - sale of high-end and upper middle-income residential lots and units, affordable housing units and lots, economic housing and leisure community developments; lease of residential developments under joint venture
• Shopping centers - development of shopping centers and lease to third parties of retail space and land therein; operation of movie theaters, food courts, entertainment facilities and carparks in these shopping centers; management and operation of malls which are co-owned with partners
• Corporate business - development and lease or sale of office buildings; sale of industrial lots and lease of factory building
• Hotels and Resorts - development and management of hotels and resorts/serviced apartments and lease of land to hotel tenants
• Construction - land development and construction of the Group and third-party projects
• Property management - facilities management of the Group and third-party projects
• Others - other income from investment activities and sale of noncore assets.
The Company and its subsidiaries generally account for inter-segment sales and transfers as if the sales and transfers were to third parties at current market prices.

34
YTD June 2018
Shopping
Centers
Corporate
Businesses
Residential
Development MCT Construction
Hotels and
Resorts
Property
Management
and Others Corporate
Intersegment
Adjustment Consolidated
(in million pesos)
Revenues
Sales to external customers 9,256 3,648 51,617 4,038 1,203 3,929 2,150 - - 75,841
Intersegment sales - 66 - - 33,403 - - - (33,469) -
Equity in net earnings of Investees 8 - 325 - - - - 77 - 410
Total Revenues 9,264 3,714 51,942 4,038 34,606 3,929 2,150 77 (36,044) 76,251
Operating Expenses 5,945 1,307 40,714 3,335 32,454 3,172 2,154 826 (36,449) 53,458
Operating Profit 3,319 2,407 11,228 703 2,152 757 (4) (749) 405 22,793
Interest income - - - - - - - - - 3,077
Interest expense - - - - - - - - - (4,620)
Other income (expense) - - - - - - - - - 1,062
Other charges - - - - - - - - - (685)
Provision for income tax - - - - - - - - - (5,804)
Net Income - - - - - - - - - 15,823
Net Income attributable to:
Equity holders of Ayala Land, Inc. - - - - - - - - - 13,538
Minority interests - - - - - - - - - 2,285
15,823
Other information
Segment assets 155,322 130,046 451,818 19,327 53,807 49,644 7,062 4,577 (303,946) 567,657
Investment in associates and jointly
controlled entities 7,886 - 12,065 - 55 148 - 240 - 20,394
Deferred tax assets 340 157 2,367 - 39 343 41 2,758 - 6,045
Total assets 163,548 130,203 466,250 19,327 53,901 50,135 7,103 7,575 (303,946) 594,096
Segment liabilities 117,947 69,732 179,040 8,041 46,078 39,527 3,547 34,433 (108,024) 390,321
Deferred tax liabilities 371 83 1,461 - 8 10 12 47 - 1,992
Total liabilities 118,318 69,815 180,501 8,041 46,086 39,537 3,599 34,480 (108,204) 392,313
Segment additions to
Property & Equipment 312 8 126 2,501 305 767 19 513 - 4,551
Investment properties 9,529 2,934 85 5,813 208 1,594 - - - 20,163
Depreciation and amortization 750 406 639 89 724 379 83 564 - 3,634
YTD June 2017
Shopping
Centers
Corporate
Businesses
Residential
Development MCT Construction
Hotels and
Resorts
Property
Management
and Others Corporate
Intersegment
Adjustmemt Consolidated
(in million pesos)
Revenues
Sales to external customers 8,245 3,001 43,735 - 871 3,399 1,733 - - 60,984
Intersegment sales - 90 - - 31,124 - 193 - (31,407) -
Equity in net earnings of Investees 83 - 256 - - - - 22 - 361
Total Revenues 8,328 3,091 43,991 - 31,995 3,399 1,926 22 (31,407) 61,345
Operating Expenses 4,615 1,025 35,737 - 29,760 2,556 1,917 427 (33,226) 42,811
Operating Profit 3,713 2,066 8,254 - 2,235 843 9 (405) 1,819 18,534
Interest income - - - - - - - - - 2,958
Interest expense - - - - - - - - - (3,881)
Other income (expense) - - - - - - - - - 688
Other charges - - - - - - - - - (417)
Provision for income tax - - - - - - - - - (4,552)
Net Income - - - - - - - - - 13,330
Net Income attributable to:
Equity holders of Ayala Land, Inc. - - - - - - - - - 11,512
Minority interests - - - - - - - - - 1,818
13,330
Other information
Segment assets 142,197 73,947 371,425 - 47,945 48,121 7,429 89,455 (269,717) 510,802
Investment in associates and jointly
controlled entities 7,609 210 9,683 - - - - 7,994 - 25,496
Deferred tax assets 422 102 2,379 - 38 398 27 2,124 4,607 10,097
Total assets 150,228 74,259 383,487 - 47,983 48,519 7,456 99,573 (265,110) 546,395
Segment liabilities 119,691 56,011 187,510 - 41,030 36,050 4,036 21,723 (105,438) 360,613
Deferred tax liabilities 227 24 2,513 - - 39 16 12 1,612 4,443
Total liabilities 119,918 56,035 190,023 - 41,030 36,089 4,052 21,735 (103,826) 365,054
Segment additions to
Property & Equipment 148 3 56 - 499 2,635 9 1 - 3,603
Investment properties 6,151 5,377 37 - 138 807 - 3 - 13,485
Depreciation and amortization 864 361 118 - 765 312 87 307 - 3,167

35
20. Commitments On February 20, 2018, the PCC approved the setting up of a joint venture between the Company and Royal Asia Land, Inc. to acquire, own, and develop a 936-hectare commercial and residential project in Silang and Carmona, Cavite. Both firms will own 50% equity in the joint venture vehicle while Royal Asia Land will receive a consultation fee of 2% of the joint venture firm's gross revenue for its participation in the planning and development of the property. ALI, meanwhile, will develop and market the project and receive a management fee of 12% and sales and marketing fee of 5% of the gross revenue. The PCC has deemed that the transaction does not result in a substantial lessening of competition because it will not have a structural effect on the market. On March 23, 2018, the Executive Committee of Ayala Land, Inc. (ALI) has approved the exchange of ALI’s 75% equity interest in Laguna Technopark, Inc. (LTI) into additional shares of stock in Prime Orion Philippines, Inc. (POPI). The value of the transaction is P3.0B where POPI will issue 1,225,370,620 common shares to ALI in exchange for 30,186 LTI common shares and bring ALI’s direct ownership in POPI to 63.90%. On April 30, 2018, ALI and POPI executed a Deed of Exchange where ALI will subscribe to 1,225,370,620
common shares of POPI for an aggregate subscription price of P3,030,750,000.00 in exchange for 30,186
common shares of Laguna Technopark, Inc. (LTI). The subscription and exchange shall be subject to and
deemed effective only upon the issuance by the Securities and Exchange Commission of the confirmation
of valuation of the shares.
On May 11, 2018, Ayala Land, Inc. (ALI) entered into a Memorandum of Understanding with Green Square
Properties Corporation (GSPC) and Green Circle Properties and Resources, Inc. (GCPRI) for the formation
of a joint-venture company (JVC) that will own and develop 27,852 hectares of land (the Properties),
specifically located in Dingalan Aurora and General Nakar, Province of Quezon. ALI will own 51%, and
GSPC and GCPRI will jointly own 49% of the JVC.
21. Events after the Reporting Date None
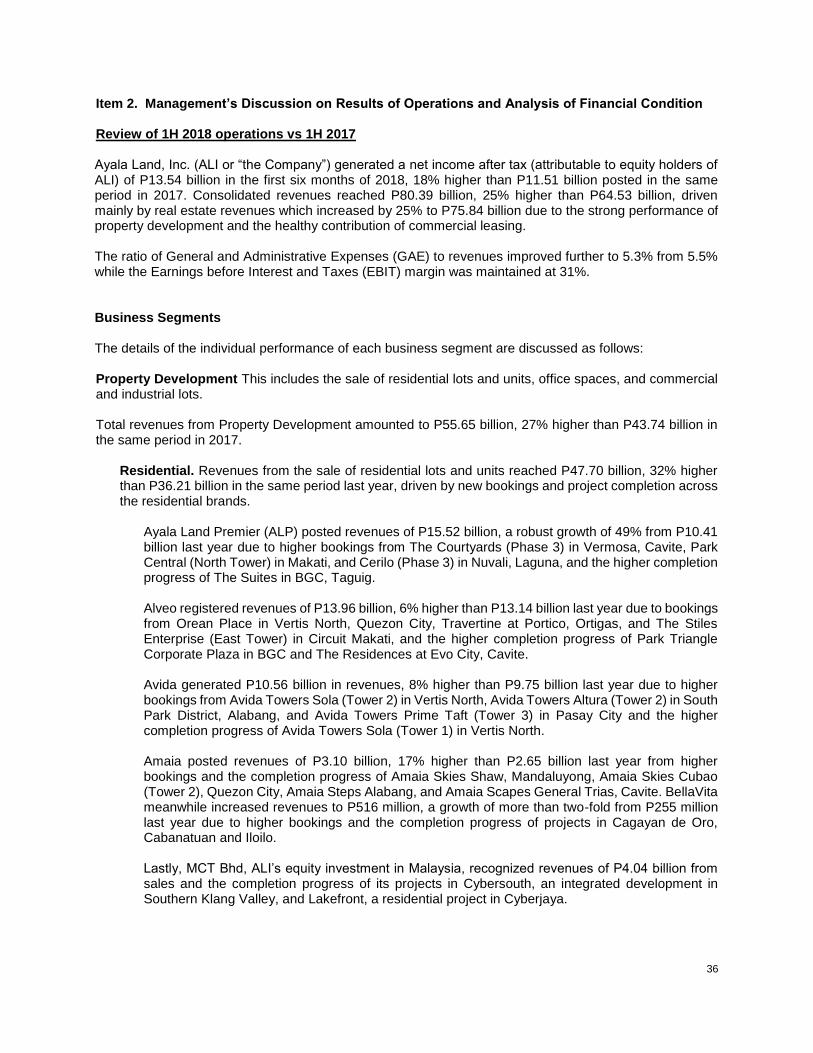
36
Item 2. Management’s Discussion on Results of Operations and Analysis of Financial Condition Review of 1H 2018 operations vs 1H 2017 Ayala Land, Inc. (ALI or “the Company”) generated a net income after tax (attributable to equity holders of ALI) of P13.54 billion in the first six months of 2018, 18% higher than P11.51 billion posted in the same period in 2017. Consolidated revenues reached P80.39 billion, 25% higher than P64.53 billion, driven mainly by real estate revenues which increased by 25% to P75.84 billion due to the strong performance of property development and the healthy contribution of commercial leasing. The ratio of General and Administrative Expenses (GAE) to revenues improved further to 5.3% from 5.5% while the Earnings before Interest and Taxes (EBIT) margin was maintained at 31%. Business Segments The details of the individual performance of each business segment are discussed as follows: Property Development This includes the sale of residential lots and units, office spaces, and commercial and industrial lots. Total revenues from Property Development amounted to P55.65 billion, 27% higher than P43.74 billion in the same period in 2017.
Residential. Revenues from the sale of residential lots and units reached P47.70 billion, 32% higher than P36.21 billion in the same period last year, driven by new bookings and project completion across the residential brands.
Ayala Land Premier (ALP) posted revenues of P15.52 billion, a robust growth of 49% from P10.41 billion last year due to higher bookings from The Courtyards (Phase 3) in Vermosa, Cavite, Park Central (North Tower) in Makati, and Cerilo (Phase 3) in Nuvali, Laguna, and the higher completion progress of The Suites in BGC, Taguig. Alveo registered revenues of P13.96 billion, 6% higher than P13.14 billion last year due to bookings from Orean Place in Vertis North, Quezon City, Travertine at Portico, Ortigas, and The Stiles Enterprise (East Tower) in Circuit Makati, and the higher completion progress of Park Triangle Corporate Plaza in BGC and The Residences at Evo City, Cavite. Avida generated P10.56 billion in revenues, 8% higher than P9.75 billion last year due to higher bookings from Avida Towers Sola (Tower 2) in Vertis North, Avida Towers Altura (Tower 2) in South Park District, Alabang, and Avida Towers Prime Taft (Tower 3) in Pasay City and the higher completion progress of Avida Towers Sola (Tower 1) in Vertis North.
Amaia posted revenues of P3.10 billion, 17% higher than P2.65 billion last year from higher bookings and the completion progress of Amaia Skies Shaw, Mandaluyong, Amaia Skies Cubao (Tower 2), Quezon City, Amaia Steps Alabang, and Amaia Scapes General Trias, Cavite. BellaVita meanwhile increased revenues to P516 million, a growth of more than two-fold from P255 million last year due to higher bookings and the completion progress of projects in Cagayan de Oro, Cabanatuan and Iloilo. Lastly, MCT Bhd, ALI’s equity investment in Malaysia, recognized revenues of P4.04 billion from sales and the completion progress of its projects in Cybersouth, an integrated development in Southern Klang Valley, and Lakefront, a residential project in Cyberjaya.

37
The average residential gross profit (GP) margin of horizontal projects improved to 46% from 44% due to the contribution of ALP’s The Courtyards (Phase 3) in Vermosa, Alveo’s Mondia in Nuvali and Ardia in Vermosa while the average GP margin of vertical developments slightly improved to 36% from 35%.
Office for Sale. Revenues from the sale of office spaces reached P4.09 billion, 2% lower than P4.19 billion in the same period last year due to lower take up as a result of limited inventory. The average GP margin of offices for sale is 35%, lower than 40% previously, recognizing higher project costs from Alveo’s Park Triangle Tower and Park Triangle Corporate Plaza in BGC. Commercial and Industrial Lots. Revenues from the sale of commercial and industrial lots reached P3.87 billion, 16% higher than P3.34 billion in the same period last year due to commercial lot sales in Arca South, Taguig, Azuela Cove in Davao, and Ayala North Point in Negros Occidental, and increased industrial lot sales in Alviera, Pampanga and Cavite Technopark in Naic. The average GP margin of commercial and industrial lots increased to 42% from 33% as a result of higher margins from the said projects.
Sales reservations reached P71.98 billion, 17% higher than P61.37 billion in the same period last year, equivalent to an average monthly take-up of P12.00 billion. Net booked sales registered at P50.44 billion, 25% higher than P40.51 billion previously. Commercial Leasing. This involves the operation of shopping centers, office buildings and hotels and resorts. Total revenues from commercial leasing amounted to P16.90 billion, 15% higher than P14.74 billion in the same period in 2017.
Shopping Centers. Revenues from shopping centers reached P9.26 billion, 12% higher than P8.25 billion previously due to the higher contribution of Vertis North and Cloverleaf, both in Quezon City and The 30th and Feliz, both in Pasig, the improved average rent of UP Town Center in Quezon City, and the strong performance of Greenbelt in Makati. EBITDA margin registered slightly lower at 64% from 66% due to the lower occupancy of newly opened malls.
The average monthly mall lease rate registered at P1,060 per square meter while same mall rental growth is at 4%. The average occupancy rate for all malls is 89% while the occupancy rate for stable malls is 94%. Total gross leasable area (GLA) of shopping centers registered at 1.75 million square meters as of June 2018.
Offices. Revenues from office leasing reached P3.71 billion, 20% higher than P3.09 billion last year due to the contribution of Vertis North Corporate Center 1, The 30th Corporate Center, Circuit BPO Tower 2, the improved average rent of BPO offices in UP North in Quezon City and higher occupancy of Ayala Center Cebu Tower. EBITDA margin registered at 91%, unchanged from the previous period.
The average monthly office lease rate registered at P742 per square meter. The average occupancy rate of all offices is 89% while the average occupancy rate of stable offices is 95%. Total offices GLA registered at 1.02 million square meters as of June 2018.
Hotels and Resorts. Revenues from hotels and resorts reached P3.93 billion, 16% higher than P3.40 billion last year due to the contribution of Seda Vertis North, Seda Capitol Central in Bacolod, Negros Occidental, and Lio B&Bs in Palawan. Overall revenue-per-available-room (REVPAR) of stable hotels increased by 9% to P4,382 per night while overall REVPAR of stable resorts increased by 15% to P12,095 per night. Overall EBITDA margin improved to 31% from 29% due to improved occupancy across all resorts.
The average hotel room rate per night is P5,625 per night while the average resort room rate per night is P17,001. The average hotel occupancy rate is 78% while resorts registered at 71%. An

38
additional of 19 rooms in Huni, Sicogon Tourism Estate in Iloilo and the remaining 49 rooms in Seda Capitol Central Bacolod were opened to the public in June 2018. Hotels and resorts currently operate 660 hotel rooms from its internationally branded segment, namely, Fairmont Hotel and Raffles Residences Makati (312) and Holiday Inn & Suites (348) Makati. Seda Hotels operates 1,409 rooms located in Atria in Iloilo (152), BGC in Taguig (179), Centrio in Cagayan de Oro (150), Abreeza in Davao (186), Nuvali in Santa Rosa Laguna (150), Vertis North in Quezon City (438) and Capitol Central in Bacolod (154). Meanwhile, El Nido Resorts operates 193 rooms from its four island resorts, Pangulasian, Lagen, Miniloc and Apulit, while Lio Tourism Estate operates 102 rooms, both in Palawan and Sicogon Tourism Estate in Iloilo operates 45 rooms. Cebu Marriott (301) is undergoing redevelopment and will be branded as Seda Ayala Center Cebu once completed. The total number of rooms in operation registered at 2,409 as of June 2018.
Services. This is composed mainly of the construction business represented by Makati Development Corporation (MDC), property management, represented by Ayala Property Management Corporation (APMC), and power services companies such as Direct Power Services, Inc. (DPSI), Ecozone Power Management, Inc. (EPMI), and Philippine Integrated Energy Solutions, Inc. (PhilEnergy). Total revenues from the service businesses amounted to P36.76 billion, 8% higher than P33.92 billion in the same period last year.
Construction. MDC generated revenues of P34.61 billion, 8% higher than P32.00 billion last year due to the increased order book of projects from Ayala Land Group. Property Management. APMC and power services companies registered revenues of P2.15 billion, 12% higher than P1.93 billion previously due to the higher number of managed properties from completed projects. The overall EBITDA margin of the service businesses registered at 8%, lower than 10% last year.
Equity in Net Earnings of Investees, Interest Fees, Investment and Other Income Interest and investment income registered at P3.08 billion, 4% higher than P2.96 billion last year due to higher interest income from real estate sales. Equity in net earnings of associates and JVs reached P410 million, a 14% gain from P361 million last year, mainly from the contribution of ALI’s joint-venture with Federal Land to develop Aveia, a residential project by Alveo in Binan, Laguna and the higher net income contribution of other non-consolidated subsidiaries. Meanwhile, other income reached P1.06 billion, a 54% growth from P688 million last year mainly as a result of the sale of MCT Bhd. in One City Properties, an integrated mixed-use development located in USJ 25, Subang Jaya and eCity Hotel located within the said development Costs and Expenses Total expenses registered at P58.76 billion, 26% higher than P46.64 billion, mainly due to higher real estate expenses which grew 27% to P49.18 billion from P38.81 billion last year. GAE reached P4.28 billion, 22% higher than P3.52 billion last year. This resulted in a further improvement of the GAE ratio to 5.3% from 5.5% last year. Interest expense, financing and other charges registered at P5.31 billion, 23% higher than P4.32 billion as a result of higher rate on additional loan availment and discounting cost due to higher AR sales.
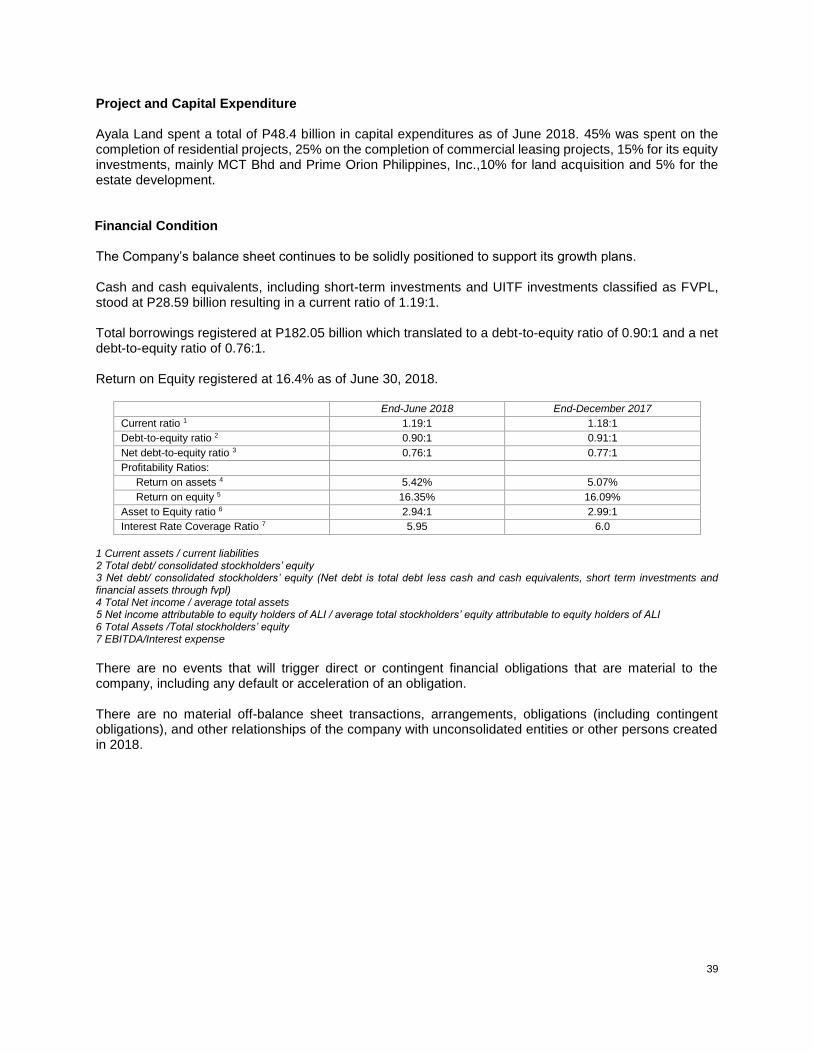
39
Project and Capital Expenditure Ayala Land spent a total of P48.4 billion in capital expenditures as of June 2018. 45% was spent on the completion of residential projects, 25% on the completion of commercial leasing projects, 15% for its equity investments, mainly MCT Bhd and Prime Orion Philippines, Inc.,10% for land acquisition and 5% for the estate development. Financial Condition The Company’s balance sheet continues to be solidly positioned to support its growth plans. Cash and cash equivalents, including short-term investments and UITF investments classified as FVPL, stood at P28.59 billion resulting in a current ratio of 1.19:1. Total borrowings registered at P182.05 billion which translated to a debt-to-equity ratio of 0.90:1 and a net debt-to-equity ratio of 0.76:1. Return on Equity registered at 16.4% as of June 30, 2018.
End-June 2018 End-December 2017
Current ratio 1 1.19:1 1.18:1
Debt-to-equity ratio 2 0.90:1 0.91:1
Net debt-to-equity ratio 3 0.76:1 0.77:1
Profitability Ratios:
Return on assets 4 5.42% 5.07%
Return on equity 5 16.35% 16.09%
Asset to Equity ratio 6 2.94:1 2.99:1
Interest Rate Coverage Ratio 7 5.95 6.0
1 Current assets / current liabilities 2 Total debt/ consolidated stockholders’ equity 3 Net debt/ consolidated stockholders’ equity (Net debt is total debt less cash and cash equivalents, short term investments and financial assets through fvpl) 4 Total Net income / average total assets 5 Net income attributable to equity holders of ALI / average total stockholders’ equity attributable to equity holders of ALI 6 Total Assets /Total stockholders’ equity 7 EBITDA/Interest expense
There are no events that will trigger direct or contingent financial obligations that are material to the company, including any default or acceleration of an obligation. There are no material off-balance sheet transactions, arrangements, obligations (including contingent obligations), and other relationships of the company with unconsolidated entities or other persons created in 2018.

40
Causes for any material changes (+/- 5% or more) in the financial statements Income Statement items – June 2018 versus June 2017 Real estate revenues increased by 25% due to the substantial growth of property development and sustained performance of commercial leasing. Equity in net earnings of associates and joint ventures improved by 14% primarily from higher contribution from Alveo-Federal Land Communities Inc. due to project’s increase in percentage in completion. Other Income grew by 54% mainly as a result of the sale of MCT Bhd. in One City Properties, an integrated mixed-use development located in USJ 25, Subang Jaya and eCity Hotel located within the said development. Real estate costs increased by 27% mainly due to higher sales and incremental project completion from residential, leasing and hotels & resorts business groups. General and administrative expenses higher by 22% primarily due to increase in taxes & licenses, contracted services (janitorial and security), PPE depreciation, insurance, rent, repairs & maintenance and postal & communications. Interest and other financing charges and other charges grew by 23% mainly due to higher interest rate on additional loan availment and discounting cost due to higher AR sale. Provision for income tax increased by 27% due to higher taxable income mainly coming from real estate. Non-controlling interests higher by 26% primarily due to NCI share on MCT Berhad. Balance Sheet items – June 2018 versus December 2017 Cash and cash equivalents up by 7% primarily due to inclusion of MCT Berhad in 2018. Short term investments higher by 26% mainly due to consolidation of MCT Berhad, additional money market placements of BG West Properties Inc., Ayala Hotels Inc., Roxas Land Corp., and Alveo Land Corp. Financial assets at fair value through profit or loss higher by 5% largely due to additional UITF investment placements of Ayala Land Inc., Prime Orion Philippines Inc., Alabang Commercial Corp., partially offset by maturities from Amaia Land Corp. Accounts and notes receivable increased by 12% due to higher bookings of Regent Wise Investments Limited, Alveo Land Corp., and Roxas Land Corp. Other current assets lower by 7% due to decrease in input VAT, partly offset by increase in CWT mainly from residential projects and various prepayments. Non-current accounts and notes receivable decreased by 23% mainly from higher collections from customers and reclass from non-current to current. Available-for-sale financial assets declined by 22% mainly due to lower investment in AFS of Cebu Holdings Inc. and Prime Orion Philippines Inc.

41
Investments in associates and joint ventures lower by 24% mainly due to consolidation of MCT Berhad from equity pick-up treatment in 2017. Investment properties grew by 13% primarily due to the increased in project costs of Ayala Land, Inc., Cebu District Property Enterprise Inc., AyalaLand Hotels and Resorts Corp., Summerhill Commercial Ventures Corp., and consolidation of MCT Berhad. Property and equipment up by 5% mainly coming from inclusion of MCT Berhad in consolidation. Deferred tax assets higher by 13% due to additional DTA from PAS Straight-line recognition of revenue (Accounting Standard vs BIR) of leasing group. Other noncurrent assets grew by 29% due to increase in bookings of deferred charges and pre-operating expenses of Ayala Land Inc. and Makati Development Corp. Short-term debt declined by 33% largely due to Ayala Land Inc. and Avida Land Corp's payment of short-term unsecured peso denominated bank loan. Income tax payable higher by 6% mainly due to higher taxable income from real estate. Current portion of long-term debt increased by 276% due to incremental debt to Bank of the Philippine Islands of Ayala Land Inc., Amorsedia Development Corp., Avida Land Corp., and Alveo Land Corp. Deposit and other current liabilities declined by 30% due to the decrease in customers' deposits from real estate customers who reached the 10% threshold for sales bookings. Deposits and other noncurrent liabilities increased by 16% due to deposits from real estate customers, liability set-up for purchase of land and contribution from leasing and mall group's advance rental and security deposits. Cumulative translations adjustments grew by 49% due to foreign currency revaluation from Regent Wise Investment Limited. Net unrealized gain on available-for-sale financial assets lower by 141% mainly due to revaluation of Prime Orion Philippines Inc’s AFS. Equity reserves increased by 203% mainly due to inclusion of MCT equity reserve and additional acquisitions of Cebu Holdings Inc. and Prime Orion Philippines Inc. Non-controlling interests up by 46% largely due to NIAT share of subsidiaries and consolidation MCT Berhad.
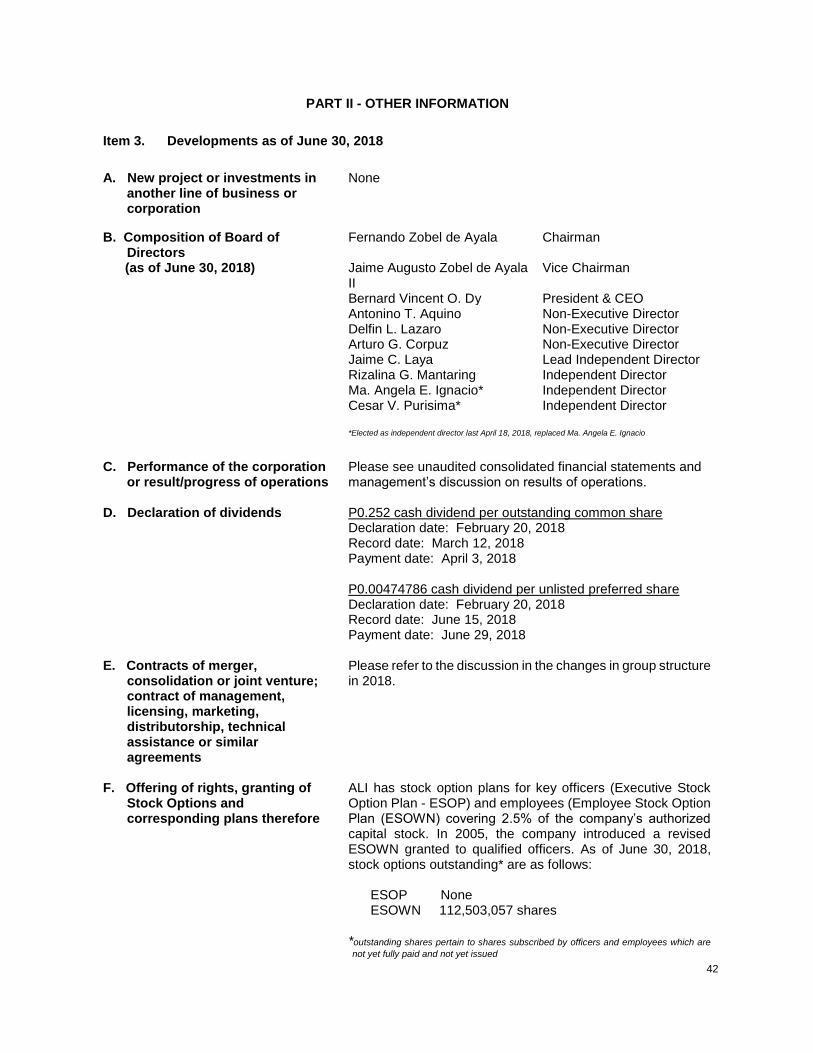
42
PART II - OTHER INFORMATION
Item 3. Developments as of June 30, 2018
A. New project or investments in
another line of business or corporation
None
B. Composition of Board of Directors
Fernando Zobel de Ayala Chairman
(as of June 30, 2018) Jaime Augusto Zobel de Ayala II
Vice Chairman
Bernard Vincent O. Dy President & CEO Antonino T. Aquino Non-Executive Director Delfin L. Lazaro Non-Executive Director Arturo G. Corpuz Non-Executive Director Jaime C. Laya Lead Independent Director Rizalina G. Mantaring Independent Director Ma. Angela E. Ignacio*
Cesar V. Purisima* Independent Director Independent Director
*Elected as independent director last April 18, 2018, replaced Ma. Angela E. Ignacio
C. Performance of the corporation
or result/progress of operations Please see unaudited consolidated financial statements and management’s discussion on results of operations.
D. Declaration of dividends P0.252 cash dividend per outstanding common share
Declaration date: February 20, 2018 Record date: March 12, 2018 Payment date: April 3, 2018 P0.00474786 cash dividend per unlisted preferred share Declaration date: February 20, 2018 Record date: June 15, 2018 Payment date: June 29, 2018
E. Contracts of merger,
consolidation or joint venture; contract of management, licensing, marketing, distributorship, technical assistance or similar agreements
Please refer to the discussion in the changes in group structure in 2018.
F. Offering of rights, granting of Stock Options and corresponding plans therefore
ALI has stock option plans for key officers (Executive Stock Option Plan - ESOP) and employees (Employee Stock Option Plan (ESOWN) covering 2.5% of the company’s authorized capital stock. In 2005, the company introduced a revised ESOWN granted to qualified officers. As of June 30, 2018, stock options outstanding* are as follows: ESOP None ESOWN 112,503,057 shares *outstanding shares pertain to shares subscribed by officers and employees which are
not yet fully paid and not yet issued
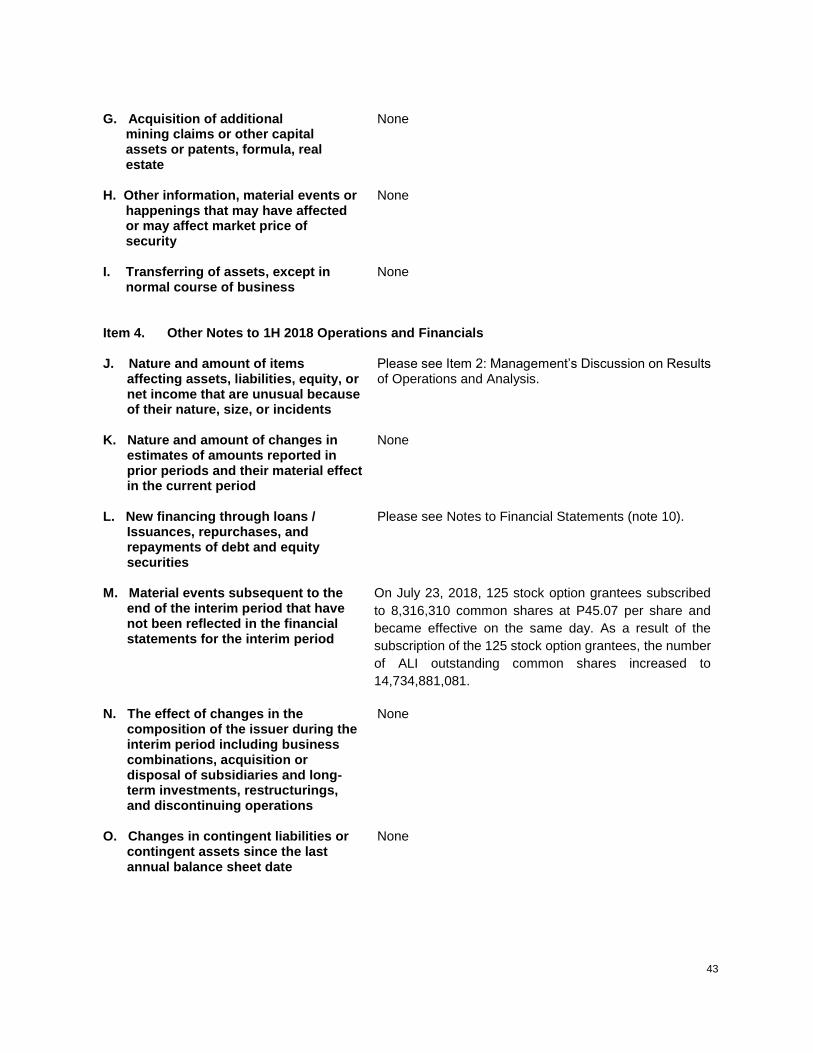
43
G. Acquisition of additional
mining claims or other capital assets or patents, formula, real estate
None
H. Other information, material events or
happenings that may have affected or may affect market price of security
None
I. Transferring of assets, except in
normal course of business None
Item 4. Other Notes to 1H 2018 Operations and Financials J. Nature and amount of items
affecting assets, liabilities, equity, or net income that are unusual because of their nature, size, or incidents
Please see Item 2: Management’s Discussion on Results of Operations and Analysis.
K. Nature and amount of changes in
estimates of amounts reported in prior periods and their material effect in the current period
None
L. New financing through loans /
Issuances, repurchases, and repayments of debt and equity securities
Please see Notes to Financial Statements (note 10).
M. Material events subsequent to the
end of the interim period that have not been reflected in the financial statements for the interim period
On July 23, 2018, 125 stock option grantees subscribed
to 8,316,310 common shares at P45.07 per share and
became effective on the same day. As a result of the
subscription of the 125 stock option grantees, the number
of ALI outstanding common shares increased to
14,734,881,081.
N. The effect of changes in the
composition of the issuer during the interim period including business combinations, acquisition or disposal of subsidiaries and long-term investments, restructurings, and discontinuing operations
None
O. Changes in contingent liabilities or contingent assets since the last annual balance sheet date
None

44
P. Other material events or transactions during the interim period
Deed of Absolute Sale with Central Azucarera de Tarlac, Inc. On April 4, 2018, Ayala Land, Inc. (ALI) signed a Deed of Absolute Sale with Central Azucarera de Tarlac, Inc. for the acquisition of several parcels of land with an aggregate area of approximately 290 hectares located in Barangay Central, City of Tarlac, Province of Tarlac. Listing of P10,000 million bonds due April 2028 On April 27, 2018, the company issued and listed on the Philippine Dealing & Exchange Corp. a P10,000.0 million bond due April 2028 with a coupon rate of 5.9203% p.a. for the initial five-year period of the ten-year term of the bond. The coupon rate will reprice on April 27, 2023, the fifth anniversary of the Issue Date, at the higher of (a) 5.9203% or (b) the prevailing 5-year benchmark plus 75 bps which shall apply to all interest payments thereafter. The Bond was assigned an issue credit rating of PRS AAA, with a Stable Outlook, by Philratings, the highest investment grade indicating minimal credit risk. The issuance is the fifth tranche of the Fixed Rate Bond series of the Company’s P50,000.0 million Debt Securities Program as approved by the Securities and Exchange Commission (SEC) in March 2016.
Memorandum of Understanding for Quezon Properties
On May 11, 2018, Ayala Land, Inc. (ALI) entered into a
Memorandum of Understanding with Green Square
Properties Corporation (GSPC) and Green Circle
Properties and Resources, Inc. (GCPRI) for the formation
of a joint-venture company (JVC) that will own and
develop 27,852 hectares of land (the Properties),
specifically located in Dingalan Aurora and General
Nakar, Province of Quezon. ALI will own 51%, and GSPC
and GCPRI will jointly own 49% of the JVC.
Q. Existence of material contingencies during the interim period; events that will trigger direct or contingent financial obligation that is material to the company, including any default or acceleration of an obligation
None
R. Material off-balance sheet transactions, arrangements, obligations (including contingent obligations), and other relationships of the company with unconsolidated entities or other
None
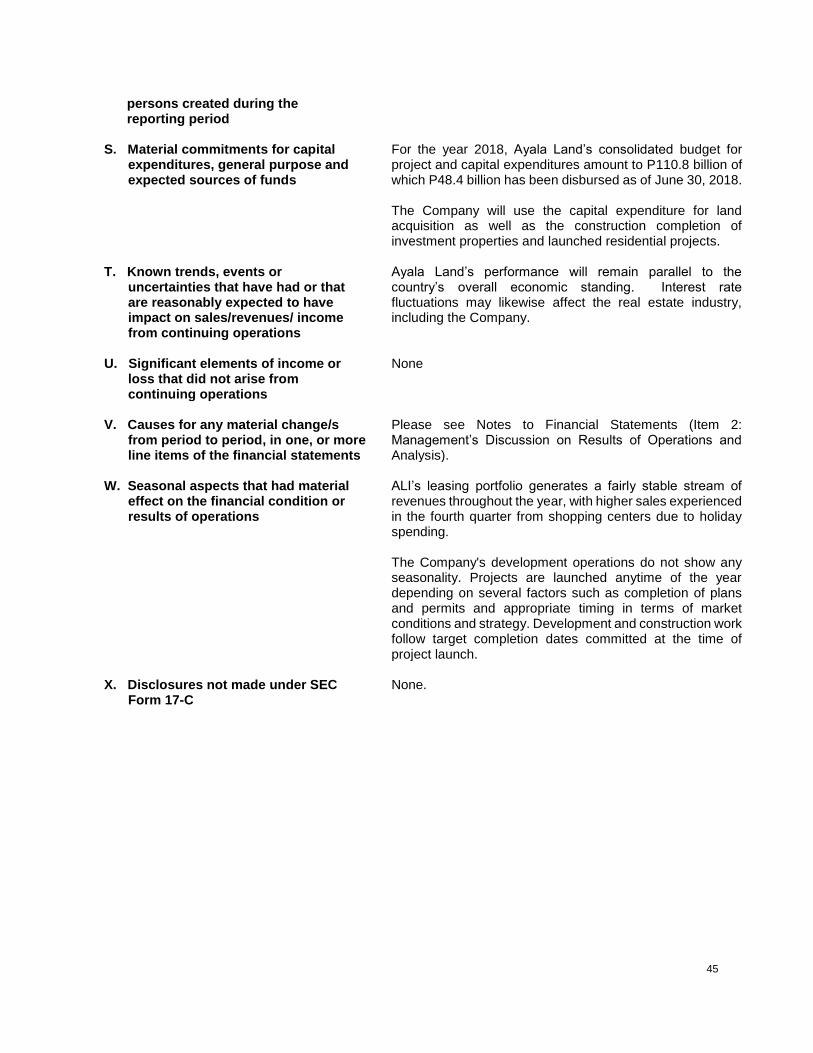
45
persons created during the reporting period
S. Material commitments for capital
expenditures, general purpose and expected sources of funds
For the year 2018, Ayala Land’s consolidated budget for project and capital expenditures amount to P110.8 billion of which P48.4 billion has been disbursed as of June 30, 2018. The Company will use the capital expenditure for land acquisition as well as the construction completion of investment properties and launched residential projects.
T. Known trends, events or uncertainties that have had or that are reasonably expected to have impact on sales/revenues/ income from continuing operations
Ayala Land’s performance will remain parallel to the country’s overall economic standing. Interest rate fluctuations may likewise affect the real estate industry, including the Company.
U. Significant elements of income or
loss that did not arise from continuing operations
None
V. Causes for any material change/s
from period to period, in one, or more line items of the financial statements
Please see Notes to Financial Statements (Item 2: Management’s Discussion on Results of Operations and Analysis).
W. Seasonal aspects that had material
effect on the financial condition or results of operations
ALI’s leasing portfolio generates a fairly stable stream of revenues throughout the year, with higher sales experienced in the fourth quarter from shopping centers due to holiday spending. The Company's development operations do not show any seasonality. Projects are launched anytime of the year depending on several factors such as completion of plans and permits and appropriate timing in terms of market conditions and strategy. Development and construction work follow target completion dates committed at the time of project launch.
X. Disclosures not made under SEC
Form 17-C None.

46
Item 5. Performance Indicators
The table below sets forth the comparative performance indicators of the Company and its majority-owned subsidiaries:
End-June 2018 End-December 2017
Current ratio 1 1.19:1 1.18:1
Debt-to-equity ratio 2 0.90:1 0.91:1
Net debt-to-equity ratio 3 0.76:1 0.77:1
Profitability Ratios:
Return on assets 4 5.42% 5.07%
Return on equity 5 16.35% 16.09%
Asset to Equity ratio 6 2.94:1 2.99:1
Interest Rate Coverage Ratio 7 5.95 5.99
1 Current assets / current liabilities 2 Total debt/ consolidated stockholders’ equity 3 Net debt/ consolidated stockholders’ equity (Net debt is total debt less cash and cash equivalents, short term investments and financial assets through fvpl) 4 Annualized Total Net income / average total assets 5 Annualized Net income attributable to equity holders of ALI / average total stockholders’ equity attributable to equity holders of ALI 6 Total Assets /Total stockholders’ equity 7 EBITDA/Interest expense
47
SIGNATURE
Pursuant to the requirements of the Securities Regulation Code, the Issuer has duly caused this report to be signed on its behalf by the undersigned thereunto duly authorized. Issuer: AYALA LAND, INC. By:
AUGUSTO D. BENGZON
Senior Vice-President
CFO, Treasurer and Chief Compliance Officer
Date: August 13, 2018