AY 2012-2013 Annual Program Survey Results NASPAA Annual Conference 2014 Albuquerque, New Mexico.
27
AY 2012-2013 Annual Program Survey Results NASPAA Annual Conference 2014 Albuquerque, New Mexico
-
Upload
claire-cummings -
Category
Documents
-
view
218 -
download
4
Transcript of AY 2012-2013 Annual Program Survey Results NASPAA Annual Conference 2014 Albuquerque, New Mexico.
AY 2012-2013 Annual Program Survey Results
NASPAA Annual Conference 2014Albuquerque, New Mexico

NASPAA 12-13 Annual Program Survey
• Process• Results of the 2012-2013 Survey• Using the Data• Observations and Feedback
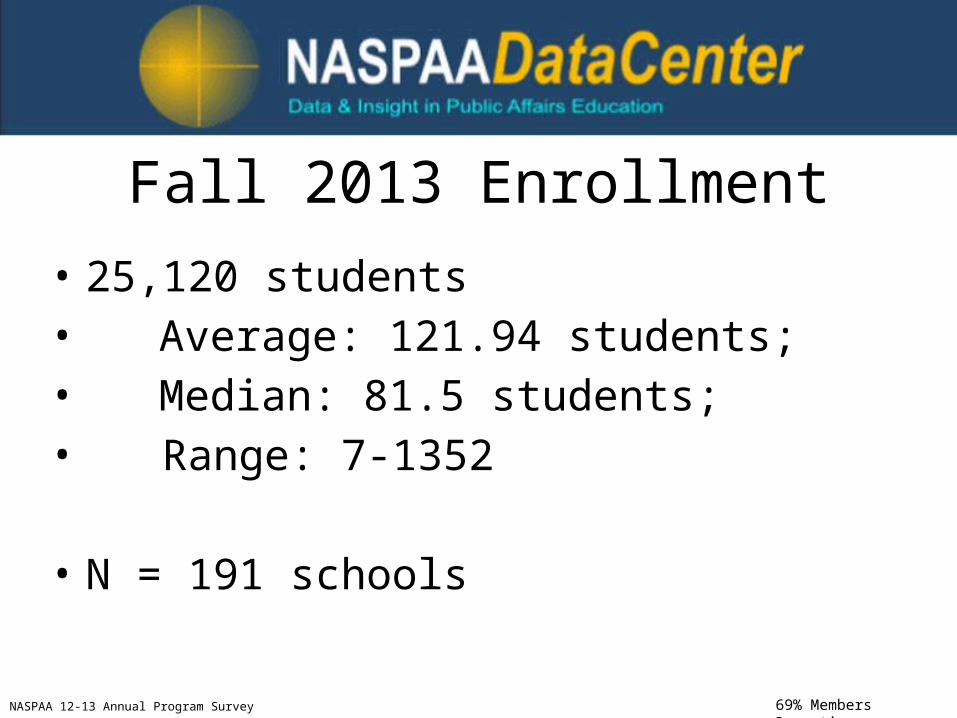
Fall 2013 Enrollment• 25,120 students• Average: 121.94 students; • Median: 81.5 students;• Range: 7-1352
• N = 191 schools
NASPAA 12-13 Annual Program Survey 69% Members Reporting

Fall 2012 Total Instructional Faculty• 3690 Faculty• Average: 17.2 Faculty; • Median: 10 Faculty;• Range: 2-90
• N = 215 schools
NASPAA 12-13 Annual Program Survey 77% Members Reporting

2011-2012 (n= 176; 63%) 2012-2013 (n= 191; 69%) 2013-2014 (n= 157; 56%) Reported by Oct. 15
0
5000
10000
15000
20000
25000
30000
6014 57001416
1799319420
21397
Enrollment by Accreditation Status and Report Year
Accredited
Non-Accredited
24007 2281325120
* Data is NOT controlled across reporting years and therefore should not be used for trend analysis
NASPAA 12-13 Annual Program Survey

2011-2012 (n= 176; 63%) 2012-2013 (n= 191; 69%) 2013-2014 (n= 157; 56%) Reported by Oct. 15
0
2000
4000
6000
8000
10000
12000
14000
16000
18000
11020
89007849
12987
1622014964
Enrollment by Membership and Report Year
APPAM & NASPAA
NASPAA Only
* Data is NOT controlled across reporting years and therefore should not be used for trend analysis
NASPAA 12-13 Annual Program Survey

2011-2012 2012-20130
5000
10000
15000
20000
3876 4080
14162 14062
Enrollment by Report Year (Controlled by Respondents)
Accredited
Non Accredited
18038 18142
N=140, 50% Members ReportingNASPAA 12-13 Annual Program Survey

2011
-201
2
2012
-201
3
2011
-201
2
2012
-201
3
2011
-201
2
2012
-201
3
2011
-201
2
2012
-201
3
Master Of Public Administra-tion
Master Of Public Affairs Master Of Public Policy Other
0
2000
4000
6000
8000
10000
12000
14000
12570 12498
1570 16142479 2516
1419 1514
Enrollment by Degree
N=140, 50%NASPAA 12-13 Annual Program Survey

Nonprofit
General/Public Management
Public Policy Analysis
Other
Health
City/ Local
Budgeting/ Finance
Environment
Human Resources
Urban
International/ Global
Economic Development
Criminal Justice
Leadership
Public Sector
Social Policy
Organizational Management
None
Education
State
Homeland/National Security
Emergency
Information Technology
Survey Methods
0% 10% 20% 30% 40% 50% 60%
56%47%
36%35%35%
34%26%
24%21%
20%19%
18%18%
17%16%
15%14%14%14%
13%12%
10%7%
6%
Specializations by Percentage Offered
N=217 (78%)
NASPAA 12-13 Annual Program Survey

Information Technology
Survey Methods
Social Policy
Education
Homeland/National Security
Organizational Management
Emergency
State
Economic Development
Leadership
Public Sector
International/ Global
None
Environment
Urban
Criminal Justice
Human Resources
Budgeting/ Finance
Public Policy Analysis
Other
Health
City/ Local
General/Public Management
Nonprofit
0 20 40 60 80 100 120
Number of Specializations by Category Offered MPA vs MPP
MPP (N= 21)MPA (n= 175)
NASPAA 12-13 Annual Program Survey

Central Gov12%
State Gov15%
Local Gov18%
Foreign Gov6%
Nonprofit28%
Private21%
Placements By Sector, 2013
N=6491, n=171 schools
NASPAA 12-13 Annual Program Survey

0%
10%
20%
30%
40%
50%
60%
70%
21%
10%
58%
43%
33%
Average Percent of Enrollment by Category
Average % Out-of-state
Average % International
Average % Female
Average % Part-time
Average % Ethnic Minority Background
N= 156
NASPAA 12-13 Annual Program Survey
N= 170
N= 163
N= 166
N= 149

NASPAA 12-13 Annual Program Survey N= 220*; 79%
In person instruction with online coursework available
In person instruction only Completely online (students never have to come to campus)
Primarily online (students have to come to campus)
0
20
40
60
80
100
120
140131
109
25
5
How the Degree is Offered

NASPAA 12-13 Annual Program Survey
NM (1) CA (16) IL (4) AL (4) FL (8)0%
10%
20%
30%
40%
50%
60%
70%
80%
68%
56%50% 50% 48%
2012-2013 Top 5: Average % Persons of Diversity Enrolled
(# of Programs in the state responding)

Master Of Public Admin-istration
Master Of Public Affairs Master Of Public Policy Other0%
5%
10%
15%
20%
25%
30%
35%
40%
35%
24%25%
31%
Average % Persons of Diversity by Degree
NASPAA 12-13 Annual Program Survey

2 Semesters 3 Semesters 4 Semesters 4 terms 5 Semesters 5 terms 6 terms 7 terms Not Applicable - Program has no
FT Students
Other (please specify)
0
20
40
60
80
100
120
140
1
10
133
1
60
2
1710 3
16
Degree Design Length for FT Students
NASPAA 12-13 Annual Program Survey N= 236; 85%

64%13%
13%
6%3%
1%
Whom the Program is Designed to Serve
Both full-time and part-time students
Generally part-time with some full-time
Generally full-time with some part-time
Full-time students only
Part Time Students only
Other
NASPAA 12-13 Annual Program Survey N= 242; 87%

56%37%
7%
1%
Availiability of Evening and Weekend Classes
We have evening classes but not weekend ones
We have both evenings and weekend ones
We have neither evening nor weekend classes
We have weekend but not evening classes
NASPAA 12-13 Annual Program Survey N= 245, 228; 82%
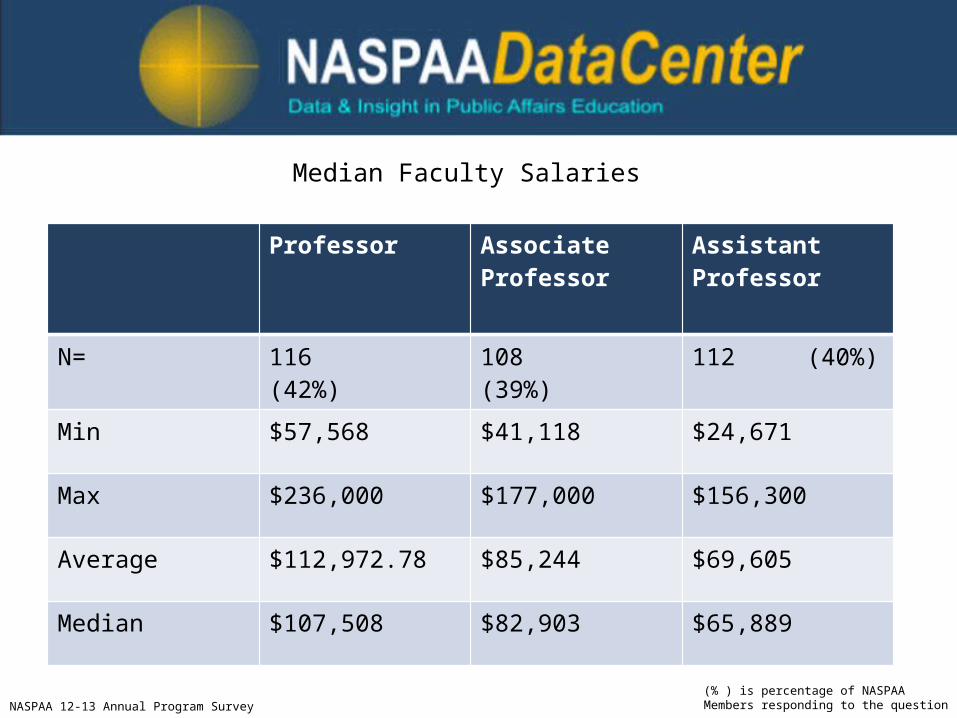
Median Faculty Salaries
Professor Associate Professor
Assistant Professor
N= 116 (42%) 108 (39%) 112 (40%)
Min $57,568 $41,118 $24,671
Max $236,000 $177,000 $156,300
Average $112,972.78 $85,244 $69,605
Median $107,508 $82,903 $65,889
NASPAA 12-13 Annual Program Survey(% ) is percentage of NASPAA Members responding to the question

NASPAA 12-13 Annual Program Survey
MS (1) TN (1) DE (1) OR (3) NC (5) ID (1)0
10
20
30
40
50
60
70
80
90
100
90
85
80 79 7775
States in Which Average % Financial Aid for Full Time Students is 75%+
(# of Programs in the state responding)

Master Of Public Administration Master Of Public Affairs Master Of Public Policy Other0%
10%
20%
30%
40%
50%
60%
49%45%
13%
35%
Average % Part Time Students by Degree
NASPAA 12-13 Annual Program Survey

Master Of Public Administration
Master Of Public Affairs Master Of Public Policy Other0%
5%
10%
15%
20%
25%
8%
5%
21%
14%
Average % International Students Enrolled by Degree
NASPAA 12-13 Annual Program Survey N= 163 schools, 59%

2011-2012 2012-2013 2013-201413500
14000
14500
14167
13912
14354
Enrollment Trend
N=105, 38%NASPAA 12-13 Annual Program Survey

2011-2012 2012-2013 2013-20140
2000
4000
6000
8000
10000
12000
14000
16000
1053 992 906
12979 12896 13298AccreditedNon Accredited
NASPAA 12-13 Annual Program Survey N=105, 38%

2011-2012 2012-2013 2013-2014 2011-2012 2012-2013 2013-2014 2011-2012 2012-2013 2013-2014 2011-2012 2012-2013 2013-2014Master Of Public Administration Master Of Public Affairs Master Of Public Policy Other
0
2000
4000
6000
8000
10000
12000
10525 10341
11079
1546 1570 15411195 1208 1039 901 793 695
Enrollment Trend by Degree
N=105, 38%NASPAA 12-13 Annual Program Survey

2011-2012 2012-2013 2013-2014
64% 67%
82%
37%
63%
86%
Percentage of Respondents who Provided Data 2012-2014
On Degrees Awarded On Placement
N=273 N=182N=273
NASPAA 12-13 Annual Program Survey
Defense-Focused Master of Business AdministrationKey Executive Master of Public Administration
Masters in Public Policy & ManagementMaster of Science in Public Service Management
Master of Public Administration: Health AdministrationMaster of Science in Public Affairs
Master of PlanningMaster of Science in Management
Master of International Public AffairsMaster of Science in Administration
Master Of International DevelopmentMaster of Public Service
Master of International AffairsMaster of Science in Public Policy and Management
Master of Health AdministrationMaster of Science in International Public Service
Master of Development PolicyMaster of Science in Urban Policy Analysis & Management
Master of Business Administration for Business, Gov't and Not-for-Profit MngmtMaster of Public Service and Administration
Master of Arts in Urban StudiesMaster of Science in Public Administration
Master of Arts in Public Policy and ManagementMaster Of Public Policy Administration
Master of Science in Public PolicyMaster of Public Policy and AdministrationExecutive Master of Public Administration
Master Of Public ManagementMaster Of Public AffairsMaster Of Public Policy
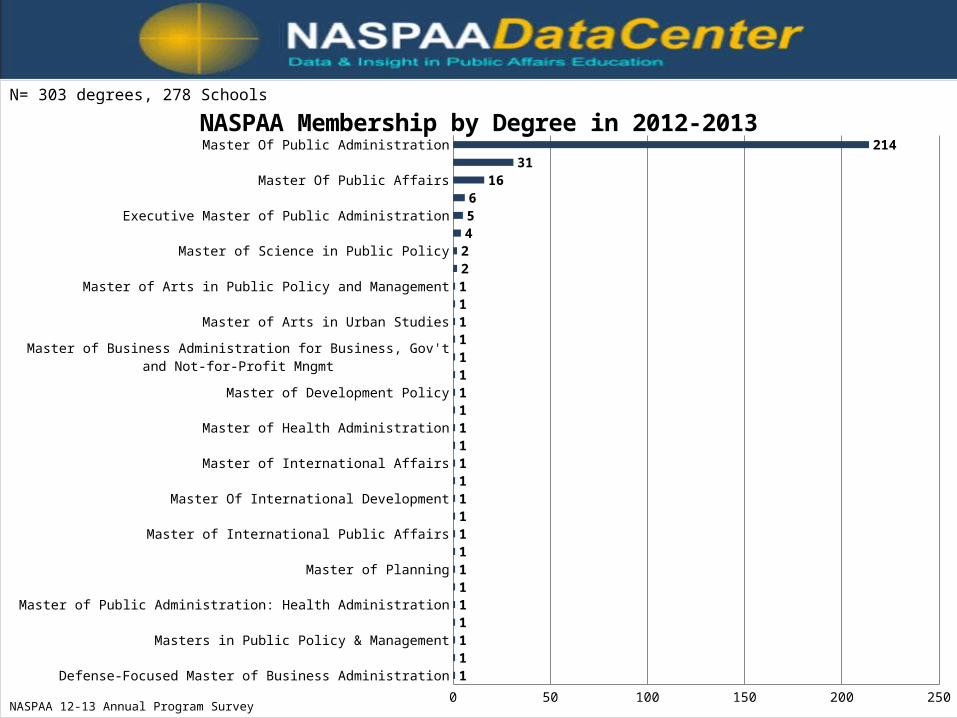
Master Of Public Administration
0 50 100 150 200 2501111111111111111111111122456
1631
214
NASPAA Membership by Degree in 2012-2013N= 303 degrees, 278 Schools
NASPAA 12-13 Annual Program Survey